thinking fast thinking slow: bridging the gap between ... platt... · thinking fast thinking slow:...
TRANSCRIPT

Thinking Fast Thinking Slow: bridging the gap between research and practice in disaster recovery Stephen Platt, Emily So, John Bevington, Enrica Verrucci, Massimiliano Pittore
Published online March 2015 at: www.carltd.com/downloads
Reference:
Platt S, So E, Bevington J, Verrucci E, So E, Pittore M (2014) Thinking Fast, Thinking Slow: bridging the gap between research and practice in disaster recovery. Second European Conference on Earthquake Engineering and Seismology, Istanbul, Aug 25-29
1
Thinking Fast Thinking Slow: bridging the gap between research
and practice in disaster recovery Stephen Platt, Emily So, John Bevington, Enrica Verrucci, Massimiliano Pittore
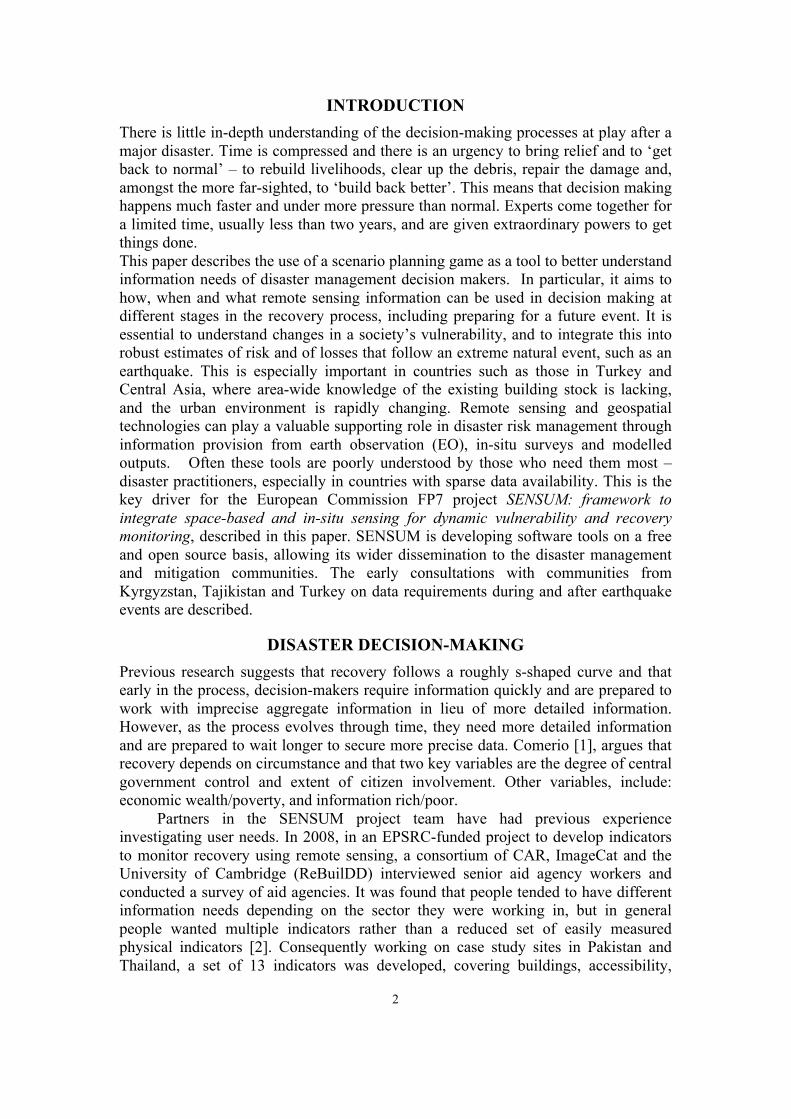
ABSTRACT The Nobel prize winning economist Daniel Kahneman (2012) suggested that we have two ways of thinking. Fast thinking involves intuition and instinctive behaviour while slow thinking demands deliberation and rational analysis. This goes some way to explaining a question that has been preoccupying researchers in the field of remote sensing and information management in the area of disaster recovery.
This paper describes using scenario planning game as a tool to improve communication between researchers and practitioners and to better understand what information disaster management decision-makers need. In particular it explores how information is needed at different stages in the recovery process and addresses the question why the take-up of this technology is slower than one might have expected.
There have been major research advances in using data collected from satellite and airborne sensors to map hazards, assess post-earthquake damage, manage humanitarian and financial assistance and to plan and monitor long-term recovery. But the take up of this technology by disaster management practitioners and planners is disappointing. Why is this? Can the information not be provided quickly enough to aid decision making, is it too costly or is there a lack of trained personnel to interpret and make use of the information?
The first phase of an EU funded project, SENSUM, aimed to address these questions using scenario planning. The information needs of recovery planning were assessed in a series of user needs scenario planning exercises with senior disaster managers in Kyrgyzstan, Tajikistan and Turkey. These realistic earthquake scenarios were played-out during one-day exercises that allowed disaster personnel to simulate the post-earthquake decision making process. The findings pinpoint how information derived from multi-resolution imagery can be effective in planning and assessing recovery of transportation networks, transitional shelters and the built environment.
But that the people charged with disaster management have to make choices fast using experience, instinct and following established protocols. They find it difficult to think about using the kind of information research scientists are able to provide. In contrast the people charged with long-term planning are able to plan deliberately and are desperate for detailed and reliable information to help make good decisions. This means two entirely different kinds of information are required – fast and slow information.
2
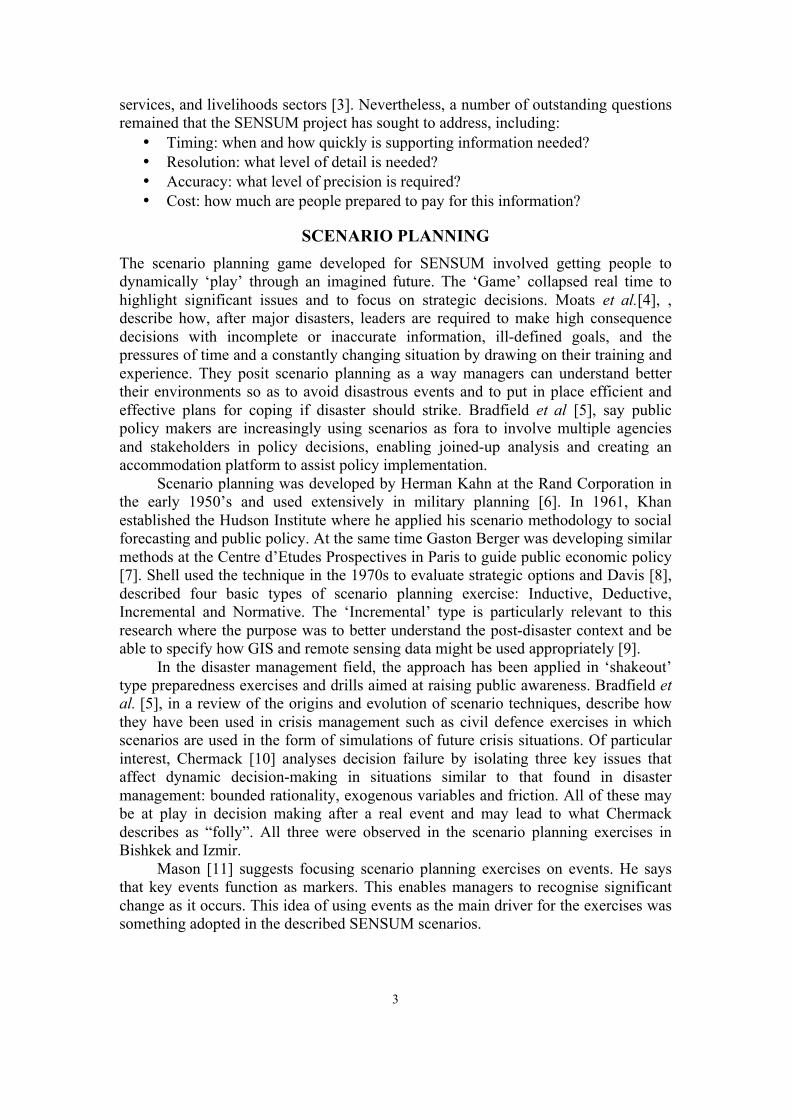
INTRODUCTION There is little in-depth understanding of the decision-making processes at play after a major disaster. Time is compressed and there is an urgency to bring relief and to ‘get back to normal’ – to rebuild livelihoods, clear up the debris, repair the damage and, amongst the more far-sighted, to ‘build back better’. This means that decision making happens much faster and under more pressure than normal. Experts come together for a limited time, usually less than two years, and are given extraordinary powers to get things done. This paper describes the use of a scenario planning game as a tool to better understand information needs of disaster management decision makers. In particular, it aims to how, when and what remote sensing information can be used in decision making at different stages in the recovery process, including preparing for a future event. It is essential to understand changes in a society’s vulnerability, and to integrate this into robust estimates of risk and of losses that follow an extreme natural event, such as an earthquake. This is especially important in countries such as those in Turkey and Central Asia, where area-wide knowledge of the existing building stock is lacking, and the urban environment is rapidly changing. Remote sensing and geospatial technologies can play a valuable supporting role in disaster risk management through information provision from earth observation (EO), in-situ surveys and modelled outputs. Often these tools are poorly understood by those who need them most – disaster practitioners, especially in countries with sparse data availability. This is the key driver for the European Commission FP7 project SENSUM: framework to integrate space-based and in-situ sensing for dynamic vulnerability and recovery monitoring, described in this paper. SENSUM is developing software tools on a free and open source basis, allowing its wider dissemination to the disaster management and mitigation communities. The early consultations with communities from Kyrgyzstan, Tajikistan and Turkey on data requirements during and after earthquake events are described.
DISASTER DECISION-MAKING Previous research suggests that recovery follows a roughly s-shaped curve and that early in the process, decision-makers require information quickly and are prepared to work with imprecise aggregate information in lieu of more detailed information. However, as the process evolves through time, they need more detailed information and are prepared to wait longer to secure more precise data. Comerio [1], argues that recovery depends on circumstance and that two key variables are the degree of central government control and extent of citizen involvement. Other variables, include: economic wealth/poverty, and information rich/poor.
Partners in the SENSUM project team have had previous experience investigating user needs. In 2008, in an EPSRC-funded project to develop indicators to monitor recovery using remote sensing, a consortium of CAR, ImageCat and the University of Cambridge (ReBuilDD) interviewed senior aid agency workers and conducted a survey of aid agencies. It was found that people tended to have different information needs depending on the sector they were working in, but in general people wanted multiple indicators rather than a reduced set of easily measured physical indicators [2]. Consequently working on case study sites in Pakistan and Thailand, a set of 13 indicators was developed, covering buildings, accessibility,
3
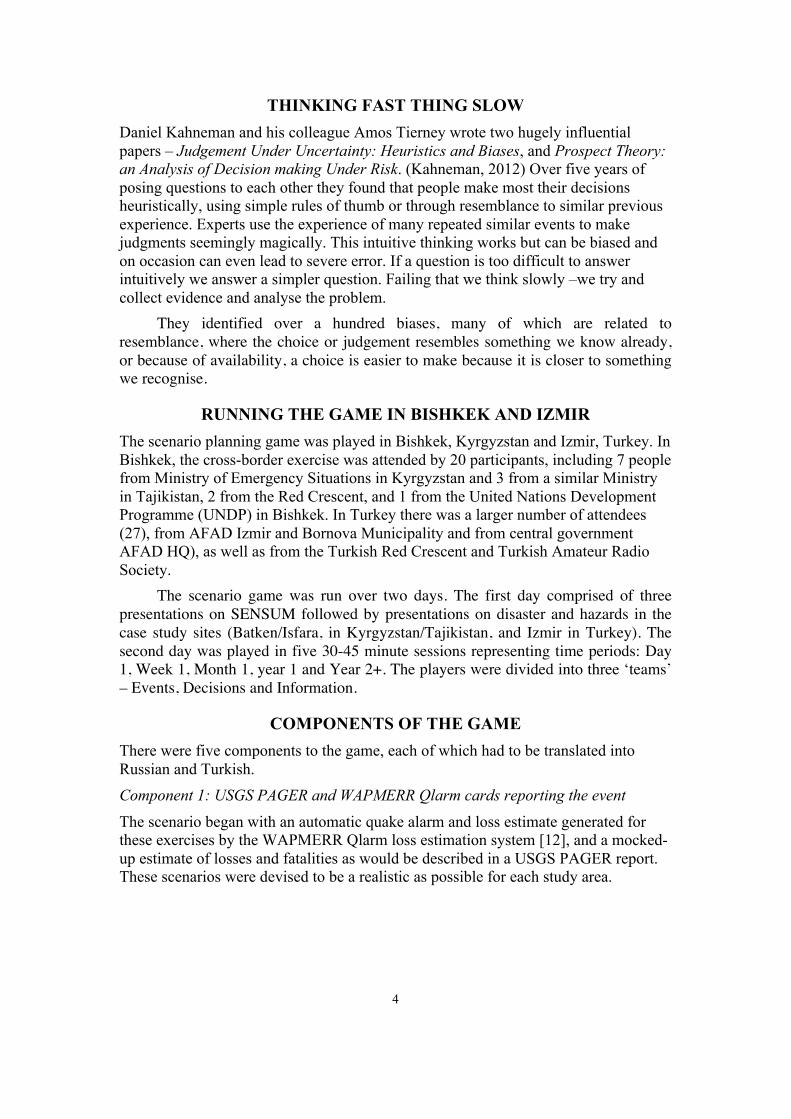
services, and livelihoods sectors [3]. Nevertheless, a number of outstanding questions remained that the SENSUM project has sought to address, including:
• Timing: when and how quickly is supporting information needed? • Resolution: what level of detail is needed? • Accuracy: what level of precision is required? • Cost: how much are people prepared to pay for this information?
SCENARIO PLANNING The scenario planning game developed for SENSUM involved getting people to dynamically ‘play’ through an imagined future. The ‘Game’ collapsed real time to highlight significant issues and to focus on strategic decisions. Moats et al.[4], , describe how, after major disasters, leaders are required to make high consequence decisions with incomplete or inaccurate information, ill-defined goals, and the pressures of time and a constantly changing situation by drawing on their training and experience. They posit scenario planning as a way managers can understand better their environments so as to avoid disastrous events and to put in place efficient and effective plans for coping if disaster should strike. Bradfield et al [5], say public policy makers are increasingly using scenarios as fora to involve multiple agencies and stakeholders in policy decisions, enabling joined-up analysis and creating an accommodation platform to assist policy implementation.
Scenario planning was developed by Herman Kahn at the Rand Corporation in the early 1950’s and used extensively in military planning [6]. In 1961, Khan established the Hudson Institute where he applied his scenario methodology to social forecasting and public policy. At the same time Gaston Berger was developing similar methods at the Centre d’Etudes Prospectives in Paris to guide public economic policy [7]. Shell used the technique in the 1970s to evaluate strategic options and Davis [8], described four basic types of scenario planning exercise: Inductive, Deductive, Incremental and Normative. The ‘Incremental’ type is particularly relevant to this research where the purpose was to better understand the post-disaster context and be able to specify how GIS and remote sensing data might be used appropriately [9].
In the disaster management field, the approach has been applied in ‘shakeout’ type preparedness exercises and drills aimed at raising public awareness. Bradfield et al. [5], in a review of the origins and evolution of scenario techniques, describe how they have been used in crisis management such as civil defence exercises in which scenarios are used in the form of simulations of future crisis situations. Of particular interest, Chermack [10] analyses decision failure by isolating three key issues that affect dynamic decision-making in situations similar to that found in disaster management: bounded rationality, exogenous variables and friction. All of these may be at play in decision making after a real event and may lead to what Chermack describes as “folly”. All three were observed in the scenario planning exercises in Bishkek and Izmir.
Mason [11] suggests focusing scenario planning exercises on events. He says that key events function as markers. This enables managers to recognise significant change as it occurs. This idea of using events as the main driver for the exercises was something adopted in the described SENSUM scenarios.
4
THINKING FAST THING SLOW Daniel Kahneman and his colleague Amos Tierney wrote two hugely influential papers – Judgement Under Uncertainty: Heuristics and Biases, and Prospect Theory: an Analysis of Decision making Under Risk. (Kahneman, 2012) Over five years of posing questions to each other they found that people make most their decisions heuristically, using simple rules of thumb or through resemblance to similar previous experience. Experts use the experience of many repeated similar events to make judgments seemingly magically. This intuitive thinking works but can be biased and on occasion can even lead to severe error. If a question is too difficult to answer intuitively we answer a simpler question. Failing that we think slowly –we try and collect evidence and analyse the problem.
They identified over a hundred biases, many of which are related to resemblance, where the choice or judgement resembles something we know already, or because of availability, a choice is easier to make because it is closer to something we recognise.
RUNNING THE GAME IN BISHKEK AND IZMIR The scenario planning game was played in Bishkek, Kyrgyzstan and Izmir, Turkey. In Bishkek, the cross-border exercise was attended by 20 participants, including 7 people from Ministry of Emergency Situations in Kyrgyzstan and 3 from a similar Ministry in Tajikistan, 2 from the Red Crescent, and 1 from the United Nations Development Programme (UNDP) in Bishkek. In Turkey there was a larger number of attendees (27), from AFAD Izmir and Bornova Municipality and from central government AFAD HQ), as well as from the Turkish Red Crescent and Turkish Amateur Radio Society.
The scenario game was run over two days. The first day comprised of three presentations on SENSUM followed by presentations on disaster and hazards in the case study sites (Batken/Isfara, in Kyrgyzstan/Tajikistan, and Izmir in Turkey). The second day was played in five 30-45 minute sessions representing time periods: Day 1, Week 1, Month 1, year 1 and Year 2+. The players were divided into three ‘teams’ – Events, Decisions and Information.
COMPONENTS OF THE GAME There were five components to the game, each of which had to be translated into Russian and Turkish. Component 1: USGS PAGER and WAPMERR Qlarm cards reporting the event The scenario began with an automatic quake alarm and loss estimate generated for these exercises by the WAPMERR Qlarm loss estimation system [12], and a mocked-up estimate of losses and fatalities as would be described in a USGS PAGER report. These scenarios were devised to be a realistic as possible for each study area.

5
Figure 1 Examples of WAPMERR Qlarm (for Batken) and Pager (for Izmir) based on a scenario of a
6.5 magnitude earthquake played to start the game in each place.
Component 2: Events Flash Cards A set of 28 generic events cards were devised. The Events teams discarded those cards that they considered inappropriate to their culture or situation. The remaining chosen event cards, plus additional cards devised by the team, were sorted into the time periods used in the game.
Figure 2. Events Board from the Izmir Game:
Event cards drive the game. Those with images were pre-prepared, the others were devised on the day by the Event Creators. Those on the left were discarded. The rest are arranged chronologically by the Events Creators.
6
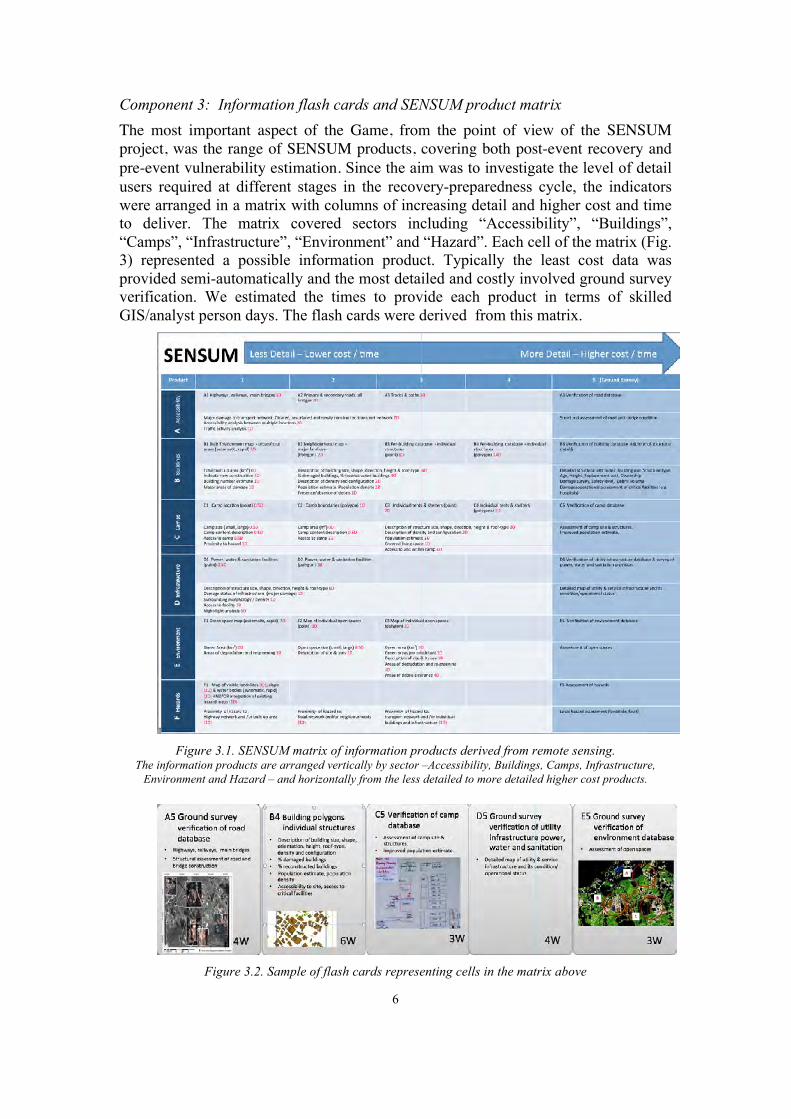
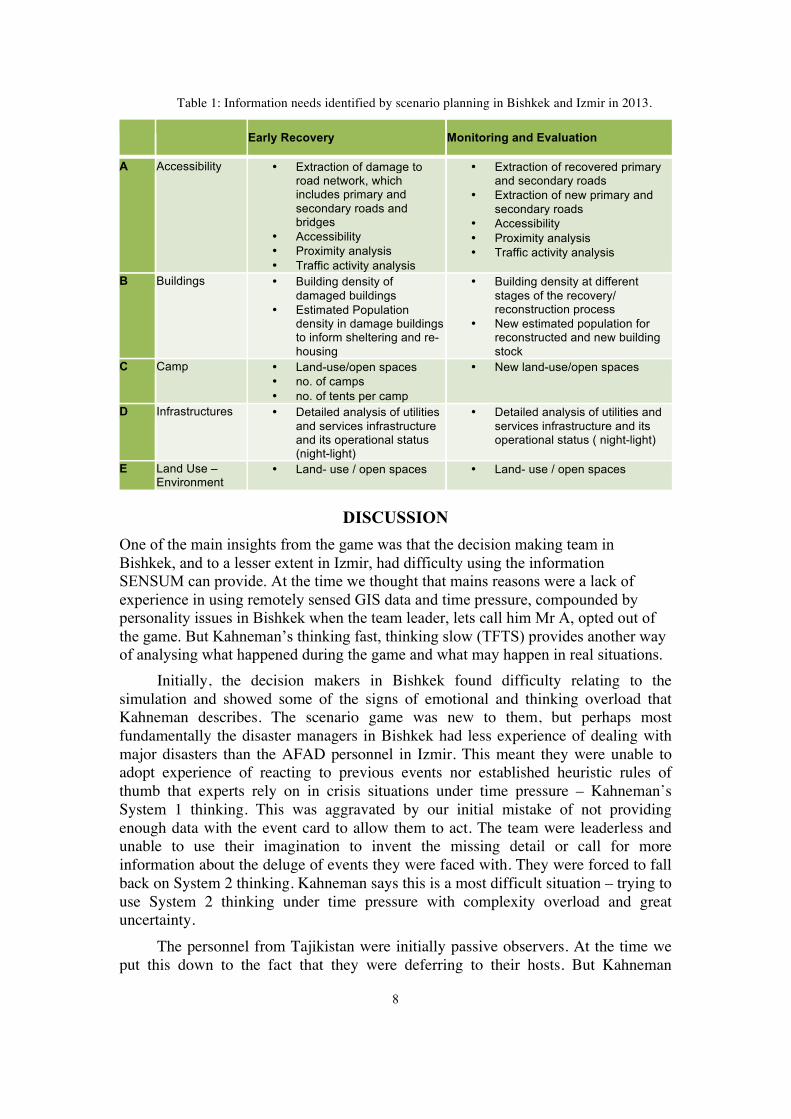
Component 3: Information flash cards and SENSUM product matrix The most important aspect of the Game, from the point of view of the SENSUM project, was the range of SENSUM products, covering both post-event recovery and pre-event vulnerability estimation. Since the aim was to investigate the level of detail users required at different stages in the recovery-preparedness cycle, the indicators were arranged in a matrix with columns of increasing detail and higher cost and time to deliver. The matrix covered sectors including “Accessibility”, “Buildings”, “Camps”, “Infrastructure”, “Environment” and “Hazard”. Each cell of the matrix (Fig. 3) represented a possible information product. Typically the least cost data was provided semi-automatically and the most detailed and costly involved ground survey verification. We estimated the times to provide each product in terms of skilled GIS/analyst person days. The flash cards were derived from this matrix.
Figure 3.1. SENSUM matrix of information products derived from remote sensing.
The information products are arranged vertically by sector –Accessibility, Buildings, Camps, Infrastructure, Environment and Hazard – and horizontally from the less detailed to more detailed higher cost products.
Figure 3.2. Sample of flash cards representing cells in the matrix above

7
Component 4: The Decision Board The decision board, placed in the centre of the room, was divided into 3 rows,
representing Events (green), Decisions (pink) and Information (yellow) and 5 columns representing time periods. These post it notes (and the top row of fuller reports produced by the information group) not only formed the log of the day’s activities, when transcribed, it formed the main data source for analysing decision-making and the use of SENSUM information products.
Figure 4. The Completed Decision Board from Izmir
The post-it notes record game play: green for events, yellow for information and pink for decisions. These were transcribed and translated and formed the basis of the analysis of decision-making and information use.
FINDINGS The transcripts of the Game clearly revealed the interplay between events, decisions and information in a way that other types of enquiry, for example user-needs surveys or interviews, would have failed to show. During the game the discussions at each table were highly informative for the SENSUM team. Our main impression was that decision making and information use was fairly close to behaviour in a real event. There was a focus on early recovery up to and including Year 1 and little longer term recovery planning. This was clearly a function of the particular people invited to take part but also represents what happens in reality.
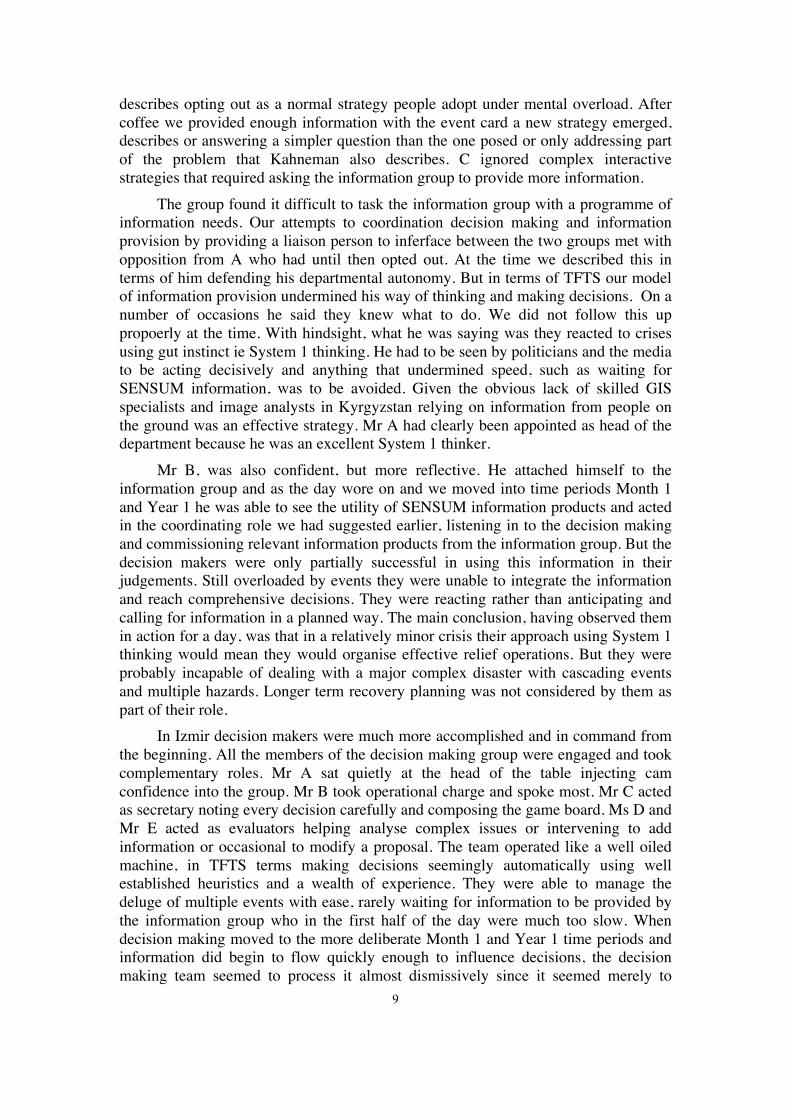
The choices of SENSUM products focused on damage assessment and early recovery. The key information needs derived from the Game are summarised in Table 1. The researchers also believed that there was a higher potential for using remote sensing products than users communicated through their choices. Beside the products requested by the decision-makers during the game, the SENSUM team also identified other products that could have been used in long-term recovery planning. In particular, products for the evaluation of hazard, both of flooding and earthquakes, as well as products for the identification of open spaces could have been useful. A hybrid product combining a detailed hazard map and a complete database of open spaces would inform post-disaster land-use planning. Detailed information about accessibility and infrastructures and critical services as well as building inventory products could be used to prepare data for the post-disaster vulnerability assessment. However, this fairly positive outcome needs to be qualified in the light of analysing the findings using Kahneman’s model of System 1 and System 2 thinking.
8
Table 1: Information needs identified by scenario planning in Bishkek and Izmir in 2013.
Early Recovery Monitoring and Evaluation
A Accessibility • Extraction of damage to road network, which includes primary and secondary roads and bridges
• Accessibility • Proximity analysis • Traffic activity analysis
• Extraction of recovered primary and secondary roads
• Extraction of new primary and secondary roads
• Accessibility • Proximity analysis • Traffic activity analysis
B Buildings • Building density of damaged buildings
• Estimated Population density in damage buildings to inform sheltering and re-housing
• Building density at different stages of the recovery/ reconstruction process
• New estimated population for reconstructed and new building stock
C Camp • Land-use/open spaces • no. of camps • no. of tents per camp
• New land-use/open spaces
D Infrastructures • Detailed analysis of utilities and services infrastructure and its operational status (night-light)
• Detailed analysis of utilities and services infrastructure and its operational status ( night-light)
E Land Use – Environment
• Land- use / open spaces
• Land- use / open spaces
DISCUSSION One of the main insights from the game was that the decision making team in Bishkek, and to a lesser extent in Izmir, had difficulty using the information SENSUM can provide. At the time we thought that mains reasons were a lack of experience in using remotely sensed GIS data and time pressure, compounded by personality issues in Bishkek when the team leader, lets call him Mr A, opted out of the game. But Kahneman’s thinking fast, thinking slow (TFTS) provides another way of analysing what happened during the game and what may happen in real situations.
Initially, the decision makers in Bishkek found difficulty relating to the simulation and showed some of the signs of emotional and thinking overload that Kahneman describes. The scenario game was new to them, but perhaps most fundamentally the disaster managers in Bishkek had less experience of dealing with major disasters than the AFAD personnel in Izmir. This meant they were unable to adopt experience of reacting to previous events nor established heuristic rules of thumb that experts rely on in crisis situations under time pressure – Kahneman’s System 1 thinking. This was aggravated by our initial mistake of not providing enough data with the event card to allow them to act. The team were leaderless and unable to use their imagination to invent the missing detail or call for more information about the deluge of events they were faced with. They were forced to fall back on System 2 thinking. Kahneman says this is a most difficult situation – trying to use System 2 thinking under time pressure with complexity overload and great uncertainty.
The personnel from Tajikistan were initially passive observers. At the time we put this down to the fact that they were deferring to their hosts. But Kahneman
9
describes opting out as a normal strategy people adopt under mental overload. After coffee we provided enough information with the event card a new strategy emerged, describes or answering a simpler question than the one posed or only addressing part of the problem that Kahneman also describes. C ignored complex interactive strategies that required asking the information group to provide more information.
The group found it difficult to task the information group with a programme of information needs. Our attempts to coordination decision making and information provision by providing a liaison person to inferface between the two groups met with opposition from A who had until then opted out. At the time we described this in terms of him defending his departmental autonomy. But in terms of TFTS our model of information provision undermined his way of thinking and making decisions. On a number of occasions he said they knew what to do. We did not follow this up propoerly at the time. With hindsight, what he was saying was they reacted to crises using gut instinct ie System 1 thinking. He had to be seen by politicians and the media to be acting decisively and anything that undermined speed, such as waiting for SENSUM information, was to be avoided. Given the obvious lack of skilled GIS specialists and image analysts in Kyrgyzstan relying on information from people on the ground was an effective strategy. Mr A had clearly been appointed as head of the department because he was an excellent System 1 thinker.
Mr B, was also confident, but more reflective. He attached himself to the information group and as the day wore on and we moved into time periods Month 1 and Year 1 he was able to see the utility of SENSUM information products and acted in the coordinating role we had suggested earlier, listening in to the decision making and commissioning relevant information products from the information group. But the decision makers were only partially successful in using this information in their judgements. Still overloaded by events they were unable to integrate the information and reach comprehensive decisions. They were reacting rather than anticipating and calling for information in a planned way. The main conclusion, having observed them in action for a day, was that in a relatively minor crisis their approach using System 1 thinking would mean they would organise effective relief operations. But they were probably incapable of dealing with a major complex disaster with cascading events and multiple hazards. Longer term recovery planning was not considered by them as part of their role.
In Izmir decision makers were much more accomplished and in command from the beginning. All the members of the decision making group were engaged and took complementary roles. Mr A sat quietly at the head of the table injecting cam confidence into the group. Mr B took operational charge and spoke most. Mr C acted as secretary noting every decision carefully and composing the game board. Ms D and Mr E acted as evaluators helping analyse complex issues or intervening to add information or occasional to modify a proposal. The team operated like a well oiled machine, in TFTS terms making decisions seemingly automatically using well established heuristics and a wealth of experience. They were able to manage the deluge of multiple events with ease, rarely waiting for information to be provided by the information group who in the first half of the day were much too slow. When decision making moved to the more deliberate Month 1 and Year 1 time periods and information did begin to flow quickly enough to influence decisions, the decision making team seemed to process it almost dismissively since it seemed merely to
10
confirm what they already knew or had already decided rather than provide new insights. The danger of this way of thinking is that it may be incapable of dealing with the unexpected where information might be crucial in understanding a novel situation. As evidence of this blindness was how B responded to a particular event devised especially to tax decision making – news that cracks had appeared in a large dam. B just rejected this event out of hand as too incredible to contemplate. The group literally threw the card off the board. This was shocking to us as observers. Dams are very highly engineered in Turkey, but failure is a remote possibility and the least one might have expected is that B would have directed someone in the information team to send an engineer to survey the damage properly and to have started to prepare a provisional evacuation plan since where it to have failed it would have posed a major threat to a heavily populated area.
Neither group were able or willing to think beyond Year 1. Long term recovery planning needs a different way of thinking than relief efforts. It was unreasonable of us in hindsight to have expected these disaster managers to be able to develop strategic plans. They have been selected because they can react effectively using fast System 1 thinking with little information or analysis.
The obvious answer is for the authorities to set up two separate teams working independently but with some degree of coordination. One would be the standing civil defence group of disaster managers – the people we had been working with in Bishkek and Izmir. The second team might have a few key people from civil defence who would provide liaison but would lead and comprise people seconded on merit for eighteen months to two years from academia, industry and the civil service. In Chile, where this worked successfully after the Maule earthquake in 2011, these people, at both national and local level, were senior academic architects. The dean of the Universidad del Desarrollo in Santiago, Pablo Allard, was the national coordinator of the urban reconstruction programme and Ivan Cartes, Dean of the Faculty of Architecture at the University of Bio-Bio in Concepción was seconded to lead the regional team master planning coastal settlements. Architects are used to taking responsibility for major projects and are trained to be able to analyse complex problems and think strategically. In TFTS terms, both groups use System 1 thinking a lot of the time, but the second group are more likely to use System 2 thinking to reflect, analyse and decide deliberately.
The challenge this poses SENSUM and others providing information to disaster decision makers is that two entirely different types of information are needed. We had assumed that the same information would be needed at each stage in the recovery process, merely the resolution would change as one moved form less detail to more detail. But the idea that there might be two different ways of thinking at play in decision making calls this into question. To have any influence on System 1 thinking the information would have to be provided magically quickly in the kind of real time streaming fighter pilots get from their heads up displays. The main purpose of SENSUM information is therefore to confirm or question decisions already taken and to force a rethink when mistakes have been made and need correcting. This creates a tension that is hard to resolve.
Longer term recovery planning in contrast requires detailed accurate GIS type information that can inform plan making. This is expensive and needs time, resources
11
and highly skilled personnel that may not be available in many places prone to disaster. SENSUM products are as yet not sophisticated or comprehensive enough. They report indicators that are relatively easy to measure rather than things that matter or things planners need to know.
This description of the issues involved in providing useful information to disaster decision makers is one aspect of the wider problem of taking research into practice. The problem is partly one of repackaging – taking research findings and presenting them in a shorter, clearer or more graphic form, and partly one of plugging gaps that theoretical research has not addressed but are important to practitioners. It is probably unreasonable, however, to expect researchers to better understand practitioners information needs or for practitioners to read academic research papers and extract the their relevance. What is needed is someone, in-house or in a consultancy, to interpret research findings and to respond quickly to information needs, due to:
• Data being not always available or accessible at the time of need; • Lack of understanding of end-users needs; • Lack of adequate communication of the potential relevance and applications; • Complex remote sensing sensors and methodologies that would require
substantial training for users to be operational. The aim of using scenario planning in SENSUM was precisely to begin to
identify barriers to the take-up of these new techniques by focusing on the reality and constraints of users’ needs for information at each stage of the recovery process. With this in mind, it was important to design a wide-range of alternative SENSUM products, with information flash cards that would:
• be transferable to both data rich / data poor countries, allowing comparisons; • permit inferences about preferences, for example, for less data-rich products; • list technologies at different levels of complexity and detail that would
highlight the trade-off users have to make between speed and detail.
Bearing in mind the areas in which remote sensing and GIS offer the greatest benefits and building upon the team’s previous experience in previous recovery projects [3], each product was designed to correspond with a set of potential indicators – those dealing with recovery derived from this previous research, and those related to hazards produced by the SENSUM team.
CONCLUSION The scenario planning game worked remarkably well in the two case studies, and the participants found it realistic and absorbing. They were able to imagine how the scenario might play out and use their imagination and experience to generate the detailed content. The Game had two main aims: a) to gain a deeper understanding on the real data needs of the end-users and b) to define a list of vulnerability and recovery indicators that would guide the development of appropriate SENSUM products. Both these aims were achieved. The Game also investigated what is required for remote sensing and GIS to become an integral part of the disaster risk management process. The evident potential has spurred considerable interest in the scientific community and the technical literature has numerous examples of advance image processing techniques to derive information about the physical structure and
12
composition of urban areas. To date, however, these techniques do not seem to be used to their full potential in disaster management and risk reduction.
During the game users in both countries had difficulty in transferring information needs into requests for data products. At the time we put this down to the inexorable pace of the disaster event forcing decision makers to follow standard protocols. We assumed that with more familiarity with GIS and remote sensing SENSUM products would be more widely adopted. However, Kahneman’s thesis of Thinking Fast, Thinking Slow suggests that the problem is more fundamental. The need to respond quickly means that disaster managers use intuitive System 1 thinking almost exclusively and may never be able to use the kind of information SENSUM is able to provide currently. Information will need to be provided on something like an interactive operations room screen if it to be used effectively.
Thinking Fast Thinking Slow, also suggests that Governments need to authorise two teams to respond to disasters. One, the usual civil defence team managing relief and immediate recovery who are good at System 1 thinking and the other who are good at both System 1 and System 2 thinking, planning long-term physical, social and economic recovery.
Acknowledgments These user-needs scenarios and the suite of remote sensing-based tools are presented as part of the European Commission FP7 project "SENSUM: framework to integrate space-based and in-situ sensing for dynamic vulnerability and recovery monitoring". The authors would like to thank project partners from the Central Asian Institute for Applied Geosciences (CAIAG) for hosting the game in Bishkek and the Izmir University of Economics Faculty of Architecture for hosting the game in Izmir. Also Max Wyss for providing a scenario-generated Qlarm seismic impact assessments and Gary Bowman from the Cambridge Judge Business School for his advice in designing the game. Most of all, thanks should go to the participants in each of the user needs workshops and those who participated so openly in the scenario games.
References 1. Comerio, M. C. (2013) Housing Recovery in Chile: A Qualitative Mid-program Review. Pacific
Earthquake Engineering Research Center. PEER 2013/01 Feb 2013 2. Platt, S (2008) Disaster Recovery User Needs Survey. Cambridge Architectural Research. 3. Brown D, Platt S and Bevington J (2010) Disaster Recovery Indicators: guidelines for monitoring
and evaluation. CURBE, Cambridge University Centre for Risk in the Built Environment. 4. Moats, J B, Chermack T J, and Dooley L M (2008) Using Scenarios to Develop Crisis Managers:
Applications of Scenario Planning and Scenario-Based Training, Advances in Developing Human Resources 10: 397 originally published online 3
5. Bradfield, R. Wright, G. Burt, G. Cairns, G. Van Der Heijden, K. Futures 37 (2005) 795–812 24 May 2005
6. Kahn, H. (1965) Thinking About the Unthinkable. New York: Horizon Press. 7. de Jouvenel, B. (1963) Introduction in: B. Jouvenel (Ed.), Futuribles: Studies in Conjecture, de
Droz, Geneva, pp. ix–xi. 8. Davis, G. (2002) Scenarios as a Tool for the 21st Century. http://www.shell.com/static/royal-
en/downloads/gd_scenarios_as_a_tool_12072002.pdf 9. Lorenz, C. (1990) How Shell Made its Managers Think the Unthinkable, Financial Times, 5 March,
1990. 10. Chermack, T J (2004) Improving decision-making with scenario Planning Futures 36 295–30911. 11. Mason, D H (1994) Scenario-based planning: Decision model for learning orgnaization. Planning
Review Mar/Apr 22, 2 12. WAPMERR (2013) Real-Time Loss Estimates after Earthquakes
http://www.wapmerr.org/realtime.asp. http://www.wapmerr.org/realtime.asp. Accessed 14/6/2013

13