third quarter 2014 quarterly market update
TRANSCRIPT

Third Quarter 2014 QUARTERLY MARKET UPDATE

Table of Contents
Third
Quart
er
2014
Q
UA
RT
ER
LY
MA
RK
ET
UP
DA
TE
MARKET SUMMARY 1.
THEME: INTEREST RATE OUTLOOK 2.
ECONOMY/MACRO BACKDROP 3.
U.S. EQUITY MARKETS 4.
INTERNATIONAL EQUITY MARKETS & GLOBAL ASSETS 5.
FIXED INCOME MARKETS 6.
ASSET ALLOCATION THEMES 7.
This report is a product of Fidelity’s Asset Allocation
Research Team (AART) with contributions from
throughout Fidelity’s asset management
organization. AART conducts economic,
fundamental, and quantitative research to develop
asset allocation recommendations for Fidelity’s
portfolio managers and investment teams. AART is
responsible for analyzing and synthesizing
investment perspectives across Fidelity’s asset
management unit to generate insights on
macroeconomic and financial market trends and their
implications for asset allocation.
Lisa Emsbo-Mattingly Director of Asset Allocation Research
Dirk Hofschire, CFA SVP, Asset Allocation Research
Craig Blackwell, CFA Analyst, Asset Allocation Research
PRIMARY CONTRIBUTORS
Austin Litvak Senior Analyst, Asset Allocation Research
Jake Weinstein, CFA Senior Analyst, Asset Allocation Research
Market Summary
Third Q
uart
er
2014
Q
UA
RT
ER
LY
MA
RK
ET
UP
DA
TE

S
UM
MA
RY
Overview: Backdrop Holds Steady, Less Risk Priced In The pace of global expansion remained slow but relatively steady during Q2 2014. Alongside accommodative monetary
policies and low inflation, market volatility plummeted and most asset prices rose. With less risk priced into the asset
markets, low volatility may breed investor complacency amid a difficult backdrop in China and risks to global oil supplies.
Past performance is no guarantee of future results. EM: emerging market. ECB: European Central Bank.
• Global economy slow but steady
– Benign cyclical trends in developed
markets, especially in U.S. and Europe
– In China, policy easing counters
weakness; EMs increasingly divergent
• ECB easing underscored stimulative,
“low for long” global monetary policies
• Modest interest-rate declines, generally
low inflation
• Rising geopolitical risk; Iraq concerns
pushed up oil prices, inflationary
pressures
• Business cycle still more supportive for
developed economies
– Steady backdrops in U.S. and Europe
– Pockets of U.S. wage inflation but no late-
cycle pressures yet
• Risks:
– Market complacency amid low volatility,
higher asset prices
– Potential for monetary policy to disappoint
– Asia: financial and cyclical backdrops in
China, Japan
– Geopolitical uncertainty, commodity supply
risks to inflation
Q2 2014 TRENDS OUTLOOK
MACRO
MARKETS
4
• “Goldilocks” fundamentals drove
market volatility lower, most asset
categories positive
• Gains widespread, performance range
relatively narrow
• U.S. mid-cycle still positive; equities still
more favorable in countries with steadier
cyclical outlooks
• Potential for market volatility to rise
• Interest rates range-bound; bonds may help
provide downside protection

S
UM
MA
RY
Risk Meter: U.S. Large-Cap Stock minus Treasury Bond Returns, 1984–2014
Widespread Gains across All Asset Categories All major asset classes posted solid gains during Q2 and were in positive territory on a year-to-date basis. REITs led for the
second quarter in a row, while rebounds occurred in Q1 global laggards such as emerging markets and non-U.S. developed
equities. The risk meter was in the middle range, indicating a narrow range of performance across different types of assets.
Quarterly Return Difference (%)
Past performance is no guarantee of future results. It is not possible to invest directly in an index. See appendix for important index information.
Assets represented by: Commodities – DJ-UBS Commodity Index; Emerging-Market Bonds – JP Morgan EMBI Global Index; Emerging-Market
Stocks – MSCI EM Index; Gold – Gold Bullion, LBMA PM Fix; High Yield Bonds – Bank of America Merrill Lynch (BofA ML) High Yield Bond Index;
Investment-Grade Bonds – Barclays U.S. Aggregate Bond Index; Non-U.S. Developed-Country Stocks – MSCI EAFE Index; Non-U.S. Small-Cap
Stocks – MSCI EAFE Small Cap Index; Real Estate Stocks – FTSE NAREIT Equity Index; U.S. Corporate Bonds – Barclays U.S. Credit Index; U.S.
Large-Cap Stocks – S&P 500 Index; U.S. Mid-Cap Stocks – Russell Midcap Index; U.S. Small-Cap Stocks – Russell 2000 Index; U.S. Treasury
Bonds – Barclays U.S. Treasury Index. Source: FactSet, Wall Street Journal, Haver Analytics, Fidelity Investments (AART), as of 6/30/14.
Q2 2014 (%) YTD (%) Q2 2014 (%) YTD (%)
Real Estate Stocks 7.1 16.2 High-Yield Bonds 2.6 5.6
Emerging-Market Stocks 6.7 6.3 Non-U.S. Small-Cap Stocks 2.2 5.8
Emerging-Market Bonds 5.4 9.1 Investment-Grade Bonds 2.0 3.9
U.S. Large-Cap Stocks 5.2 7.1 U.S. Small-Cap Stocks 2.0 3.2
U.S. Mid-Cap Stocks 5.0 8.7 Gold 1.8 9.4
Non-U.S. Developed-Country Stocks 4.3 5.1 U.S. Treasury Bonds 1.4 2.7
U.S. Corporate Bonds 2.7 5.7 Commodities 0.1 7.1
Risk On
Risk Off
5
-40
-30
-20
-10
0
10
20
30
De
c-9
8
De
c-9
9
Sep-0
9
Jun-0
3
De
c-0
1
Ma
r-1
3
Sep-8
7
De
c-0
2
De
c-0
9
Jun-0
7
Sep-9
5
Ma
r-8
9
De
c-9
6
De
c-9
2
Jun-0
4
Jun-8
6
Sep-9
7
Sep-0
3
Jun-9
5
De
c-8
6
De
c-8
8
Jun-9
4
De
c-0
5
Jun-8
9
Sep-9
1
De
c-9
7
Sep-9
3
Ma
r-0
7
Ma
r-0
4
Jun-9
1
De
c-8
9
Jun-9
2
Jun-9
3
Ma
r-0
3
De
c-8
4
Sep-9
9
Ma
r-0
9
Ma
r-0
8
Sep-9
8
Sep-0
1
De
c-8
7
3.8% Jun-14

S
UM
MA
RY
Foreign Exchange
0%
10%
20%
30%
40%
50%
60%
70%
80%
90%
100%
Un
ite
d S
tate
s
Euro
zone
Germ
any
Un
ite
d K
ing
dom
Fra
nce
Japa
n
Sw
itzerl
and
FX
Vo
l
Euro
zone
Un
ite
d K
ing
dom
Sw
itzerl
and
Japa
n
Ca
nad
a
Austr
alia
Ne
w Z
eala
nd
No
rwa
y
South
Kore
a
Ch
ina
Gold
Hig
h Y
ield
Tre
asury
Tre
asury
Curv
e
3m high 3m low current
Exceptionally Low Global Market Volatility Market volatility has plunged across nearly all financial instruments—including stocks, bonds, and currencies—hitting five-
year lows in many categories. The steady economic backdrop and expectations of sustained low monetary policy rates have
engendered investor risk-taking, particularly in carry trades that tend to benefit higher-yielding bonds and currencies.
6
Past performance is no guarantee of future results. It is not possible to invest directly in an index. See appendix for important index information. Implied
volatility rankings calculated using 30-day at-the-money option prices. Equity volatility indices based on derivative fluctuations for each stock market.
Volatility for each equity market represented by: United States – S&P 500; Eurozone – Euro Stoxx 50; Germany – DAX Index; United Kingdom – FTSE
100; France – CAC 40; Japan – Nikkei 225; Switzerland – SMI. Foreign exchange volatility (gray shading) is based on movements in each currency
relative to the U.S. dollar; FX Vol is a Fidelity Investments calculation aggregating currency volatility. Gold volatility is gold prices relative to the U.S.
dollar. High Yield volatility is calculated from the JNK exchange-traded fund. Treasury volatility is based on the MOVE Index. Treasury Curve is the
volatility spread between the five- and one-year Treasuries. Source: Bloomberg Finance L.P., Fidelity Investments (AART), as of 6/30/14.
Implied Asset Class Volatility
Percentile Ranking vs. Last Five Years
Equities Fixed Income

S
UM
MA
RY
Low Volatility Veils Some Churning Beneath the Surface Despite muted market-level volatility, narrower equity categories—such as small caps, biotechnology, and Internet stocks—
experienced a correction. These categories led the market coming into 2014 and sported relatively high valuations compared
with the broader indices, but they regained their footing during Q2 without disturbing the overall market’s upward trend.
7
100
110
120
130
140
150
160
Jun-13 Jul-13 Aug-13 Sep-13 Oct-13 Nov-13 Dec-13 Jan-14 Feb-14 Mar-14 Apr-14 May-14 Jun-14
Biotech Internet Software & Svcs Small Caps
Market Performance
Index Levels (6/30/13 = 100)
Past performance is no guarantee of future results. It is not possible to invest directly in an index. See appendix for important index information. Peak
and trough dates for indices: Biotech – 2/25/14 (Peak) and 4/11/14 (Trough); Internet Software & Services – 3/5/14 and 5/8/14; Small Caps – 3/4/14
and 5/15/14. Small Caps represented by the Russell 2000 Index. Biotech represented by the Russell 3000 Biotechnology sub-index. Internet Software
& Services represented by the Russell 3000 Internet Software & Services sub-index. Source: FactSet, Fidelity Investments (AART), as of 6/30/14.
Peak-to-Trough Performance
Biotech -20.8%
Internet Software & Services -17.5%
Small Caps -9.3%
Internet Software & Services Small Caps

Third Q
uart
er
2014
Q
UA
RT
ER
LY
MA
RK
ET
UP
DA
TE
Theme:
Interest Rate Outlook

T
HE
ME
Fed: Federal Reserve. QE: quantitative easing. LEFT: Source: Bloomberg Finance L.P., Fidelity Investments (AART), as of 6/30/14. RIGHT: Past
performance is no guarantee of future results. Other G7 (Group of 7) countries include Canada, France, Germany, Italy, Japan, and U.K. Simple average
shown. Source: Bloomberg Finance L.P., Fidelity Investments (AART), as of 6/30/14.
2013 Curve Shift, Low Global Yields Keep U.S. Rates Low The dramatic steepening of the yield curve in 2013 reflected increased investor expectations of the Fed’s QE tapering and of
stronger U.S. economic growth in 2014. So far this year, yields have come back down as investors interpreted a dovish Fed
stance and disappointing economic performance. Low yields globally have supported foreign demand for U.S. bonds.
U.S. Treasury Yield Curve
Yield (%)
0.0
0.5
1.0
1.5
2.0
2.5
3.0
3.5
4.0
1-M
onth
1-Y
ear
2-Y
ear
3-Y
ear
5-y
ear
7-Y
ear
10
-Yea
r
20
-Yea
r
30
-Yea
r
12/31/13
6/30/14
3/31/13
9
1.50
1.75
2.00
2.25
2.50
2.75
3.00
3.25
De
c-1
2
Jan-1
3
Feb
-13
Ma
r-1
3
Apr-
13
Ma
y-1
3
Jun-1
3
Jul-1
3
Aug-1
3
Sep-1
3
Oct-
13
No
v-1
3
De
c-1
3
Jan-1
4
Feb
-14
Ma
r-1
4
Apr-
14
Ma
y-1
4
Jun-1
4
U.S. Other G7s
Yield (%)
10-Year Government Bond Yields
T
HE
ME
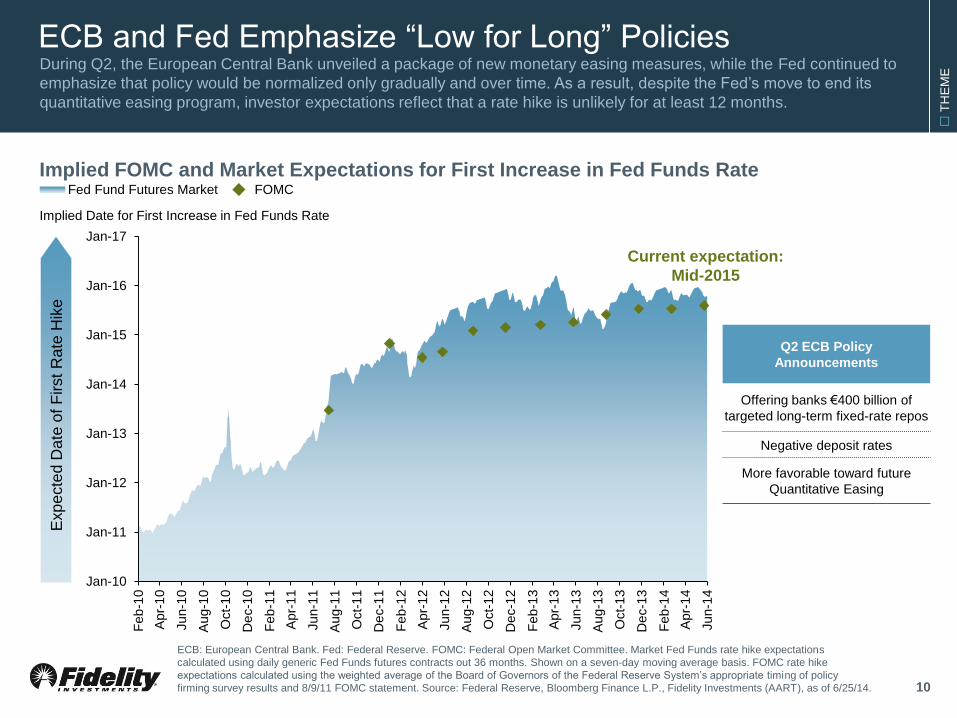
ECB and Fed Emphasize “Low for Long” Policies During Q2, the European Central Bank unveiled a package of new monetary easing measures, while the Fed continued to
emphasize that policy would be normalized only gradually and over time. As a result, despite the Fed’s move to end its
quantitative easing program, investor expectations reflect that a rate hike is unlikely for at least 12 months.
10
Jan-10
Jan-11
Jan-12
Jan-13
Jan-14
Jan-15
Jan-16
Jan-17
Feb
-10
Apr-
10
Jun-1
0
Aug-1
0
Oct-
10
De
c-1
0
Feb
-11
Apr-
11
Jun-1
1
Aug-1
1
Oct-
11
De
c-1
1
Feb
-12
Apr-
12
Jun-1
2
Aug-1
2
Oct-
12
De
c-1
2
Feb
-13
Apr-
13
Jun-1
3
Aug-1
3
Oct-
13
De
c-1
3
Feb
-14
Apr-
14
Jun-1
4
Fed Fund Futures Market FOMC
Implied Date for First Increase in Fed Funds Rate
Implied FOMC and Market Expectations for First Increase in Fed Funds Rate
ECB: European Central Bank. Fed: Federal Reserve. FOMC: Federal Open Market Committee. Market Fed Funds rate hike expectations
calculated using daily generic Fed Funds futures contracts out 36 months. Shown on a seven-day moving average basis. FOMC rate hike
expectations calculated using the weighted average of the Board of Governors of the Federal Reserve System’s appropriate timing of policy
firming survey results and 8/9/11 FOMC statement. Source: Federal Reserve, Bloomberg Finance L.P., Fidelity Investments (AART), as of 6/25/14.
Q2 ECB Policy
Announcements
Offering banks €400 billion of
targeted long-term fixed-rate repos
Negative deposit rates
More favorable toward future
Quantitative Easing
Exp
ecte
d D
ate
of
First
Rate
Hik
e
Current expectation:
Mid-2015

T
HE
ME
-200
0
200
400
600
800
1,000
1,200
1,400
1,600
1,800
2,000
2,200
2004 2005 2006 2007 2008 2009 2010 2011 2012 2013 2014***
Government Issuance (Post-Fed)* Spread Product Issuance Coupon Reinvestment Demand
Favorable Bond Market Technicals: Limited New Supply The net issuance of bonds—including government bonds after subtracting Fed purchases, as well as private credit bonds—
has been lower in recent years than before the financial crisis in 2008. Since 2008, the demand created by the reinvestment
of coupon proceeds has been nearly sufficient to soak up new issuance without any additional inflows.
Billions ($)
U.S. Dollar Bond Net Issuance vs. Reinvestment Demand
*Post-Fed: excluding Fed asset purchases. **Federal Reserve and foreign official institutions as defined by the Treasury. ***Forecasted through year-end by
JPMorgan (JPM) Research. Demand includes coupons for all bond issuance. Government Issuance includes Treasuries, agencies, and agency MBS.
Spread Product Issuance includes corporates, emerging-market sovereigns, municipals, non-agency MBS, ABS, CMBS, and CLOs. IG: investment-grade.
Source: JPM Research as of 5/31/2014 (bond issuance and reinvestment, data copyright JPM Research 2014), Barclays as of 9/30/2013 (investment grade
corporate bondholders), Federal Reserve Flow of Funds (Treasury holders), Haver Analytics as of 3/31/2014, Fidelity Investments (AART), as of 6/30/14.
Ownership Share of Less
Return-Oriented Investors
IG Corporate Bonds 2013
Pensions & Insurance 55%
Treasuries 1994 2014
Central Banks** 21% 51%
Supply Exceeds
Reinvestment Demand
Reinvestment
Demand Near
Supply
11

T
HE
ME
-1.0%
-0.5%
0.0%
0.5%
1.0%
1.5%
2.0%
2.5%
3.0%
3.5%
4.0%
0.0% 1.0% 2.0% 3.0% 4.0%
Nominal: not inflation-adjusted. Real: inflation-adjusted. GDP: Gross Domestic Product. LEFT: Real Treasury yield represented by the constant
maturity 10-Year Treasury Inflation-Protected Security. Nominal yield represented by the constant maturity 10-Year Treasury bond. Expected inflation
calculated as the difference between the nominal and real yields. Source: Bloomberg Finance L.P., Fidelity Investments (AART), through 6/30/14.
RIGHT: The average real 10-year yield and real GDP compound annual growth rates are calculated since the inception dates of the inflation-adjusted
government securities for the following countries: United Kingdom (Jan. 1985), Australia (Jun. 1985), Canada (Nov. 1991), United States (Apr. 1998),
and Japan (Apr. 2004). Source: Country statistical organizations, Haver Analytics, Fidelity Investments (AART), through 6/30/14.
June 2014
-1
0
1
2
3
4
Feb
-11
Apr-
11
Jun-1
1
Aug-1
1
Oct-
11
De
c-1
1
Feb
-12
Apr-
12
Jun-1
2
Aug-1
2
Oct-
12
De
c-1
2
Feb
-13
Apr-
13
Jun-1
3
Aug-1
3
Oct-
13
De
c-1
3
Feb
-14
Apr-
14
Jun-1
4
Outlook: A Sharp Rise in Yields Remains Unlikely After 2013’s rise, the decline in real long-term bond yields during 2014 has been the main driver of falling long-term nominal
rates. Because bond yields and GDP growth tend to be highly correlated, given our forecast for slower U.S. GDP growth over
the next 20 years, we believe 10-year Treasury yields should rise over time but to a level that is below the historical average.
12
Average Real 10-Year Yield
Real GDP Compound Annual Growth Rate
Historical Observations in U.K., Australia, Canada, United States,
and Japan
Government Real Yields and Real GDP
Growth for Major Economies, 1985–2014
10-Year Nominal and Real Treasury
Yields and Inflation Expectations
Jan. 1
3.0%
0.8%
Yield (%)
Nominal
Treasury
Yield
Real Treasury
Yield
Expected
Inflation
U.S. 20-Year Forecast
March 2013
0.3%
Jun. 30
2.5%

Third Q
uart
er
2014
Q
UA
RT
ER
LY
MA
RK
ET
UP
DA
TE
Economy/Macro Backdrop

E
CO
NO
MY
Global Business Cycle Relatively Steady but Slow The global economy continues to grow at steady pace as the U.S. and much of Europe remain firmly in the mid-cycle.
However, Japan has seen late-cycle pressures persist, while China’s economy faces late cycle pressures and may be in a
growth recession despite recent policy easing.
*For developed economies, we use the classic definition of recession, involving an outright contraction in economic activity. For developing economies,
such as China, we have adopted a “growth cycle” definition because they tend to exhibit strong trend performance driven by rapid factor accumulation
and increases in productivity, and deviation from trend tends to matter most for asset returns. Source: Fidelity Investments (AART), as of 6/30/14. 14

E
CO
NO
MY
Low U.S. Economic Volatility; Some Weakening Abroad The U.S. backdrop has been steady, with plunging volatility in economic data contributing to stability in the asset markets.
However, leading economic indicators for the major global economies have deteriorated somewhat over the past quarter, with
emerging economies suffering a greater slowing.
15
LEFT: See appendix for important index information. A Z-score is a measurement of the volatility of specific data points relative to the average of
those data points. Shaded area indicates a recession as defined by the National Bureau of Economic Research. Source: Rasmussen Consumer
Index (consumer confidence), American Iron and Steel Institute (raw steel production), Department of Labor (initial unemployment claims), Economic
Cycle Research Institute (weekly leading index), National Bureau of Economic Research, Haver Analytics, Fidelity Investments (AART), as of 6/16/14.
RIGHT: LEI data from 20 developed and 20 emerging economies. Data complete through 3/31/14; as of 6/30/14, 95% of countries reporting data
through 4/30/14. Source: Organisation for Economic Co-operation and Development (OECD), Foundation for International Business and Economic
Research (FIBER), Haver Analytics, Fidelity Investments (AART), as of 6/30/14.
0%
10%
20%
30%
40%
50%
60%
70%
80%
90%
100%
Apr-
07
Apr-
08
Apr-
09
Apr-
10
Apr-
11
Apr-
12
Apr-
13
Apr-
14
Developed Emerging
Leading Economic Indicators (LEIs)
% Positive over Past 6 Months
0
0
0
0
0
0
0
0
0
0
0
-1.0
-0.8
-0.6
-0.4
-0.2
0.0
0.2
0.4
0.6
20
07
20
08
20
09
20
10
20
11
20
12
20
13
20
14
Consumer Confidence Raw Steel Production
Initial Claims (Inverted) Weekly Leading Index
Volatility of Key U.S. Economic Indicators
One-Year Rolling Average Z-Score

E
CO
NO
MY
Outlook for Europe Steady but Slow; for Japan, Uncertain Developed Europe’s cyclical backdrop remains positive. Most countries boast a favorable outlook for manufacturing, although
the slowing bullwhip is a sign that the expansion remains sluggish. The outlook for Japan remains muddled, as post-
consumption tax hike data has shown a recovery in sentiment despite still-difficult current conditions.
16
European Manufacturing Bullwhip
LEFT: PMI: Purchasing Managers Index. See appendix for important index information. Source: Markit, Haver Analytics, Fidelity Investments
(AART), as of 6/30/14. RIGHT: Source: Cabinet Office of Japan, Haver Analytics, Fidelity Investments (AART), as of 6/9/14.
-4
-2
0
2
4
6
8
10
12
14
Euro
Are
a
Fra
nce
Germ
any
Ita
ly
Spain
U.K
.
Dec.2013 May.2014
Japan Economy Watchers Survey
20
25
30
35
40
45
50
55
60
2010 2011 2012 2013 2014
Current Conditions Future Conditions
Bullwhip: Manufacturing PMI New Orders Index minus Inventories Index Diffusion Index (50 = Neutral)

E
CO
NO
MY
EMs: Recent Stability but Late-Cycle Challenges Persist Emerging-market economies have stabilized recently as global financial conditions have eased, current account deficits have
shrunk, exchange rate volatility has decreased, and election outcomes have generally been perceived as favorable. Yet, most
are still facing stagflationary pressures, weak corporate profitability, and mixed lending and monetary conditions.
17
Currency
Change India Turkey
South
Africa Indonesia Brazil
2013 -11% -17% -19% -21% -13%
YTD 2014 3% 1% -1% 1% 7%
Current account: the sum of net exports, net income from abroad, and net current transfers from abroad. EM: emerging market. LEFT: Source: Country
statistical organizations, FactSet, Haver Analytics, Fidelity Investments (AART), as of 3/31/2014. RIGHT: Country statistical organizations, FactSet,
Institute for International Finance (IIF), Haver Analytics, Fidelity Investments (AART), as of 5/31/14. IIF survey data as of 3/31/14.
Late-Cycle Dynamics in Emerging Markets
Persistent Inflationary
Pressures
Many large EM countries remain
above their inflation targets
Weak Profitability EM earnings per share contracted
over past year
Tighter Bank Lending
Standards
Bank lending conditions contracted
for 4th consecutive quarter
in Q1 2014
Mixed Monetary Policies China easing, but some EMs have
tightened to counter inflation
-8%
-6%
-4%
-2%
0%
2%
4%
6%
India Turkey South Africa Indonesia Brazil
Q1 2013 Q1 2014 4 Qtr. Change
Current Account Balance
% of GDP

E
CO
NO
MY
Gains in Employment Support Outlook for U.S. Consumer The U.S. labor market continues to steadily improve; initial unemployment claims have fallen near seven-year lows and
employee earnings are slowly accelerating. Consumer sentiment remains near post-recession highs. An improving
employment backdrop and the potential for higher wages supports a constructive outlook for consumption activity.
18
0.5%
1.0%
1.5%
2.0%
2.5%
3.0%
3.5%
4.0%
4.5%
5.0%
0
2
4
6
8
10
12
14
16
18
20
22
24
19
95
19
96
19
97
19
98
19
99
20
00
20
01
20
02
20
03
20
04
20
05
20
06
20
07
20
08
20
09
20
10
20
11
20
12
20
13
20
14
Small Business Worker CompensationAvg. Hourly Earnings
50
55
60
65
70
75
80
85
90
95
100
250
300
350
400
450
500
550
600
650
700
20
05
20
06
20
07
20
08
20
09
20
10
20
11
20
12
20
13
20
14
Initial Claims (4-week avg.) Consumer Sentiment
Employment and Consumer Sentiment Hourly Earnings & Worker Compensation
Initial Unemployment Claims
(Thousands)
Univ. of Michigan
Consumer Sentiment Index Net % Planning to Raise
Worker Compensation
Year-over-Year Change in Avg.
Hourly Earnings
Shaded areas indicate recessions as defined by the National Bureau of Economic Research. LEFT: Source: Department of Labor, University of
Michigan, Haver Analytics, Fidelity Investments (AART), through 6/30/14. RIGHT: Source: National Federation of Independent Businesses, Bureau
of Labor Statistics, Haver Analytics, Fidelity Investments (AART), as of 5/31/2014.

E
CO
NO
MY
LEFT: Source: Ellie Mae as of 5/31/2014 (FICO scores), National Association of Realtors as of 5/31/2014 (affordability, months of sales), Bureau of
Labor Statistics as of 6/30/14 (unemployment rate), Census Bureau as of 5/31/2014 (housing starts, months of sales), Haver Analytics, Fidelity
Investments (AART), as of 6/30/14. RIGHT: Capital expenditure plans are GDP-weighted (20% Industry, 80% Service). Source: Bureau of Economic
Analysis (real private fixed non-residential investment), Institute for Supply Management (planned capital expenditures), Haver Analytics, Fidelity
Investments (AART), as of 5/19/2014.
Housing Slower; Capital Expenditure Could Accelerate After a sharp rebound through the first half of 2013, the housing market remains in a soft patch. However, slowly improving
fundamentals suggest the sector will provide a modest economic tailwind over the next two to three years. Business
sentiment has continued to improve, signaling a potential pickup in capital expenditures.
U.S. Capital Expenditure
-20%
-15%
-10%
-5%
0%
5%
10%
15%
20
01
20
02
20
03
20
04
20
05
20
06
20
07
20
08
20
09
20
10
20
11
20
12
20
13
20
14
Real Private Fixed Non-Residential InvestmentCapital Expenditure Plans for Current Year
Year-over-Year % Change Negatives Positives
Tight mortgage
credit
Slow credit thaw under way
Average FICO score on approved loans
lower than last year
Higher prices
Affordability still high
Index higher than at any point from
1971 to 2008
Weak new
housing demand
Labor market slowly improving
Unemployment rate of 25- to 34-year-olds
fell to 6.5% from 7.7% one year ago
Tepid construction
activity
Activity still positive
Housing starts up 10% year over year
Supply concerns
Inventories at low levels
Median of 5.5 months of sales is lower
than historical average
U.S. Housing Fundamentals
19
E
CO
NO
MY
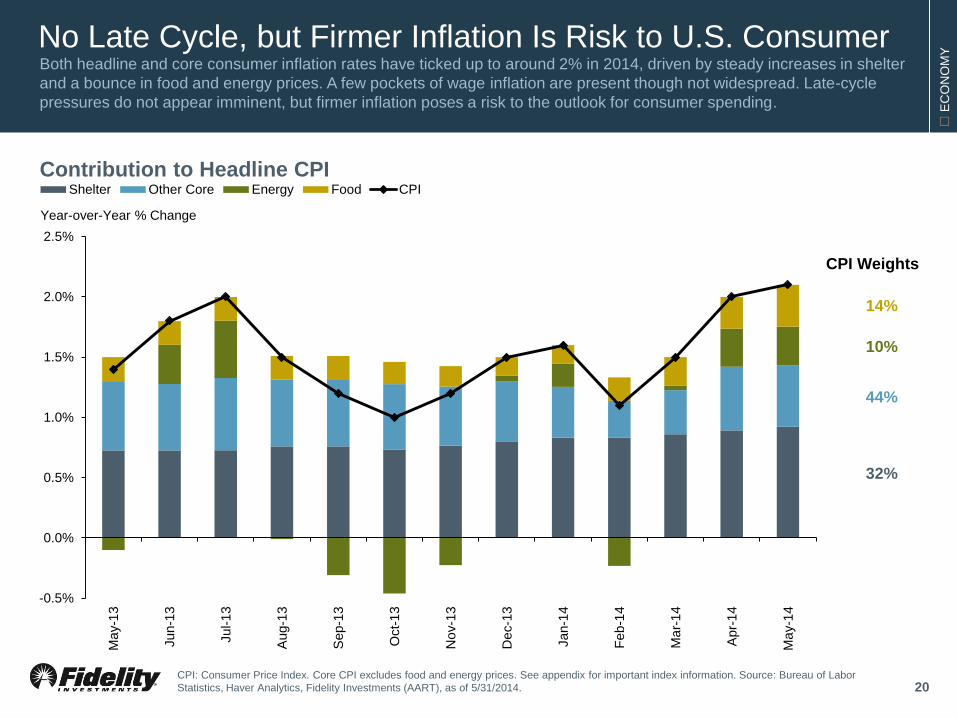
No Late Cycle, but Firmer Inflation Is Risk to U.S. Consumer Both headline and core consumer inflation rates have ticked up to around 2% in 2014, driven by steady increases in shelter
and a bounce in food and energy prices. A few pockets of wage inflation are present though not widespread. Late-cycle
pressures do not appear imminent, but firmer inflation poses a risk to the outlook for consumer spending.
-0.5%
0.0%
0.5%
1.0%
1.5%
2.0%
2.5%
Ma
y-1
3
Jun-1
3
Jul-1
3
Aug-1
3
Sep-1
3
Oct-
13
No
v-1
3
De
c-1
3
Jan-1
4
Feb
-14
Ma
r-1
4
Apr-
14
Ma
y-1
4
Shelter Other Core Energy Food CPI
Contribution to Headline CPI
Year-over-Year % Change
CPI: Consumer Price Index. Core CPI excludes food and energy prices. See appendix for important index information. Source: Bureau of Labor
Statistics, Haver Analytics, Fidelity Investments (AART), as of 5/31/2014.
14%
10%
44%
32%
CPI Weights
20
E
CO
NO
MY
90
95
100
105
110
115
120
Dec-13 Jan-14 Feb-14 Mar-14 Apr-14 May-14 Jun-14
Agriculture & Livestock Energy Industrial Metals
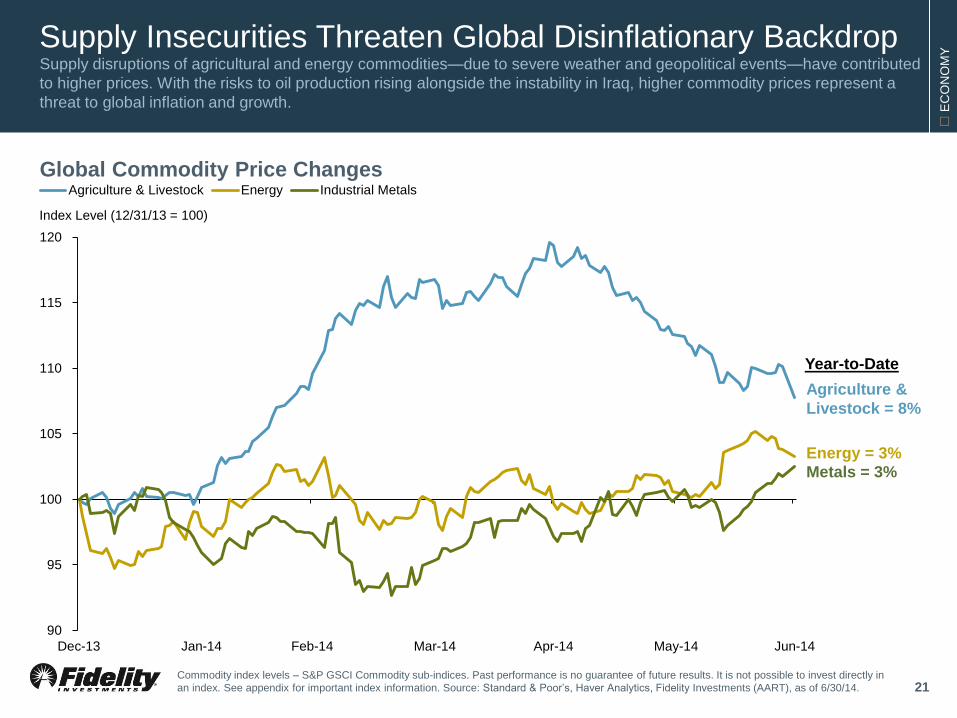
Supply Insecurities Threaten Global Disinflationary Backdrop Supply disruptions of agricultural and energy commodities—due to severe weather and geopolitical events—have contributed
to higher prices. With the risks to oil production rising alongside the instability in Iraq, higher commodity prices represent a
threat to global inflation and growth.
21 Commodity index levels – S&P GSCI Commodity sub-indices. Past performance is no guarantee of future results. It is not possible to invest directly in
an index. See appendix for important index information. Source: Standard & Poor’s, Haver Analytics, Fidelity Investments (AART), as of 6/30/14.
Index Level (12/31/13 = 100)
Agriculture &
Livestock = 8%
Metals = 3%
Global Commodity Price Changes
Energy = 3%
Year-to-Date

E
CO
NO
MY
China’s Financial Backdrop Poses Risk to Asia’s Growth Our banking crisis model is an early warning system that identifies mounting financial imbalances as a rising risk of future
crisis. The probability of crisis has risen among emerging economies in recent years—specifically in China, as its rapid
expansion of credit and housing prices is similar to the excesses of other countries that have experienced financial crises.
22
0.00
0.02
0.04
0.06
0.08
0.10
0.12
0.14
0.16
0.18
1994 1995 1996 1997 1998 1999 2000 2001 2002 2003 2004 2005 2006 2007 2008 2009 2010 2011 2012 2013 2014
Developed Markets Emerging Markets
Asian Financial Crisis
Global Financial Crisis
EM Asia Stress
Aggregate Financial Crisis Risk (In Following Three Years)
Risk is weighted by share of global GDP. The countries included in the analysis vary over time from 22 in 1993 to 30 currently. Source: World Bank,
Fidelity Investments (AART), through 3/31/14.
Probability of a Banking Crisis (GDP-weighted)

E
CO
NO
MY
Property Market Dip Threatens China’s Near-Term Stability China continues to try to balance reining in excessive credit creation with attempting to meet high targets for economic
growth. A slump in real estate—at the center of China’s credit and investment boom—presents a substantial downside risk,
prompting China’s policymakers during Q2 to shift the policy focus away from reform and toward supporting growth.
23
0
50
100
150
200
250
300
-40%
-20%
0%
20%
40%
60%
80%
2008 2009 2010 2011 2012 2013 2014
Construction Started Vacant Residential Inventory-to-Sales Ratio
China Real Estate
Year-over-Year Change (%) Index (2008* = 100)
* Average for 2008 used as index. Both data series are seasonally adjusted and shown as a three-month average. Vacant Residential Inventory-
to-Sales Ratio: Residential square footage vacant and available for sale divided by residential square footage sold. Source: China National
Statistics Bureau, Haver Analytics, Fidelity Investments (AART), as of 6/13/14.
Recent China Policy Announcements
Increased government spending on rail and
water infrastructure
Local governments urged to accelerate spending
Lower required reserve ratio for banks focused
on small business and rural loans
Targeted lending programs from the central
bank, channeled through state-owned banks

E
CO
NO
MY
Boundless High Liquidity Growth Is Not Guaranteed While global interest rates are low and financial conditions easy, the direction of monetary policy has grown more diverse.
The U.S. and U.K. are moving beyond quantitative easing, and monetary actions among emerging markets are now split
between rate hikes and rate cuts. Any unexpected shift toward a less accommodative stance could create market volatility.
24
0%
1%
2%
3%
4%
5%
6%
7%
8%
9%
2004 2005 2006 2007 2008 2009 2010 2011 2012 2013 2014
Developed Markets Emerging Markets ex China
Average target policy rates are GDP-weighted. Developed Markets include: Australia, Canada, the eurozone, Japan, U.K., and U.S. Emerging Markets
ex China include: Brazil, Czech Republic, Hong Kong, Hungary, India, Indonesia, Malaysia, Mexico, Poland, Russia, Singapore, South Africa, South
Korea, Taiwan, Thailand, and Turkey. Sources: Country central banks, Haver Analytics, Fidelity Investments (AART), as of 6/30/14.
Central Bank Target Policy Rates
Target Policy Rates (%)

E
CO
NO
MY
Outlook: Market Assessment Fidelity’s Business Cycle Board, composed of portfolio managers responsible for a variety of asset allocation strategies
across Fidelity’s asset management unit, believes that the global economy remains on a trend of slow but steady growth, with
a mixed outlook among countries and regions.
Potential Risks
• Recent uptick in inflation
• Continued rise in geopolitical uncertainty
• Uncertain economic outlooks for China and
Japan
Asset Allocation Considerations
• Global business cycle generally supportive of risk
assets in U.S. and Europe
• Mostly cautious toward emerging-market equities but
prices have already discounted significant weakness
• Disciplined risk-management practices are
imperative, especially during periods of extremely
low volatility
Pockets of wage growth not
a significant late-cycle risk
Market volatility subdued due to
steady economy and easy
monetary policies
Fed rate hikes remain
unlikely over next six to
12 months
Source: Market Assessment Statement of Global Asset Allocation’s Business Cycle Board, Fidelity Investments, as of 6/30/14. 25
Third Q
uart
er
2014
Q
UA
RT
ER
LY
MA
RK
ET
UP
DA
TE
U.S. Equity Markets
U
.S. E
QU
ITY
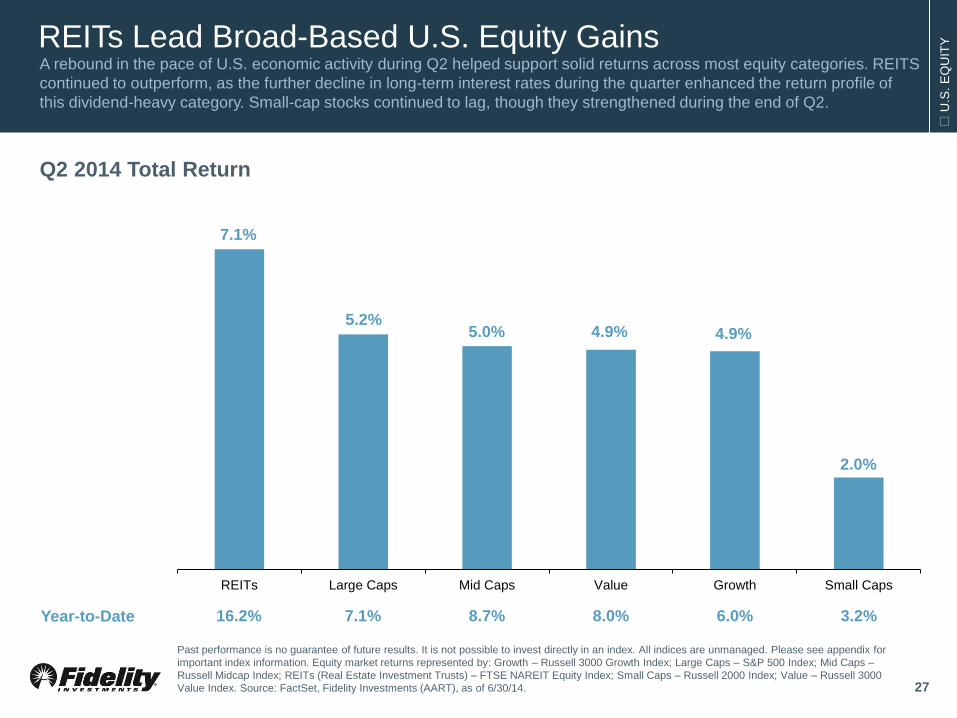
REITs Lead Broad-Based U.S. Equity Gains A rebound in the pace of U.S. economic activity during Q2 helped support solid returns across most equity categories. REITS
continued to outperform, as the further decline in long-term interest rates during the quarter enhanced the return profile of
this dividend-heavy category. Small-cap stocks continued to lag, though they strengthened during the end of Q2.
Q2 2014 Total Return
Year-to-Date 16.2% 7.1% 8.7% 8.0% 6.0% 3.2%
7.1%
5.2% 5.0% 4.9% 4.9%
2.0%
REITs Large Caps Mid Caps Value Growth Small Caps
Past performance is no guarantee of future results. It is not possible to invest directly in an index. All indices are unmanaged. Please see appendix for
important index information. Equity market returns represented by: Growth – Russell 3000 Growth Index; Large Caps – S&P 500 Index; Mid Caps –
Russell Midcap Index; REITs (Real Estate Investment Trusts) – FTSE NAREIT Equity Index; Small Caps – Russell 2000 Index; Value – Russell 3000
Value Index. Source: FactSet, Fidelity Investments (AART), as of 6/30/14. 27

U
.S. E
QU
ITY
Year-to-Date 13.0% 18.7% 8.9% 8.6% 5.2% 10.6% 4.0% 4.3% 0.6% 5.0% 7.1%
Energy Led Widespread Positive Performance across Sectors A rise in oil prices drove a strong outperformance by the energy sector during the second quarter, while most other sectors
posted returns near those of the broader market. Utilities outperformed for a second consecutive quarter as lower long-term
interest rates made dividends more attractive. Materials benefited from the 2014 rise in commodity prices.
Q2 2014 Total Return
12.1%
7.8%
6.5%
5.6%
4.7% 4.5% 3.9% 3.8% 3.5%
2.3%
5.2%
Energy Utilities Info Tech Materials ConsumerStaples
Health Care Industrials TelecomServices
ConsumerDiscretionary
Financials S&P 500
Past performance is no guarantee of future results. It is not possible to invest directly in an index. All indices are unmanaged. Please see appendix
for important index information. Sector investing involves risk. Because of its narrow focus, sector investing may be more volatile than investing in
more diversified baskets of securities. Sector returns represented by S&P 500 sectors. Source: FactSet, Fidelity Investments (AART), as of 6/30/14. 28

U
.S. E
QU
ITY
U.S. Business Cycle Backdrop Constructive for Tech Sector A disciplined business-cycle approach to sector allocation can produce active returns by favoring industries that may benefit
from cyclical trends. Revenue growth in the technology sector is poised to benefit from the greater number of companies
planning to increase capital expenditures on technology over the next 12 months.
Business Cycle Approach to Sectors
Past performance is no guarantee of future results. Sectors as defined by GICS. LEFT: Green portions suggest a historical pattern of
outperformance, red portions suggest underperformance, and unshaded portions indicate no clear pattern of out- or underperformance vs. the
broader market, as represented by the top 3,000 U.S. stocks by market capitalization. Analysis includes performance for 1962 to 2010. Source: The
Business Cycle Approach to Sector Investing, Fidelity Investments (AART), May 2012. RIGHT: Shaded area indicates a recession as defined by the
National Bureau of Economic Research. NABE Tech Capex Plans includes spending plans on computers and communications. Tech sector
companies are those within the information technology sector in the top 3,000 U.S. stocks by market capitalization. Source: National Association for
Business Economics Industry Survey, Haver Analytics, Fidelity Investments (AART), as of 6/30/14.
Business Tech Capital Expenditure Plans
vs. Tech Sector Revenues
29
-25%
-20%
-15%
-10%
-5%
0%
5%
10%
15%
20%
25%
0
10
20
30
40
50
60
70
80
20
03
20
04
20
05
20
06
20
07
20
08
20
09
20
10
20
11
20
12
20
13
20
14
NABE Tech Capex Plans Tech Sector Revenue Growth
% Respondents Increasing Tech Capex Plans Year-over-Year (%)

U
.S. E
QU
ITY
Valuations Above Long-Term Average, but Sustainable U.S. P/E ratios are slightly above their historical averages, but our long-term view is that stocks can sustain the current
valuation level on average over the next 20 years. This is due to our expectation of lower interest rates and equity volatility,
as well as the high exposure of the U.S. equity market to sectors that have consistently earned higher P/E multiples.
30
0% 10% 20% 30% 40% 50% 60% 70%
Japan
United States
France
Mexico
Germany
India
United Kingdom
Turkey
China
Spain
Brazil
Italy
Canada
Russia
Weight of High P/E Sectors in Equity
Markets
LEFT: Past performance is no guarantee of future results. It is not possible to invest directly in an index. All indices are unmanaged. Please see
appendix for important index information. Shaded areas indicate U.S. recessions as defined by the National Bureau of Economic Research. Source:
Standard & Poor’s, Robert Shiller, Haver Analytics, Fidelity Investments (AART), as of 6/30/14. RIGHT: High P/E sectors include: technology,
industrials, consumer goods, consumer services, and health care. Source: Thomson Reuters Datastream, Fidelity Investments (AART), as of 5/31/14.
17.5
0
500
1,000
1,500
2,000
2,500
10x
15x
20x
25x
30x
35x
40x
19
89
19
90
19
91
19
92
19
93
19
94
19
95
19
96
19
97
19
98
19
99
20
00
20
01
20
02
20
03
20
04
20
05
20
06
20
07
20
08
20
09
20
10
20
11
20
12
20
13
20
14
Price-to-Earnings (P/E) Average P/E Price Index
Average P/E since 1926 =
15.1
S&P 500 Price and Valuation
Price-to-Earnings Ratio S&P 500 Price Level High P/E Sector Share of Total Equity Market (%)

U
.S. E
QU
ITY
Corporate Profitability Still a Support for Stocks The slow but steady U.S. expansion provides a stable outlook for corporate revenues. Profit margins remain near historic
highs and show little indication of pressure: cyclical productivity continues to rise, input cost inflation is muted, and debt
service obligations are extremely low. Against this backdrop, mid-single-digit corporate profit growth appears achievable.
31
Cyclical productivity: a proprietary measure of U.S. cyclical corporate productivity. CPI: Consumer Price Index. PPI: Producer Price Index. See
appendix for important index information. Core inflation excludes food and energy prices. Source: Bureau of Labor Statistics, Haver Analytics, Fidelity
Investments (AART), through 6/24/14.
Earnings Mid-Single-Digit Growth
Revenue Stable, Slow Growth
Nominal GDP Growth Steady, low-single-digit growth
Profit Margins High and Steady
Cyclical Productivity Efficiency gains continue
Input Costs Input prices contained
relative to consumer prices
Debt Service Low interest expense,
debt maturities extended
-4%
-3%
-2%
-1%
0%
1%
2%
3%
4%
-20%
-15%
-10%
-5%
0%
5%
10%
15%
20%
19
99
20
00
20
01
20
02
20
03
20
04
20
05
20
06
20
07
20
08
20
09
20
10
20
11
20
12
20
13
20
14
Cyclical ProductivityConsumer Inflation minus Producer Inflation
Earnings & Cyclical Productivity
Core Consumer Inflation
minus Core Producer Inflation
Year-over-Year Change
in Cyclical Productivity (%)
Positive for Profit Margins
Negative for Profit Margins

U
.S. E
QU
ITY
Mixed Outlook for Small-Cap vs. Large-Cap Stocks Large-caps typically outperformed small-caps during mid-cycle expansions, and are currently less expensive relative to
history. However, small-caps maintain less exposure than large-caps to the increasingly uncertain outlook for the international
economy. It is unclear which of these dynamics will exert the greater influence on small-cap performance going forward.
0%
10%
20%
30%
40%
50%
60%
70%
Index Info Tech Materials Energy Industrials Cons.Staples
Cons. Disc. Health Care Financials Telecom Utilities
Large-Cap Small-Cap
Larg
e-C
ap
Sm
all
-Cap
Foreign Sales as a % of Total Sales Relative Performance during Business Cycle Phases
(Small-Cap minus Large-Cap)
1950–2014
Business Cycle
Phases
Median Relative
Performance
% of Time
Outperforming
Early 14.1% 100%
Mid -6.6% 44%
Late 0.6% 44%
Recession 3.6% 44%
Large-Cap & Small-Cap Valuations
Current P/E Average since
1979
Large Caps 17.2x 16.4x
Small Caps 22.0x 15.9x
Past performance is no guarantee of future results. It is not possible to invest directly in an index. All indices are unmanaged. Please see appendix for
important index information. CHART: Large-cap stocks – S&P 500 Index; small-cap stocks – S&P Small-Cap 600 Index; sectors as defined by GICS;
foreign sales data for 2013. TABLES: Large-cap stocks – S&P 500 Index; small cap stocks – IA SBBI U.S. Small Stock Index (1950 through 1978),
Russell 2000 (1979 to 2014). Source: FactSet, Fidelity Investments (AART), as of 6/30/14. 32

U
.S. E
QU
ITY
Environment Improving for Active Management Although still elevated relative to history, the correlation between equity returns continued to fall in Q2 while the number of
factors having a measurable impact on market returns (as determined by principal component analysis) has continued to rise.
Accordingly, there may be more opportunity for active management in U.S. stocks today than during the past several years.
33
0
2
4
6
8
10
12
14
16
18
20
0.00
0.05
0.10
0.15
0.20
0.25
0.30
0.35
0.40
0.45
0.50
Dec-9
1
Dec-9
2
Dec-9
3
Dec-9
4
Dec-9
5
De
c-9
6
Dec-9
7
Dec-9
8
De
c-9
9
Dec-0
0
Dec-0
1
Dec-0
2
Dec-0
3
Dec-0
4
Dec-0
5
Dec-0
6
Dec-0
7
Dec-0
8
Dec-0
9
Dec-1
0
Dec-1
1
Dec-1
2
Dec-1
3
Equity Correlations # Factors Explaining 50% of Return Variation
U.S. Equity Return Correlations and No. of Factors Driving Returns, 1991–2013
Average stock correlation calculated using trailing one year (52 weeks) of weekly returns. The number of factors explaining 50% of the return variation
is the result of a principal component analysis (PCA) for the universe of stocks (Russell 3000 Index plus S&P 500 Index constituents) over the trailing
one year using weekly returns. PCA: a linear method of statistical analysis that involves determining the combination of variables that produce a
diagonal covariance matrix or a set of uncorrelated factor returns. Past performance is no guarantee of future results. Please see appendix for
important index information. Source: FactSet, Fidelity Investments, as of 12/31/13.
# Factors Explaining 50% of Return Variation Correlations
Third Q
uart
er
2014
Q
UA
RT
ER
LY
MA
RK
ET
UP
DA
TE
International Equity Markets
& Global Assets

I
NT
ER
NA
TIO
NA
L
10.1%
6.7%
4.3% 3.7%
2.2%
7.3% 7.0% 6.7%
4.5%
1.8%
0.1%
Canada Japan EAFE Europe EAFESmall Cap
EM Asia LatinAmerica
EmergingMarkets
EMEA Gold Commodities
Stabilizing Global Conditions Buoy International Markets Equity markets outside the U.S. posted strong returns this quarter, led by Canada and bolstered by solid emerging-market
performance—in fact, EMs saw their best gains in six quarters. A weaker U.S. dollar helped boost results in all major
markets. Commodities were flat, with a steep drop in agricultural prices offsetting a rise in energy prices.
Q2 2014 Total Return
Q2 2014 LC 6.2% 4.9% 3.7% 3.4% 1.5% 5.6% 5.2% 5.2% 4.3% #N/A #N/A
Year-to-Date USD 12.0% 0.9% 5.1% 5.9% 5.8% 7.0% 7.4% 6.3% 2.8% 9.4% 7.1%
EM: emerging markets. LC: local currency. All returns are gross in U.S. dollars unless otherwise noted. Past performance is no guarantee of future
results. It is not possible to invest directly in an index. All indices are unmanaged. Please see appendix for important index information. Index returns
represented by: Canada – MSCI Canada Index; Commodities – S&P GSCI Commodities Index; EAFE – MSCI Europe, Australasia, Far East Index;
EAFE Small Cap – MSCI EAFE Small Cap Index; EM Asia – MSCI Emerging Markets Asia Index; EMEA (Europe, Middle East, and Africa) – MSCI
EM EMEA Index; Emerging Markets (EM) – MSCI EM Index; Europe – MSCI Europe Index; Gold – Gold Bullion Price, LBMA PM Fix; Japan – MSCI
Japan Index; Latin America – MSCI EM Latin America Index. Source: FactSet, Fidelity Investments (AART), as of 6/30/14.
Developed-Market Equities Emerging-Market Equities Commodities
35

I
NT
ER
NA
TIO
NA
L
Mixed Earnings Picture Outside U.S. Over the past year, non-U.S. corporate earnings have seen wide divergences: declines in EMs, very slow growth in Europe,
and a dramatic rebound in Japan. Market expectations are that stabilizing conditions in EMs and moderating growth in Japan
will produce a convergence in profits over the next year.
36
Japan 7.6%
Europe 9.9%
EM 9.5%
-40%
-30%
-20%
-10%
0%
10%
20%
30%
40%
50%
60%
Jun-1
1
Jul-1
1
Aug-1
1
Sep-1
1
Oct-
11
No
v-1
1
De
c-1
1
Jan-1
2
Feb
-12
Ma
r-1
2
Apr-
12
Ma
y-1
2
Jun-1
2
Jul-1
2
Aug-1
2
Sep-1
2
Oct-
12
No
v-1
2
De
c-1
2
Jan-1
3
Feb
-13
Ma
r-1
3
Apr-
13
Ma
y-1
3
Jun-1
3
Jul-1
3
Aug-1
3
Sep-1
3
Oct-
13
No
v-1
3
De
c-1
3
Jan-1
4
Feb
-14
Ma
r-1
4
Apr-
14
Ma
y-1
4
Japan Europe Emerging Markets
Global Earnings per Share Growth
Year-over-Year Trailing EPS Growth Rate
Please see appendix for important index information. EPS: earnings per share. Forward EPS growth uses estimates for the next twelve months for: EM
– MSCI EM Index; Europe – MSCI Europe Index; Japan – MSCI Japan Index. Source: FactSet, Fidelity Investments (AART), as of 5/31/14.
Forward EPS Growth

I
NT
ER
NA
TIO
NA
L
Emerging-Market Valuations Remain Compressed Non-U.S. equity valuations remain historically attractive, with EM equities far below their long-term averages. While EM
economies continue to experience headwinds, forward valuations are currently trading at a 35% discount to the U.S.—far
below the median discount—suggesting a favorable support to long-term returns.
37
-35%
-26%
-60%
-50%
-40%
-30%
-20%
-10%
0%
10%
19
96
19
97
19
98
19
99
20
00
20
01
20
02
20
03
20
04
20
05
20
06
20
07
20
08
20
09
20
10
20
11
20
12
20
13
20
14
EM Discount to US Valuations Median
Trailing 12-Month P/E Ratios
5
10
15
20
25
30
20
03
20
04
20
05
20
06
20
07
20
08
20
09
20
10
20
11
20
12
20
13
20
14
EM EM AverageEAFE EAFE Average
EM Forward P/E Discount to U.S.
P/E Ratio: share price divided by earnings. P/E ratios derived from: EM – MSCI Emerging Markets (EM) Index; EAFE – MSCI Europe, Australia, Far East
(EAFE) Index; U.S. – MSCI USA Index. LEFT: EM Average: 1988-2014. EAFE Average: 1973 to 2014. RIGHT: Forward P/E valuations are price divided
by next-twelve-months earnings estimates. BOTH: Source: FactSet, Fidelity Investments (AART), as of 5/31/14.

I
NT
ER
NA
TIO
NA
L
Secular Global Economic Growth Forecast Favors EMs We forecast slower global GDP growth of 2.1% annually over the next 20 years, versus a 2.7% average over the past 20
years. Developing economies will likely lead, underscoring the global nature of future investment opportunities. However,
poorer demographics and less catch-up potential in emerging Asia signify a slower outlook for this region.
38
0.0%
0.5%
1.0%
1.5%
2.0%
2.5%
3.0%
3.5%
4.0%
4.5%
5.0%
5.5%
Japa
n
Germ
any
Ita
ly
Ne
therl
and
s
Spain
Ca
nad
a
Fra
nce
Sw
ede
n
Austr
alia
U.K
.
U.S
.
Ru
ssia
South
Kore
a
Tha
iland
South
Afr
ica
Me
xic
o
Peru
Bra
zil
Ch
ina
Ma
laysia
Turk
ey
Co
lom
bia
Indon
esia
Phili
ppin
es
India
Global Growth Rate = 2.1%
Real GDP Growth Forecast, 2014 to 2033
Annualized Growth Rate
Countries in table sorted by per-capita income, from highest to lowest; Gray shading indicates working-age population growth will be slower over next 20
years, but maturing demographics should help to offset the negative impact on GDP growth. Source: Fidelity Investments (AART), as of 1/31/14.

I
NT
ER
NA
TIO
NA
L
Non-U.S. DM Equities: EM Exposure and Higher Yields Investors can access the positive, secular economic growth in EMs while retaining the benefits of developed-market equities,
such as greater liquidity and better corporate governance. Japanese and European equity markets have large exposures to
EMs. Also, dividend yields in non-U.S. markets are higher, and have risen above their long-term averages.
39
25%
29%
36%
45%
0% 10% 20% 30% 40% 50%
U.S.
DevelopedMarkets
Japan
Europe
0.0
0.5
1.0
1.5
2.0
2.5
3.0
3.5
4.0
4.5
US Japan EM World exUS
DM ex US Pacific exJapan
Current Avg. since 1995
Bond Yields
G7 1.7%
EM 5.3%
Share of Equity Market with Significant
EM Exposure
Global Dividend Yields
Dividend Yield (%)
EM: Emerging Markets; DM: Developed Markets. Past performance and dividend yields are historical and do not guarantee future results. It is not
possible to invest directly in an index. All indices are unmanaged. Please see appendix for important index information. Country/regions represented
by: U.S. – MSCI USA Index; Japan – MSCI Japan Index; DM – MSCI World Index; Europe – MSCI Europe Index; EM – MSCI Emerging Markets
Index; DM ex U.S. – MSCI World Index; World ex U.S. – MSCI AC World Index; Pacific ex Japan – MSCI Pacific ex Japan. Bond yields represented
by: G7 – Citigroup Group-of-Seven Bond Index; EM – JP Morgan EMBI Global Index. LEFT: Significant EM exposure as defined by MSCI Economic
Exposure indices. Companies with >25% of revenues from EM regions are considered significantly exposed. Source: MSCI, FactSet, Fidelity
Investments (AART), as of 5/31/14. RIGHT: Source: FactSet, Fidelity Investments (AART), as of 5/31/14.

Third Q
uart
er
2014
Q
UA
RT
ER
LY
MA
RK
ET
UP
DA
TE
Fixed Income Markets

F
IXE
D I
NC
OM
E
Broad Gains as Rates Fell and Spreads Narrowed All fixed-income sectors continued to post positive returns during Q2. Longer-duration categories led, supported by falling
longer-term interest rates. Spread compression also drove incremental performance across all credit categories. Emerging-
market debt continued to benefit from both of these trends, following negative returns in 2013.
Q2 2014 Total Return
Year-to-Date 9.1% 11.8% 5.8% 5.7% 6.0% 5.6% 4.1% 2.9% 2.6% 2.7% 2.2% 1.3% 3.9%
5.4%
4.9%
3.8%
2.7% 2.6% 2.6% 2.4%
1.5% 1.4% 1.4% 1.2% 0.8%
2.0%
EM
De
bt
Lo
ng G
ovt
& C
redit
TIP
S
Cre
dit
Mu
nic
ipal
Hig
h Y
ield
MB
S
CM
BS
Le
ve
raged
Lo
an
Tre
asuri
es
Agen
cy
AB
S
Aggre
gate
Past performance is no guarantee of future results. It is not possible to invest directly in an index. All indices are unmanaged. Index returns
represented by: ABS (Asset-Backed Securities) – Barclays ABS Index; Agency – Barclays U.S. Agency Index; Aggregate – Barclays U.S. Aggregate
Bond Index; CMBS (Commercial Mortgage-Backed Securities) – Barclays Investment-Grade CMBS Index; Credit – Barclays U.S. Credit Bond Index;
EM Debt (Emerging-Market Debt) – JP Morgan EMBI Global Index; High Yield – BofA ML U.S. High Yield Index; Leveraged Loan – S&P/LSTA
Leveraged Loan Index; Long Government & Credit (Investment-Grade) – Barclays Long Government & Credit Index; MBS (Mortgage-Backed
Securities) – Barclays MBS Index; Municipal – Barclays Municipal Bond Index; TIPS (Treasury Inflation-Protected Securities) – Barclays U.S. TIPS
Index; Treasuries – Barclays U.S. Treasury Index. Source: FactSet, Fidelity Investments (AART), as of 6/30/14. 41

F
IXE
D I
NC
OM
E
10 11 7 6
1 5
3 6
26 25
14 17
0
10
20
30
40
50
60
70
80
90
100
0
1
2
3
4
5
6
U.S. AggregateBond
MBS CMBS CorporateInvestment Grade
CorporateHigh Yield
Emerging-MarketDebt
Bond Yields Still Low, Credit Spreads Narrowed Yields and credit spreads of all fixed-income categories fell further below their long-term historical averages during the
second quarter, nearing cyclical lows. Most bond categories benefited from robust investor demand and still-improving credit
fundamentals.
Past performance is no guarantee of future results. It is not possible to invest directly in an index. All indices are unmanaged. Please see appendix
for important index information. Percentile ranks of yields and spreads based on historical period from 2000 to 2014. MBS: Mortgage-Backed
Security; CMBS: Commercial Mortgage-Backed Security. All categories represented by respective Barclays bond indices. Source: Barclays, Fidelity
Investments (AART), as of 6/30/14.
Fixed Income Yields and Spreads
Yield (%) Yield and Spread Percentiles (%)
Credit Spread Treasury Rates Spread Percentile Yield Percentile
42

F
IXE
D I
NC
OM
E
0
50
100
150
200
250
300
350
400
450
500
2006 2007 2008 2009 2010 2011 2012 2013 2014*
New Project Financing Refinancing Total Reinvestment Demand
43
Technical Factors Support Municipal Bonds Despite several negative credit developments, municipal fundamentals generally continue to steadily improve alongside the
broader U.S. economic expansion. Market technicals remain strong amid declining new issuance and steady demand from
the reinvestment of coupons and other proceeds.
Municipal Bond Issuance vs. Reinvestment Demand
Billions ($)
*New Project Financing and Refinancing forecasted through year-end with data through 4/30/14 and assuming a 2013 growth rate through year-end.
Reinvestment Demand forecasted by JPMorgan Research. Refinancing includes issues that are in part used to refinance debt as well as new projects.
Total Reinvestment Demand includes proceeds from existing municipal investments, including coupons, maturities, and refundings; demand data
courtesy of JPMorgan Research, copyright 2014. Source: Thomson Reuters, JPMorgan Research, Fidelity Investments (AART), as of 4/30/14.
Supply Exceeds
Reinvestment
Demand
Reinvestment
Demand Near
Supply

F
IXE
D I
NC
OM
E
Past performance is no guarantee of future results. Roll refers to the yield of a bond moving along the yield curve as it approaches its maturity
date and the influence this has on the bond’s price, assuming an unchanged yield curve. Yield refers to the current yield-to-maturity of each bond
on the yield curve. Implied Annualized Return assumes yield curve slope remains unchanged and coupons are reinvested at current market rates.
Source: Bloomberg Finance L.P., Fidelity Investments (AART), as of 6/30/14.
Short Duration: Roll May Boost Duration-Adjusted Returns With cash yields near zero, short-duration fixed-income strategies may provide a better opportunity to outpace inflation
without significant interest-rate risk. The yield curve is currently steepest in the two- to five-year range, potentially offering
incremental roll returns and the best risk-adjusted return opportunities on the yield curve.
0.5% 0.9%
1.6%
2.1% 2.5%
0.7%
1.2%
1.8%
1.6% 1.1%
-
0.1
0.2
0.3
0.4
0.5
0.6
0.7
0.8
0.9
0.0%
0.5%
1.0%
1.5%
2.0%
2.5%
3.0%
3.5%
4.0%
1 year 2 year 3 year 5 year 7 year 10 year
Yield Roll return Duration-Adjusted Return
Maturity
Implied Annualized Return (%) Implied Annualized Return / Duration
Return Potential of U.S. Treasuries
Highest Duration-Adjusted Return
44

F
IXE
D I
NC
OM
E
Past performance is no guarantee of future results. Spread returns: returns of the Bank of America Merrill Lynch (BofA ML) High-Yield Bond Index
attributable to changes in credit spreads. Rate returns: returns of the BofA ML High-Yield Bond Index attributable to changes in interest rates.
Source: BofA ML, Fidelity Investments (AART), as of 5/31/2014. 45
Typical Mid-Cycle Pattern for High Yield High-yield debt typically benefits from economic expansion as credit spread tightening helps to offset a rise in interest rates.
In the past, this negative correlation between rates and spreads has temporarily broken down following unexpected Fed
policy announcements, implying a risk of higher volatility in the event of a surprise move to a tighter monetary posture.
-3
-2
-1
0
1
2
3
Jan-1
2
Feb
-12
Ma
r-1
2
Apr-
12
Ma
y-1
2
Jun-1
2
Jul-1
2
Aug-1
2
Sep-1
2
Oct-
12
No
v-1
2
De
c-1
2
Jan-1
3
Feb
-13
Ma
r-1
3
Apr-
13
Ma
y-1
3
Jun-1
3
Jul-1
3
Aug-1
3
Sep-1
3
Oct-
13
No
v-1
3
De
c-1
3
Jan-1
4
Feb
-14
Ma
r-1
4
Apr-
14
Ma
y-1
4
Spread Return Rate Return
Monthly Returns (%)
Fed Taper Scare
Return to
Normal Pattern
High Yield Return Components: Spreads vs. Rates

F
IXE
D I
NC
OM
E
0
1
2
3
4
5
6
7
8
0 2 4 6 8 10 12 14 16
Allocating to Fixed Income: A Multisector Approach With yields on high-quality U.S. bonds near historic lows, diversifying across a broad spectrum of fixed-income sectors may
significantly improve a portfolio’s Sharpe ratio, or risk-adjusted return. Investing in a variety of sectors may also provide
opportunities to diversify across risk characteristics, which could enhance inflation resistance or geographic variation.
46
Portfolio Description
#1
High-quality portfolio with limited risk
80% U.S. Investment Grade
5% U.S. High Yield
5% U.S. Real Estate Debt
5% Leveraged Loans
5% Emerging Market
Portfolio Description
#2
Mix of high yield, government, and foreign
40% U.S. High Yield
30% U.S. Government
15% Foreign Developed
15% Emerging Market
Yield to Maturity (%)
Efficient Frontier Using Yield to Maturity, 1998–2013
Efficient frontier represents optimal risk-return combinations of seven assets. Yield to maturity: rate of return for investor who holds bond to maturity.
Volatility is represented by standard deviation. Please see appendix for important definitions and index information. Past performance is no guarantee
of future results. Diversification does not ensure a profit or guarantee against loss. It is not possible to invest directly in an index. Index returns
represented by: Emerging Market Debt – JPM EMBI Global Composite Index; Foreign Developed-Country Bonds – Citigroup G-7 Non-USD Bond
Index; Leveraged Loans – S&P/LSTA Performing Loan Index; Real Estate Debt – 50% Barclays CMBS Index and 50% BofA ML Corporate Real Estate
Index; U.S. Government – Barclays U.S. Government Index; U.S. High Yield – BofA ML High Yield Index; U.S. Investment Grade – Barclays U.S.
Aggregate Bond Index. Source: FactSet, Bloomberg Finance L.P., Morningstar EnCorr, Fidelity Investments (AART), as of 12/31/2013.
Portfolio Sharpe
Ratio
#1 0.67
#2 0.65
U.S. Investment Grade 0.46
U.S. High Yield
Foreign Developed-Country Bonds
Emerging-Market Debt
#2
Real Estate Debt #1
U.S. Investment Grade U.S. Government
Leveraged Loans
Volatility of Returns (%)
Third Q
uart
er
2014
Q
UA
RT
ER
LY
MA
RK
ET
UP
DA
TE
Asset Allocation Themes

A
SS
ET
ALLO
CA
TIO
N
Real Return: Managing Inflation Risk Still Matters Investments with hard-asset or income-adjusting characteristics have historically offered inflation resistance, particularly
when investors needed it most—as inflation increased. Combining assets into a diversified real-return composite has
increased the frequency of outpacing inflation as it rises, a difficult task for cash in today’s low-rate environment.
Frequency of Outperforming Inflation, 1998–2014
0%
10%
20%
30%
40%
50%
60%
70%
80%
90%
100%
CompositePortfolio
Commodities TIPS Leveraged Loans Real EstateStocks
Real EstateBonds
Cash
Outperformed during Rising Inflation Outperformed during Falling Inflation
Overall
Rate of
Outperformance 80% 62% 84% 84% 71% 74% 48%
% of Periods Outperforming Inflation Rate
Past performance is no guarantee of future results. Diversification does not ensure a profit or guarantee against loss. It is not possible to invest
directly in an index. Please see appendix for important index information. Inflation rate: year-over-year change in the consumer price index. Asset
classes represented by: Cash – IA SBBI U.S. 30 Day Treasury Bill Index; Commodities – Dow Jones-UBS Commodity Index; Composite portfolio –
30% TIPS, 25% leveraged loans, 25% commodities, 10% real estate equity, 10% real estate income; Leveraged Loans – S&P/LSTA Leveraged
Performing Loan Index; Real Estate Bonds – BofA ML U.S. Corporate Real Estate Index; Real Estate Stocks – Dow Jones U.S. Select Real Estate
Securities Index; TIPS (Treasury Inflation Protected Securities) – Barclays U.S. TIPS Index. Source: Morningstar EnCorr, Fidelity Investments
(AART), as of 6/30/14. 48

A
SS
ET
ALLO
CA
TIO
N
Myopic Loss Aversion Prompts Risk-Averse Behavior Myopic loss aversion describes a common bias in which greater sensitivity to losses than to gains is compounded by the
frequent evaluation of outcomes. Investors who review their portfolios more frequently have tended to shift toward more
conservative exposures, as increased monitoring raises the likelihood of seeing (and reacting to) a loss.
49
Impact of Feedback Frequency on Investment Decisions
Monthly Yearly
Stocks 41%
Bonds 59%
Stocks 70%
Bonds 30%
In the study, subjects were assigned simulated conditions that were similar to making portfolio decisions on a monthly or yearly basis. Source: Thaler,
R. H., A. Tversky, D. Kahneman, and A. Schwartz. “The Effect of Myopia and Loss Aversion on Risk Taking: An Experimental Test.” The Quarterly
Journal of Economics 112.2 (1997), Fidelity Investments (AART), as of 6/30/14.

A
SS
ET
ALLO
CA
TIO
N
High-Quality Bonds Provide Diversification Benefits Bond correlations with stocks remain negative on a rolling 24-month basis, suggesting that bonds continue to provide
important portfolio diversification benefits, especially when equity volatility rises. Equity-to-bond correlations have historically
tended to be lower during times of subdued and stable inflation, which is consistent with our long-term outlook.
50
-1
-0.8
-0.6
-0.4
-0.2
0
0.2
0.4
0.6
0.8
1
19
28
19
30
19
32
19
34
19
36
19
38
19
40
19
42
19
44
19
46
19
48
19
50
19
52
19
54
19
56
19
58
19
60
19
62
19
64
19
66
19
68
19
70
19
72
19
74
19
76
19
78
19
80
19
82
19
84
19
86
19
88
19
90
19
92
19
94
19
96
19
98
20
00
20
02
20
04
20
06
20
08
20
10
20
12
20
14
Rolling 24-Month Stocks and Intermediate U.S. Treasury Bonds Correlation
Stocks and Bonds Performance Correlations
Past performance is no guarantee of future results. Stocks represented by the S&P 500 Index. Intermediate U.S. Treasury bonds represented by the
IA SBBI Intermediate-Term U.S. Treasury Bond Index. Source: Morningstar EnCorr, Fidelity Investments (AART), as of 6/30/14.
Correlation Coefficient

A
SS
ET
ALLO
CA
TIO
N
International Equities: The Case for Diversification A portfolio consisting of 70% U.S. and 30% international equities has provided higher returns, lower volatility, and better risk-
adjusted returns than the S&P 500 over the long run. Correlations between U.S. and international equities have trended back
down toward pre-recession levels, signaling increased benefits from diversification in a global portfolio.
51
Past performance is no guarantee of future results. It is not possible to invest directly in an index. All indices are unmanaged. Please see appendix for
important index information. CHART: International Equities – MSCI World ex-U.S.; U.S. Equities – S&P 500. Through 6/30/2014. TABLE: Hypothetical
“globally balanced portfolio” is rebalanced monthly in 70% U.S. equities, 25% developed-market (DM) equities, and 5% emerging-market (EM) equities.
U.S. equities – S&P 500 Total Return Index; DM equities – MSCI EAFE Index (1978-2013), Ibbotson (1970-1977), Global Financial Data (GFD) World
x/USA Return Index (1950-1969); EM equities – MSCI EM Index (1988-2013), GFD Emerging Markets Index (1950-1987). BOTH: Source: FactSet,
GFD, Ibbotson, Fidelity Investments (AART), as of 6/30/14.
1950 to 2013 S&P 500 International
Portfolio
Globally Balanced Portfolio
70% U.S. / 30% Intl
Annualized Returns 11.3% 11.1% 11.4%
Standard Deviation 14.5% 14.6% 13.2%
Sharpe Ratio 0.46 0.44 0.52
Correlations: International and U.S. Equities
0.2
0.3
0.4
0.5
0.6
0.7
0.8
Jun-0
6
De
c-0
6
Jun-0
7
De
c-0
7
Jun-0
8
De
c-0
8
Jun-0
9
De
c-0
9
Jun-1
0
De
c-1
0
Jun-1
1
De
c-1
1
Jun-1
2
De
c-1
2
Jun-1
3
De
c-1
3
Jun-1
4
Six-Month Rolling Correlations of Daily Returns

A
SS
ET
ALLO
CA
TIO
N
Performance Rotations Underscore Need for Diversification The performance of different assets has fluctuated widely from year to year, and the magnitude of returns can vary
significantly among asset classes in any given year—even among asset classes that are moving in the same direction.
A simple portfolio allocation with 60% in U.S. equities and 40% in U.S. bonds illustrates the potential benefits of diversification.
Periodic Table of Returns
*Through 6/30/14. Past performance is no guarantee of future results. Diversification/asset allocation does not ensure a profit or guarantee against loss.
It is not possible to invest directly in an index. All indices are unmanaged. Please see appendix for important index information. Asset classes
represented by: Commodities – DJ-UBS Commodity Index; Emerging-Market – MSCI Emerging Markets Index; Foreign-Developed Country – MSCI
EAFE Index; Growth – Russell 3000 Growth Index; High Yield – Bank of America Merrill Lynch U.S. High Yield Index; Investment-Grade – Barclays U.S.
Aggregate Bond Index; Large Cap – S&P 500 Index; Real Estate – FTSE NAREIT Equity Index; Small Cap – Russell 2000 Index; Value – Russell 3000
Value Index. Source: Ibbotson Associates, Standard & Poor’s, Haver Analytics, Fidelity Investments (AART), as of 6/30/14. 52
1992 1993 1994 1995 1996 1997 1998 1999 2000 2001 2002 2003 2004 2005 2006 2007 2008 2009 2010 2011 2012 2013 2014* Legend
18% 75% 17% 38% 35% 35% 35% 66% 32% 14% 26% 56% 32% 35% 35% 40% 5% 79% 28% 8% 20% 39% 16% Real Estate Stocks
17% 33% 8% 37% 23% 33% 29% 34% 26% 8% 10% 47% 26% 21% 33% 16% -20% 58% 27% 8% 19% 34% 8% Value Stocks
15% 20% 3% 37% 23% 29% 21% 27% 12% 5% 4% 39% 21% 14% 27% 12% -26% 37% 19% 4% 18% 33% 7% Large Cap Stocks
15% 19% 2% 30% 22% 24% 20% 24% 8% 2% -2% 37% 18% 12% 22% 11% -34% 32% 18% 4% 18% 32% 7% Commodities
11% 19% 1% 28% 22% 22% 14% 21% -1% -2% -6% 31% 17% 7% 18% 7% -36% 28% 17% 2% 16% 23% 6%Emerging-Market
Stocks
8% 17% 0% 20% 16% 20% 9% 21% -3% -4% -9% 31% 11% 5% 16% 6% -36% 27% 16% 2% 16% 19% 6% Growth Stocks
8% 10% -1% 18% 15% 13% 3% 12% -5% -4% -15% 29% 11% 5% 12% 5% -37% 26% 15% 0% 16% 7% 6%60% Large Cap
40% IG Bonds
7% 10% -2% 15% 11% 10% -3% 7% -9% -12% -16% 28% 9% 5% 11% 2% -38% 20% 15% -4% 15% 3% 6% High-Yield Bonds
5% 10% -2% 15% 6% 2% -18% 3% -14% -20% -20% 24% 8% 4% 9% -1% -38% 19% 12% -12% 11% -2% 5%Foreign-Developed
Country Stocks
4% 4% -3% 12% 6% -3% -25% -1% -22% -20% -22% 19% 7% 3% 4% -2% -43% 18% 8% -13% 4% -2% 4%Investment-Grade
Bonds
-12% -1% -7% -5% 4% -12% -27% -5% -31% -21% -28% 4% 4% 2% 2% -16% -53% 6% 7% -18% -1% -10% 3% Small Cap Stocks

Appendix: Important Information
Views expressed are as of the date indicated, based on the information available at that
time, and may change based on market and other conditions. Unless otherwise noted, the
opinions provided are those of the authors and not necessarily those of Fidelity
Investments or its affiliates. Fidelity does not assume any duty to update any of the
information.
Investment decisions should be based on an individual’s own goals, time horizon, and
tolerance for risk.
These materials are provided for informational purposes only and should not be used or
construed as a recommendation of any security, sector, or investment strategy.
Fidelity does not provide legal or tax advice and the information provided herein is general
in nature and should not be considered legal or tax advice. Consult with an attorney or a
tax professional regarding your specific legal or tax situation.
Past performance and dividend rates are historical and do not guarantee future
results.
Investing involves risk, including risk of loss.
Diversification does not ensure a profit or guarantee against loss.
All indices are unmanaged, and performance of the indices includes reinvestment of
dividends and interest income and, unless otherwise noted, is not illustrative of any
particular investment. An investment cannot be made in any index.
Although bonds generally present less short-term risk and volatility than stocks, bonds do
contain interest rate risk (as interest rates rise, bond prices usually fall, and vice versa)
and the risk of default, or the risk that an issuer will be unable to make income or principal
payments. Additionally, bonds and short-term investments entail greater inflation risk—or
the risk that the return of an investment will not keep up with increases in the prices of
goods and services—than stocks. Increases in real interest rates can cause the price of
inflation-protected debt securities to decrease.
Stock markets, especially non-U.S. markets, are volatile and can decline significantly in
response to adverse issuer, political, regulatory, market, or economic developments.
Foreign securities are subject to interest rate, currency exchange rate, economic, and
political risks, all of which are magnified in emerging markets.
The securities of smaller, less well-known companies can be more volatile than those of
larger companies.
Growth stocks can perform differently from the market as a whole and from other types of
stocks, and can be more volatile than other types of stocks. Value stocks can perform
differently from other types of stocks and can continue to be undervalued by the market for
long periods of time.
Lower-quality debt securities generally offer higher yields but also involve greater risk of
default or price changes due to potential changes in the credit quality of the issuer. Any
fixed income security sold or redeemed prior to maturity may be subject to loss.
Floating-rate loans generally are subject to restrictions on resale, and sometimes trade
infrequently in the secondary market; as a result, they may be more difficult to value, buy,
or sell. A floating-rate loan may not be fully collateralized and therefore may decline
significantly in value.
The municipal market can be affected by adverse tax, legislative, or political changes, and
by the financial condition of the issuers of municipal securities. Interest income generated
by municipal bonds is generally expected to be exempt from federal income taxes and, if
the bonds are held by an investor resident in the state of issuance, from state and local
income taxes. Such interest income may be subject to federal and/or state alternative
minimum taxes. Investing in municipal bonds for the purpose of generating tax-exempt
income may not be appropriate for investors in all tax brackets. Generally, tax-exempt
municipal securities are not appropriate holdings for tax-advantaged accounts such as
IRAs and 401(k)s.
The commodities industry can be significantly affected by commodity prices, world events,
import controls, worldwide competition, government regulations, and economic conditions.
The gold industry can be significantly affected by international monetary and political
developments, such as currency devaluations or revaluations, central bank movements,
economic and social conditions within a country, trade imbalances, or trade or currency
restrictions between countries.
Changes in real estate values or economic downturns can have a significant negative
effect on issuers in the real estate industry.
Leverage can magnify the impact that adverse issuer, political, regulatory, market, or
economic developments have on a company. In the event of bankruptcy, a company’s
creditors take precedence over the company’s stockholders.
53

Appendix: Important Information
54
Market Indices
Bank of America Merrill Lynch (BofA ML) All U.S. Convertibles Index is an
unmanaged index that tracks the performance of all U.S. convertible securities. BofA ML
Corporate Real Estate Index, a subset of BofA ML U.S. Corporate Index, is a market
capitalization-weighted index of U.S. dollar-denominated investment-grade corporate debt
publicly issued in the U.S. domestic market by real estate issuers. Qualifying securities
must have an investment-grade rating (based on an average of Moody’s, S&P, and Fitch).
In addition, qualifying securities must have at least one year remaining to final maturity, a
fixed coupon schedule, and a minimum amount outstanding of $250 million. BofA ML
High Yield Bond Index is an unmanaged index that tracks the performance of below-
investment-grade, U.S. dollar-denominated corporate bonds publicly issued in the U.S.
domestic market. BofA ML U.S. High Yield BB-B Rated 1-5 Year Index includes fixed
income securities with a remaining term to final maturity less than 5 years and rated BB1
through B3 by Moody’s. BofA ML U.S. Fixed Rate Preferred Securities Index is an
unmanaged index that tracks the performance of fixed-rate preferred securities publicly
issued in the U.S. domestic market.
Barclays U.S. 1-3 (1-5) Year Government Credit Index includes all publicly issued U.S.
government and corporate securities that have a remaining maturity between one and
three (five) years and are rated investment grade. Barclays U.S. 1-5 Year Credit Index is
designed to cover publicly issued U.S. corporate and specified non-U.S. debentures and
secured notes with a maturity between one and five years and meet the specified liquidity
and quality requirements; bonds must be SEC-registered to qualify. Barclays U.S. 1-5
Year Municipal Index covers the one- to five-year maturity, U.S. dollar-denominated, tax-
exempt bond market with four main sectors: state and local general obligation bonds,
revenue bonds, insured bonds, and pre-refunded bonds.
Barclays ABS Index is a market value-weighted index that covers fixed-rate asset-backed
securities with average lives greater than or equal to one year and that are part of a public
deal; the index covers the following collateral types: credit cards, autos, home equity loans,
stranded-cost utility (rate-reduction bonds), and manufactured housing. Barclays CMBS
Index is designed to mirror commercial mortgage-backed securities of investment-grade
quality (Baa3/BBB-/BBB- or above) using Moody’s, S&P, and Fitch, respectively, with
maturities of at least one year. Barclays Emerging Market Bond Index is an unmanaged
index that tracks total returns for external-currency-denominated debt instruments of the
emerging markets. Barclays Long U.S. Government Credit Index includes all publicly
issued U.S. government and corporate securities that have a remaining maturity of 10 or
more years, are rated investment grade, and have $250 million or more of outstanding
face value. Barclays U.S. MBS Index is a market value-weighted index of fixed-rate
securities that represent interests in pools of mortgage loans, including balloon mortgages,
with original terms of 15 and 30 years that are issued by the Government National
Mortgage Association (GNMA), the Federal National Mortgage Association (FNMA), and
the Federal Home Loan Mortgage Corp. (FHLMC). Barclays U.S. Agency Bond Index is
a market value-weighted index of U.S. Agency government and investment-grade
corporate fixed-rate debt issues. Barclays U.S. Aggregate Bond is a broad-based,
market-value-weighted benchmark that measures the performance of the investment
grade, U.S. dollar-denominated, fixed-rate taxable bond market. Barclays U.S. Corporate
High Yield Bond Index is a market value-weighted index that covers the universe of
dollar-denominated, fixed-rate, non-investment grade debt. Barclays U.S. Credit Bond
Index is a market value-weighted index of investment-grade corporate fixed-rate debt
issues with maturities of one year or more. Barclays U.S. Government Index is a market
value-weighted index of U.S. government fixed-rate debt issues with maturities of one year
or more. Barclays Municipal Bond Index is a market value-weighted index of investment-
grade municipal bonds with maturities of one year or more. Barclays U.S. Treasury
Inflation-Protected Securities (TIPS) Index (Series-L) is a market value-weighted index
that measures the performance of inflation-protected securities issued by the U.S.
Treasury. Barclays U.S. Treasury Bond Index is a market value-weighted index of public
obligations of the U.S. Treasury with maturities of one year or more.
The Citigroup 3-Month Treasury Bill Index is an unmanaged index of three-month
Treasury bills.
CAC 40® Index is a free float-adjusted market capitalization-weighted price index of 40
companies listed on the Euronext Paris exchange selected to be representative of the
broader market.
DAX is Deutscher Aktienindex 100, a market capitalization–weighted index of the 100
most heavily traded stocks in the German market.
Dow Jones-UBS Commodity Index measures the performance of the commodities
market. It consists of exchange-traded futures contracts on physical commodities that are
weighted to account for the economic significance and market liquidity of each commodity.
Dow Jones U.S. Select Real Estate Securities Index is a float-adjusted, market
capitalization-weighted index of publicly traded real estate securities, such as real estate
investment trusts (REITs) and real estate operating companies (REOCs).
The Euro Stoxx 50® Index is a market capitalization-weighted stock index of 50 large,
blue-chip companies operating within eurozone nations.
FTSE 100 Index is a market capitalization-weighted index of the 100 most highly
capitalized blue chip companies listed on the London Stock Exchange. FTSE National
Association of Real Estate Investment Trusts (NAREIT) All REITs Index is a market
capitalization-weighted index that is designed to measure the performance of all tax-
qualified REITs listed on the NYSE, the American Stock Exchange, or the NASDAQ
National Market List. FTSE NAREIT Equity REIT Index is an unmanaged market value-
weighted index based on the last closing price of the month for tax-qualified REITs listed
on the New York Stock Exchange (NYSE).

Market Indices (continued)
The IA SBBI U.S. Small Stock Index is a custom index designed to measure the
performance of small-capitalization U.S. stocks. IA SBBI U.S. Intermediate-Term
Government Bond Index is an unweighted index that measures the performance of five-
year maturity U.S. Treasury bonds. Each year, a one-bond portfolio containing the shortest
non-callable bond having a maturity of not less than five years is constructed. IA SBBI
U.S. Long-Term Corporate Bond Index is a custom index designed to measure the
performance of long-term U.S. corporate bonds. IA SBBI U.S. 30-Day Treasury Bill Index
is an unweighted index that measures the performance of 30-day maturity U.S. Treasury
bills.
JNK Exchange Traded Fund is the SPDR® Barclays High Yield Bond ETF, which seeks
to provide investment results that track the price and yield performance of the Barclays
High Yield Very Liquid Index, which includes high-yield corporate bonds with above-
average liquidity that are denominated in U.S. dollars.
JPM® EMBI Global Index, and its country sub-indices, tracks total returns for traded
external debt instruments issued by emerging-market sovereign and quasi-sovereign
entities. JPM® EMBI Global Investment Grade Index, and its country sub-indices, tracks
total returns for traded external debt instruments issued by emerging-market sovereign
and quasi-sovereign entities rated investment grade. JPM® EMBI Global Investment
Grade Index, and its country sub-indices, tracks total returns for traded external debt
instruments issued by emerging-market sovereign and quasi-sovereign entities rated
speculative grade.
MOVE is the Merrill Option Volatility Estimate, is a registered service mark of Merrill
Lynch; it is a yield curve-weighted index of the normalized implied volatility on one-month
Treasury options.
MSCI® All Country (AC) Europe Index is a market capitalization-weighted index that is
designed to measure the equity market performance of Europe; it consists of the following
developed and emerging-market country indices: Austria, Belgium, Czech Republic,
Denmark, Finland, France, Germany, Greece, Hungary, Ireland, Italy, Netherlands,
Norway, Poland, Portugal, Russia, Spain, Sweden, Switzerland, Turkey, and United
Kingdom. MSCI All Country World Index (ACWI) is a market capitalization-weighted
index that is designed to measure the investable equity market performance for global
investors of developed and emerging markets. MSCI Europe Index is a market
capitalization-weighted index that is designed to measure the investable equity market
performance for global investors of the developed markets in Europe. MSCI North
America Index is a market capitalization-weighted index designed to measure the
performance of large and mid cap segments of the U.S. and Canada markets. MSCI
Pacific ex Japan Index is a market capitalization-weighted index that is designed to
measure the equity market performance of four of the five developed market countries in
the Pacific region including Australia, Hong Kong, New Zealand, and Singapore.
MSCI World Index is a market capitalization weighted index that is designed to measure
the investable equity market performance for global investors of developed markets. MSCI
World ex USA Index is a market capitalization-weighted index designed to measure the
equity market performance of developed markets excluding the U.S.
MSCI Emerging Markets (EM) Index is a market capitalization-weighted index that is
designed to measure the investable equity market performance for global investors in
emerging markets. MSCI EM Asia Index is a market capitalization-weighted index
designed to measure equity market performance in Asia. MSCI EM Europe, Middle East,
and Africa (EMEA) Index is a market capitalization-weighted index that is designed to
measure the investable equity market performance for global investors in the emerging
market countries of Europe, the Middle East , and Africa. MSCI EM Latin America Index
is a market capitalization-weighted index that is designed to measure the investable equity
market performance for global investors in the emerging market countries of Latin
America. MSCI EM Large Cap Index is composed of those securities in the MSCI EM
Index that are defined as large-capitalization stocks.
MSCI Europe, Australasia, Far East Index (EAFE) is a market capitalization-weighted
index that is designed to measure the investable equity market performance for global
investors in developed markets, excluding the U.S. and Canada. MSCI EAFE Small Cap
Index is a market capitalization-weighted index that is designed to measure the investable
equity market performance of small cap stocks for global investors in developed markets,
excluding the U.S. and Canada.
MSCI Canada Index is a market capitalization-weighted index designed to measure equity
market performance in Canada. MSCI China Index is a market capitalization-weighted
index designed to measure equity market performance in China. MSCI Japan Index is a
market capitalization-weighted index designed to measure equity market performance in
Japan. MSCI USA Index is a market capitalization-weighted index designed to measure
the equity market performance of the U.S.
MSCI USA High Dividend Index is an unmanaged index that tracks the performance of
U.S. high-dividend-yield equities; it consists of those securities in the MSCI USA Index that
have a higher-than-average dividend yield, a track record of consistent dividend payments,
and the capacity to sustain future dividend payments.
MSCI Economic Exposure Indices are designed to reflect the performance of companies
with significant exposure to target regions or countries, regardless of their domicile.
Nikkei 225® Index is a market capitalization-weighted index of the 225 leading stocks traded
on the Tokyo Stock Exchange.
Appendix: Important Information
55

Market Indices (continued)
Russell 2000® Index is a market capitalization-weighted index designed to measure the
performance of the small-cap segment of the U.S. equity market. It includes approximately
2,000 of the smallest securities in the Russell 3000 Index. Russell 3000® Index is a market
capitalization-weighted index designed to measure the performance of the 3,000 largest
companies in the U.S. equity market. Russell 3000 Growth Index is a market capitalization-
weighted index designed to measure the performance of the broad growth segment of the
U.S. equity market. It includes those Russell 3000 Index companies with higher price-to-book
ratios and higher forecasted growth rates. Russell 3000 Value Index Russell 2500 Value
Index is a market capitalization-weighted index designed to measure the performance of the
small to mid-cap value segment of the U.S. equity market. It includes those Russell 2500
Index companies with lower price-to-book ratios and lower forecasted growth rates. Russell
3000 Internet Software and Services and Russell 3000 Biotechnology sub-indices are
classified by the Global Industry Classification Standard (GICS). Russell Midcap® Index is a
market capitalization-weighted index designed to measure the performance of the mid-cap
segment of the U.S. equity market. It contains approximately 800 of the smallest securities in
the Russell 1000 Index.
The S&P 500® Index is a market capitalization-weighted index of 500 common stocks
chosen for market size, liquidity, and industry group representation to represent U.S.
equity performance. S&P 500 is a registered service mark of The McGraw-Hill Companies,
Inc., and has been licensed for use by Fidelity Distributors Corporation and its affiliates.
The S&P SmallCap 600 is a market capitalization-weighted index of 600 small-
capitalization stocks.
Sectors and industries defined by Global Industry Classification Standards (GICS®).
SMI is the Swiss Market Index, a price index made up of twenty of the largest capitalization
and most liquid stocks traded on the Geneva, Zurich, and Basle Stock Exchanges.
S&P 500 sectors are defined as follows: Consumer Discretionary – companies that tend
to be the most sensitive to economic cycles. Consumer Staples – companies whose
businesses are less sensitive to economic cycles. Energy – companies whose businesses
are dominated by either of the following activities: the construction or provision of oil rigs,
drilling equipment, and other energy-related services and equipment, including seismic
data collection; or the exploration, production, marketing, refining, and/or transportation of
oil and gas products, coal, and consumable fuels. Financials – companies involved in
activities such as banking, consumer finance, investment banking and brokerage, asset
management, insurance and investments, and real estate, including REITs. Health Care –
companies in two main industry groups: health care equipment suppliers, manufacturers,
and providers of health care services; and companies involved in research, development,
production, and marketing of pharmaceuticals and biotechnology products. Industrials –
companies whose businesses manufacture and distribute capital goods, provide
commercial services and supplies, or provide transportation services. Information
Technology – companies in technology software & services and technology hardware &
equipment. Materials – companies that are engaged in a wide range of commodity-related
manufacturing. Telecommunication Services – companies that provide communications
services primarily through fixed-line, cellular, wireless, high bandwidth, and/or fiber-optic
cable networks. Utilities – companies considered electric, gas, or water utilities, or
companies that operate as independent producers and/or distributors of power.
S&P GSCI (Commodities Index) is a world production-weighted index composed of 24
widely traded commodities. All sub-indices (Energy, Industrial Metals, Precious Metals,
and Agriculture and Livestock) follow the same rules regarding world production weights,
methodology for rolling, and other functional characteristics.
S&P GSCI™ (Goldman Sachs Commodities Index) is a world production-weighted index
composed of 24 widely traded commodities. All sub-indices (Energy, Industrial Metals,
Precious Metals, and Agriculture and Livestock) follow the same rules regarding world
production weights, methodology for rolling, and other functional characteristics.
Standard & Poor’s/Loan Syndications and Trading Association (S&P/LSTA)
Leveraged Performing Loan Index is a market value-weighted index designed to
represent the performance of U.S. dollar-denominated, institutional leveraged performing
loan portfolios (excluding loans in payment default) using current market weightings,
spreads, and interest payments.
Thomson Reuters Municipal Market Data (MMD) AAA Curve is a proprietary yield curve
that provides the offer-side of AAA-rated state general obligation bonds, as determined by
the MMD analyst team. In the interest of transparency, MMD publishes extensive yield-
curve assumptions relating to various structural criteria that are used in filtering market
information for the purpose of benchmark yield-curve creation. MMD yield curves are
available on a subscription basis from Thomson Reuters.
VIX® is the Chicago Board Options Exchange Volatility Index®, a weighted average of
prices on S&P 500 Index options with a constant maturity of 30 days to expiration. It is
designed to measure the market’s expectation of near-term stock market volatility.
Other Indices
The Consumer Price Index (CPI) is a monthly inflationary indicator that measures the
change in the cost of a fixed basket of products and services; the unadjusted number is
often called “headline inflation” or “headline CPI.” The Core Consumer Price Index is a
monthly inflationary indicator that measures the change in the cost of a fixed basket of
products and services, excluding food and energy prices.
Cyclical Productivity is a proprietary index comparing aggregate hours worked to a set of
economic indicators. It is calculated monthly, then reported as a year-over-year
percentage change.
Appendix: Important Information
56

Other Indices (continued)
The Economic Cycle Research Institute U.S. Weekly Leading Index is a proprietary
index based on leading economic indicators.
The Economy Watchers Survey is conducted by the Cabinet Office of Japan; it surveys
individuals engaged in jobs that enable them to observe developments reflecting economic
activity, in order to assess economic trends.
The Global Leading Indicators Diffusion Index is a proprietary index combining six-
month averages for multiple leading indicators in the 37 largest economies. A score over
50 represents rising leading indicators, while a score under 50 represents falling leading
indicators, and a score of 50 indicates no change. The economies included in the Global
Leading Indicator Diffusion Index are: Austria, Belgium, Brazil, Canada, China, Czech
Republic, Denmark, Finland, France, Germany, Greece, Hungary, India, Indonesia,
Ireland, Italy, Japan, South Korea, Luxembourg, Malaysia, Mexico, Netherlands, New
Zealand, Norway, Poland, Portugal, Russia, Slovakia, South Africa, Spain, Sweden,
Switzerland, Taiwan, Thailand, Turkey, United States, United Kingdom.
The London Bullion Market Association (LBMA) publishes the international benchmark
price of gold in USD, twice daily.
The Producer Price Index (PPI) measures the selling price received by domestic
producers for their output. Core PPI excludes food and energy prices.
A purchasing managers’ index (PMI) is a survey of purchasing managers in a certain
economic sector. A PMI over 50 represents expansion of the sector compared to the
previous month, while a reading under 50 represents a contraction, and a reading of 50
indicates no change. The Institute for Supply Management® reports the U.S.
manufacturing PMI®. Markit compiles non-U.S. PMIs.
The Rasmussen Consumer Index measures consumer confidence on a daily basis.
The University of Michigan Consumer Sentiment Index is a consumer confidence index
published monthly by the University of Michigan and Thomson Reuters.
Definitions
Correlation coefficient measures the interdependencies of two random variables, and
ranges in value from −1 to +1, indicating perfect negative correlation at −1, absence of
correlation at 0, and perfect positive correlation at +1.
The Price-to-Earnings (P/E) ratio is the ratio of a company’s current share price to its
current earnings, typically trailing 12-months earnings per share. A Forward P/E
calculation will typically use an average of analysts’ published estimates of earnings for the
next 12 months in the denominator.
R2 is a measure of how well a regression line fits the data. It ranges from 0 to 1: an R2 of 0
suggests that the regression has no explanatory power, while an R2 of 1 suggests that the
regression fully explains the relationship between the variables regressed.
Sharpe ratio compares portfolio returns above the risk-free rate relative to overall portfolio
volatility. A higher Sharpe ratio implies better risk-adjusted returns.
Standard deviation shows how much variation there is from the average (mean or
expected value). A low standard deviation indicates that the data points tend to be very
close to the mean, whereas a high standard deviation indicates that the data points are
spread out over a large range of values. A higher standard deviation represents greater
relative risk.
—
Third-party marks are the property of their respective owners; all other marks are the
property of FMR LLC.
If receiving this piece through your relationship with Fidelity Financial Advisor Solutions
(FFAS), this publication is provided to investment professionals, plan sponsors,
institutional investors, and individual investors by Fidelity Investments Institutional Services
Company, Inc.
If receiving this piece through your relationship with Fidelity Personal & Workplace
Investing (PWI), Fidelity Family Office Services (FFOS), or Fidelity Institutional Wealth
Services (IWS), this publication is provided through Fidelity Brokerage Services LLC,
Member NYSE.
If receiving this piece through your relationship with National Financial or Fidelity Capital
Markets, this publication is FOR INSTITUTIONAL INVESTOR USE ONLY. Clearing and
custody services are provided through National Financial Services LLC, Member NYSE,
SIPC.
692189.1.0
© 2014 FMR LLC. All rights reserved.
Appendix: Important Information
57