third quarter 2021 earnings
TRANSCRIPT
MGM RESORTS INTERNAT IONAL
M G M R E S O R T S I N T E R N A T I O N A L
T H I R D Q U A R T E R 2 0 2 1 E A R N I N G S
N O V E M B E R 3 , 2 0 2 1
MGM RESORTS INTERNAT IONAL 2
FORWARD-LOOKING STATEMENTSStatements in this presentation that are not historical facts are forward-looking statements, within the meaning of the Private Securities Litigation Reform Act of 1995 and involve risks and/or uncertainties, includingthose described in the Company's public filings with the Securities and Exchange Commission. The Company has based forward-looking statements on management’s current expectations and assumptions andnot on historical facts. Examples of these statements include, but are not limited to, the Company’s expectations regarding the closing of the transactions between MGM Growth Properties LLC and VICI PropertiesInc. and the purchase of The Cosmopolitan of Las Vegas (collectively, the “Transactions”) and any excepted benefits to be received from the Transactions. Additional forward-looking statements also includestatements related to the Company’s financial outlook (including expectations regarding its liquidity position, long term cost savings and corporate expense), the continued impact of the COVID-19 pandemic onthe Company’s operations, the Company’s ability to execute on its strategic pillars, the Company's ability to return value to shareholders (including the timing and amount of any share repurchases or dividends),expectations regarding the development of an integrated resort in Japan and the sale process related to The Mirage, the positioning of BetMGM as a leader in sports betting and iGaming (including BetMGM’sexpected growth in new and existing jurisdictions and projected market share and net revenues) and expectations regarding the renewal of the Company’s subconcession in Macau. These forward-lookingstatements involve a number of risks and uncertainties. Among the important factors that could cause actual results to differ materially from those indicated in such forward-looking statements include thecontinued impact of the COVID-19 pandemic, effects of economic and other conditions in the markets in which the Company operates and competition with other destination travel locations throughout the UnitedStates and the world, the design, timing and costs of expansion projects, risks relating to international operations, permits, licenses, financings, approvals and other contingencies in connection with growth in newor existing jurisdictions and additional risks and uncertainties described in the Company’s Form 10-K, Form 10-Q and Form 8-K reports (including all amendments to those reports). In providing forward-lookingstatements, the Company is not undertaking any duty or obligation to update these statements publicly as a result of new information, future events or otherwise, except as required by law. If the Company updatesone or more forward-looking statements, no inference should be drawn that it will make additional updates with respect to those other forward-looking statements.
MARKET AND INDUSTRY DATAThis presentation also contains estimates and information concerning the Company’s industry that are based on industry publications, reports and peer company public filings. This information involves a numberof assumptions and limitations, and you are cautioned not to rely on or give undue weight to this information. The Company has not independently verified the accuracy or completeness of the data contained inthese industry publications, reports or filings. The industry in which we operate is subject to a high degree of uncertainty and risk due to a variety of factors, including those described in the “Risk Factors” section ofthe Company’s public filings with the SEC. Third party logos and brands included in this presentation are the property of their respective owners and are included for informational purposes only.
NOTE REGARDING PRESENTATION OF NON -GAAP F INANCIAL MEASURESThis presentation includes certain “non-GAAP financial measures” as defined in Regulation G under the Securities Exchange Act of 1934, as amended, including, among others, Adjusted EBITDAR, Table GamesHold Adjusted Las Vegas Strip Resorts Adjusted Property EBITDAR, and Adjusted EPS. Schedules that reconcile the non-GAAP financial measures to the most directly comparable financial measures calculatedand presented in accordance with Generally Accepted Accounting Principles in the United States are included herein or in the Company’s earnings releases that have been furnished with the SEC and are availableon our website at www.mgmresorts.com.
IMPORTANT NOTE REGARDING BETMGM FINANCIAL AND OTHER INFORMATIONThis presentation includes certain financial and other information related to BetMGM and the industry in which BetMGM operates, which is jointly owned by the Company and Entain plc. This information wasobtained from BetMGM management and while the Company believes such information to be reliable and accurate, the Company has not independently verified it and does not make any representation as to itsaccuracy. Included in this information is BetMGM reported net revenues from operations, forecasted 2022 net revenues from operations and long-term EBITDA margin targets. BetMGM financial information is notprepared in accordance with GAAP. If BetMGM presented these financial measures in accordance with GAAP, then BetMGM would present the revenues associated with its Nevada digital and retail sports bettingoperations differently, until such time as BetMGM is directly licensed as a Nevada gaming operator. Currently under GAAP, its calculation of net revenue would be on a basis net of operating costs, such that theGAAP reported net revenue would be lower than the net revenue reported herein, with net income remaining the same. BetMGM projected net revenue from operations and target EBITDA margins are also basedon significant assumptions regarding the extension of current market trends in the states where BetMGM currently operates as well as assumptions regarding BetMGM’s expansion into new jurisdictions in 2021and 2022. These assumptions are subject to significant risks and uncertainty and as a result investors are cautioned not to place undue reliance on such statements as a prediction of BetMGM’s actual results. See“Forward-looking Statements” above.
MGM RESORTS INTERNAT IONAL
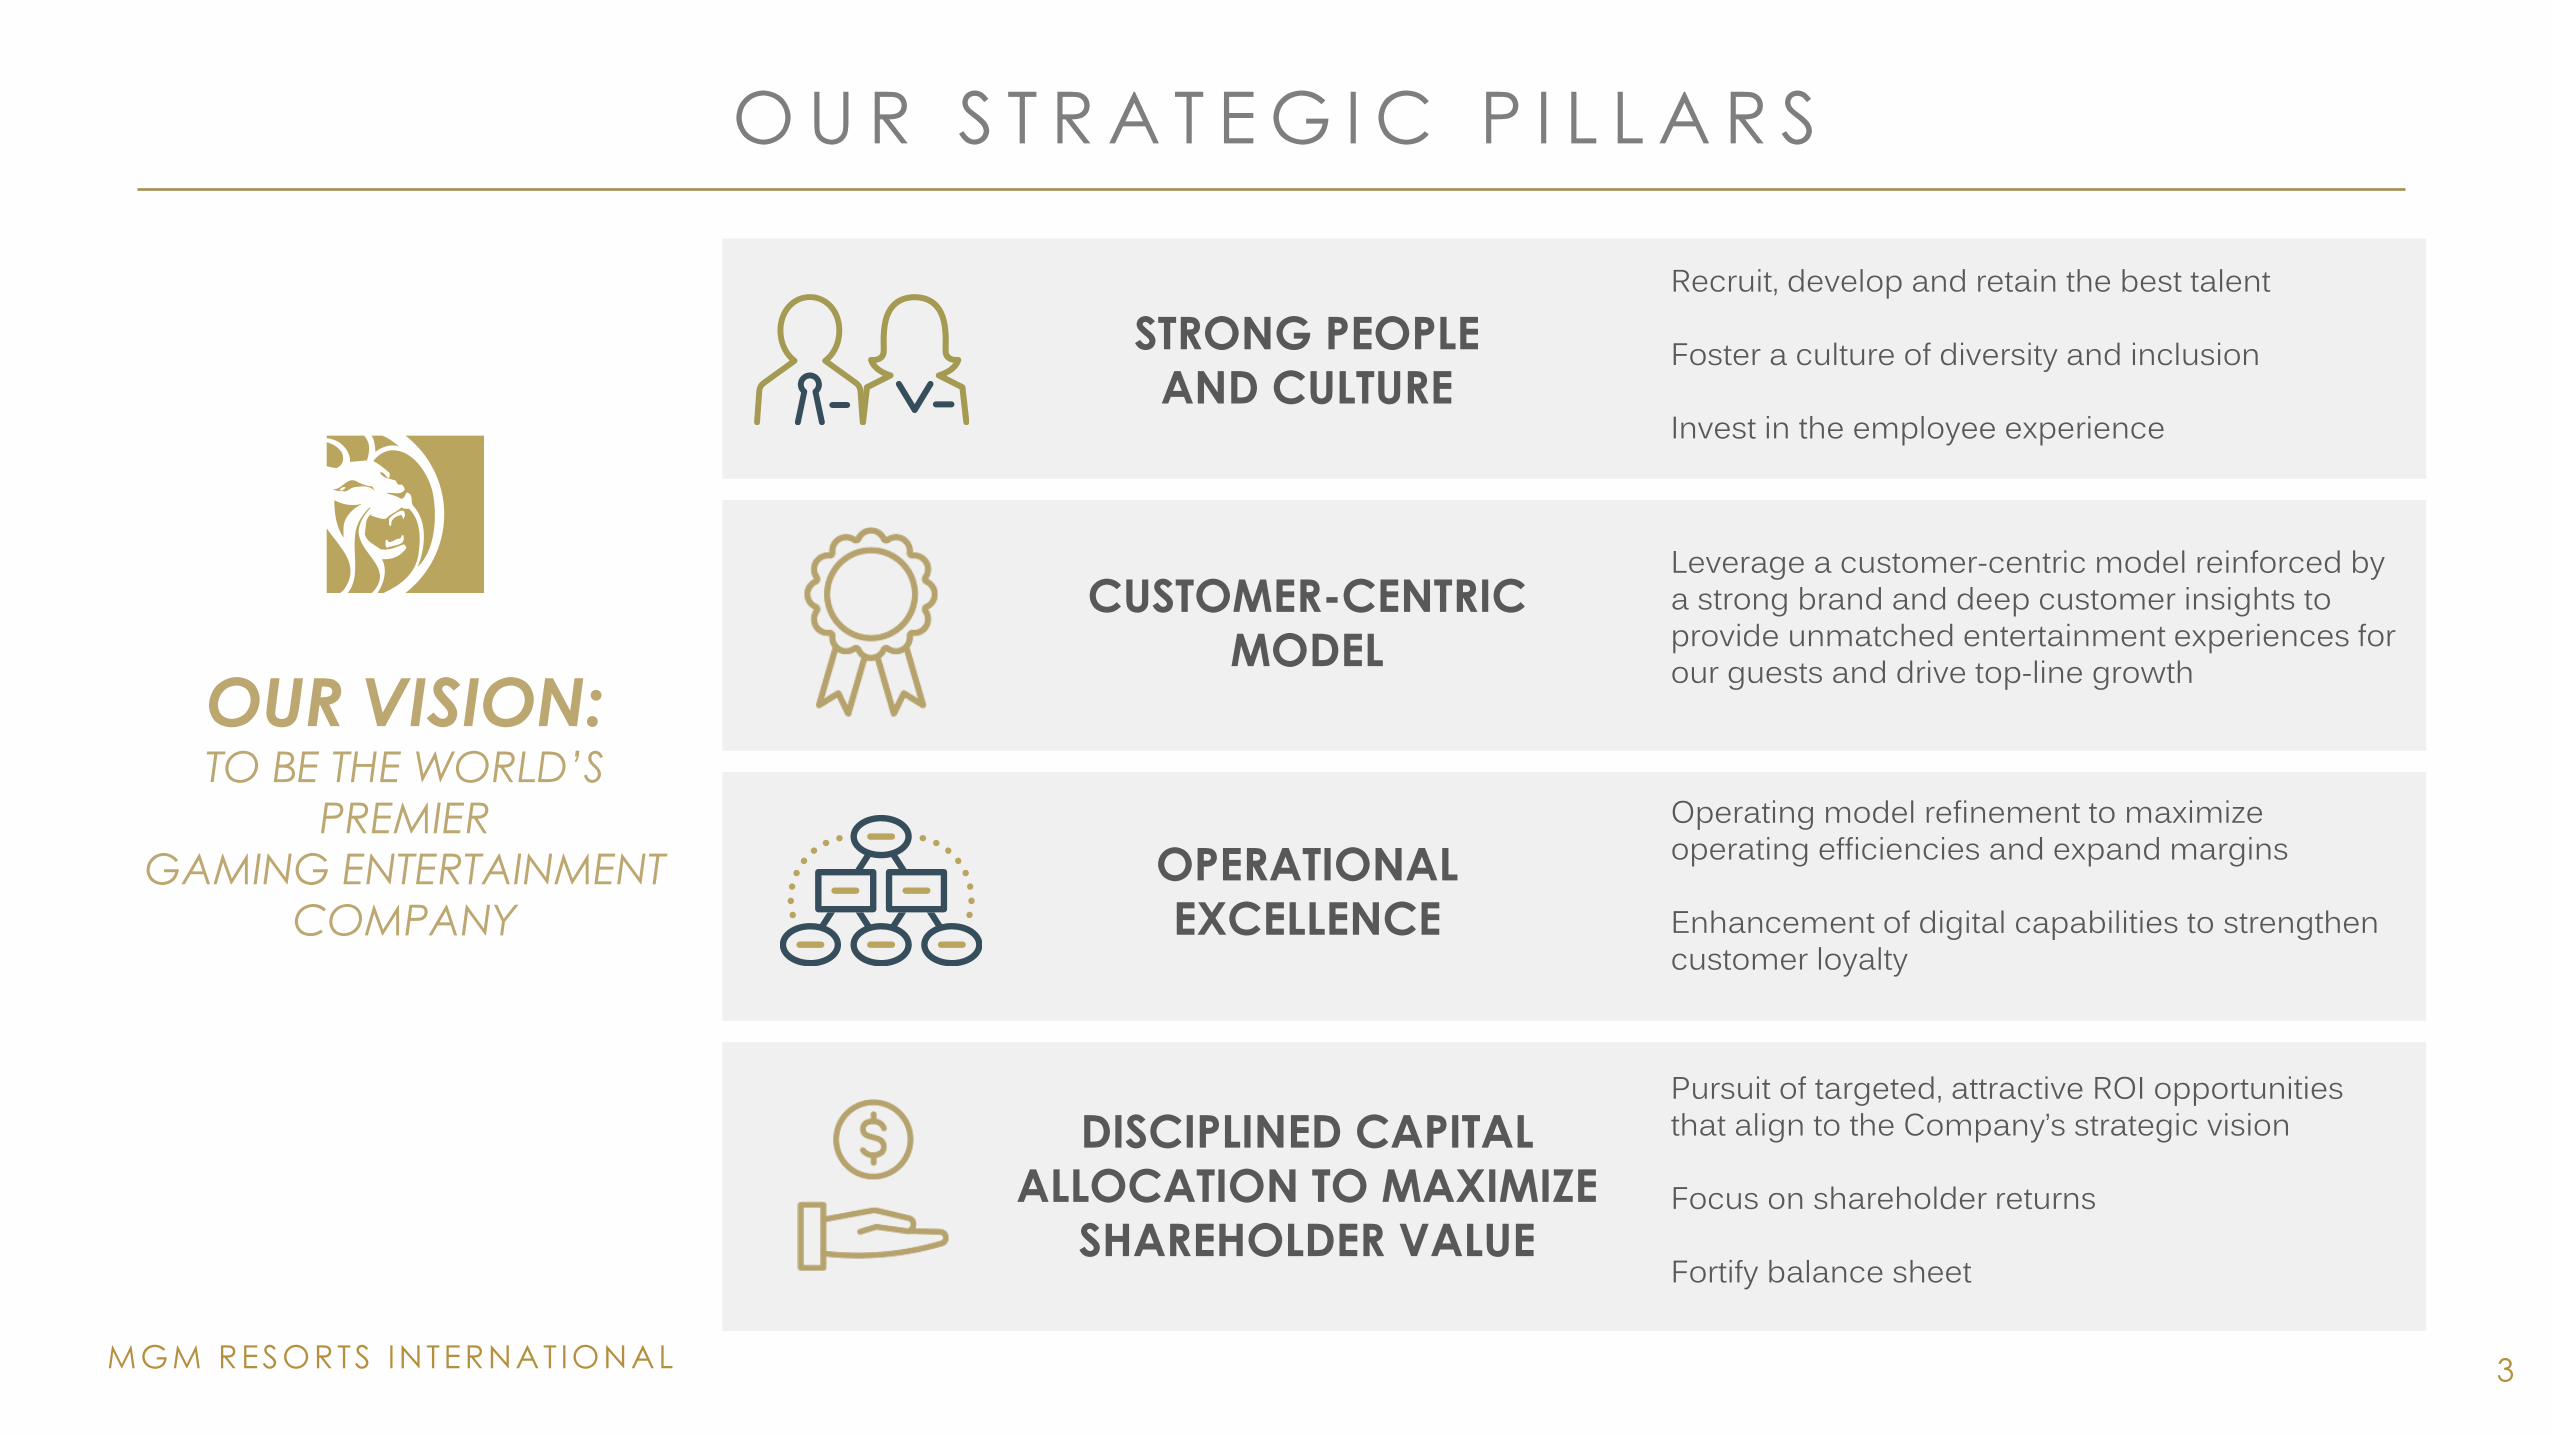
O U R S T R A T E G I C P I L L A R S
STRONG PEOPLE
AND CULTURE
Recruit, develop and retain the best talent
Foster a culture of diversity and inclusion
Invest in the employee experience
OPERATIONAL
EXCELLENCE
Operating model refinement to maximize operating efficiencies and expand margins
Enhancement of digital capabilities to strengthen customer loyalty
DISCIPLINED CAPITAL
ALLOCATION TO MAXIMIZE
SHAREHOLDER VALUE
Pursuit of targeted, attractive ROI opportunities that align to the Company’s strategic vision
Focus on shareholder returns
Fortify balance sheet
3
OUR VISION: TO BE THE WORLD’S
PREMIER
GAMING ENTERTAINMENT
COMPANY
Leverage a customer-centric model reinforced by a strong brand and deep customer insights to provide unmatched entertainment experiences for our guests and drive top-line growth
CUSTOMER-CENTRIC
MODEL
T A B L E O F
C O N T E N T S
4
• 3 Q 2 0 2 1 H I G H L I G H T S
• 3 Q 2 0 2 1 F I N A N C I A L R E S U L T S
• B E T M G M
• S U P P L E M E N T A L
MGM RESORTS INTERNAT IONAL
K E Y 3 Q 2 0 2 1 T A K E A W A Y S
5
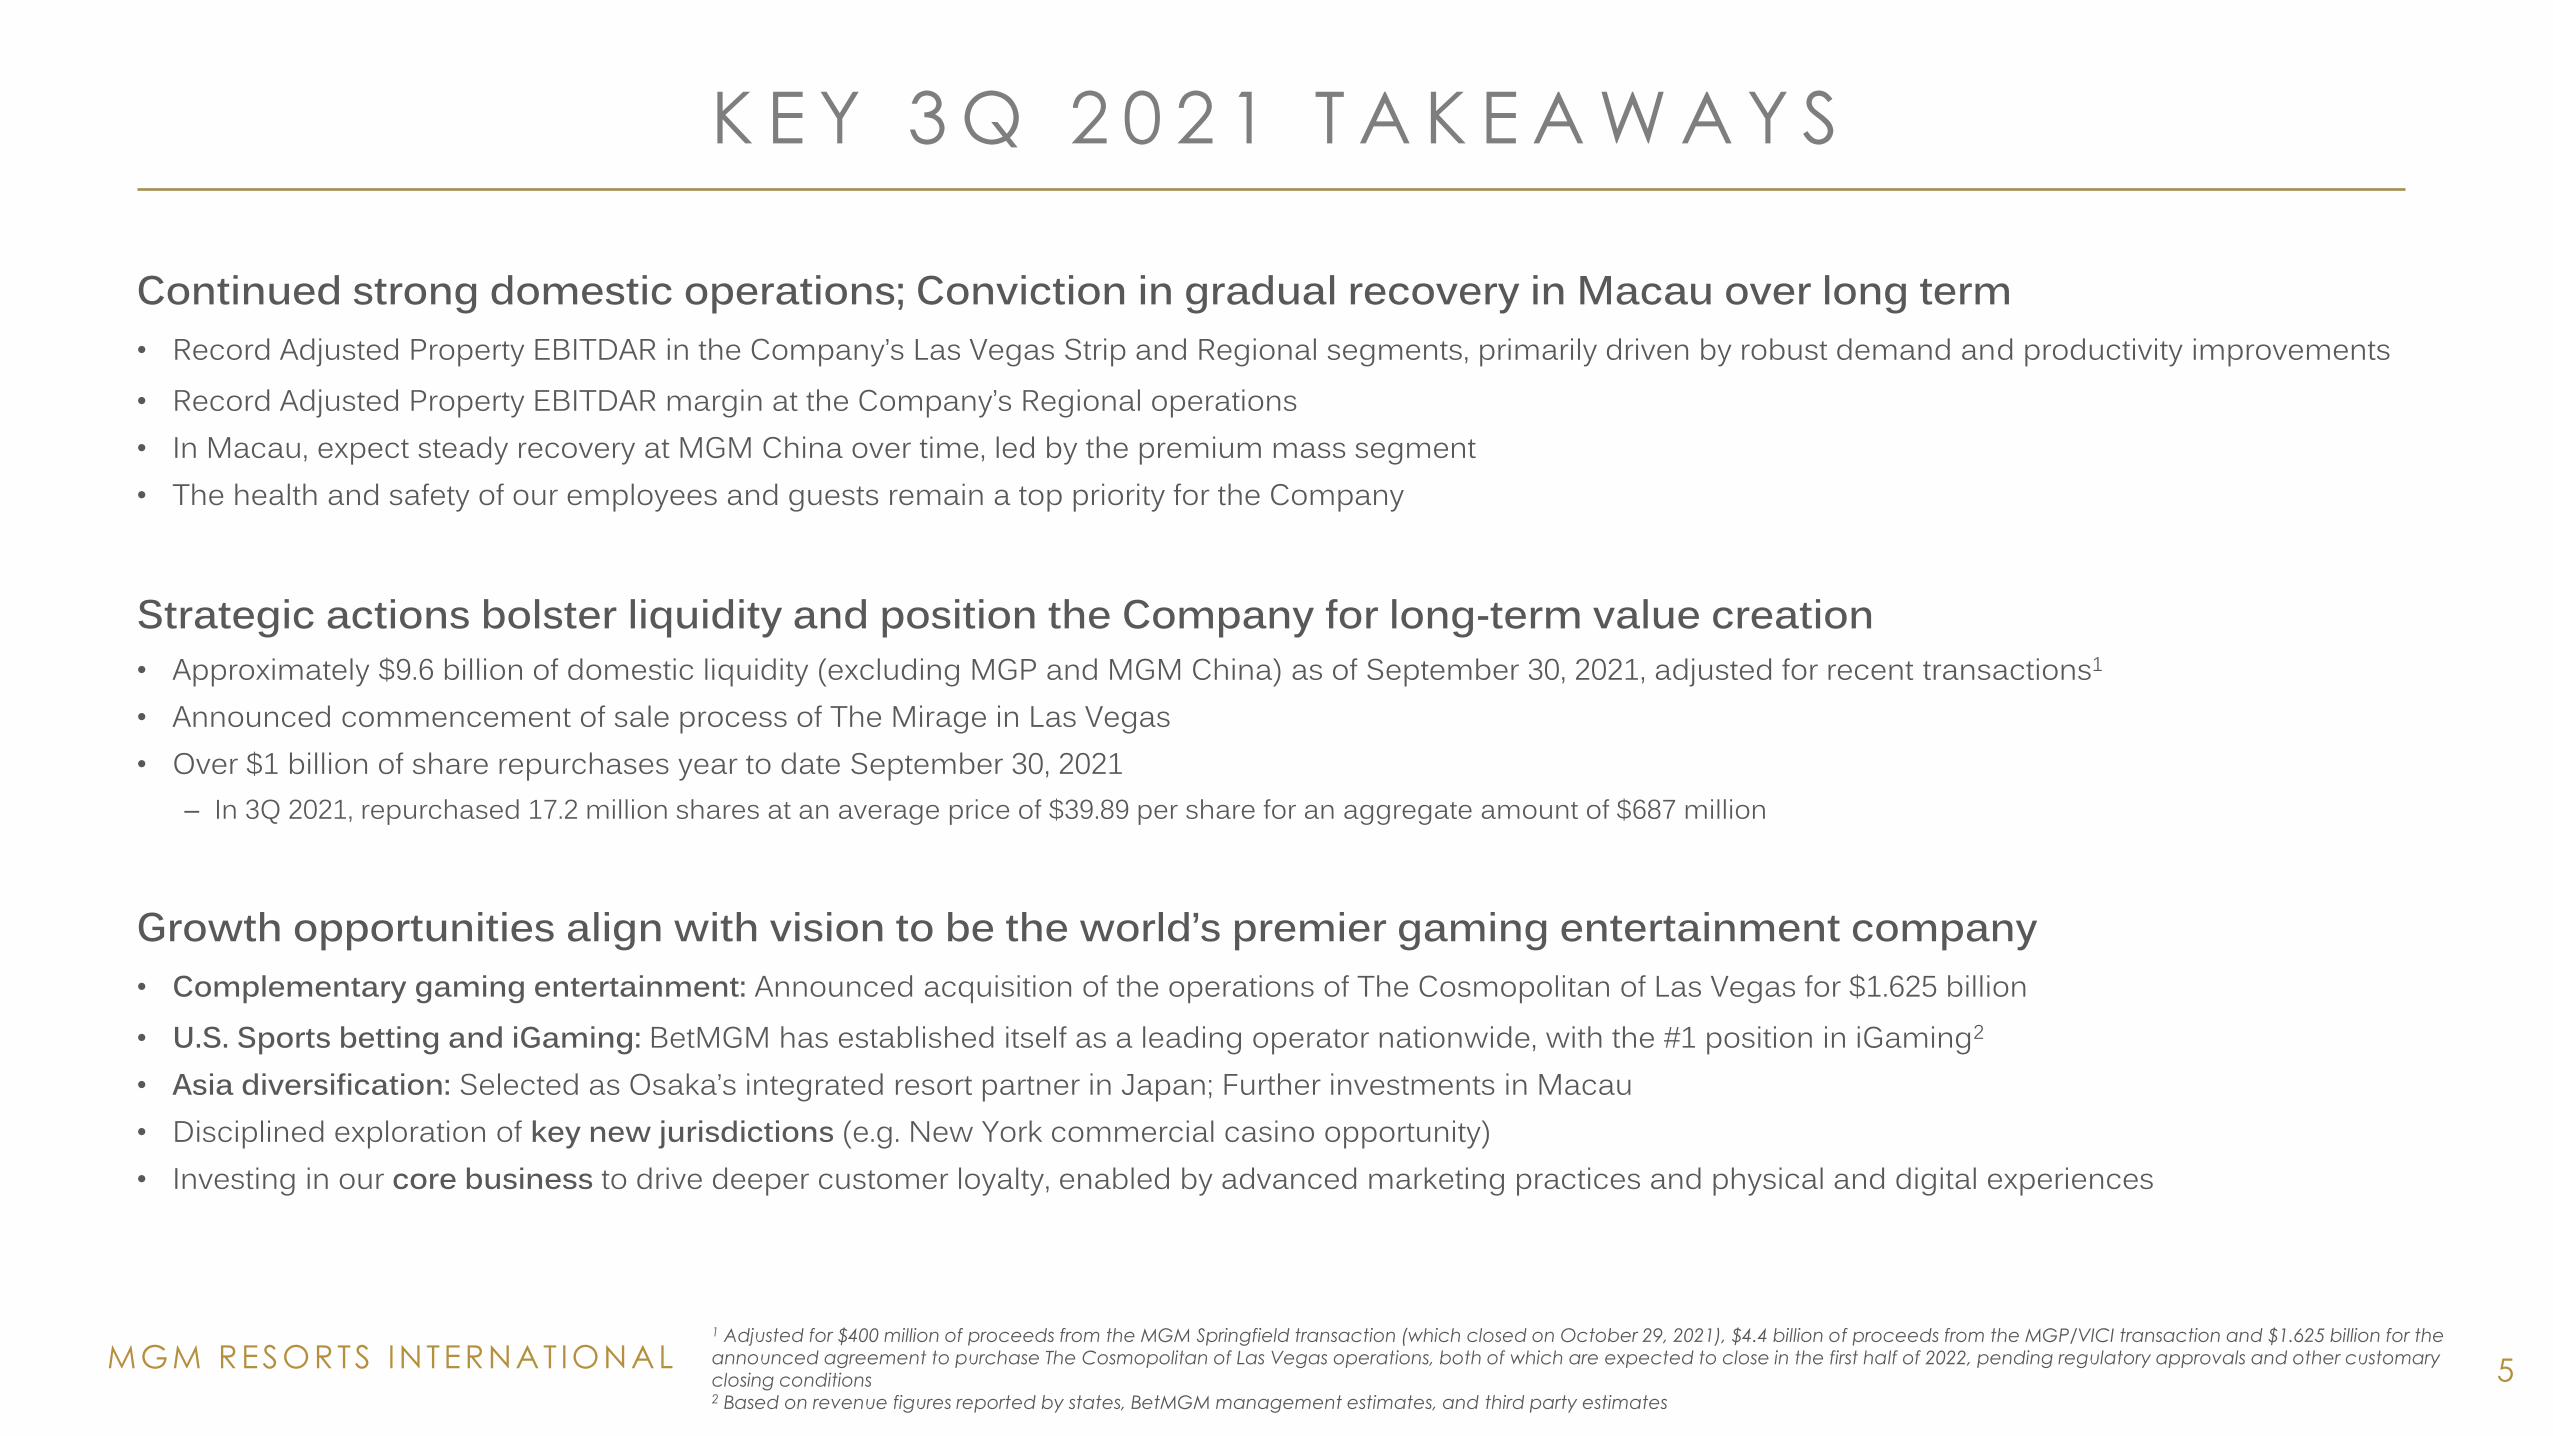
Continued strong domestic operations; Conviction in gradual recovery in Macau over long term• Record Adjusted Property EBITDAR in the Company’s Las Vegas Strip and Regional segments, primarily driven by robust demand and productivity improvements• Record Adjusted Property EBITDAR margin at the Company’s Regional operations• In Macau, expect steady recovery at MGM China over time, led by the premium mass segment• The health and safety of our employees and guests remain a top priority for the Company
Strategic actions bolster liquidity and position the Company for long-term value creation• Approximately $9.6 billion of domestic liquidity (excluding MGP and MGM China) as of September 30, 2021, adjusted for recent transactions1
• Announced commencement of sale process of The Mirage in Las Vegas• Over $1 billion of share repurchases year to date September 30, 2021
– In 3Q 2021, repurchased 17.2 million shares at an average price of $39.89 per share for an aggregate amount of $687 million
Growth opportunities align with vision to be the world’s premier gaming entertainment company• Complementary gaming entertainment: Announced acquisition of the operations of The Cosmopolitan of Las Vegas for $1.625 billion• U.S. Sports betting and iGaming: BetMGM has established itself as a leading operator nationwide, with the #1 position in iGaming2
• Asia diversification: Selected as Osaka’s integrated resort partner in Japan; Further investments in Macau• Disciplined exploration of key new jurisdictions (e.g. New York commercial casino opportunity)• Investing in our core business to drive deeper customer loyalty, enabled by advanced marketing practices and physical and digital experiences
1 Adjusted for $400 million of proceeds from the MGM Springfield transaction (which closed on October 29, 2021), $4.4 billion of proceeds from the MGP/VICI transaction and $1.625 billion for the announced agreement to purchase The Cosmopolitan of Las Vegas operations, both of which are expected to close in the first half of 2022, pending regulatory approvals and other customary closing conditions2 Based on revenue figures reported by states, BetMGM management estimates, and third party estimates
MGM RESORTS INTERNAT IONAL
3 Q 2 0 2 1 F I N A N C I A L H I G H L I G H T S
6
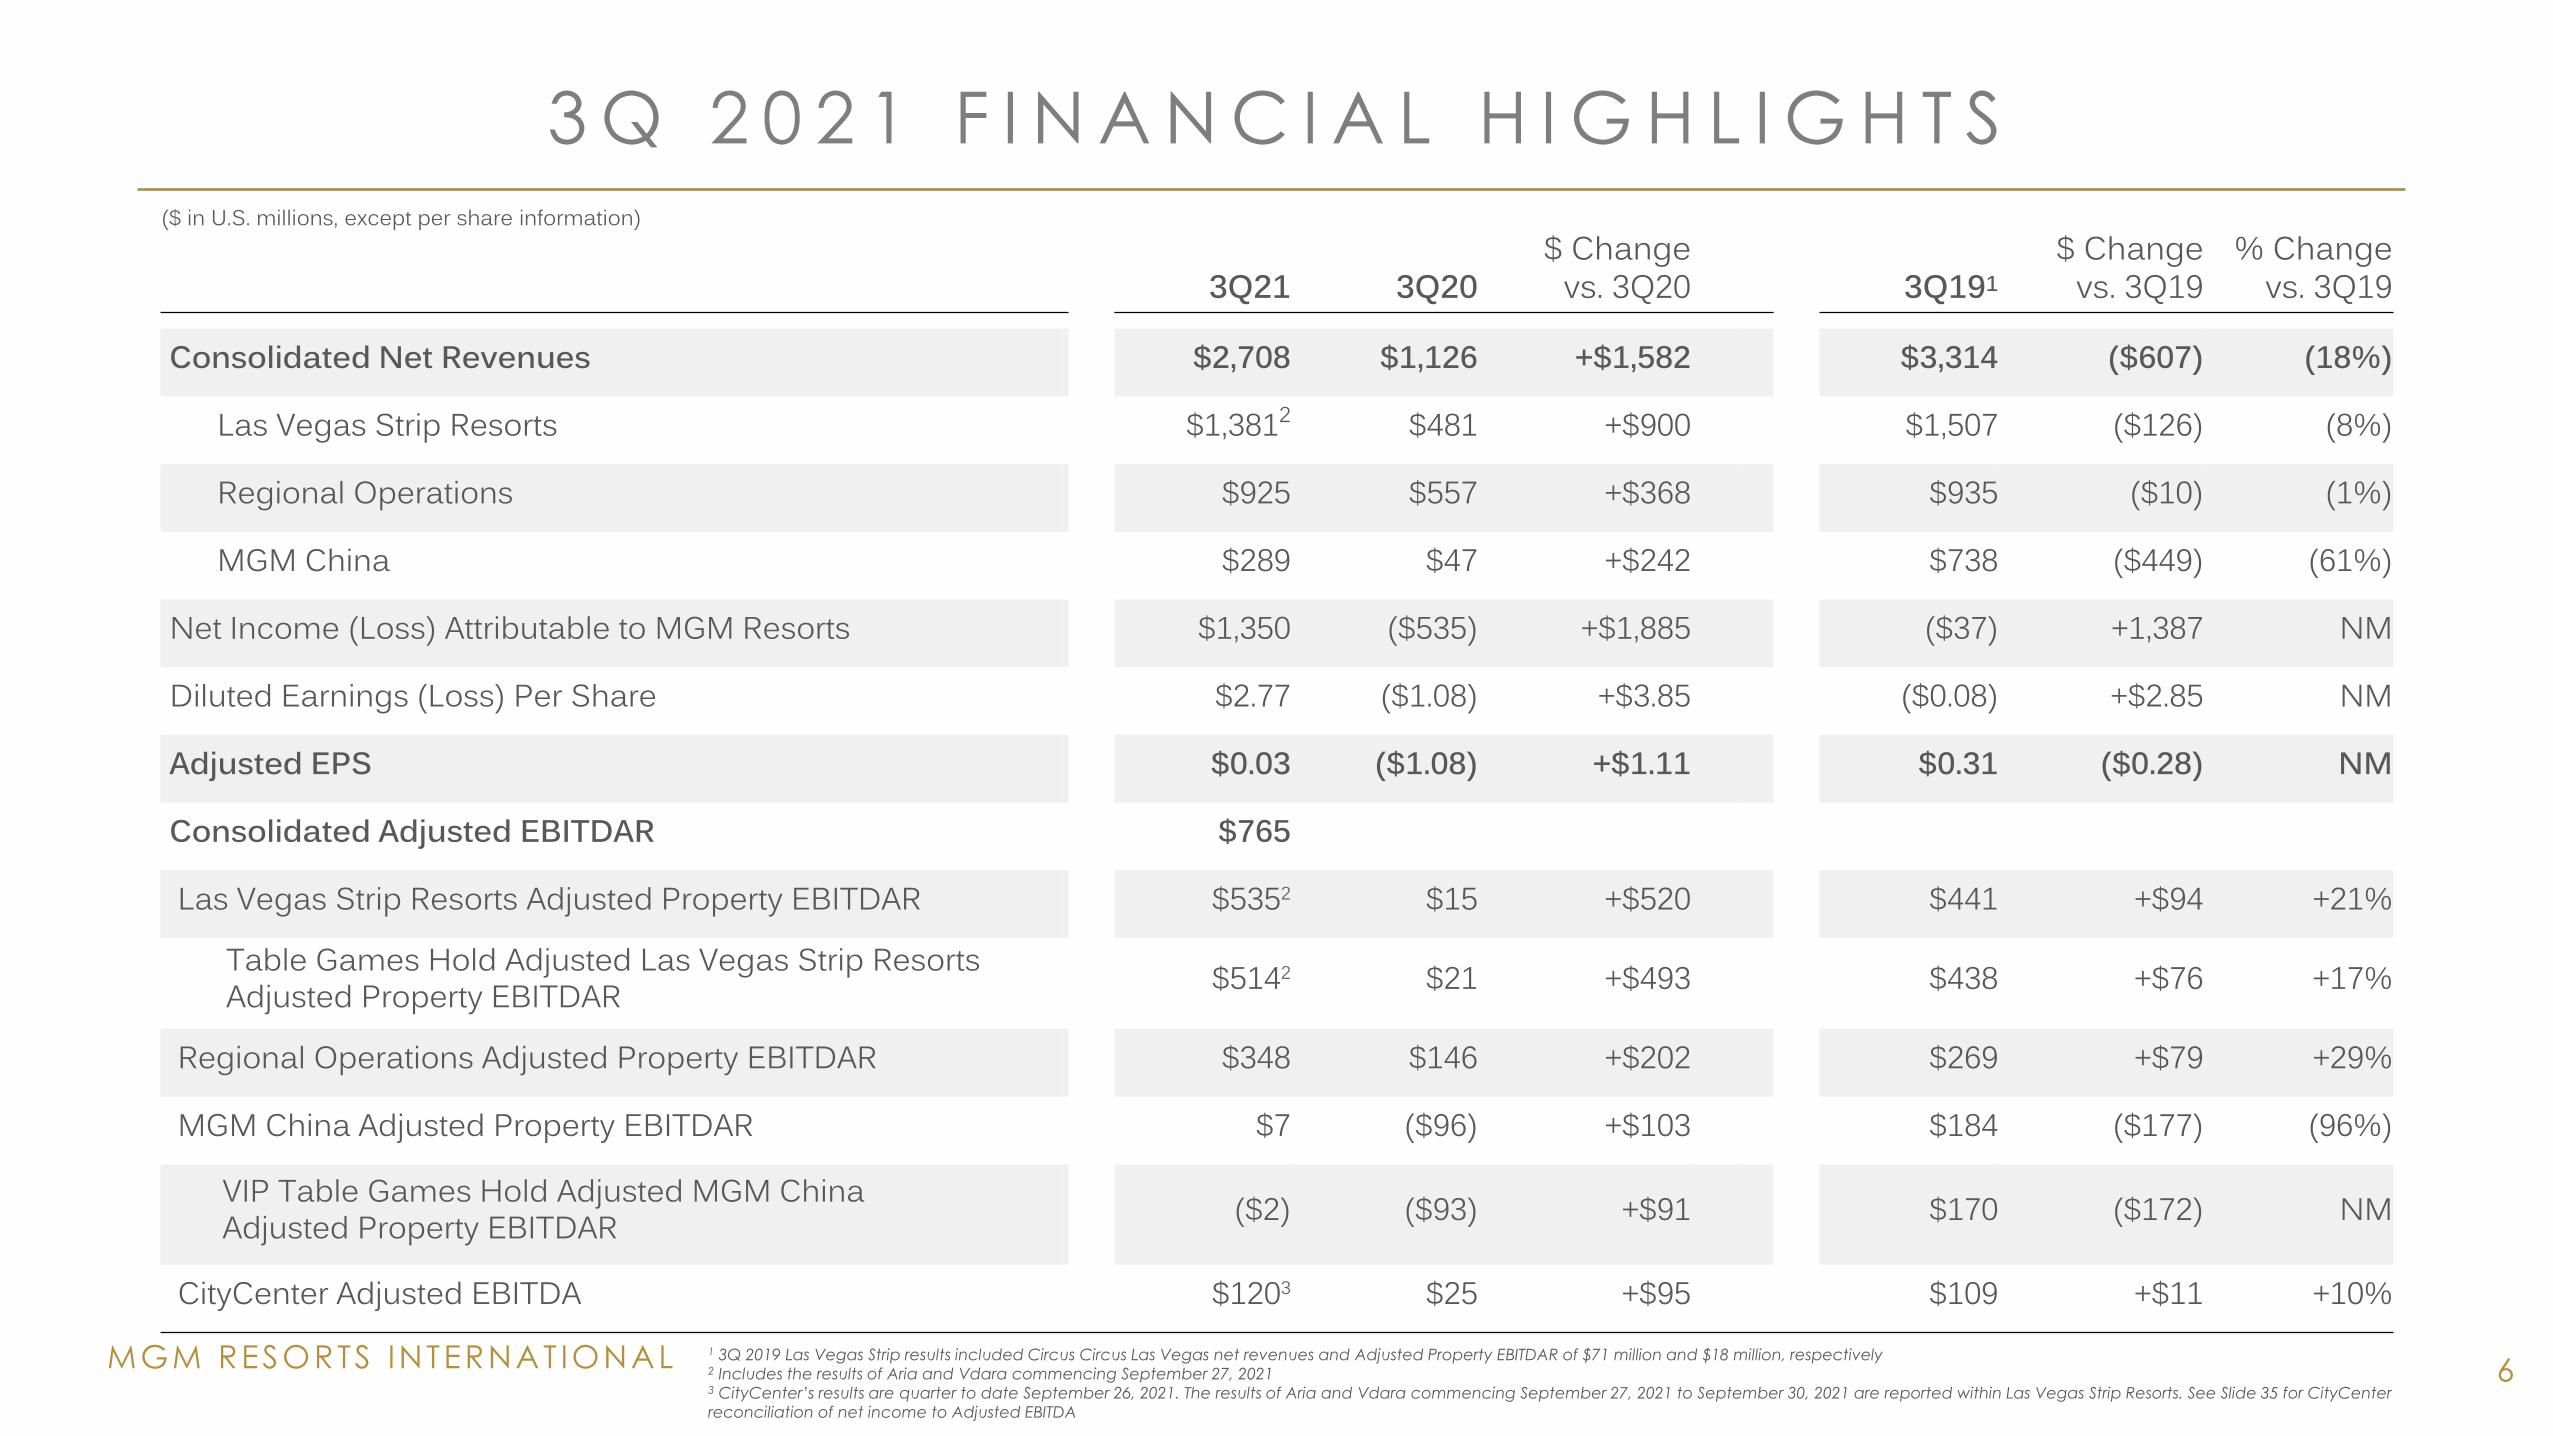
($ in U.S. millions, except per share information)
3Q21 3Q20$ Change
vs. 3Q20 3Q191$ Change
vs. 3Q19% Change
vs. 3Q19
Consolidated Net Revenues $2,708 $1,126 +$1,582 $3,314 ($607) (18%)
Las Vegas Strip Resorts $1,3812 $481 +$900 $1,507 ($126) (8%)
Regional Operations $925 $557 +$368 $935 ($10) (1%)
MGM China $289 $47 +$242 $738 ($449) (61%)
Net Income (Loss) Attributable to MGM Resorts $1,350 ($535) +$1,885 ($37) +1,387 NM
Diluted Earnings (Loss) Per Share $2.77 ($1.08) +$3.85 ($0.08) +$2.85 NM
Adjusted EPS $0.03 ($1.08) +$1.11 $0.31 ($0.28) NM
Consolidated Adjusted EBITDAR $765
Las Vegas Strip Resorts Adjusted Property EBITDAR $5352 $15 +$520 $441 +$94 +21%
Table Games Hold Adjusted Las Vegas Strip Resorts Adjusted Property EBITDAR $5142 $21 +$493 $438 +$76 +17%
Regional Operations Adjusted Property EBITDAR $348 $146 +$202 $269 +$79 +29%
MGM China Adjusted Property EBITDAR $7 ($96) +$103 $184 ($177) (96%)
VIP Table Games Hold Adjusted MGM China Adjusted Property EBITDAR ($2) ($93) +$91 $170 ($172) NM
CityCenter Adjusted EBITDA $1203 $25 +$95 $109 +$11 +10%1 3Q 2019 Las Vegas Strip results included Circus Circus Las Vegas net revenues and Adjusted Property EBITDAR of $71 million and $18 million, respectively2 Includes the results of Aria and Vdara commencing September 27, 20213 CityCenter’s results are quarter to date September 26, 2021. The results of Aria and Vdara commencing September 27, 2021 to September 30, 2021 are reported within Las Vegas Strip Resorts. See Slide 35 for CityCenter
reconciliation of net income to Adjusted EBITDA
MGM RESORTS INTERNAT IONAL
S T R O N G L I Q U I D I T Y P R O V I D E S F I N A N C I A L F L E X I B I L I T Y
7
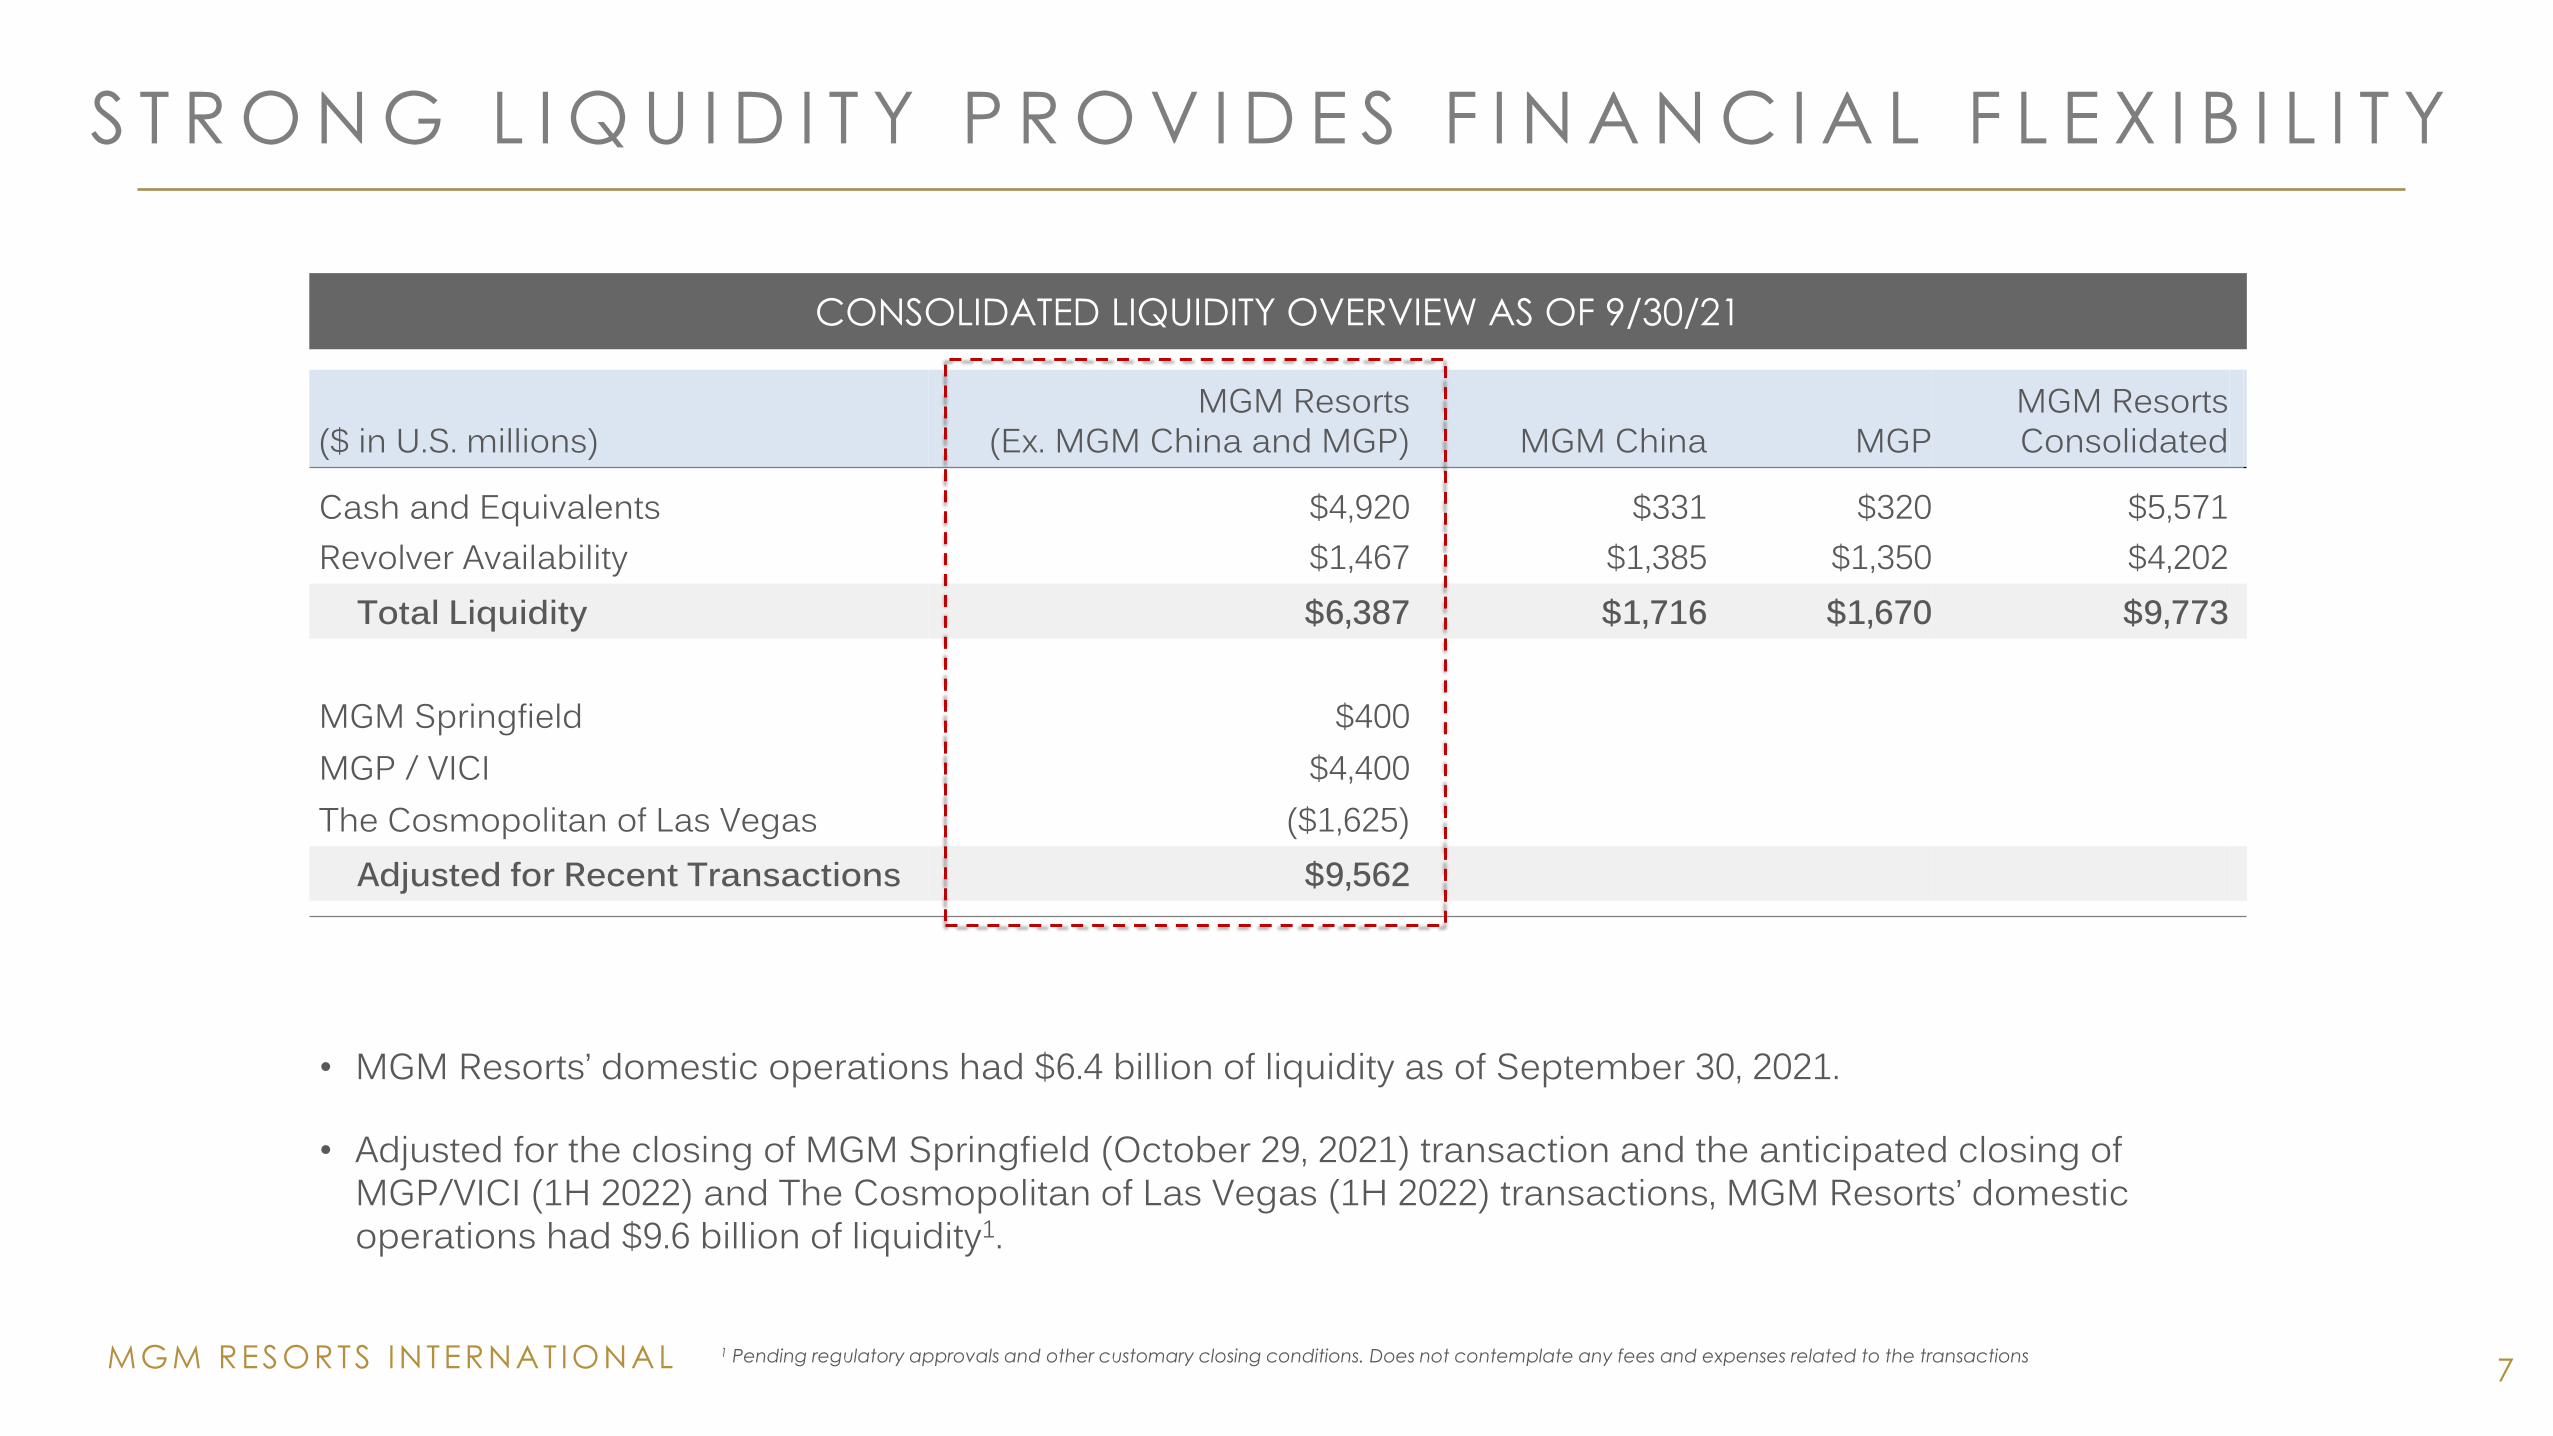
($ in U.S. millions)MGM Resorts
(Ex. MGM China and MGP) MGM China MGPMGM Resorts Consolidated
Cash and Equivalents $4,920 $331 $320 $5,571 Revolver Availability $1,467 $1,385 $1,350 $4,202
Total Liquidity $6,387 $1,716 $1,670 $9,773
MGM Springfield $400MGP / VICI $4,400The Cosmopolitan of Las Vegas ($1,625)
Adjusted for Recent Transactions $9,562
• MGM Resorts’ domestic operations had $6.4 billion of liquidity as of September 30, 2021.
• Adjusted for the closing of MGM Springfield (October 29, 2021) transaction and the anticipated closing of MGP/VICI (1H 2022) and The Cosmopolitan of Las Vegas (1H 2022) transactions, MGM Resorts’ domestic operations had $9.6 billion of liquidity1.
CONSOLIDATED LIQUIDITY OVERVIEW AS OF 9/30/21
1 Pending regulatory approvals and other customary closing conditions. Does not contemplate any fees and expenses related to the transactions
A G R E E M E N T T O A C Q U I R E T H E
O P E R A T I O N S O F
T H E C O S M O P O L I T A N O F L A S V E G A S
8
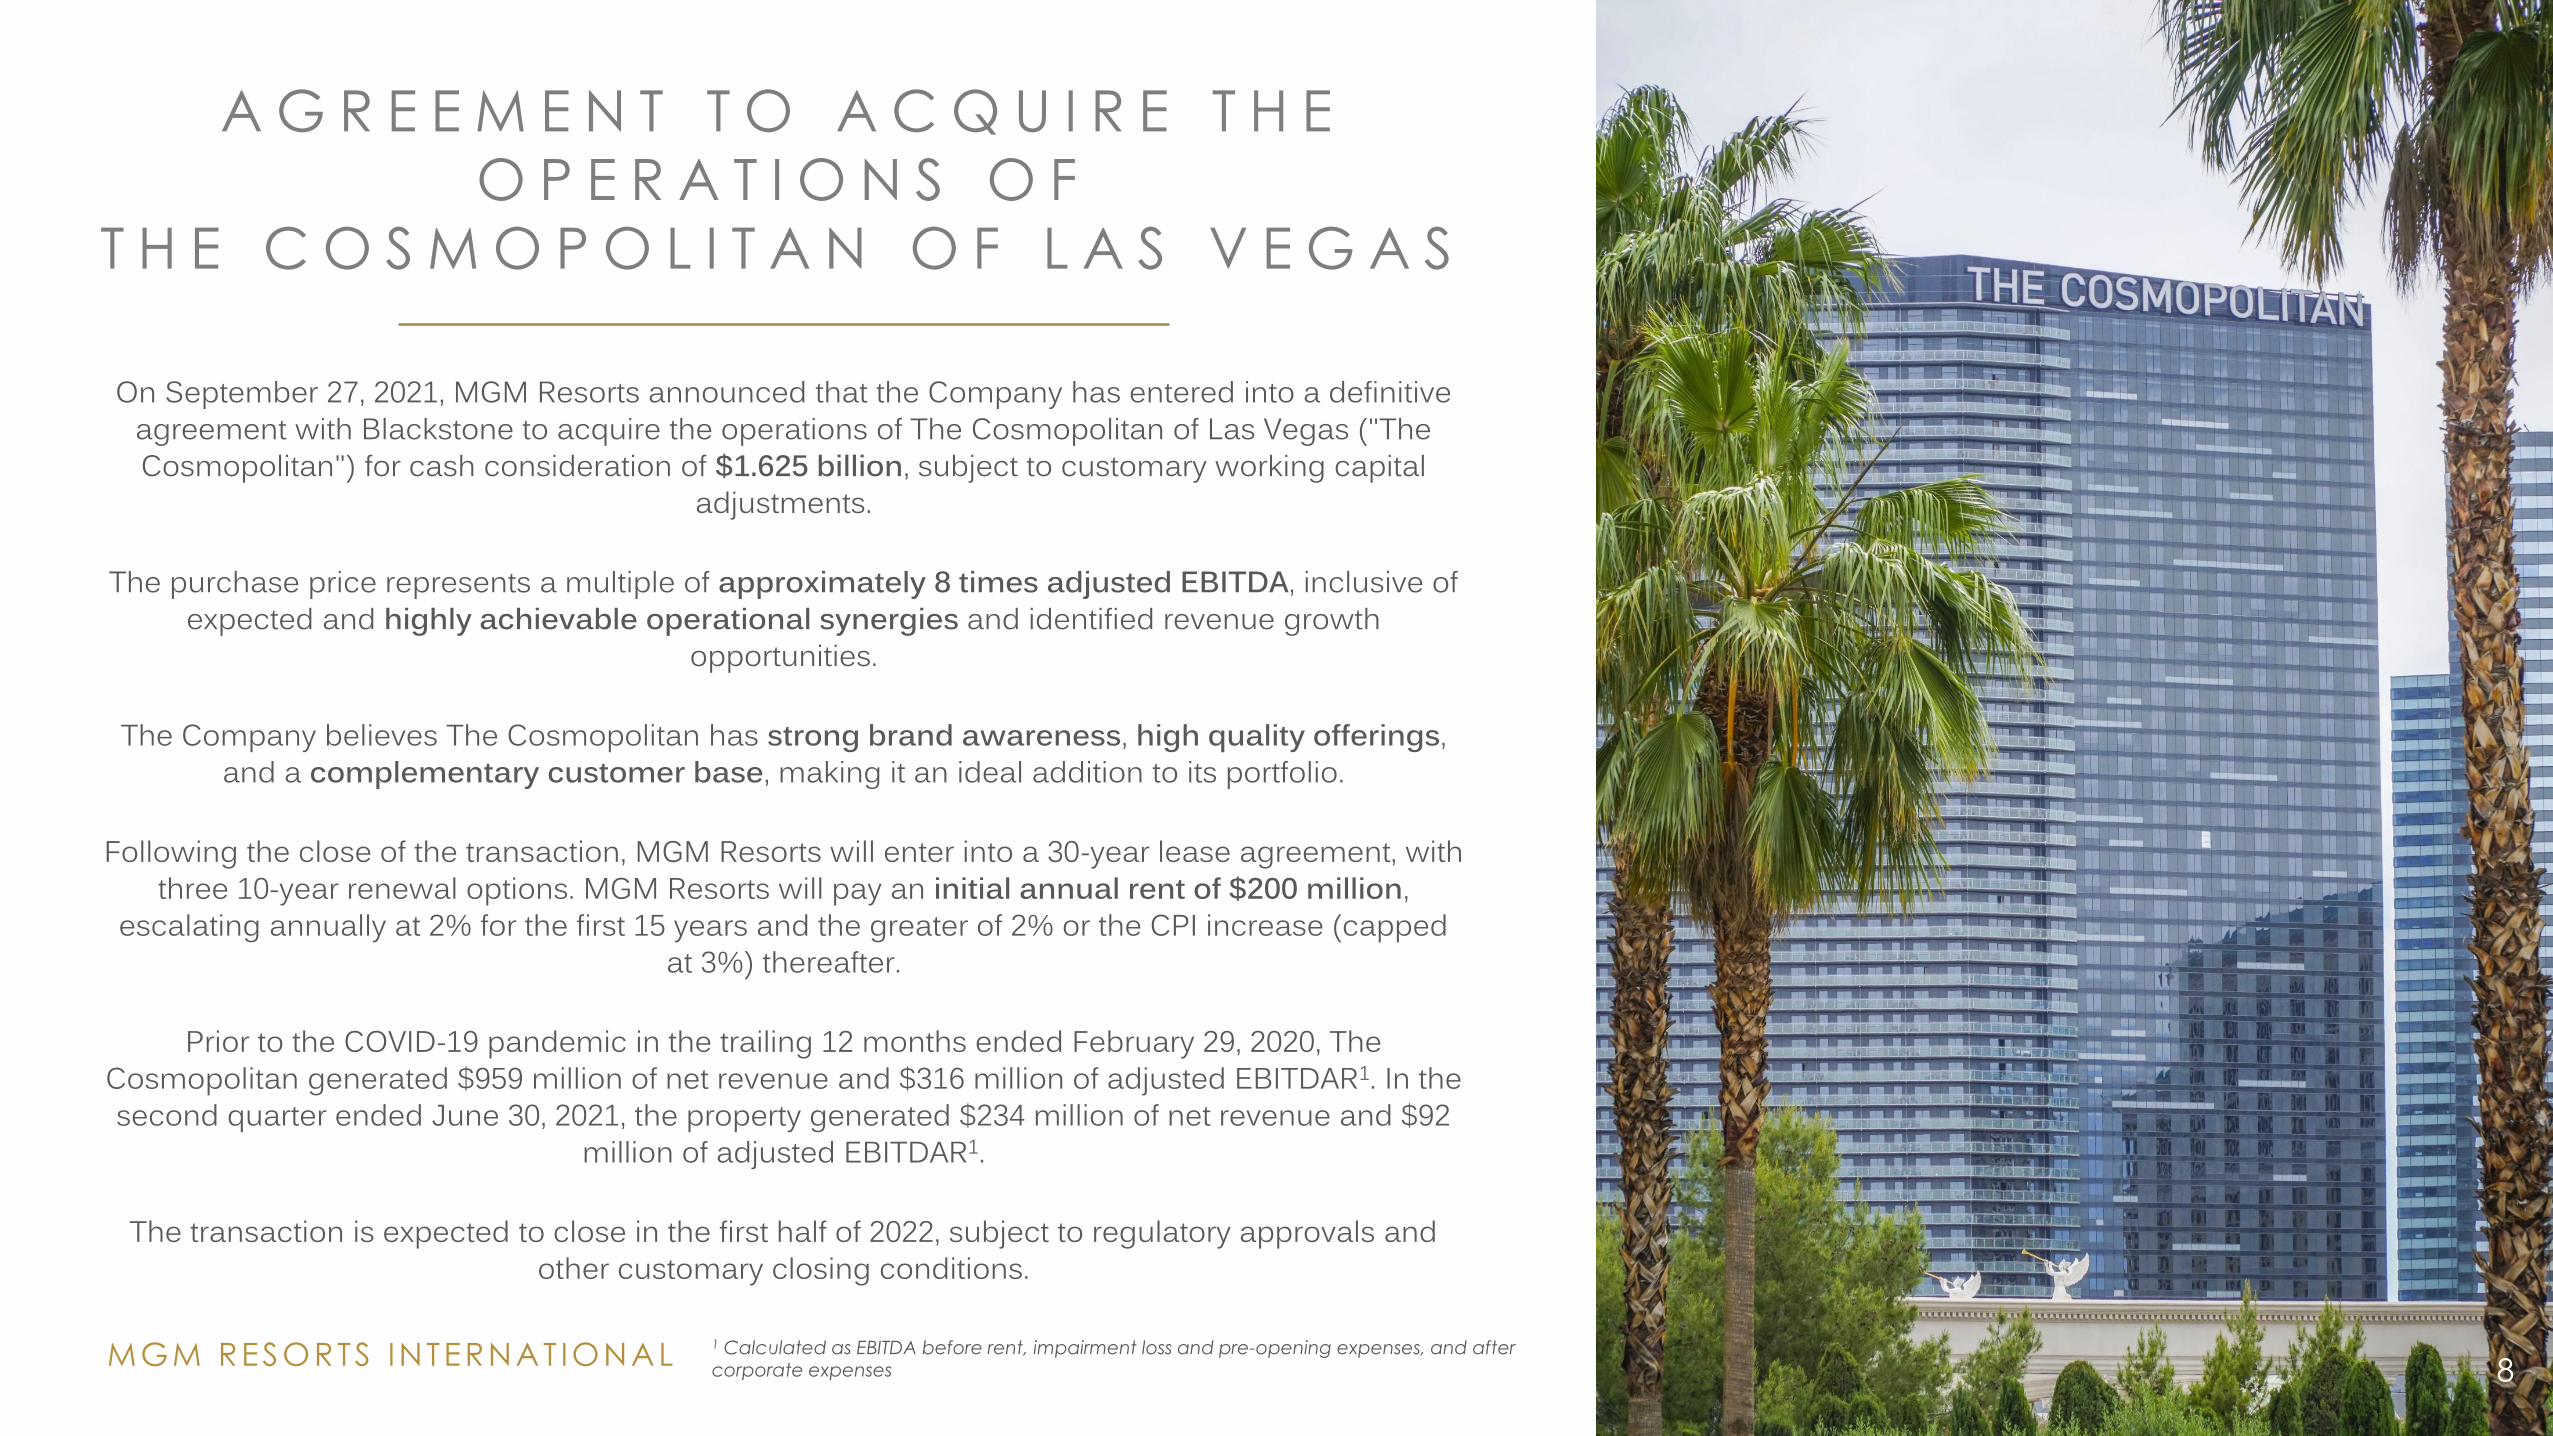
On September 27, 2021, MGM Resorts announced that the Company has entered into a definitive agreement with Blackstone to acquire the operations of The Cosmopolitan of Las Vegas ("The Cosmopolitan") for cash consideration of $1.625 billion, subject to customary working capital
adjustments.
The purchase price represents a multiple of approximately 8 times adjusted EBITDA, inclusive of expected and highly achievable operational synergies and identified revenue growth
opportunities.
The Company believes The Cosmopolitan has strong brand awareness, high quality offerings, and a complementary customer base, making it an ideal addition to its portfolio.
Following the close of the transaction, MGM Resorts will enter into a 30-year lease agreement, with three 10-year renewal options. MGM Resorts will pay an initial annual rent of $200 million,
escalating annually at 2% for the first 15 years and the greater of 2% or the CPI increase (capped at 3%) thereafter.
Prior to the COVID-19 pandemic in the trailing 12 months ended February 29, 2020, The Cosmopolitan generated $959 million of net revenue and $316 million of adjusted EBITDAR1. In the second quarter ended June 30, 2021, the property generated $234 million of net revenue and $92
million of adjusted EBITDAR1.
The transaction is expected to close in the first half of 2022, subject to regulatory approvals and other customary closing conditions.
MGM RESORTS INTERNAT IONAL1 Calculated as EBITDA before rent, impairment loss and pre-opening expenses, and after corporate expenses
M G M R E S O R T S S E L E C T E D A S O S A K A ’ S I N T E G R A T E D R E S O R T
P A R T N E R I N J A P A N
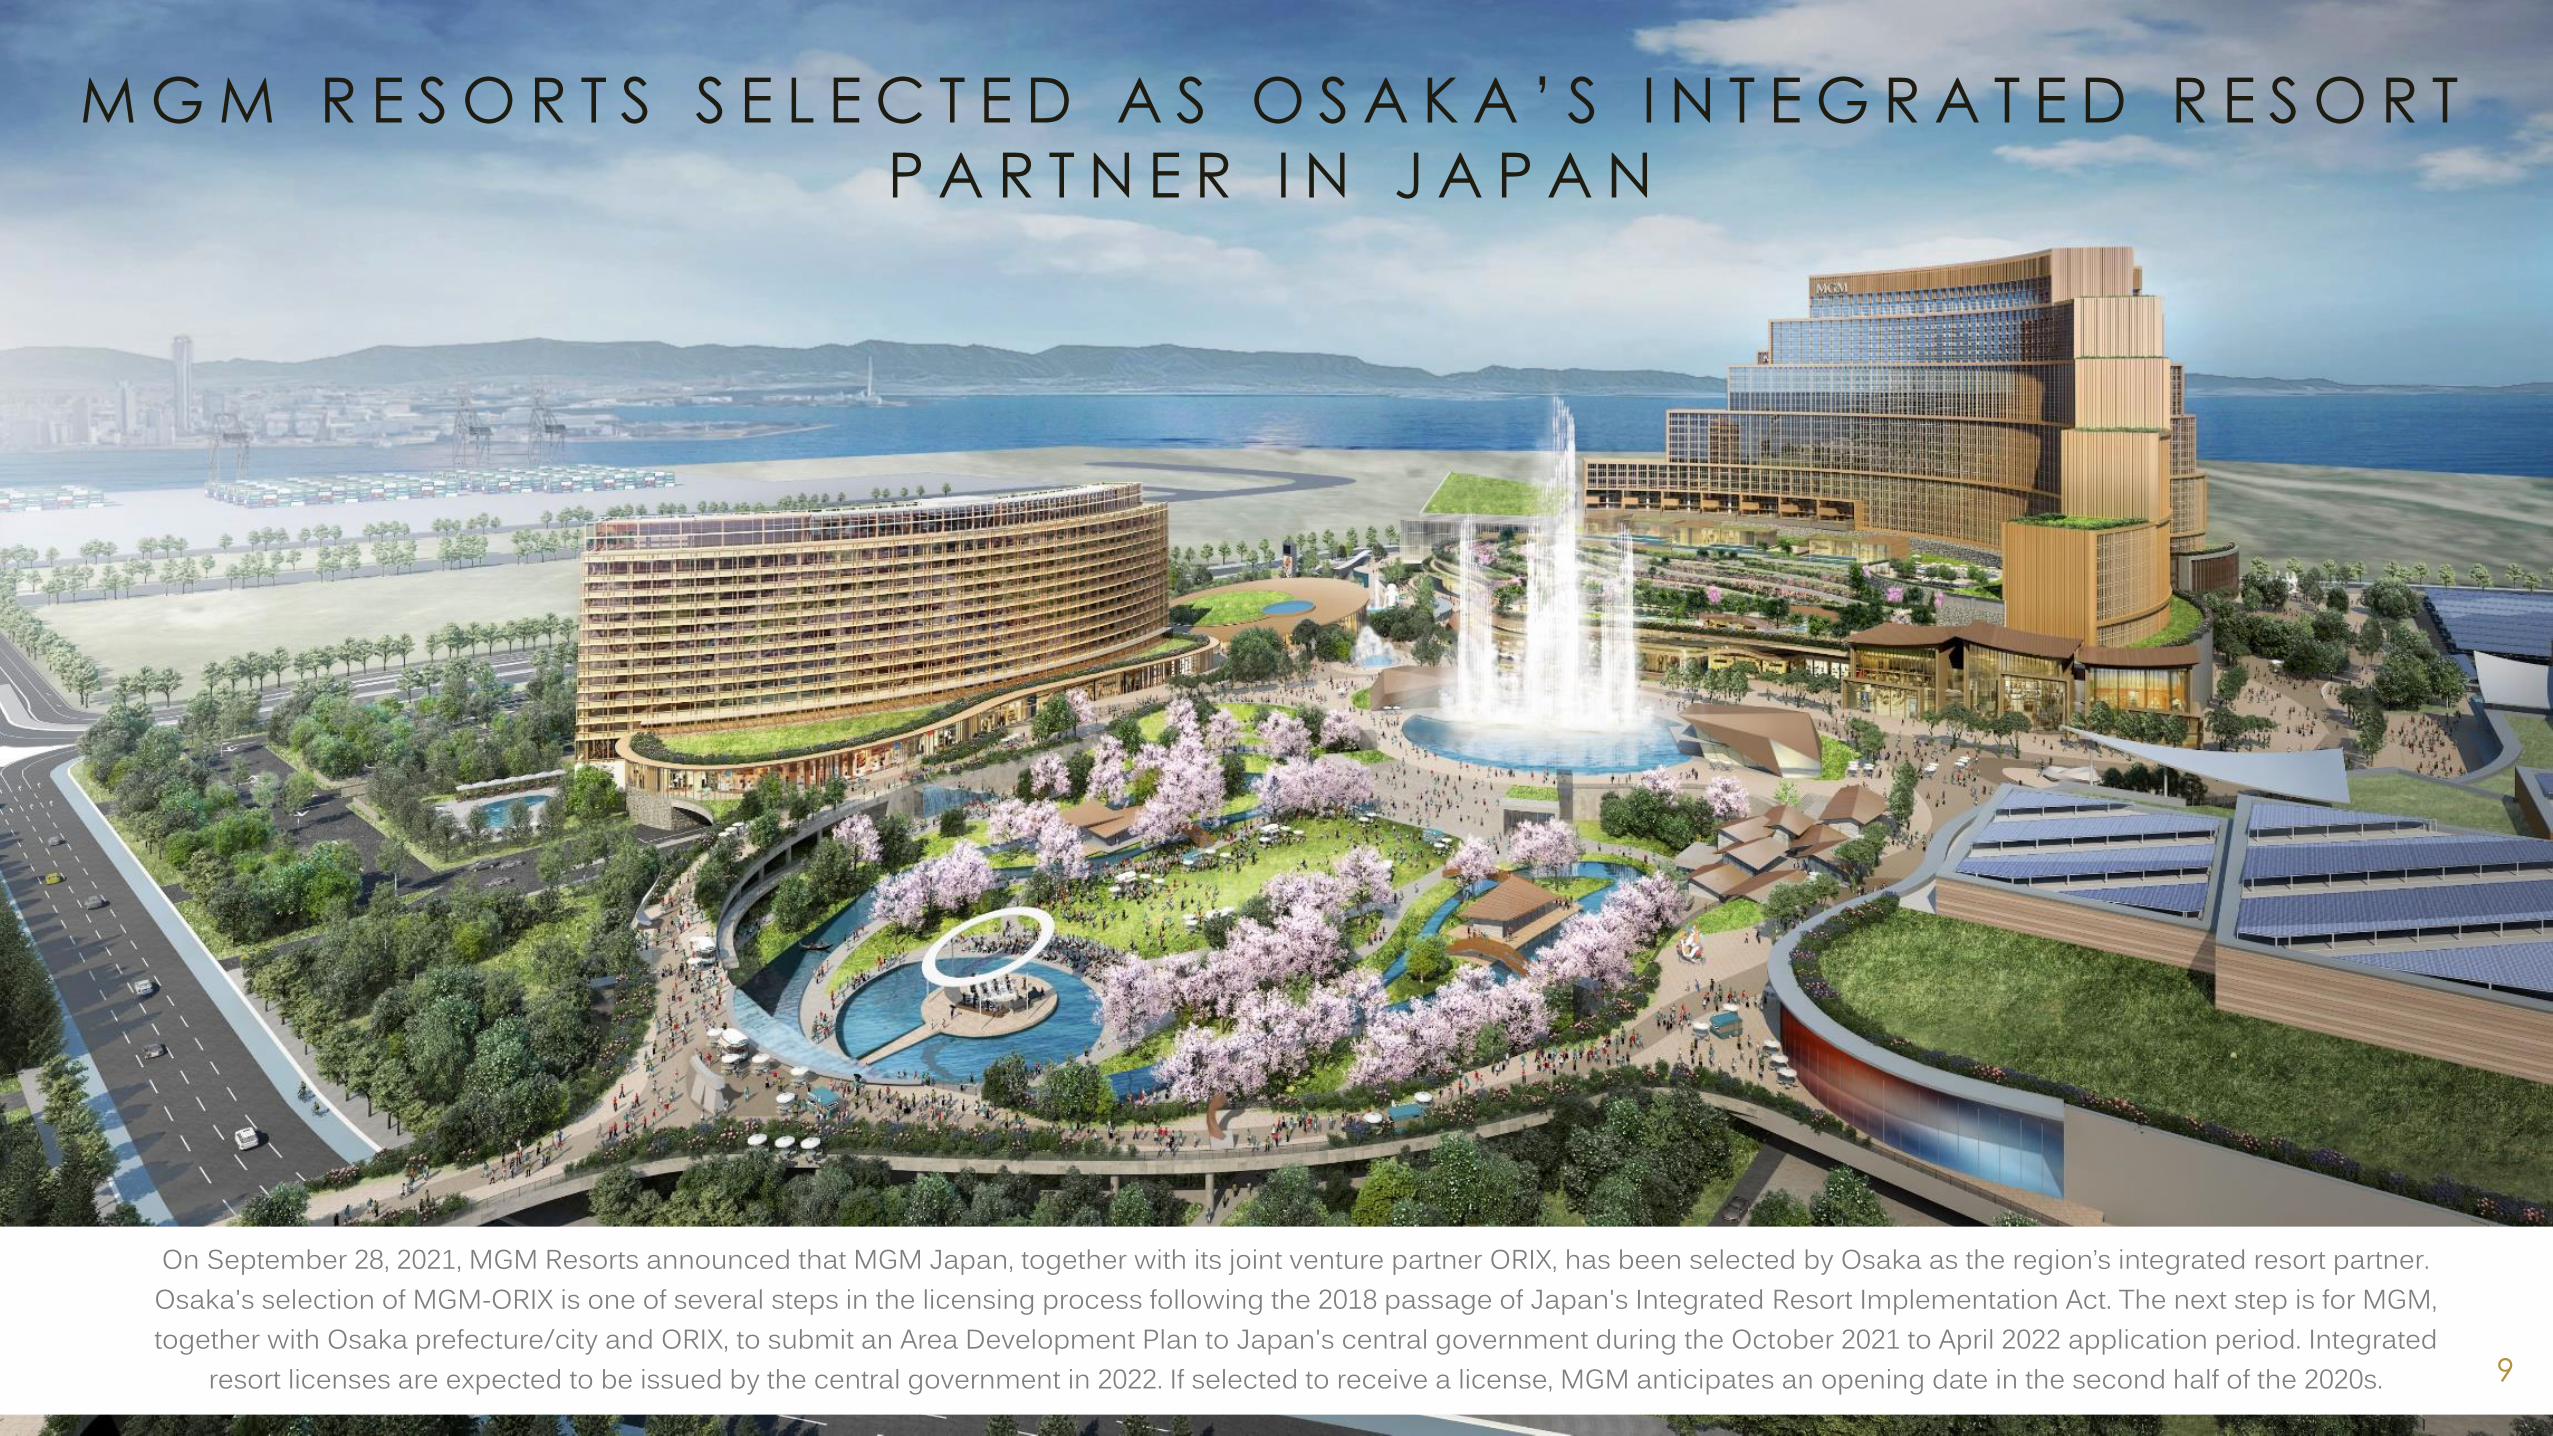
On September 28, 2021, MGM Resorts announced that MGM Japan, together with its joint venture partner ORIX, has been selected by Osaka as the region’s integrated resort partner. Osaka's selection of MGM-ORIX is one of several steps in the licensing process following the 2018 passage of Japan's Integrated Resort Implementation Act. The next step is for MGM, together with Osaka prefecture/city and ORIX, to submit an Area Development Plan to Japan's central government during the October 2021 to April 2022 application period. Integrated
resort licenses are expected to be issued by the central government in 2022. If selected to receive a license, MGM anticipates an opening date in the second half of the 2020s. 9
10
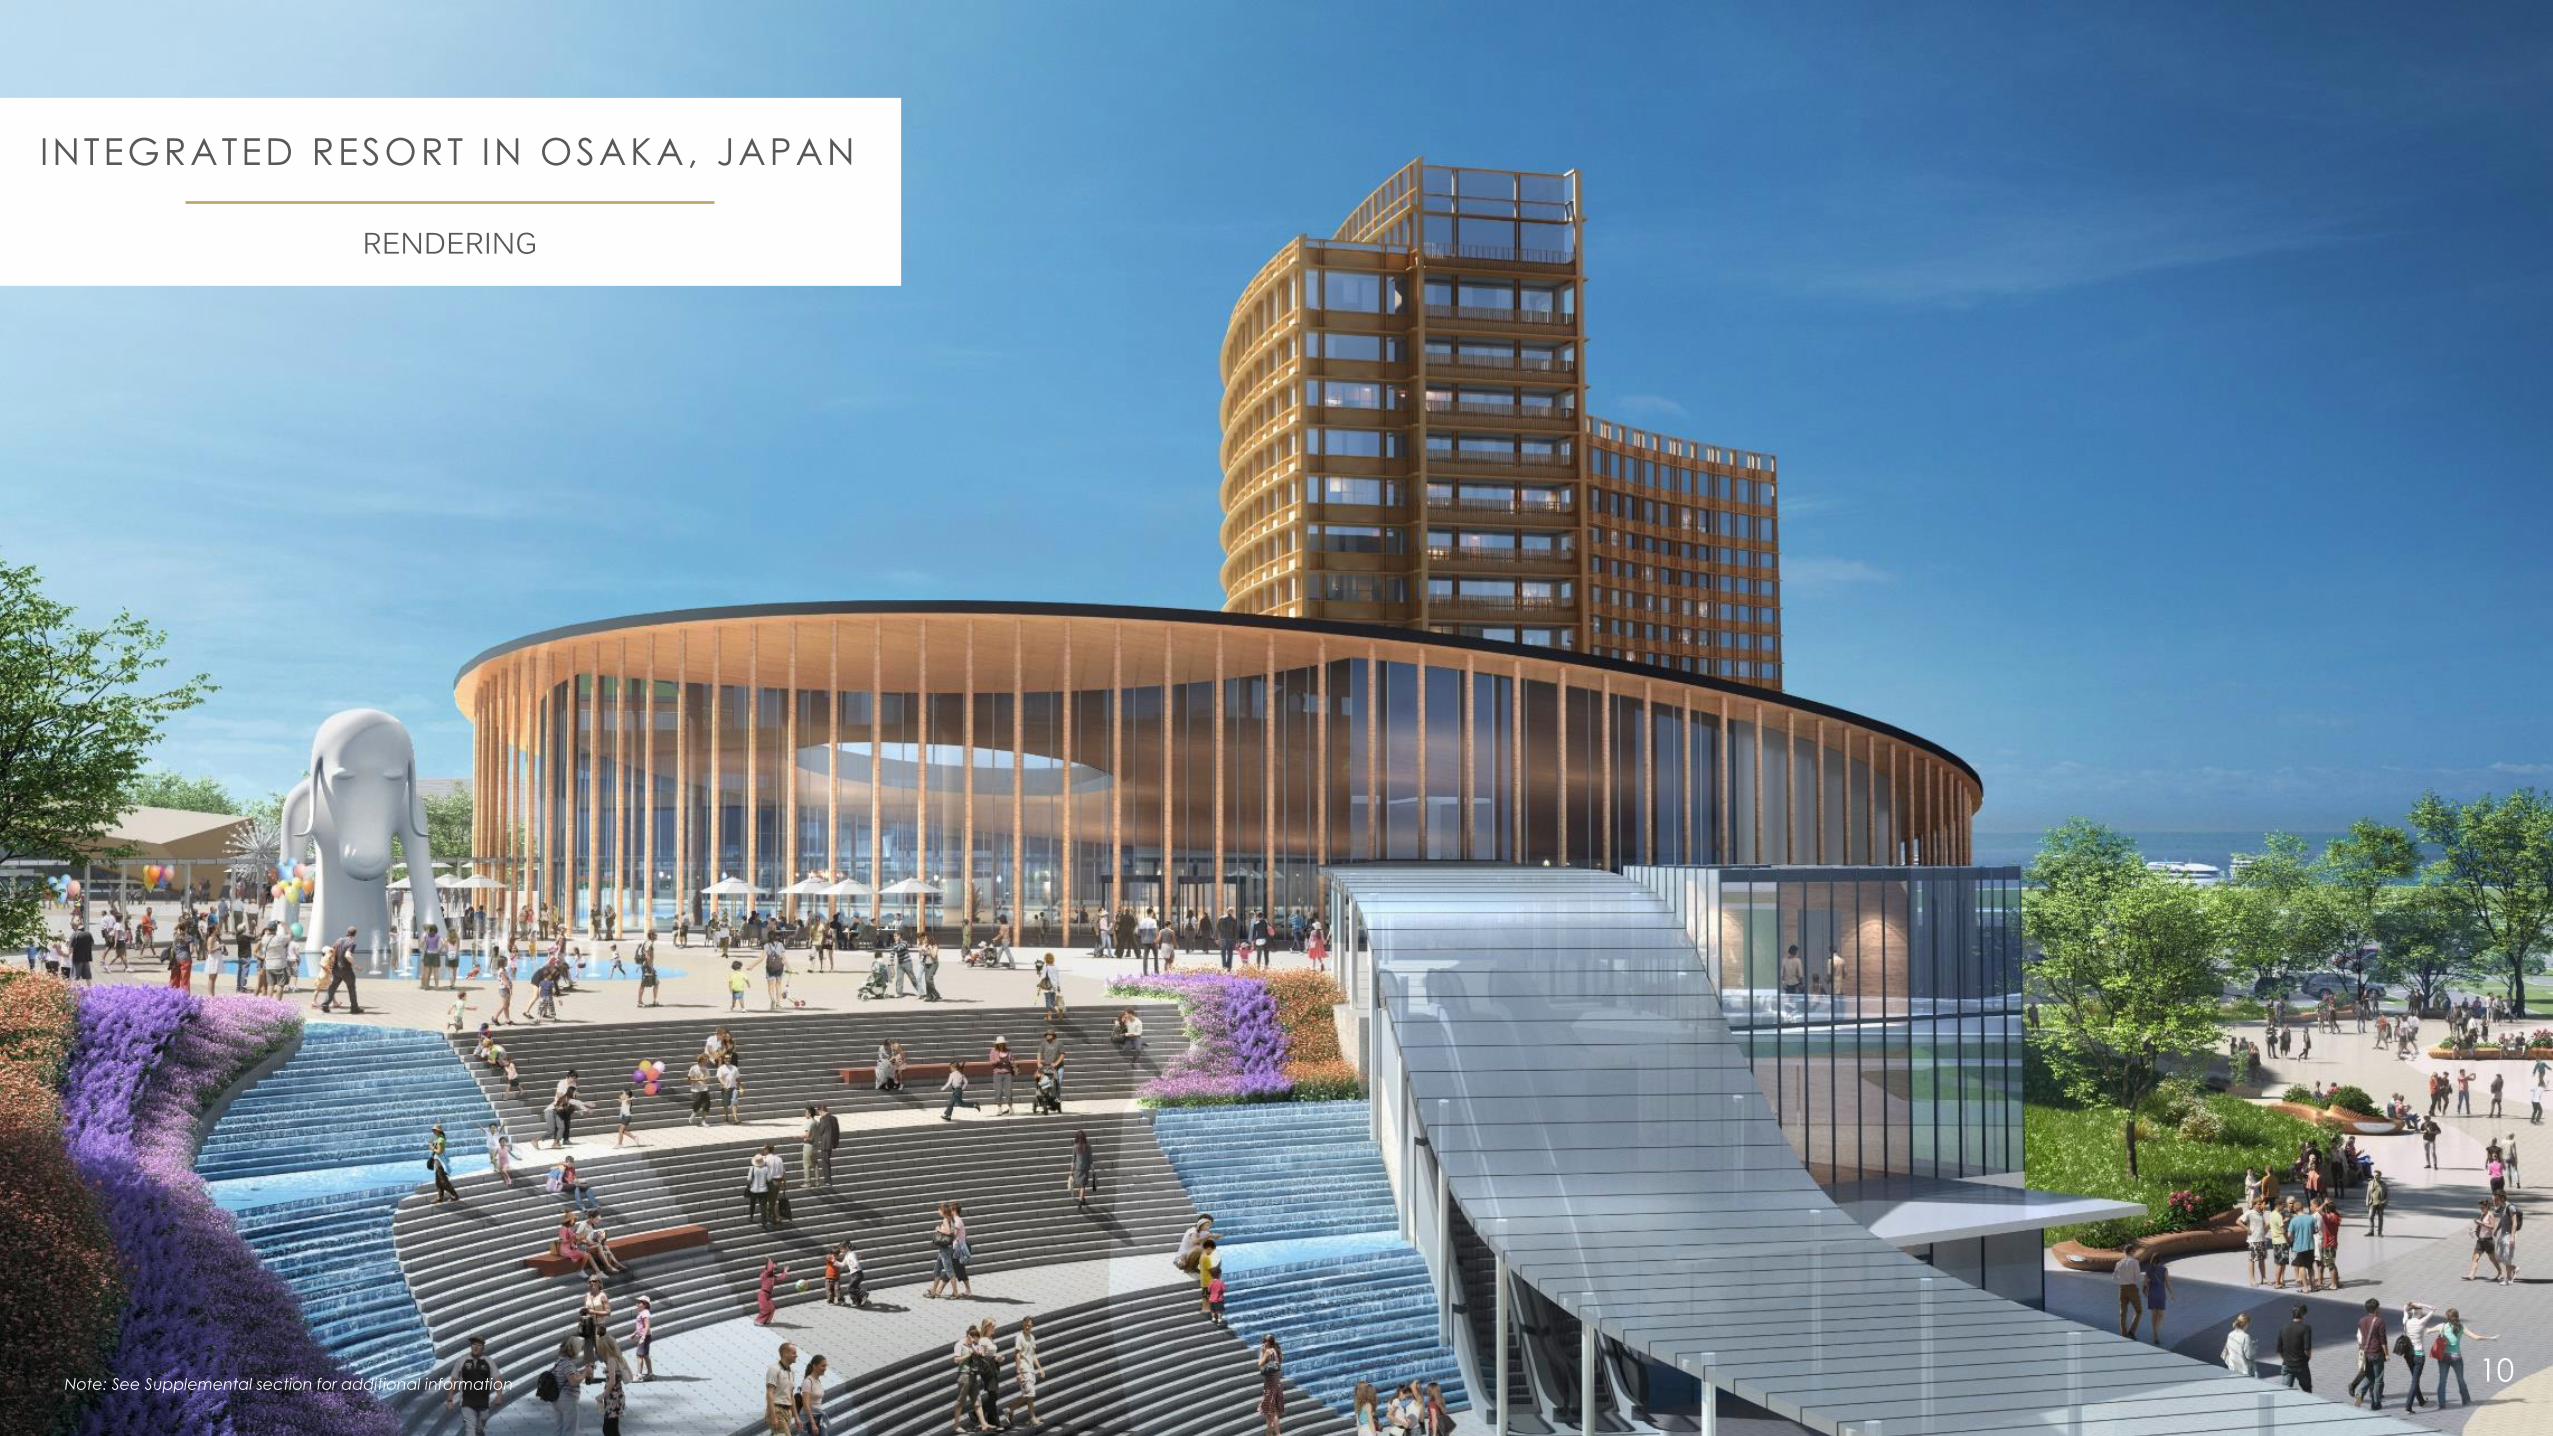
RENDERING
INTEGRATED RESORT IN OSAKA, JAPAN
Note: See Supplemental section for additional information
11
• 3 Q 2 0 2 1 H I G H L I G H T S
• 3 Q 2 0 2 1 F I N A N C I A L R E S U L T S
• B E T M G M
• S U P P L E M E N T A L
T A B L E O F
C O N T E N T S
MGM RESORTS INTERNAT IONAL
3 Q 2 0 2 1 – L A S V E G A S S T R I P
12
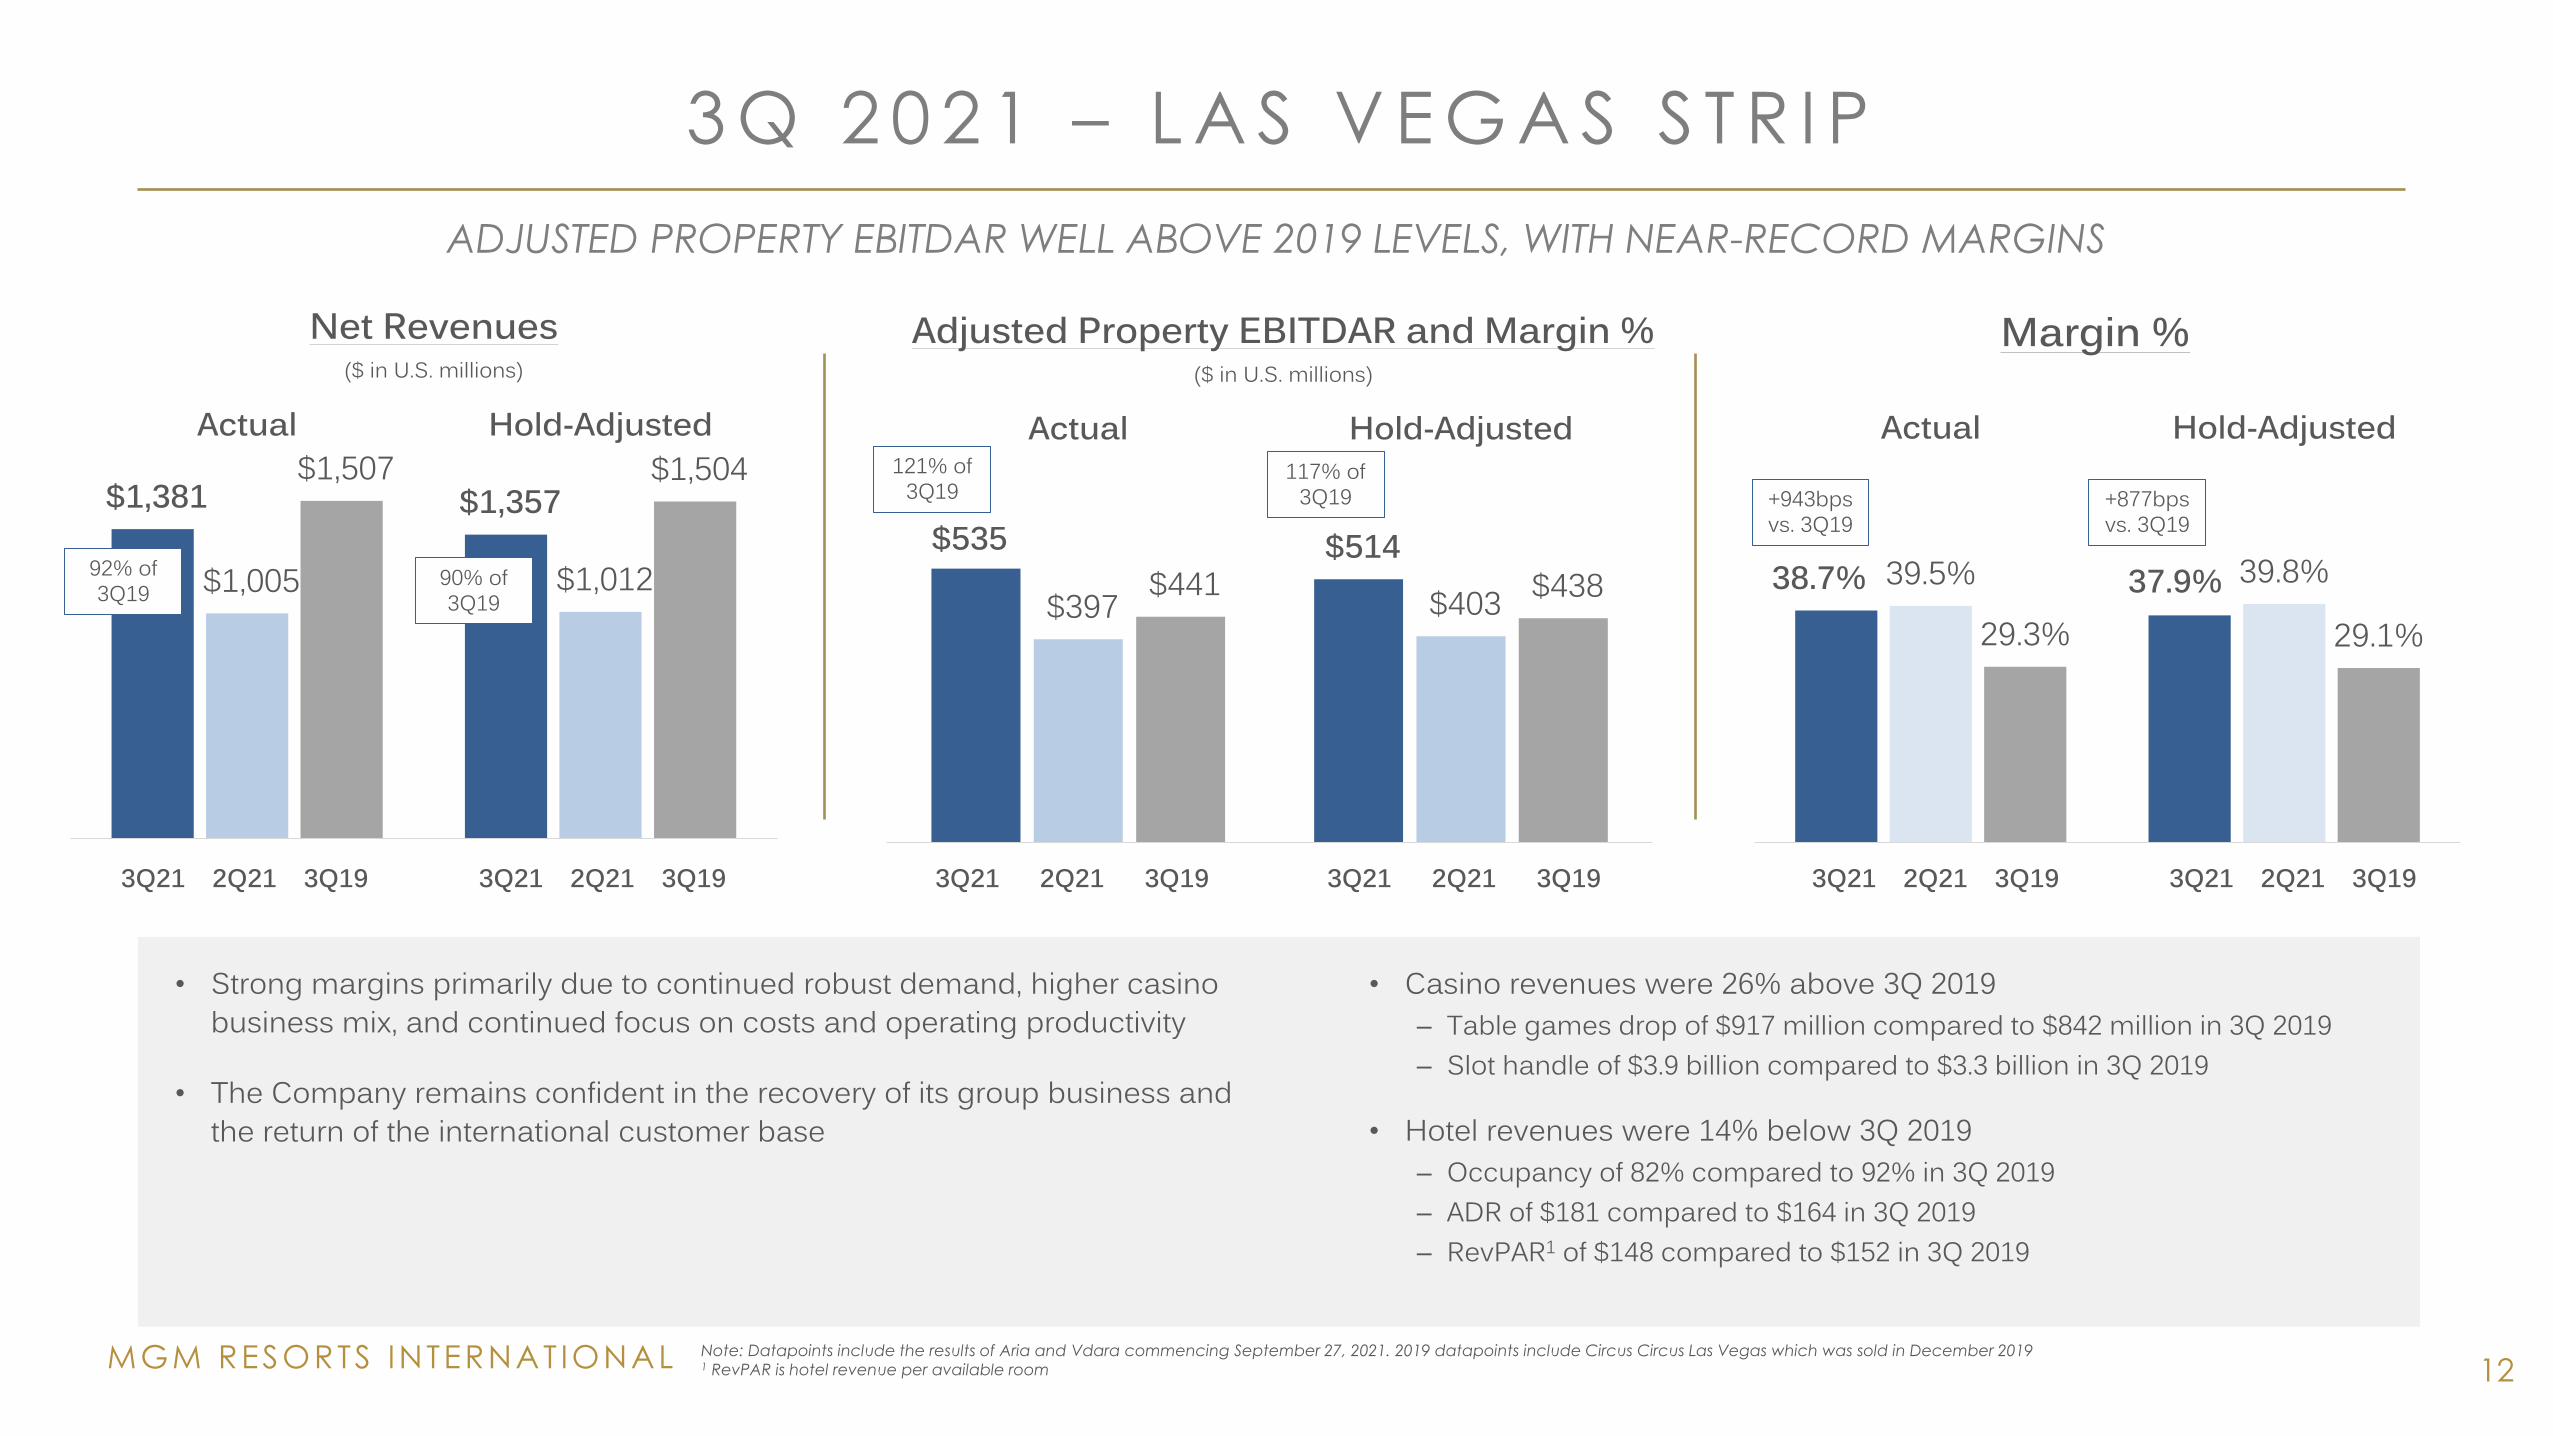
• Strong margins primarily due to continued robust demand, higher casino business mix, and continued focus on costs and operating productivity
• The Company remains confident in the recovery of its group business and the return of the international customer base
Note: Datapoints include the results of Aria and Vdara commencing September 27, 2021. 2019 datapoints include Circus Circus Las Vegas which was sold in December 2019 1 RevPAR is hotel revenue per available room
• Casino revenues were 26% above 3Q 2019– Table games drop of $917 million compared to $842 million in 3Q 2019– Slot handle of $3.9 billion compared to $3.3 billion in 3Q 2019
• Hotel revenues were 14% below 3Q 2019– Occupancy of 82% compared to 92% in 3Q 2019– ADR of $181 compared to $164 in 3Q 2019– RevPAR1 of $148 compared to $152 in 3Q 2019
ADJUSTED PROPERTY EBITDAR WELL ABOVE 2019 LEVELS, WITH NEAR-RECORD MARGINS
$535 $514
$397 $403 $441 $438
Actual Hold-Adjusted
Adjusted Property EBITDAR and Margin % ($ in U.S. millions)
$1,381 $1,357
$1,005 $1,012
$1,507 $1,504 Actual Hold-Adjusted
Net Revenues($ in U.S. millions)
121% of 3Q19
3Q21 2Q21 3Q19 3Q21 2Q21 3Q19 3Q21 2Q21 3Q19 3Q21 2Q21 3Q19 3Q21 2Q21 3Q19 3Q21 2Q21 3Q19
90% of 3Q19
92% of 3Q19 38.7% 37.9%39.5% 39.8%
29.3% 29.1%
Actual Hold-Adjusted
Margin %
117% of 3Q19 +943bps
vs. 3Q19+877bps vs. 3Q19
MGM RESORTS INTERNAT IONAL
3 Q 2 0 2 1 – R E G I O N A L O P E R A T I O N S
13
99% of 3Q19
129% of 3Q19
+886 bps vs. 3Q19
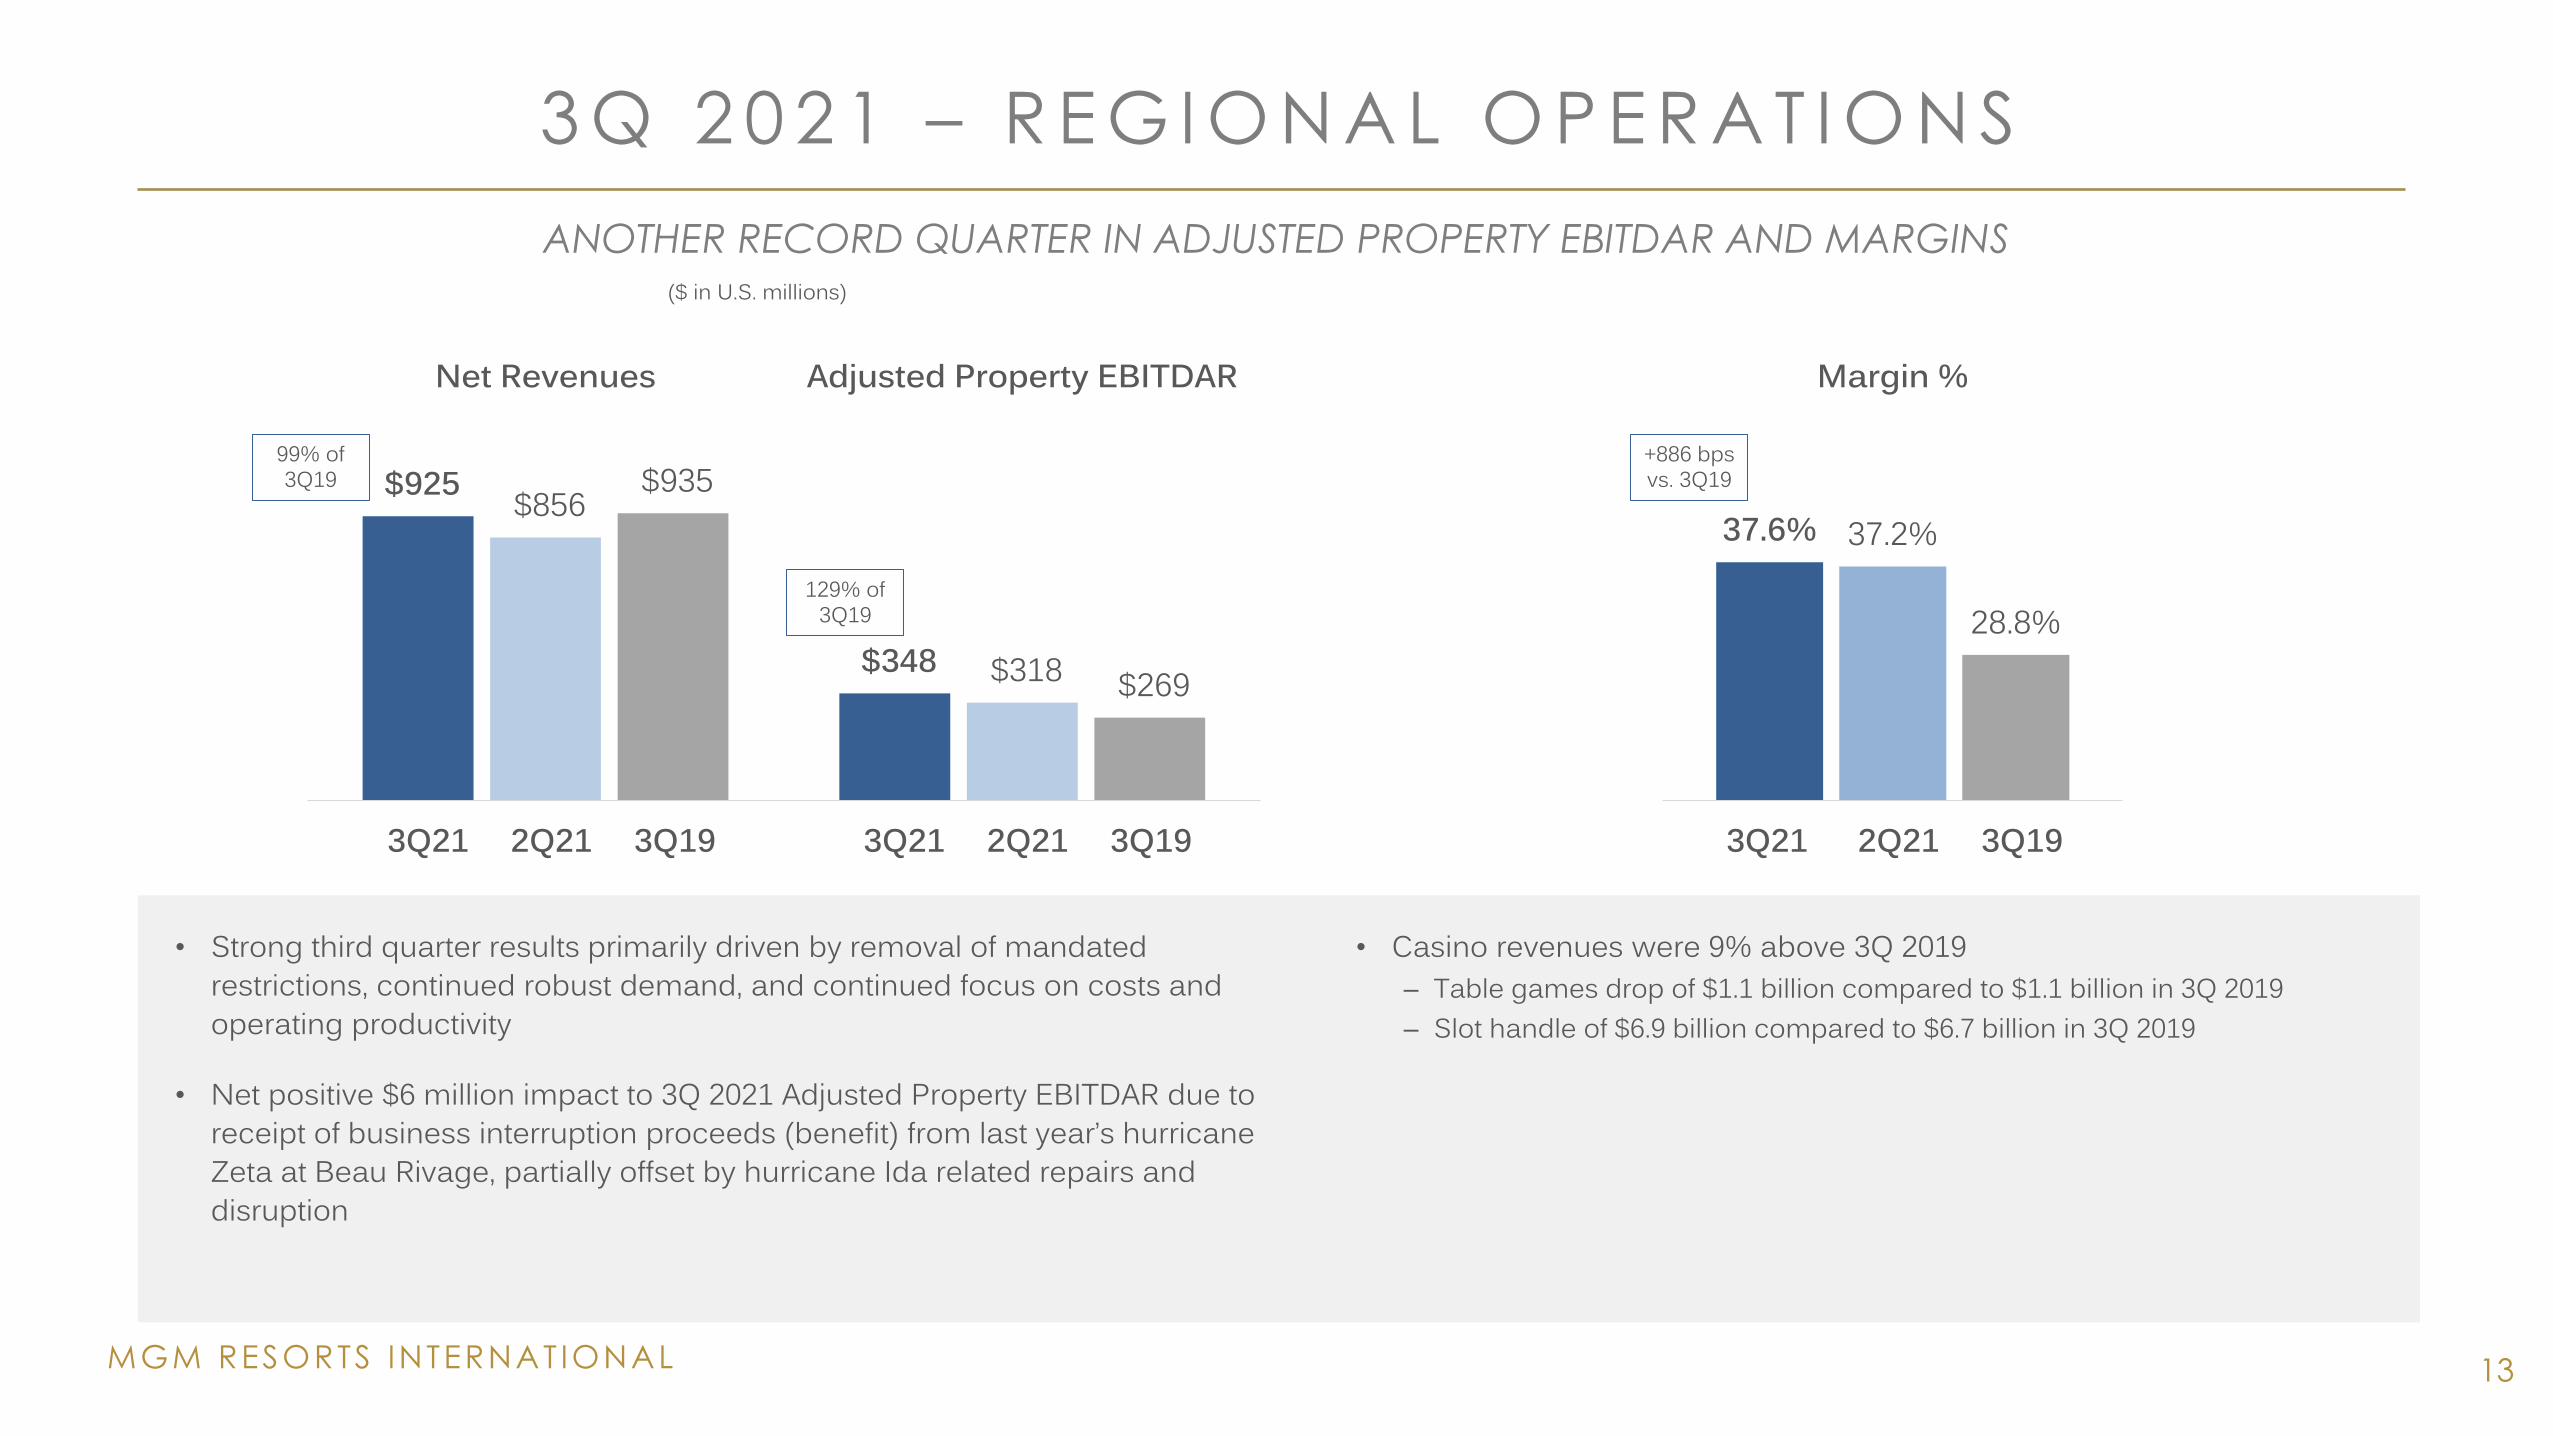
• Strong third quarter results primarily driven by removal of mandated restrictions, continued robust demand, and continued focus on costs and operating productivity
• Net positive $6 million impact to 3Q 2021 Adjusted Property EBITDAR due to receipt of business interruption proceeds (benefit) from last year’s hurricane Zeta at Beau Rivage, partially offset by hurricane Ida related repairs and disruption
• Casino revenues were 9% above 3Q 2019– Table games drop of $1.1 billion compared to $1.1 billion in 3Q 2019– Slot handle of $6.9 billion compared to $6.7 billion in 3Q 2019
ANOTHER RECORD QUARTER IN ADJUSTED PROPERTY EBITDAR AND MARGINS
3Q21 2Q21 3Q193Q21 2Q21 3Q19 3Q21 2Q21 3Q19
$925
$348
$856
$318
$935
$269
Net Revenues Adjusted Property EBITDAR
($ in U.S. millions)
37.6% 37.2%
28.8%
Margin %
MGM RESORTS INTERNAT IONAL
3 Q 2 0 2 1 – C I T Y C E N T E R
14
1. STRUCTURE TODAY (73% OWNERSHIP OF OP)
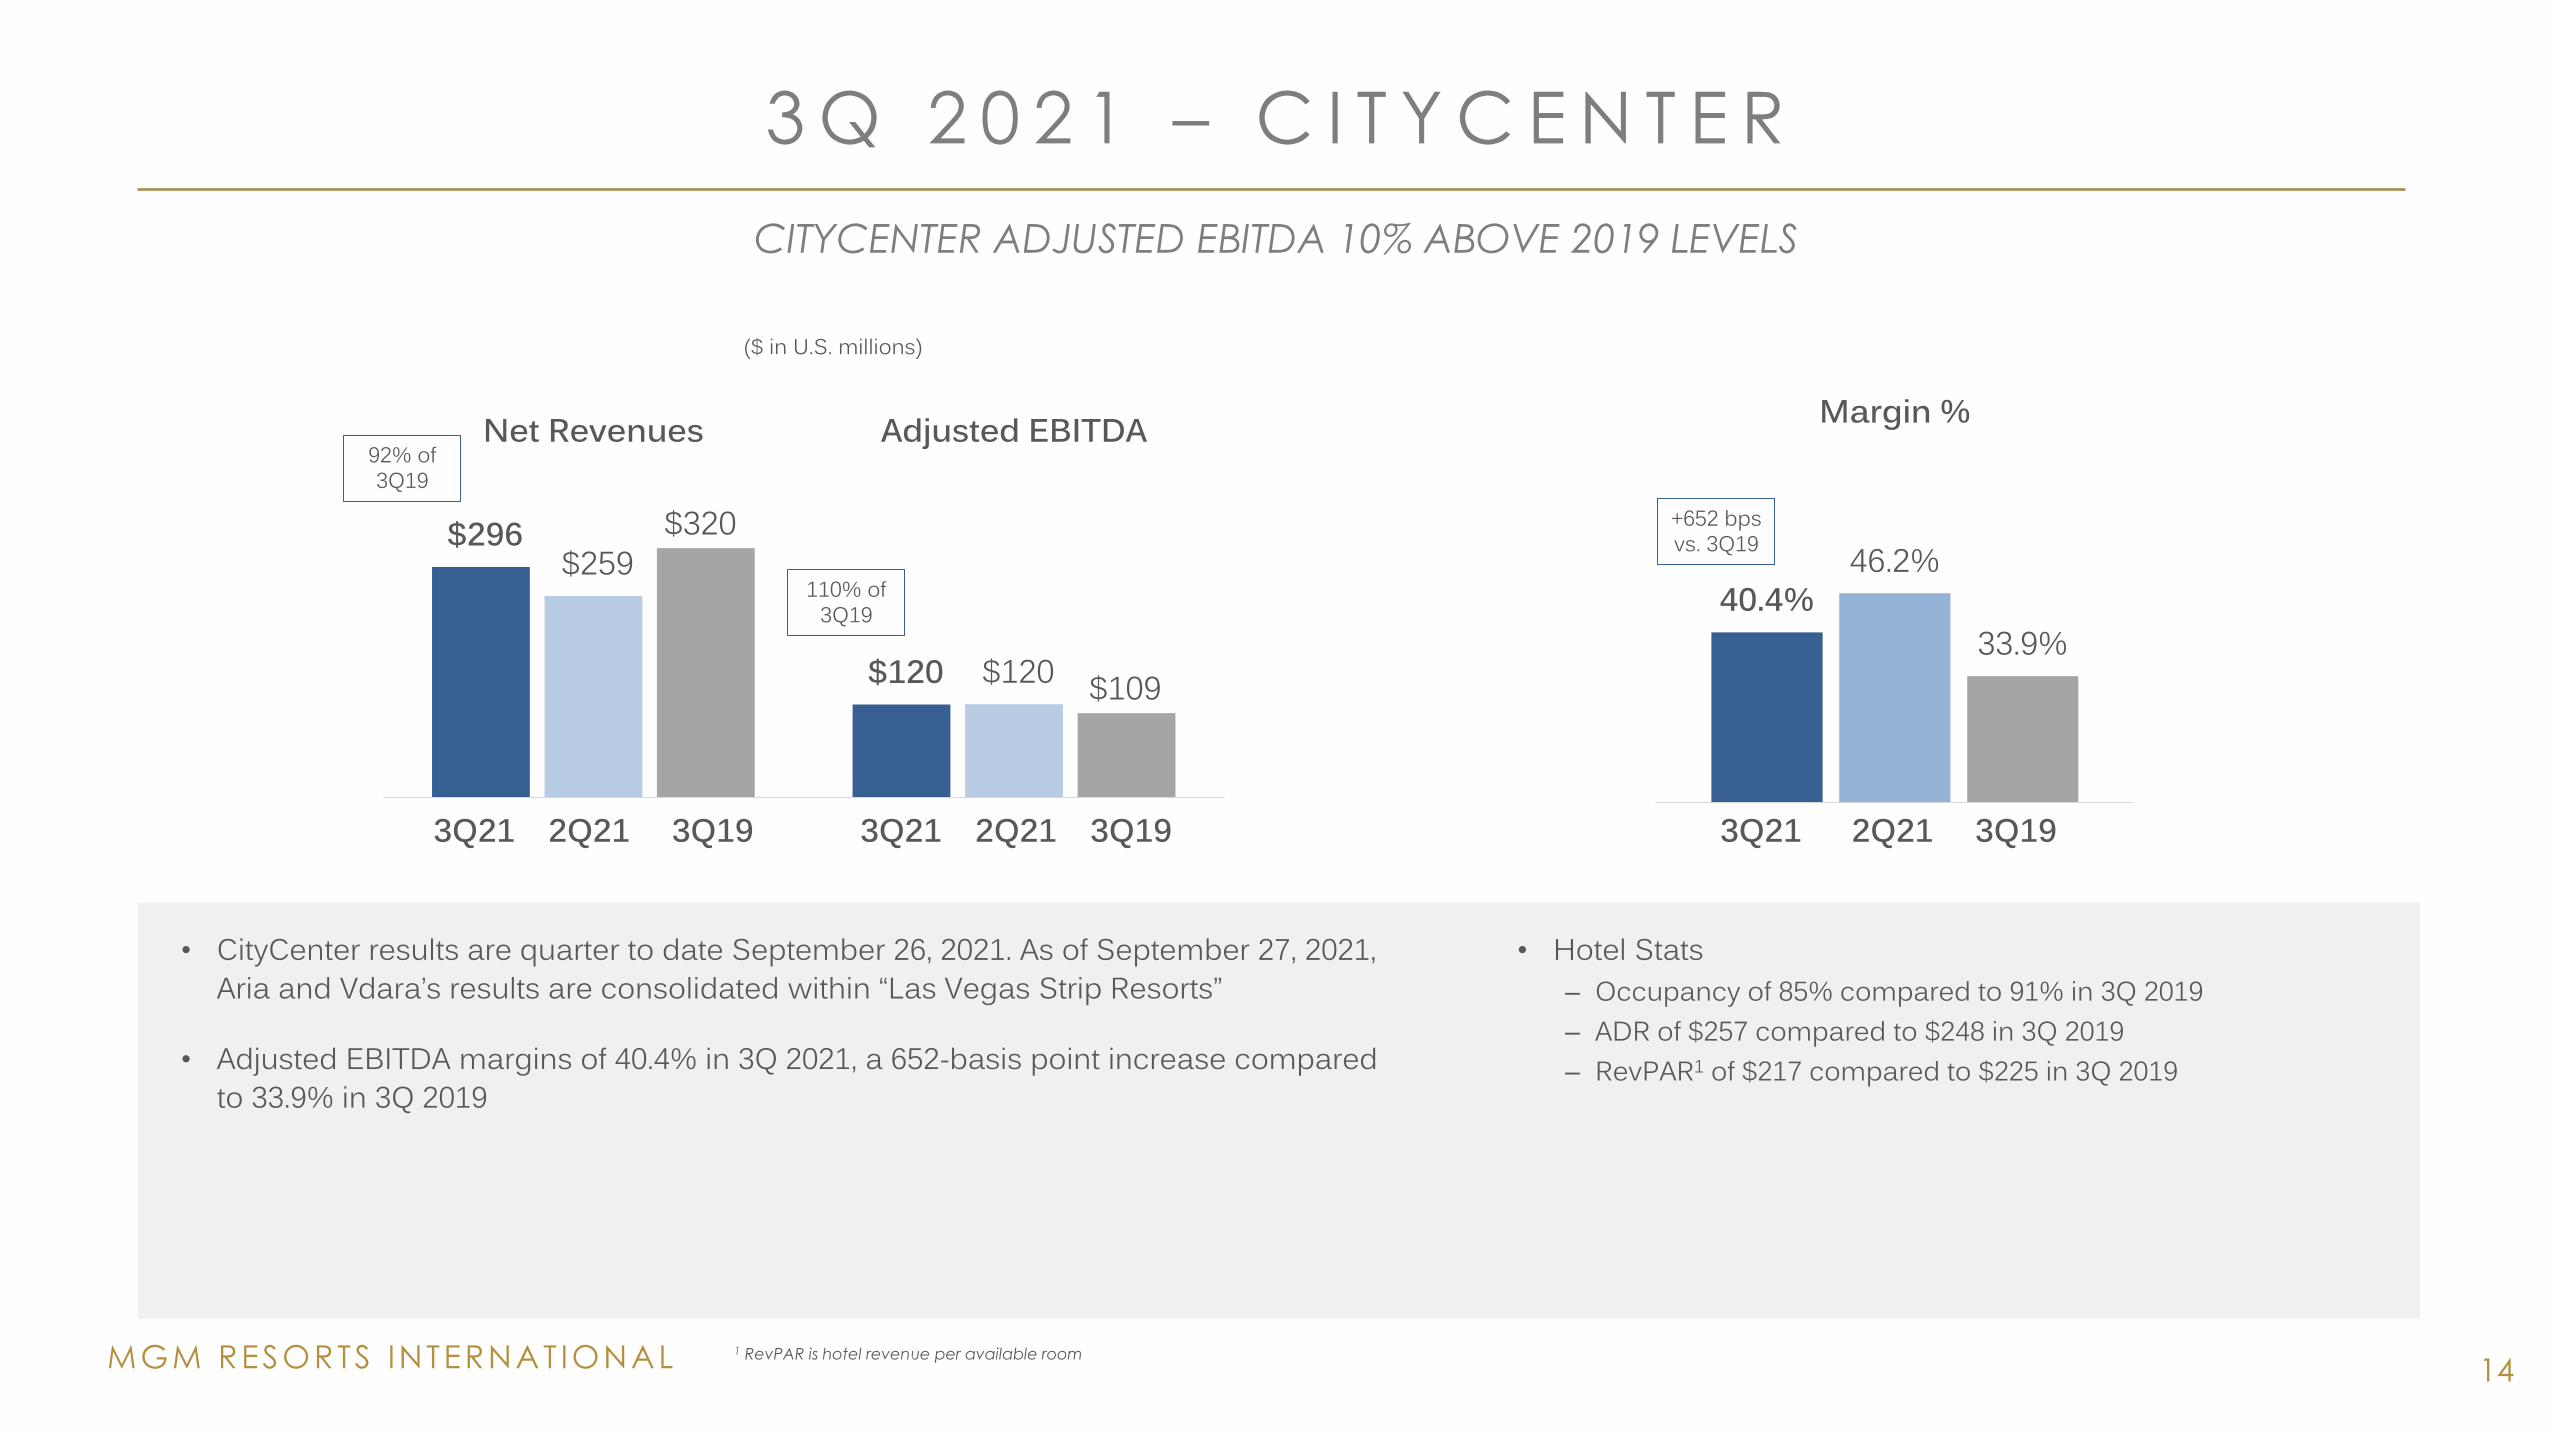
• CityCenter results are quarter to date September 26, 2021. As of September 27, 2021, Aria and Vdara’s results are consolidated within “Las Vegas Strip Resorts”
• Adjusted EBITDA margins of 40.4% in 3Q 2021, a 652-basis point increase compared to 33.9% in 3Q 2019
1 RevPAR is hotel revenue per available room
• Hotel Stats– Occupancy of 85% compared to 91% in 3Q 2019– ADR of $257 compared to $248 in 3Q 2019 – RevPAR1 of $217 compared to $225 in 3Q 2019
92% of 3Q19
110% of 3Q19
CITYCENTER ADJUSTED EBITDA 10% ABOVE 2019 LEVELS
+652 bps vs. 3Q19
3Q21 2Q21 3Q19 3Q21 2Q21 3Q19
$296
$120
$259
$120
$320
$109
Net Revenues Adjusted EBITDA
($ in U.S. millions)
40.4%46.2%
33.9%
Margin %
3Q21 2Q21 3Q19
MGM RESORTS INTERNAT IONAL
3 Q 2 0 2 1 – M G M C H I N A
15
3Q21 2Q21 3Q19 3Q21 2Q21 3Q19
4% of 3Q19
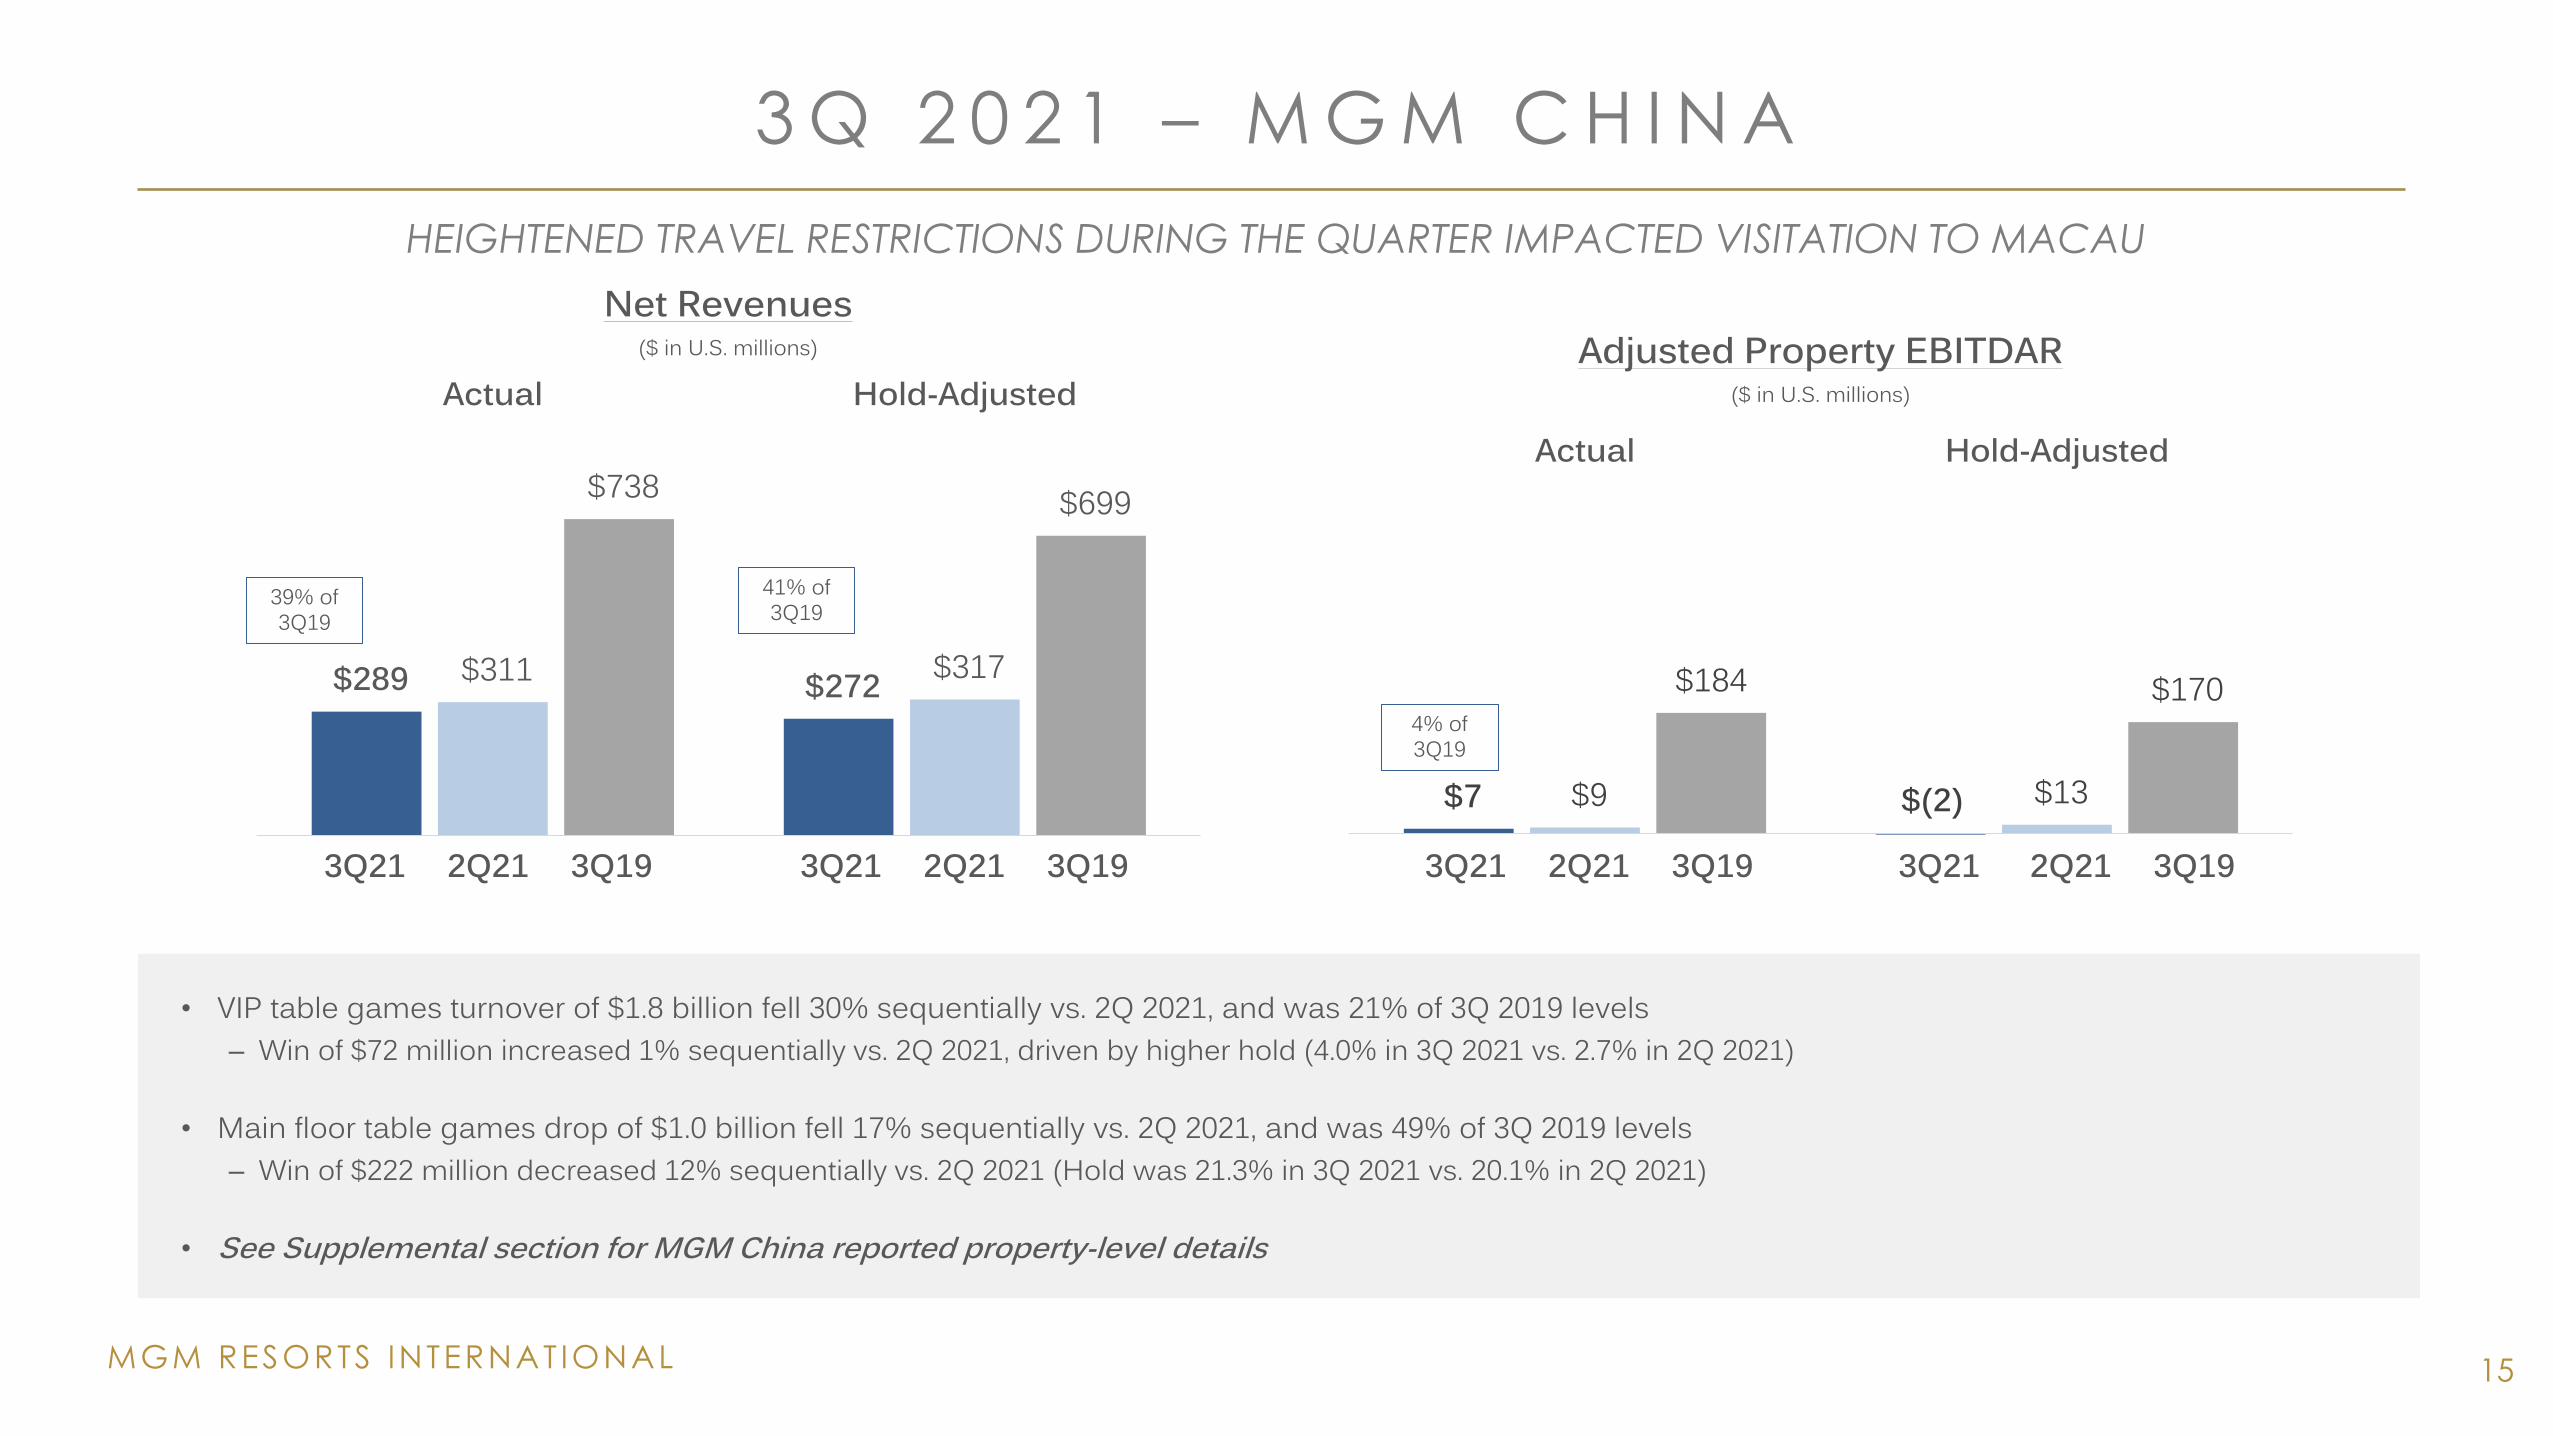
• VIP table games turnover of $1.8 billion fell 30% sequentially vs. 2Q 2021, and was 21% of 3Q 2019 levels– Win of $72 million increased 1% sequentially vs. 2Q 2021, driven by higher hold (4.0% in 3Q 2021 vs. 2.7% in 2Q 2021)
• Main floor table games drop of $1.0 billion fell 17% sequentially vs. 2Q 2021, and was 49% of 3Q 2019 levels– Win of $222 million decreased 12% sequentially vs. 2Q 2021 (Hold was 21.3% in 3Q 2021 vs. 20.1% in 2Q 2021)
• See Supplemental section for MGM China reported property-level details
HEIGHTENED TRAVEL RESTRICTIONS DURING THE QUARTER IMPACTED VISITATION TO MACAU
3Q21 2Q21 3Q19 3Q21 2Q21 3Q19
$289 $272 $311 $317
$738 $699
Actual Hold-Adjusted
Net Revenues ($ in U.S. millions)
$7 $(2)$9 $13
$184 $170
Actual Hold-Adjusted
Adjusted Property EBITDAR ($ in U.S. millions)
41% of 3Q1939% of
3Q19
MGM RESORTS INTERNAT IONAL
M G M C H I N A ’ S M A R K E T O U T P E R F O R M A N C E
16
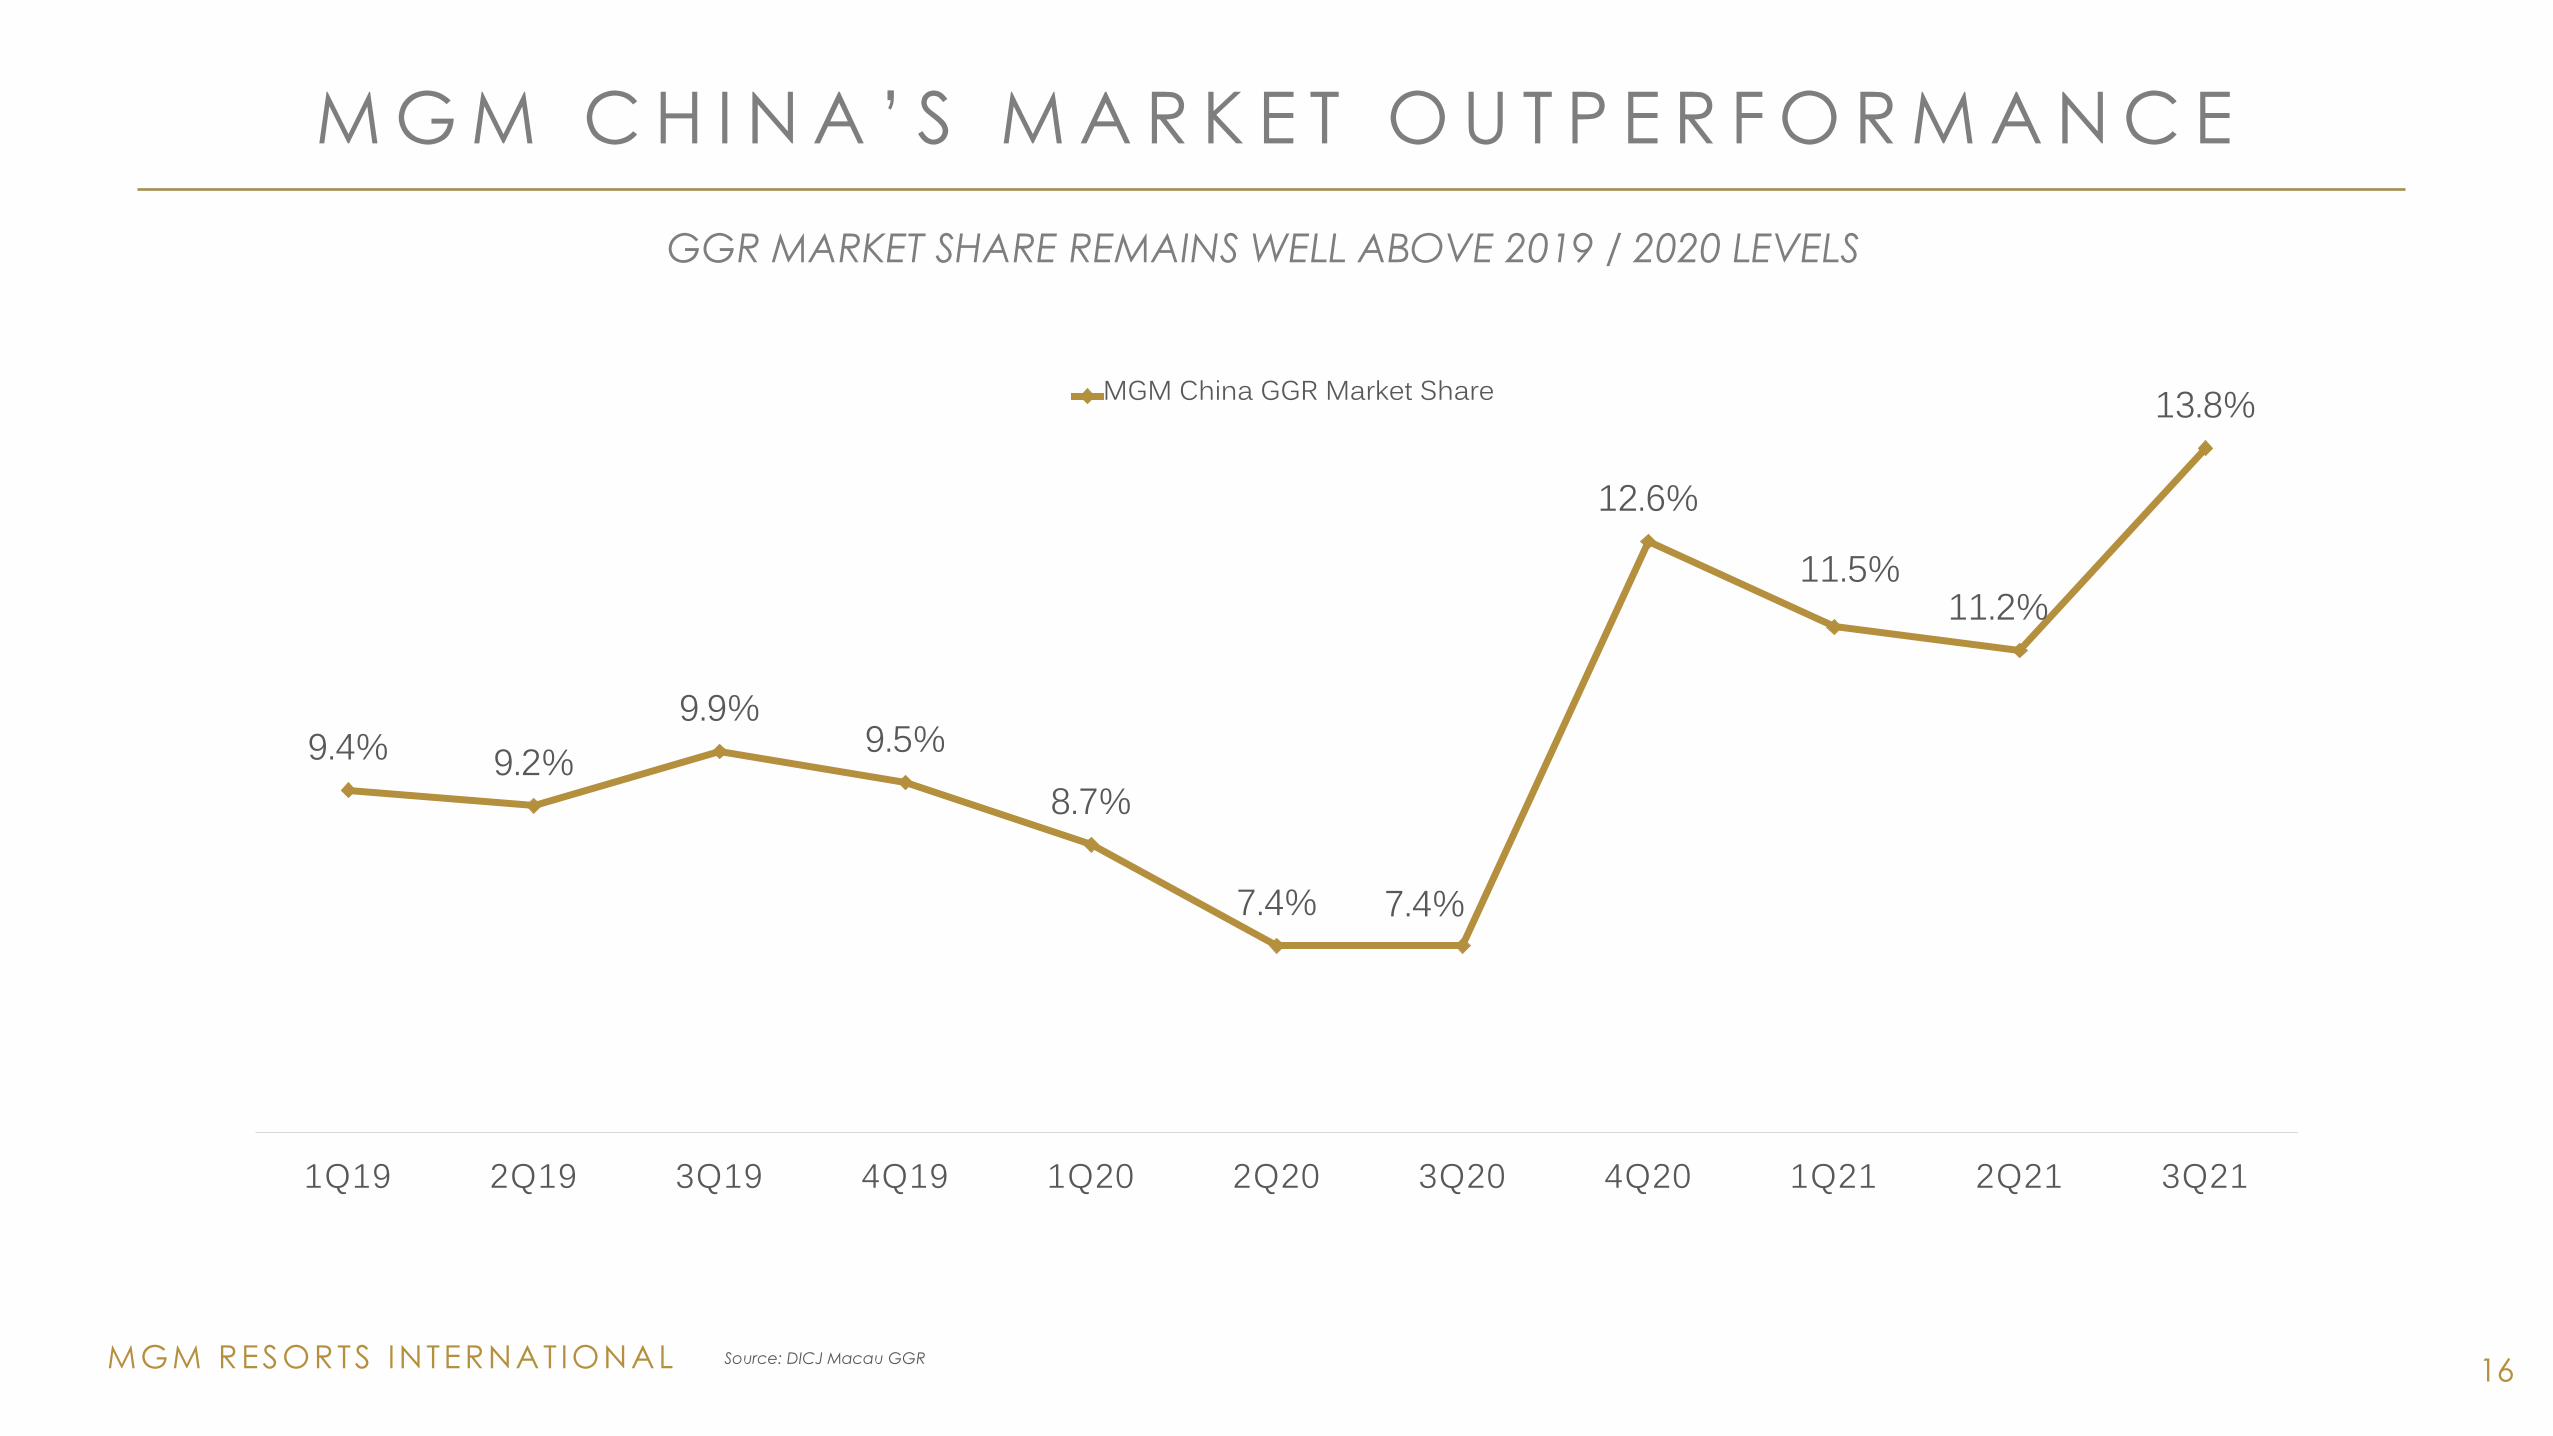
9.4% 9.2%9.9%
9.5%8.7%
7.4% 7.4%
12.6%
11.5%11.2%
13.8%
1Q19 2Q19 3Q19 4Q19 1Q20 2Q20 3Q20 4Q20 1Q21 2Q21 3Q21
MGM China GGR Market Share
GGR MARKET SHARE REMAINS WELL ABOVE 2019 / 2020 LEVELS
Source: DICJ Macau GGR
MGM RESORTS INTERNAT IONAL
3 Q 2 0 2 1 F I N A N C I A L I T E M S
17
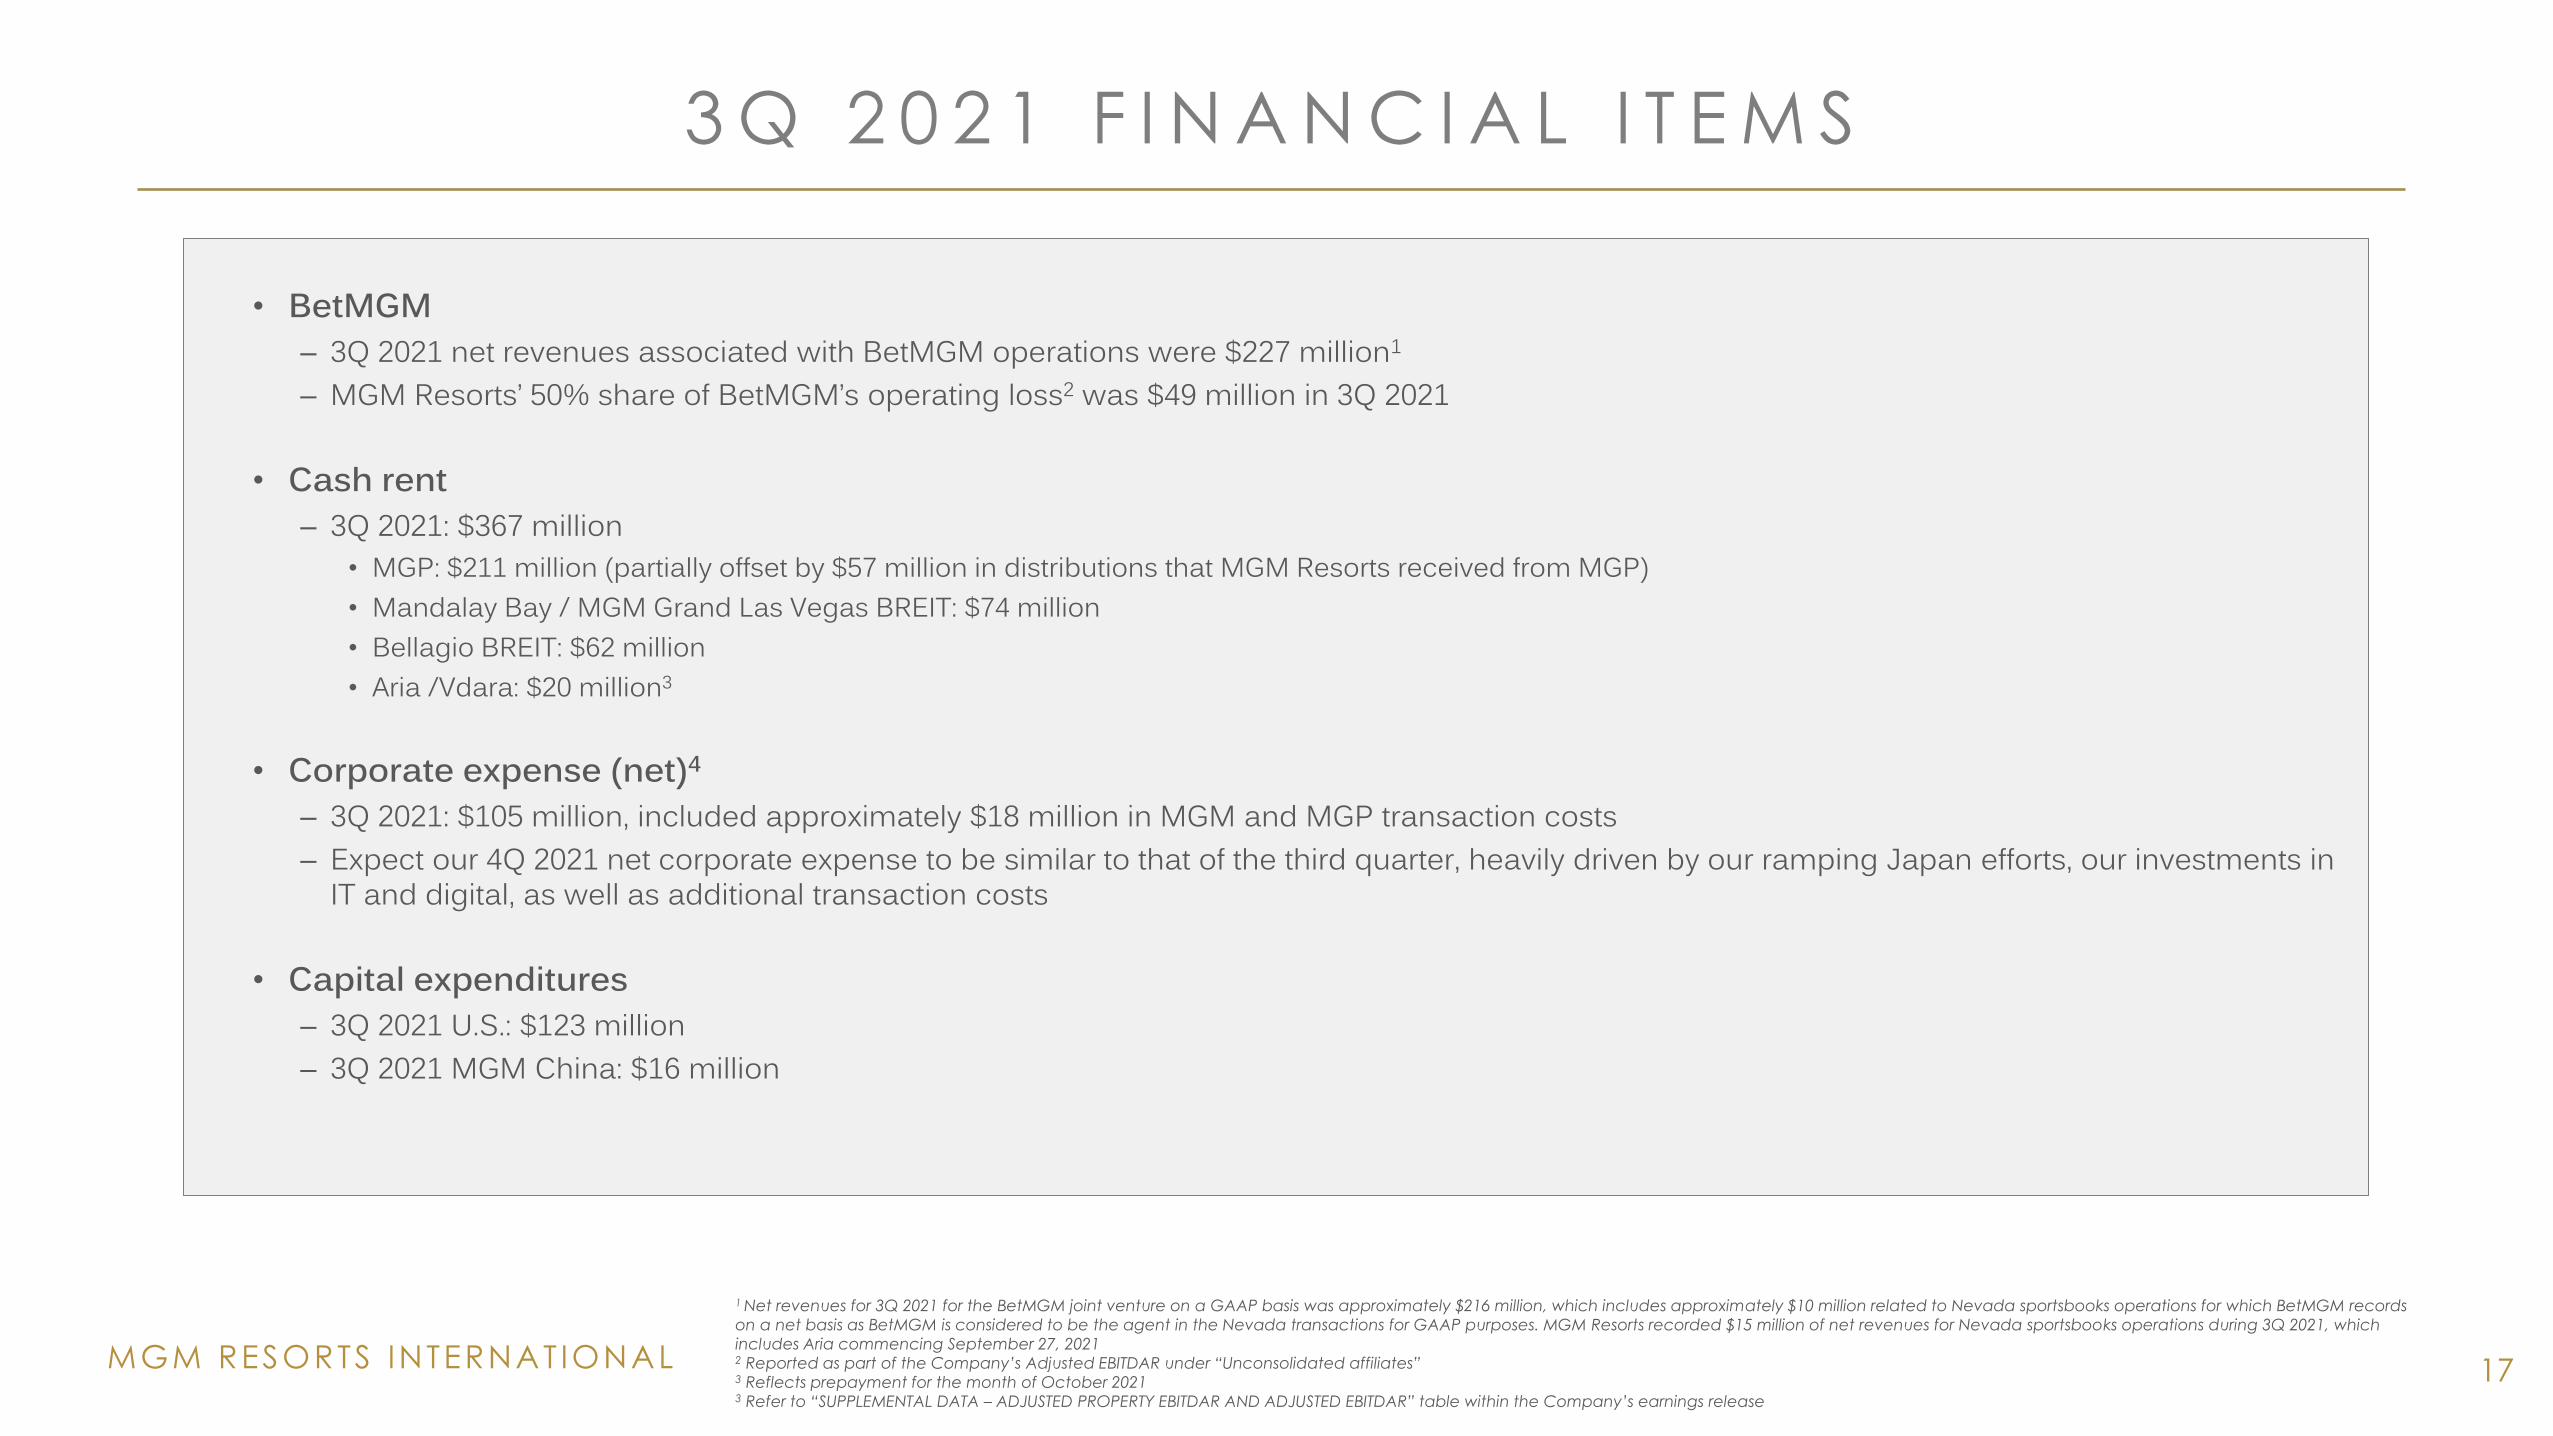
• BetMGM– 3Q 2021 net revenues associated with BetMGM operations were $227 million1
– MGM Resorts’ 50% share of BetMGM’s operating loss2 was $49 million in 3Q 2021
• Cash rent– 3Q 2021: $367 million
• MGP: $211 million (partially offset by $57 million in distributions that MGM Resorts received from MGP)• Mandalay Bay / MGM Grand Las Vegas BREIT: $74 million• Bellagio BREIT: $62 million• Aria /Vdara: $20 million3
• Corporate expense (net)4
– 3Q 2021: $105 million, included approximately $18 million in MGM and MGP transaction costs– Expect our 4Q 2021 net corporate expense to be similar to that of the third quarter, heavily driven by our ramping Japan efforts, our investments in
IT and digital, as well as additional transaction costs
• Capital expenditures– 3Q 2021 U.S.: $123 million– 3Q 2021 MGM China: $16 million
1 Net revenues for 3Q 2021 for the BetMGM joint venture on a GAAP basis was approximately $216 million, which includes approximately $10 million related to Nevada sportsbooks operations for which BetMGM records
on a net basis as BetMGM is considered to be the agent in the Nevada transactions for GAAP purposes. MGM Resorts recorded $15 million of net revenues for Nevada sportsbooks operations during 3Q 2021, which
includes Aria commencing September 27, 20212 Reported as part of the Company’s Adjusted EBITDAR under “Unconsolidated affiliates”3 Reflects prepayment for the month of October 20213 Refer to “SUPPLEMENTAL DATA – ADJUSTED PROPERTY EBITDAR AND ADJUSTED EBITDAR” table within the Company’s earnings release
18
• 3 Q 2 0 2 1 H I G H L I G H T S
• 3 Q 2 0 2 1 F I N A N C I A L R E S U L T S
• B E T M G M
• S U P P L E M E N T A L
T A B L E O F
C O N T E N T S
MGM RESORTS INTERNAT IONAL
B E T M G M B Y T H E N U M B E R S
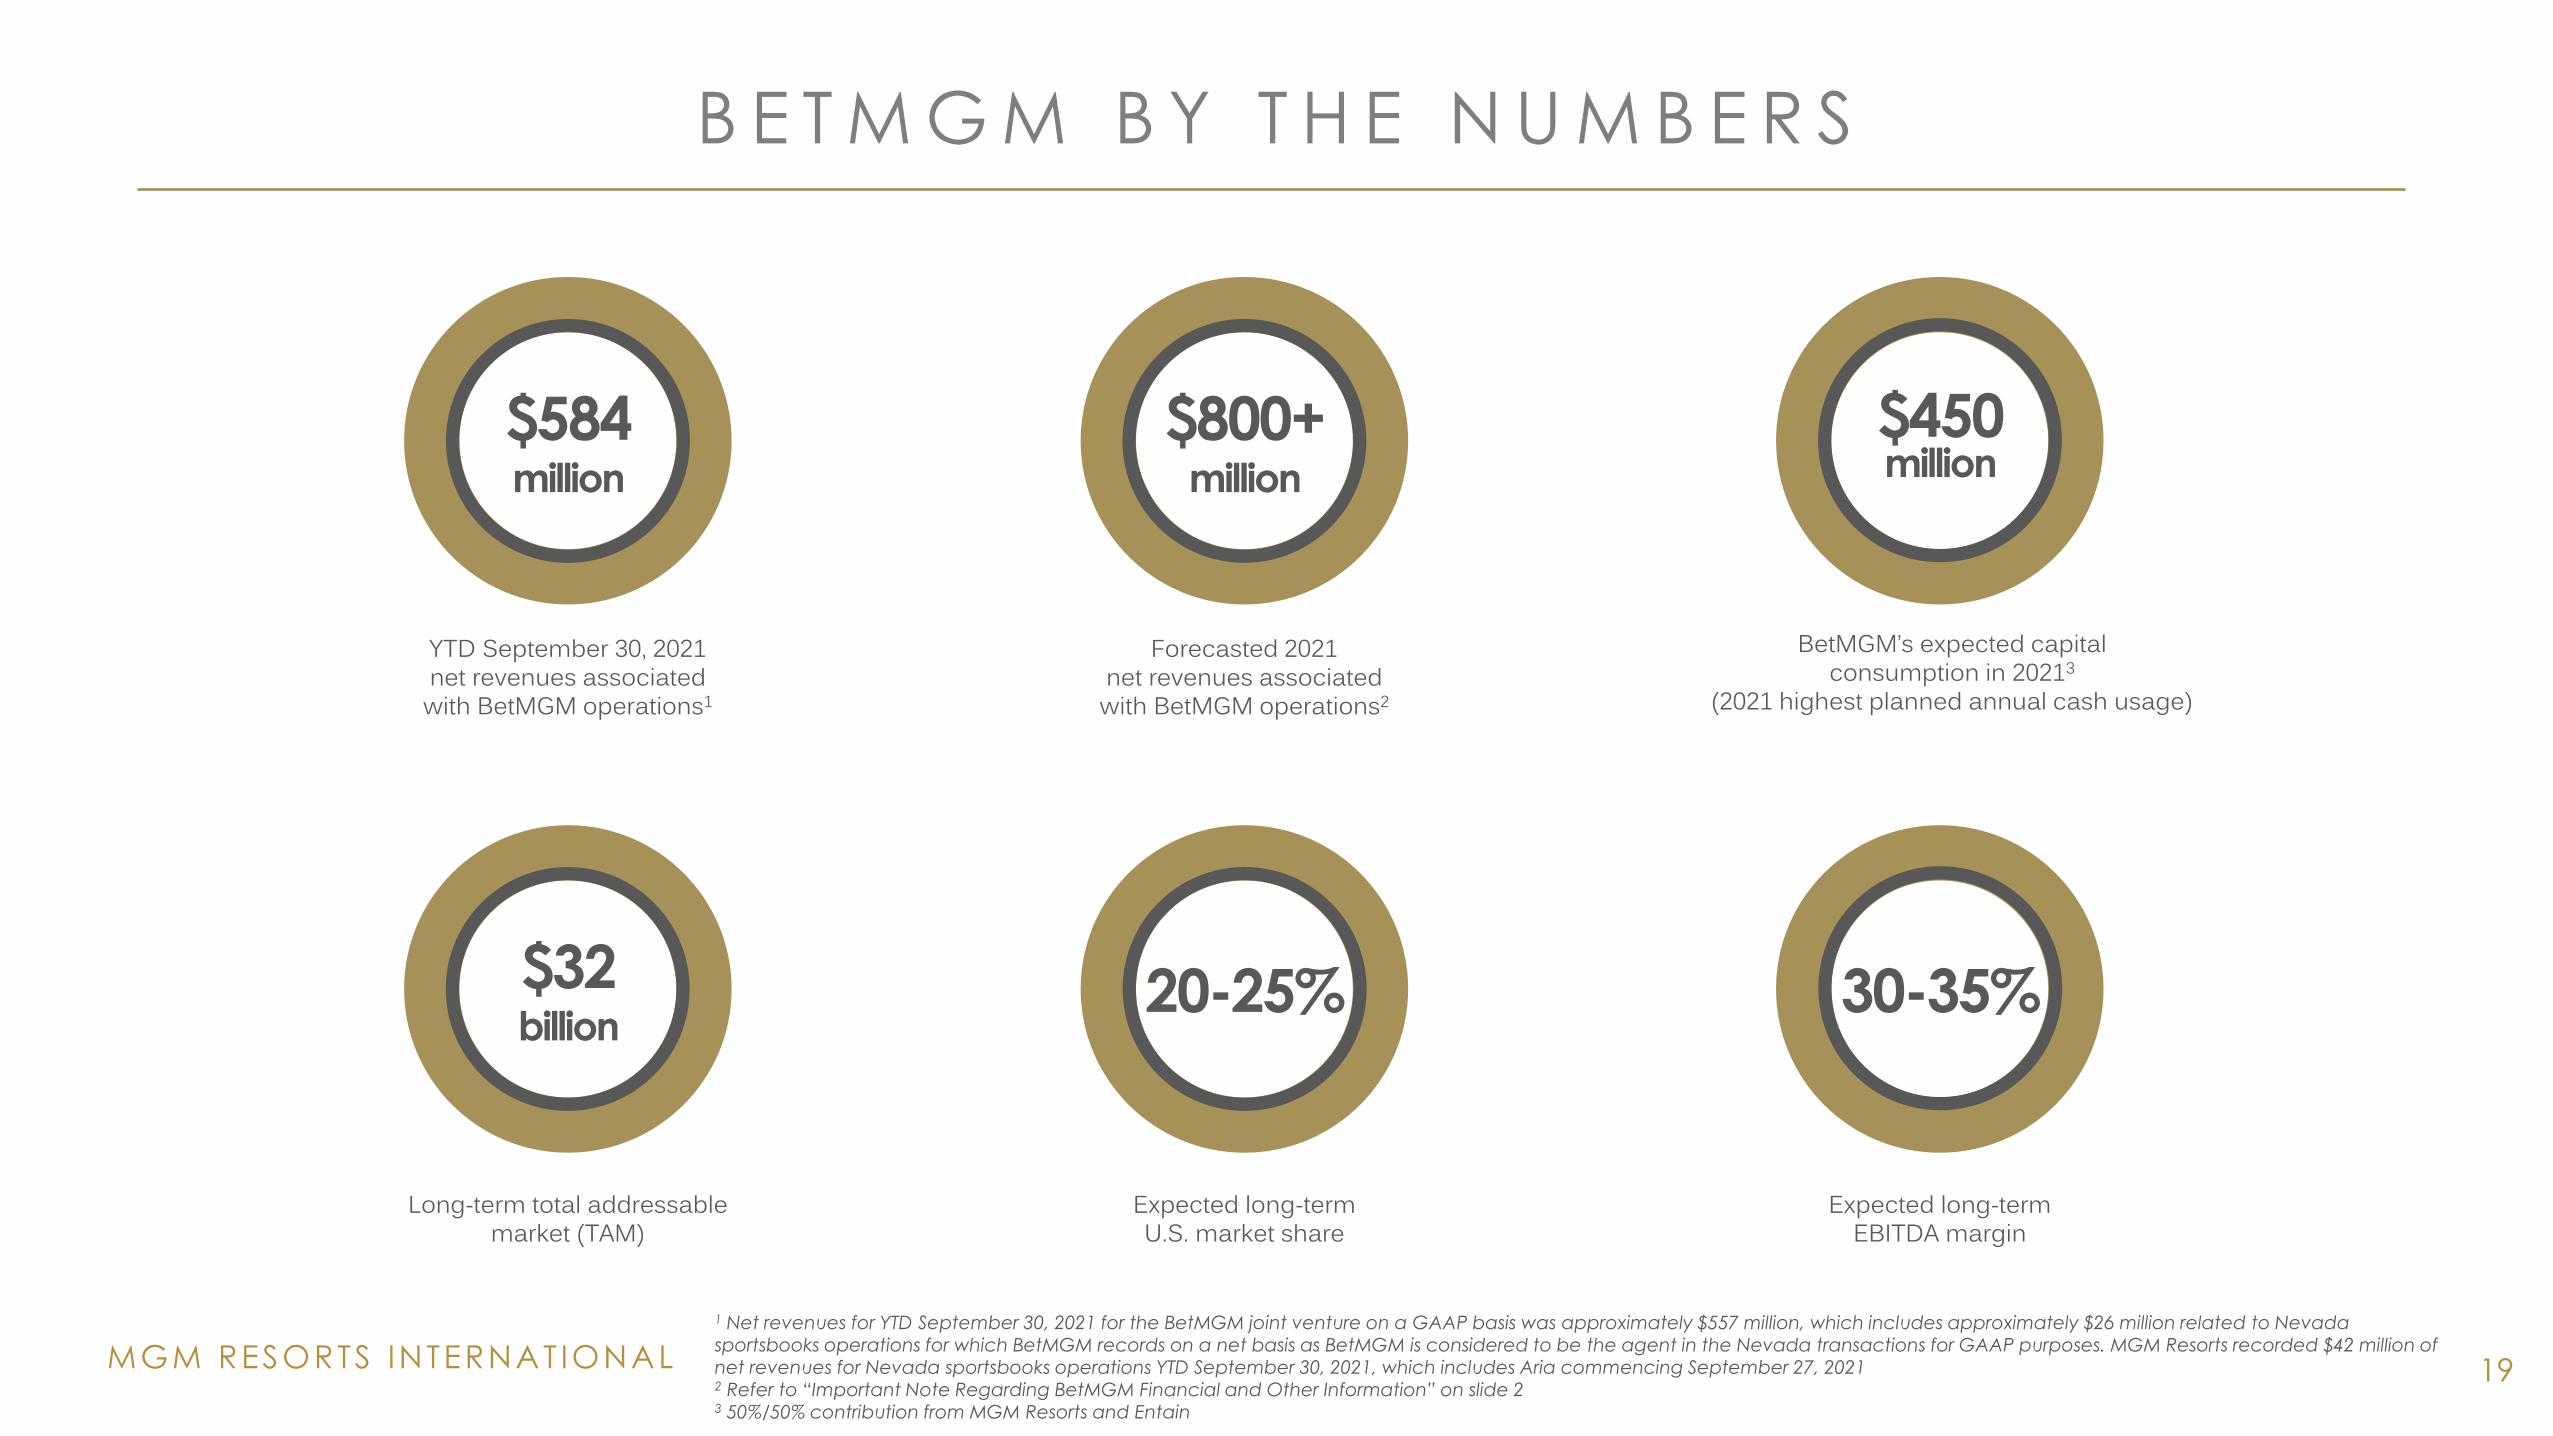
19
Forecasted 2021net revenues associated
with BetMGM operations2
Long-term total addressable market (TAM)
Expected long-termU.S. market share
Expected long-term EBITDA margin
$800+million
$32billion
20-25% 30-35%
1 Net revenues for YTD September 30, 2021 for the BetMGM joint venture on a GAAP basis was approximately $557 million, which includes approximately $26 million related to Nevada sportsbooks operations for which BetMGM records on a net basis as BetMGM is considered to be the agent in the Nevada transactions for GAAP purposes. MGM Resorts recorded $42 million of net revenues for Nevada sportsbooks operations YTD September 30, 2021, which includes Aria commencing September 27, 20212 Refer to “Important Note Regarding BetMGM Financial and Other Information” on slide 23 50%/50% contribution from MGM Resorts and Entain
BetMGM’s expected capitalconsumption in 20213
(2021 highest planned annual cash usage)
$450million
YTD September 30, 2021net revenues associated
with BetMGM operations1
$584million
MGM RESORTS INTERNAT IONAL
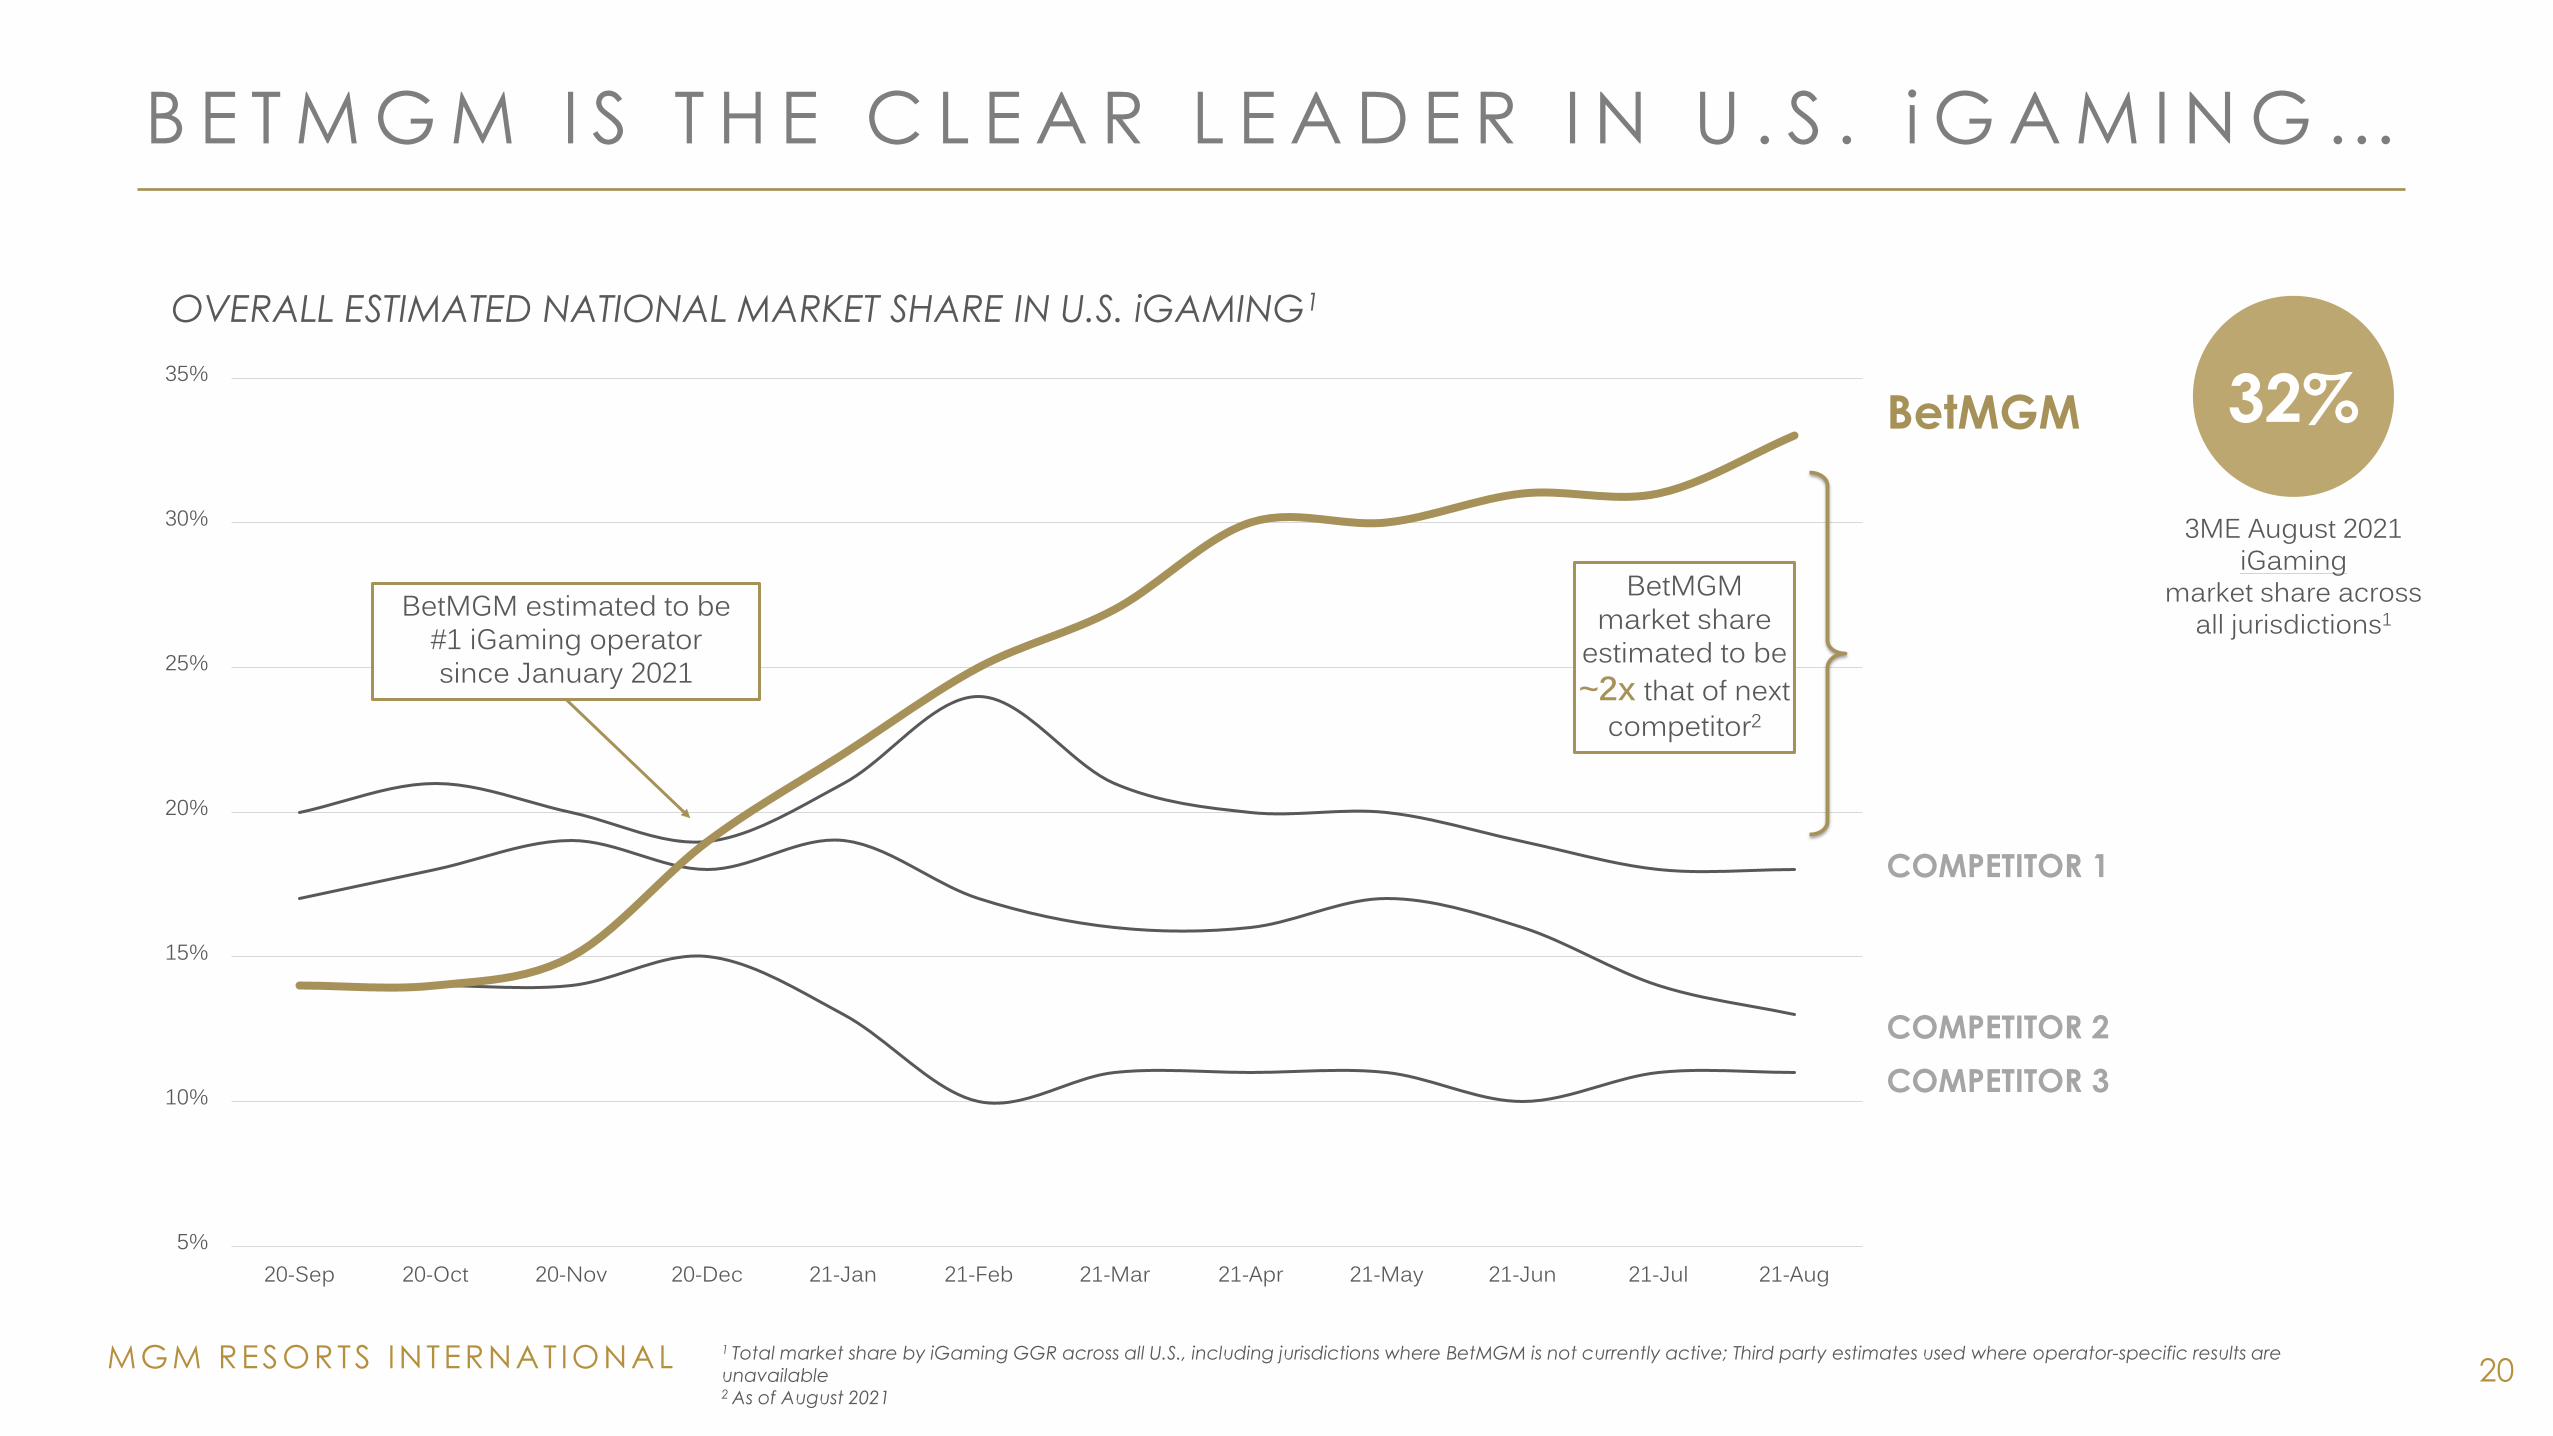
B E T M G M I S T H E C L E A R L E A D E R I N U . S . i G A M I N G …
20
COMPETITOR 1
COMPETITOR 3
BetMGM
COMPETITOR 2
OVERALL ESTIMATED NATIONAL MARKET SHARE IN U.S. iGAMING1
1 Total market share by iGaming GGR across all U.S., including jurisdictions where BetMGM is not currently active; Third party estimates used where operator-specific results are unavailable2 As of August 2021
3ME August 2021 iGaming
market share across all jurisdictions1
32%
5%
10%
15%
20%
25%
30%
35%
20-Sep 20-Oct 20-Nov 20-Dec 21-Jan 21-Feb 21-Mar 21-Apr 21-May 21-Jun 21-Jul 21-Aug
BetMGM estimated to be #1 iGaming operator since January 2021
BetMGM market share
estimated to be ~2x that of next
competitor2
MGM RESORTS INTERNAT IONAL
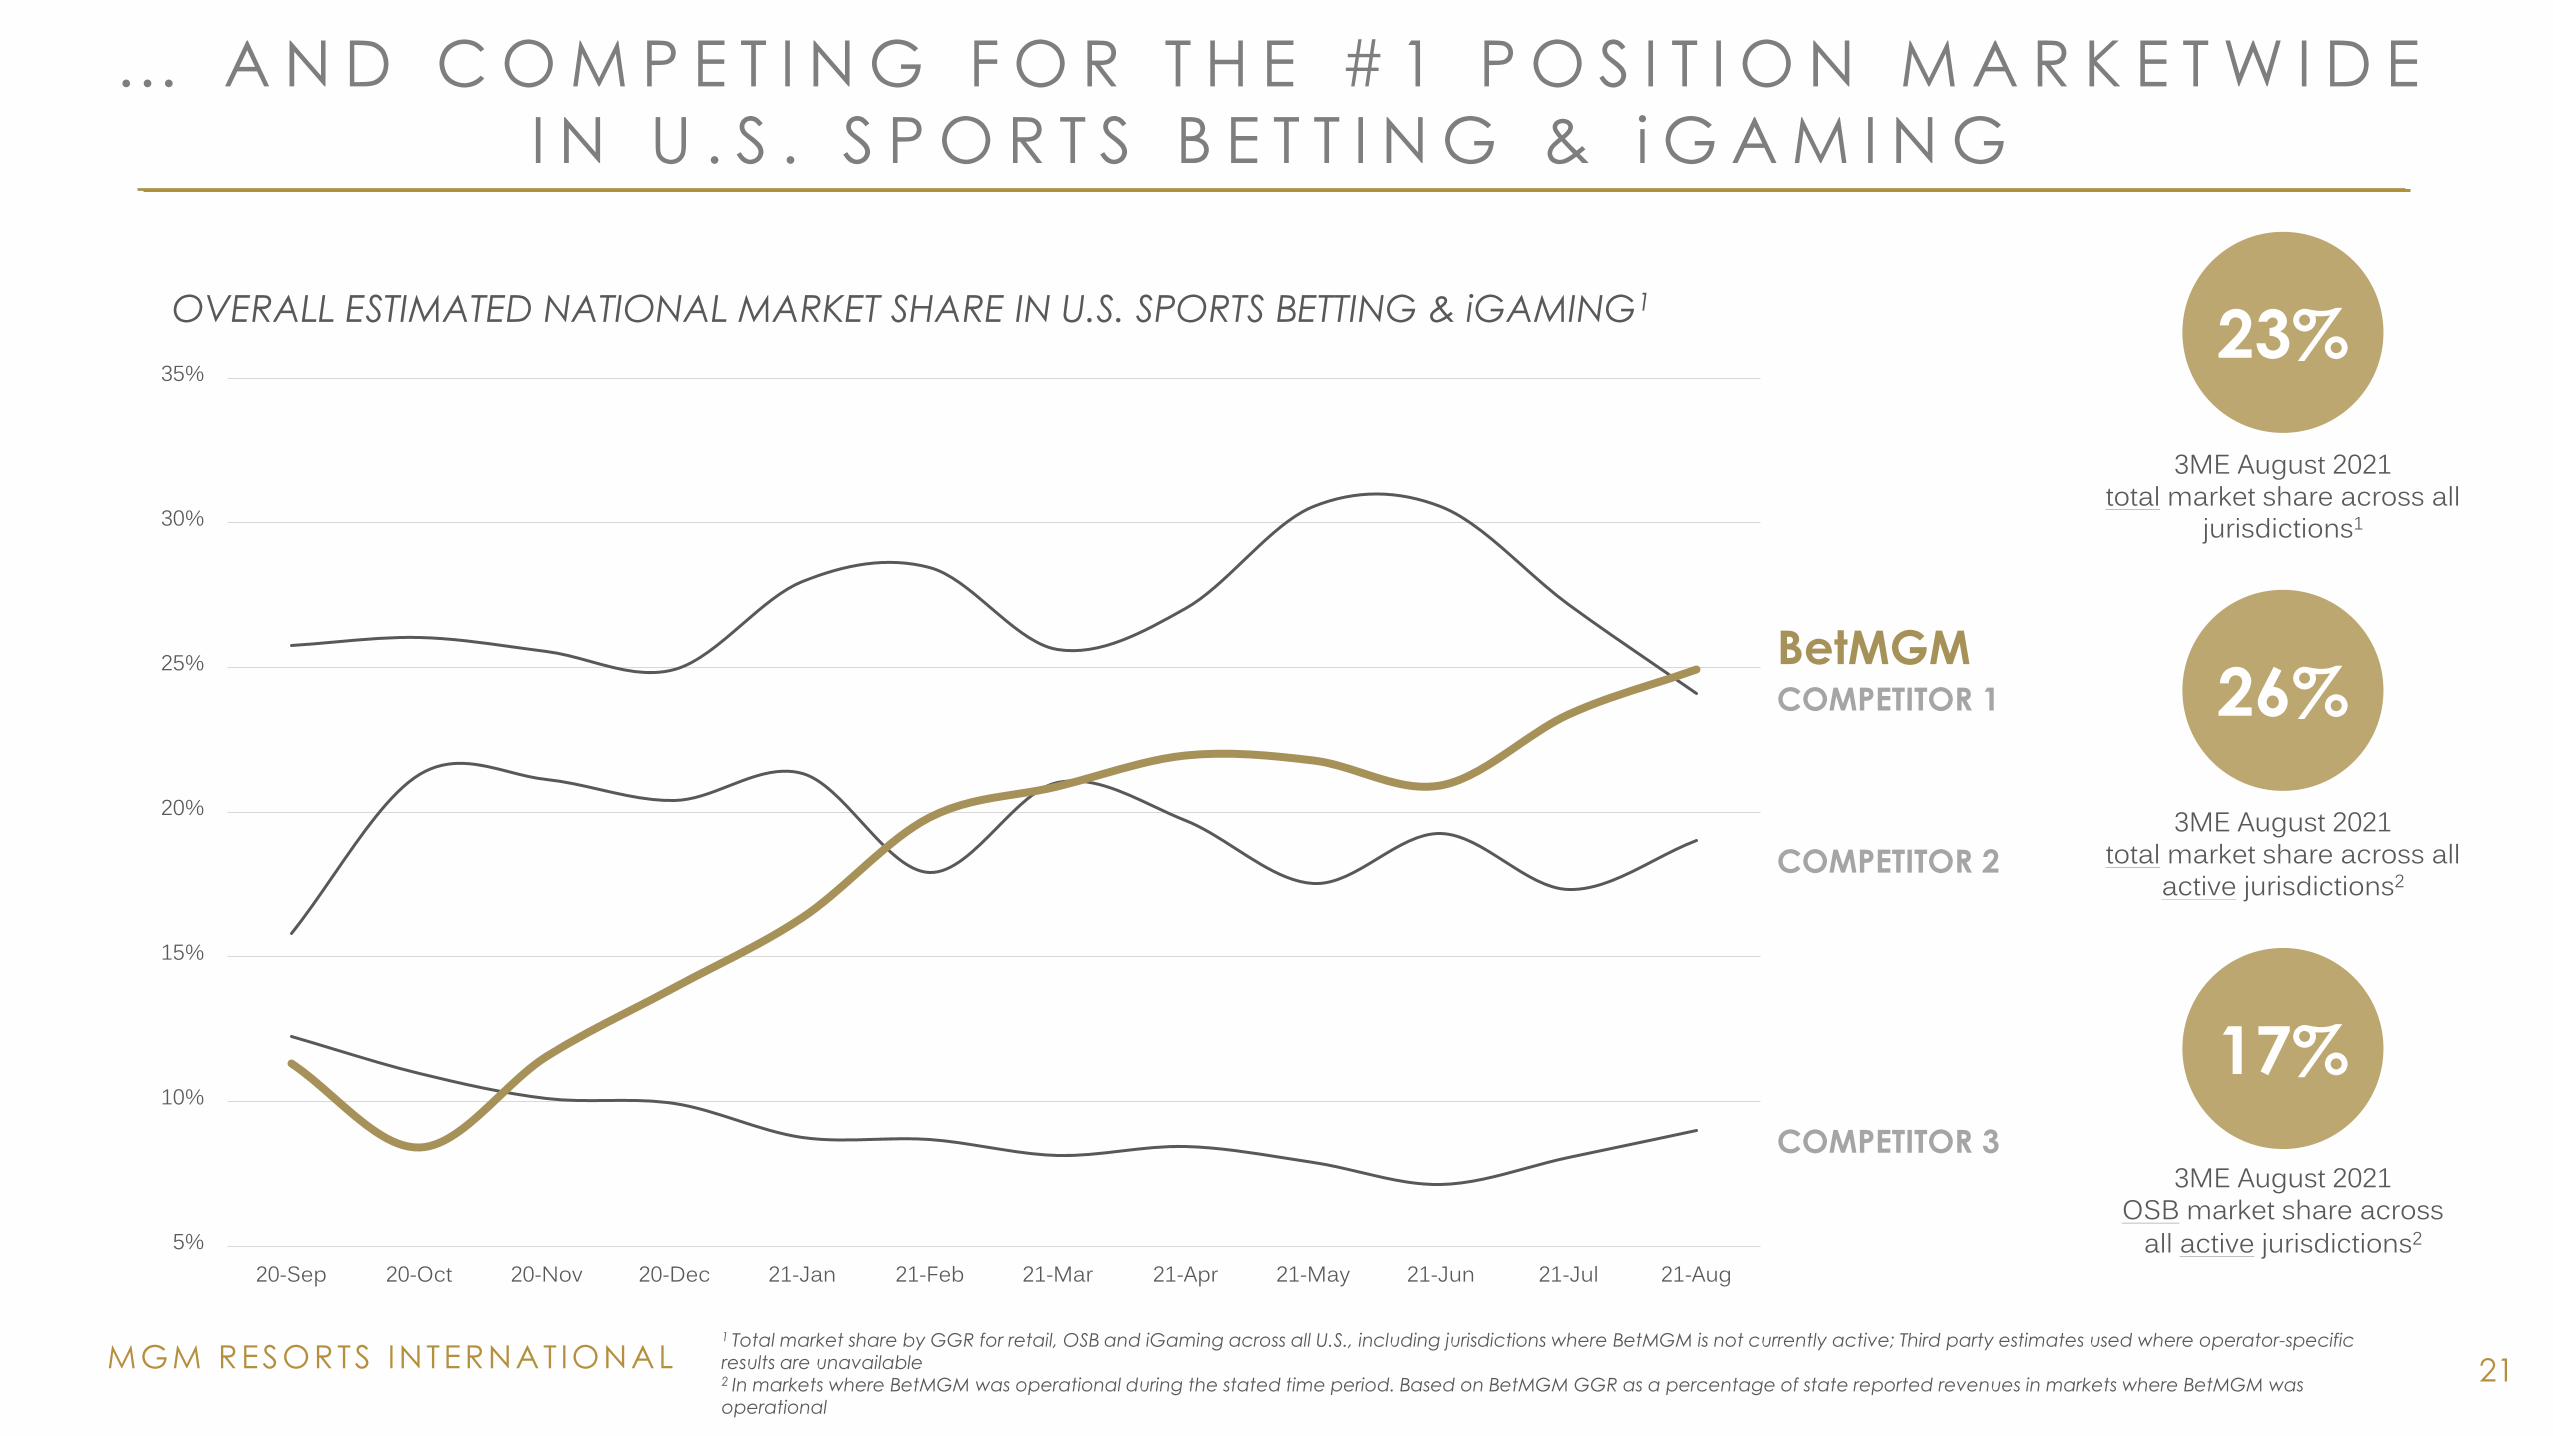
… A N D C O M P E T I N G F O R T H E # 1 P O S I T I O N M A R K E T W I D E
I N U . S . S P O R T S B E T T I N G & i G A M I N G
OVERALL ESTIMATED NATIONAL MARKET SHARE IN U.S. SPORTS BETTING & iGAMING1
1 Total market share by GGR for retail, OSB and iGaming across all U.S., including jurisdictions where BetMGM is not currently active; Third party estimates used where operator-specific results are unavailable2 In markets where BetMGM was operational during the stated time period. Based on BetMGM GGR as a percentage of state reported revenues in markets where BetMGM was operational
COMPETITOR 1
COMPETITOR 2
COMPETITOR 3
BetMGM
21
3ME August 2021 total market share across all
active jurisdictions2
26%
3ME August 2021 OSB market share across
all active jurisdictions2
17%
3ME August 2021 total market share across all
jurisdictions1
23%
5%
10%
15%
20%
25%
30%
35%
20-Sep 20-Oct 20-Nov 20-Dec 21-Jan 21-Feb 21-Mar 21-Apr 21-May 21-Jun 21-Jul 21-Aug
MGM RESORTS INTERNAT IONAL
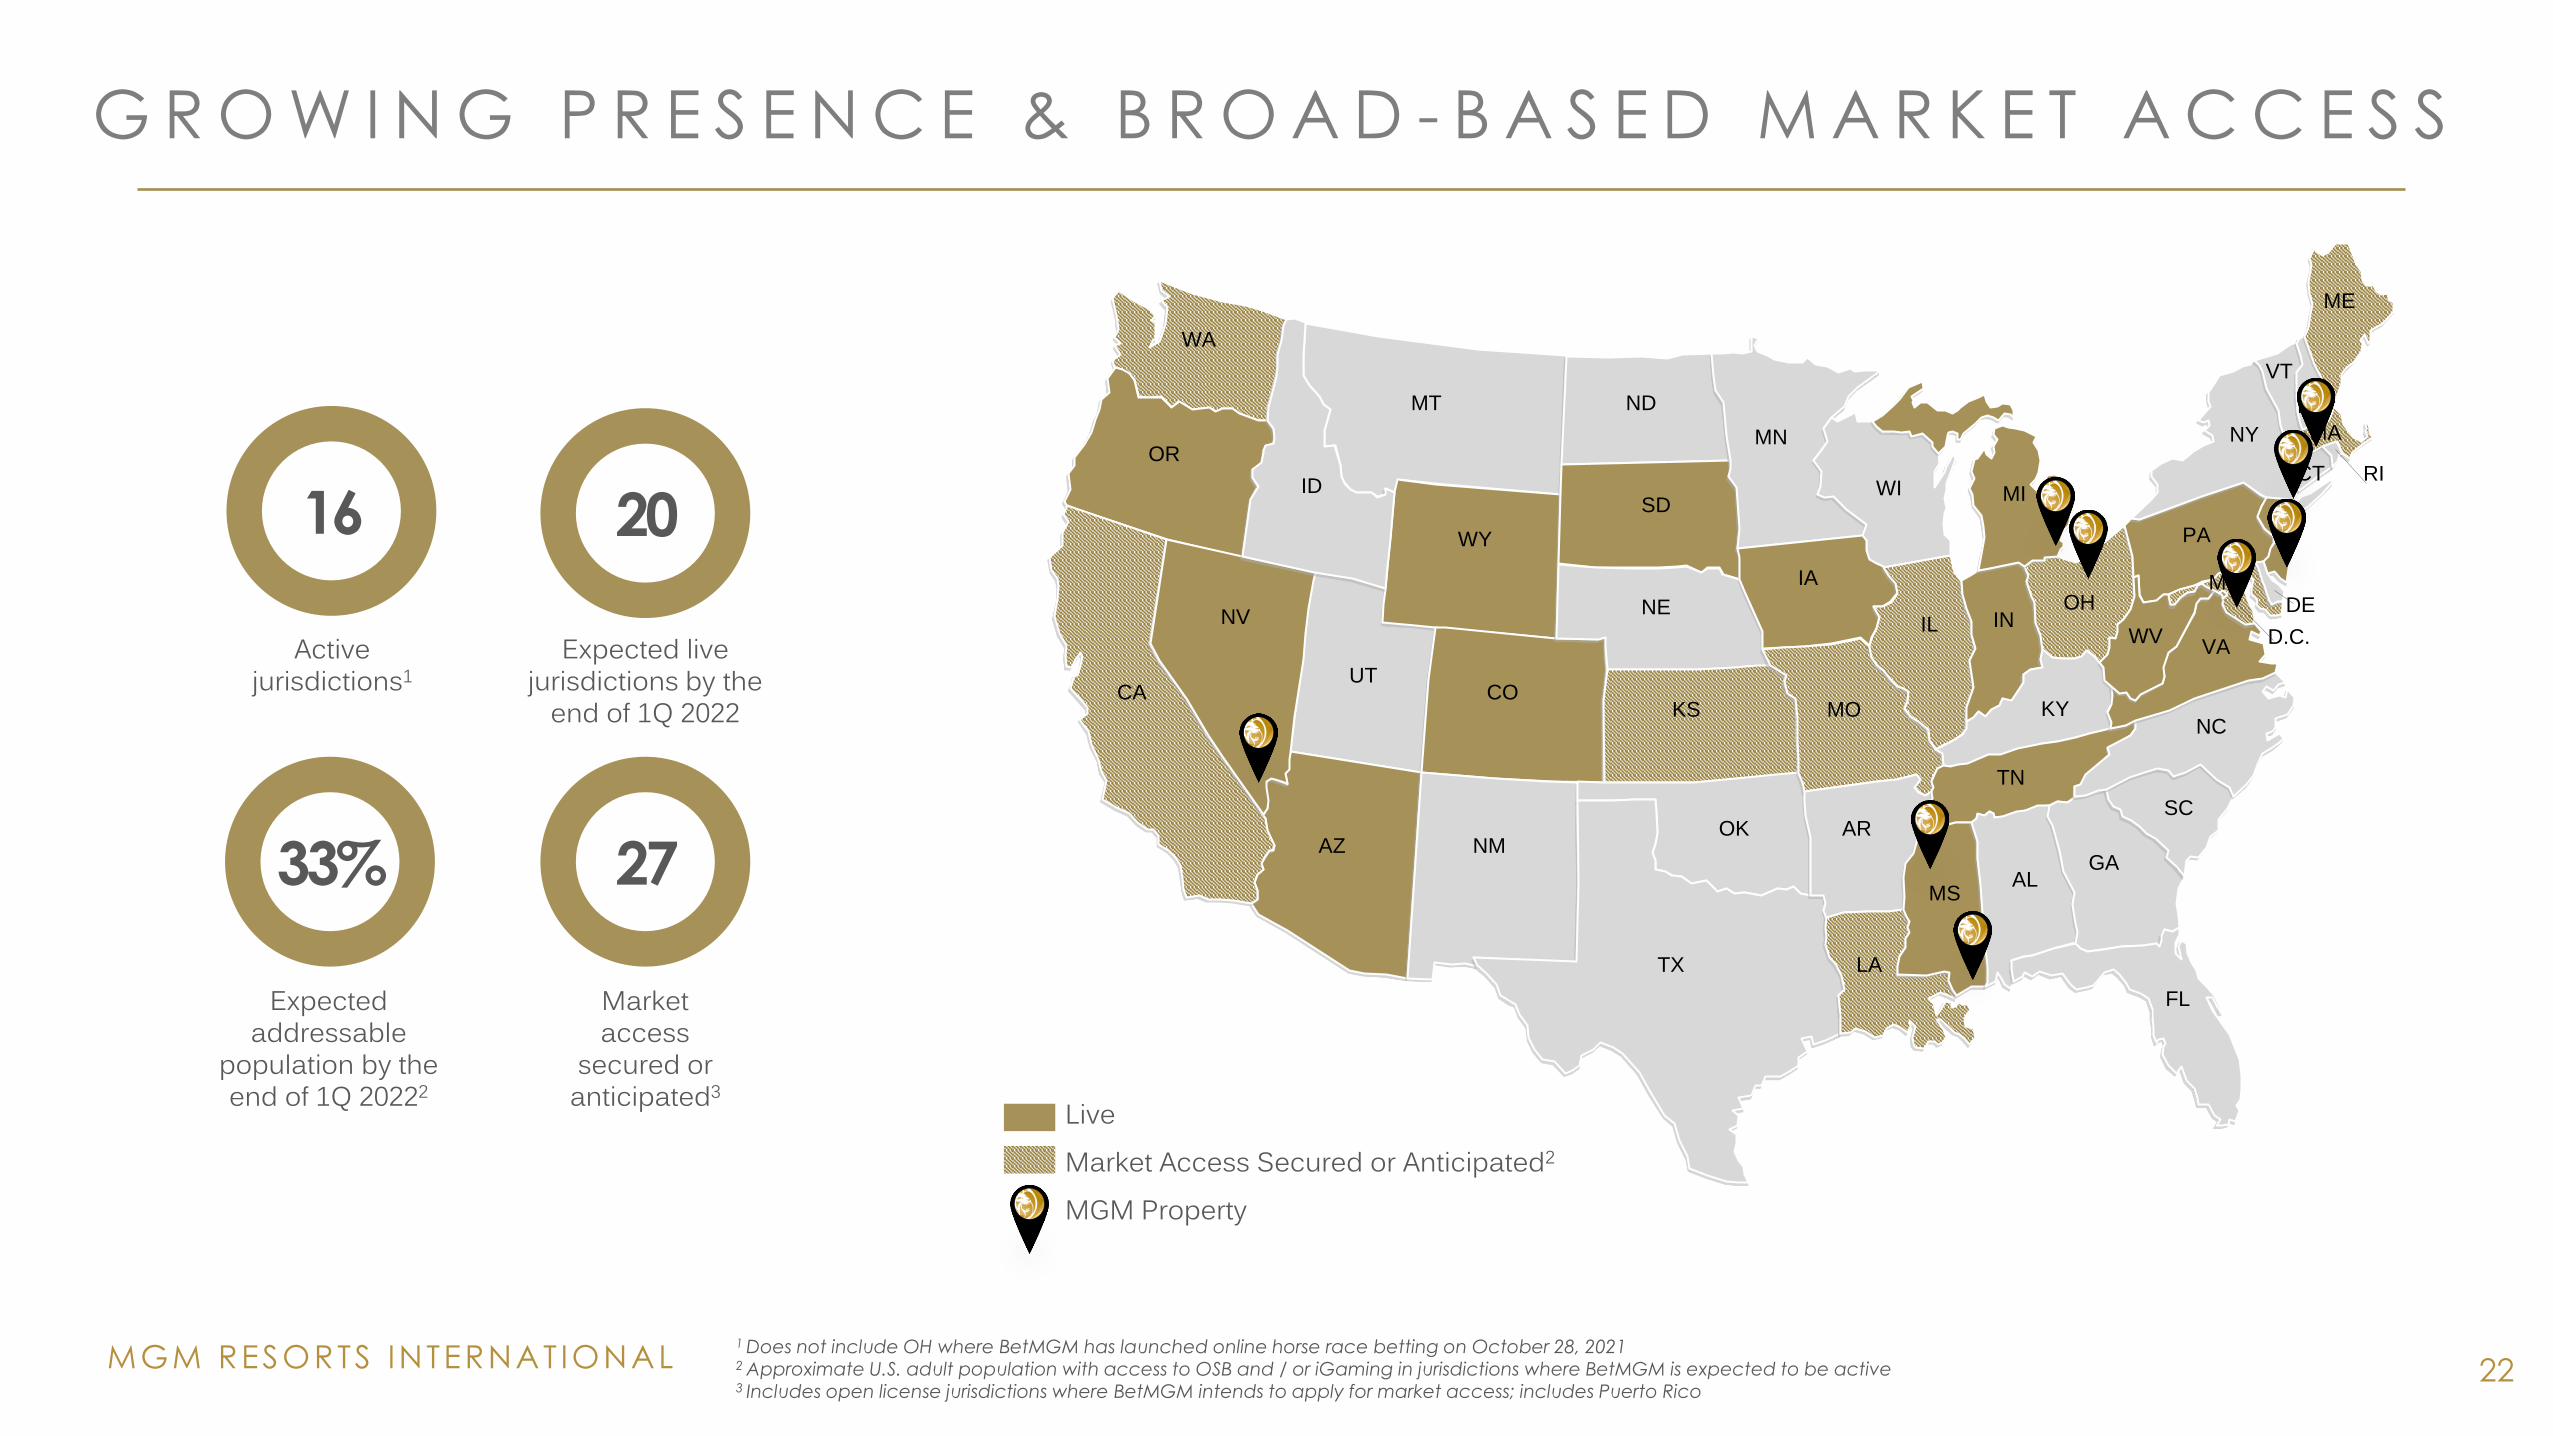
G R O W I N G P R E S E N C E & B R O A D - B A S E D M A R K E T A C C E S S
22
20
Expected live jurisdictions by the
end of 1Q 2022
16
Active jurisdictions1
33%
Expected addressable
population by the end of 1Q 20222
27
Market access
secured or anticipated3
1 Does not include OH where BetMGM has launched online horse race betting on October 28, 20212 Approximate U.S. adult population with access to OSB and / or iGaming in jurisdictions where BetMGM is expected to be active 3 Includes open license jurisdictions where BetMGM intends to apply for market access; includes Puerto Rico
WA
OR
CA
MT
ID
NV
AZ
UT
WY
CO
NM
TX
OK
KS
NE
SD
ND
MN
IA
MO
AR
LA
MSAL
GA
FL
SC
TN
NC
IL
WI MI
OHIN
KY
WVVA
PA
NY
ME
VT
NH
NJ
DEMD
D.C.
MA
CT RI
LiveMarket Access Secured or Anticipated2
MGM Property
MGM RESORTS INTERNAT IONAL
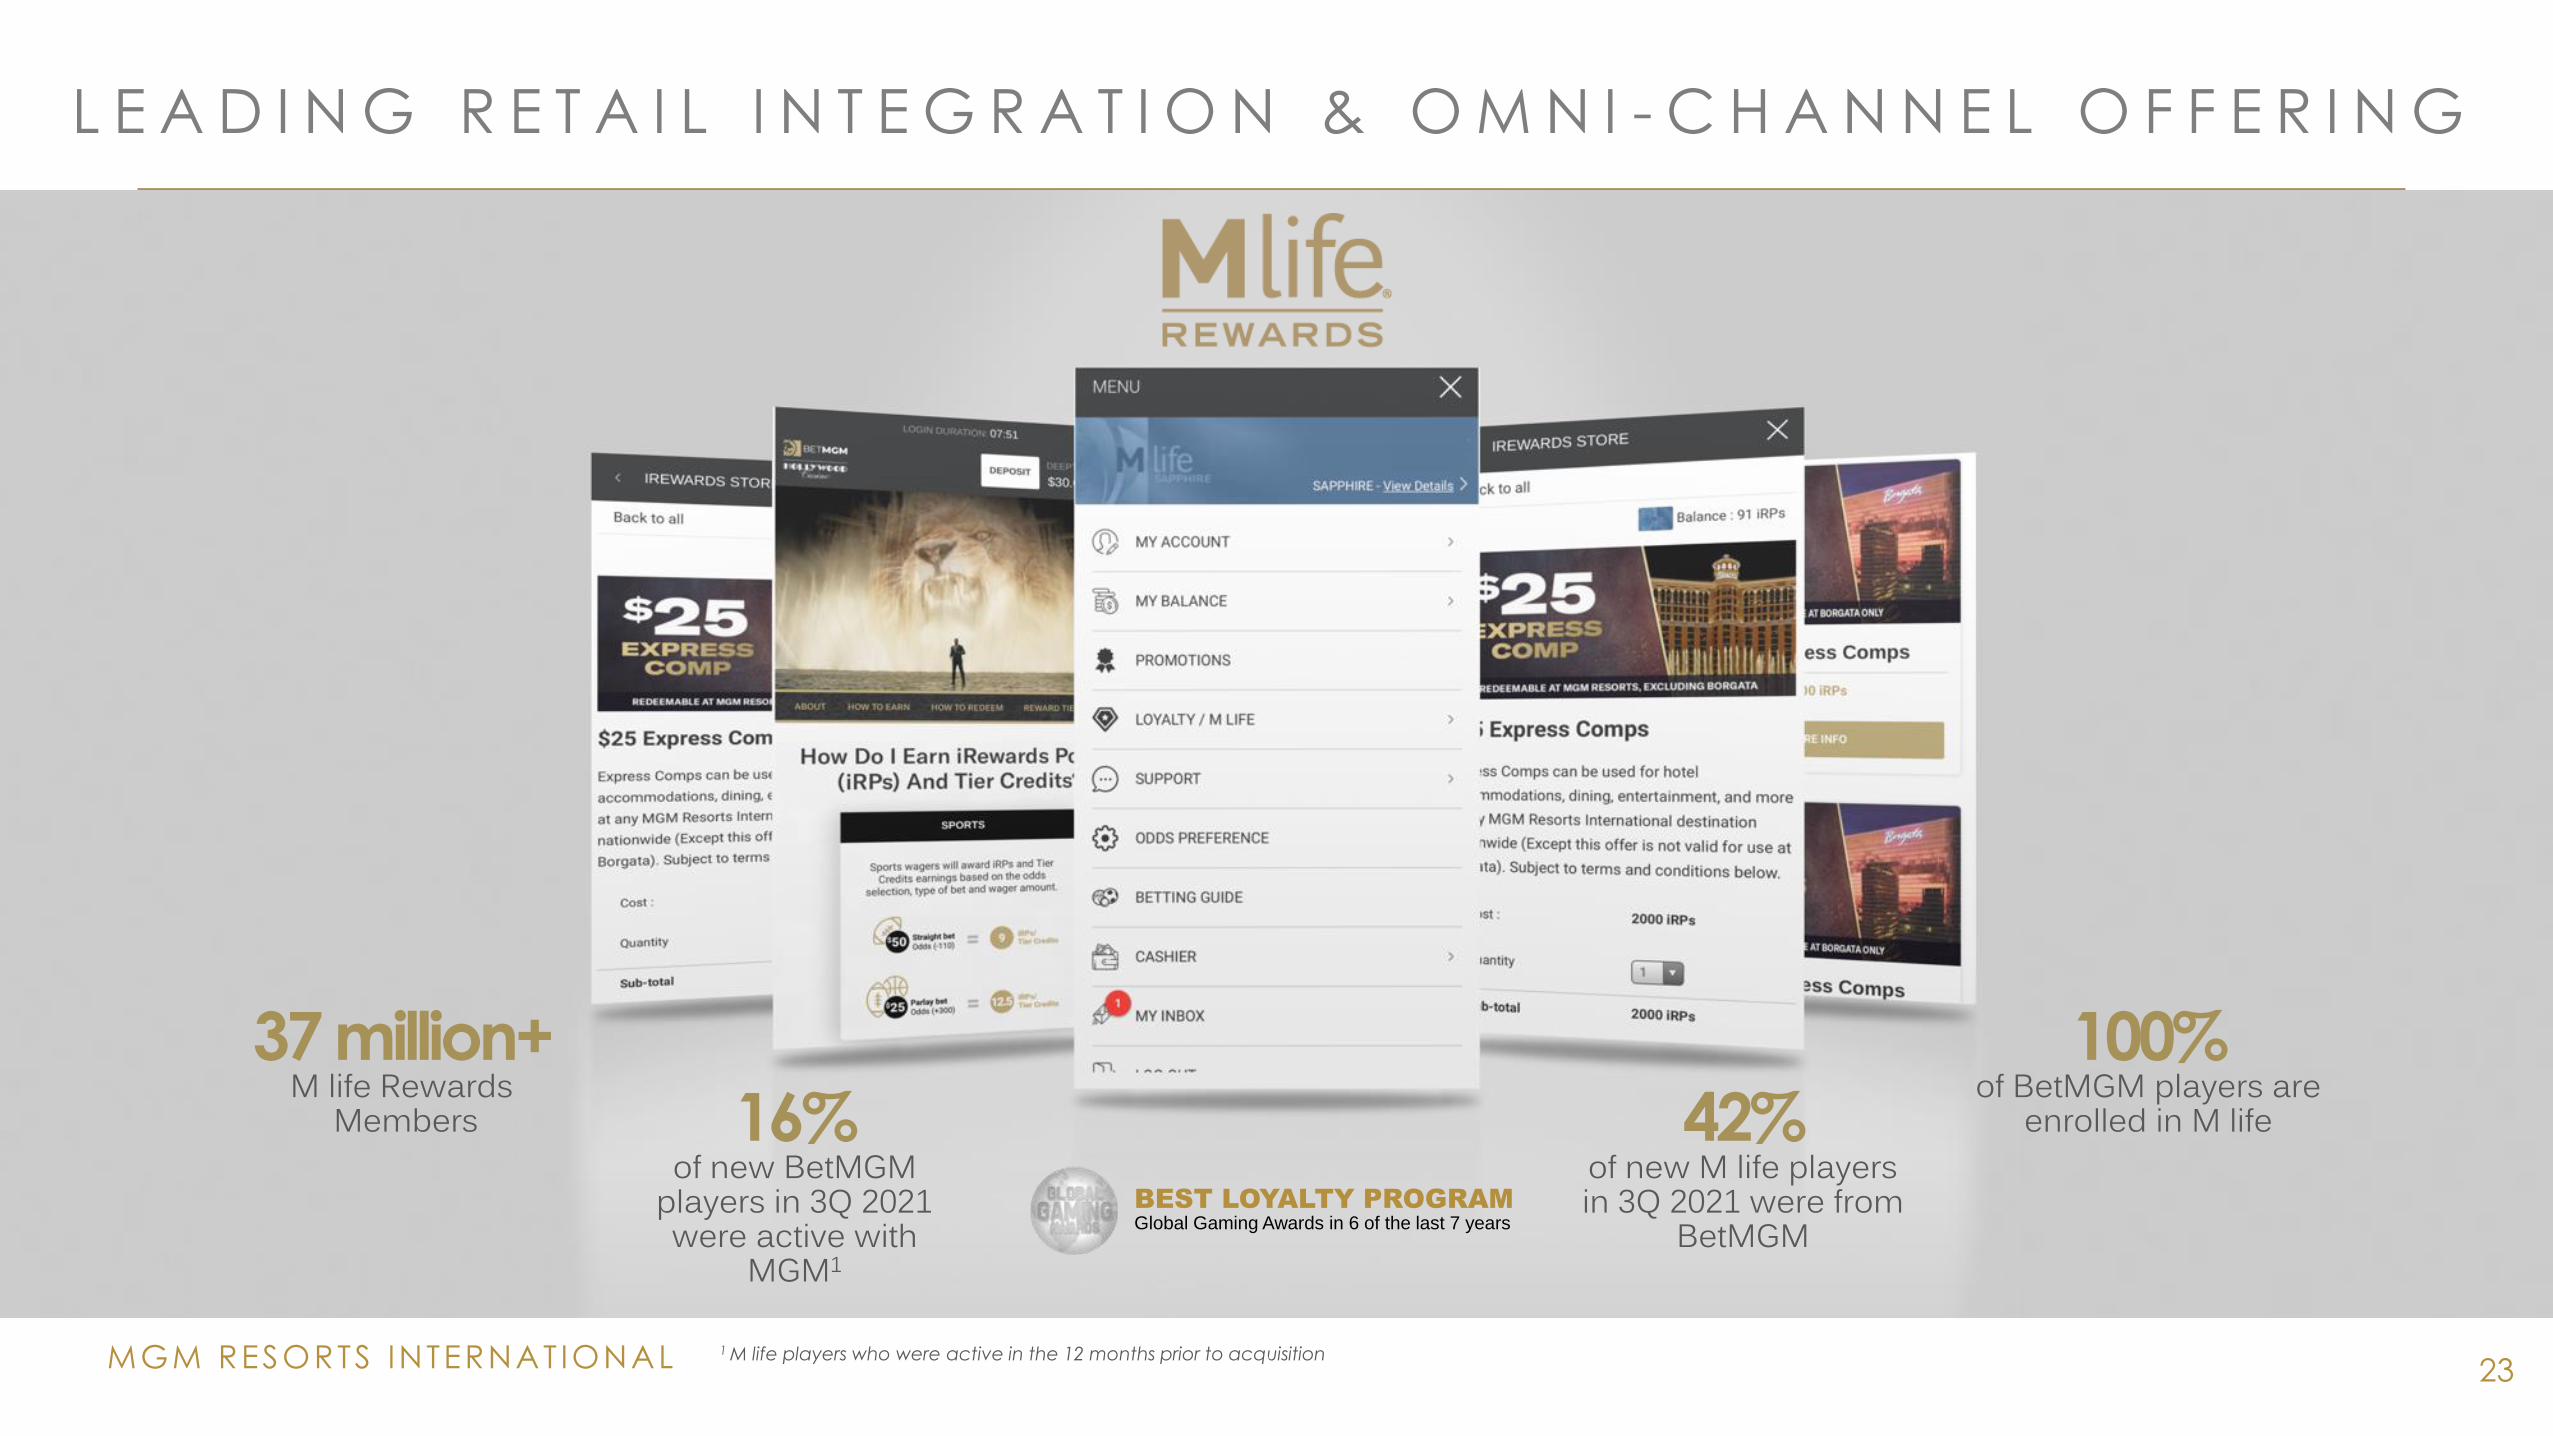
BEST LOYALTY PROGRAMGlobal Gaming Awards in 6 of the last 7 years
37 million+M life Rewards
Members
100%of BetMGM players are
enrolled in M life16%of new BetMGM
players in 3Q 2021 were active with
MGM1
1 M life players who were active in the 12 months prior to acquisition
L E A D I N G R E T A I L I N T E G R A T I O N & O M N I - C H A N N E L O F F E R I N G
42%of new M life players in 3Q 2021 were from
BetMGM
23
MGM RESORTS INTERNAT IONAL 24
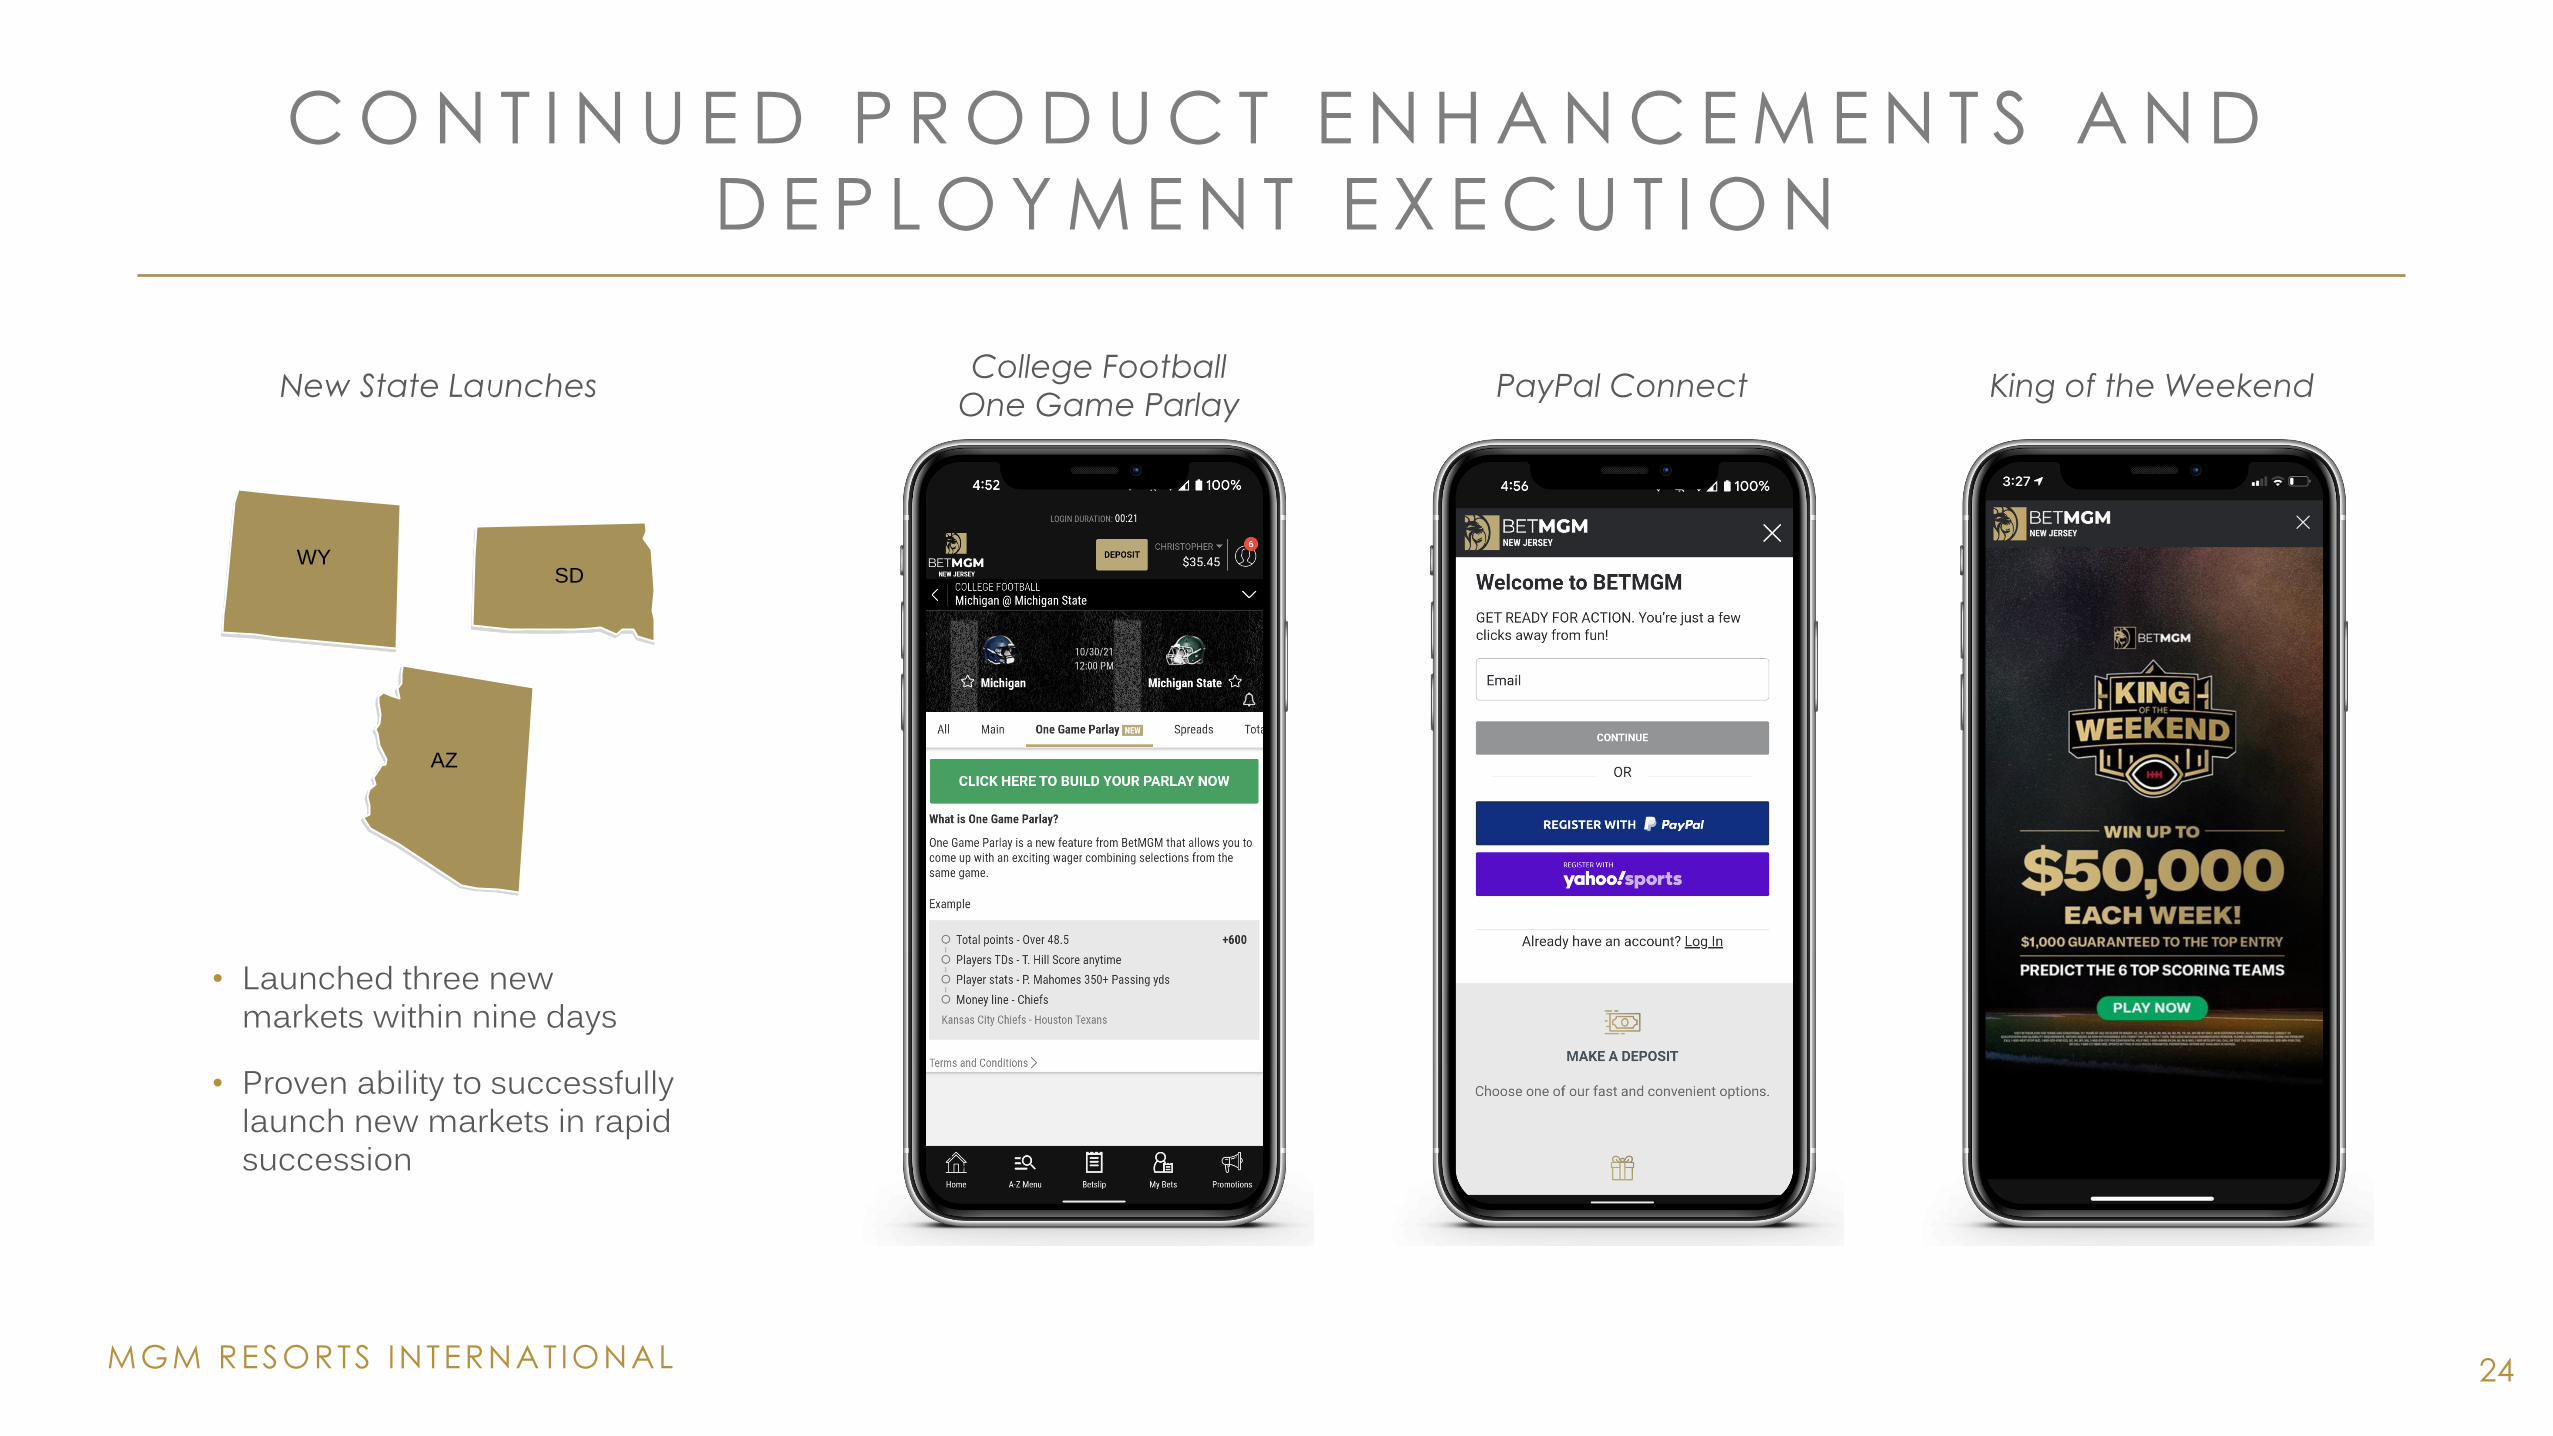
C O N T I N U E D P R O D U C T E N H A N C E M E N T S A N D
D E P L O Y M E N T E X E C U T I O N
College Football
One Game ParlayPayPal Connect King of the WeekendNew State Launches
• Launched three new markets within nine days
• Proven ability to successfully launch new markets in rapid succession
WYSD
AZ
25
• MGM CHINA PROPERTY DATA
• MGP/VICI TRANSACTION: IMPACT
• CITYCENTER TRANSACTION: IMPACT
• RECENT TRANSACTIONS / ANNOUNCEMENTS
S U P P L E M E N T A L
MGM RESORTS INTERNAT IONAL 26
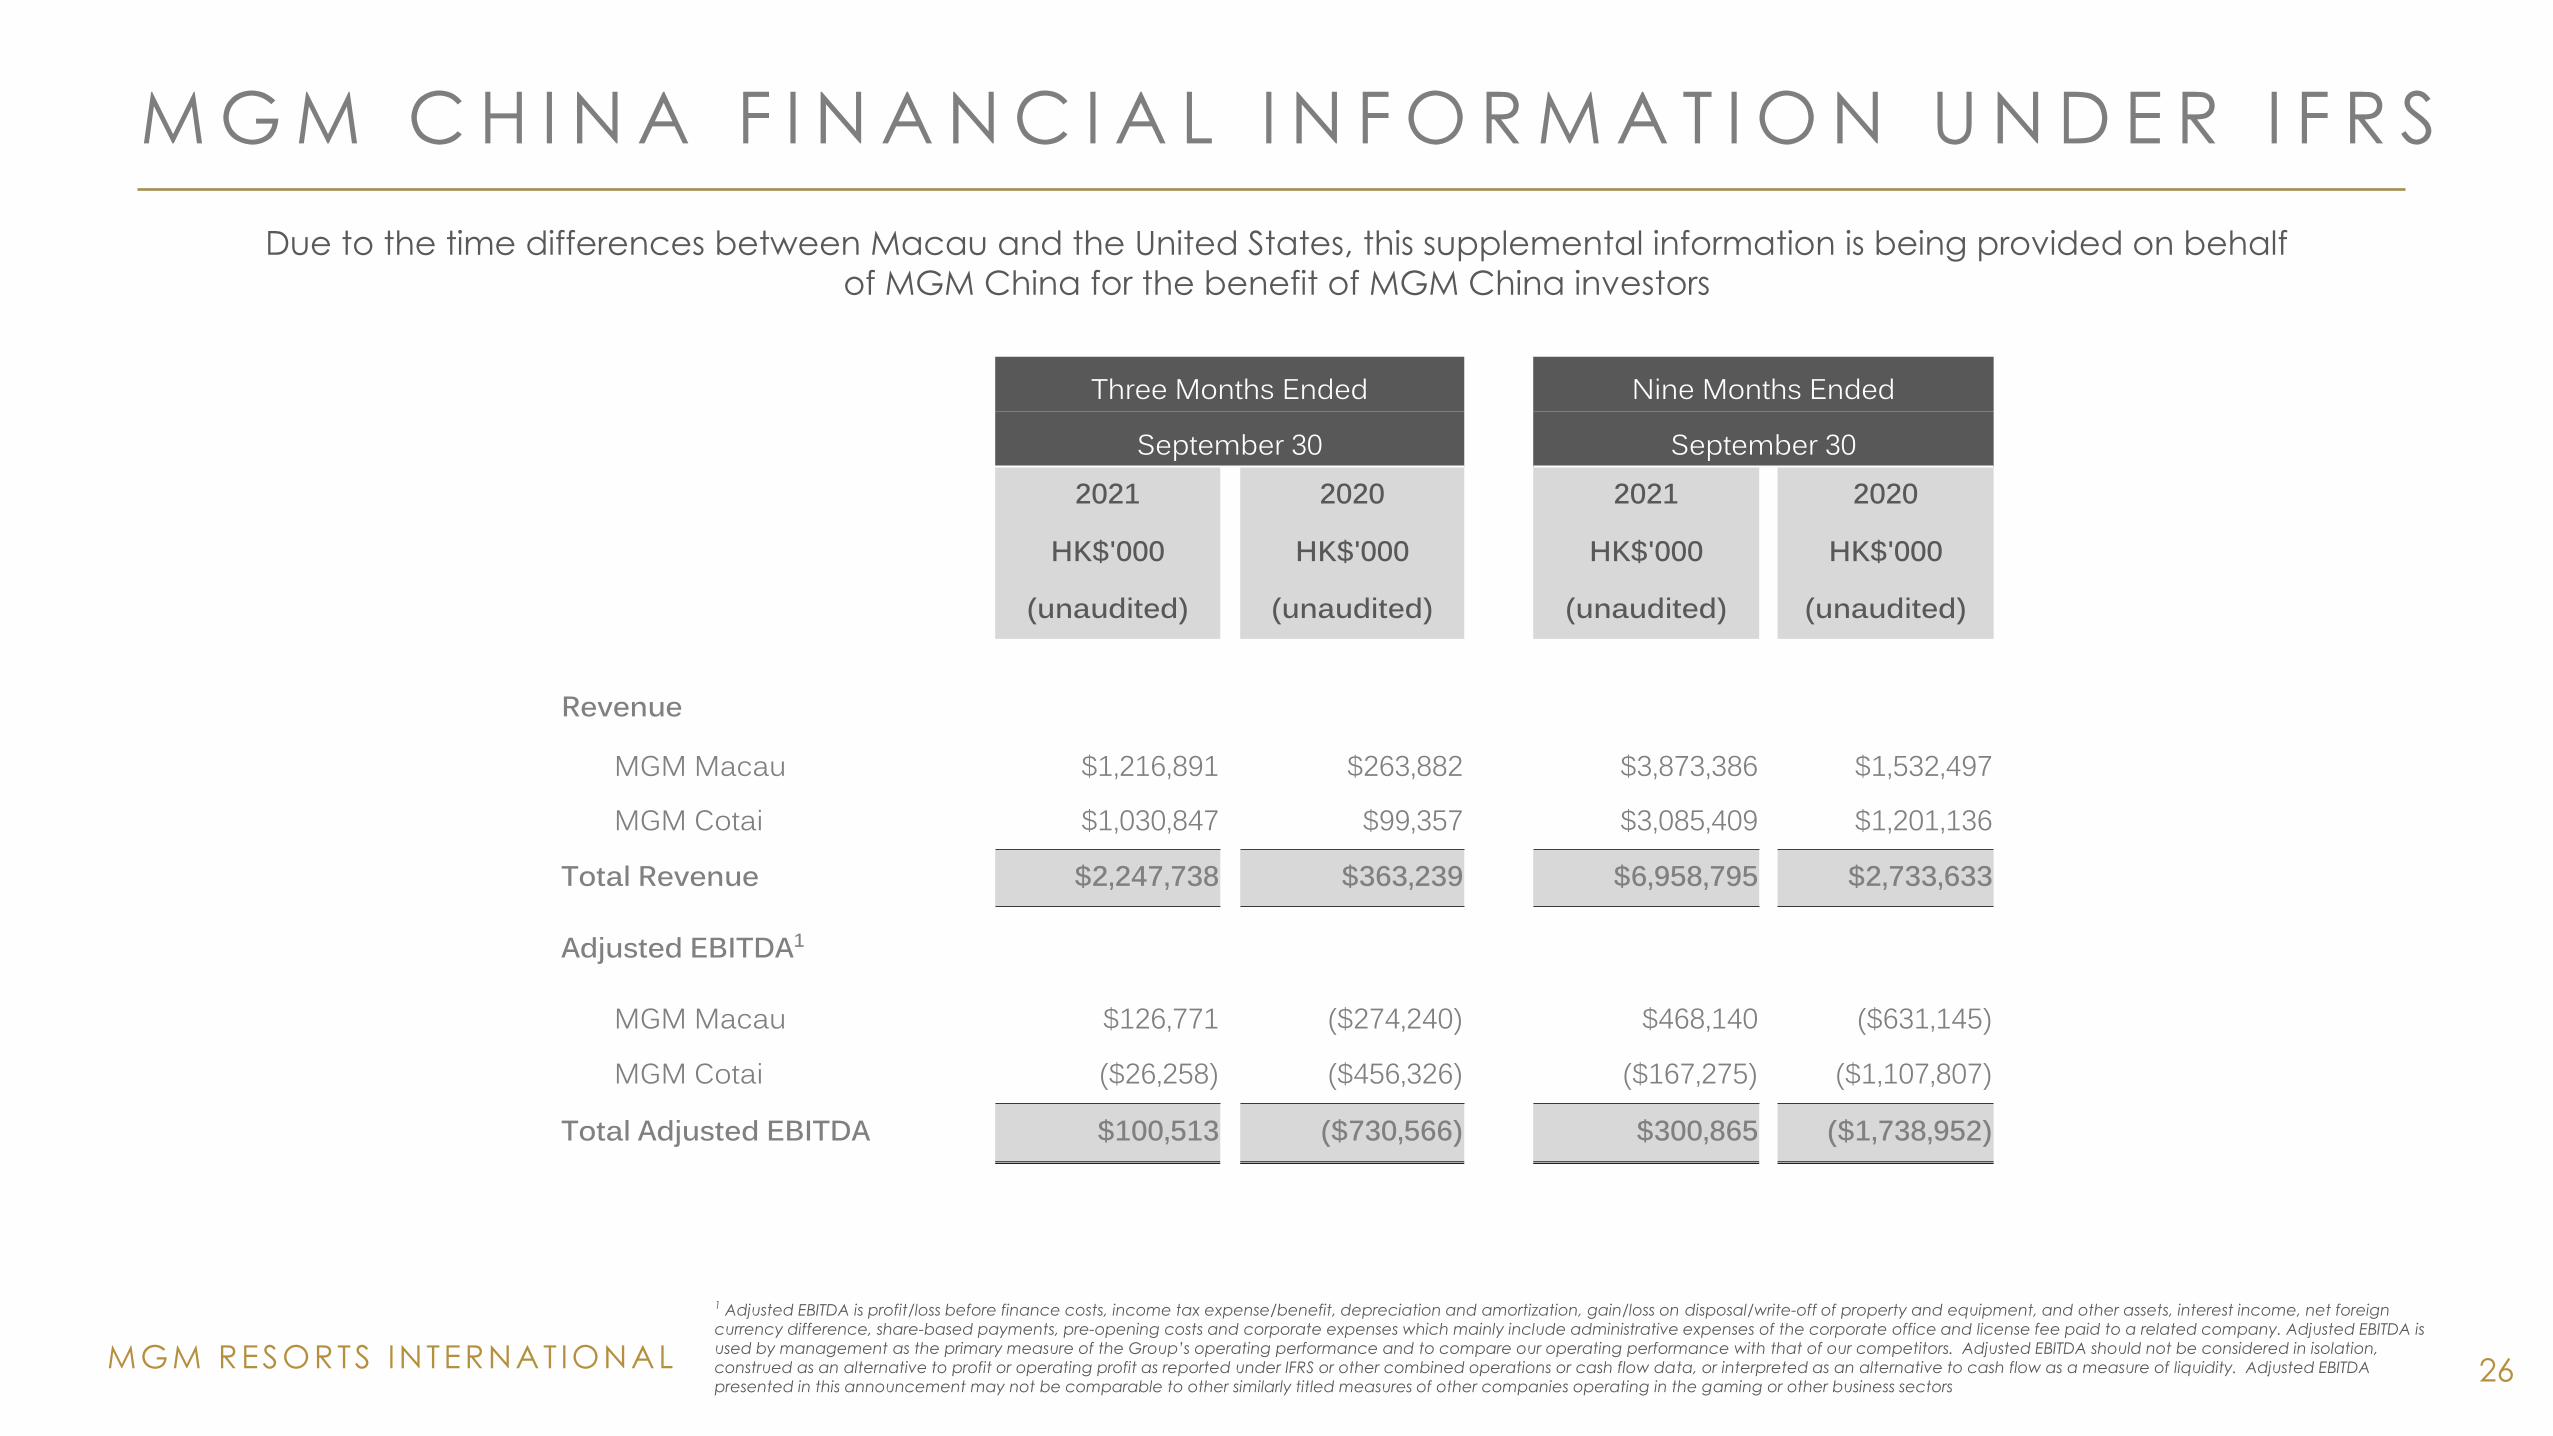
1 Adjusted EBITDA is profit/loss before finance costs, income tax expense/benefit, depreciation and amortization, gain/loss on disposal/write-off of property and equipment, and other assets, interest income, net foreign
currency difference, share-based payments, pre-opening costs and corporate expenses which mainly include administrative expenses of the corporate office and license fee paid to a related company. Adjusted EBITDA is
used by management as the primary measure of the Group’s operating performance and to compare our operating performance with that of our competitors. Adjusted EBITDA should not be considered in isolation,
construed as an alternative to profit or operating profit as reported under IFRS or other combined operations or cash flow data, or interpreted as an alternative to cash flow as a measure of liquidity. Adjusted EBITDA
presented in this announcement may not be comparable to other similarly titled measures of other companies operating in the gaming or other business sectors
Due to the time differences between Macau and the United States, this supplemental information is being provided on behalf
of MGM China for the benefit of MGM China investors
M G M C H I N A F I N A N C I A L I N F O R M A T I O N U N D E R I F R S
Three Months Ended Nine Months Ended
September 30 September 302021 2020 2021 2020
HK$'000 HK$'000 HK$'000 HK$'000
(unaudited) (unaudited) (unaudited) (unaudited)
Revenue
MGM Macau $1,216,891 $263,882 $3,873,386 $1,532,497
MGM Cotai $1,030,847 $99,357 $3,085,409 $1,201,136
Total Revenue $2,247,738 $363,239 $6,958,795 $2,733,633
Adjusted EBITDA1
MGM Macau $126,771 ($274,240) $468,140 ($631,145)
MGM Cotai ($26,258) ($456,326) ($167,275) ($1,107,807)
Total Adjusted EBITDA $100,513 ($730,566) $300,865 ($1,738,952)

MGM RESORTS INTERNAT IONAL
M G M C H I N A F I N A N C I A L I N F O R M A T I O N U N D E R I F R S
27
1 The total of “VIP gross table games win”, “main floor gross table games win” and “slot machine gross win” is different to the casino revenue because casino revenue is reported net of commissions and certain sales incentives
including the allocation of casino revenue to hotel rooms, food and beverage and other revenue for services provided to casino customers on a complimentary basis2 Permanent table count as of September 30, 2021 and 20203 Due to social distancing measures as a result of the COVID-19 pandemic, the slot machines were operated at a reduced capacity
Due to the time differences between Macau and the United States, this supplemental information is being provided on behalf
of MGM China for the benefit of MGM China investors
Three Months Ended Nine Months EndedSeptember 30 September 30
MGM MACAU2021 2020 2021 2020
HK$'000 HK$'000 HK$'000 HK$'000(unaudited) (unaudited) (unaudited) (unaudited)
(in thousands, except for percentages and revenue per available room (“RevPAR”))
VIP Table Games Turnover 9,039,520 4,949,128 33,007,574 22,494,616
VIP Gross Table Games Win1 358,946 106,704 1,005,646 656,744VIP Table Games Win Percentage 3.97% 2.16% 3.05% 2.92%Average Daily Gross Win Per VIP Gaming Table 57.8 17.0 54.4 38.9Main Floor Table Games Drop 4,735,304 690,385 14,987,256 4,483,888
Main Floor Gross Table Games Win1 889,235 118,750 3,002,404 923,604Main Floor Table Games Win Percentage 18.8% 17.2% 20.0% 20.6%Average Daily Gross Win Per Main Floor Gaming Table 45.3 6.5 51.1 18.7Slot Machine Handle 3,005,368 1,174,460 10,364,494 5,556,499
Slot Machine Gross Win1 117,942 45,907 397,472 193,667Slot Hold Percentage 3.9% 3.9% 3.8% 3.5%Average Daily Win Per Slot 1.8 0.8 2.1 1.2
Commissions, complimentaries and other incentives1 (285,644) (53,820) (946,586) (422,373)Room Occupancy Rate 71.3% 12.3% 79.4% 20.5%RevPAR 1,161 193 1,100 385
As of September 30Gaming Units: 2021 2020
Tables2 289 285Slot Machines3 769 640
MGM RESORTS INTERNAT IONAL 28
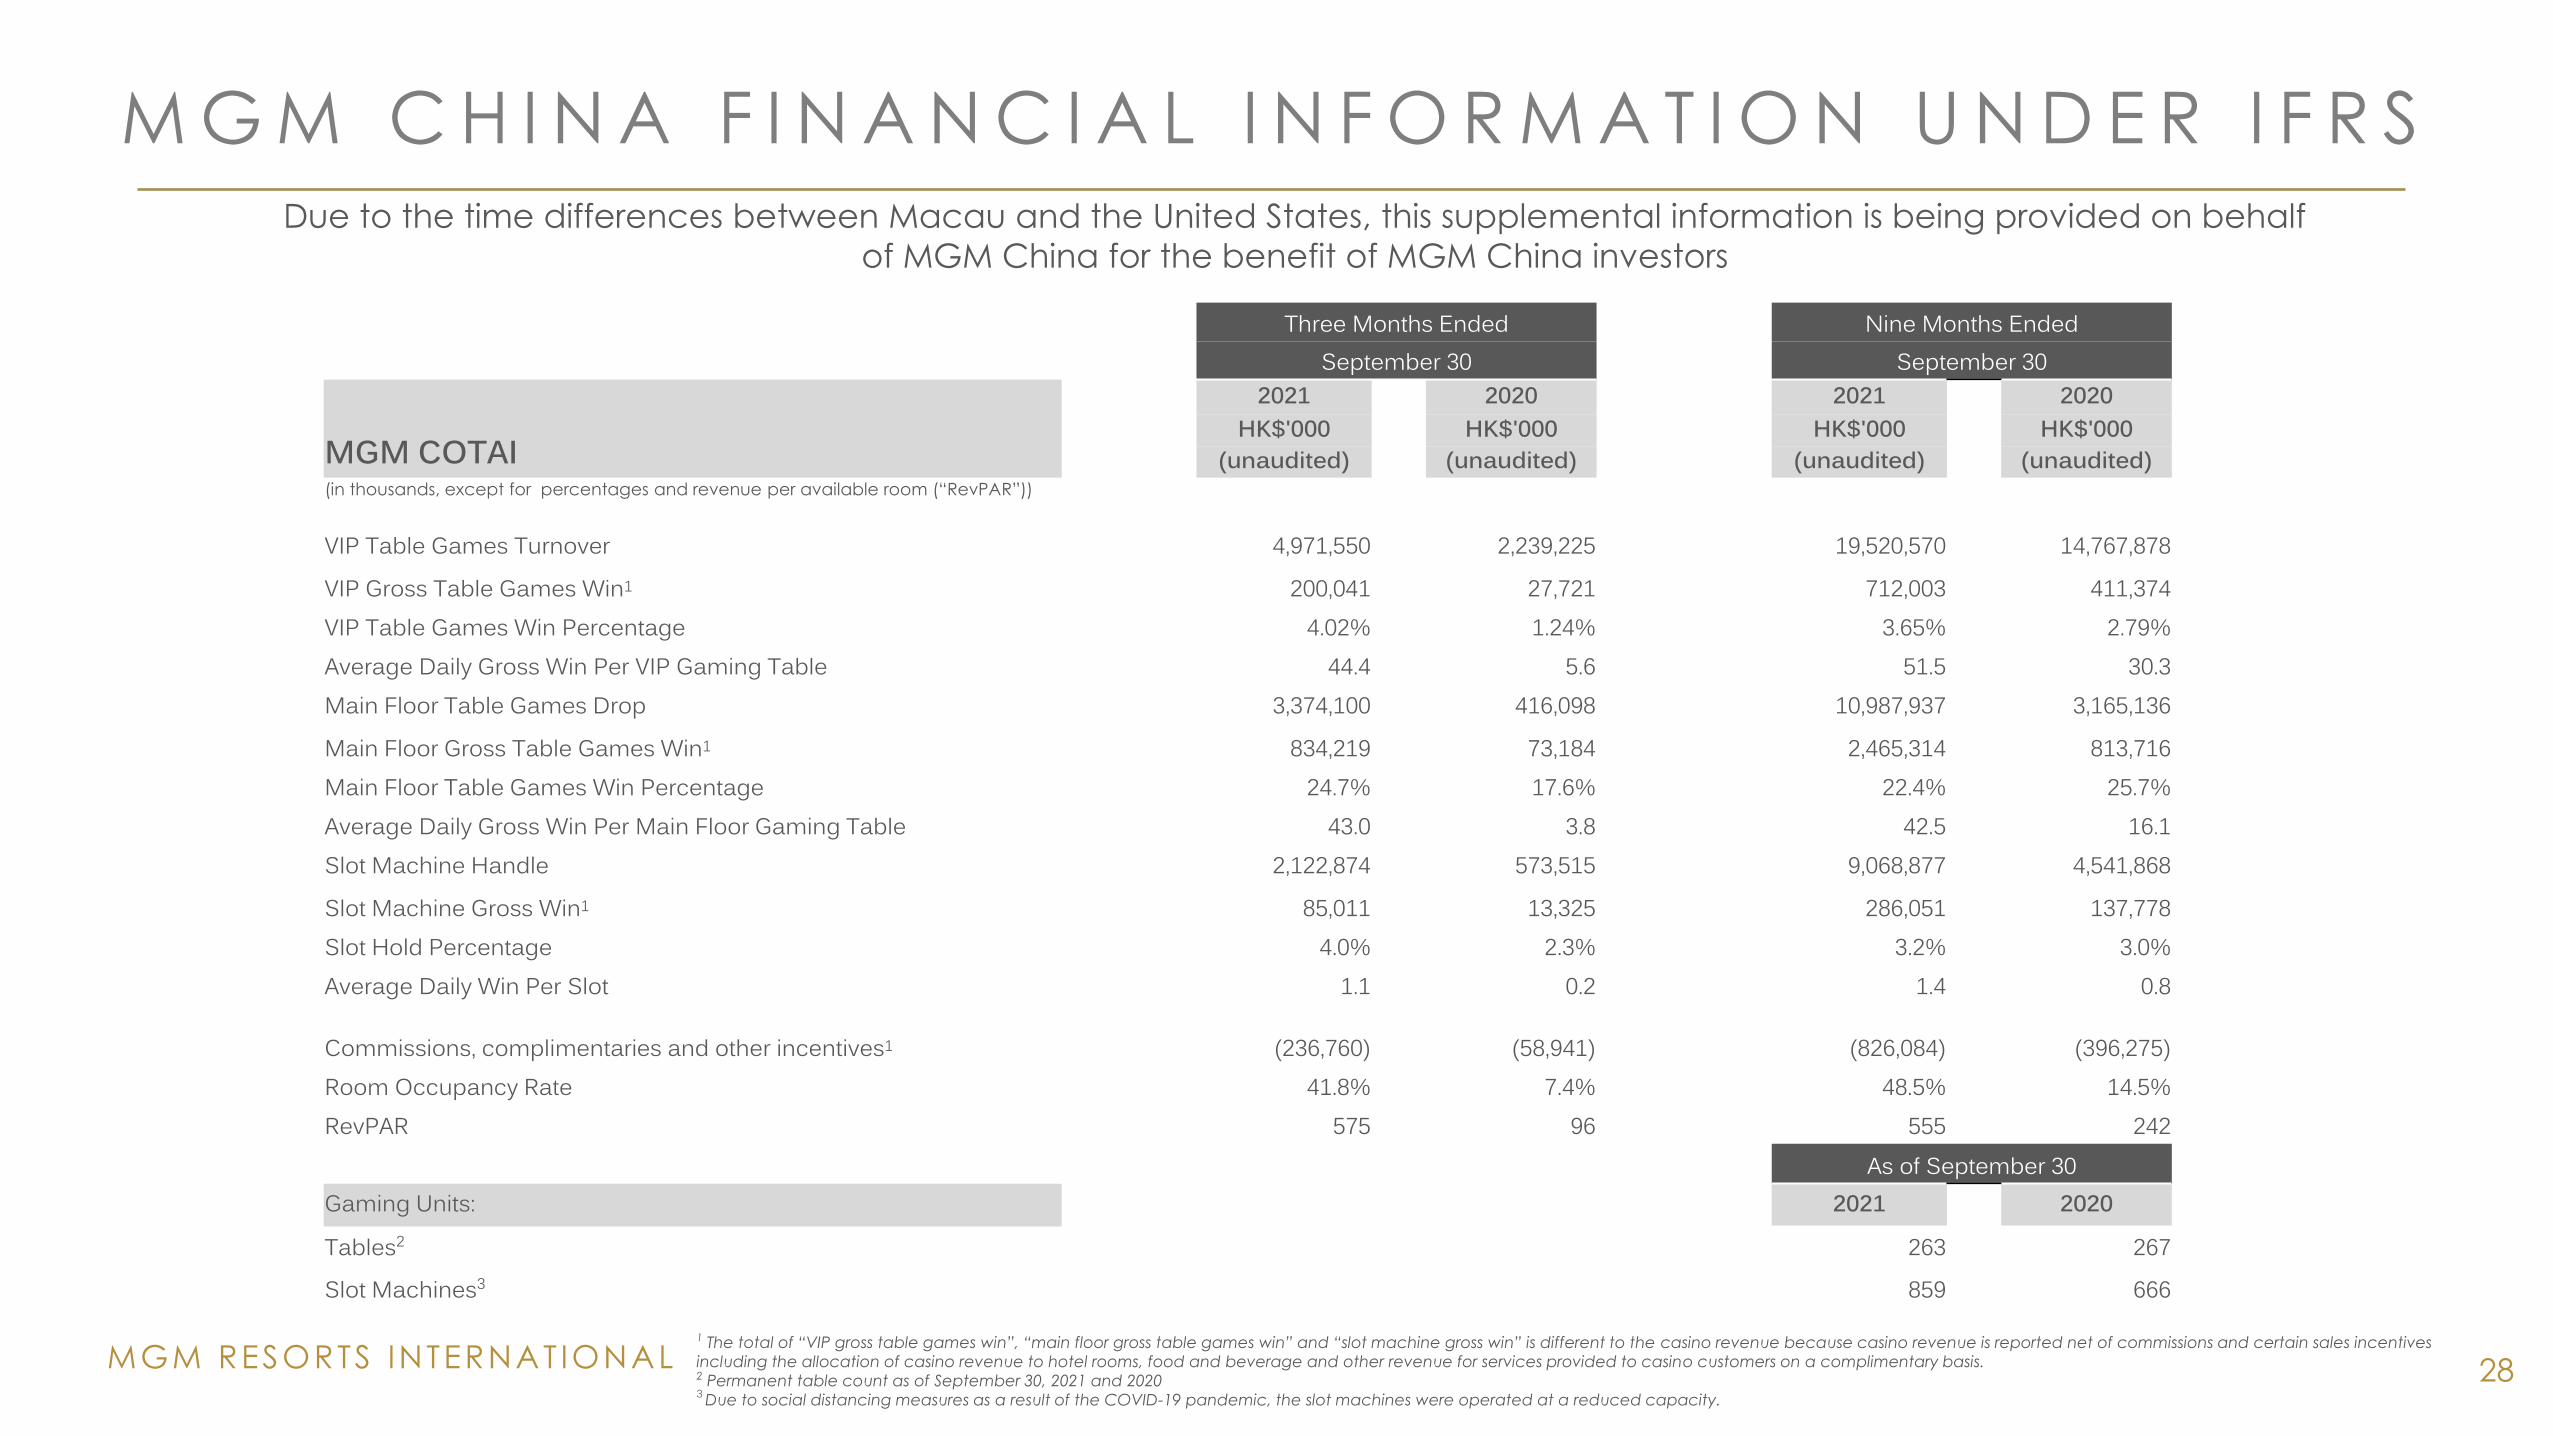
Due to the time differences between Macau and the United States, this supplemental information is being provided on behalf
of MGM China for the benefit of MGM China investors
1 The total of “VIP gross table games win”, “main floor gross table games win” and “slot machine gross win” is different to the casino revenue because casino revenue is reported net of commissions and certain sales incentives
including the allocation of casino revenue to hotel rooms, food and beverage and other revenue for services provided to casino customers on a complimentary basis. 2 Permanent table count as of September 30, 2021 and 20203 Due to social distancing measures as a result of the COVID-19 pandemic, the slot machines were operated at a reduced capacity.
M G M C H I N A F I N A N C I A L I N F O R M A T I O N U N D E R I F R S
Three Months Ended Nine Months EndedSeptember 30 September 30
MGM COTAI
2021 2020 2021 2020HK$'000 HK$'000 HK$'000 HK$'000
(unaudited) (unaudited) (unaudited) (unaudited)(in thousands, except for percentages and revenue per available room (“RevPAR”))
VIP Table Games Turnover 4,971,550 2,239,225 19,520,570 14,767,878
VIP Gross Table Games Win1 200,041 27,721 712,003 411,374VIP Table Games Win Percentage 4.02% 1.24% 3.65% 2.79%Average Daily Gross Win Per VIP Gaming Table 44.4 5.6 51.5 30.3Main Floor Table Games Drop 3,374,100 416,098 10,987,937 3,165,136
Main Floor Gross Table Games Win1 834,219 73,184 2,465,314 813,716Main Floor Table Games Win Percentage 24.7% 17.6% 22.4% 25.7%Average Daily Gross Win Per Main Floor Gaming Table 43.0 3.8 42.5 16.1Slot Machine Handle 2,122,874 573,515 9,068,877 4,541,868
Slot Machine Gross Win1 85,011 13,325 286,051 137,778Slot Hold Percentage 4.0% 2.3% 3.2% 3.0%Average Daily Win Per Slot 1.1 0.2 1.4 0.8
Commissions, complimentaries and other incentives1 (236,760) (58,941) (826,084) (396,275)Room Occupancy Rate 41.8% 7.4% 48.5% 14.5%RevPAR 575 96 555 242
As of September 30Gaming Units: 2021 2020
Tables2 263 267
Slot Machines3 859 666
MGM RESORTS INTERNAT IONAL
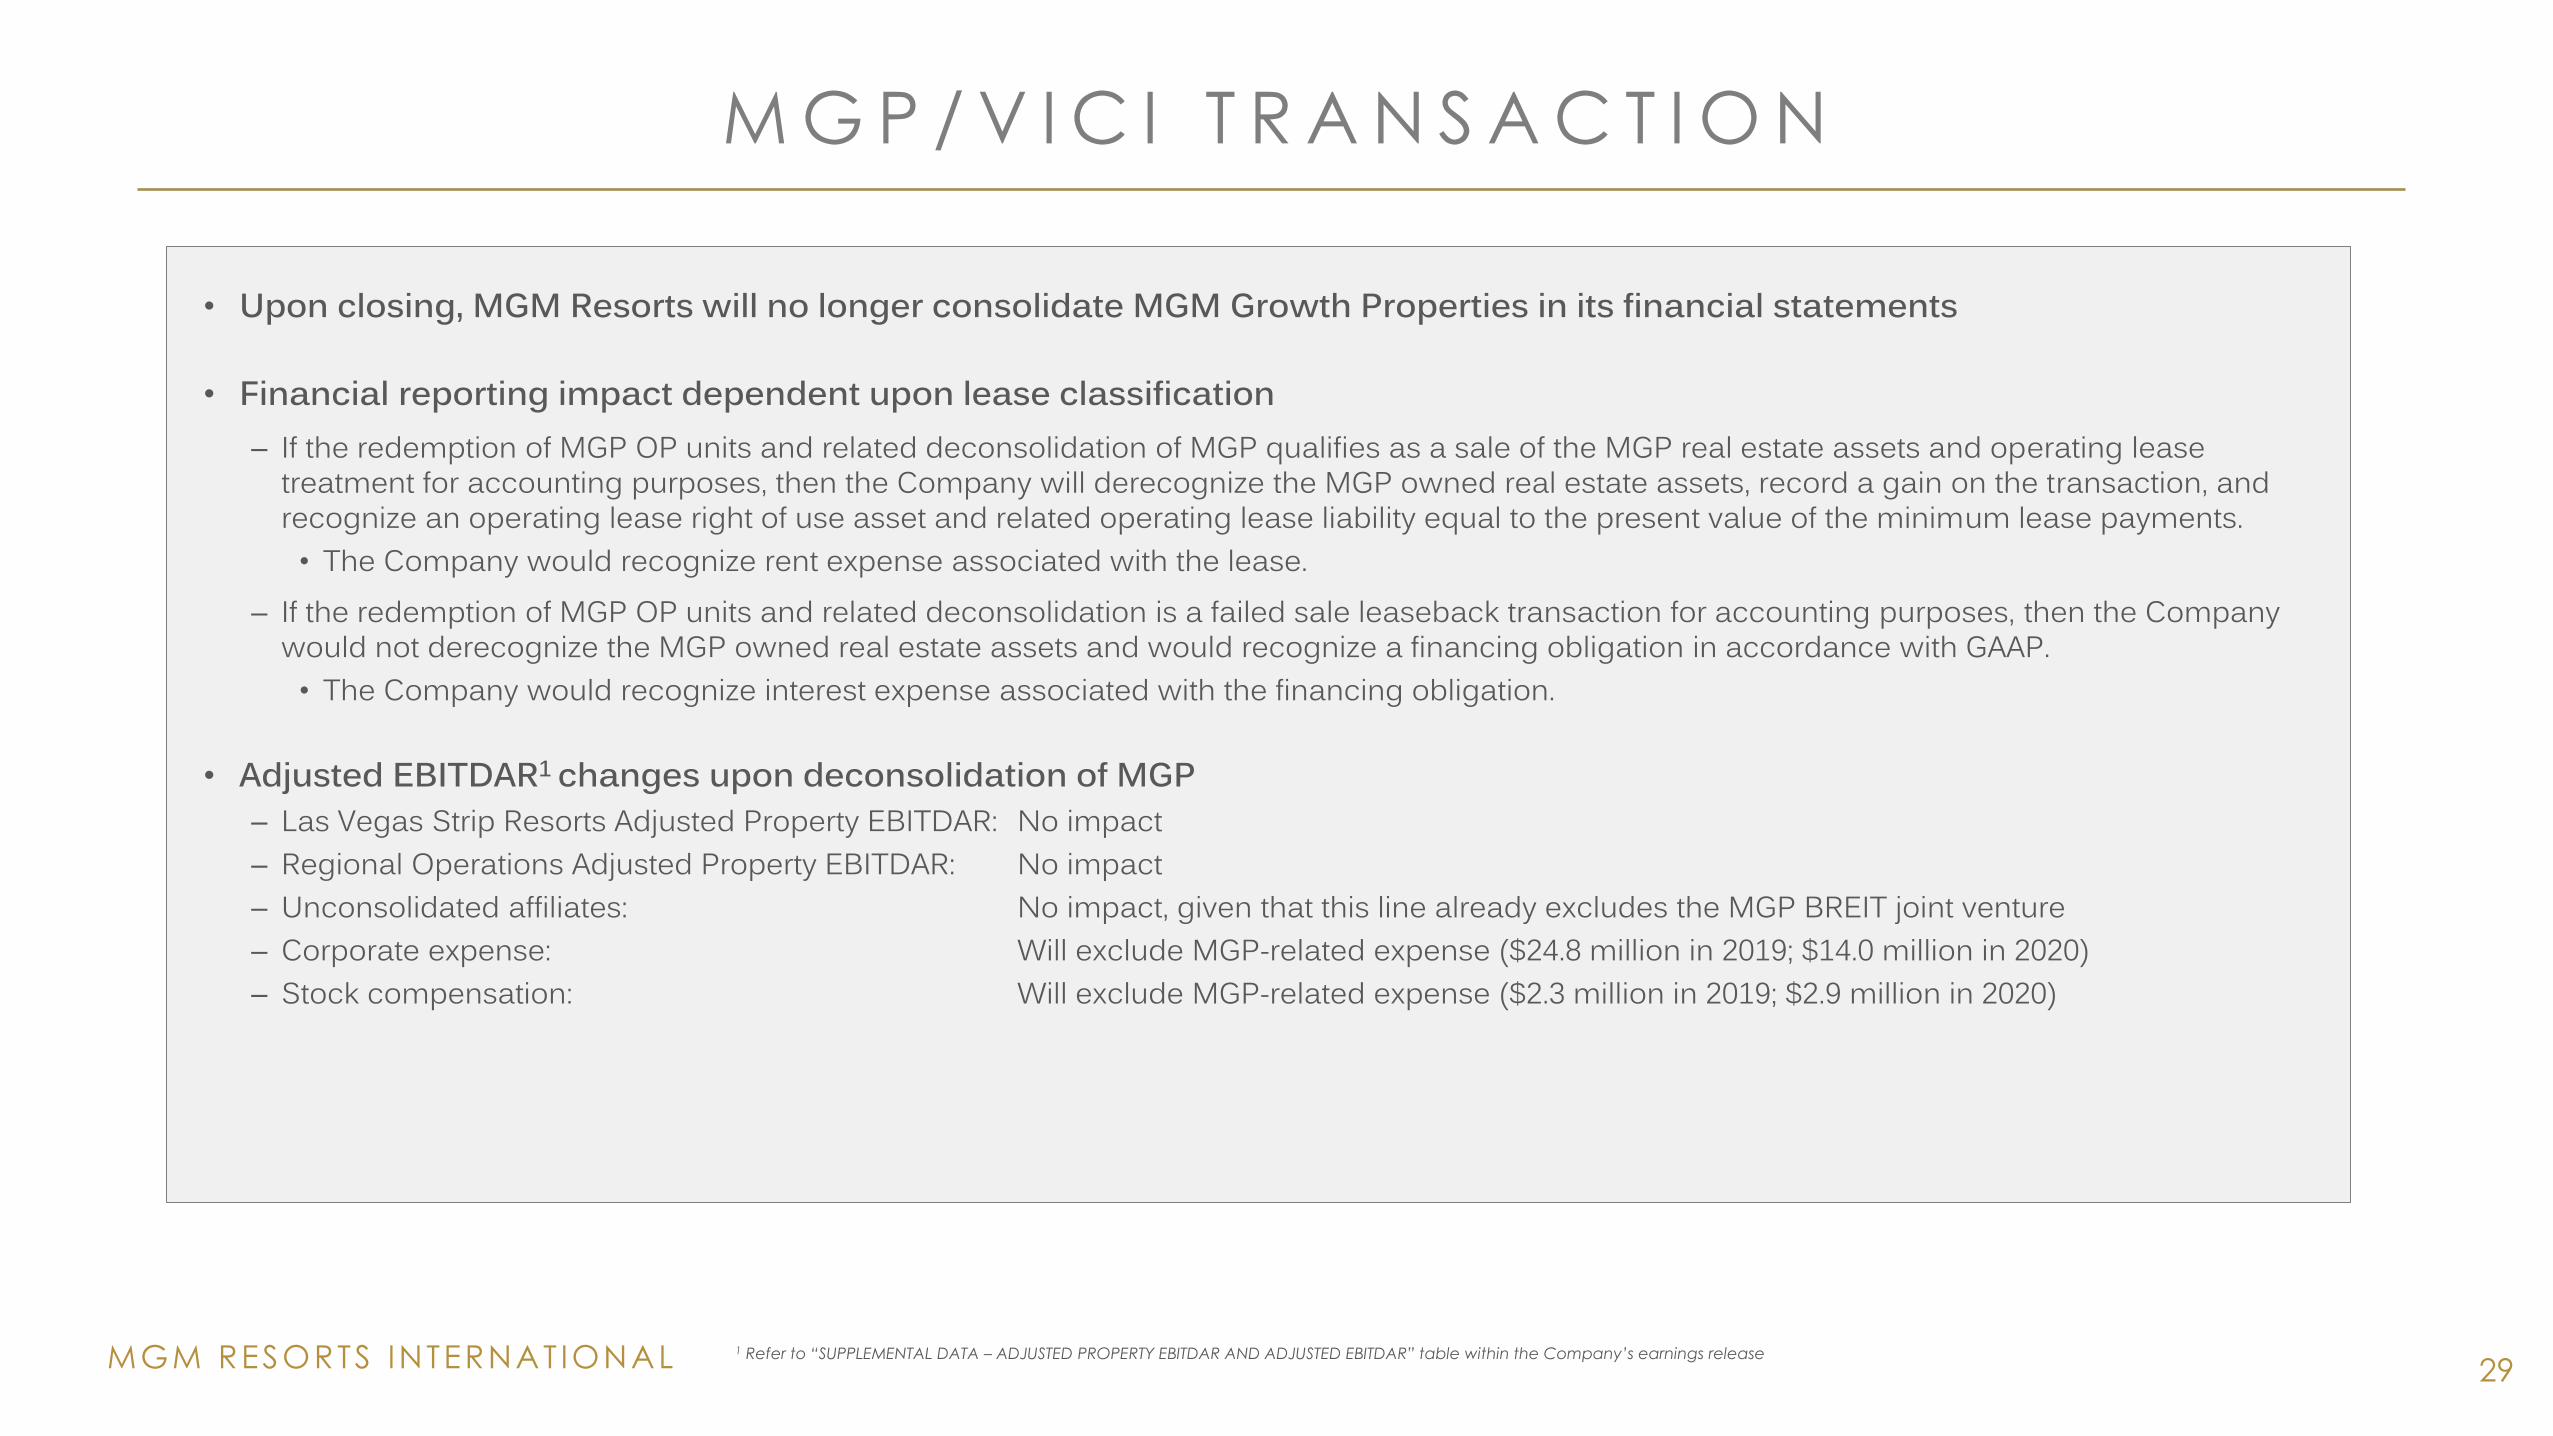
M G P / V I C I T R A N S A C T I O N
29
• Upon closing, MGM Resorts will no longer consolidate MGM Growth Properties in its financial statements
• Financial reporting impact dependent upon lease classification– If the redemption of MGP OP units and related deconsolidation of MGP qualifies as a sale of the MGP real estate assets and operating lease
treatment for accounting purposes, then the Company will derecognize the MGP owned real estate assets, record a gain on the transaction, and recognize an operating lease right of use asset and related operating lease liability equal to the present value of the minimum lease payments. • The Company would recognize rent expense associated with the lease.
– If the redemption of MGP OP units and related deconsolidation is a failed sale leaseback transaction for accounting purposes, then the Company would not derecognize the MGP owned real estate assets and would recognize a financing obligation in accordance with GAAP. • The Company would recognize interest expense associated with the financing obligation.
• Adjusted EBITDAR1 changes upon deconsolidation of MGP– Las Vegas Strip Resorts Adjusted Property EBITDAR: No impact– Regional Operations Adjusted Property EBITDAR: No impact– Unconsolidated affiliates: No impact, given that this line already excludes the MGP BREIT joint venture– Corporate expense: Will exclude MGP-related expense ($24.8 million in 2019; $14.0 million in 2020)– Stock compensation: Will exclude MGP-related expense ($2.3 million in 2019; $2.9 million in 2020)
1 Refer to “SUPPLEMENTAL DATA – ADJUSTED PROPERTY EBITDAR AND ADJUSTED EBITDAR” table within the Company’s earnings release
MGM RESORTS INTERNAT IONAL
C I T Y C E N T E R T R A N S A C T I O N
30
• Transaction impact– Upon closing of the purchase of Infinity World’s 50% interest in CityCenter, the Company consolidated CityCenter which included recognizing
CityCenter’s assets and liabilities at fair value with the difference between the purchase price and the fair value of the net assets acquired being recorded as goodwill.
– The Company recorded a $1.6 billion net gain upon consolidation for the difference between the fair value and carrying value of its investment.
• Impact to consolidated financial statements– Net revenues:
• Include CityCenter’s net revenues• Exclude “reimbursed costs” revenues historically related to the Company’s management of CityCenter (e.g. $420 million in 2019)
– G&A includes rent expense related to CityCenter, which is recognized on a straight-line basis over the lease term– Initial year’s cash rent of $215 million to Blackstone
• Impact to Adjusted EBITDAR1
– Las Vegas Strip Adjusted Property EBITDAR: Includes CityCenter’s Adjusted Property EBITDAR– Unconsolidated affiliates: Excludes MGM’s share of CityCenter’s operating income, adjusted for basis differences– Management and other: Minimal impact – Corporate expense: Minimal impact– Stock compensation: Will increase slightly
1 Refer to “SUPPLEMENTAL DATA – ADJUSTED PROPERTY EBITDAR AND ADJUSTED EBITDAR” table within the Company’s earnings release
MGM RESORTS INTERNAT IONAL
O S A K A Y U M E S H I M A I N T E G R A T E D R E S O R T P R O J E C T
31
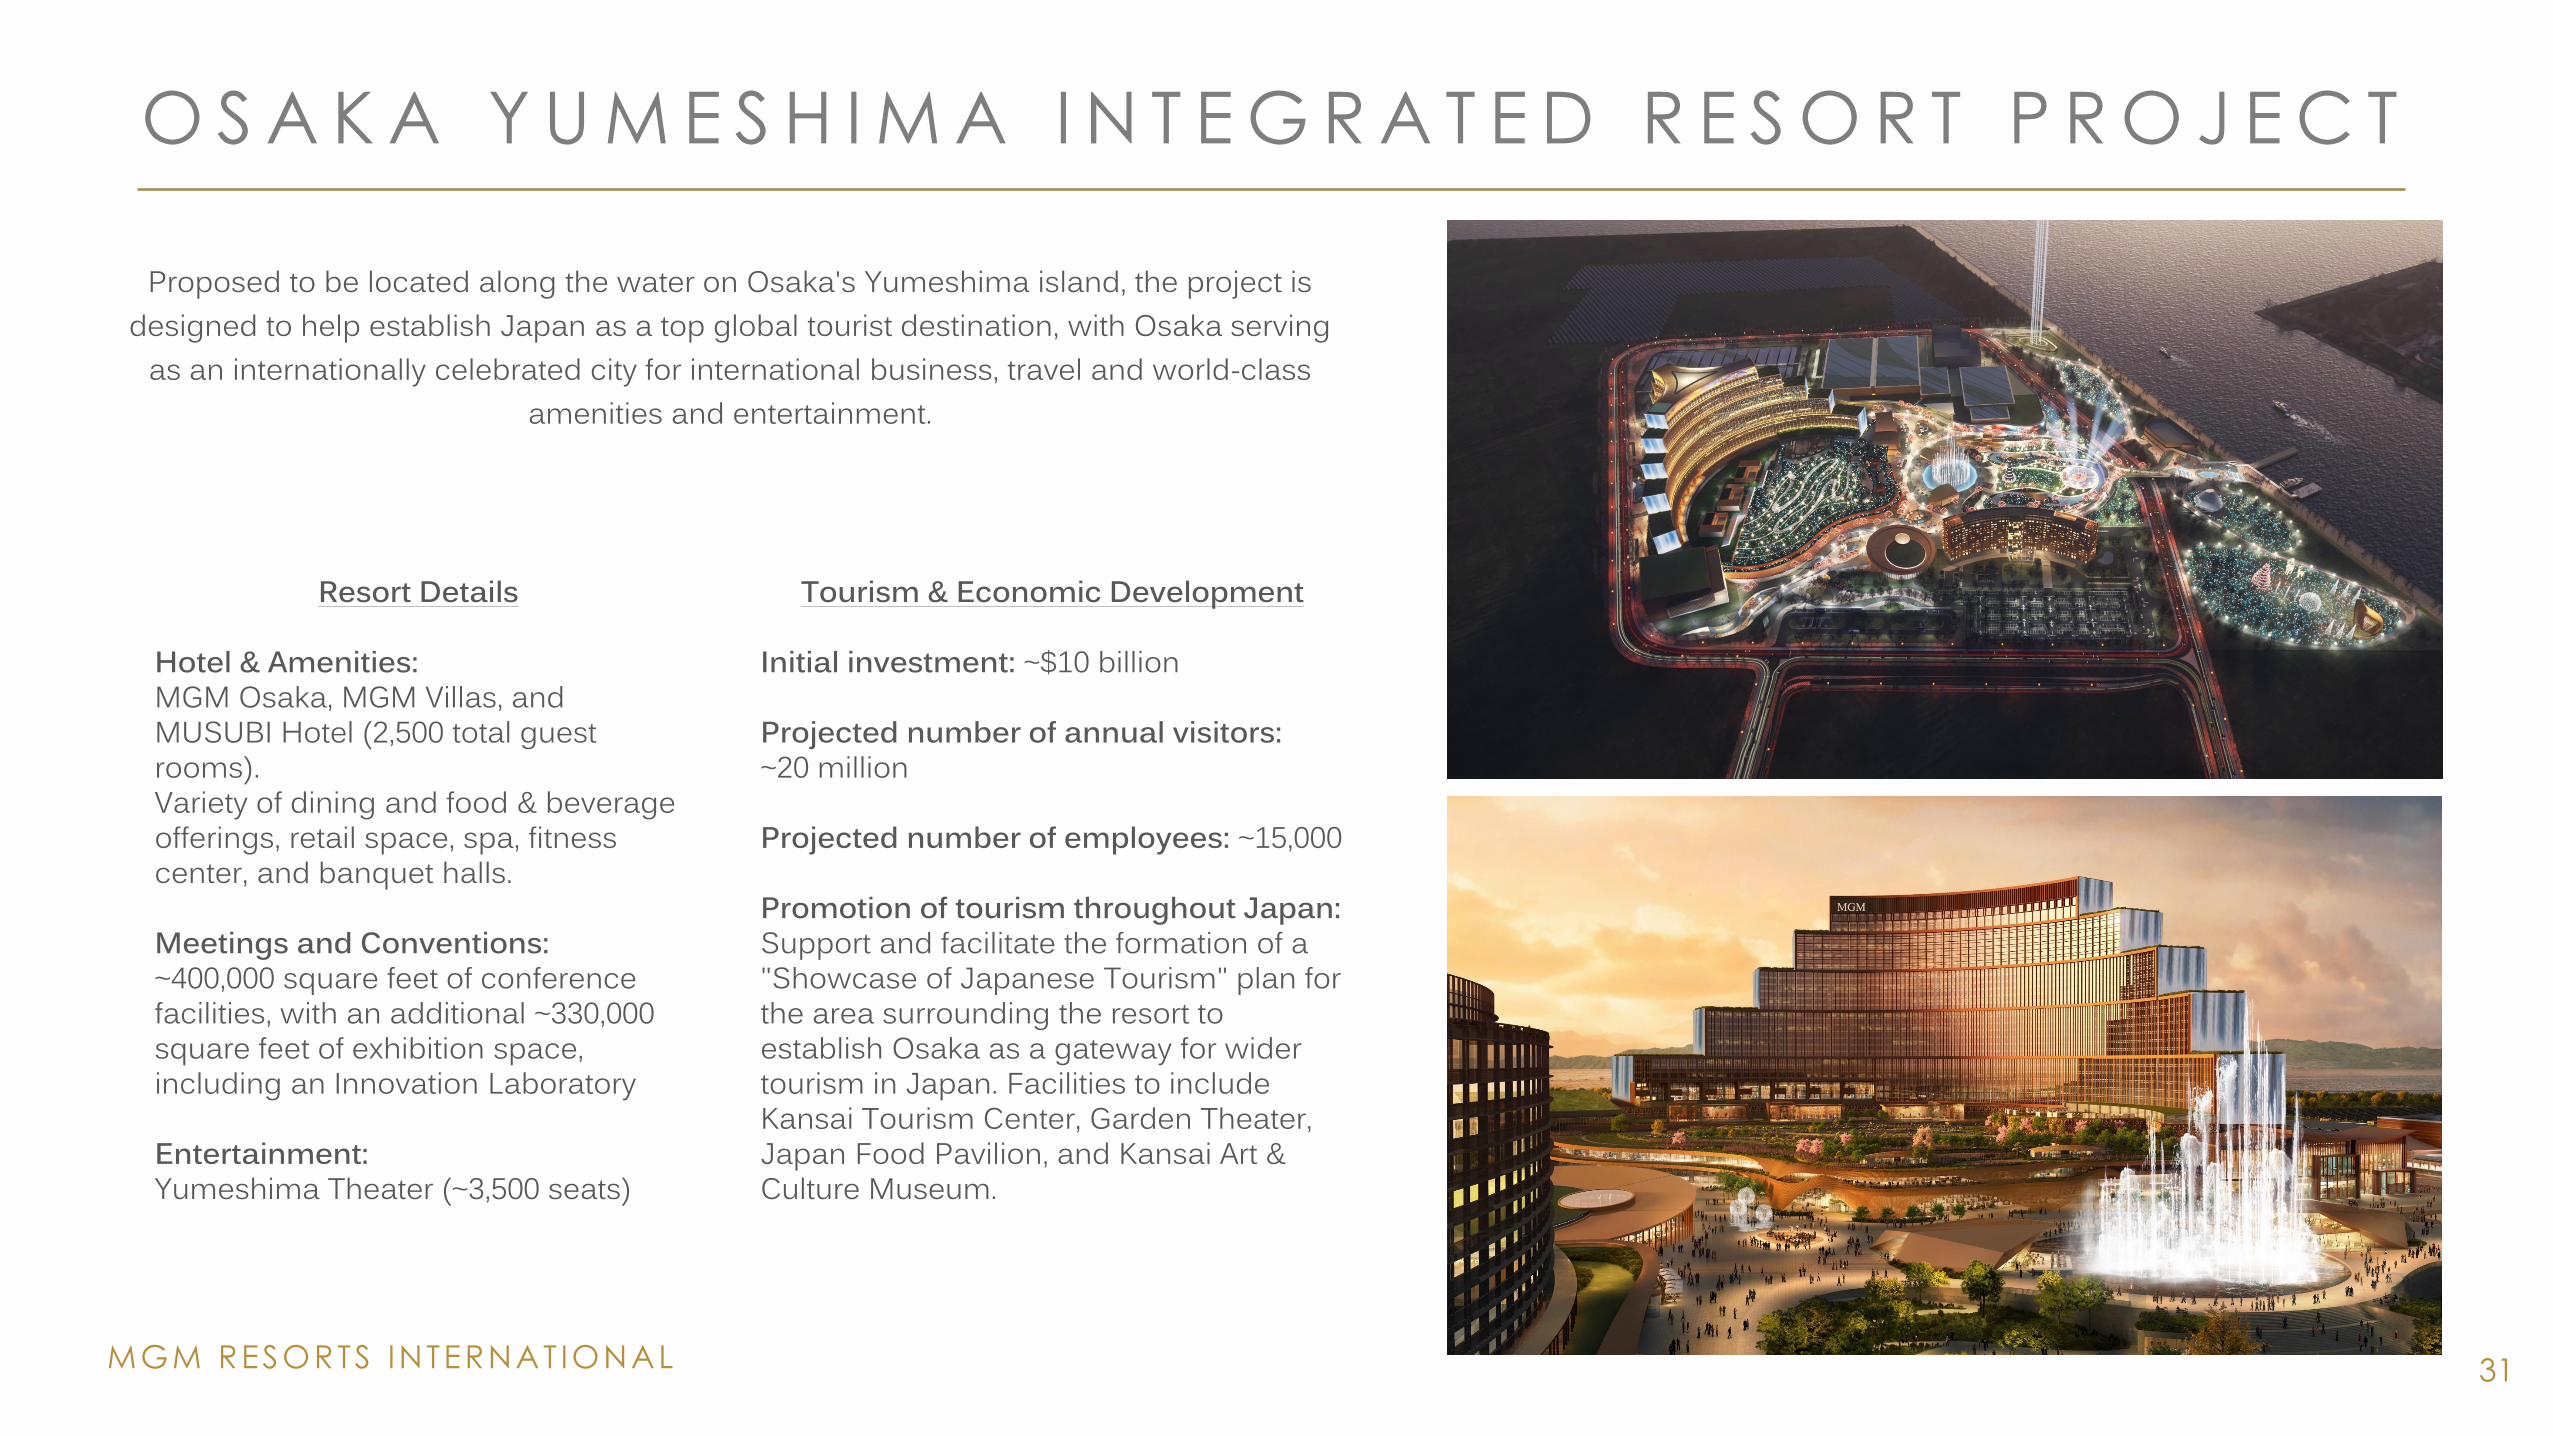
Resort Details
Hotel & Amenities: MGM Osaka, MGM Villas, and MUSUBI Hotel (2,500 total guest rooms). Variety of dining and food & beverage offerings, retail space, spa, fitness center, and banquet halls.
Meetings and Conventions: ~400,000 square feet of conference facilities, with an additional ~330,000 square feet of exhibition space, including an Innovation Laboratory
Entertainment: Yumeshima Theater (~3,500 seats)
Tourism & Economic Development
Initial investment: ~$10 billion
Projected number of annual visitors: ~20 million
Projected number of employees: ~15,000
Promotion of tourism throughout Japan: Support and facilitate the formation of a "Showcase of Japanese Tourism" plan for the area surrounding the resort to establish Osaka as a gateway for wider tourism in Japan. Facilities to include Kansai Tourism Center, Garden Theater, Japan Food Pavilion, and Kansai Art & Culture Museum.
Proposed to be located along the water on Osaka's Yumeshima island, the project is designed to help establish Japan as a top global tourist destination, with Osaka serving
as an internationally celebrated city for international business, travel and world-class amenities and entertainment.
MGM RESORTS INTERNAT IONAL 32
A G R E E M E N T W I T H V I C I T O R E D E E M M G P
O P E R A T I N G P A R T N E R S H I P U N I T S
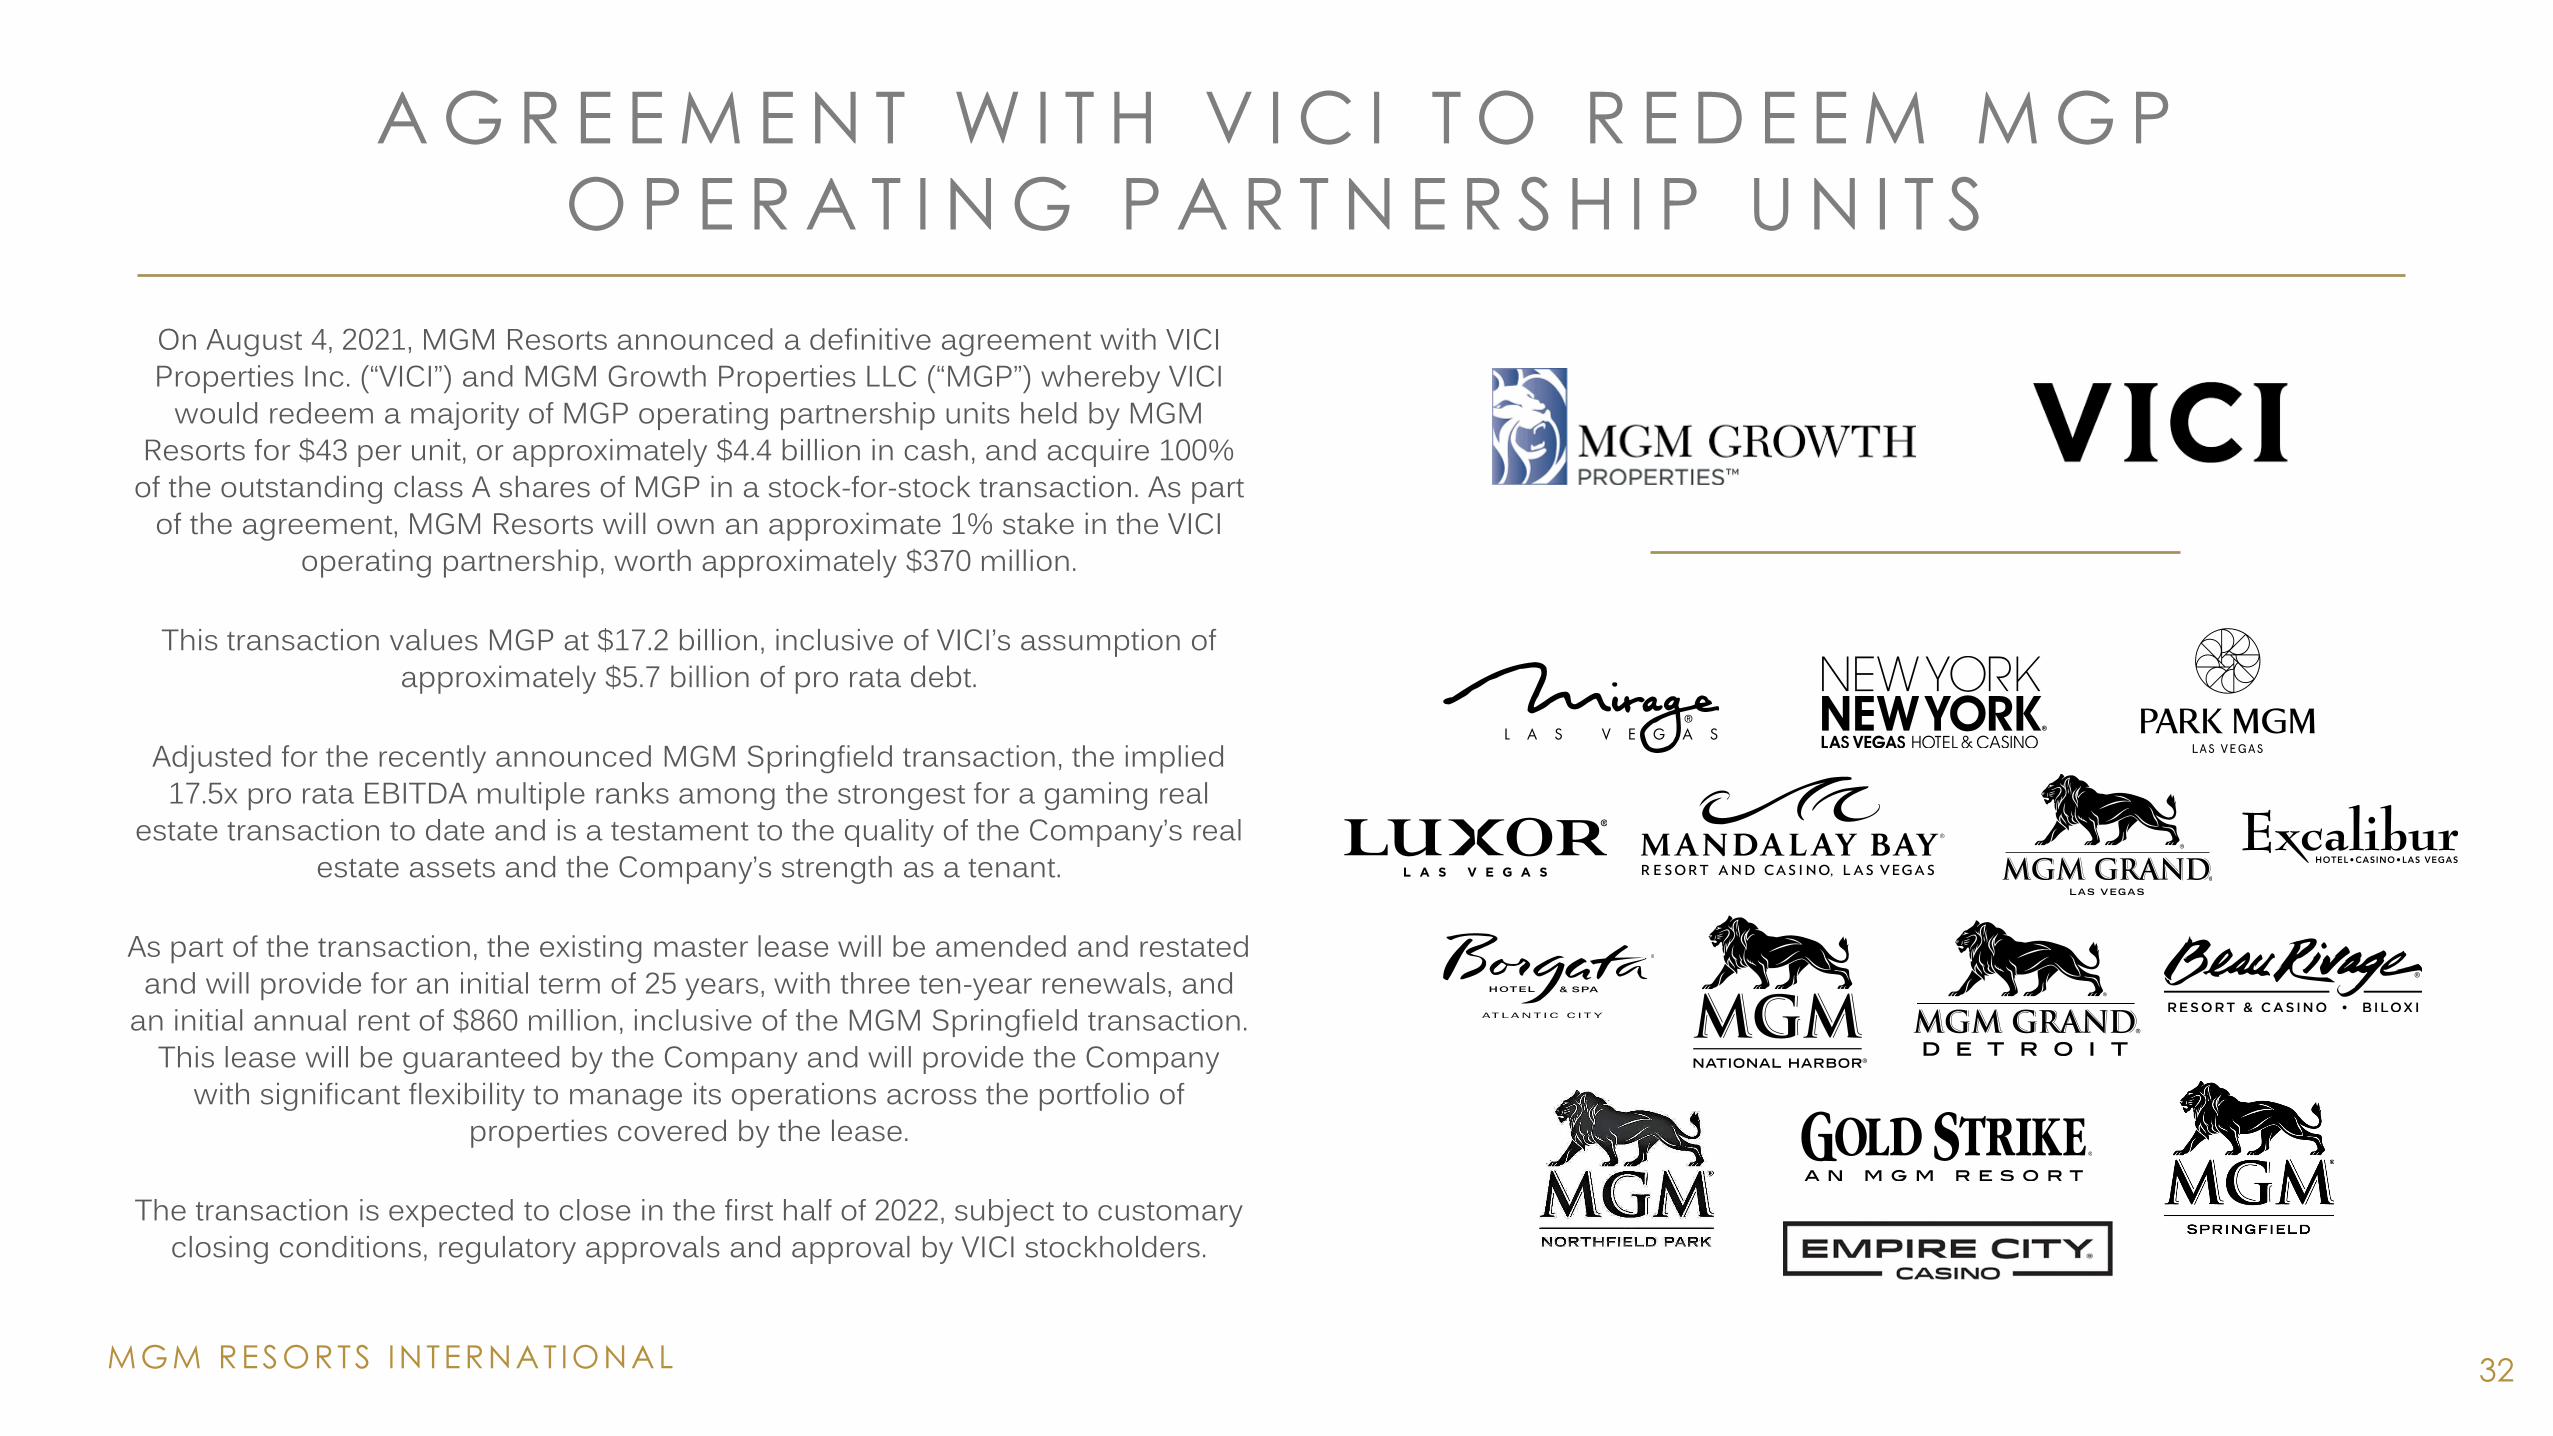
On August 4, 2021, MGM Resorts announced a definitive agreement with VICI Properties Inc. (“VICI”) and MGM Growth Properties LLC (“MGP”) whereby VICI
would redeem a majority of MGP operating partnership units held by MGM Resorts for $43 per unit, or approximately $4.4 billion in cash, and acquire 100%
of the outstanding class A shares of MGP in a stock-for-stock transaction. As part of the agreement, MGM Resorts will own an approximate 1% stake in the VICI
operating partnership, worth approximately $370 million.
This transaction values MGP at $17.2 billion, inclusive of VICI’s assumption of approximately $5.7 billion of pro rata debt.
Adjusted for the recently announced MGM Springfield transaction, the implied 17.5x pro rata EBITDA multiple ranks among the strongest for a gaming real
estate transaction to date and is a testament to the quality of the Company’s real estate assets and the Company’s strength as a tenant.
As part of the transaction, the existing master lease will be amended and restated and will provide for an initial term of 25 years, with three ten-year renewals, and
an initial annual rent of $860 million, inclusive of the MGM Springfield transaction. This lease will be guaranteed by the Company and will provide the Company
with significant flexibility to manage its operations across the portfolio of properties covered by the lease.
The transaction is expected to close in the first half of 2022, subject to customary closing conditions, regulatory approvals and approval by VICI stockholders.
P U R C H A S E D I N F I N I T Y W O R L D ’ S
5 0 % I N T E R E S T I N C I T Y C E N T E R
A N D M O N E T I Z E R E A L E S T A T E
A S S E T S
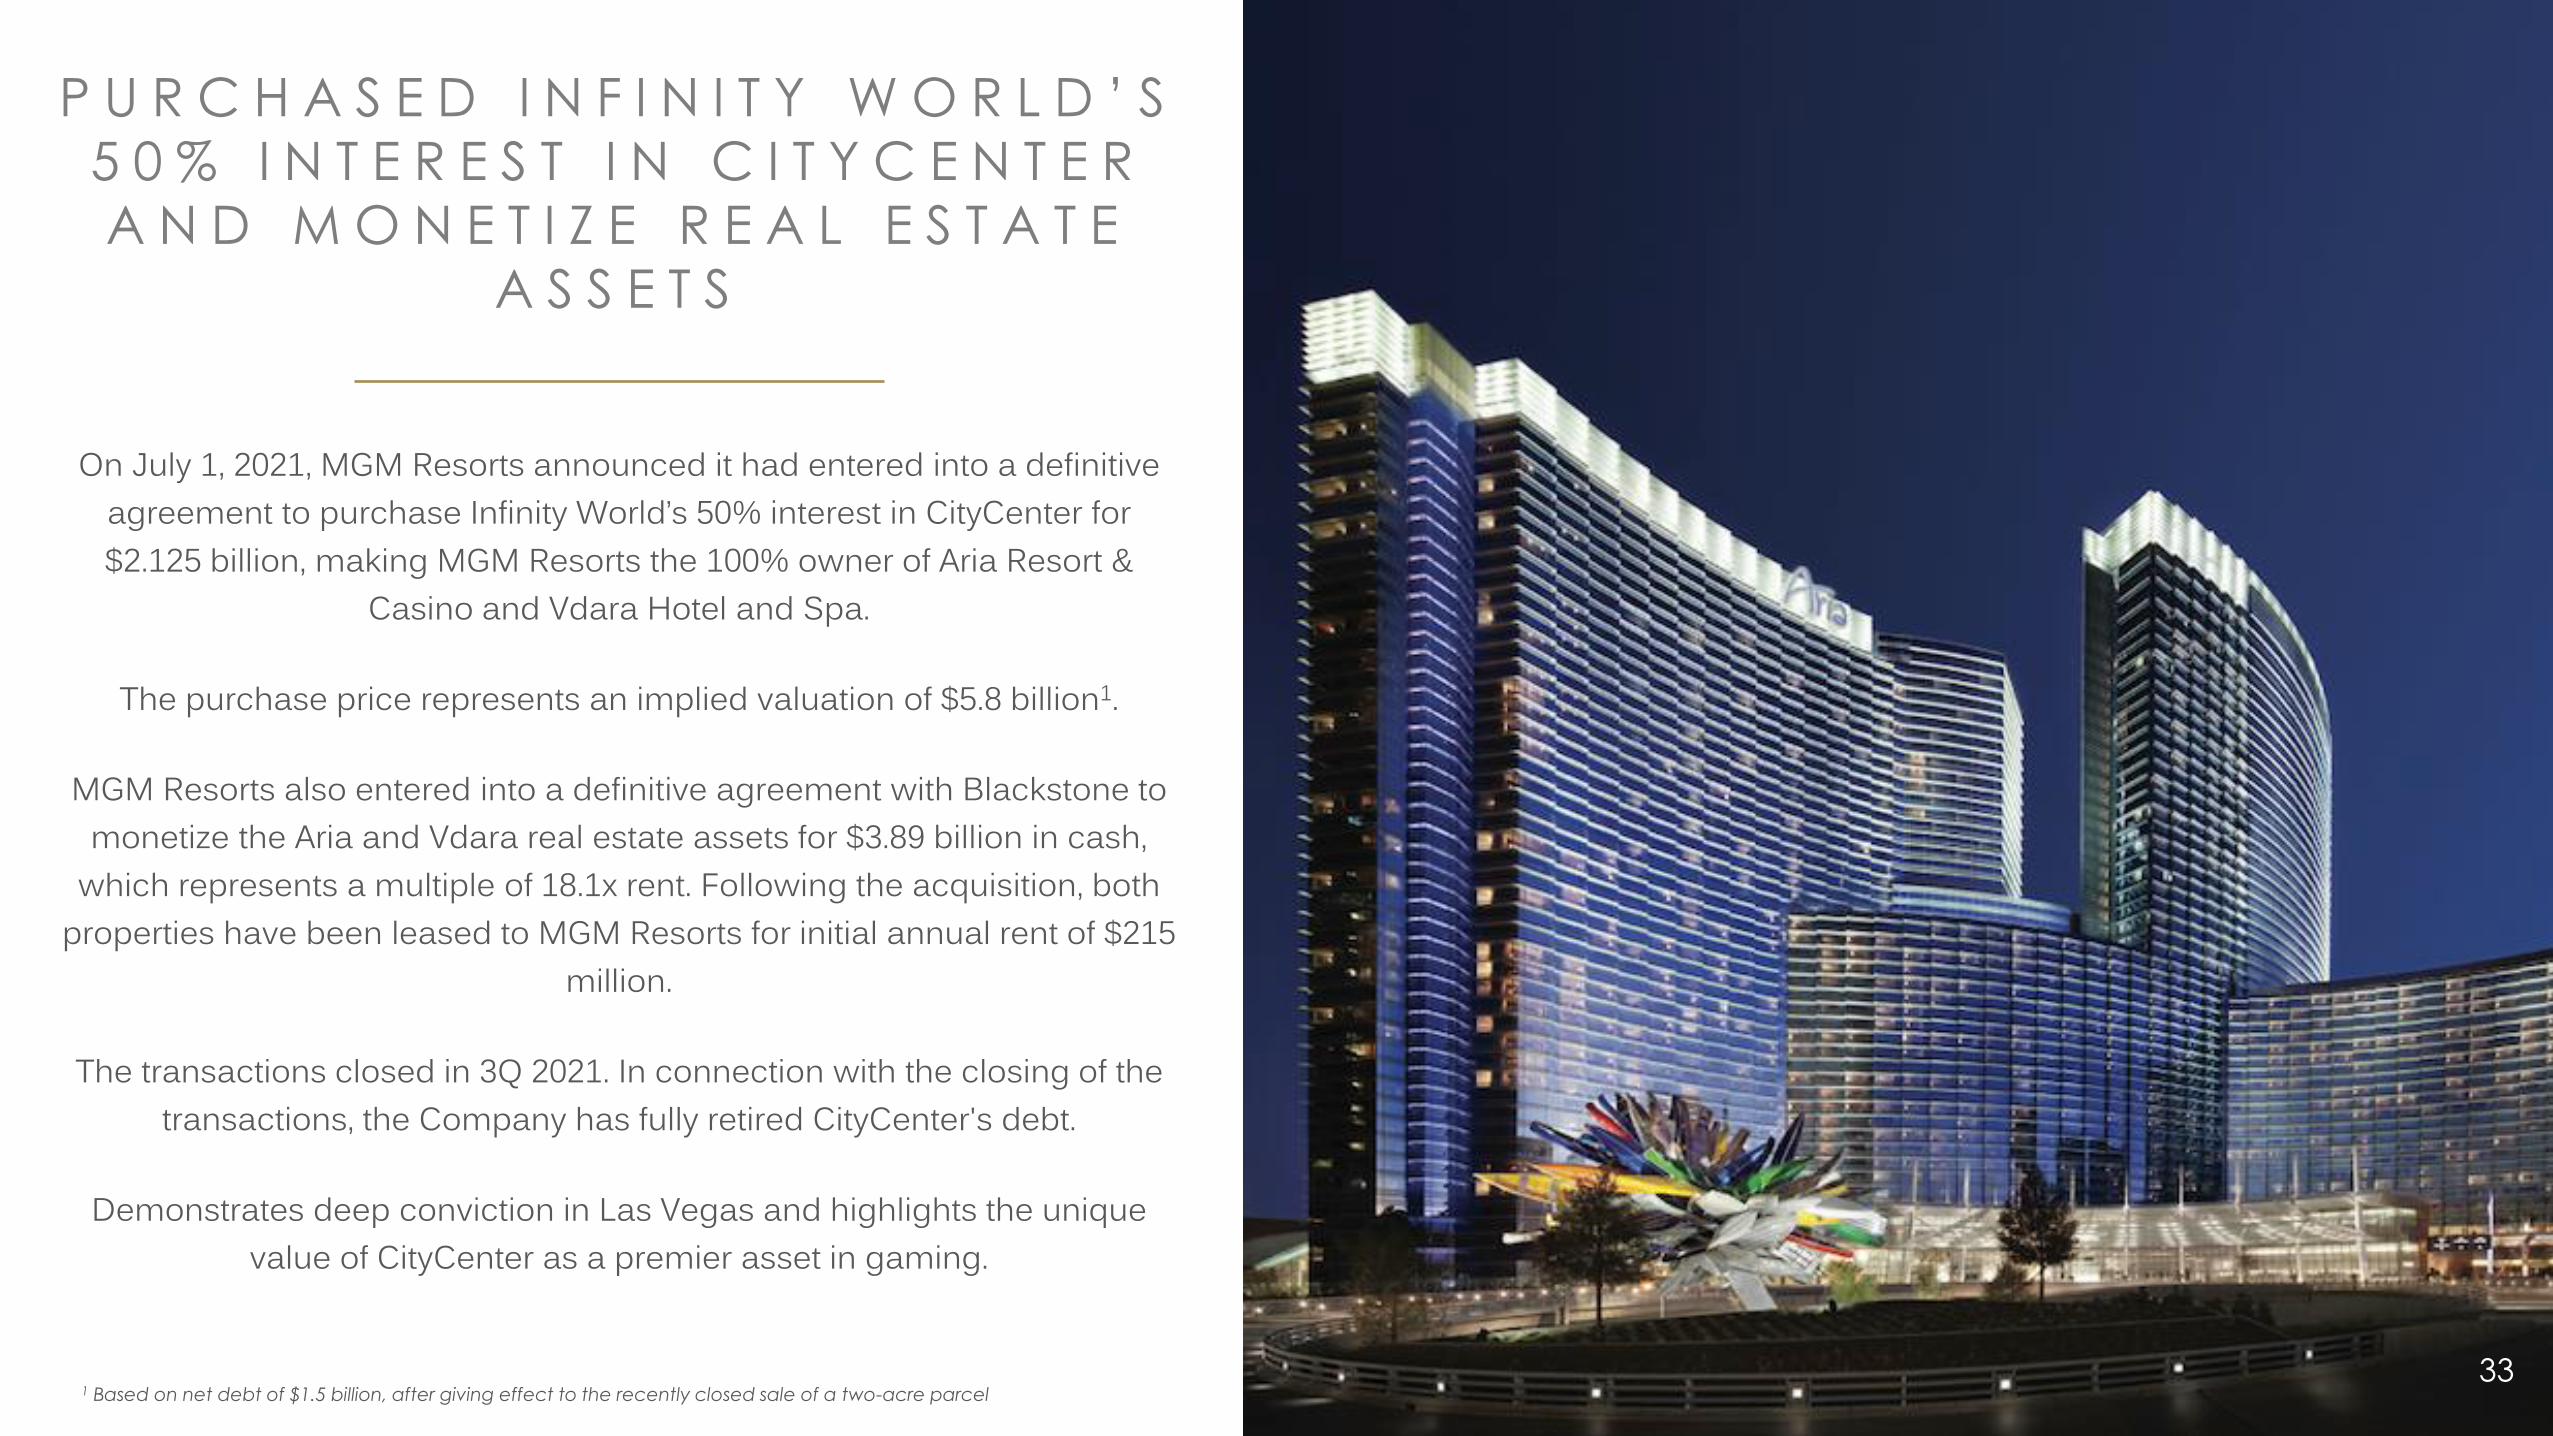
On July 1, 2021, MGM Resorts announced it had entered into a definitive agreement to purchase Infinity World’s 50% interest in CityCenter for $2.125 billion, making MGM Resorts the 100% owner of Aria Resort &
Casino and Vdara Hotel and Spa.
The purchase price represents an implied valuation of $5.8 billion1.
MGM Resorts also entered into a definitive agreement with Blackstone to monetize the Aria and Vdara real estate assets for $3.89 billion in cash,
which represents a multiple of 18.1x rent. Following the acquisition, both properties have been leased to MGM Resorts for initial annual rent of $215
million.
The transactions closed in 3Q 2021. In connection with the closing of the transactions, the Company has fully retired CityCenter's debt.
Demonstrates deep conviction in Las Vegas and highlights the unique value of CityCenter as a premier asset in gaming.
1 Based on net debt of $1.5 billion, after giving effect to the recently closed sale of a two-acre parcel 33
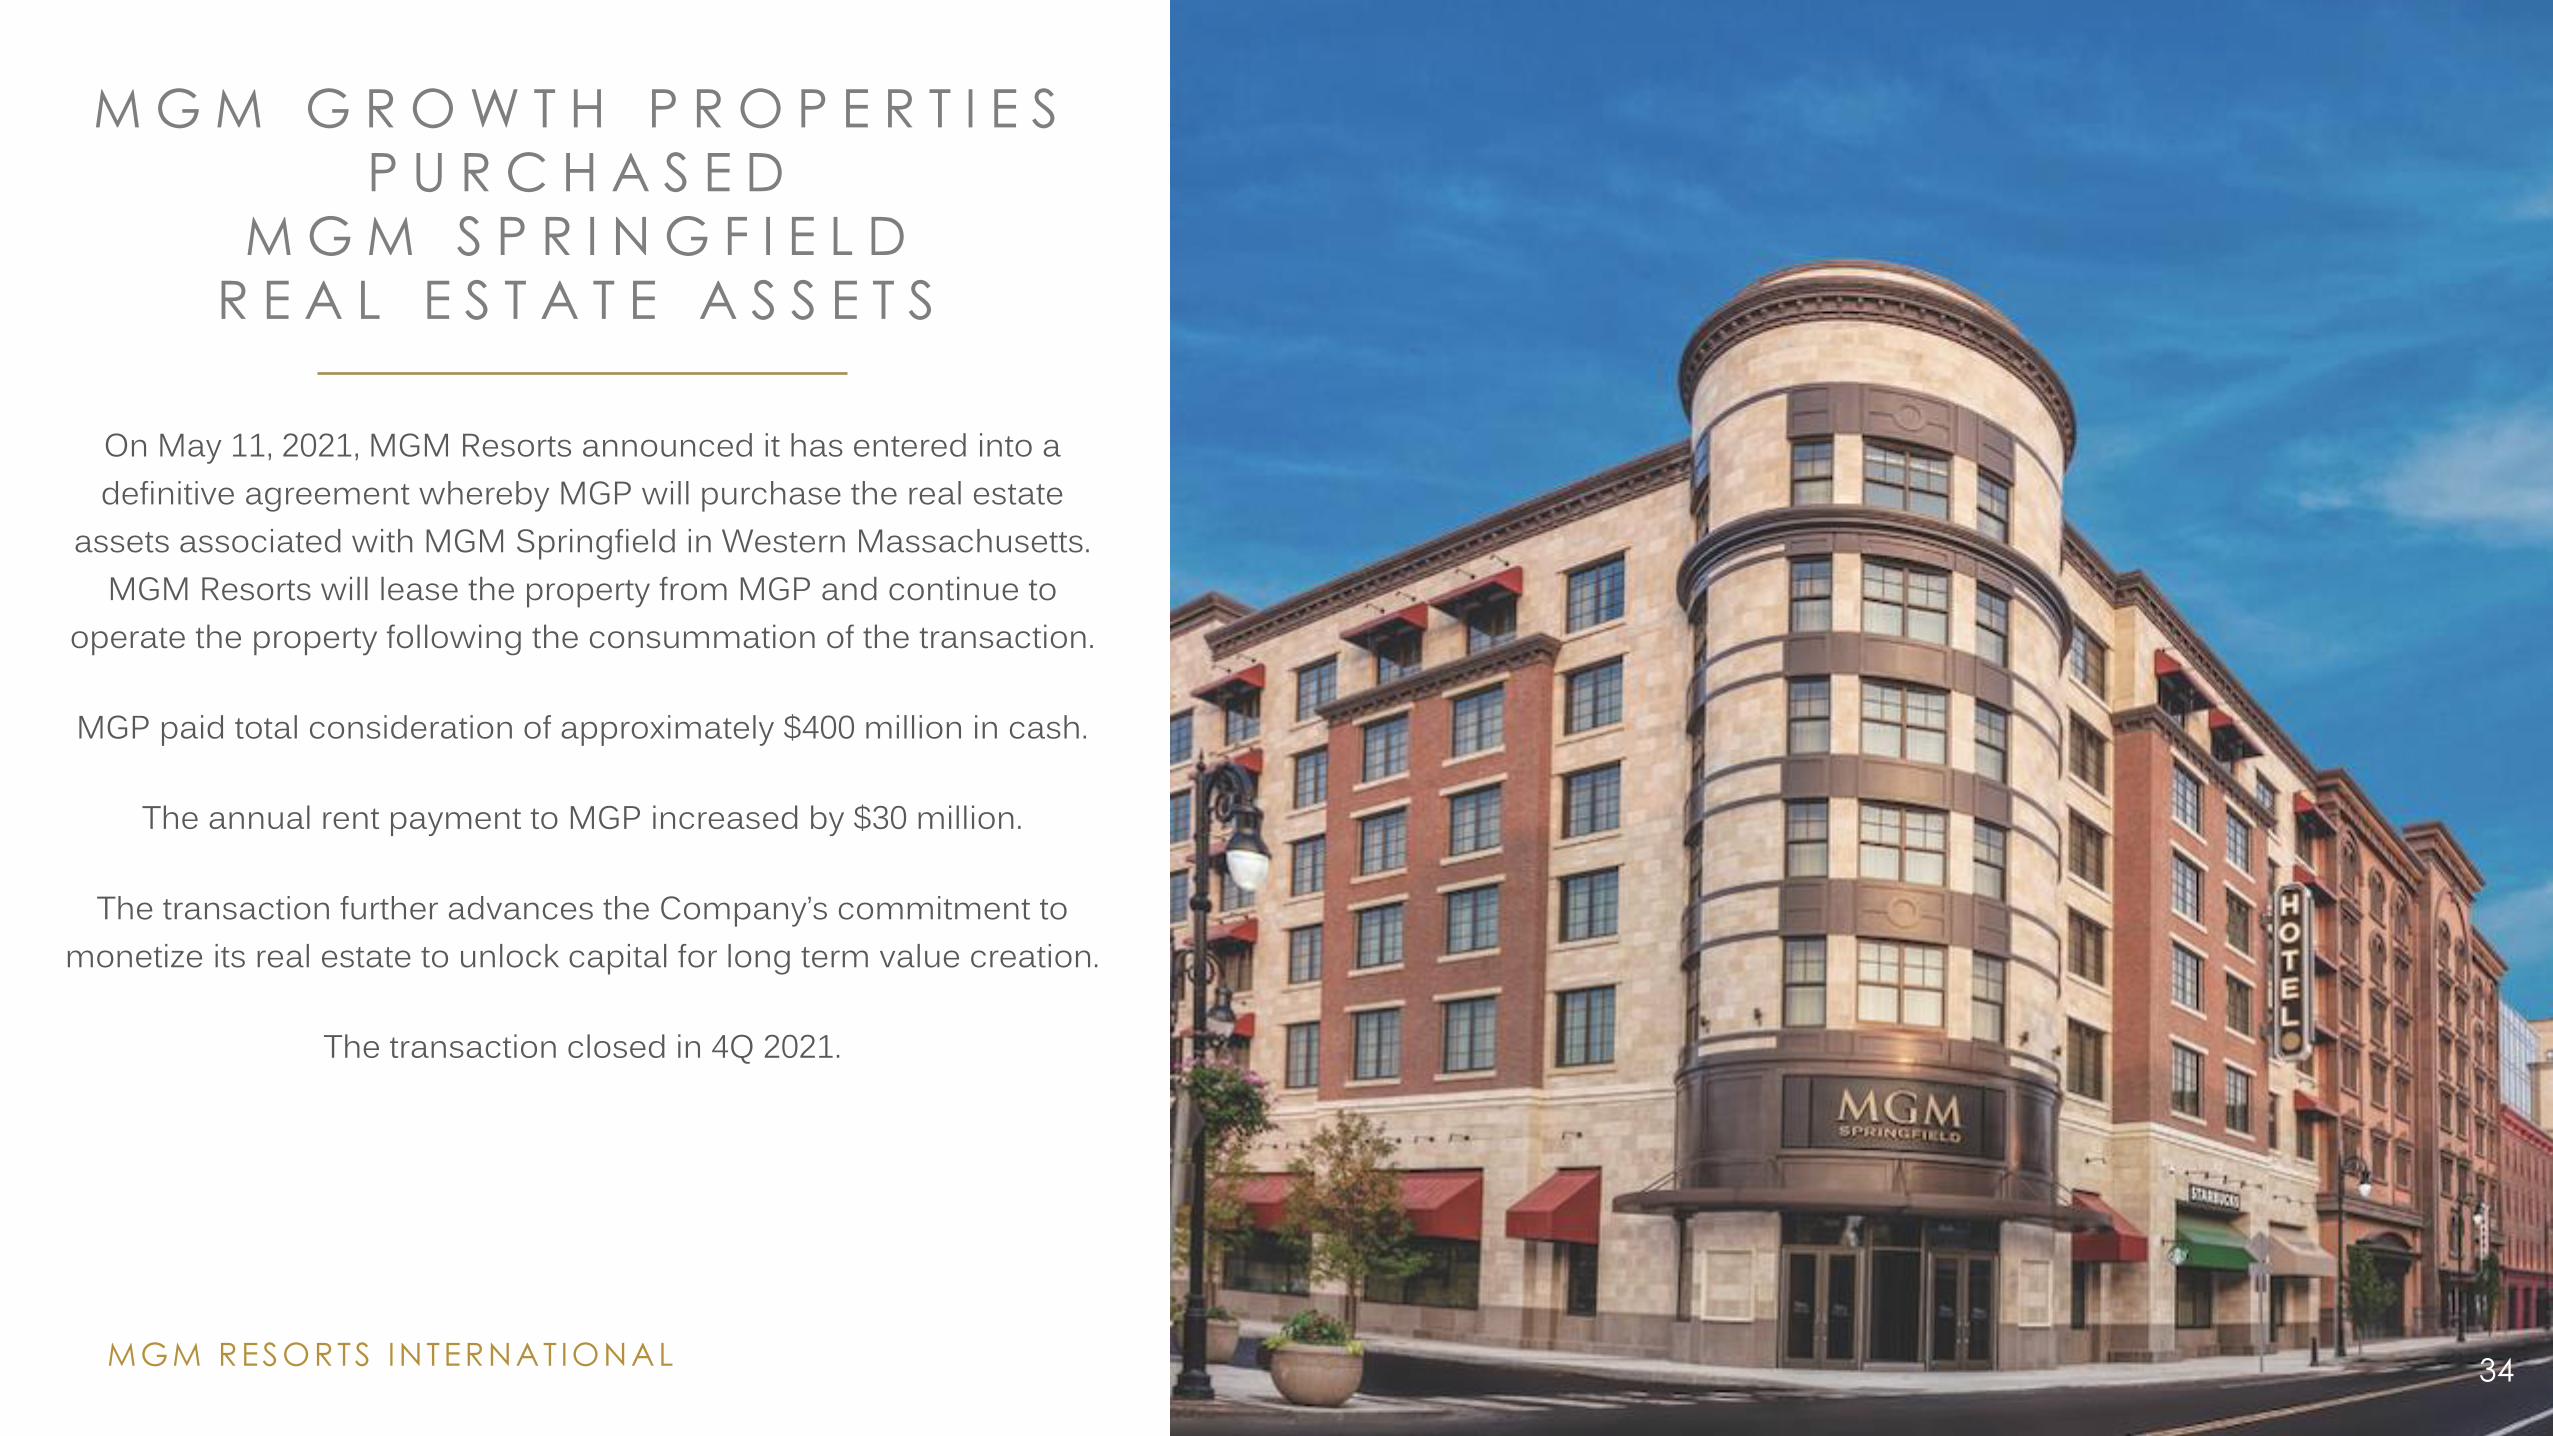
M G M G R O W T H P R O P E R T I E S
P U R C H A S E D
M G M S P R I N G F I E L D
R E A L E S T A T E A S S E T S
34
On May 11, 2021, MGM Resorts announced it has entered into a definitive agreement whereby MGP will purchase the real estate
assets associated with MGM Springfield in Western Massachusetts. MGM Resorts will lease the property from MGP and continue to
operate the property following the consummation of the transaction.
MGP paid total consideration of approximately $400 million in cash.
The annual rent payment to MGP increased by $30 million.
The transaction further advances the Company’s commitment to monetize its real estate to unlock capital for long term value creation.
The transaction closed in 4Q 2021.
MGM RESORTS INTERNAT IONAL
MGM RESORTS INTERNAT IONAL 35
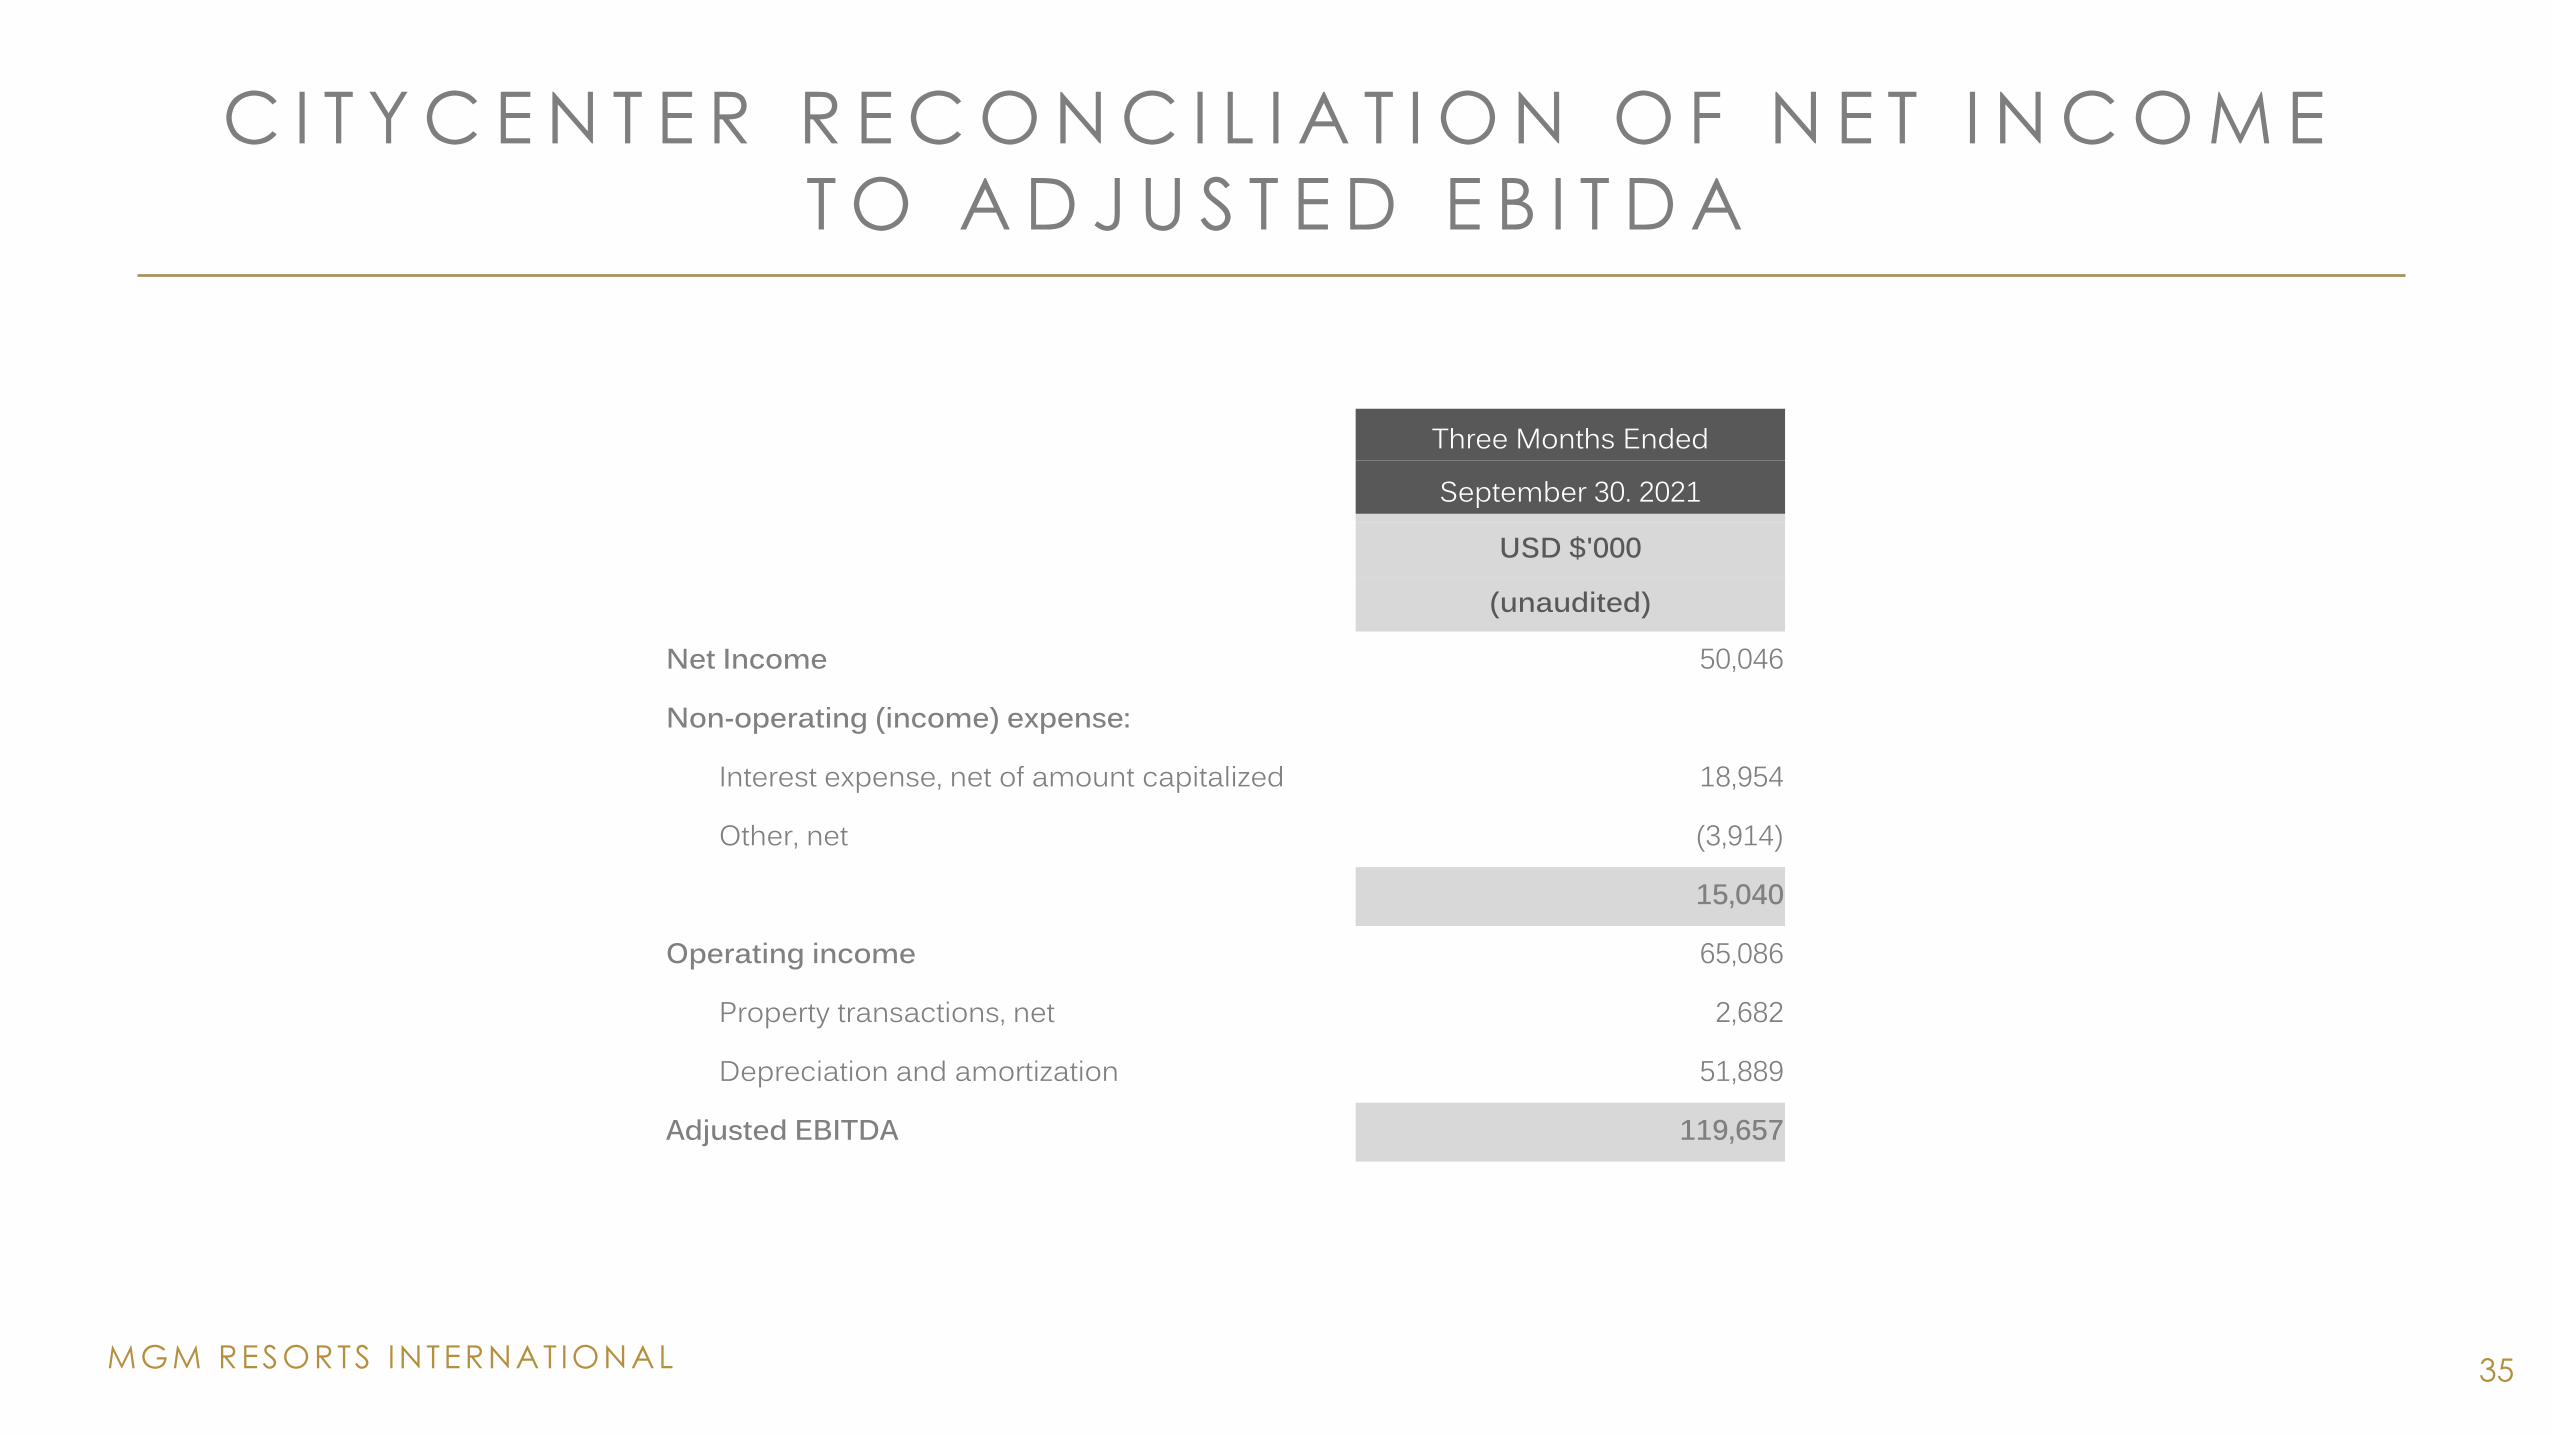
C I T Y C E N T E R R E C O N C I L I A T I O N O F N E T I N C O M E
T O A D J U S T E D E B I T D A
Three Months Ended
September 30. 2021
USD $'000
(unaudited)
Net Income 50,046
Non-operating (income) expense:
Interest expense, net of amount capitalized 18,954
Other, net (3,914)
15,040
Operating income 65,086
Property transactions, net 2,682
Depreciation and amortization 51,889
Adjusted EBITDA 119,657