third unheard poll.pdf
TRANSCRIPT
7/27/2019 Third Unheard poll.pdf
http://slidepdf.com/reader/full/third-unheard-pollpdf 1/20
For
Richer or Poorer WHAT NEW YORKERS WANT IN THE NEXT MAYOR
Major Findings from The Unheard Third 2013
OCTOBER 2013
7/27/2019 Third Unheard poll.pdf
http://slidepdf.com/reader/full/third-unheard-pollpdf 2/20
The Community Service Society of New York (CSS) is an informed,independent, and unwavering voice forpositive action on behalf of more than3 million low-income New Yorkers.CSS draws on a 170-year history of excellence in addressing the root causesof economic disparity. We respondto urgent, contemporary challengesthrough applied research, advocacy,litigation, and innovative programmodels that strengthen and benet all
New Yorkers.
www.cssny.org
About the Authors
Nancy Ranin is Vice President fr
Plicy Research and Advcacy at CSS,
where she leads the wrk n labr,
husing, and yuth issues. She is the
funder f The Unheard Third survey
and has written widely n issues
affecting upward mbility fr lw-wage
wrkers and the challenges f meeting
wrk and family respnsibilities. NancyRankin is a graduate f Crnell and
Princetn University’s Wdrw Wilsn
Schl f Public and Internatinal
Affairs.
Apurva Mehrotra is a plicy analyst
at CSS where he cnducts research
n issues affecting lw-incme New
Yrkers. He recently c-authred
a CSS reprt n CUNY enrllment
trends. He received a Masters in Public
Administratin frm Baruch Cllege.
Lake Research Partners cnducts the
survey annually fr CSS.
In 2013, New York City voters areelecting a new mayor and a slate of new City Council members. CSS iscommitted to ensuring that the voicesof low-income New Yorkers—whomake up one-third of the city’selectorate—are a part of the politicaldebate. During the 2013 electionseason, CSS has sponsored publiccandidate forums, issued a voterguide detailing the positions of thecandidates, and widely disseminatedthe ndings of The Unheard Third,
our annual survey of low-income NewYorkers. These efforts have helped toraise the visibility of issues of concernto our constituents, and to put the
candidates on record with their plansto help low-income New Yorkers andthe working poor.
www.cssny.org/vote2013
7/27/2019 Third Unheard poll.pdf
http://slidepdf.com/reader/full/third-unheard-pollpdf 3/201What New Yorers Want in the Net Mayor
INSIDE THIS REPORT
About The Unheard Third
Major Findings from The Unheard Third 2013
A New Consensus
How the Survey Was Conducted
What New Yorers Want: Jbs with Upward Mbility
A Change in Educatin Plicies An Affrdable Place t Live
2
5
1012
15
16
17
7/27/2019 Third Unheard poll.pdf
http://slidepdf.com/reader/full/third-unheard-pollpdf 4/202 What New Yorers Want in the Net Mayor
For Richer or Poorer:WHAT NEW YORkERS WANT IN THE NExT MAYOR
Major Findings from The Unheard Third 2013
This mayoral election is shaping up as
a referendum on whether or not New
Yorkers agree with the argument put
forward by the Democratic candidate
that New York has become a tale of
two cities, one prospering and one
struggling to survive. Do voters want
the next mayor to make economic
advancement for those left behind acenterpiece of his agenda? And if so,
what could the next mayor actually
do to help low-income New Yorkers
get ahead? In our annual survey, The
Unheard Third 2013, we put these
questions to New Yorkers—including
those in the bottom third of incomes
as well as those better off. How
worried are voters about widening
inequality? Where do New Yorkers
stand on the proposals being debated
about jobs, housing, and the schools?How much appetite do voters really
have to combat poverty on the scale
needed to have an impact? And do
the early fall victories and polling
leads for more progressive candidates
reect the views of mostly Democratic
primary voters, or reveal a deeper
sea-change in attitudes that could
unite voters and become the new
mainstream?
We found a surprising level of agree-ment across incomes on what have
come to be some of the dening issues
of this year’s mayoral race. New York-
ers, at every income level, overwhelm-
ingly agree that the wealthy have
beneted most from the Bloomberg
years. Sixty-three percent point to the
wealthy as having gained the most
while only seven percent say the poor,
a perception shared by low-income
New Yorkers with moderate and
higher-income respondents. Just 16
percent think the middle class has ben-
eted the most. These ndings come
at a time when the city’s poverty rate
remains stubbornly high at 21.2 per-
cent, a level that has not declined to
its pre-recession rate of 18.5 percent,while those in the top of the income
distribution have bounced back and
seen their incomes rise.
Recent job growth has been con-centrated in low-paid sectors. In
the 2008 recession and recovery
that followed, the city experienced a
net loss of 33,900 jobs in high and
middle-wage industries compared to
a net gain of nearly 102,000 jobs in
industries where average wages fall
below $36,600, not enough to bring a
family of three above twice the federal
poverty level. The loss of better-paid
jobs and the standard of living they
made possible is weighing on the pub-lic’s mind. Our survey found that three
out of four New Yorkers are worried
about a disappearing middle class, and
less than half (46 percent) think it’s
now possible for poor people to climb
up the rungs of the economic ladder.
This represents a growing pessimism
over last year, when just over half of
New Yorkers thought the poor had a
shot at upward mobility.
Given these widespread concerns, it
is perhaps not surprising that voters
across the income divide broadly agree
on a set of policies to invest in educa-
tion, create more affordable housing,
and spur the kind of job growth that
widens economic opportunities. Some
differences emerge along partisan
lines. Yet, even across parties, we
found high levels of support among
both Democrats and Republicans fora number of specic proposals that
would defy the conventional wisdom
about expected Republican views.
D vters want the next mayr t make
ecnmic advancement fr thse left behind
a centerpiece f his agenda?
In the charts that follow, ndings re-
ported by income category are for all
respondents in the sample. Findings
reported by party identication in-
clude only respondents who said they
were currently registered to vote.
Fr details n hw the survey was cnducted
see page 17.
7/27/2019 Third Unheard poll.pdf
http://slidepdf.com/reader/full/third-unheard-pollpdf 5/203What New Yorers Want in the Net Mayor
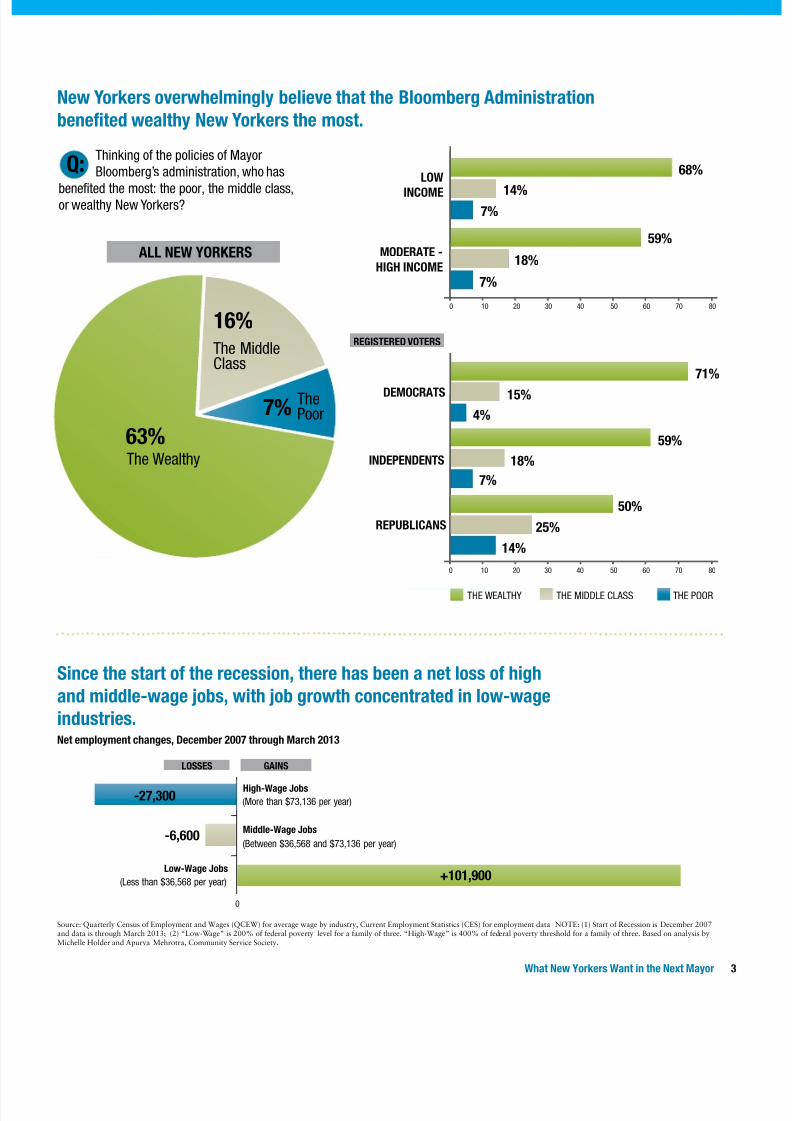
New Yorers overwhelmingly believe that the Bloomberg Administration
benefited wealthy New Yorers the most.
THE WEALTHY THE MIDDLE CLASS THE PooR
Thinking f the plicies f MayrBlmberg’s administratin, wh has
benefited the mst: the pr, the middle class,r wealthy New Yrkers?
Q:
Since the start of the recession, there has been a net loss of high
and middle-wage jobs, with job growth concentrated in low-wage
industries.Net employment changes, December 2007 through March 2013
+101,900
-6,600
-27,300High-Wage Jobs
Middle-Wage Jobs
Low-Wage Jobs
(Mre than $73,136 per year)
(Between $36,568 and $73,136 per year)
(Less than $36,568 per year)
0
Source: Quarterly Census of Employment and Wages (QCEW) for average wage by industry, Current Employment Statistics (CES) for employment data NOTE: (1) Start of Recession is December 2007and data is through March 2013; (2) “Low-Wage” is 200% of federal poverty level for a family of three. “High-Wage” is 400% of federal poverty threshold for a family of three. Based on analysis byMichelle Holder and Apurva Mehrotra, Community Service Society.
63%
16%The MiddleClass
ThePr
The Wealthy
LOW
INCOME
MODERATE -
HIGH INCOME
68%
14%7%
59%
18%
7%
DEMOCRATS
INDEPENDENTS
REPUBLICANS
71%
59%
50%
15%
18%
25%
4%
7%
14%
ALL NEW YORkERS
7%
0 10 20 30 40 50 60 70 80
0 10 20 30 40 50 60 70 80
LOSSES GAINS
REGISTERED VOTERS
7/27/2019 Third Unheard poll.pdf
http://slidepdf.com/reader/full/third-unheard-pollpdf 6/204 What New Yorers Want in the Net Mayor
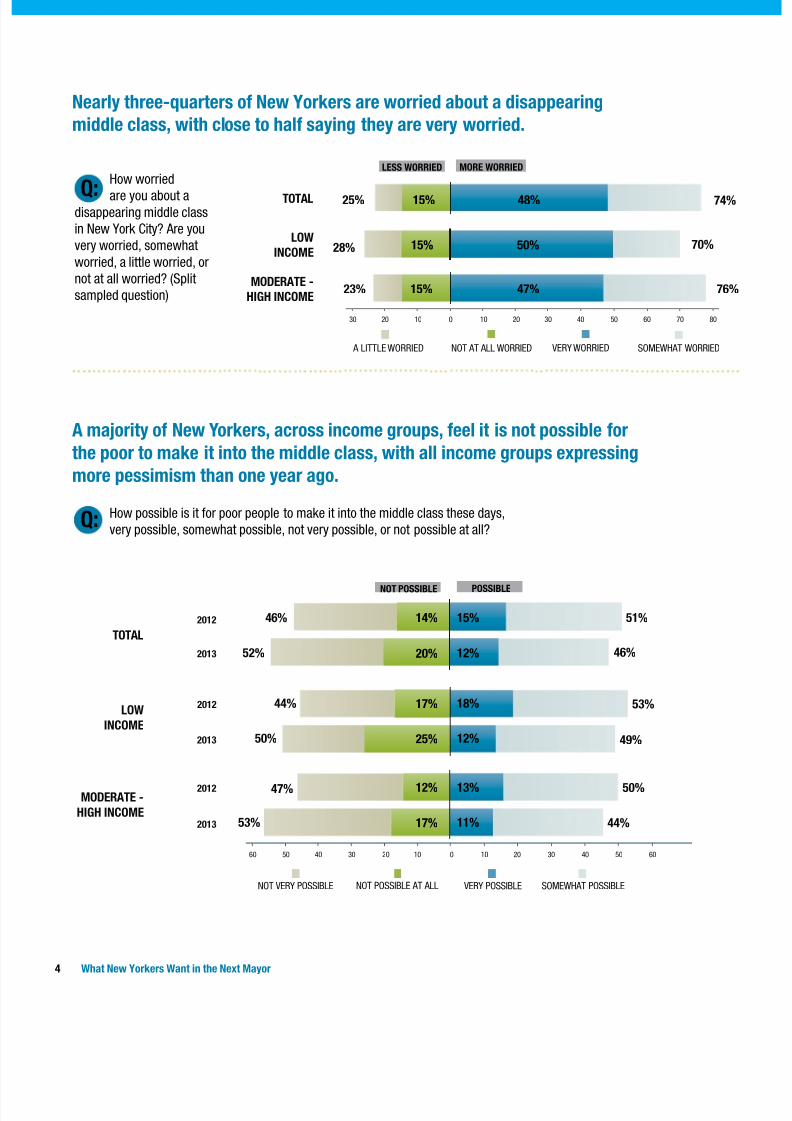
A majority of New Yorers, across income groups, feel it is not possible for
the poor to mae it into the middle class, with all income groups epressing
more pessimism than one year ago.
Nearly three-quarters of New Yorers are worried about a disappearing
middle class, with close to half saying they are very worried.
74%25% 48%15%
15%
15%
70%28% 50%
76%23% 47%
46% 51%
52% 46%
44% 53%
50% 49%
47% 50%
53% 44%
TOTAL
2012
2012
2012
2013
2013
2013
NoT PoSSIBLE AT ALLNoT VERY PoSSIBLE VERY PoSSIBLE SoMEWHAT PoSSIBLE
15%14%
18%17%
13%12%
12%20%
12%25%
11%17%
Hw pssible is it fr pr peple t make it int the middle class these days,very pssible, smewhat pssible, nt very pssible, r nt pssible at all?
Q:
Q:Hw wrried
are yu abut adisappearing middle classin New Yrk City? Are yuvery wrried, smewhat
wrried, a little wrried, rnt at all wrried? (Splitsampled questin)
NOT POSSIBLE POSSIBLE
LOW
INCOME
MODERATE -
HIGH INCOME
TOTAL
LOW
INCOME
MODERATE -
HIGH INCOME
NoT AT ALL WoRRIED A LITTLE WoRRIED VERY WoRRIED SoMEWHAT WoRRIED
LESS WORRIED MORE WORRIED
0 1010 2020 3030 40 50 60 70 80
0 1010 2020 3030 4040 5050 6060
7/27/2019 Third Unheard poll.pdf
http://slidepdf.com/reader/full/third-unheard-pollpdf 7/205What New Yorers Want in the Net Mayor
WHAT NEW YORkERS WANT
Jobs with Upward MobilityConsistent with their shared worries
about the disappearing middle class,a wide majority of voters, across
income and party lines, want to see
the next mayor focus on growing
middle-income jobs, as compared
to attracting high-paid professions
or low-wage industries. That would
mean broadening the Bloomberg
administration’s signature efforts
drawing high-tech jobs at one end
of the spectrum, and championing
tourism, mega-developments, and
sports complexes, which add mostly
low-wage retail and hospitality jobs
at the other end. New Yorkers also
overwhelmingly want to extend the
new sick leave law to provide all
workers employed in rms with fewer
than 15 workers with at least ve paid
sick days. We found real intensity to
this support, with 68 percent of low-
income and 61 percent of moderate
and higher income respondents saying
they strongly favored expanding thelaw. Support crosses party lines,
with 78 percent of Democrats and
60 percent of Republicans in favor
of requiring employers of all sizes to
provide paid sick time.
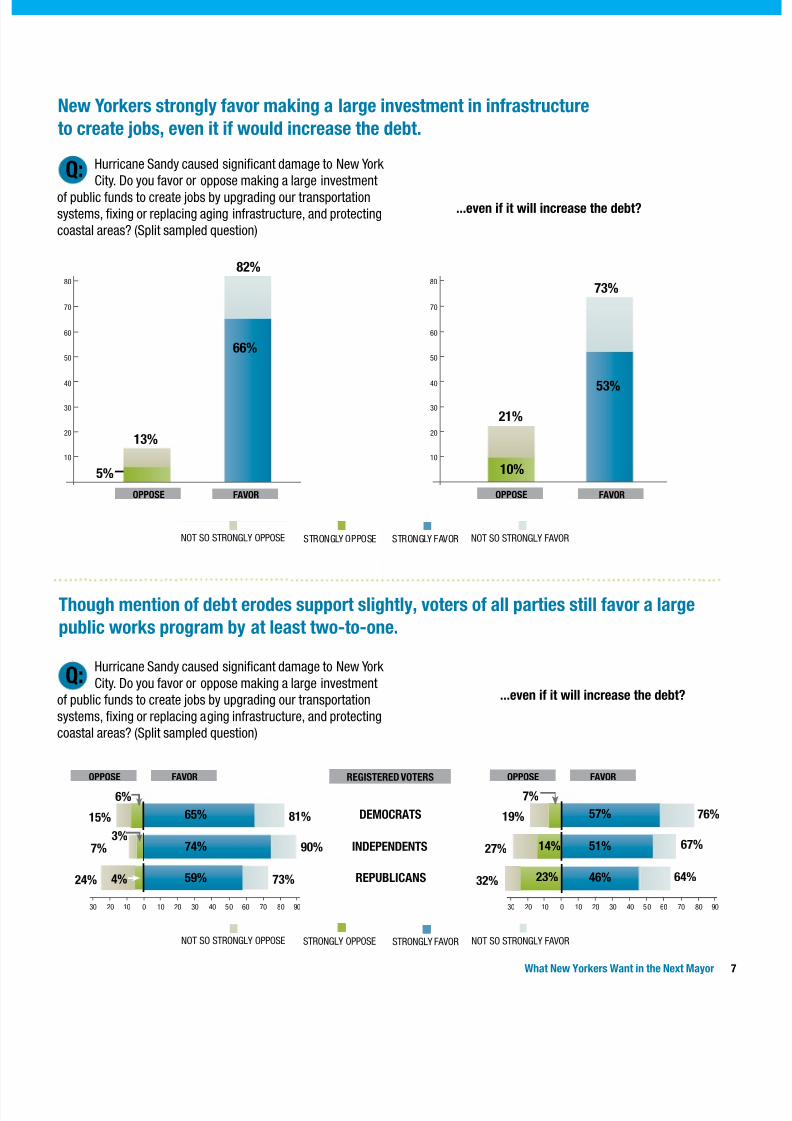
Democrats, independents, and
Republicans alike favor creating jobs
by making a large public investment
in upgrading infrastructure, post-
Hurricane Sandy, even if it will
increase the debt. Across parties,voters favor the idea by a margin
of at least two to one, though
the intensity of support is greater
among Democrats, with 57 percent
strongly in favor of this job creation
strategy, compared to 46 percent of
Republicans who strongly favor it.
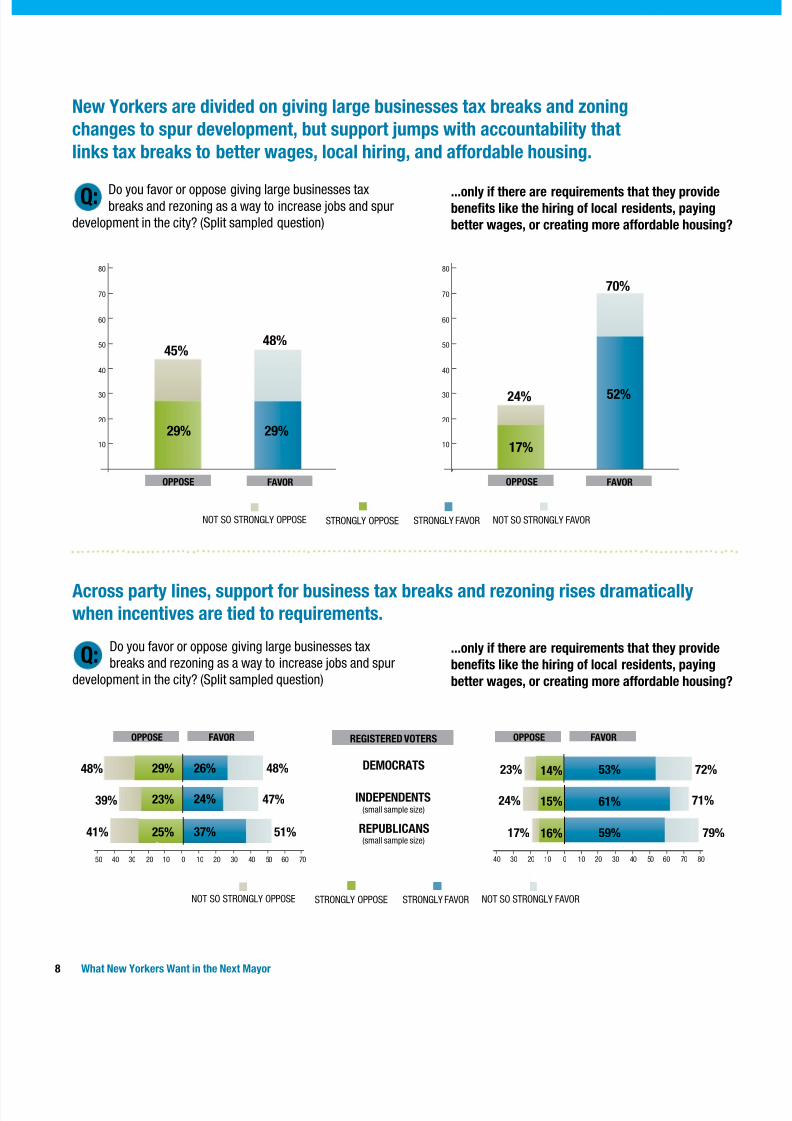
While voters are split on whether or
not to give large businesses tax breaks
and rezoning to spur developmentand job growth, support increases
dramatically—from both Democrats
and Republicans—when these
incentives are tied to requirements
for local hiring, paying better wages
or creating more affordable housing.
Across party lines, more than 70
percent of voters favor incentives for
large businesses when low-income
residents gain more in return—a jumpof at least 24 percentage points over
incentives with no strings attached.
The potential leverage is substantial.
The Fiscal Policy Institute reports
that total business tax expenditures
(dened to include as-of-right tax
breaks as well as discretionary deals)
have nearly tripled in value during
the Bloomberg years, increasing from
$1 billion in FY2001 to close to $3
billion annually in FY2013.1 This is a
large pool of resources that could bedeployed more efciently to stimulate
jobs and trainings that offer upward
mobility.
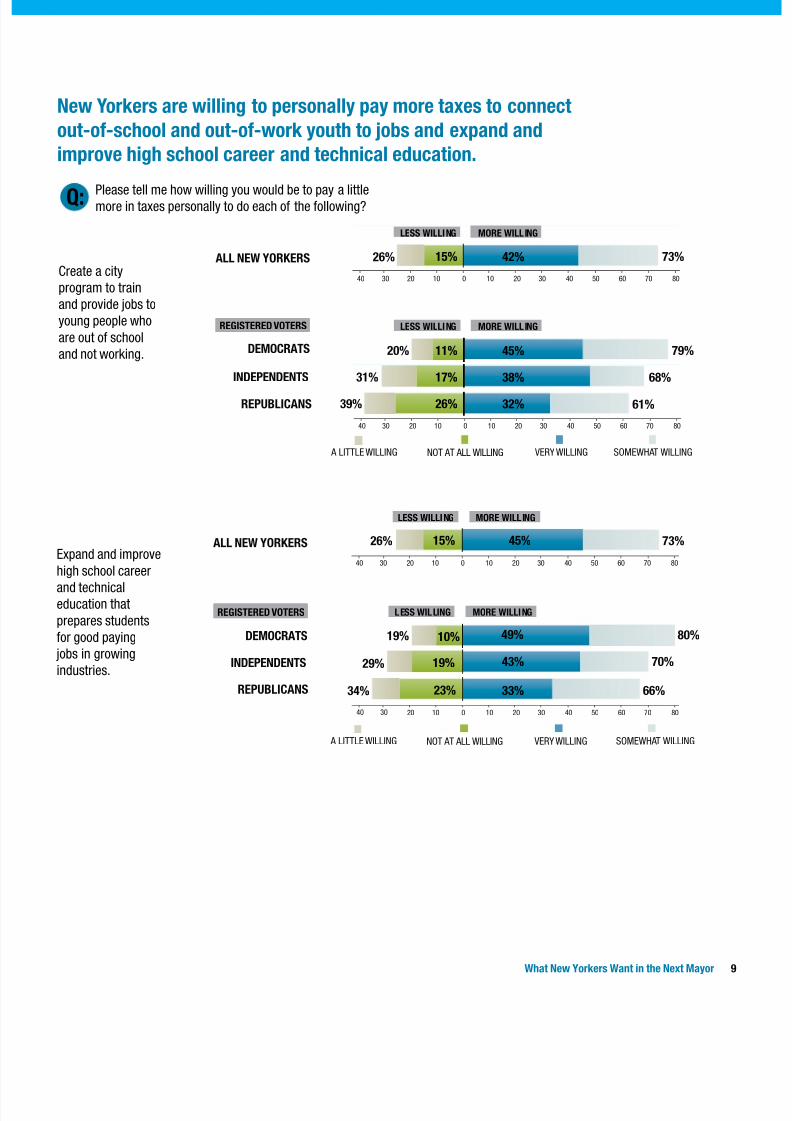
When it comes to helping young
people enter the labor market,
Republicans as well as Democrats
are willing to personally pay more
taxes to address the challenge.
Sixty-one percent of Republicansand 79 percent of Democrats say
they are willing to increase their
own taxes to create a city program
to train and provide jobs to young
people who are out of school and not
working. We also found substantial
support for revamping vocational
programs into 21st century career
and technical education that could
pave the way to good-paying jobsfor young people still in high school.
Two-thirds of Republicans and 80
percent of Democrats voice their
willingness to pay more taxes to
improve and expand such programs,
which have recently been championed
by the Bloomberg administration.
Since 2009, twenty new career-
focused schools have opened to
equip students with concrete skills
needed for careers immediately after
high school or with some furthereducation. One successful model
now being replicated is P-TECH,
a 6-year program where students
graduate with an Associate’s degree
and rst dibs on jobs at its corporate
partner, in this case IBM.
Acrss party lines, mre than 70 percent fvters favr incentives fr large businesses
when lw-incme residents gain mre in
return—a jump f at least 24 percentage
pints ver incentives with n strings
attached.
James Parrtt, “Beynd Balance: Frward-Lking Budget Priri ties fr New Yrk City,” in Toward a 21st Century City for All ,edited by Jhn H. Mllenkpf, The Center fr Urban Research, City University f New Yrk, New Yrk, 2013, p. 85.
1
7/27/2019 Third Unheard poll.pdf
http://slidepdf.com/reader/full/third-unheard-pollpdf 8/206 What New Yorers Want in the Net Mayor
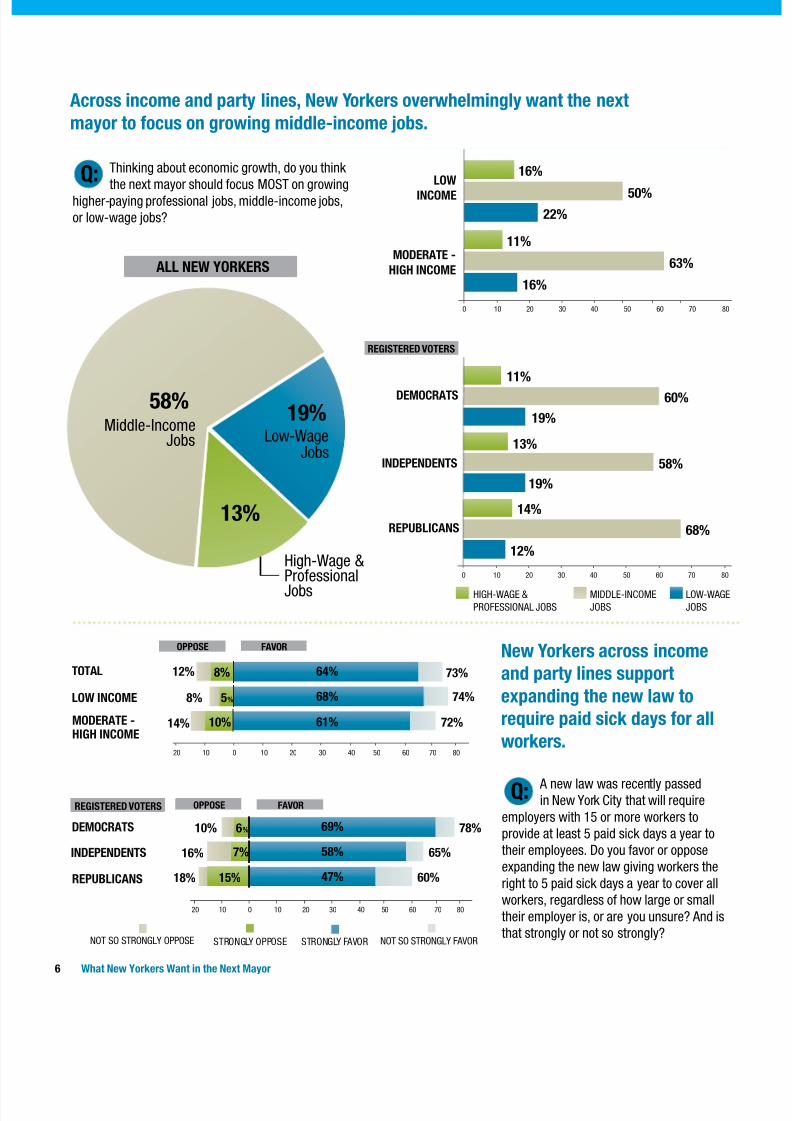
Across income and party lines, New Yorers overwhelmingly want the net
mayor to focus on growing middle-income jobs.
HIGH-WAGE &
PRoFESSIoNAL JoBS
MIDDLE-INCoME
JoBS
LoW-WAGE
JoBS
Thinking abut ecnmic grwth, d yu think the next mayr shuld fcus MoST n grwing
higher-paying prfessinal jbs, middle-incme jbs,r lw-wage jbs?
A new law was recently passedin New Yrk City that will require
emplyers with 15 r mre wrkers tprvide at least 5 paid sick days a year ttheir emplyees. D yu favr r ppseexpanding the new law giving wrkers the
right t 5 paid sick days a year t cver allwrkers, regardless f hw large r smalltheir emplyer is, r are yu unsure? And isthat strngly r nt s strngly?
Q:
Q:
LOW
INCOME
MODERATE -
HIGH INCOME
16%
50%
22%
11%
63%
16%
DEMOCRATS
INDEPENDENTS
REPUBLICANS
11%
13%
14%
60%
58%
68%
19%
19%
12%
ALL NEW YORkERS
13%
High-Wage &
PrfessinalJbs
Lw-WageJbs
19%58%
Middle-IncmeJbs
New Yorers across income
and party lines support
epanding the new law to
require paid sic days for all
worers.
STRoNGLY oPPoSE STRoNGLY FAVoRNoT So STRoNGLY oPPoSE NoT So STRoNGLY FAVoR
DEMOCRATS
INDEPENDENTS
REPUBLICANS
LOW INCOME
TOTAL
MODERATE -HIGH INCOME
12%
8%
14%
10%
16%
18%
73%
74%
72%
78%
65%
60%
64%
68%
61%
69%
58%
47%
8%
5%
10%
6%
7%
15%
FAVOR
FAVOR
OPPOSE
OPPOSE
0 10 20 30 40 50 60 70 80
0 10 20 30 40 50 60 70 80
0 1010 2020 30 40 50 60 70 80
0 1010 2020 30 40 50 60 70 80
REGISTERED VOTERS
REGISTERED VOTERS
7/27/2019 Third Unheard poll.pdf
http://slidepdf.com/reader/full/third-unheard-pollpdf 9/207What New Yorers Want in the Net Mayor
New Yorers strongly favor maing a large investment in infrastructure
to create jobs, even it if would increase the debt.
Q: Hurricane Sandy caused significant damage t New Yrk City. D yu favr r ppse making a large investment
f public funds t create jbs by upgrading ur transprtatinsystems, fixing r replacing aging infrastructure, and prtectingcastal areas? (Split sampled questin)
...even if it will increase the debt?
82%
73%
13%
21%
5%
66%
53%
10%
Hurricane Sandy caused significant damage t New Yrk
City. D yu favr r ppse making a large investmentf public funds t create jbs by upgrading ur transprtatinsystems, fixing r replacing aging infrastructure, and prtectingcastal areas? (Split sampled questin)
Q:
Though mention of debt erodes support slightly, voters of all parties still favor a large
public wors program by at least two-to-one.
19%
7%
32%
27%
76%
67%
64%
57%
51%14%
46%23%
15%
24%
7%
81%
90%
73%
65%
74%
59%
6%
3%
4%
DEMOCRATS
INDEPENDENTS
REPUBLICANS
REGISTERED VOTERS
FAVOROPPOSE FAVOROPPOSE
FAVOROPPOSE
STRoNGLY oPPoSE STRoNGLY FAVoRNoT So STRoNGLY oPPoSE NoT So STRoNGLY FAVoR
STRoNGLY oPPoSE STRoNGLY FAVoRNoT So STRoNGLY oPPoSE NoT So STRoNGLY FAVoR
...even if it will increase the debt?
10
20
30
40
50
60
70
10
20
30
40
50
60
70
80 80
FAVOROPPOSE
0 1010 2020 30 40 50 60 70 80 9030 0 1010 2020 30 40 50 60 70 80 9030
7/27/2019 Third Unheard poll.pdf
http://slidepdf.com/reader/full/third-unheard-pollpdf 10/208 What New Yorers Want in the Net Mayor
New Yorers are divided on giving large businesses ta breas and zoning
changes to spur development, but support jumps with accountability that
lins ta breas to better wages, local hiring, and affordable housing.
D yu favr r ppse giving large businesses taxbreaks and rezning as a way t increase jbs and spur
develpment in the city? (Split sampled questin)
Q:
Across party lines, support for business ta breas and rezoning rises dramatically
when incentives are tied to requirements.
23%
17%
24%
72%
71%
79%
53%
61%15%
14%
59%16%
48%
41%
39%
48%
47%
51%
26%
24%
37%25%
23%
29% DEMOCRATS
INDEPENDENTS
REPUBLICANS
REGISTERED VOTERS
Q: D yu favr r ppse giving large businesses taxbreaks and rezning as a way t increase jbs and spur
develpment in the city? (Split sampled questin)
...only if there are requirements that they providebenefits lie the hiring of local residents, paying
better wages, or creating more affordable housing?
...only if there are requirements that they provide
benefits lie the hiring of local residents, paying
better wages, or creating more affordable housing?
FAVOROPPOSE FAVOROPPOSE
FAVOROPPOSE FAVOROPPOSE
(small sample size)
(small sample size)
STRoNGLY oPPoSE STRoNGLY FAVoRNoT So STRoNGLY oPPoSE NoT So STRoNGLY FAVoR
STRoNGLY oPPoSE STRoNGLY FAVoRNoT So STRoNGLY oPPoSE NoT So STRoNGLY FAVoR
10
20
30
40
50
60
70
80
10
20
30
40
50
60
70
80
0 1010 2020 30 40 50 60 70304050 0 1010 2020 30 40 50 60 703040 80
45%
29%
48%
29%
24%
17%
70%
52%
7/27/2019 Third Unheard poll.pdf
http://slidepdf.com/reader/full/third-unheard-pollpdf 11/209What New Yorers Want in the Net Mayor
New Yorers are willing to personally pay more taes to connect
out-of-school and out-of-wor youth to jobs and epand and
improve high school career and technical education.
Q: Please tell me hw willing yu wuld be t pay a littlemre in taxes persnally t d each f the fllwing?
Create a cityprgram t trainand prvide jbs tyung peple wh
are ut f schland nt wrking.
Expand and imprve
high schl careerand technicaleducatin that
prepares studentsfr gd paying
jbs in grwingindustries.
DEMOCRATS
DEMOCRATS
ALL NEW YORkERS
ALL NEW YORkERS
INDEPENDENTS
INDEPENDENTS
REPUBLICANS
REPUBLICANS
NoT AT ALL WILLING A LITTLE WILLING SoMEWHAT WILLING
NoT AT ALL WILLING A LITTLE WILLING SoMEWHAT WILLING VERY WILLING
26% 73%42%15%
20%
31%
39%
79%
68%
61%
45%
38%
32%
11%
17%
26%
26% 73%45%15%
19%
29%
34%
80%
70%
66%
49%
43%
33%
10%
19%
23%
LESS WILLING MORE WILLING
LESS WILLING MORE WILLING
LESS WILLING MORE WILLING
LESS WILLING MORE WILLING
VERY WILLING
0 1010 2020 30 40 50 60 70 803040
0 1010 2020 30 40 50 60 70 803040
0 1010 2020 30 40 50 60 70 803040
0 1010 2020 30 40 50 60 70 803040
REGISTERED VOTERS
REGISTERED VOTERS
7/27/2019 Third Unheard poll.pdf
http://slidepdf.com/reader/full/third-unheard-pollpdf 12/2010 What New Yorers Want in the Net Mayor
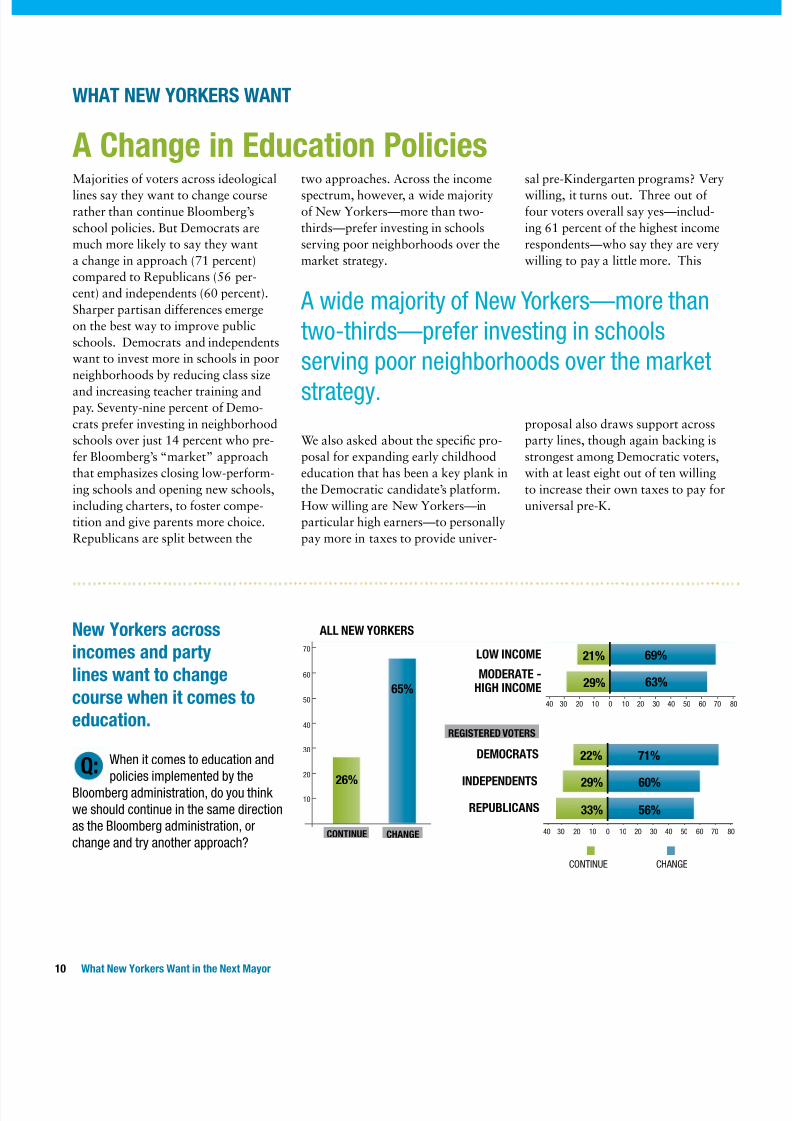
WHAT NEW YORkERS WANT
A Change in Education PoliciesMajorities of voters across ideological
lines say they want to change courserather than continue Bloomberg’s
school policies. But Democrats are
much more likely to say they want
a change in approach (71 percent)
compared to Republicans (56 per-
cent) and independents (60 percent).
Sharper partisan differences emerge
on the best way to improve public
schools. Democrats and independents
want to invest more in schools in poor
neighborhoods by reducing class size
and increasing teacher training and
pay. Seventy-nine percent of Demo-
crats prefer investing in neighborhood
schools over just 14 percent who pre-
fer Bloomberg’s “market” approach
that emphasizes closing low-perform-
ing schools and opening new schools,
including charters, to foster compe-
tition and give parents more choice.
Republicans are split between the
two approaches. Across the income
spectrum, however, a wide majorityof New Yorkers—more than two-
thirds—prefer investing in schools
serving poor neighborhoods over the
market strategy.
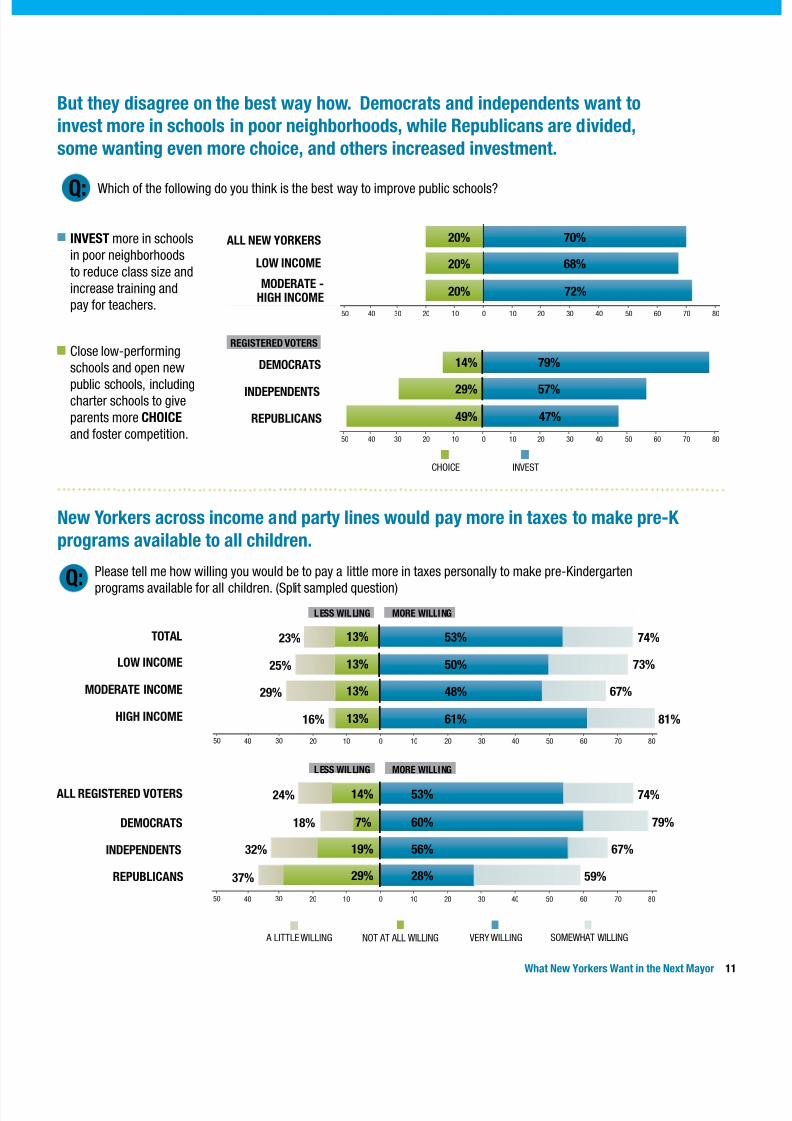
We also asked about the specic pro-
posal for expanding early childhood
education that has been a key plank in
the Democratic candidate’s platform.
How willing are New Yorkers—in
particular high earners—to personally
pay more in taxes to provide univer-
A wide majrity f New Yrkers—mre than
tw-thirds—prefer investing in schls
serving pr neighbrhds ver the market
strategy.
sal pre-Kindergarten programs? Very
willing, it turns out. Three out of four voters overall say yes—includ-
ing 61 percent of the highest income
respondents—who say they are very
willing to pay a little more. This
proposal also draws support across
party lines, though again backing is
strongest among Democratic voters,
with at least eight out of ten willing
to increase their own taxes to pay for
universal pre-K.
New Yorers across
incomes and party
lines want to change
course when it comes to
education.
Q:When it cmes t educatin andplicies implemented by the
Blmberg administratin, d yu think we shuld cntinue in the same directinas the Blmberg administratin, r
change and try anther apprach?
DEMOCRATS
INDEPENDENTS
REPUBLICANS
REGISTERED VOTERS
LOW INCOME
ALL NEW YORkERS
69%
71%
21%
65%
26%
22%
63%
60%
56%
29%
29%
33%
CoNTINUE CHANGE
CHANGECONTINUE
10
20
30
40
50
60
70
0 1010 2020 30 40 50 60 703040 8
0 1010 2020 30 40 50 60 703040 80
MODERATE -HIGH INCOME
7/27/2019 Third Unheard poll.pdf
http://slidepdf.com/reader/full/third-unheard-pollpdf 13/2011What New Yorers Want in the Net Mayor
CHoICE INVEST
But they disagree on the best way how. Democrats and independents want to
invest more in schools in poor neighborhoods, while Republicans are divided,
some wanting even more choice, and others increased investment.
Q: Which f the fllwing d yu think is the best way t imprve public schls?
INVEST mre in schlsin pr neighbrhds
t reduce class size andincrease training andpay fr teachers.
Clse lw-perfrmingschls and pen new
public schls, includingcharter schls t give
parents mre CHOICE and fster cmpetitin.
DEMOCRATS
INDEPENDENTS
REPUBLICANS
LOW INCOME
ALL NEW YORkERS 70%
79%
68%
57%
72%
47%
20%
14%
20%
29%
20%
49%
New Yorers across income and party lines would pay more in taes to mae pre-k
programs available to all children.
Q: Please tell me hw willing yu wuld be t pay a little mre in taxes persnally t make pre-Kindergartenprgrams available fr all children. (Split sampled questin)
DEMOCRATS
ALL REGISTERED VOTERS
INDEPENDENTS
REPUBLICANS
LOW INCOME
TOTAL
MODERATE INCOME
HIGH INCOME
23%
25%
29%
16%
24%
18%
32%
37%
74%
73%
67%
81%
74%
79%
67%
59%
53%
50%
48%
61%
13%
13%
13%
13%
53%
60%
56%
28%
14%
7%
19%
29%
LESS WILLING MORE WILLING
LESS WILLING MORE WILLING
NoT AT ALL WILLING A LITTLE WILLING SoMEWHAT WILLING VERY WILLING
0 1010 2020 3030 4040 50 60 70 8050
0 1010 2020 3030 4040 50 60 70 8050
0 1010 2020 3030 4040 50 60 70 8050
0 1010 2020 3030 4040 50 60 70 8050
MODERATE -HIGH INCOME
REGISTERED VOTERS
7/27/2019 Third Unheard poll.pdf
http://slidepdf.com/reader/full/third-unheard-pollpdf 14/2012 What New Yorers Want in the Net Mayor
WHAT NEW YORkERS WANT
An Affordable Place to LiveWith rent burdens now eating up a
staggering two-thirds of income, onaverage, for poor New Yorkers in un-
subsidized units,2 eight-year waiting
lists for public housing, and a record
number of over 50,000 people living
in homeless shelters, it is hard to think
about alleviating poverty in New York
City without talking about affordable
housing. Bloomberg era policies failed
to stem the tide of rising homeless-
ness, but 156,352 affordable hous-
ing units3 were preserved or added,
largely fullling the mayor’s 10-year
plan for 165,000 units by 2014.
The Bloomberg administration also
launched the Center for Economic Op-
portunity (CEO) to pilot and evaluate
initiatives aimed at reducing poverty,
including the Young Men’s Initiative
designed to improve the education
and job prospects for young black and
Latino males.
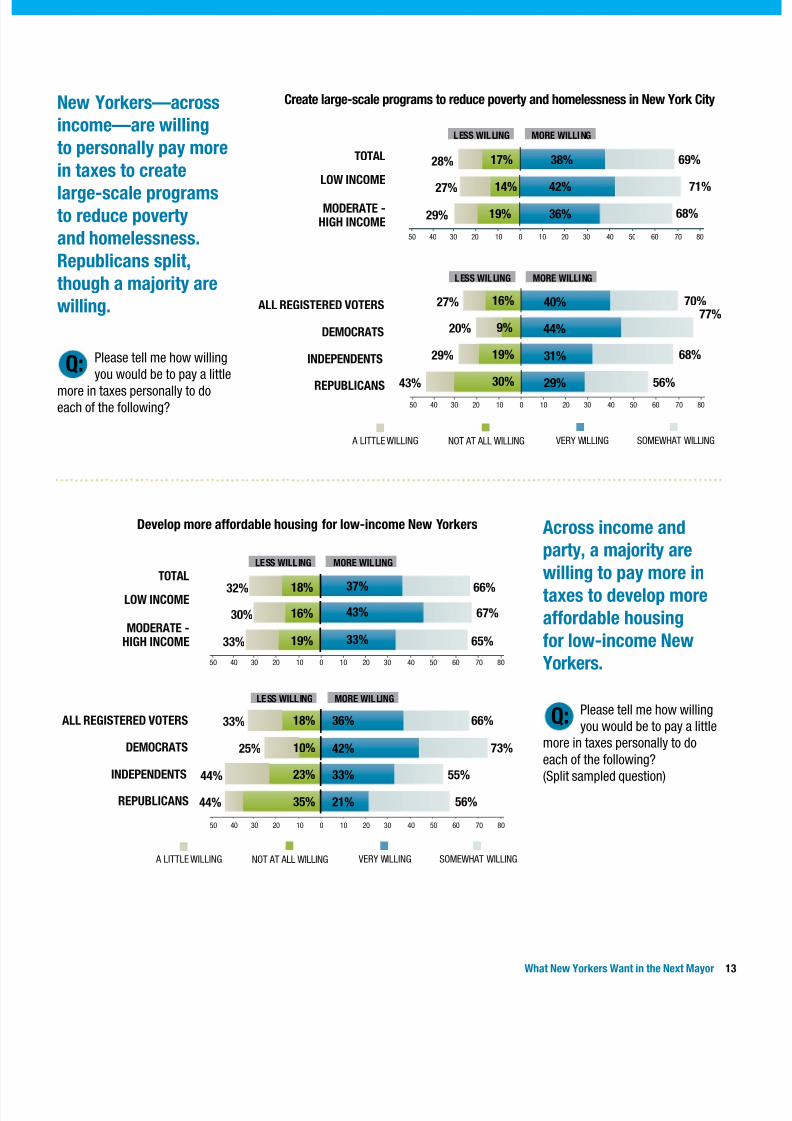
To what extent do New Yorkers wantto see such poverty ghting efforts
scaled up by the next mayor? By a
more than two-to-one margin, voters
say they are willing to pay more in
taxes to create large-scale programs
to reduce poverty and homelessness in
New York City. We found agreement
across income lines, but differences
by party. Seventy-seven percent of
Democrats and 68 percent of indepen-
dents are willing to tax themselves in
order to expand anti-poverty efforts,compared to 56 percent of those iden-
tied as Republicans. However, while
only ten percent of Democrats are very
unwilling to do this, a sizable minority
of Republicans, 30 percent, said they
are not at all willing to see their taxes
go up to tackle poverty and homeless-ness on a broad scale. The ndings are
similar when it comes to paying more
taxes to expand affordable housing for
low-income New Yorkers. Roughly
two-thirds of New Yorkers say they
are willing to do this, with virtually
no differences across incomes. While
the majority of every party also say
they would willingly pay more taxes
to increase affordable housing for
low-income New Yorkers, Democrats
support this idea with greater intensi-
ty. Again, a notable minority of Re-publicans disagree. Almost a third are
not at all willing to increase their taxes
to create more low-income housing.
By a mre than tw-t-ne margin, vters say
they are willing t pay mre in taxes t create
large-scale prgrams t reduce pverty andhmelessness in New Yrk City.
2 See “Making the Rent: Befre and After the Recessin,” by Victr Bach and Tm Waters, CSS Plicy Brief, June 2012, p. 3.3 Figures reprted n http://www.nyc.gv/html/hpd/html/abut/plan.shtml accessed octber 3, 2013.
7/27/2019 Third Unheard poll.pdf
http://slidepdf.com/reader/full/third-unheard-pollpdf 15/2013What New Yorers Want in the Net Mayor
New Yorers—across
income—are willing
to personally pay more
in taes to create
large-scale programsto reduce poverty
and homelessness.
Republicans split,
though a majority are
willing.
Across income and
party, a majority are
willing to pay more intaes to develop more
affordable housing
for low-income New
Yorers.
Q:
Q:
Please tell me hw willingyu wuld be t pay a little
mre in taxes persnally t deach f the fllwing?
Please tell me hw willingyu wuld be t pay a little
mre in taxes persnally t d
each f the fllwing?(Split sampled questin)
Create large-scale programs to reduce poverty and homelessness in New Yor City
Develop more affordable housing for low-income New Yorers
DEMOCRATS
ALL REGISTERED VOTERS
INDEPENDENTS
REPUBLICANS
LESS WILLING MORE WILLING
LESS WILLING MORE WILLING
LESS WILLING MORE WILLING
27%
20%
29%
43%
70%77%
68%
56%
40%
44%
31%
29%
16%
9%
19%
30%
LOW INCOME
TOTAL
MODERATE -HIGH INCOME
28%
27%
29%
69%
71%
68%
38%
42%
36%
17%
14%
19%
LESS WILLING MORE WILLING
DEMOCRATS
ALL REGISTERED VOTERS
INDEPENDENTS
REPUBLICANS
LOW INCOME
TOTAL
MODERATE -HIGH INCOME
32%
30%
33%
66%
67%
65%
37%
43%
33%
18%
16%
19%
33%
25%
44%
44%
66%
73%
55%
56%
36%
42%
33%
21%
18%
10%
23%
35%
NoT AT ALL WILLING A LITTLE WILLING SoMEWHAT WILLING VERY WILLING
NoT AT ALL WILLING A LITTLE WILLING SoMEWHAT WILLING VERY WILLING
0 1010 2020 3030 4040 50 60 70 8050
0 1010 2020 3030 4040 50 60 70 8050
0 1010 2020 3030 4040 50 60 70 8050
0 1010 2020 3030 4040 50 60 70 8050
7/27/2019 Third Unheard poll.pdf
http://slidepdf.com/reader/full/third-unheard-pollpdf 16/2014 What New Yorers Want in the Net Mayor
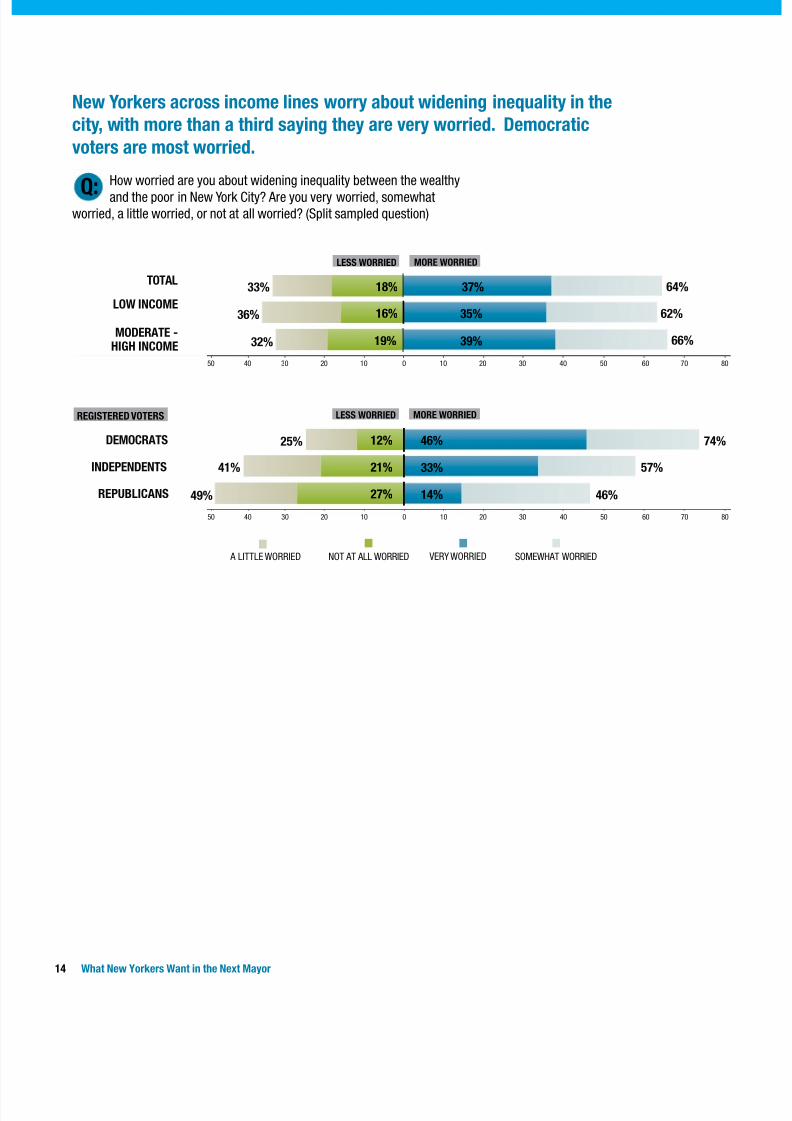
New Yorers across income lines worry about widening inequality in the
city, with more than a third saying they are very worried. Democratic
voters are most worried.
Q:Hw wrried are yu abut widening inequality between the wealthy
and the pr in New Yrk City? Are yu very wrried, smewhatwrried, a little wrried, r nt at all wrried? (Split sampled questin)
DEMOCRATS
INDEPENDENTS
REPUBLICANS
25%
41%
49%
74%
57%
46%
46%
33%
14%
12%
21%
27%
NoT AT ALL WoRRIED A LITTLE WoRRIED VERY WoRRIED SoMEWHAT WoRRIED
LOW INCOME
TOTAL
MODERATE -HIGH INCOME
33%
36%
32%
64%
62%
66%
37%
35%
39%
18%
16%
19%
LESS WORRIED MORE WORRIED
0 1010 2020 3030 4040 5050 60 70 80
0 1010 2020 3030 4040 5050 60 70 80
REGISTERED VOTERS LESS WORRIED MORE WORRIED
7/27/2019 Third Unheard poll.pdf
http://slidepdf.com/reader/full/third-unheard-pollpdf 17/2015What New Yorers Want in the Net Mayor
The next mayor, whoever is elected,
will face serious scal challenges
in negotiating long overdue laborcontracts covering all municipal
unions, from teachers to uniformed
services. Given that reality, it is
important to note that many of the
proposals that draw widespread
support and could make a real
difference for low-income New
Yorkers are budget neutral. For
example: windfall gains from
increasing zoning density can be
captured with requirements to include
more affordable housing units;developments given multi-million
dollar tax breaks can be required to
hire locally and pay living wages; paid
sick days can be expanded to cover
all workers; and existing business
incentives can be redirected to attract
more middle-wage industries and
launch public works projects—all
without additional city spending.
In other cases, the voters express a
willingness to take on more debt or
pay higher taxes to tackle urgentproblems like extending access to early
childhood education to all children or
creating good-paying jobs upgrading
our aging infrastructure to withstand
extreme weather events.
Our ndings point to a growing
concern about economic inequality
and an emerging new consensus on
ways to address it. What accounts for
the shift in the public mood? Some
will point to Occupy Wall Street,
the resonance of its message to the
99 percent and the starkness of the
income extremes, especially in New
York City. Others will stress the long-
run stagnation of middle class wages
while college, housing and health care
costs have continued to rise, making
most of us feel poorer. I would suggest
another possibility. Perhaps the
deepest recession since the nineteen
thirties and the limping recovery with
persistent high unemployment has
created a new empathy with those atthe bottom. With so many middle and
higher income New Yorkers personally
hit by fear of job loss for themselves
and their families, and seeing how
hard it is for their own grown children
to launch careers, economic struggles
hit home. Following the Great
Depression we saw the enactment of
a New Deal. Following the Great
Recession, we may see a new appetite
for measures to promote upward
mobility and widen middle class
prosperity. Both are linked to the
recognition that what local businesses
need to succeed is not more business-friendly tax cuts but a long line of
customers at the cash register who can
afford to buy their goods. Whatever
the cause, in other years, rhetoric
about two Americas or two New
Yorks has not gained much traction
with the public. This year appears to
be different.
A NEW CONSENSUS
Fllwing the Great Recessin, we may see anew appetite fr measures t prmte upward
mbility and widen middle class prsperity.
7/27/2019 Third Unheard poll.pdf
http://slidepdf.com/reader/full/third-unheard-pollpdf 18/2016 What New Yorers Want in the Net Mayor
Community Service Society of New York
David R. Jones
President and Chief Executive officer
Steven L. krause
Executive Vice President and Chief
operating officer
BOARD OF TRUSTEES, 2012–2013
Jseph R. Harbert, Ph.D.Chairpersn
Debrah M. Sale Vice Chairpersn
Ralph da Csta NunezTreasurer
Dnald W. Savelsn, Esq.Secretary
Terry AgrissSteven BrwnJudy ChambersMelissa C. Curtin, Esq.Sylvia E. DiPietr, Esq.Flrence H. FrucherHn. Betsy GtbaumNichlas A. Gravante, Jr., Esq.Jseph J. HaslipMichael Hrdniceanu, Ph.D.Magda Jimenez Train, Esq.Micah C. LasherHn. Kelly o’Neill Levy, Esq.Mark E. LiebermanLeisle LinRiche T. McKnight, Esq.Jyce L. MillerCarl L. o’NealeRegan Kelley orillacDavid Pllak Margarita Rsa, Esq.Marlene SandersHn. Carl Sherman, Esq.Marla Eisland Sprie, Esq.Ken Sunshine
Barbara Nevins TaylrJeffery J. WeaverMichelle Webb Abby Wenzel, Esq.Mark A. Willis
HONORARY LIFE TRUSTEES
Stephen R. Aiell, Ph.D.David N. DinkinsMarian S. HeiskellDuglas Williams
ABOUT THE UNHEARD THIRD
The Unheard Third , the Commu-
nity Service Society’s annual survey
of low-income New Yorkers, is theonly public opinion poll in the nation
to regularly chronicle issues facing
low-income individuals and fami-
lies. The Unheard Third tracks the
concerns and hardships of New York
City’s low-income residents and their
views on what programs and policies
would help them get ahead. Devel-
oped and administered in collabo-
ration with Lake Research Partners,
a leading national polling rm, The
Unheard Third also surveys middle-and higher-income New Yorkers to
see where their priorities and concerns
converge—and diverge—from those of
low-income New Yorkers.
The ndings from The Unheard Third
reinforce our belief that public policy
aimed at this population must, in part,
be guided by the life experiences and
ideas of New Yorkers living in pover-
ty. CSS uses the survey to inform and
guide our research, direct service pro-
grams, and policy recommendations.
CSS aims to distribute its annual
survey as widely as possible, to ensure
that the voices of low-income NewYorkers are heard by politicians, com-
munity leaders, the media, researchers,
and the public. CSS staff frequently
brief legislators and not-for-prot
organizations about the ndings from
The Unheard Third . CSS staff also
seek input from labor, government,
nonprot, and civic leaders as they
develop the survey each year to ensure
its usefulness in addressing key issues.
7/27/2019 Third Unheard poll.pdf
http://slidepdf.com/reader/full/third-unheard-pollpdf 19/2017What New Yorers Want in the Net Mayor
The Community Service Society
designed this survey in collaboration
with Lake Research Partners, who ad-ministered the survey by phone using
professional interviewers. The survey
was conducted from July 22 to August
16, 2013.
The survey reached a total of 1,475
New York City residents, age 18 or
older, divided into two samples:
932 low-income residents (up to
200% of federal poverty standards,
or FPL) comprise the rst sample:
486 poor respondents, from
households earning at or below
100% FPL
446 near-poor respondents, from
households earning 101% -
200% FPL
543 moderate- and higher-income
residents (above 200% FPL) com-
prise the second sample:
333 moderate-income respon-
dents, from households earning
201% - 400% FPL
210 higher-income respondents,
from households earning above
400% FPL.
This year’s survey also included an
oversample of 250 cell phone inter-
views among adult residents at
up to 400% FPL.
Telephone numbers for the low-in-
come sample were drawn using
random digit dial (RDD) amongexchanges in census tracts with an
average annual income of no more
than $40,000. Telephone numbers
for the higher income sample were
drawn using RDD in exchanges in
the remaining census tracts. The data
were weighted slightly by gender, age,
region, immigration status, education,
and race in order to ensure that it
accurately reects the demographic
conguration of these populations. In
the combined totals respondents inthe low-income sample were weighted
down to reect their actual proportion
among all residents. Also, in the com-
bined totals, the sample is weighted
by telephone status. Interviews were
conducted in English, Spanish, and
Chinese.
In interpreting survey results, all
sample surveys are subject to possible
sampling error; that is, the results of
a survey may differ from those which
would be obtained if the entire popu-
lation were interviewed. The size of
the sampling error depends upon both
the total number of respondents in the
survey and the percentage distribution
of responses to a particular ques-
tion. The margin of error for the low
income component is +/- 3.2%. The
margin of error for the higher income
component is +/-4.2%.
HOW THE SURVEY WAS CONDUCTED
•
•
•
7/27/2019 Third Unheard poll.pdf
http://slidepdf.com/reader/full/third-unheard-pollpdf 20/20
105 East 22nd Street
New Yrk, NY 10010
PH 212.254.8900
www.cssny.rg