thirteen facts about wage growth - hamilton project feedback, and audrey breitwieser, karna...
TRANSCRIPT

Jay Shambaugh, Ryan Nunn, Patrick Liu, and Greg Nantz
ECONOMIC FACTS | SEPTEMBER 2017
Thirteen Facts about Wage Growth
W W W . H A M I L T O N P R O J E C T . O R G

The Hamilton Project seeks to advance America’s promise of
opportunity, prosperity, and growth. The Project’s economic
strategy reflects a judgment that long-term prosperity is best
achieved by fostering economic growth and broad participation
in that growth, by enhancing individual economic security, and by
embracing a role for effective government in making needed public
investments. We believe that today’s increasingly competitive
global economy requires public policy ideas commensurate with
the challenges of the 21st century. Our strategy calls for combining
increased public investments in key growth-enhancing areas, a
secure social safety net, and fiscal discipline. In that framework,
the Project puts forward innovative proposals from leading
economic thinkers — based on credible evidence and experience,
not ideology or doctrine — to introduce new and effective policy
options into the national debate.
The Project is named after Alexander Hamilton, the nation’s
first treasury secretary, who laid the foundation for the modern
American economy. Consistent with the guiding principles of
the Project, Hamilton stood for sound fiscal policy, believed
that broad-based opportunity for advancement would drive
American economic growth, and recognized that “prudent aids
and encouragements on the part of government” are necessary to
enhance and guide market forces.
MISSION STATEMENT
We thank Lauren Bauer, Jared Bernstein, David Dreyer, Andrew
Figura, Joy Fox, Kriston McIntosh, and Louise Sheiner for
insightful feedback, and Audrey Breitwieser, Karna Malaviya, and
Becca Portman for excellent research assistance.
ACKNOWLEDGMENTS

The Hamilton Project • Brookings i
Thirteen Facts about Wage Growth
Introduction
The expectation of rising living standards, with each generation doing better than the one before, has long been a given. More recently, that expectation has diminished—and with good reason. One of the best measures economists use to determine Americans’ economic advancement is whether wages are rising, broadly and consistently. After adjusting for inflation, wages are only 10 percent higher in 2017 than they were in 1973, with annual real wage growth just below 0.2 percent.1 The U.S. economy has experienced long-term real wage stagnation and a persistent lack of economic progress for many workers.
For more than a decade, The Hamilton Project has offered proposals and analyses aimed at increasing both economic growth and broad participation in its benefits. This document highlights the necessary conditions for broadly shared wage growth, trends closely related to stagnation in wages for many workers, and the recent history of wage growth, with an emphasis on the experience of the Great Recession and recovery. It concludes by discussing how public policies can effectively contribute to the growth in wages that is a core part of improving living standards for all Americans.
WHAT IS NECESSARY FOR BROADLY SHARED WAGE GROWTH?
The economic forces that underlie wage growth—that is, the increase in pay going to typical workers—essentially encompass all aspects of the economy. Wages depend on how productive workers are, the share of economic output that is channeled to compensation, and the division of wage and nonwage compensation (including benefits like health insurance). Workers’ productivity, in turn, depends on the human and physical capital used in the production process, as well as how efficiently labor and capital are used.
Jay Shambaugh, Ryan Nunn, Patrick Liu, and Greg Nantz

ii Thirteen Facts about Wage Growth
For the inflation-adjusted compensation paid to a typical worker to rise sustainably, a number of conditions must be met. Workers must become more productive over time. They must have adequate bargaining power such that their share of the returns to production remains stable or increases. And labor income has to be broadly shared, rather than concentrated at the top.
Figure A reflects the many economic forces that contribute to wage trends. Real wages fall over some periods because technological progress slows, capital investment weakens, nonwage benefits increase, or because labor receives a diminishing share of economic output. Over short horizons, wages can be influenced by simple supply and demand for labor: a weaker economy can yield insufficient demand for labor, generating weak wage growth. Also, unexpectedly high inflation can lead to steep drops in real wages, as in 1980, and unexpectedly low inflation can lead to an increase in real wages, as in 2009.
THE IMPORTANCE OF PRODUCTIVITY GROWTH
For workers to experience rising living standards over any substantial period, labor productivity must also rise. That is,
FIGURE A.
Real Average Hourly Earnings, 1973–2017
Hou
rly
earn
ings
(201
6 do
llars
)
1973 1977 1981 1985 1989 1993 1997 2001 2005 2009 2013 20170
4
8
12
16
20
24
Source: Current Employment Statistics, Bureau of Labor Statistics [BLS] (1973–2017); authors’ calculations.Note: Earnings are for production and nonsupervisory employees and are expressed in 2016 dollars, deflated using the Consumer Price Index for All Urban Consumers Research Series (CPI-U-RS) and seasonally adjusted. Shaded bars indicate recessions.
BOX 1.
What’s in a Wage?
A number of different concepts are often lumped together under the term “wages.” It can refer to cash earnings or total compensation, including benefits like health insurance. It can be measured at an hourly, daily, weekly, or annual frequency. In different contexts, one might refer to average wages or to median wages, with the latter corresponding more closely to the experience of a typical worker. Finally, wages can be expressed either in nominal or inflation-adjusted (real) terms, accounting for changes in prices.
Depending on the question that is being asked and the data that are available, we alternate between these various wage definitions in this document. When differences between the definitions are economically important, we highlight the distinctions and discuss their relevance. We generally emphasize real wages or compensation because they describe changes in the purchasing power of workers.

The Hamilton Project • Brookings iii
for a worker to be paid more for an hour’s work, the value of that worker’s economic output must increase.
The history of the U.S. economy has been one of rising labor productivity, as shown in figure B. Technological advances, increases in human and physical capital, and improved business methods allow for dramatically more efficient uses of human labor as those advances and improvements accumulate over time.
Wages rise in the wake of these changes because firms compete with each other to hire and retain those workers who have become more productive. Figure B shows the increase in output per hour (productivity) and average compensation per hour—both adjusted for inflation—from the postwar period through the present. Both series have exhibited large increases over that period.
What economic and policy factors might reduce compensation growth by limiting worker productivity? In subsequent chapters, we explore a number of possibilities. First, worker mobility—both across jobs and across states—has been in decline for decades. In addition, business start-ups have become less common. These developments are associated with weaker increases in productivity and wages, given that they limit the reallocation of workers to productive new jobs.
Finally, the recent decline in the growth of capital relative to labor depresses workers’ productivity.
WHO BENEFITS FROM PRODUCTIVITY GROWTH?
However, even robust growth in productivity is not always sufficient to ensure rising wages, particularly for workers at the bottom and middle of the wage distribution. Two considerations are most important.
First, the overall share of economic output that is received by workers can and does change over time. For example, if the share of output received as wages and benefits falls, real wage growth that would otherwise have occurred as productivity improved might diminish or even disappear completely. This dynamic affects workers as a group, rather than the distribution of wages received by various workers. Changes in worker bargaining power, competition within and across industries, and globalization can all influence the share of output workers receive. Over the long run, labor’s share of output has fallen, which is reflected in the fact that average compensation growth has lagged behind productivity growth (as depicted in figure B).2
Second, the inequality of wages paid to workers can also change over time. While workers as a whole might benefit from productivity growth over some period, these benefits are
FIGURE B.
Real Labor Productivity and Hourly Compensation, 1947–2017
Source: Productivity and Costs, BLS (1947–2017); authors’ calculations.Note: Productivity is the indexed value of nonfarm business real gross output per hour of all persons; hourly compensation is the indexed value of nonfarm business average real compensation per hour. Compensation is deflated using the CPI-U-RS deflator. Productivity and compensation values for 2017 are based on only the first two quarters of the year.
Productivity
Compensation
Inde
x (1
947
= 10
0)
1957 1967 1977 1987 1997 2007 2017100
200
300
400
500
1947

iv Thirteen Facts about Wage Growth
sometimes shared unequally. Indeed, real wages for those in the bottom half of the wage distribution have stagnated since 1979 (the earliest year in which appropriate data are available), whereas the upper reaches of the distribution have seen large gains. To the extent that labor’s gains disproportionately accrue to those with high incomes, gains for the typical worker will lag even farther behind productivity growth.
Finally, wages are only one component of compensation: nonwage components—such as health, life, and disability insurance, as well as retirement contributions—might take up a falling or rising share of compensation over time. To shed light on these trends, figure C shows growth in wages
and benefits separately. While benefits have made up an increasingly large share of compensation, wage growth has lagged.
Economic and policy changes are both important for the division of economic gains. In the next chapter we explore the roles of technological progress, globalization, and changing returns to education in driving some of these wage trends over the long run. We also examine declines in the rate of union membership and the real minimum wage, focusing on how these developments have affected the level and distribution of wages.
FIGURE C.
Real Wages and Benefits, 1991 and 2017
Source: Employer Costs for Employee Compensation, BLS (1991–2017); authors’ calculations.Note: Wages and benefits are average hourly levels and are expressed in 2016 dollars, deflated using the CPI-U-RS. Wage levels are somewhat different than in figure A due to the difference of samples.
Dol
lars
per
hou
r (20
16 d
olla
rs)
2017 Q11991 Q1 2017 Q11991 Q1
Wages Bene�ts
0
10
20
30
+36.33%
+15.71%

The Hamilton Project • Brookings v
Table of Contents
INTRODUCTION i
CHAPTER 1. Why Have Wages Been Stagnant for So Many Workers?
1. The share of economic output workers receive has generally fallen over the past 1 few decades.
2. Wages have risen for those in the top of the distribution but stagnated for those 2 in the bottom and middle.
3. The education wage premium rose sharply until about 2000, contributing to rising 3 wage inequality.
4. Globalization and technological change have likely put downward pressure on 4 less-educated workers’ wages.
5. Wages have grown for women and fallen for men. 5
6. Declines in the real minimum wage and union membership have affected wage growth. 6
7. Workers have become less likely to move to a different state or to a different job, 7 reducing wage growth.
8. Business formation and closings have declined. 8
CHAPTER 2. How Strong Has Wage Growth Been since the Great Recession?
9. Inflation-adjusted wage growth was higher from 2007 to 2017 than it was during 9 previous business cycles.
10. Labor market slack has declined during the recovery from the Great Recession, 10 though some likely remains.
11. Recent labor productivity growth has been slow, restraining wage growth. 11
12. In recent years, measured wage growth has been depressed by changes in the workforce. 12
13. Wage growth during the Great Recession occurred among top earners, but has since 13 become more broadly shared.
CONCLUSION. What Public Policies Can Achieve 14
TECHNICAL APPENDIX 15
ENDNOTES 15
REFERENCES 16
SELECTED HAMILTON PROJECT PAPERS ON WAGES 18

vi Thirteen Facts about Wage Growth

The Hamilton Project • Brookings 1
The share of economic output workers receive has generally fallen over the past few decades.1.
Chapter 1. Why Have Wages Been Stagnant for So Many Workers?
FIGURE 1.
Labor Share of Income, 1973–2017
Source: Productivity and Costs, BLS (1973–2017).Note: Labor share is defined as the sum of employee and proprietor labor compensation, divided by gross value-added output. Shaded bars indicate recessions.
54
56
58
60
Labo
r sha
re (p
erce
nt)
62
64
66
1973 1977 1981 1985 1989 1993 1997 2001 2005 2009 2013 2017
Long-term wage stagnation can be traced to many trends, including the decline in labor’s share of income. The portion of national income received by workers fell from 64.5 percent in 1974 Q3 to 56.8 percent in 2017 Q2. Over the past few years the U.S. labor share has ceased falling, but this might reflect the ongoing economic recovery rather than any change in the long-run downward trend.
The fall in labor’s share is not unique to the United States. In other advanced economies, it has also been falling since the 1970s. The declining labor share has been traced to both technological progress as well as to the increase in capital intensity of production (International Monetary Fund 2017;
Karabarbounis and Neiman 2014). Analysis has suggested a number of other possible explanations for the United States, including the offshoring of labor-intensive production. A portion of the labor share decline is likely due to difficulty in measuring labor compensation (Elsby, Hobijn, and Sahin 2013; Smith et al. 2017).
One recent study suggests that the fall in the labor share is related to the rise of so-called superstar firms, which the authors argue are likely to have lower labor shares given their high profitability (Autor et al. 2017). Market concentration has increased noticeably over time and could be playing a role in lowering labor’s income share (Furman 2016).

2 Thirteen Facts about Wage Growth
Wages have risen for those in the top of the distribution but stagnated for those in the bottom and middle.
2.
Chapter 1. Why Have Wages Been Stagnant for So Many Workers?
FIGURE 2.
Real Wages by Wage Quintile, 1979 and 2016
Source: Current Population Survey, BLS (1979–2016); authors’ calculations.Note: Wages are expressed in 2016 dollars, deflated using the CPI-U-RS. Sample restricted to workers ages 25–54. Growth rates are cumulative.
Wage inequality has been on the rise over the past several decades. In figure 2 we examine wages rather than total compensation, which include nonwage benefits. (Compensation has also exhibited increasing inequality; see Pierce 2010.) This permits a sharper focus on wages, which are of particular interest to many workers.
Much of the growth in wages has been concentrated at the top, with wages in the top quintile growing from $38 per hour in 1979 to $48 per hour in 2016—a 27 percent increase. Wages in the upper-middle quintile increased by 12 percent, from $24 per hour to $27 per hour. In the bottom fifth, real wages fell slightly over the same period.
Recent research has shed light on how inequality is evolving between and within firms. For smaller firms, the rise in wage inequality has largely occurred across businesses, rather than within: some firms systematically pay higher wages than
others. By contrast, wage inequality within the largest firms has increased considerably (Song et al. 2015).
Some researchers have tied increases in wage inequality to globalization (Haskel et al. 2012), while others have explored the role of technological progress (Autor, Katz, and Kearney 2008; Goldin and Katz 2010). Labor market institutions, discussed in fact 6, have also had important effects on the distribution of wages.
However, widening inequality has not always been a feature of the U.S. economy. As recent work by Piketty, Saez, and Zucman (2016) has shown, overall income growth (including both labor and capital income) was tilted toward the lower end of the distribution from 1946 through 1980. Incomes rose faster in the bottom half of the income distribution than in the top 10 percent or top 1 percent. Since 1980, that process has clearly reversed.
Bottom Lower-middle Middle Upper-middle Top
2016
1979
Hou
rly
wag
e (2
016
dolla
rs)
Wage quintile
0
10
20
30
40
50
60
27.41%
11.50%
0.77%
-0.98%
3.41%

The Hamilton Project • Brookings 3
The education wage premium rose sharply until about 2000, contributing to rising wage inequality.3.
Chapter 1. Why Have Wages Been Stagnant for So Many Workers?
FIGURE 3A.
Bachelor’s Degree and Advanced Degree Wage Premiums, 1979–2016
FIGURE 3B.
Share of Income Quintile with a Four-Year Degree, 1979 and 2016
Wag
e qu
intil
e
2016
Top
Upper-middle
Middle
Lower-middle
Bottom
0% 20% 40% 60% 80% 100%
1979
Perc
ent o
f hig
h sc
hool
gra
duat
es’
hour
ly w
ages
Advanced degree premium
Bachelor’s degree premium
1979 1984 1989 1994 1999 2004 2009 2014100
180
140
220
Source: Current Population Survey, BLS (1979–2016); authors’ calculations.Note: Sample restricted to workers ages 25–54. Wage premiums are the ratio of median wages for each educational attainment group with respect to median wages for workers with exactly a high school diploma.
Source: Current Population Survey, BLS (1979–2016); authors’ calculations.Note: Wages are hourly. Sample is restricted to workers ages 25–54.
The wage benefit to a college degree increased remarkably during the last two decades of the 20th century, leveling off around 2000 at a historically high level (see figure 3a). Bachelor’s degree holders ages 25 to 54 in 1979 could expect to earn 134 percent of the wages received by those with only a high school education, and advanced degree holders could expect to earn 154 percent. By 2016 the wage premiums for a bachelor’s degree and an advanced degree had risen to 168 and 213 percent, respectively.
At the same time, the percent of workers with at least a four-year college degree also rose dramatically—from 23 percent in 1979 to 40 percent in 2016. As shown in figure 3b, workers across the wage distribution have become more educated, but the increases have been larger for those with higher wages. Workers with a college education are now the majority in the top two income quintiles: their shares doubled or nearly
doubled from 1979 to 2016. By contrast, college-educated workers represent just 15 percent of the bottom quintile. These changes in college attainment and the college wage premium reflect an evolving mix of individuals attaining college degrees as well as shifts in the relative demand for high-skilled labor (Abel and Deitz 2014).
Because wages fell for those workers with only a high school diploma, the increase in educational attainment did not lead to sharply rising wages for the typical worker, despite the education wage premium and rising attainment. However, increasing educational attainment still further could have important economic payoffs. By one estimate, increasing men’s college attainment by 10 percent would eliminate nearly all of the decline in median annual earnings observed from 1979 to 2013 (Hershbein, Kearney, and Summers 2015).

4 Thirteen Facts about Wage Growth
Globalization and technological change have likely put downward pressure on less-educated workers’ wages.
4.
Chapter 1. Why Have Wages Been Stagnant for So Many Workers?
FIGURE 4A.
U.S. Manufacturing Imports, 1973–2011 FIGURE 4B.
U.S. Manufacturing Output and Employment, 1973–2016
Source: Bivens (2013).
Source: Bureau of Economic Analysis (1973–2016); Current Employment Statistics, BLS (1973–2016).Note: Manufacturing output is gross real manufacturing output, deflated by Haver Analytics for years prior to 1997.
Shar
e of
GD
P (p
erce
nt)
Empl
oyee
s (m
illio
ns)
Man
ufac
turi
ng o
utpu
t(t
rilli
ons
of 2
009
dolla
rs)
1973 1979 1989 2000 2007 2011
Manufacturing employmentTotalImports fromless-developed countries
Manufacturing output
0
2
4
6
8
10
12
0
4
8
12
16
20
24
0
1
2
3
4
5
6
1973 1980 1987 1994 2001 2008 2015
While theory and evidence suggest overall gains to an economy when opening to trade, some groups may suffer negative consequences. Basic trade theory implies that when a country with abundant capital and high-skill workers (like the United States) trades with a country abundant in low-skill labor, lower-skilled labor in the rich country will experience losses (Stolper and Samuelson 1941). As seen in figure 4a, the United States imports more manufactured goods today than in prior decades, an increasing share of which has come from low-wage countries. Recent work focusing on China’s entry into the world economy suggests that it resulted in manufacturing job losses in the United States, in particular during the steeper job losses after 2000 (Autor, Dorn, and Hanson 2016).
Of course, globalization has conferred a number of benefits for workers. Trade has lowered consumer prices, helping increase real wages; moreover, exports can be an important source of productivity and wage growth (Bernard et al. 2007). However, U.S. imports are more likely than U.S. exports to be produced by low-skilled workers (Katz and Murphy 1992; Borjas et al. 1997), suggesting that trade may put downward pressure on wage growth for low-skilled American workers.
While globalization plays a role, most research finds that it is not principally responsible for the decline in labor demand experienced by low-skilled workers (Helpman 2016). Technological change that raises the relative productivity of high-skill workers is another important factor (Goldin and Katz 2010; Autor, Katz, and Kearney 2008).
The manufacturing sector provides an example of how technological progress can affect particular groups of workers. As seen in figure 4b, U.S. manufacturing output has increased considerably since 1973—nearly doubling in 40 years—while manufacturing employment has fallen sharply. This increase in manufacturing productivity has been accompanied by a shift from low-skilled to high-skilled workers in the industry (Berman et al. 1994).
Globalization and technology have brought great gains to American workers as a group, but their benefits have been unequally shared. They have likely contributed to worsening labor market outcomes for low-skilled workers, helping to explain the stagnation in their wages.

The Hamilton Project • Brookings 5
Wages have grown for women and fallen for men.5.
Chapter 1. Why Have Wages Been Stagnant for So Many Workers?
FIGURE 5.
Real Wages of White, Black, and Hispanic Men and Women, 1979 and 2016
Source: Current Population Survey, BLS (1979–2016); authors’ calculations.Note: Wages are median hourly earnings expressed in 2016 dollars and deflated using the CPI-U-RS. Sample is restricted to workers ages 25–54. Hollow green bars represent a decrease from 1979 to 2016. Race/ethnicity categories are mutually exclusive.
Wage inequality is closely linked to differences in earnings by gender and by race/ethnicity. In both 1979 and 2016, non-Hispanic white men earned more per hour than any other group. Relative to non-Hispanic black and Hispanic men, white men increased their advantage over that period. But within each racial/ethnic group, men’s wages have been stagnant or falling over time.
However, women have gained ground. White women have seen a wage increase of 34 percent, while black and Hispanic women have both experienced growth at around 17 percent. Women’s wage levels remain below those of men, but the gender wage gap has narrowed over time.
Much of this narrowing was driven by the increasing educational attainment of women. By the early 2000s, 25- to 54-year-old women had surpassed men in both four-year and advanced degree attainment (authors’ calculations; not shown). The segregation of men and women in different occupations—which accounts for some of the gender wage gap—diminished at the same time that more women obtained college degrees (Cortes and Pan forthcoming).
The gap in wages by race/ethnicity has proven harder to close. Labor market discrimination is an important part of this pattern (Bertrand and Mullainathan 2004; Charles and Guryan 2008), as are pre-labor market differences in the experiences of whites and people of color (Altonji and Blank 1999).
0
5
10
15
20
25
1979
2016
Women Men Women Men Women Men
Hou
rly
wag
e (2
016
dolla
rs)
White Black Hispanic
-1.4%
33.7%
16.9%
-8.9%
17.5%
-7.6%

6 Thirteen Facts about Wage Growth
Declines in the real minimum wage and union membership have affected wage growth.6.
Chapter 1. Why Have Wages Been Stagnant for So Many Workers?
FIGURE 6A.
Federal Minimum Wage, 1968–2016FIGURE 6B.
Public and Private Sector Union Membership, 1956–2016
Source: Minimum Wage Laws in the States, BLS (1968–2016); authors’ calculations.Note: The real minimum wage is expressed in 2016 dollars and is deflated using the CPI-U-RS.
Source: BLS (1975); Hirsch and Macpherson (2017); Current Population Survey, BLS (1983–2016); authors’ calculations.Note: Missing data interpolated for 1957, 1959, 1961, 1963, 1965, 1966, 1967, 1969, 1971, and 1982.
0
2
4
6
8
10
12
Min
imum
wag
e (d
olla
rs)
Real minimum wage
Nominal minimum wage
1968 1956 1966 1976 1986 1996 2006 20161980 1992 2004 20160
5
10
15
20
25
30
Uni
on m
embe
rshi
p(p
erce
nt o
f all
wor
kers
)
Private sector union members
Public sector union members
0
2
4
6
8
10
12
Min
imum
wag
e (d
olla
rs)
Real minimum wage
Nominal minimum wage
1968 1956 1966 1976 1986 1996 2006 20161980 1992 2004 20160
5
10
15
20
25
30
Uni
on m
embe
rshi
p(p
erce
nt o
f all
wor
kers
)
Private sector union members
Public sector union members
Although the increased demand for educated workers explains much of the rise in wages for workers in the upper part of the wage distribution, other factors account for wage stagnation among lower-income workers as well as the broader decline in the labor share of income.
One such factor is the decline in union membership. In 1956 about 28 percent of all workers belonged to a union; in 2016 that number was a little more 10 percent. This decline has occurred principally among private sector workers, only 5 percent of whom now belong to a union. With this fall in union membership has come an increase in wage inequality (Card 2001). The spread of other labor market institutions—such as noncompete contracts, and no-poaching and collusion agreements by firms—could also be contributing to weaker worker bargaining power.
In addition, decline in the real minimum wage has limited wage growth among low-wage workers. Autor, Manning, and Smith (2016) find that changes in the statutory minimum wage were one factor in explaining changes in the ratio of median wages and the 10th percentile of the wage distribution. Similar to the way that men were disproportionately affected by declining union membership (Fortin and Lemieux 1997), the falling real minimum wage in the 1980s disproportionately affected women, accounting for as much as half of the rise in wage inequality among women (Autor, Manning, and Smith 2016).
More recently, increases in state minimum wages appear to be raising wages at the bottom end of the wage distribution (Gould 2017). Raising the minimum wage could affect millions of workers with wages at or somewhat above the minimum wage (Kearney and Harris 2014).

The Hamilton Project • Brookings 7
Workers have become less likely to move to a different state or to a different job, reducing wage growth.
7.
Chapter 1. Why Have Wages Been Stagnant for So Many Workers?Chapter 1. Why Have Wages Been Stagnant for So Many Workers?
FIGURE 7A.
Interstate Mobility Rate, 1980–2016FIGURE 7B.
Worker Reallocation Rate, 1990–2013
Source: Current Population Survey Annual Social and Economic Supplement, BLS (1980–2016); authors’ calculations.Note: Restricted to prime-age respondents, ages 25–54. Data were not available for 1985 and 1995. Shaded bars indicate recessions.
Source: Davis and Haltiwanger (2014).Note: The worker reallocation rate is defined as the quarterly sum of hires and separations as a share of employment. For more information, see Davis and Haltiwanger (2014). Shaded bars indicate recessions.
Inte
rsta
te m
obili
ty ra
te (p
erce
nt)
2
3
4
1
0
Real
loca
tion
rate
(per
cent
)
1980 1990 1993 1996 1999 2002 2005 2008 20111986 1992 1998 2004 2010 2016
20
25
30
35
15
10
5
0
Inte
rsta
te m
obili
ty ra
te (p
erce
nt)
2
3
4
1
0
Real
loca
tion
rate
(per
cent
)
1980 1990 1993 1996 1999 2002 2005 2008 20111986 1992 1998 2004 2010 2016
20
25
30
35
15
10
5
0
In recent decades American workers have become less likely to move to new places and to new jobs. Since 1990, interstate mobility—defined as the percent of U.S. residents who move from one state to another in a given year—has declined by half, from 3.8 percent in 1990 to less than 2.0 percent in 2016 (see figure 7a). The labor market is a principal driver of migration, accounting for about half of interstate moves (BLS 1980–2016; authors’ calculations). Part of the explanation for the long-run decline in geographic mobility lies in economic diversification: as each region of the country attracts a wider range of industries, the regions become more alike, allowing workers to find jobs locally that they would have otherwise had to relocate to obtain (Kaplan and Schulhofer-Wohl 2017).
At the same time, workers are switching jobs less frequently and staying longer at the jobs they have. Figure 7b shows the decline in the worker reallocation rate, defined as the sum of hires and separations, both divided by total employment. After remaining approximately level through the 1990s, the rate subsequently fell by almost one-quarter. Worker reallocation
rates have fallen for male and female workers, as well as for workers of all ages, education levels, and states of residence (Davis and Haltiwanger 2014).
Diminished worker mobility might have an important negative impact on workers’ wage growth. Under normal economic conditions, job-to-job mobility generates about 1 percent earnings growth per quarter. During recessions, this mobility declines and workers find it more difficult to climb the job ladder into higher-wage positions (Haltiwanger et al. 2017).
Public policy has likely contributed to the decline in both geographic and job-to-job mobility. Occupational licenses and noncompete contracts, for example, often hinder workers’ ability to pursue economic opportunity outside of their current state and employer (Starr, Bishara, and Prescott 2017; White House 2015). In addition, land-use restrictions that reduce new housing development contribute to a reduction in worker movement to high productivity areas, limiting both productivity and wage growth (Ganong and Shoag 2017).

8 Thirteen Facts about Wage Growth
Business formation and closings have declined.8.Chapter 1. Why Have Wages Been Stagnant for So Many Workers?Chapter 1. Why Have Wages Been Stagnant for So Many Workers?
FIGURE 8.
Start-up and Exit Rates for U.S. Firms, 1979–2014
Source: Business Dynamics Statistics, U.S. Census Bureau (2016); authors’ calculations.Note: Shaded bars indicate recessions.
10
18
16
14
12
8
61979 1984 1989 1994 1999 2004 2009 2014
Newly formed �rms
Perc
ent o
f all
�rm
s
Firms exiting
Over the past several decades, start-ups have become increasingly scarce, with their share of all firms falling from 14 percent in 1979 to 8 percent in 2014. At the same time, the rate at which businesses close down has declined slightly over the long run. Unsurprisingly, the Great Recession was a period of temporarily elevated business closings and depressed business start-ups.
Young firms now employ a smaller share of workers. Davis and Haltiwanger (2014) explain that the decline in young, fast-expanding firms has contributed to falling business dynamism and job churn.
More firms exited than entered during the Great Recession, and the typical firm’s age has continued to rise (Davis and Haltiwanger 2014). Researchers have linked the decline in the
number of young firms to increased business consolidation and decreased rates of population growth (Hathaway and Litan 2014). The fall in start-ups and young firms has a negative impact on wages. Young firms tend to poach workers who are making job-to-job moves, which can help them to climb the job ladder and achieve stronger wage growth (Haltiwanger et al. 2017). As the average age of firms increases, job churn falls (Wiczer 2014), resulting in diminished economic growth (Lazear and Spletzer 2012).
Diminished dynamism can also impede the reallocation of resources to high productivity firms; recent research indicates that the decline in dynamism in the tech sector occurred at the same time as the decline in productivity growth (Decker et al. 2016). This lower productivity growth in turn restrains wage growth.

The Hamilton Project • Brookings 9
Inflation-adjusted wage growth was higher from 2007 to 2017 than it was during previous business cycles.
9.
Chapter 2. How Strong Has Wage Growth Been s ince the Great Recession?
By comparison with the previous three business cycles, inflation-adjusted wage growth since 2007 has been relatively strong. It is slightly ahead of the growth seen during the 1990s or 2000s business cycles and is notably higher than growth in the 1980s. Figure 9a plots year-over-year growth in real average hourly earnings for production and nonsupervisory workers, showing trend growth separately for 1981–90 (-0.37 percent), 1990–2001 (0.71 percent), 2001–7 (0.31 percent), and 2007–17 (0.83 percent). It is important to note that this recent real wage growth followed years of stagnation and has been accompanied by rising inequality, likely making it feel insufficient to many workers.
FIGURE 9A.
Real Wage Growth, 1981–2017
FIGURE 9B.
Nominal Wage Growth, 1981–2017
Source: Current Employment Statistics, BLS (1981–2017); authors’ calculations.Note: Horizontal lines indicate annualized wage growth over a given period.
However, low inflation during this most recent period generates a starkly different story for nominal wage growth (i.e., wage growth without any adjustment for inflation). Figure 9b shows that nominal annual wage growth has been just 2.4 percent since the start of the Great Recession, contrasting with nominal wage growth above 3.0 percent in each of the previous business cycles.
Typically, nominal wage growth rises later in expansions and falls during recessions, while real wage growth may jump up or down with variation in inflation. But the most recent expansion has seen little uptick in nominal wage growth, especially in contrast to the previous three expansions.
1981 1986 1991 1996 2001 2006 2011 2016
Perc
ent c
hang
e fr
omon
e ye
ar a
go
3.56 percent 3.28 percent 3.07 percent 2.34 percent
0
2
4
6
8
10
Perc
ent c
hang
e fr
omon
e ye
ar a
go
1981 1986 1991 1996 2001 2006 2011 2016
-0.37 percent 0.71 percent 0.31 percent 0.82 percent
-2
0
2
4
6
-4
1981 1986 1991 1996 2001 2006 2011 2016
Perc
ent c
hang
e fr
omon
e ye
ar a
go
3.56 percent 3.28 percent 3.07 percent 2.34 percent
0
2
4
6
8
10
Perc
ent c
hang
e fr
omon
e ye
ar a
go
1981 1986 1991 1996 2001 2006 2011 2016
-0.37 percent 0.71 percent 0.31 percent 0.82 percent
-2
0
2
4
6
-4

10 Thirteen Facts about Wage Growth
Labor market slack has declined during the recovery from the Great Recession, though some likely remains.
10.
Chapter 2. How Strong Has Wage Growth Been s ince the Great Recession?
FIGURE 10A.
Unemployment Rate and Alternative Measure of Labor Market Slack, 2007–17
FIGURE 10B.
Share of Labor Force That Works Part Time for Economic Reasons, 2007–17
Source: Current Population Survey, BLS (2007–17).Note: The U-6 unemployment rate includes total unemployed, all persons marginally attached to the labor force, and total persons employed part time for economic reasons. Data are seasonally adjusted. Shaded bars indicate recessions.
Perc
ent o
f lab
or fo
rce
Perc
ent
Alternative U-6 rate
Official unemployment rate
2007 2009 2011 2013 2015 20170
20
16
12
8
4
2007 2009 2011 2013 2015 2017
2
4
6
8
0
Perc
ent o
f lab
or fo
rce
Perc
ent
O�cial unemployment rate
Alternative U-6 rate
2007 2009 2011 2013 2015 20170
20
16
12
8
4
2007 2009 2011 2013 2015 2017
2
4
6
8
0
While in the long run real wage growth depends on productivity and the distribution of gains from productivity, over shorter time horizons wage growth can be determined by the supply and demand for labor. When there is extensive slack in the economy—such as during a recession or the early phase of a recovery, when labor and capital are underutilized—wage growth can be temporarily lower. At these times, there are more unemployed workers and hiring demand is low, both of which put downward pressure on wages.
The sizable slack in the U.S. labor markets early in the Great Recession likely put substantial downward pressure on wage growth for a number of years. By many measures, labor market slack is now at roughly its prerecessionary level. The unemployment rate was 4.3 percent as of July 2017, with several states experiencing record lows. The alternative U-6 rate—a broader measure of unemployment that includes the unemployed, people working part time who would like full-
time work, and those who would like a job but are not actively looking (marginally attached workers)—is also at its lowest level since the Great Recession. A number of other measures tell a similar story, including the rise in workers’ job quits, job openings rate, and the length of time required for firms to fill job vacancies (Yellen 2017). Still, there might be slack remaining in the labor market: the number of people working part time for economic reasons remains elevated relative to the precrisis period, inflation remains unusually low, and the employment rate of prime-age workers remains below its prerecession starting point.
Diminishing slack in the labor market generally means that employers must pay higher wages to attract workers (Krueger 2015). Wage growth for less-educated workers is particularly sensitive to changes in labor demand (Katz and Krueger 1999), but thus far the large reduction in slack has not been accompanied by dramatically higher nominal wage growth.
The Hamilton Project • Brookings 11
Recent labor productivity growth has been slow, restraining wage growth.11.
Chapter 2. How Strong Has Wage Growth Been s ince the Great Recession?
FIGURE 11A.
Productivity Growth, Inflation, and Wage Growth Rates, 1981–2017
FIGURE 11B.
Capital Intensity Growth Rate, 1981–2007, and 2007–16
Sources: Current Employment Statistics, BLS (1981–2017); Productivity and Costs, BLS (1981–2017); authors’ calculations.Note: Growth rates are expressed in annual terms. Nominal wage is average hourly earnings for production and nonsupervisory workers, expressed in 2016 dollars and deflated using the CPI-U-RS; productivity is private nonfarm business real output per hour of all persons.
Source: Multifactor Productivity Trends, BLS (1981–2016); authors’ calculations.Note: Growth rates are expressed in annual terms. Capital intensity is the ratio of capital services to labor hours for the private nonfarm business sector. Capital services are the flow of productive services derived from an asset used in production.
Gro
wth
rate
(per
cent
)
1981 Q3–2007 Q4
Gro
wth
rate
(per
cent
)
1981–2007 2007–162007 Q4–2017 Q20
2
4
6
0.0
0.2
0.4
0.6
0.8
1.0
In�ation
Productivity
Nominal wage2.36%
Nominal wage3.30%
Gro
wth
rate
(per
cent
)
1981 Q3–2007 Q4
Gro
wth
rate
(per
cent
)
1981–2007 2007–162007 Q4–2017 Q20
2
4
6
0.0
0.2
0.4
0.6
0.8
1.0
In�ation
Productivity
Nominal wage2.36%
Nominal wage3.30%
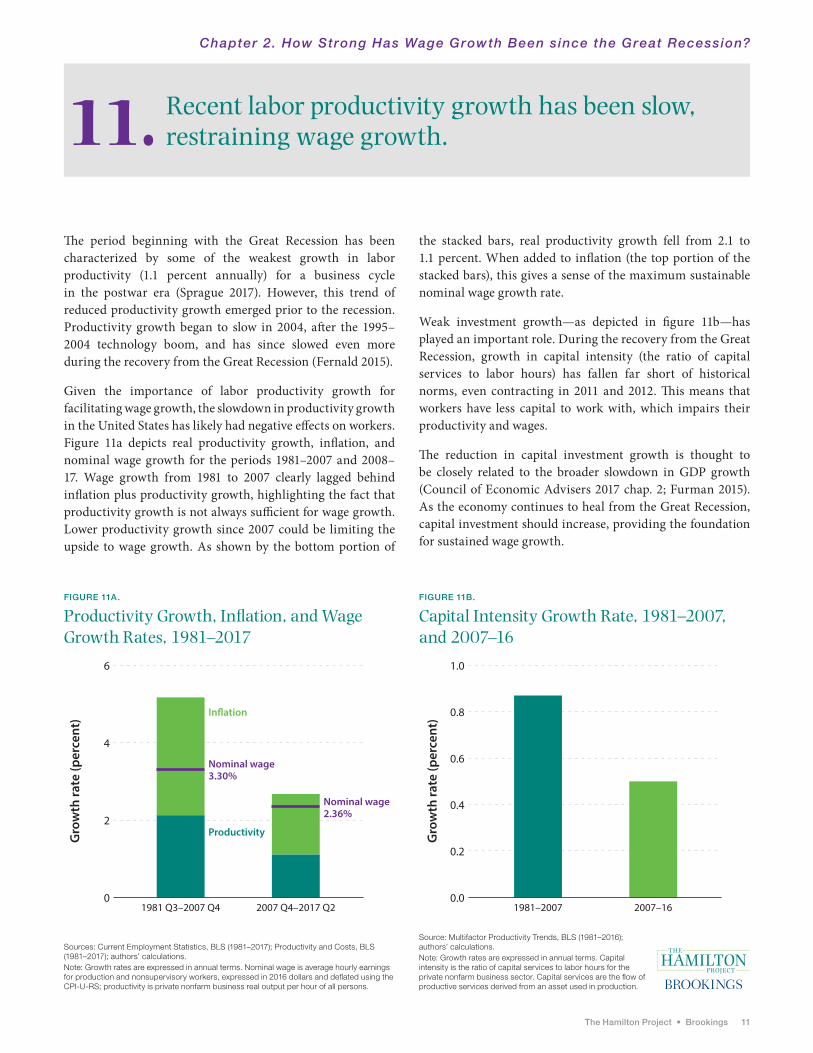
The period beginning with the Great Recession has been characterized by some of the weakest growth in labor productivity (1.1 percent annually) for a business cycle in the postwar era (Sprague 2017). However, this trend of reduced productivity growth emerged prior to the recession. Productivity growth began to slow in 2004, after the 1995–2004 technology boom, and has since slowed even more during the recovery from the Great Recession (Fernald 2015).
Given the importance of labor productivity growth for facilitating wage growth, the slowdown in productivity growth in the United States has likely had negative effects on workers. Figure 11a depicts real productivity growth, inflation, and nominal wage growth for the periods 1981–2007 and 2008–17. Wage growth from 1981 to 2007 clearly lagged behind inflation plus productivity growth, highlighting the fact that productivity growth is not always sufficient for wage growth. Lower productivity growth since 2007 could be limiting the upside to wage growth. As shown by the bottom portion of
the stacked bars, real productivity growth fell from 2.1 to 1.1 percent. When added to inflation (the top portion of the stacked bars), this gives a sense of the maximum sustainable nominal wage growth rate.
Weak investment growth—as depicted in figure 11b—has played an important role. During the recovery from the Great Recession, growth in capital intensity (the ratio of capital services to labor hours) has fallen far short of historical norms, even contracting in 2011 and 2012. This means that workers have less capital to work with, which impairs their productivity and wages.
The reduction in capital investment growth is thought to be closely related to the broader slowdown in GDP growth (Council of Economic Advisers 2017 chap. 2; Furman 2015). As the economy continues to heal from the Great Recession, capital investment should increase, providing the foundation for sustained wage growth.

12 Thirteen Facts about Wage Growth
In recent years, measured wage growth has been depressed by changes in the workforce.12.
Chapter 2. How Strong Has Wage Growth Been s ince the Great Recession?
FIGURE 12.
Drag on Median Earnings Growth from Changing Composition of Full-Time Workforce, 2001–17
Source: Daly, Hobijn, and Pyle (2017).Note: Series shows the Daly, Hobijn, and Pyle estimate of the percentage point reduction in median weekly earnings growth accounted for by transitions to and from full-time employment. See Daly and Hobijn (2016); and Daly, Hobijn, and Pyle (2017) for details. Shaded bars indicate recessions.
Perc
enta
ge p
oint
s
0
1
2
-1
3
2001 2004 2007 2010 2013 2016
Measured wage growth reflects changes in wages for continuously employed workers as well as changes in the composition of the workforce. That latter component of wage growth evolves as workers of varying wage levels enter and exit employment. At any given time, those exiting employment might have wages that are quite different from (and typically higher than) the wages of those who enter, causing overall wage growth to differ from the wage growth of workers who were continuously employed (Daly and Hobijn 2016).
Figure 12 displays the drag on median weekly earnings growth from the changing composition of the full-time workforce. In normal times, entrants to full-time employment have lower wages than those exiting, which tends to depress measured wage growth. During the Great Recession this effect diminished substantially when an unusual number of low-wage workers exited full-time employment and few were entering (Daly and Hobijn 2016). After the Great Recession
ended, the recovering economy began to pull workers back into full-time employment from part-time employment (see fact 10) and nonemployment, while higher-paid, older workers left the labor force.
Wage growth in the middle and later parts of the recovery fell short of the growth experienced by continuously employed workers, reflecting both the retirements of relatively high-wage workers and the reentry of workers with relatively low wages. In 2017 the effect of this shifting composition of employment remains large, at more than 1.5 percentage points.3 If and when growth in full-time employment slows, we can expect this effect to diminish somewhat, providing a boost to measured wage growth. Given that the gap has been roughly stable for the past five years, this composition effect does not explain the lack of pick-up in wages as the labor market has tightened, but rather helps account for the overall slow pace of growth in nominal wages during the entire recovery.

The Hamilton Project • Brookings 13
Wage growth during the Great Recession occurred among top earners, but has since become more broadly shared.
13.
Chapter 2. How Strong Has Wage Growth Been s ince the Great Recession?
FIGURE 13.
Real Wage Growth by Wage Quintile, 2007–10 and 2010–16
Source: Current Population Survey, BLS (2007–16); authors’ calculations.Note: Wages are hourly and expressed in 2016 dollars, deflated using the CPI-U-RS. Sample is restricted to workers ages 25–54 and pooled within years. Growth rates are cumulative.
During the Great Recession workers with wages in the bottom three income quintiles—60 percent of all workers—experienced limited or no growth in their wages. For the top-earning 40 percent of workers, wages increased by more than 1 percent over the same period.
Since 2010, however, wage growth has accelerated for all workers, and particularly for the lowest-paid workers. One explanation for recent wage growth among low-wage workers is the legislated increase in the minimum wage in many states (Gould 2017). Comparing changes in state minimum wages from 2015 to 2016, Gould (2017) shows that workers in the 10th percentile experienced real wage growth of 5.2 percent in states that raised their minimum wage, compared to an increase of 2.5 percent in states that did not.
Despite the more rapid increase at the bottom of the income spectrum, along with continued growth at the top, wage growth for workers in the middle quintiles has continued to be sluggish. One possible factor limiting wage growth in the recovery is that, during the recession itself, wages were to some extent prevented from falling (e.g., by employee reluctance to accept wage reductions). If wage rigidities prevented wage cuts, employers might have limited raises during the recovery to rebalance (Daly and Hobijn 2015). However, as time passed after the end of the recession, the wage-dampening influence of this factor weakened.
Bottom Lower-middle Middle Upper-middle Top
2010–16
2007–10
Wag
e gr
owth
(per
cent
)
Wage quintile
0
1
2
3

14 Thirteen Facts about Wage Growth
Conclusion. What Public Policies Can Achieve
Nearly every economic policy can have impacts on wage growth in one way or another, given the wide array of factors that determine wages. Proper macroeconomic
policy can keep the economy out of extended recessions and maintain demand for labor at a high enough level to drive wage growth, particularly for low-wage workers. Longer-run growth, though, requires both productivity and distributional policies to ensure that wage growth is widely shared.
Policies that support labor productivity growth range from those that enable innovation (basic research funding, patent rules, and entrepreneurship support), to those that increase human capital (education and training polices), to those that affect the level of investment (tax incentives, regulatory policy, and public infrastructure investment). Land-use policies that keep people from moving to high-productivity areas, in addition to occupational licensing rules that keep them from moving to new jobs or starting firms, seem likely to choke off both wages and productivity growth. Notably, decreasing firm dynamism lowers productivity growth and disrupts wage ladders in ways that might have been particularly deleterious for wage growth. A faster growing and more dynamic economy would benefit workers.
At the same time, the declining labor share over the past few decades and the disconnect between productivity and compensation makes clear that while economic growth is necessary for broadly shared wage growth, it is not sufficient. Faster wage growth across the distribution has not automatically followed economic growth in the United States for the past few decades. Weakened unions combined with noncompete contracts, market power exercised by firms in labor markets, and a declining real minimum wage have left workers with a smaller share of gains. In addition to faster productivity growth, it will likely be necessary to tilt the institutions of the U.S. labor market back toward workers to ensure that workers across the income distribution see their wages rise. If policy reforms—including mobility policies, noncompete reform, and licensing reform—help workers either start new businesses or move to more productive firms, these reforms could increase both productivity and wages.
Policies aimed at wage growth are not the only strategy for improving living standards. In particular, tax and transfer policies have significant roles to play in supporting employment and in achieving equitable distribution of gains from economic growth. Efforts to raise employment and labor force participation would boost household incomes even without increases in hourly wages. But policies that drive market wage growth are a core part of improving living standards for all Americans.

The Hamilton Project • Brookings 15
Technical Appendix
Fact 2. Wages have risen for those in the top half of the wage distribution, but stagnated for those in the bottom half.Figure 2. Hourly Wages by Percentile, 1979 and 2016Data come from the Current Population Survey, Bureau of Labor Statistics (1979–2016) and are deflated using the CPI-U-RS. Age range restricted to 25–54. Average real wages within each quintile are used to calculate cumulative wage growth rates from 1979 to 2016.
Fact 6. Declines in the real minimum wage and union membership have affected wage growth.Figure 6B. Public and Private Sector Union Membership, 1956–2016Data for 1956–72 come from the Bureau of Labor Statistics, Handbook of Labor Statistics 1975 (1975); data for 1973–81 come from Hirsch and Macpherson (2017); data for 1983–2016 come from the Current Population Survey, Bureau of Labor Statistics (1983–2016). We calculated unionization shares by public and private sector by dividing employed private wage and salary workers (members of unions) and employed wage and salary workers in government (members of unions) by
total employed wage and salary workers. We interpolated data for missing values.
Fact 8. Business formation and closings have declined.Figure 8. Start-up and Exit Rates for U.S. Firms, 1977–2014Data come from the Business Dynamics Statistics, U.S. Census Bureau (2016). “Newly created firms” are defined as firms age 0 in a given year. Firms age 0 and firm exits are divided by the total number of firms in each year to calculate annual start-up and exit rates, respectively.
Fact 9. Inflation-adjusted wage growth was higher from 2007 to 2017 than it was during previous business cycles.Figure 9. Real and Nominal Annual Wage Growth, 1981–2017Wages are seasonally adjusted average hourly earnings for production and nonsupervisory workers, deflated using the CPI-U-RS. Growth rates are year-over-year percent changes. Average wage growth is the annualized growth rate from an NBER-defined business cycle peak to the subsequent peak.
Endnotes
1. Cumulative real wage growth is sensitive to the particular method of inflation adjustment. Some researchers use the Consumer Price Index for All Urban Consumers (CPI-U) deflator, which implies even lower real wage growth, or the Personal Consumption Expenditures (PCE) deflator, which implies higher real wage growth (Bivens and Mishel 2015; Sacerdote 2017).
2. There is also a technical issue that explains some of the gap. In recent decades the CPI deflator used to adjust for wage inflation has increased more than the GDP deflator used for productivity. According to analysis by
Bivens and Mishel (2015), the deflator difference accounts for roughly one third of the compensation versus productivity differential.
3. In a similar vein, the Atlanta Federal Reserve “Wage Tracker” series, which calculates wage growth for continuously employed workers, currently shows faster growth than average hourly wage growth for all employees. However, the Wage Tracker series still shows slower nominal growth than in the pre-2007 period.

16 Thirteen Facts about Wage Growth
References
Abel, Jaison R., and Richard Deitz. 2014. “Do the Benefits of College Still Outweigh the Costs?” Current Issues in Economics and Finance 20 (3): 1–11.
Altonji, Joseph G., and Rebecca M. Blank. 1999. “Race and Gender in the Labor Market.” In Handbook of Labor Economics Volume 3C, edited by Orley Ashenfelter and David Card, 3143–259. Amsterdam, Netherlands: Elsevier B.V.
Autor, David H., David Dorn, and Gordon H. Hanson. 2016. “The China Shock: Learning from Labor-Market Adjustment to Large Changes in Trade.” Annual Review of Economics 8 (1): 205–40.
Autor, David, David Dorn, Lawrence F. Katz, Christina Patterson, and John Van Reenen. 2017. “Concentrating on the Fall of the Labor Share.” American Economic Journal: Papers & Proceedings 107 (5): 180–85.
Autor, David H., Lawrence F. Katz, and Melissa S. Kearney. 2008, May. “Trends in U.S. Wage Inequality: Revising the Revisionists.” The Review of Economics and Statistics 90 (2): 300–23.
Autor, David H., Alan Manning, and Christopher L. Smith. 2016. “The Contribution of the Minimum Wage to U.S. Wage Inequality over Three Decades: A Reassessment.” American Economic Journal: Applied Economics 8 (1): 58–99.
Berman, Eli, John Bound, and Zvi Griliches. 1994. “Changes in the Demand for Skilled Labor within U.S. Manufacturing: Evidence from the Annual Survey of Manufacturers.” The Quarterly Journal of Economics 109 (2): 367–97.
Bernard, Andrew B., J. Bradford Jensen, Stephen J. Redding, and Peter K. Schott. 2007. “Firms in International Trade.” Journal of Economic Perspectives 21 (3): 105–30.
Bertrand, Marianne, and Sendhil Mullainathan. 2004, September. “Are Emily and Greg More Employable than Lakisha and Jamal? A Field Experiment on Labor Market Discrimination.” American Economic Review 94 (4): 991–1013.
Bivens, Josh. 2013, March. “Using Standard Models to Benchmark the Costs of Globalization for American Workers without a College Degree.” Briefing Paper 354, Economic Policy Institute, Washington DC.
Bivens, Josh, and Lawrence Mishel. 2015, September. “Understanding the Historic Divergence Between Productivity and a Typical Worker’s Pay: Why It Matters and Why It’s Real.” Briefing Paper 406, Economic Policy Institute, Washington, DC.
Borjas, George J., Lawrence F. Katz, and Richard B. Freeman. 1997. “How Much Do Immigration and Trade Affect Labor Market Outcomes?” Brookings Papers on Economic Activity 1: 1–90.
Bureau of Economic Analysis. 1973–2016. “Annual GDP by Industry.” Bureau of Economic Analysis, U.S. Department of Commerce, Washington, DC.
Bureau of Labor Statistics (BLS). 1947–2017. “Productivity and Costs.” Bureau of Labor Statistics, U.S. Department of Labor, Washington, DC.
———. 1968–2017. “Minimum Wage Laws in the States.” Bureau of Labor Statistics, U.S. Department of Labor, Washington, DC.
———. 1973–2017. “Current Employment Statistics.” Bureau of Labor Statistics, U.S. Department of Labor, Washington, DC.
———. 1979–2017. “Current Population Survey.” Bureau of Labor Statistics, U.S. Department of Labor, Washington, DC.
———. 1980–2016. “Current Population Survey Annual Social and Economic Supplement.” Bureau of Labor Statistics, U.S. Department of Labor, Washington, DC.
———. 1981–2016. “Multifactor Productivity Trends.” Bureau of Labor Statistics, U.S. Department of Labor, Washington, DC.
———. 1991–2017. “Employer Costs for Employee Compensation.” Bureau of Labor Statistics, U.S. Department of Labor, Washington, DC.
———. 1975. Handbook of Labor Statistics 1975. Washington, DC: Bureau of Labor Statistics.
———. 2017. “Local Area Unemployment Statistics.” Bureau of Labor Statistics, U.S. Department of Labor, Washington, DC.
Card, David. 2001. “The Effect of Unions on Wage Inequality in the U.S. Labor Market.” Industrial and Labor Relations Review 54 (2): 296–315.
Council of Economic Advisers (CEA). 2017. Economic Report of the President. Washington, DC: Government Publishing Office.
Charles, Kerwin K., and Jonathan Guryan. 2008, October. “Prejudice and Wages: An Empirical Assessment of Becker’s The Economics of Discrimination.” Journal of Political Economy 116 (5): 773–809.
Cortes, Patricia, and Jessica Pan. Forthcoming. “When Time Binds: Substitutes for Household Production, Returns to Working Long Hours, and the Gender Wage Gap Among the Highly Skilled.” Journal of Labor Economics.
Daly, Mary C., and Bart Hobjin. 2015, January. “Why Is Wage Growth So Slow?” Economic Letter No. 2015-01, Federal Reserve Bank of San Francisco.
———. 2016. “The Intensive and Extensive Margins of Real Wage Adjustment.” Working Paper No. 2016-04, Federal Reserve Bank of San Francisco.
Daly, Mary C., Bart Hobijn, and Benjamin Pyle. 2017. “The Good News on Wage Growth.” [Blog]. SF Fed Blog, Federal Reserve Bank of San Francisco.
Davis, Steven J., and John Haltiwanger. 2014, September. “Labor Market Fluidity and Economic Performance.” Working Paper No. 20479, National Bureau of Economic Research, Cambridge, MA.

The Hamilton Project • Brookings 17
Decker, Ryan A., John Haltiwanger, Ron S. Jarmin, and Javier Miranda. 2016, August. “Declining Business Dynamism: Implications for Productivity?” Brookings Institution, Washington, DC.
Elsby, Michael W. L., Bart Hobijn, and Ayşegül Şahin. 2013. “The Decline of the U.S. Labor Share.” Brookings Papers on Economic Activity Fall 2013: 1–52.
Fernald, John G. 2015. “Productivity and Potential Output Before, During, and After the Great Recession.” NBER Macroeconomics Annual 29 (1): 1–51.
Fortin, Nicole M., and Thomas Lemieux. 1997. “Institutional Changes and Rising Wage Inequality: Is there a Linkage?” Journal of Economic Perspectives 11 (2): 75–96.
Furman, Jason. 2015. “Business Investment in the United States: Facts, Explanations, Puzzles, and Policies.” Remarks by Jason Furman, Chairman, Council of Economic Advisors, to the Progressive Policy Institute, September 30, Washington, DC.
Furman, Jason. 2016. “Inequality: Facts, Explanations, and Policies.” Remarks by Jason Furman, Chairman, Council of Economic Advisors, to the City College of New York, October 27, New York, NY.
Ganong, Peter, and Daniel W. Shoag. 2017. “Why Has Regional Income Convergence in the U.S. Declined?” Working Paper No. 23609, National Bureau of Economic Research, Cambridge, MA.
Goldin, Claudia, and Lawrence F. Katz. 2010, March. The Race between Education and Technology. Cambridge, MA; London, England: Harvard University Press.
Gould, Elise. 2017, March. “The State of American Wages 2016.” Economic Policy Institute, Washington, DC.
Haltiwanger et al. 2017, June. “Cyclical Job Ladders by Firm Size and Firm Wage.” Working Paper No. 23485, National Bureau of Economic Research, Cambridge, MA.
Haskel, Jonathan, Robert Z. Lawrence, Edward E. Leamer, and Matthew J. Slaughter. 2012. “Globalization and U.S. Wages: Modifying Classic Theory to Explain Recent Facts.” Journal of Economic Perspectives 26 (2): 119–40.
Hathaway, Ian, and Robert E. Litan. 2014. “What’s Driving the Decline in the Firm Formation Rate? A Partial Explanation.” Brookings Institution, Washington, DC.
Helpman, Elhanan. 2016, December. “Globalization and Wage Inequality.” Background paper for the Keynes Lecture in Economics, delivered to the British Academy on September 28, 2016.
Hershbein, Brad, Melissa S. Kearney, and Lawrence H. Summers. 2015. “Increasing Education: What It Will and Will Not Do for Earnings and Earnings Inequality.” Brookings Institution, Washington, DC.
Hirsch, Barry and David Macpherson. “Union Membership and Coverage Database from the CPS.” http://www.unionstats.com. Last modified February 11, 2017.
International Monetary Fund (IMF). 2017, April. World Economic Outlook: Gaining Momentum? Washington, DC: International Monetary Fund.
Kaplan, Greg, and Sam Schulhofer-Wohl. 2017, February. “Understanding the Long-Run Decline in Interstate Migration.” International Economic Review 58 (1): 57–94.
Karabarbounis, Loukas and Brent Neiman. 2014. “The Global Decline of the Labor Share.” The Quarterly Journal of Economics 129 (1): 61–103.
Katz, Lawrence F., and Alan B. Krueger. 1999. “The High-Pressure U.S. Labor Market of the 1990s.” Brookings Papers on Economic Activity 1: 1–87.
Katz, Lawrence F., and Kevin M. Murphy. 1992. “Changes in Relative Wages, 1963–1987: Supply and Demand Factors.” The Quarterly Journal of Economics 107 (1): 35–78.
Kearney, Melissa S., and Benjamin H. Harris. 2014. “The ‘Ripple Effect’ of a Minimum Wage Increase on American Workers.” Economic Analysis, The Hamilton Project, Brookings Institution, Washington, DC.
Krueger, Alan B. 2015. “How Tight Is the Labor Market?” The 2015 Martin Feldstein Lecture. NBER Reporter 3. National Bureau of Economic Research, Cambridge, MA.
Lazear, Edward P., and James R. Spletzer. 2012. “Hiring, Churn, and the Business Cycle.” American Economic Review 102 (3): 575–79.
Pierce, Brooks. 2010, October. “Recent Trends in Compensation Inequality.” In Labor in the New Economy, edited by Katharine G. Abraham, James R. Spletzer, and Michael Harper, 63–98. Chicago: University of Chicago Press.
Piketty, Thomas, Emmanuel Saez, and Gabriel Zucman. 2016, December. “Distributional National Accounts: Methods and Estimates for the United States.” Working Paper No. 22945, National Bureau of Economic Research, Cambridge, MA.
Sacerdote, Bruce. 2017. “Fifty Years of Growth in American Consumption, Income, and Wages.” Working Paper No. 23292, National Bureau of Economic Research, Cambridge, MA.
Smith, Matthew, Danny Yagan, Owen Zidar, and Eric Zwick. 2017, July. “Capitalists in the Twenty-First Century.” Unpublished manuscript.
Song, Jae, David J. Price, Fatih Guvenen, Nicholas Bloom, and Till von Wachter. 2015, May. “Firming Up Inequality.” Working Paper No. 21199, National Bureau of Economic Research, Cambridge, MA.
Sprague, Shawn. 2017. “Below Trend: The U.S. Productivity Slowdown since the Great Recession.” Bureau of Labor Statistics, U.S. Department of Labor, Washington, DC.
Starr, Evan P., Norman Bishara, and J. J. Prescott. 2017, July. “Noncompetes in the U.S. Labor Force.” Social Science Research Network, Washington, DC.
Stolper, Wolfgang F., and Paul Samuelson. 1941. “Protection and Real Wages.” Review of Economic Studies 9 (1): 58–73.
U.S. Census Bureau. 2016. “Business Dynamics Statistics: 2014 Update.” U.S. Census Bureau, Washington, DC.
White House. 2015, July. “Occupational Licensing: A Framework for Policymakers.” Department of the Treasury Office of Economic Policy, the Council of Economic Advisers, and the Department of Labor, Washington, DC.
Wiczer, David. 2014, May. “The Recession’s Effect on Job Churn.” Federal Reserve Bank of St. Louis.
Yellen, Janet. 2017, January. “The Economic Outlook and the Conduct of Monetary Policy.” Speech given by Janet Yellen, Chair, at the Stanford Institute for Economic Policy Research, Stanford, CA.
18 Thirteen Facts about Wage Growth
Selected Hamilton Project Papers on Wages
POLICY PROPOSALS
• “A Proposal for Modernizing Labor Laws for Twenty-First Century Work: ‘The Independent Worker’”Seth D. Harris and Alan B. KruegerThe rise of technological intermediaries enabling workers to engage in the gig economy has resulted in protracted legal battles over whether to classify these workers as “employees” or “independent contractors.” Seth Harris and Alan Krueger propose assigning benefits and protections to independent workers according to whether or not the new benefits meet three certain considerations, and seek to address several growing issues in the labor market.
• “Strengthening Reemployment in the Unemployment Insurance System”Adriana KuglerHelping unemployed workers return to work has long been a policy challenge in the United States, and the urgency of the problem tends to increase during and after economic downturns. In this paper, Adriana Kugler offers three pilot programs to reform the unemployment system by encouraging different ways to return to work. The first program would allow the unemployed to continue claiming benefits while receiving entrepreneurial training and other assistance for setting up a business. The second program would support the unemployed through temporary positions and internships that might lead to full-time jobs. The third program would provide partial benefits to claimants who accept part-time jobs.
• “Reforming Occupational Licensing Policies”Morris KleinerOccupational licensing has been among the fastest-growing labor market institutions in the United States since World War II. Evidence suggests that occupational licensing has important effects on wage determination, benefits, employment, and prices, often imposing net costs on society with little improvement to service quality, health, and safety. To improve occupational licensing practices, Morris Kleiner proposes four specific reforms.
• “Designing Thoughtful Minimum Wage Policy at the State and Local Levels”Arindrajit DubeIn this policy memo, Arindrajit Dube proposes that state and local governments consider median wages and local costs when setting minimum wages, index the minimum wage for inflation, and engage in regional wage setting. This proposal aims to raise the earnings of low-wage workers with minimal negative impacts on employment. This proposal is chapter thirteen of The Hamilton Project’s Policies to Address Poverty in America, and a segment in Improving Safety Net and Work Support.
• “The Mobility Bank: Increasing Residential Mobility to Boost Economic Mobility”Jens Ludwig and Steven RaphaelWorkers with less education and savings often have difficulty financing residential moves to improve their job market outcomes. Ludwig and Raphael propose the creation of a “mobility bank” to help finance the residential moves of U.S. workers relocating either to take offered jobs or to search for work, and to help them learn more about the employment options available in other parts of the country.
ECONOMIC FACTS AND STRATEGY PAPERS
• “Seven Facts on Noncognitive Skills from Education to the Labor Market”Diane Whitmore Schanzenbach, Ryan Nunn, Lauren Bauer, Megan Mumford, and Audrey BreitwieserIn the past 30 years, the U.S. labor market has shifted dramatically toward increasing demand and reward for noncognitive skills. These noncognitive skills—elsewhere called soft skills or social, emotional, and behavioral skills—include qualities like perseverance, conscientiousness, self-control, social skills, and leadership ability. To facilitate success in the modern labor market, education policies should address how schools and teachers develop noncognitive skills. In this set of economic facts, The Hamilton Project explores the development of noncognitive skills in education and the returns to noncognitive skills in the labor market.
• “A Dozen Facts about America’s Struggling Lower-Middle Class”Melissa S. Kearney, Benjamin H. Harris, Elisa Jácome, and Lucie ParkerMany American families whose incomes are not low enough to officially place them in poverty live in economically precarious situations. This struggling lower-middle class consists of the 30 percent of working-age families with children who have incomes between 100 and 250 percent of the federal poverty level (FPL). These economic facts focus on two key challenges facing lower-middle-class families: food insecurity and the low return to work for families who lose tax and transfer benefits as their earnings increase.
• “Thirteen Economic Facts about Social Mobility and the Role of Education”Michael Greenstone, Adam Looney, Jeremy Patashnik, and Muxin YuIn this set of economic facts, The Hamilton Project examines the relationship between growing income inequality and social mobility in America. The memo explores the growing gap in educational opportunities and outcomes for students based on family income and the great potential of education to increase upward mobility for all Americans.

ADVISORY COUNCIL
GEORGE A. AKERLOFUniversity ProfessorGeorgetown University
ROGER C. ALTMANFounder & Senior ChairmanEvercore
KAREN ANDERSONSenior Director of Policy,Communications, and External AffairsBecker Friedman Institute forResearch in EconomicsThe University of Chicago
ALAN S. BLINDERGordon S. Rentschler Memorial Professor of Economics & Public AffairsPrinceton UniversityNonresident Senior FellowThe Brookings Institution
ROBERT CUMBYProfessor of EconomicsGeorgetown University
STEVEN A. DENNINGChairmanGeneral Atlantic
JOHN DEUTCHEmeritus Institute ProfessorMassachusetts Institute of Technology
CHRISTOPHER EDLEY, JR.Co-President and Co-FounderThe Opportunity Institute
BLAIR W. EFFRONCo-FounderCenterview Partners LLC
DOUGLAS W. ELMENDORFDean & Don K. Price Professorof Public PolicyHarvard Kennedy School
JUDY FEDERProfessor & Former DeanMcCourt School of Public PolicyGeorgetown University
ROLAND FRYERHenry Lee Professor of EconomicsHarvard University
JASON FURMANProfessor of PracticeHarvard Kennedy School
MARK T. GALLOGLYCofounder & Managing PrincipalCenterbridge Partners
TED GAYERVice President & DirectorEconomic StudiesThe Brookings Institution
TIMOTHY F. GEITHNERPresidentWarburg Pincus
RICHARD GEPHARDTPresident & Chief Executive OfficerGephardt Group Government Affairs
ROBERT GREENSTEINFounder & PresidentCenter on Budget and Policy Priorities
MICHAEL GREENSTONEThe Milton Friedman Professor in Economics and the CollegeDirector of the Becker Friedman InstituteDirector of the Energy Policy Instituteat ChicagoUniversity of Chicago
GLENN H. HUTCHINSChairmanNorth Island
JAMES A. JOHNSONChairmanJohnson Capital Partners
LAWRENCE F. KATZElisabeth Allison Professor of EconomicsHarvard University
MELISSA S. KEARNEYProfessor of EconomicsUniversity of MarylandNonresident Senior FellowThe Brookings Institution
LILI LYNTONFounding PartnerBoulud Restaurant Group
HOWARD S. MARKSCo-ChairmanOaktree Capital Management, L.P.
MARK MCKINNONFormer Advisor to George W. BushCo-Founder, No Labels
ERIC MINDICHChief Executive Officer & FounderEton Park Capital Management
SUZANNE NORA JOHNSONFormer Vice ChairmanGoldman Sachs Group, Inc.
PETER ORSZAGManaging Director & Vice Chairman ofInvestment BankingLazardNonresident Senior FellowThe Brookings Institution
RICHARD PERRYManaging Partner & Chief Executive OfficerPerry Capital
PENNY PRITZKERChairmanPSP Capital Partners
MEEGHAN PRUNTYManaging DirectorBlue Meridian PartnersEdna McConnell Clark Foundation
ROBERT D. REISCHAUERDistinguished Institute Fellow& President EmeritusUrban Institute
ALICE M. RIVLINSenior Fellow, Economic StudiesCenter for Health PolicyThe Brookings Institution
DAVID M. RUBENSTEINCo-Founder & Co-Chief Executive OfficerThe Carlyle Group
ROBERT E. RUBINFormer U.S. Treasury SecretaryCo-Chair EmeritusCouncil on Foreign Relations
LESLIE B. SAMUELSSenior CounselCleary Gottlieb Steen & Hamilton LLP
SHERYL SANDBERGChief Operating OfficerFacebook
DIANE WHITMORE SCHANZENBACHMargaret Walker Alexander ProfessorDirectorThe Institute for Policy ResearchNorthwestern UniversityNonresident Senior FellowThe Brookings Institution
RALPH L. SCHLOSSTEINPresident & Chief Executive OfficerEvercore
ERIC SCHMIDTExecutive ChairmanAlphabet Inc.
ERIC SCHWARTZChairman and CEO76 West Holdings
THOMAS F. STEYERBusiness Leader and Philanthropist
LAWRENCE H. SUMMERSCharles W. Eliot University ProfessorHarvard University
LAURA D’ANDREA TYSONProfessor of Business Administration andEconomicsDirectorInstitute for Business & Social ImpactBerkeley-Haas School of Business
JAY SHAMBAUGHDirector

W W W . H A M I L T O N P R O J E C T . O R G
W W W . H A M I L T O N P R O J E C T . O R G
1775 Massachusetts Ave., NW Washington, DC 20036
(202) 797-6279
Printed on recycled paper.
1. The share of economic output workers receive has generally fallen over the past few decades.
2. Wages have risen for those in the top half of the wage distribution, but stagnated for those in the bottom half.
3. The education wage premium rose sharply until about 2000, contributing to rising wage inequality.
4. Globalization and technological change have likely put downward pressure on less-educated workers’ wages.
5. Wages have grown for women and fallen for men.
6. Declines in the real minimum wage and union membership have affected wage growth.
7. Workers have become less likely to move to a different state or to a different job, reducing wage growth.
8. Business formation and closings have declined.
9. Inflation-adjusted wage growth was higher from 2007 to 2017 than it was during previous business cycles.
10. Labor market slack has declined during the recovery from the Great Recession, though some likely remains.
11. Recent labor productivity growth has been slow, restraining wage growth.
12. In recent years, measured wage growth has been depressed by changes in the workforce.
13. Wage growth during the Great Recession occurred among top earners, but has since become more broadly shared.
Thirteen Facts about Wage Growth
Labor Share of Income, 1973–2017
Source: Productivity and Costs, BLS (1973–2017).
Note: Labor share is defined as the sum of employee and proprietor labor compensation, divided by gross value-added output. Shaded bars indicate recessions.
54
56
58
60
Labo
r sha
re (p
erce
nt)
62
64
66
1973 1977 1981 1985 1989 1993 1997 2001 2005 2009 2013 2017