this business of food john kurnik, ph.d.. the last year a comprehensive report, with full industry...
TRANSCRIPT

This Business of FoodJohn Kurnik, Ph.D.

The last year a comprehensive report, with full industry cost disclosure, was issued by the USDA.
Subsequently, cost and profit data has not been assembled comprehensively by the USDA in one report.
The following chart uses parsed USDA data to complete the picture of consumer retail food expenditures through 2010.
1997

Source: Economic Research Service/USDA
1970
1974
1978
1982
1986
1990
1994
1998
2002
2006
2010
0100200300400500600700800900
1000
Farm Value Marketing Bill
U.S. Consumer Expenditures in Billions of Dollars

Source: David Bakke, AOL Money and Finance, 09/10/2010
Pasta-Pasta Meals such as spaghetti, ziti, or macaroni and
cheese (just to name a few) Cost to Produce = $0.20 to $2.50 per eight ounce
retail serving. This includes tomato sauce, spices and processed cheese product when required.
Red meat, fish, or poultry excluded. Pasta or “Paste” was the meal of the working class
because it was simple and cheap to produce.
Largest Profit Margin Foods
Source: David Bakke, AOL Money and Finance, 09/10/2010
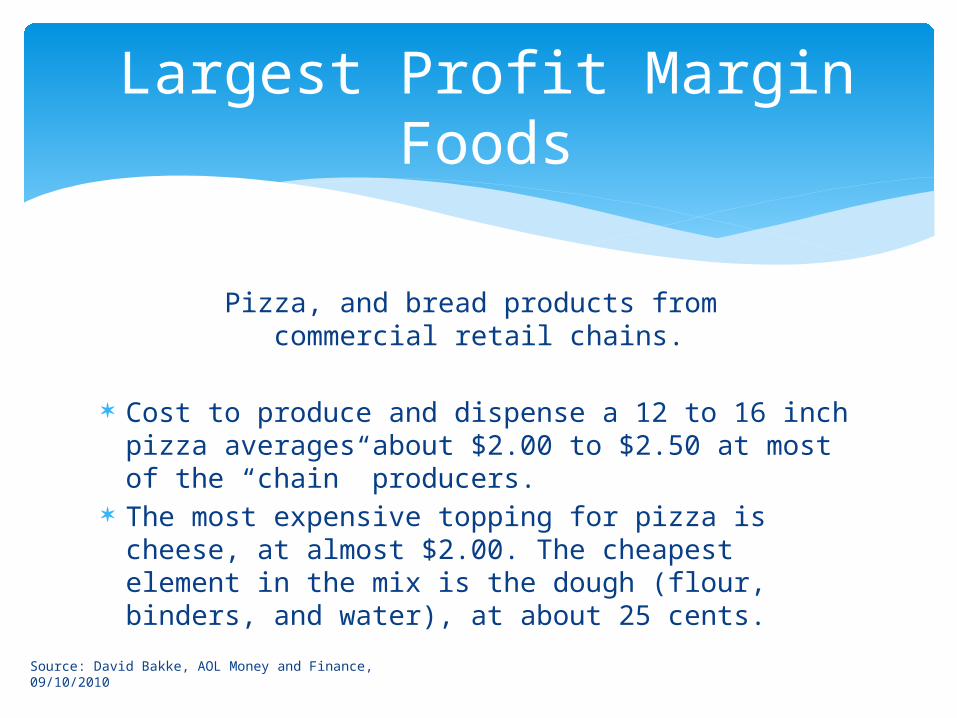
Pizza, and bread products from commercial retail chains.
Cost to produce and dispense a 12 to 16 inch pizza averages about $2.00 to $2.50 at most of the “chain” producers.
The most expensive topping for pizza is cheese, at almost $2.00. The cheapest element in the mix is the dough (flour, binders, and water), at about 25 cents.
Largest Profit Margin Foods
Source: David Bakke, AOL Money and Finance, 09/10/2010
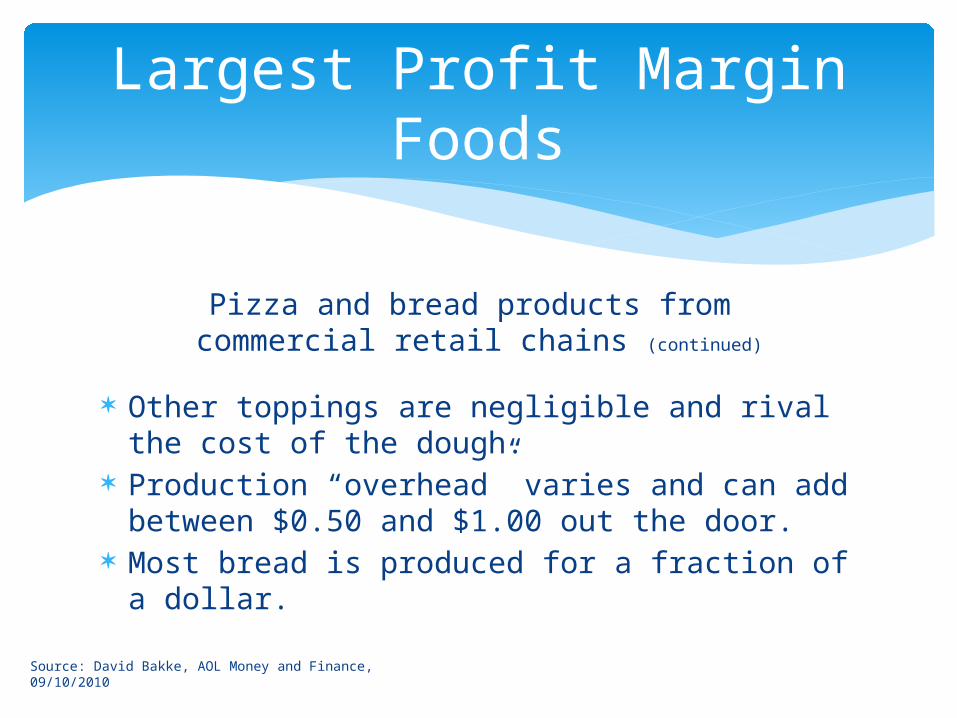
Pizza and bread products from commercial retail chains (continued)
Other toppings are negligible and rival the cost of the dough.
Production “overhead” varies and can add between $0.50 and $1.00 out the door.
Most bread is produced for a fraction of a dollar.
Largest Profit Margin Foods

Source: David Bakke, AOL Money and Finance, 09/10/2010
Non-Alcoholic Beverages such as soda, coffee, and tea
Cost to Produce is $0.05 to $0.20 per retail serving In many cases the cost of the serving cup with lid and
straw, or the initial cost of reusable china along with handling, breakage, and cleaning, exceeds this cost to produce the beverage serving.
Aluminum can production and distribution costs vary between 2.5 and 5 cents each at the current strike price of aluminum.
Free refills anyone?
Largest Profit Margin Drinks

Source: David Bakke, AOL Money and Finance, 09/10/2010
Alcoholic beverages such as commercial grade
wine and beer.
Cost to produce and dispense at the retail level is based on a substantial markup. Conservative estimates put retail wine and beer markup at 200 percent, where upscale distribution can top 600 percent of production.
Largest Profit Margin Drinks

Source: Robert H. Lustig, MD, Lecture, UCSF 07/27/2009
Cane Sugar, High Fructose, and Salt Cane Sugar The standard for sweetening since the early 1900’s Processes normally through the liver and triggers
the fat cell hormone Leptin. The “I’m full” signal to the brain to stop eating.
High Fructose 1.73 times sweeter than cane sugar Less than ½ the cost of cane sugar to produce
Crank it up a notch withENHANCERS

Source: Robert H. Lustig, MD, Lecture, UCSF 07/27/2009
Cane Sugar, High Fructose, and Salt (continued)
High Fructose (continued)
Does not trigger the hormone leptin. The “I’m Full” signal to the brain
Salt Negligible cost to produce Enhances the taste of food High levels trigger the “I’m thirsty” signal to the brain.
Crank it up a notch withENHANCERS
Source: Robert H. Lustig, MD, Lecture, UCSF 07/27/2009
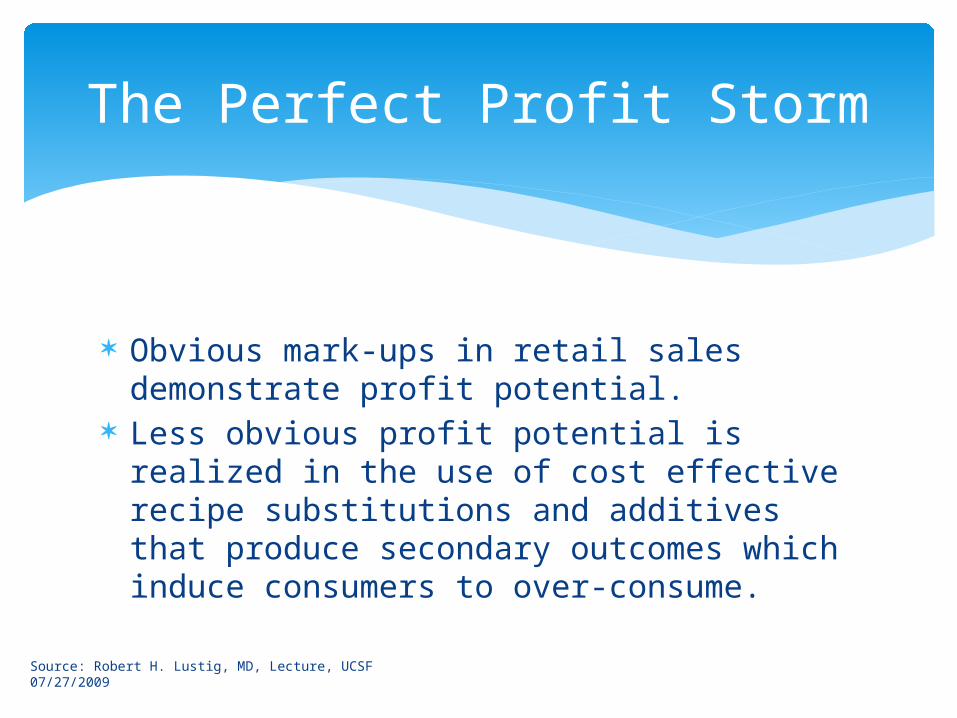
Obvious mark-ups in retail sales demonstrate profit potential.
Less obvious profit potential is realized in the use of cost effective recipe substitutions and additives that produce secondary outcomes which induce consumers to over-consume.
The Perfect Profit Storm

Source: Robert H. Lustig, MD, Lecture, UCSF 07/27/2009
High Fructose significantly reduces the cost of sweetening consumable products.
Salt heightens the instantaneous taste sense of consumers. The more salt, the higher the sensation.
At levels established for cane sugar, High Fructose neutralizes the bitterness of high levels of salt while allowing taste enhancement at extreme levels. All at a lower price point for increased profit.
The Perfect Profit Storm

Physiologically, one secondary effect of high levels of Salt and High Fructose induces people to consume more product to quench thirst and quell hunger. In other words “to spend money”. With broad profit margins above “Farm Value” food producers use these enhancers to drive the spend and consume cycle.
A negative economic byproduct of enhancing food for profit are the health risks and costs associated with population obesity.
The Perfect Profit Storm
Source: Robert H. Lustig, MD, Lecture, UCSF 07/27/2009

The “Farm Value” to “Street Value” ratio of retail food sales has expanded disproportionately over the last 30 years.
The industry claims that consumer driven competition and marketing support for continued name recognition drives this business machine and that over 79 percent of retail food expenditures pays the marketing bill.
Beyond the Profit
Source: Heather Levine, Money Crashers, Eating Healthy on a Budget, 08/10/2011

Source: Robert H. Lustig, MD, Lecture, UCSF 07/27/2009
Two thirds of Americans are overweight or obese
One in three children is overweight Portion size relative to calorie consumption
has increased by an average of 13 percent over the last decade as profit margins continued to grow
FOOD FOR THOUGHT?
Profit Verses Priorities

Yours TrulyAfter Fructose