this is a title that goes over two lines - ses.com · governance and management (slide 26-27) ......
TRANSCRIPT
SES Proprietary and Confidential |
February/March 2018
Investor presentation

SES investor presentation I February / March 2018 2
Table of Contents
Understanding the business Performance review and detailed dynamics
Overview (slide 3)
Business Overview (slide 4)
Industry Structure (slide 5)
Business Transformation (slide 6)
SES Video (slide 7)
SES Video Market Dynamics (slide 8)
SES Networks (slide 9)
SES Networks Market Dynamics (slide 10)
Innovation and Technology (slide 11)
Financial Potential (slide 12)
Conclusion (slide 13)
Video Distribution (slide 15)
Video Services (slide 16)
Fixed Data (slide 17)
Mobility (slide 18)
Government (slide 19)
SES Fleet (slide 20)
Technology and Launch Schedule (slide 21)
Financials (slide 22-25)
Governance and Management (slide 26-27)
Corporate Social Responsibility (slide 28)
Financial calendar & stock market info (slide 29)
IR contacts (slide 30)

SES investor presentation I February / March 2018
Overview
3
Overview and Business description Structure and Financials Outlook and Equity market
▲ World’s leading satellite-enabled solutions provider
covering 99% of the globe and world’s
population with more than 60 Satellites
with 99.99% reliability
Two key target markets: Video distribution and Network
connectivity for corporate clients and governments
Financial outlook assumes a EUR/USD rate of
1.15 and nominal launch schedule and satellite
health status
FY 2018
▲ Video EUR 1,300 – 1,320 million
Networks EUR 660 – 690 million
Other revenue around EUR 10 million
▲ EBITDA margin: 64.0% – 64.5%
FY 2020
▲ Video over EUR 1,350 million
Networks over EUR 875 million
▲ EBITDA margin: over 65.0%
▲ Resilient Video business, highly cash generative
▲ Funding Network business opportunities from
exponential demand increase
Articulated around 2 major value propositions:
▲ Efficient video distribution and management of video
content in any place of the world
▲ Provision of a satellite-based connectivity to any fixed
and mobile data network
Supported by sustained competitive advantages from:
▲ Unique space and ground network
▲ Global reach, global scale
▲ Expertise in customer solutions
To deliver market-leading growth due to sustained
competitive advantages through a differentiated strategy
and capabilities
▲ Listed on Euronext Paris and
Luxembourg Stock Exchange
32%
68%
2017 Revenue
0.7 0.9
0.7 0.8
2014 2015 2016 2017
FCF (before financing and acquisitions)
EUR billion
1.9 2.0 2.1 2.0 1.4 1.5 1.5
1.3
2014 2015 2016 2017
Revenue and EBITDA
Revenue EBITDA
Times
2.8x 2.5x 3.1x 3.3x
2014 2015 2016 2017
Net debt / EBITDA*
* Based on rating agency methodology
0
10
20
30
40
2013 2014 2015 2016 2017
Share price
EUR 2013 2014 2015 2016 2017
EPS 1.41 1.49 1.34 2.18 1.21
DPS 1.07 1.18 1.30 1.34 0.80
EUR
SES Networks
SES Video
EUR 2 billion
SES investor presentation I February / March 2018
Business Overview
4
Growth engine focused on fast expanding data segments:
Fixed Data, Mobility and Government
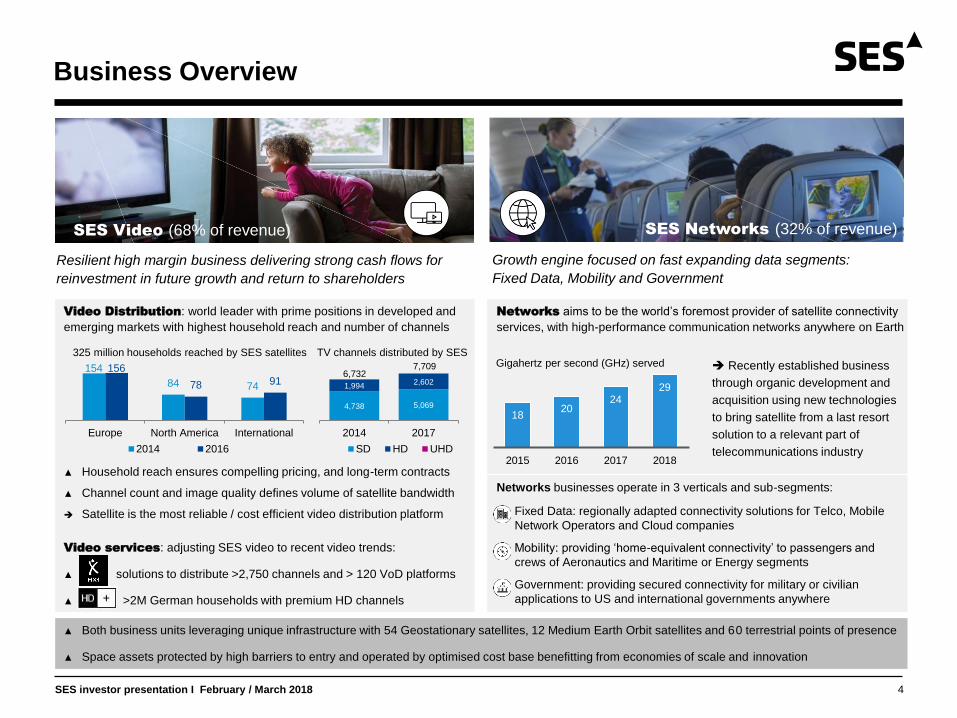
Video Distribution: world leader with prime positions in developed and
emerging markets with highest household reach and number of channels
▲ Household reach ensures compelling pricing, and long-term contracts
▲ Channel count and image quality defines volume of satellite bandwidth
Satellite is the most reliable / cost efficient video distribution platform
Video services: adjusting SES video to recent video trends:
▲ HD+ solutions to distribute >2,750 channels and > 120 VoD platforms
▲ MX1 >2M German households with premium HD channels
Resilient high margin business delivering strong cash flows for
reinvestment in future growth and return to shareholders
SES Video (68% of revenue) SES Networks (32% of revenue)
▲ Both business units leveraging unique infrastructure with 54 Geostationary satellites, 12 Medium Earth Orbit satellites and 60 terrestrial points of presence
▲ Space assets protected by high barriers to entry and operated by optimised cost base benefitting from economies of scale and innovation
154
84 74
156
78 91
Europe North America International
2014 2016
4,738 5,069
1,994 2,602
2014 2017
SD HD UHD
325 million households reached by SES satellites TV channels distributed by SES
6,732 7,709
Networks aims to be the world’s foremost provider of satellite connectivity
services, with high-performance communication networks anywhere on Earth
Recently established business
through organic development and
acquisition using new technologies
to bring satellite from a last resort
solution to a relevant part of
telecommunications industry
Networks businesses operate in 3 verticals and sub-segments:
▲ Fixed Data: regionally adapted connectivity solutions for Telco, Mobile
Network Operators and Cloud companies
▲ Mobility: providing ‘home-equivalent connectivity’ to passengers and
crews of Aeronautics and Maritime or Energy segments
▲ Government: providing secured connectivity for military or civilian
applications to US and international governments anywhere
18 20
24 29
2015 2016 2017 2018
Gigahertz per second (GHz) served
SES investor presentation I February / March 2018
Video Networks
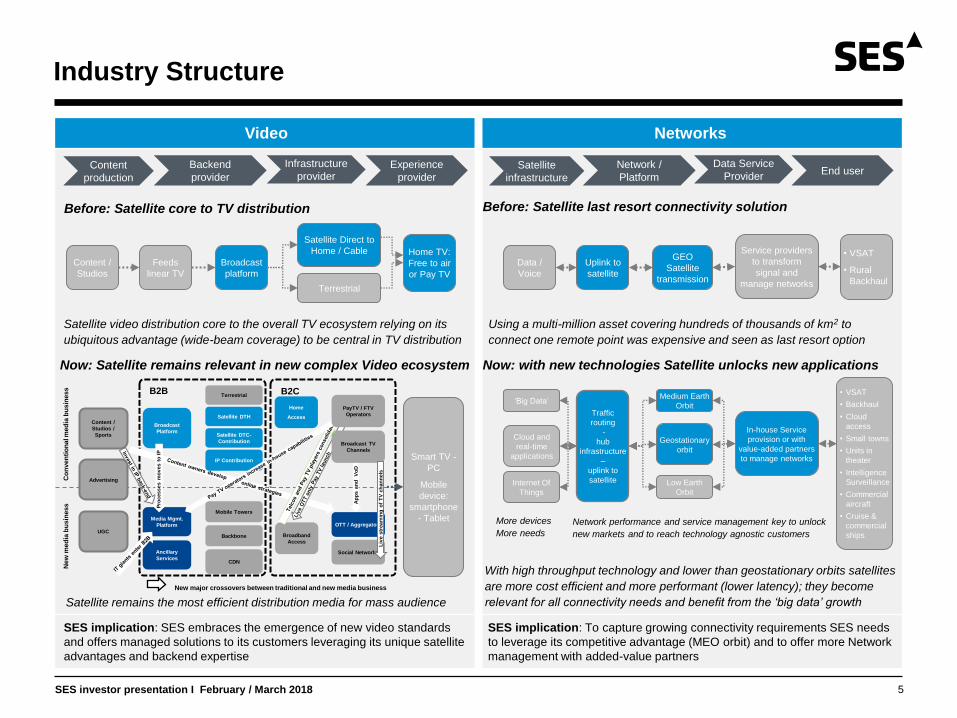
SES implication: SES embraces the emergence of new video standards
and offers managed solutions to its customers leveraging its unique satellite
advantages and backend expertise
SES implication: To capture growing connectivity requirements SES needs
to leverage its competitive advantage (MEO orbit) and to offer more Network
management with added-value partners
Co
nven
tio
nal m
ed
ia b
usin
ess
New
med
ia b
usin
ess
UGC
Content /
Studios /
Sports
Broadcast
Platform
Social Networks Ancillary
Services
IP Contribution
Media Mgmt.
Platform
Terrestrial
Satellite DTH
Satellite DTC-
Contribution
B2B B2C
CDN
Backbone
Mobile Towers
Advertising
Broadband
Access
OTT / Aggregators
Home
Access
Broadcast TV
Channels
New major crossovers between traditional and new media business
Ap
ps a
nd
V
oD
Pro
cesse
s m
ov
es t
o I
P
PayTV / FTV
Operators
Liv
e s
tream
ing
of
TV
ch
an
nels
Industry Structure
5
Before: Satellite last resort connectivity solution Before: Satellite core to TV distribution
Now: with new technologies Satellite unlocks new applications Now: Satellite remains relevant in new complex Video ecosystem
Satellite
infrastructure End user
Network /
Platform
Data Service
Provider Content
production
Experience
provider
Backend
provider
Infrastructure
provider
Content /
Studios
Broadcast
platform
Feeds
linear TV
Terrestrial
Satellite Direct to
Home / Cable Home TV:
Free to air
or Pay TV
Data /
Voice
GEO
Satellite
transmission
Uplink to
satellite
Service providers
to transform
signal and
manage networks
• VSAT
• Rural
Backhaul
Smart TV -
PC
Mobile
device:
smartphone
- Tablet More devices
More needs
Network performance and service management key to unlock
new markets and to reach technology agnostic customers
Using a multi-million asset covering hundreds of thousands of km2 to
connect one remote point was expensive and seen as last resort option
Satellite video distribution core to the overall TV ecosystem relying on its
ubiquitous advantage (wide-beam coverage) to be central in TV distribution
With high throughput technology and lower than geostationary orbits satellites
are more cost efficient and more performant (lower latency); they become
relevant for all connectivity needs and benefit from the ‘big data’ growth Satellite remains the most efficient distribution media for mass audience
‘Big Data’
Traffic
routing
-
hub
infrastructure
–
uplink to
satellite
In-house Service
provision or with
value-added partners
to manage networks
• VSAT
• Backhaul
• Cloud
access
• Small towns
• Units in
theater
• Intelligence
Surveillance
• Commercial
aircraft
• Cruise &
commercial
ships
Cloud and
real-time
applications
Internet Of
Things
Medium Earth
Orbit
Geostationary
orbit
Low Earth
Orbit
SES investor presentation I February / March 2018
Business Transformation
6
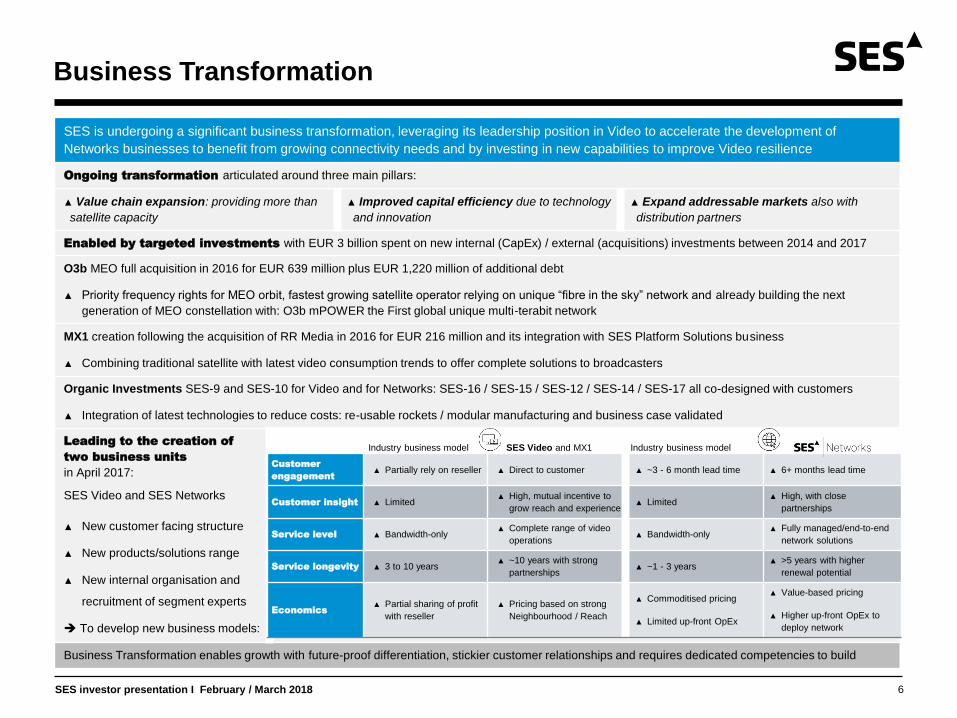
SES is undergoing a significant business transformation, leveraging its leadership position in Video to accelerate the development of
Networks businesses to benefit from growing connectivity needs and by investing in new capabilities to improve Video resilience
Ongoing transformation articulated around three main pillars:
▲ Value chain expansion: providing more than
satellite capacity
▲ Improved capital efficiency due to technology
and innovation
▲ Expand addressable markets also with
distribution partners
Enabled by targeted investments with EUR 3 billion spent on new internal (CapEx) / external (acquisitions) investments between 2014 and 2017
O3b MEO full acquisition in 2016 for EUR 639 million plus EUR 1,220 million of additional debt
▲ Priority frequency rights for MEO orbit, fastest growing satellite operator relying on unique “fibre in the sky” network and already building the next
generation of MEO constellation with: O3b mPOWER the First global unique multi-terabit network
MX1 creation following the acquisition of RR Media in 2016 for EUR 216 million and its integration with SES Platform Solutions business
▲ Combining traditional satellite with latest video consumption trends to offer complete solutions to broadcasters
Organic Investments SES-9 and SES-10 for Video and for Networks: SES-16 / SES-15 / SES-12 / SES-14 / SES-17 all co-designed with customers
▲ Integration of latest technologies to reduce costs: re-usable rockets / modular manufacturing and business case validated
Leading to the creation of
two business units
in April 2017:
SES Video and SES Networks
▲ New customer facing structure
▲ New products/solutions range
▲ New internal organisation and
recruitment of segment experts
To develop new business models:
Business Transformation enables growth with future-proof differentiation, stickier customer relationships and requires dedicated competencies to build
Industry business model SES Video and MX1 Industry business model
Customer
engagement
▲ Partially rely on reseller ▲ Direct to customer ▲ ~3 - 6 month lead time ▲ 6+ months lead time
Customer insight ▲ Limited ▲ High, mutual incentive to
grow reach and experience ▲ Limited
▲ High, with close
partnerships
Service level ▲ Bandwidth-only ▲ Complete range of video
operations ▲ Bandwidth-only
▲ Fully managed/end-to-end
network solutions
Service longevity ▲ 3 to 10 years ▲ ~10 years with strong
partnerships ▲ ~1 - 3 years
▲ >5 years with higher
renewal potential
Economics
▲ Partial sharing of profit
with reseller
▲ Pricing based on strong
Neighbourhood / Reach
▲ Commoditised pricing
▲ Limited up-front OpEx
▲ Value-based pricing
▲ Higher up-front OpEx to
deploy network

SES investor presentation I February / March 2018 7
▲ Stable business
Video Distribution Relies on satellite to distribute Video content to end viewer through Direct to Home (DTH), Direct to Cable (DTC) or IPTV feeds
MX1 processes organises and format video content to distribute it all over the world using satellite or non satellite capabilities
Video Distribution (~75% of Video revenue)
Leveraging satellite advantages of being able to distribute cost effectively
4 Gbps of video content to 325 million households
and relying on strategic partnerships where SES and customers
are both incentivised to grow reach and video experience
▲ Europe leading positions in Germany, UK, France and
others, with high households reach and over 2,600 channels
▲ North America wholesale for ⅔ and cable feed for ⅓
▲ Growing in International LATAM, MEA, Asia Pacific
Video Services (~25% of Video revenue)
Supports business resilience by integrating latest digital trends to SES:
One-stop-shop for any broadcaster to distribute contents
Distributing >3,200 channels and > 120 VoD platforms
Partnership with all major German speaking
commercial channels to provide HD / UHD experience to end
viewers with exclusive sport content
Performance in 9 years of existence: From 0 to 2 million
subscribers, 8 to 23 channels, EUR 50 to 70 annual fee
Resilient high margin business delivering strong cash flows for reinvestment in future growth and return to shareholders
EUR
1.4 bn
SES Video
>45%
>10% ~20%
~15%
~10%
1,126 1,108 1,054
210 284 329
2015 2016 2017
Video Distribution
Video Services
Revenue development (EUR Million)
1,336 1,392 1,383
Production / Content owner Processing data Transmission Reception
Content
Videos
Format
Rights Management
Playout
Satellite
Fiber
Cable
WLAN
TV
Computer
Phone/ tablet
Customer
% of contracted future revenue EUR million
▲ High visibility with:
EUR 5.3 billion future revenue and cash secured (backlog)
and operational insight from backend service provision
10-year typical distribution contract term and fixed pricing
with high probability of renewal
complete solution
1,383
FY 2017 FY 2018
>85% of 2018
expected revenue
contracted

SES investor presentation I February / March 2018
Dynamics leading to overall stability with some decrease in Video Distribution in Europe and in the US and pockets of growth in developing markets Video Services
SES Video – Market Dynamics
8
Linear TV remains the leading mass market medium
Satellite continues to be the leading distribution platform
OTT is complementary to linear TV
2006 2016Linear TV OTT
3h36 3h53
0h49
Linear TV
OTT
Daily TV viewing time in Europe(1,4)
11,044 17,938
2017 2022
HDTV SD UHD
42,840 46,269
Advertising spending
USD billion(2)
Satellite TV channels # of channels(3)
SES Opportunities
▲ Better quality HD and UHD with
enhanced compression
standards to increase demand
▲ Continued growth potential in
emerging markets
▲ Full control of customer
experience and need to
maximise audience for high
value channels continue to lead
broadcasters to stick to satellite
▲ Cloud make MX1 solutions
competitive by leveraging
backend media workflows for
thousands of channels
SES Threats
▲ Broadcasters focusing on high
value content may lead niche
content moving to online
distribution or to disappear
leading to less Volume
▲ New video consumption trends
urge Satellite operators to adjust
existing business model
▲ Some price erosion in mature
markets
▲ Linear TV remains the most used
medium even among millennials
and especially in prime time
▲ Emergence of hybrid solutions
combining Satellite and broadband
video feeds to provide the best
video experience
206 237
2017 2022
PayTV OTT
Market size
USD billion(1)
158 176
2017 2022TV Online Video
99 103
320 366
2017 2022
Europe NAM Emerging
454 500
Direct to home satellite reach Millions of households(1)
▲ Content rights owners focus their
efforts on building OTT, but linear
TV broadcast remains most
efficient mass market medium to
maximise viewership
▲ OTT availability and quality of
experience is dependent on
broadband access
▲ Channel growth mainly from emerging
markets more than offsetting slight
decline in mature markets
▲ Strong SD to HD transition in Europe
and UHD to reach 600 channels by
2022 and >1000 by 2025(3) which
require more bandwidth
▲ Stable Direct to home reach in
developed markets and growing
internationally
1) Ampere 2017 2) Ovum 2017 3) Eurodata 2017 4) Mediametrie 2017
228
283
191
243
SES investor presentation I February / March 2018 9
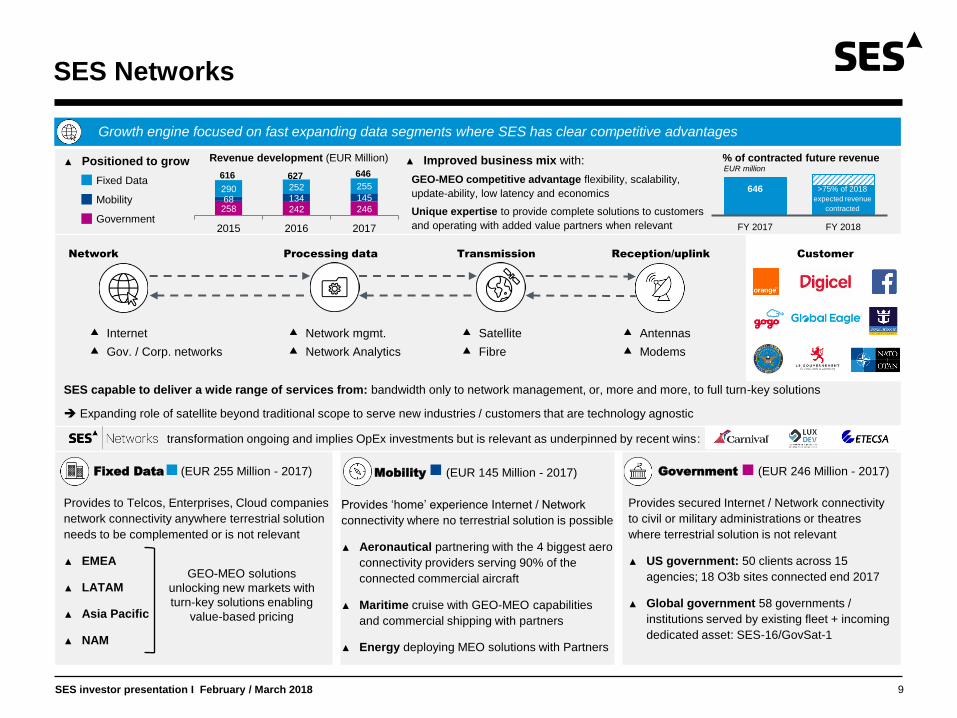
▲ Positioned to grow
SES capable to deliver a wide range of services from: bandwidth only to network management, or, more and more, to full turn-key solutions
Expanding role of satellite beyond traditional scope to serve new industries / customers that are technology agnostic
transformation ongoing and implies OpEx investments but is relevant as underpinned by recent wins:
Fixed Data (EUR 255 Million - 2017)
Provides to Telcos, Enterprises, Cloud companies
network connectivity anywhere terrestrial solution
needs to be complemented or is not relevant
▲ EMEA
▲ LATAM
▲ Asia Pacific
▲ NAM
Mobility (EUR 145 Million - 2017)
Provides ‘home’ experience Internet / Network
connectivity where no terrestrial solution is possible
▲ Aeronautical partnering with the 4 biggest aero
connectivity providers serving 90% of the
connected commercial aircraft
▲ Maritime cruise with GEO-MEO capabilities
and commercial shipping with partners
▲ Energy deploying MEO solutions with Partners
Government (EUR 246 Million - 2017)
Provides secured Internet / Network connectivity
to civil or military administrations or theatres
where terrestrial solution is not relevant
▲ US government: 50 clients across 15
agencies; 18 O3b sites connected end 2017
▲ Global government 58 governments /
institutions served by existing fleet + incoming
dedicated asset: SES-16/GovSat-1
Growth engine focused on fast expanding data segments where SES has clear competitive advantages
SES Networks
258 242 246 68 134 145 290 252 255
2015 2016 2017
Fixed Data
Government
Revenue development (EUR Million)
616 627 646
Network Processing data Transmission Reception/uplink
Internet
Gov. / Corp. networks
Network mgmt.
Network Analytics
Satellite
Fibre
Antennas
Modems
Customer
GEO-MEO solutions
unlocking new markets with
turn-key solutions enabling
value-based pricing
Mobility
▲ Improved business mix with:
GEO-MEO competitive advantage flexibility, scalability,
update-ability, low latency and economics
Unique expertise to provide complete solutions to customers
and operating with added value partners when relevant
% of contracted future revenue EUR million
646
FY 2017 FY 2018
>75% of 2018
expected revenue
contracted
SES investor presentation I February / March 2018
SES Networks - Market Dynamics
10
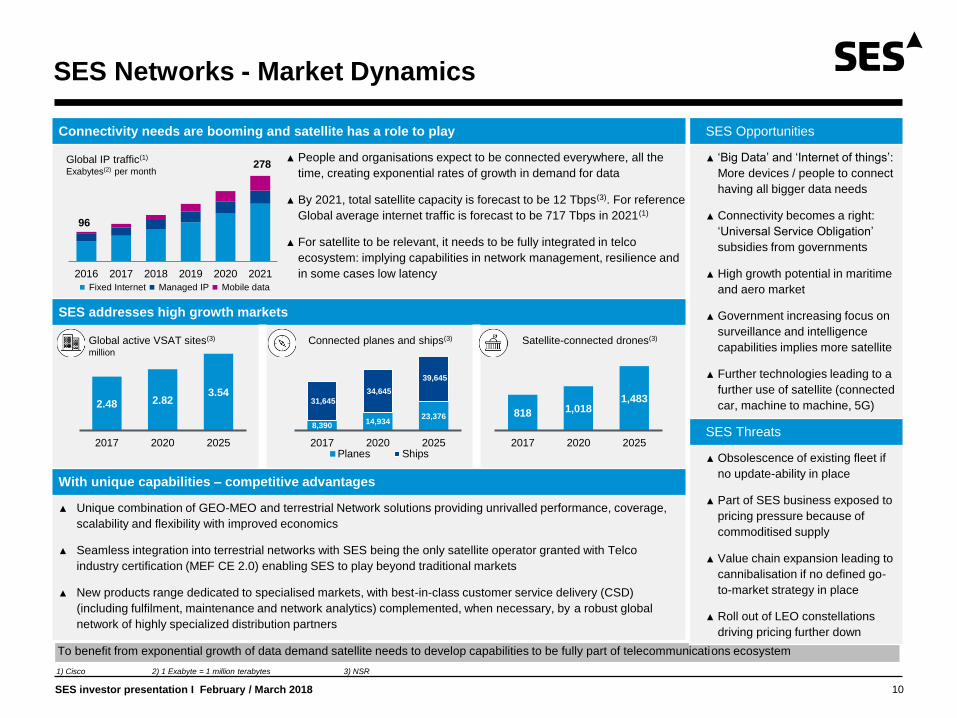
To benefit from exponential growth of data demand satellite needs to develop capabilities to be fully part of telecommunications ecosystem
Connectivity needs are booming and satellite has a role to play
▲ People and organisations expect to be connected everywhere, all the
time, creating exponential rates of growth in demand for data
▲ By 2021, total satellite capacity is forecast to be 12 Tbps(3). For reference
Global average internet traffic is forecast to be 717 Tbps in 2021(1)
▲ For satellite to be relevant, it needs to be fully integrated in telco
ecosystem: implying capabilities in network management, resilience and
in some cases low latency
SES addresses high growth markets
With unique capabilities – competitive advantages
▲ Unique combination of GEO-MEO and terrestrial Network solutions providing unrivalled performance, coverage,
scalability and flexibility with improved economics
▲ Seamless integration into terrestrial networks with SES being the only satellite operator granted with Telco
industry certification (MEF CE 2.0) enabling SES to play beyond traditional markets
▲ New products range dedicated to specialised markets, with best-in-class customer service delivery (CSD)
(including fulfilment, maintenance and network analytics) complemented, when necessary, by a robust global
network of highly specialized distribution partners
2016 2017 2018 2019 2020 2021
Fixed Internet Managed IP Mobile data
278
96
Global IP traffic(1) Exabytes(2) per month
SES Opportunities
▲ ‘Big Data’ and ‘Internet of things’:
More devices / people to connect
having all bigger data needs
▲ Connectivity becomes a right:
‘Universal Service Obligation’
subsidies from governments
▲ High growth potential in maritime
and aero market
▲ Government increasing focus on
surveillance and intelligence
capabilities implies more satellite
▲ Further technologies leading to a
further use of satellite (connected
car, machine to machine, 5G)
SES Threats
▲ Obsolescence of existing fleet if
no update-ability in place
▲ Part of SES business exposed to
pricing pressure because of
commoditised supply
▲ Value chain expansion leading to
cannibalisation if no defined go-
to-market strategy in place
▲ Roll out of LEO constellations
driving pricing further down
818 1,018 1,483
2017 2020 2025
Satellite-connected drones(3)
8,390 14,934
23,376
31,645
34,645
39,645
2017 2020 2025Planes Ships
Connected planes and ships(3)
2.48 2.82 3.54
2017 2020 2025
Global active VSAT sites(3)
million
1) Cisco 2) 1 Exabyte = 1 million terabytes 3) NSR
SES investor presentation I February / March 2018
Innovation and Technology
11
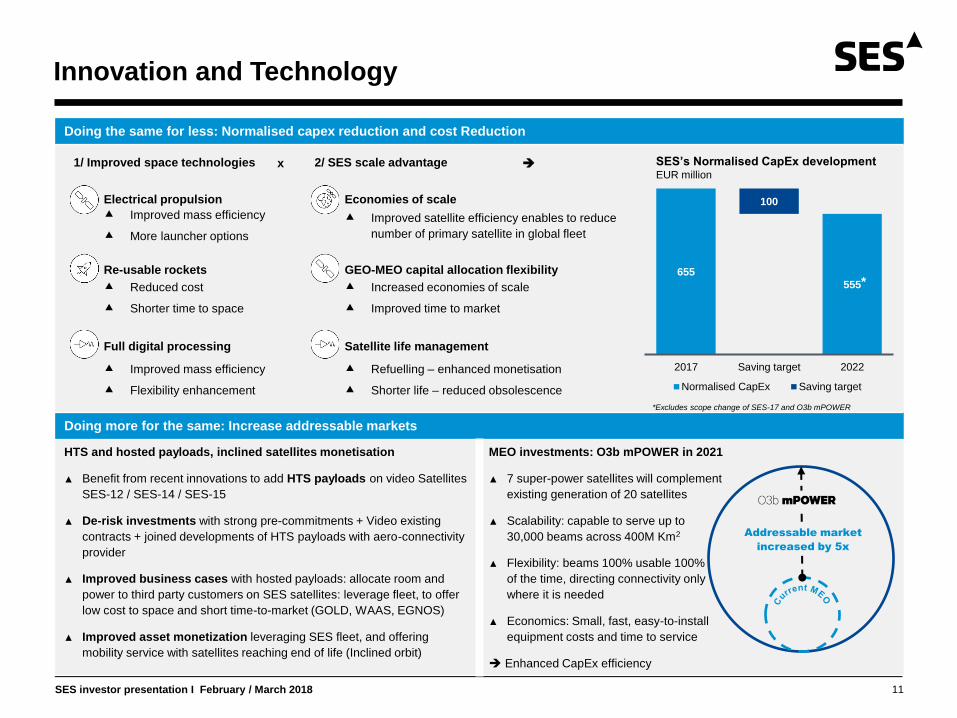
Doing the same for less: Normalised capex reduction and cost Reduction
Doing more for the same: Increase addressable markets
HTS and hosted payloads, inclined satellites monetisation
▲ Benefit from recent innovations to add HTS payloads on video Satellites
SES-12 / SES-14 / SES-15
▲ De-risk investments with strong pre-commitments + Video existing
contracts + joined developments of HTS payloads with aero-connectivity
provider
▲ Improved business cases with hosted payloads: allocate room and
power to third party customers on SES satellites: leverage fleet, to offer
low cost to space and short time-to-market (GOLD, WAAS, EGNOS)
▲ Improved asset monetization leveraging SES fleet, and offering
mobility service with satellites reaching end of life (Inclined orbit)
MEO investments: O3b mPOWER in 2021
▲ 7 super-power satellites will complement
existing generation of 20 satellites
▲ Scalability: capable to serve up to
30,000 beams across 400M Km2
▲ Flexibility: beams 100% usable 100%
of the time, directing connectivity only
where it is needed
▲ Economics: Small, fast, easy-to-install
equipment costs and time to service
Enhanced CapEx efficiency
Electrical propulsion
Full digital processing
Re-usable rockets
Improved mass efficiency
More launcher options
Reduced cost
Shorter time to space
Improved mass efficiency
Flexibility enhancement
1/ Improved space technologies
Economies of scale
Satellite life management
GEO-MEO capital allocation flexibility
Improved satellite efficiency enables to reduce
number of primary satellite in global fleet
Refuelling – enhanced monetisation
Shorter life – reduced obsolescence
2/ SES scale advantage
Increased economies of scale
Improved time to market
SES’s Normalised CapEx development
EUR million
655
555
100
2017 Saving target 2022
Normalised CapEx Saving target
x
Addressable market
increased by 5x
*Excludes scope change of SES-17 and O3b mPOWER
*
SES investor presentation I February / March 2018
Financial Potential
12
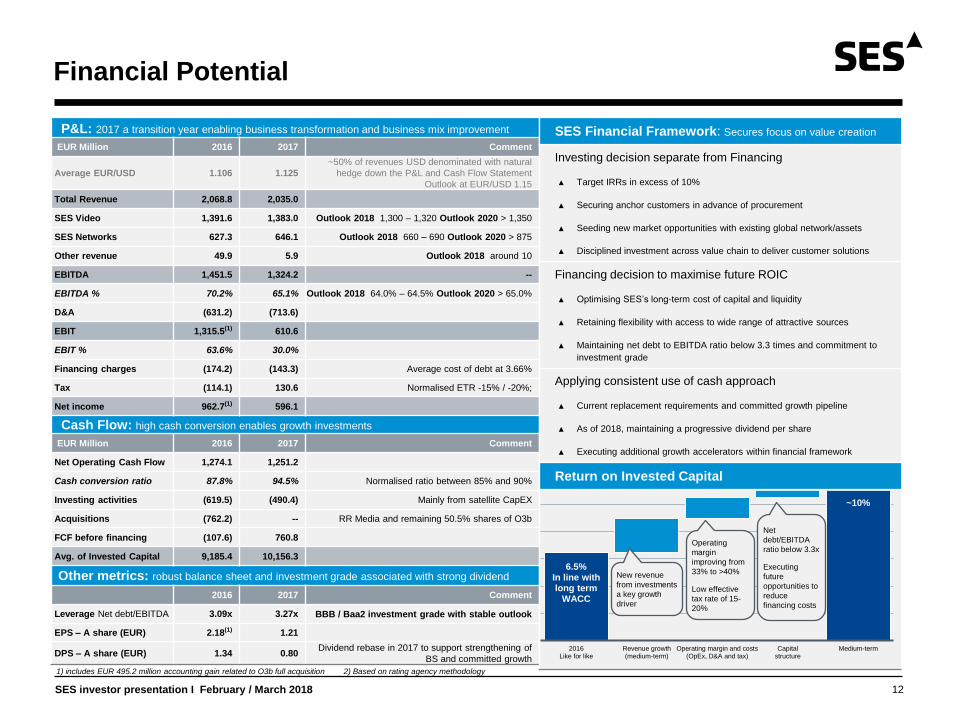
P&L: 2017 a transition year enabling business transformation and business mix improvement
EUR Million 2016 2017 Comment
Average EUR/USD 1.106 1.125
~50% of revenues USD denominated with natural
hedge down the P&L and Cash Flow Statement
Outlook at EUR/USD 1.15
Total Revenue 2,068.8 2,035.0
SES Video 1,391.6 1,383.0 Outlook 2018 1,300 – 1,320 Outlook 2020 > 1,350
SES Networks 627.3 646.1 Outlook 2018 660 – 690 Outlook 2020 > 875
Other revenue 49.9 5.9 Outlook 2018 around 10
EBITDA 1,451.5 1,324.2 --
EBITDA % 70.2% 65.1% Outlook 2018 64.0% – 64.5% Outlook 2020 > 65.0%
D&A (631.2) (713.6)
EBIT 1,315.5(1) 610.6
EBIT % 63.6% 30.0%
Financing charges (174.2) (143.3) Average cost of debt at 3.66%
Tax (114.1) 130.6 Normalised ETR -15% / -20%;
Net income 962.7(1) 596.1
Cash Flow: high cash conversion enables growth investments
EUR Million 2016 2017 Comment
Net Operating Cash Flow 1,274.1 1,251.2
Cash conversion ratio 87.8% 94.5% Normalised ratio between 85% and 90%
Investing activities (619.5) (490.4) Mainly from satellite CapEX
Acquisitions (762.2) -- RR Media and remaining 50.5% shares of O3b
FCF before financing (107.6) 760.8
Avg. of Invested Capital 9,185.4 10,156.3
Other metrics: robust balance sheet and investment grade associated with strong dividend
2016 2017 Comment
Leverage Net debt/EBITDA 3.09x 3.27x BBB / Baa2 investment grade with stable outlook
EPS – A share (EUR) 2.18(1) 1.21
DPS – A share (EUR) 1.34 0.80 Dividend rebase in 2017 to support strengthening of
BS and committed growth
1) includes EUR 495.2 million accounting gain related to O3b full acquisition 2) Based on rating agency methodology
SES Financial Framework: Secures focus on value creation
Investing decision separate from Financing
▲ Target IRRs in excess of 10%
▲ Securing anchor customers in advance of procurement
▲ Seeding new market opportunities with existing global network/assets
▲ Disciplined investment across value chain to deliver customer solutions
Financing decision to maximise future ROIC
▲ Optimising SES’s long-term cost of capital and liquidity
▲ Retaining flexibility with access to wide range of attractive sources
▲ Maintaining net debt to EBITDA ratio below 3.3 times and commitment to
investment grade
Applying consistent use of cash approach
▲ Current replacement requirements and committed growth pipeline
▲ As of 2018, maintaining a progressive dividend per share
▲ Executing additional growth accelerators within financial framework
Return on Invested Capital
6.5% In line with long term
WACC
~10%
2016Like for like
Revenue growth(medium-term)
Operating margin and costs(OpEx, D&A and tax)
Capitalstructure
Medium-term
New revenue
from investments
a key growth
driver
Operating
margin
improving from
33% to >40%
Low effective
tax rate of 15-
20%
Net
debt/EBITDA
ratio below 3.3x
Executing
future
opportunities to
reduce
financing costs
SES investor presentation I February / March 2018
Conclusion
13
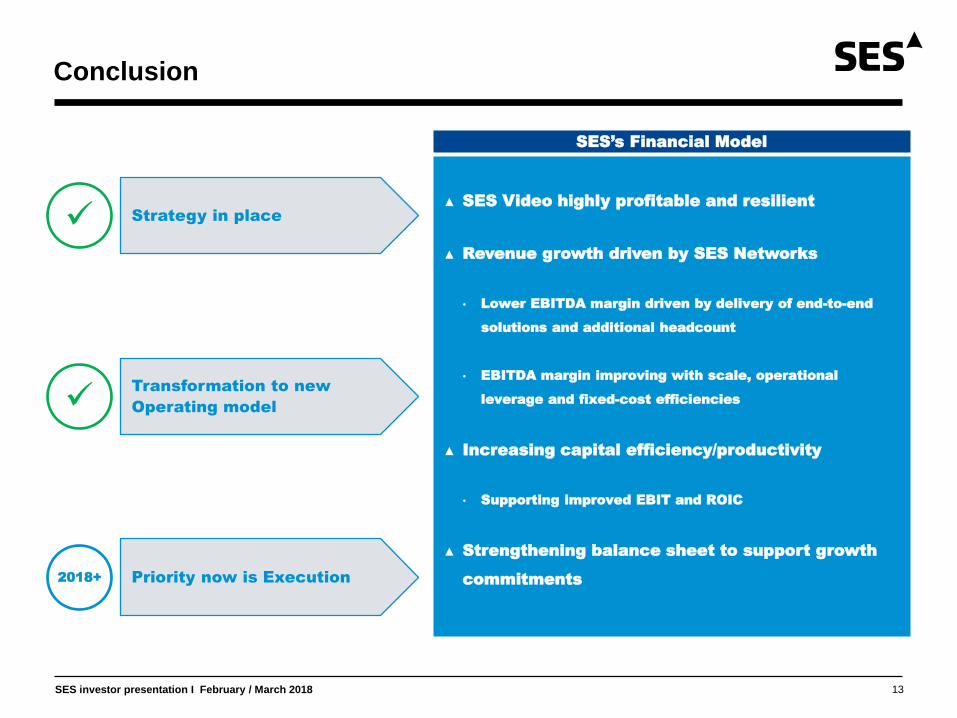
▲ SES Video highly profitable and resilient
▲ Revenue growth driven by SES Networks
• Lower EBITDA margin driven by delivery of end-to-end
solutions and additional headcount
• EBITDA margin improving with scale, operational
leverage and fixed-cost efficiencies
▲ Increasing capital efficiency/productivity
• Supporting improved EBIT and ROIC
▲ Strengthening balance sheet to support growth
commitments
SES’s Financial Model
Transformation to new
Operating model
Strategy in place
Priority now is Execution 2018+

SES IN DETAIL

SES investor presentation I February / March 2018
▲ Market forecast (NSR 2017)
▲ Europe (>30% of group revenue)
leading in most valuable markets
And growing in Eastern Europe
▲ Tailwind: Growth from HD transition
▲ Headwinds: Potential reduction in channel
distribution: ‘Long tail channels’
▲ North America (<10% of group revenue)
Complete satellite lease with EchoStar for ⅔ and
over 4,500 cable headends reach for ⅓
▲ Tailwinds: Development of UHD platform
▲ Headwinds: Reduction in channel distribution:
‘skinny bundling’
▲ International (>10% of group revenue)
LATAM, MEA, Asia Pacific
▲ Tailwind: “Virtuous DTH circle”:
▲ Headwind: Lower pricing than developed markets
and potential regulatory issues
SES to support Broadcaster / Pay-TV business model: Monetise content to deliver best Video experience to end-viewer
▲ 80% Content costs
▲ 10/15% SG&A
▲ 5/10% Distribution
Video Distribution - 52% of group revenue
15
Robust high margin business delivering strong cash flows for reinvestment in future growth and return to shareholder
8,313 7,993
2017 2022
Video satellite capacity (USD Million)
Resilient cash flow streams as satellite remains core to customer business model, with some growth opportunities with UHD and emerging markets
▲ Recent performance
• 2017 impacted by satellite health
• Major renewals signed and secured
▲ Benefitting from cost reduction
• CapEx savings: More efficient / less
satellites
• Extend life of existing assets with first
space refueling
▲ Stable delivery, with robust underlying and high visibility
1,096 1,077 1,044
24 22
2015 LfL* 2016 LfL* 2017
Periodic: revenues that are
not directly related to the
underlying business trends , such as certain interim
satellite missions or contract
amendment adjustment
Revenue development (EUR Million)
1,120 1,100 1,054
▲ Maximise content costs with enhanced definition for a marginal cost
▲ optimise backend activities with MX1 economies of scale
▲ Deliver anywhere video content at a flat cost with high reliability enabling a full control of end
viewer experience to our customer
-0.8% CAGR
Decline driven by Occasional use and C-band
distribution partially offset by Ku-band DTH
2016 – Total TV
households (million) SES reach
Direct to
Home
Cable / IPTV
feeds
Germany – 38M 95% 46% 49%
UK – 27M 68% 43% 25%
France – 26M 63% 20% 43%
Platform gaining audience
Attract more broadcasters
Leading to improved offering
Leading to more households
* At constant FX and assuming RR Media
had been consolidated on 1 January 2015
Underlying: reflects
business trends, can be
impacted by Health, Portfolio
adjustment like in 2017
SES investor presentation I February / March 2018
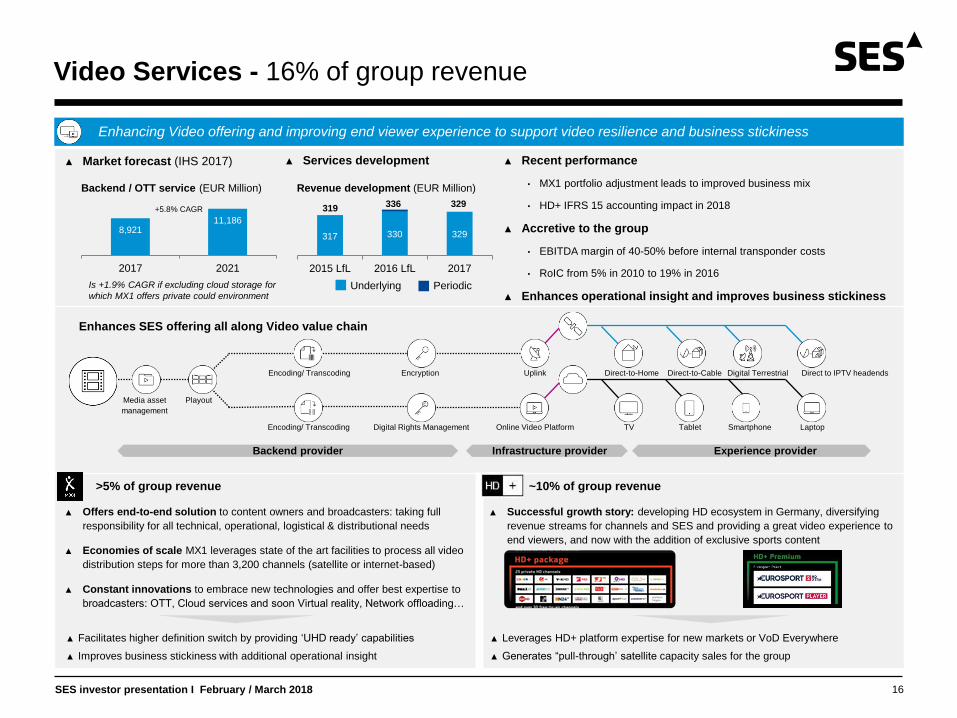
Video Services - 16% of group revenue
16
▲ Market forecast (IHS 2017)
▲ >5% of group revenue
▲ Offers end-to-end solution to content owners and broadcasters: taking full
responsibility for all technical, operational, logistical & distributional needs
▲ Economies of scale MX1 leverages state of the art facilities to process all video
distribution steps for more than 3,200 channels (satellite or internet-based)
▲ Constant innovations to embrace new technologies and offer best expertise to
broadcasters: OTT, Cloud services and soon Virtual reality, Network offloading…
▲ H ~10% of group revenue
▲ Successful growth story: developing HD ecosystem in Germany, diversifying
revenue streams for channels and SES and providing a great video experience to
end viewers, and now with the addition of exclusive sports content
Enhancing Video offering and improving end viewer experience to support video resilience and business stickiness
8,921 11,186
2017 2021
Backend / OTT service (EUR Million)
▲ Recent performance
• MX1 portfolio adjustment leads to improved business mix
• HD+ IFRS 15 accounting impact in 2018
▲ Accretive to the group
• EBITDA margin of 40-50% before internal transponder costs
• RoIC from 5% in 2010 to 19% in 2016
▲ Enhances operational insight and improves business stickiness
▲ Services development
317 330 329
2015 LfL 2016 LfL 2017
Underlying Periodic
Revenue development (EUR Million)
319 336 329
+5.8% CAGR
Is +1.9% CAGR if excluding cloud storage for
which MX1 offers private could environment
Enhances SES offering all along Video value chain
Playout Media asset
management
Encoding/ Transcoding
Encoding/ Transcoding Digital Rights Management Online Video Platform TV Tablet Smartphone Laptop
Encryption Uplink Direct-to-Home Direct to IPTV headends Direct-to-Cable Digital Terrestrial
▲ Facilitates higher definition switch by providing ‘UHD ready’ capabilities
▲ Improves business stickiness with additional operational insight
▲ Leverages HD+ platform expertise for new markets or VoD Everywhere
▲ Generates “pull-through’ satellite capacity sales for the group
Backend provider Infrastructure provider Experience provider
SES investor presentation I February / March 2018
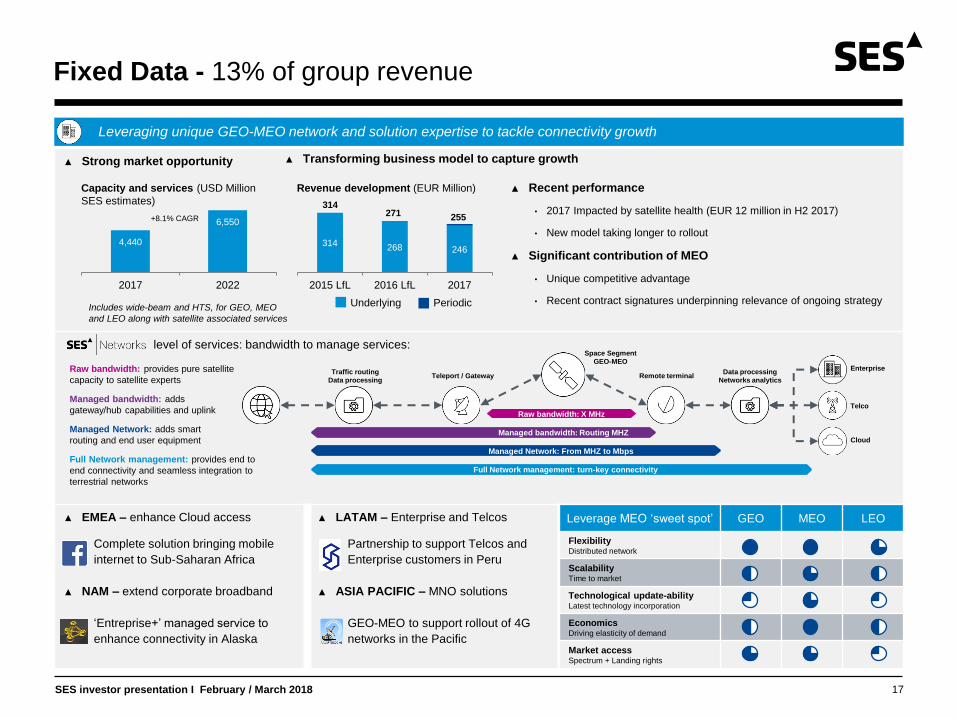
Fixed Data - 13% of group revenue
17
▲ Strong market opportunity
level of services: bandwidth to manage services:
▲ EMEA – enhance Cloud access
Complete solution bringing mobile
internet to Sub-Saharan Africa
▲ NAM – extend corporate broadband
‘Entreprise+’ managed service to
enhance connectivity in Alaska
▲ LATAM – Enterprise and Telcos
Partnership to support Telcos and
Enterprise customers in Peru
▲ ASIA PACIFIC – MNO solutions
GEO-MEO to support rollout of 4G
networks in the Pacific
Leveraging unique GEO-MEO network and solution expertise to tackle connectivity growth
4,440
6,550
2017 2022
Capacity and services (USD Million
SES estimates)
▲ Recent performance
• 2017 Impacted by satellite health (EUR 12 million in H2 2017)
• New model taking longer to rollout
▲ Significant contribution of MEO
• Unique competitive advantage
• Recent contract signatures underpinning relevance of ongoing strategy
▲ Transforming business model to capture growth
314 268 246
2015 LfL 2016 LfL 2017
Underlying Periodic
Revenue development (EUR Million)
271 255 +8.1% CAGR
Space Segment
GEO-MEO Enterprise
Teleport / Gateway Data processing
Networks analytics
Traffic routing
Data processing
Raw bandwidth: provides pure satellite
capacity to satellite experts
Managed bandwidth: adds
gateway/hub capabilities and uplink
Managed Network: adds smart
routing and end user equipment
Full Network management: provides end to
end connectivity and seamless integration to
terrestrial networks
Telco
Cloud
Remote terminal
Full Network management: turn-key connectivity
Managed Network: From MHZ to Mbps
Managed bandwidth: Routing MHZ
Raw bandwidth: X MHz
Leverage MEO ‘sweet spot’ GEO MEO LEO
Flexibility Distributed network
Scalability Time to market
Technological update-ability Latest technology incorporation
Economics Driving elasticity of demand
Market access Spectrum + Landing rights
Includes wide-beam and HTS, for GEO, MEO
and LEO along with satellite associated services
314
SES investor presentation I February / March 2018
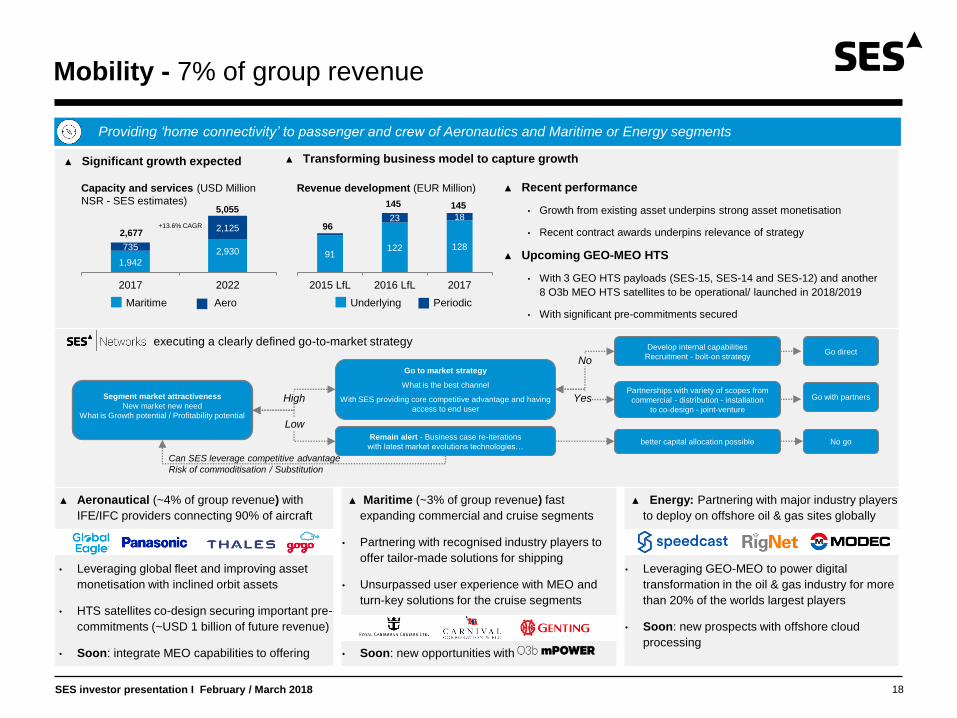
Mobility - 7% of group revenue
18
▲ Significant growth expected
executing a clearly defined go-to-market strategy
▲ Aeronautical (~4% of group revenue) with
IFE/IFC providers connecting 90% of aircraft
• Leveraging global fleet and improving asset
monetisation with inclined orbit assets
• HTS satellites co-design securing important pre-
commitments (~USD 1 billion of future revenue)
• Soon: integrate MEO capabilities to offering
▲ Maritime (~3% of group revenue) fast
expanding commercial and cruise segments
• Partnering with recognised industry players to
offer tailor-made solutions for shipping
• Unsurpassed user experience with MEO and
turn-key solutions for the cruise segments
• Soon: new opportunities with
▲ Energy: Partnering with major industry players
to deploy on offshore oil & gas sites globally
• Leveraging GEO-MEO to power digital
transformation in the oil & gas industry for more
than 20% of the worlds largest players
• Soon: new prospects with offshore cloud
processing
Providing ‘home connectivity’ to passenger and crew of Aeronautics and Maritime or Energy segments
1,942
2,930 735
2,125
2017 2022
Capacity and services (USD Million
NSR - SES estimates)
▲ Recent performance
• Growth from existing asset underpins strong asset monetisation
• Recent contract awards underpins relevance of strategy
▲ Upcoming GEO-MEO HTS
• With 3 GEO HTS payloads (SES-15, SES-14 and SES-12) and another
8 O3b MEO HTS satellites to be operational/ launched in 2018/2019
• With significant pre-commitments secured
▲ Transforming business model to capture growth
91 122 128
23 18
2015 LfL 2016 LfL 2017
Underlying Periodic
Revenue development (EUR Million)
96
145 145
+13.6% CAGR
Maritime Aero
Segment market attractiveness
New market new need
What is Growth potential / Profitability potential
Go to market strategy
What is the best channel
With SES providing core competitive advantage and having
access to end user
Remain alert - Business case re-iterations
with latest market evolutions technologies…
Can SES leverage competitive advantage
Risk of commoditisation / Substitution
better capital allocation possible
High
Low
Develop internal capabilities
Recruitment - bolt-on strategy
Partnerships with variety of scopes from
commercial - distribution - installation
to co-design - joint-venture
Go with partners
No
Yes
Go direct
No go
5,055
2,677
SES investor presentation I February / March 2018
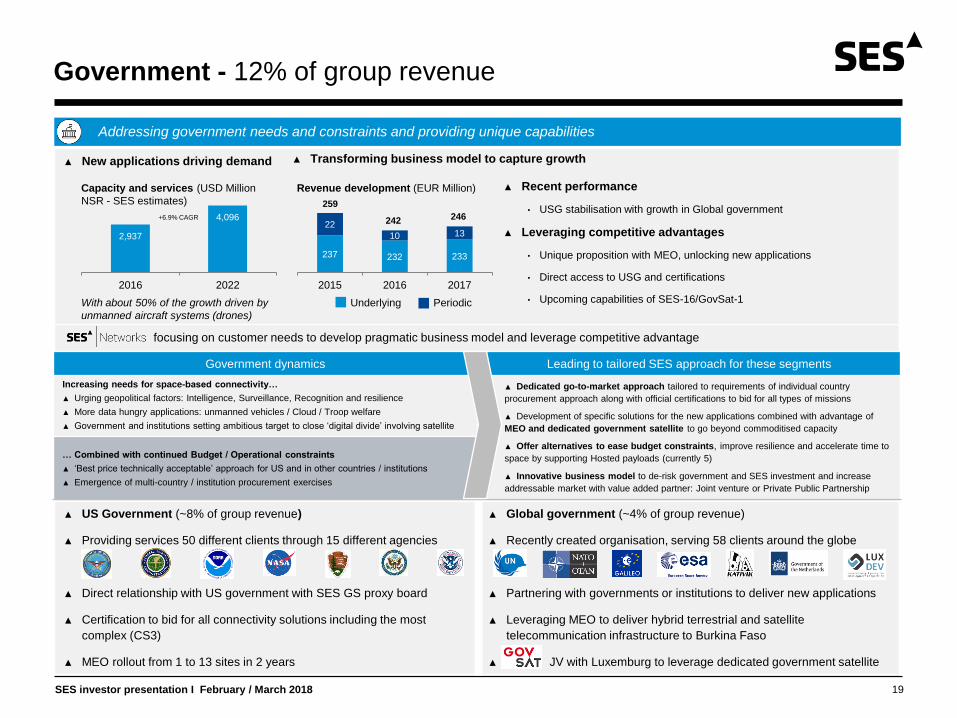
Government - 12% of group revenue
19
▲ New applications driving demand
focusing on customer needs to develop pragmatic business model and leverage competitive advantage
▲ US Government (~8% of group revenue)
▲ Providing services 50 different clients through 15 different agencies
▲ Direct relationship with US government with SES GS proxy board
▲ Certification to bid for all connectivity solutions including the most
complex (CS3)
▲ MEO rollout from 1 to 13 sites in 2 years
▲ Global government (~4% of group revenue)
▲ Recently created organisation, serving 58 clients around the globe
▲ Partnering with governments or institutions to deliver new applications
▲ Leveraging MEO to deliver hybrid terrestrial and satellite
telecommunication infrastructure to Burkina Faso
▲ JV with Luxemburg to leverage dedicated government satellite
Addressing government needs and constraints and providing unique capabilities
2,937
4,096
2016 2022
▲ Recent performance
• USG stabilisation with growth in Global government
▲ Leveraging competitive advantages
• Unique proposition with MEO, unlocking new applications
• Direct access to USG and certifications
• Upcoming capabilities of SES-16/GovSat-1
▲ Transforming business model to capture growth
237 232 233
22
10 13
2015 2016 2017
Revenue development (EUR Million)
259
242 +6.9% CAGR
Government dynamics Leading to tailored SES approach for these segments
Increasing needs for space-based connectivity…
▲ Urging geopolitical factors: Intelligence, Surveillance, Recognition and resilience
▲ More data hungry applications: unmanned vehicles / Cloud / Troop welfare
▲ Government and institutions setting ambitious target to close ‘digital divide’ involving satellite
▲ Dedicated go-to-market approach tailored to requirements of individual country
procurement approach along with official certifications to bid for all types of missions
▲ Development of specific solutions for the new applications combined with advantage of
MEO and dedicated government satellite to go beyond commoditised capacity
▲ Offer alternatives to ease budget constraints, improve resilience and accelerate time to
space by supporting Hosted payloads (currently 5)
▲ Innovative business model to de-risk government and SES investment and increase
addressable market with value added partner: Joint venture or Private Public Partnership
… Combined with continued Budget / Operational constraints
▲ ‘Best price technically acceptable’ approach for US and in other countries / institutions
▲ Emergence of multi-country / institution procurement exercises
Underlying Periodic
Capacity and services (USD Million
NSR - SES estimates)
With about 50% of the growth driven by
unmanned aircraft systems (drones)
246

SES investor presentation I February / March 2018
World’s biggest satellite fleet
Satellite Fleet: leveraging over 60 satellites in two orbits
20
Geostationary Orbit (36,000 km from Earth)
Medium Earth Orbit (8,000 km from Earth)
In Orbit GEO wide-beam 53 SES Satellites
Future GEO wide-beam SES-16 with LuxGovsat
From Earth Satellite appears fixed
600 milliseconds latency
Constellation needed for constant service
150 milliseconds latency
Global coverage ideal for broadcast
Satellite colocation to increase capacity
Covering all EMEA geopolitical hotspots
with enhanced security features
In Orbit GEO HTS SES-15
3 satellites necessary to cover Earth
Wide-beam and HTS capabilities
In Orbit MEO HTS 12 O3b satellites to 20 by mid ‘19
6/7 satellites to cover 80% of Earth
Always connected to terrestrial network
Future GEO HTS SES-12 / SES-14
Like SES-15 mainly for Aero-connectivity
Wide-beam and HTS capabilities
Inclined satellite 5 Satellites
Future Constellation of 7 satellites by ’21/’22
Up to 30,000+ Spot beams
Unique flexibility with beams steerability
To be relocated Currently 4 moves scheduled
Geo satellites can be moved to perform
temporary mission and for resilience
Do not keep ‘fixed’ position in the sky
Now fully usable for mobility applications
Current fleet
Fleet configuration is based on current
planning and is subject to change
28.2˚ East
129˚ West
19.2˚ East
Ground infrastructure 66 Teleports and 28 points of presence
Space segment enabled and secured by:
Frequency / Orbital rights C / Ku / Ka frequency + Orbital rights
Connect satellite to terrestrial network
Key for high performance connectivity
Infrastructure investments secured by UN
ITU organisation
SES investor presentation I February / March 2018
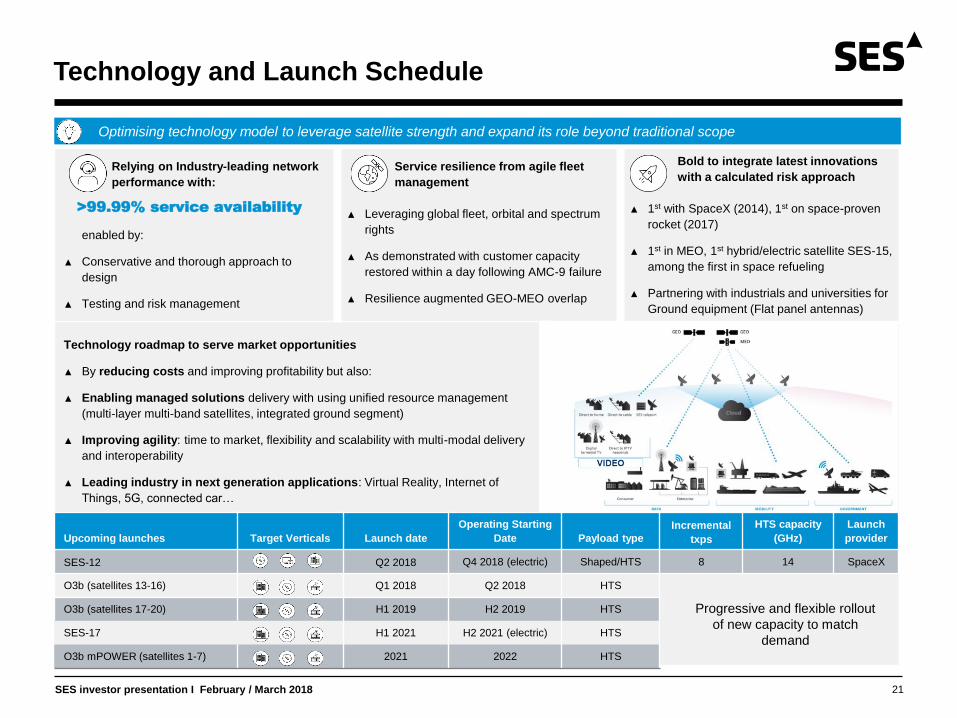
Relying on Industry-leading network
performance with:
>99.99% service availability
enabled by:
▲ Conservative and thorough approach to
design
▲ Testing and risk management
Service resilience from agile fleet
management
▲ Leveraging global fleet, orbital and spectrum
rights
▲ As demonstrated with customer capacity
restored within a day following AMC-9 failure
▲ Resilience augmented GEO-MEO overlap
Bold to integrate latest innovations
with a calculated risk approach
▲ 1st with SpaceX (2014), 1st on space-proven
rocket (2017)
▲ 1st in MEO, 1st hybrid/electric satellite SES-15,
among the first in space refueling
▲ Partnering with industrials and universities for
Ground equipment (Flat panel antennas)
Technology roadmap to serve market opportunities
▲ By reducing costs and improving profitability but also:
▲ Enabling managed solutions delivery with using unified resource management
(multi-layer multi-band satellites, integrated ground segment)
▲ Improving agility: time to market, flexibility and scalability with multi-modal delivery
and interoperability
▲ Leading industry in next generation applications: Virtual Reality, Internet of
Things, 5G, connected car…
Optimising technology model to leverage satellite strength and expand its role beyond traditional scope
Technology and Launch Schedule
21
Upcoming launches Target Verticals Launch date
Operating Starting
Date Payload type
Incremental
txps
HTS capacity
(GHz)
Launch
provider
SES-12 Q2 2018 Q4 2018 (electric) Shaped/HTS 8 14 SpaceX
O3b (satellites 13-16) Q1 2018 Q2 2018 HTS
O3b (satellites 17-20) H1 2019 H2 2019 HTS
SES-17 H1 2021 H2 2021 (electric) HTS
O3b mPOWER (satellites 1-7) 2021 2022 HTS
Progressive and flexible rollout
of new capacity to match
demand
SES investor presentation I February / March 2018
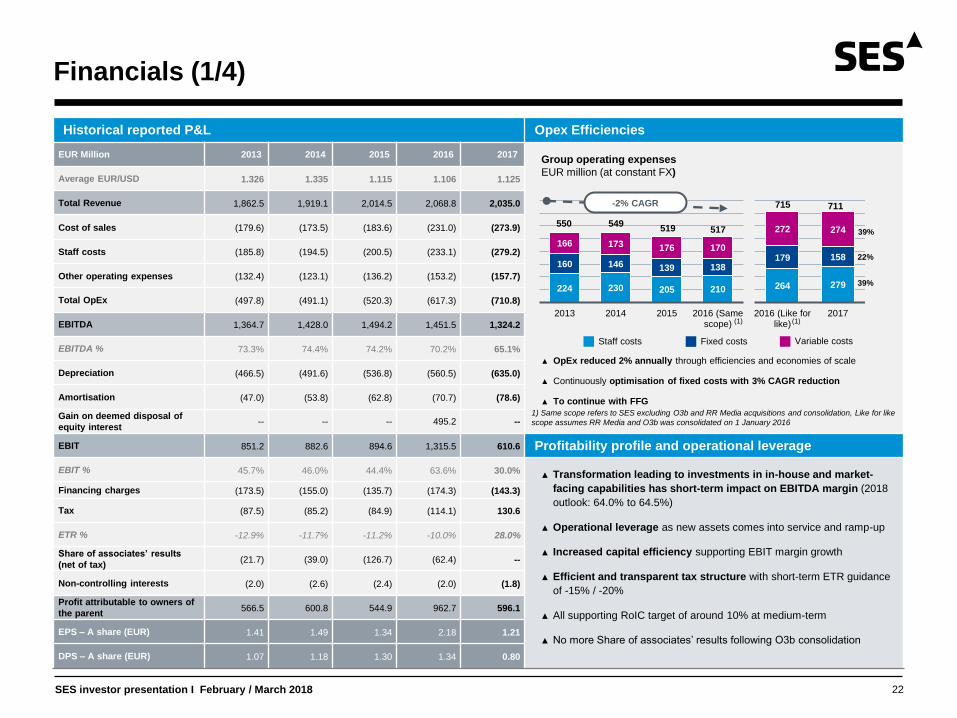
Financials (1/4)
22
Historical reported P&L Opex Efficiencies
EUR Million 2013 2014 2015 2016 2017
Average EUR/USD 1.326 1.335 1.115 1.106 1.125
Total Revenue 1,862.5 1,919.1 2,014.5 2,068.8 2,035.0
Cost of sales (179.6) (173.5) (183.6) (231.0) (273.9)
Staff costs (185.8) (194.5) (200.5) (233.1) (279.2)
Other operating expenses (132.4) (123.1) (136.2) (153.2) (157.7)
Total OpEx (497.8) (491.1) (520.3) (617.3) (710.8)
EBITDA 1,364.7 1,428.0 1,494.2 1,451.5 1,324.2
EBITDA % 73.3% 74.4% 74.2% 70.2% 65.1%
Depreciation (466.5) (491.6) (536.8) (560.5) (635.0)
Amortisation (47.0) (53.8) (62.8) (70.7) (78.6)
Gain on deemed disposal of
equity interest -- -- -- 495.2 --
EBIT 851.2 882.6 894.6 1,315.5 610.6 Profitability profile and operational leverage
EBIT % 45.7% 46.0% 44.4% 63.6% 30.0% ▲ Transformation leading to investments in in-house and market-
facing capabilities has short-term impact on EBITDA margin (2018
outlook: 64.0% to 64.5%)
▲ Operational leverage as new assets comes into service and ramp-up
▲ Increased capital efficiency supporting EBIT margin growth
▲ Efficient and transparent tax structure with short-term ETR guidance
of -15% / -20%
▲ All supporting RoIC target of around 10% at medium-term
▲ No more Share of associates’ results following O3b consolidation
Financing charges (173.5) (155.0) (135.7) (174.3) (143.3)
Tax (87.5) (85.2) (84.9) (114.1) 130.6
ETR % -12.9% -11.7% -11.2% -10.0% 28.0%
Share of associates’ results
(net of tax) (21.7) (39.0) (126.7) (62.4) --
Non-controlling interests (2.0) (2.6) (2.4) (2.0) (1.8)
Profit attributable to owners of
the parent 566.5 600.8 544.9 962.7 596.1
EPS – A share (EUR) 1.41 1.49 1.34 2.18 1.21
DPS – A share (EUR) 1.07 1.18 1.30 1.34 0.80
224 230 205 210
160 146 139 138
166 173 176 170
2013 2014 2015 2016 (Samescope)
Staff costs Variable costs Fixed costs
Group operating expenses
EUR million (at constant FX)
▲ OpEx reduced 2% annually through efficiencies and economies of scale
▲ Continuously optimisation of fixed costs with 3% CAGR reduction
▲ To continue with FFG
550 549 519 517
-2% CAGR
264 279
179 158
272 274
2016 (Like forlike)
2017
715 711
39%
22%
39%
1) Same scope refers to SES excluding O3b and RR Media acquisitions and consolidation, Like for like
scope assumes RR Media and O3b was consolidated on 1 January 2016
(1) (1)
SES investor presentation I February / March 2018
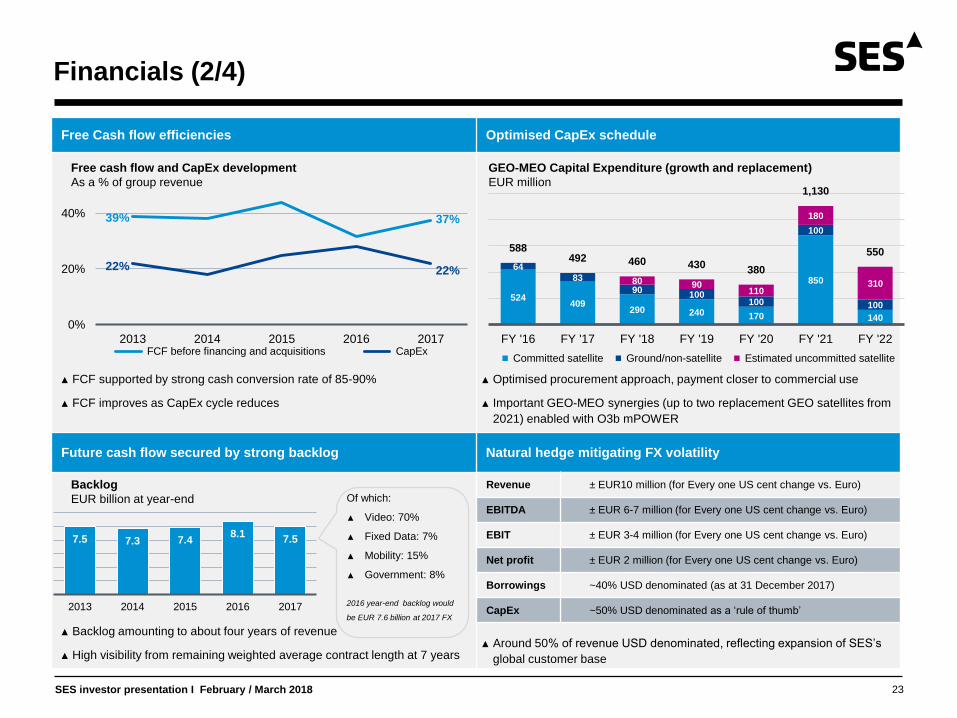
Financials (2/4)
23
Free Cash flow efficiencies Optimised CapEx schedule
Future cash flow secured by strong backlog Natural hedge mitigating FX volatility
▲ Backlog amounting to about four years of revenue
▲ High visibility from remaining weighted average contract length at 7 years
GEO-MEO Capital Expenditure (growth and replacement)
EUR million
Free cash flow and CapEx development
As a % of group revenue
▲ Optimised procurement approach, payment closer to commercial use
▲ Important GEO-MEO synergies (up to two replacement GEO satellites from
2021) enabled with O3b mPOWER
Backlog
EUR billion at year-end
0%
20%
40%
2013 2014 2015 2016 2017 FCF before financing and acquisitions CapEx
39%
22% 22%
37%
524 409
290 240 170
850
140
64
83
90 100
100
100
100
80 90 110
180
310
588 492 460 430
380
1,130
550
FY '16 FY '17 FY '18 FY '19 FY '20 FY '21 FY '22
Committed satellite Ground/non-satellite Estimated uncommitted satellite
Revenue ± EUR10 million (for Every one US cent change vs. Euro)
EBITDA ± EUR 6-7 million (for Every one US cent change vs. Euro)
EBIT ± EUR 3-4 million (for Every one US cent change vs. Euro)
Net profit ± EUR 2 million (for Every one US cent change vs. Euro)
Borrowings ~40% USD denominated (as at 31 December 2017)
CapEx ~50% USD denominated as a ‘rule of thumb’
▲ Around 50% of revenue USD denominated, reflecting expansion of SES’s
global customer base
7.5 7.3 7.4 8.1
7.5
2013 2014 2015 2016 2017
Of which:
▲ Video: 70%
▲ Fixed Data: 7%
▲ Mobility: 15%
▲ Government: 8%
2016 year-end backlog would
be EUR 7.6 billion at 2017 FX
▲ FCF supported by strong cash conversion rate of 85-90%
▲ FCF improves as CapEx cycle reduces

SES investor presentation I February / March 2018
Financials (3/4)
24
Historical reported BS
EUR Million 2013 2014 2015 2016 2017 Comments
Closing rate EUR/USD 1.379 1.214 1.089 1.054 1.199
Property, Plant & Equipment 3,747.7 4,341.6 4,464.8 5,156.3 4,591.4 Of which over 90% representing Space segment (satellite fleet)
Assets Under Construction 1,099.8 684.8 894.3 1,389.6 1,480.2 Of which 95% representing Space segment (satellite fleet)
Intangible Assets 2,750.3 3,307.3 3,587.4 5,247.7 4,630.9 Of which about 50% representing Goodwill and about 40% Orbital slot license rights
Cash 544.2 524.5 639.7 587.5 269.6
Other Assets 946.8 1,093.9 1,079.6 1,264.8 1,212.3 Mainly representing trade and other receivables
Total Assets 9,088.8 9,952.1 10,665.8 13,645.9 12,184.4
Shareholder’s equity 2,820.7 3,404.7 3,932.5 6,806.5 5,987.9
Minority Interest 78.2 84.9 128.3 138.6 124.6 Investments in LuxGovSat, Ciel Satellite and Al Maisan Satellite (YahSat)
Total Equity 2,898.9 3,489.6 4,060.8 6,945.1 6,112.5
Debt 4,345.9 4,486.1 4,431.7 4,427.4 3,947.9 See next page
Deferred Tax Liabilities 645.3 676.5 655.9 664.2 438.5
Other Liabilities 1,198.7 1,299.9 1,517.4 1,609.2 1,685.5 Mainly representing deferred income and trade and other payables
Total Equity and Liabilities 9,088.8 9,952.1 10,665.8 13,645.9 12,184.4
Financial Metrics: 2017 reflects business transformation and integration of 2016 acquisitions
RoIC 11.1% 11.1% 10.5% 12.9% 7.7% Net Operating Profit After Tax (NOPAT) / Average of shareholders’ equity plus net debt
RoIC (normalised) 11.1% 11.1% 10.5% 7.4% 5.1% Normalised excludes exceptional items (Tax credit, one-off accounting gains…)
RoE 20.2% 19.4% 14.9% 18.0% 9.3% Net profit / Average of shareholders’ equity
Return on Tangible assets 15.2% 13.9% 12.3% 18.7% 13.0% Net profit / Property, Plant and Equipment
Dividend Yield 4.5% 4.0% 5.1% 6.4% 6.1% Dividend / Share price at year end

SES investor presentation I February / March 2018
Financials (4/4)
25
Total Debt and Loan repayment schedule
Leverage Investment grade
▲ Average cost of debt of 3.7% and average
maturity of 7.0 years
▲ Long term WACC at around 6.5%
▲ No financial covenant
Senior debt repayment schedule
EUR million(1)
541 476
691 708
56
669
16 16 16 156
0
1,352
2018 2019 2020 2021 2022 2023 2024 2025 2026 2027 2028 2029+
Debt Currency Mix
58%
42%
Fixed floating Mix
95%
5%
▲ 12 interest bearing loans and borrowings from multiple sources
▲ Additional EUR 1.3 billion from two perpetual hybrid bonds issued during 2016 at an average coupon of 5.05% (with call dates of 2022 or 2024)
▲ Liquidity ensured through European Medium-Term Note (EMTM) or commercial paper programmes
2.54 2.54 2.65 2.78
3.09 3.27
2014 2015 2016 2017
▲ SES below internal threshold
3.3x where WACC is
optimised
▲ SES intends to strengthen
balance sheet
1) As of 31 December 2017, Debt reported at Nominal amount EUR 3,977 million, Total Borrowings reported under IFRS EUR 3,948 with the difference coming Loan Origination Costs
Net Debt to EBITDA
Times
2) Hybrid bonds treated 100% as equity under IFRS and 50% debt / 50% equities by credit rating agencies
IFRS(2) Rating agencies(2)
▲ End of 2017 and early 2018 both credit agencies confirmed SES
investment grade
▲ Standard & Poors: SES S.A. Corporate Credit Rating BBB /
Stable/A-2 with stable outlook
• Senior Unsecured BBB / Junior Subordinated BB+ /Commercial Paper A-2
▲ Moody’s: SES S.A. Baa2; outlook stable (designed as Government-
Related Issuer), On a standalone basis Baa3 Outlook stable
• Senior Unsecured Baa2 / Junior Subordinated Ba1 /Commercial Paper P-2
3.3x threshold
SES investor presentation I February / March 2018
Governance
26
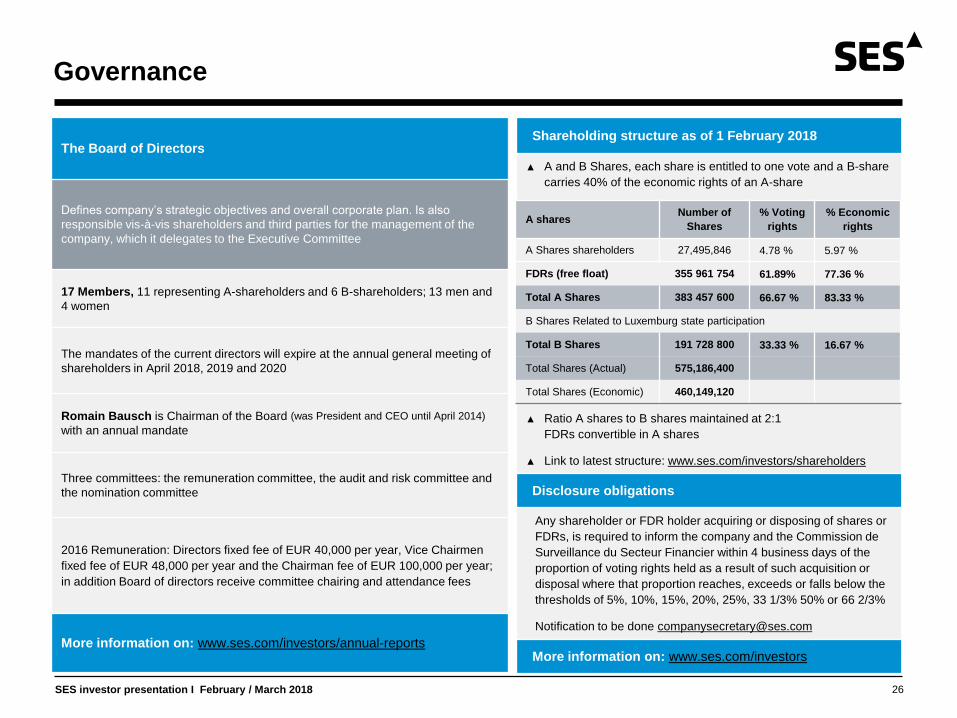
The Board of Directors
Defines company’s strategic objectives and overall corporate plan. Is also
responsible vis-à-vis shareholders and third parties for the management of the
company, which it delegates to the Executive Committee
17 Members, 11 representing A-shareholders and 6 B-shareholders; 13 men and
4 women
The mandates of the current directors will expire at the annual general meeting of
shareholders in April 2018, 2019 and 2020
Romain Bausch is Chairman of the Board (was President and CEO until April 2014)
with an annual mandate
Three committees: the remuneration committee, the audit and risk committee and
the nomination committee
2016 Remuneration: Directors fixed fee of EUR 40,000 per year, Vice Chairmen
fixed fee of EUR 48,000 per year and the Chairman fee of EUR 100,000 per year;
in addition Board of directors receive committee chairing and attendance fees
More information on: www.ses.com/investors/annual-reports
Shareholding structure as of 1 February 2018
▲ A and B Shares, each share is entitled to one vote and a B-share
carries 40% of the economic rights of an A-share
▲ Ratio A shares to B shares maintained at 2:1
FDRs convertible in A shares
▲ Link to latest structure: www.ses.com/investors/shareholders
Disclosure obligations
Any shareholder or FDR holder acquiring or disposing of shares or
FDRs, is required to inform the company and the Commission de
Surveillance du Secteur Financier within 4 business days of the
proportion of voting rights held as a result of such acquisition or
disposal where that proportion reaches, exceeds or falls below the
thresholds of 5%, 10%, 15%, 20%, 25%, 33 1/3% 50% or 66 2/3%
Notification to be done [email protected]
More information on: www.ses.com/investors
A shares Number of
Shares
% Voting
rights
% Economic
rights
A Shares shareholders 27,495,846 4.78 % 5.97 %
FDRs (free float) 355 961 754 61.89% 77.36 %
Total A Shares 383 457 600 66.67 % 83.33 %
B Shares Related to Luxemburg state participation
Total B Shares 191 728 800 33.33 % 16.67 %
Total Shares (Actual) 575,186,400
Total Shares (Economic) 460,149,120

SES investor presentation I February / March 2018
SES Management
27
The Executive Committee
SES Management team
Karim Michel
Sabbagh
President and CEO
until April 2017
Ferdinand Kayser
CEO SES
Video
Steve Collar
CEO SES Networks
President and CEO
designate
Padraig McCarthy
Chief Financial
Officer
Christophe De
Hauwer
Chief Strategy and
Development Officer
Martin Halliwell
Chief Technology
Officer
John Purvis
Chief Legal
Officer
Evie Roos
Chief Human
Resources Officer
The Executive Committee is in charge of the daily management of the group. It functions as a collegial body. It is mandated to prepare and plan the overall
policies and strategies of the company for approval by the Board
8 Members, nominated by the board of directors, Including President and CEO, CEO Video, CEO Networks, CFO, CSDO, CTO, CLO, CHRO
Executive Committee annual bonus derives from : 1/ the financial performance of the Company (50%) ; 2/ individual business objectives for each member
(25%) and 3/ a discretionary element determined by the Remuneration Committee after reviewing the Company’s achievements (25%)
2017 Remuneration of the Executive Committee was EUR 8,3 million, of which EUR 4,6 million for the fixed part and EUR 3,7 million for the variable part
Since April 2014
Joined SES in 2013
Prior to his current
role he was a
Senior Partner at
Booz & Company
Mr Sabbagh is a
Canadian and
Lebanese national
Since April 2013
until April 2018
Since April 2017
Joined SES in 2002
Prior to his current
role he was serving
as Chief
Commercial Officer
since 2011
Mr Kayser is a
Luxembourg
national
Since April 2017
Joined SES in 2016
Prior to his current
role he was serving
as Chief Executive
Officer of O3b
Mr Collar is a British
national
Since August 2015
Joined SES in 2003
Prior to his current
role he held several
in business
development and
fleet management
Mr De Hauwer is a
Belgian national
Since May 2011
Joined SES in 1987
Prior to his current
role he held several
positions in SES
engineering
Mr Halliwell is a
British national
Since April 2013
Joined SES in 2001
Prior to his current
role he held several
positions in corporate
governance, compliance
and risk management
Mr Puvis is a British
national
Since February 2017
Joined SES in 2013
Prior to her current
role she held several
various management
positions at
ArcelorMittal
Mrs Roos is a
Belgian, Luxembourg
and US national
Andrew Browne
Chief Financial
Officer designate
Former CFO of O3b,
SES and Intelsat
SES investor presentation I February / March 2018
Compliance and Corporate Social Responsibility
28
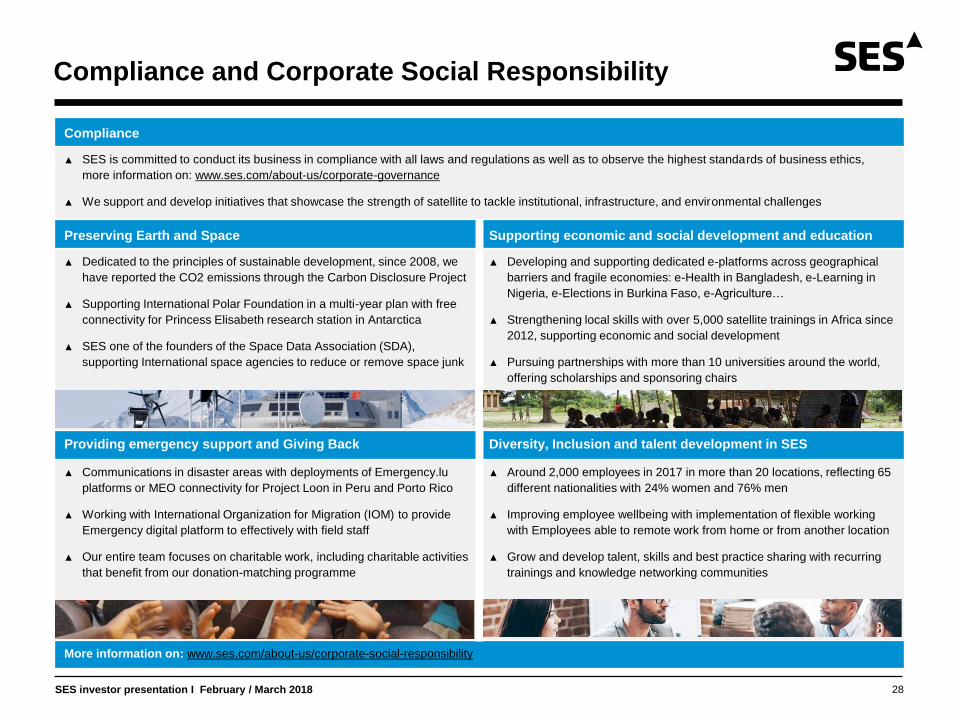
Compliance
▲ SES is committed to conduct its business in compliance with all laws and regulations as well as to observe the highest standards of business ethics,
more information on: www.ses.com/about-us/corporate-governance
▲ We support and develop initiatives that showcase the strength of satellite to tackle institutional, infrastructure, and environmental challenges
Preserving Earth and Space Supporting economic and social development and education
▲ Dedicated to the principles of sustainable development, since 2008, we
have reported the CO2 emissions through the Carbon Disclosure Project
▲ Supporting International Polar Foundation in a multi-year plan with free
connectivity for Princess Elisabeth research station in Antarctica
▲ SES one of the founders of the Space Data Association (SDA),
supporting International space agencies to reduce or remove space junk
▲ Developing and supporting dedicated e-platforms across geographical
barriers and fragile economies: e-Health in Bangladesh, e-Learning in
Nigeria, e-Elections in Burkina Faso, e-Agriculture…
▲ Strengthening local skills with over 5,000 satellite trainings in Africa since
2012, supporting economic and social development
▲ Pursuing partnerships with more than 10 universities around the world,
offering scholarships and sponsoring chairs
Providing emergency support and Giving Back Diversity, Inclusion and talent development in SES
▲ Communications in disaster areas with deployments of Emergency.lu
platforms or MEO connectivity for Project Loon in Peru and Porto Rico
▲ Working with International Organization for Migration (IOM) to provide
Emergency digital platform to effectively with field staff
▲ Our entire team focuses on charitable work, including charitable activities
that benefit from our donation-matching programme
▲ Around 2,000 employees in 2017 in more than 20 locations, reflecting 65
different nationalities with 24% women and 76% men
▲ Improving employee wellbeing with implementation of flexible working
with Employees able to remote work from home or from another location
▲ Grow and develop talent, skills and best practice sharing with recurring
trainings and knowledge networking communities
More information on: www.ses.com/about-us/corporate-social-responsibility

SES investor presentation I February / March 2018
Financial calendar & stock market info
29
Financial calendar
Event Date
FY 2017 results 23 February 2018
Q1 2018 results 27 April 2018
Q2 2018 results 27 July 2018
Q3 2018 results 26 October 2018
FY 2018 results February 2019
Other events
2018 Annual General Meeting 5 April 2018
Ex-Dividend Date 23 April 2018
Payment date 25 April 2018
Investor day TBC
Roadshows and conferences all along the year
More information on: www.ses.com/investors/financial-calendar
Stock market info
▲ Listed on Euronext Paris Luxembourg Stock
Exchange
▲ Bloomberg: SESG FP equity
▲ Reuters: SESFd.PA
▲ ISIN: LU0088087324
Consensus as at 15 February 2018
▲ 21 Analysts - ‘4 Buy’ / 11 ‘Hold’ / 6 ‘Sell’
▲ Consensus price target at EUR 14.4 EUR
Current Valuation as at 31 January 2018
EV /
EBITDA
P/E
ratio
Div.
yield
FCF
yield
SES 8.9 12.6 6.1% 4.3%
MSCI Media 9.4 16.8 3.8% 4.3%
MSCI Telco 6.2 16.1 4.7% 3.7%
Equity Indices 8.4 14.7 3.5% 4.0%
EUR Million
EUR/USD 1.197 Revenue
Revenue
growth % EBITDA
EBITDA
growth %
2018 1,988 +0.8% 1,296 +1.0%
2019 2,058 +3.5% 1,355 +4.6%
2020 2,116 +2.8% 1,405 +3.7%
1) Collected by VARA independent 3rd party provider - https://vara-services.com/ses/

SES investor presentation I February / March 2018
IR contacts
30
SES Investor Relations team
Château de Betzdorf • L-6815 Betzdorf • Luxembourg • On map • [email protected]
Michelle Suc
Investor Relations Coordinator
Investor Relations
+352 710725 403
Antoine De Brosses
Manager
Investor Relations
+352 710725 413
Ralph Rauschenberger
Vice President
Finance Support to Investor Relations
+352 710725 441
Richard Whiteing
Vice President
Head of Investor Relations
+352 710725 261
+352 691898956
Connect with us:
SES investor presentation I February / March 2018
Disclaimer
31
This presentation does not, in any jurisdiction, including without limitation in the U.S., constitute or form part of, and should not be construed as,
any offer for sale of, or solicitation of any offer to buy, or any investment advice in connection with, any securities of SES, nor should it or any
part of it form the basis of, or be relied on in connection with, any contract or commitment whatsoever.
No representation or warranty, express or implied, is or will be made by SES, its directors, officers or advisors, or any other person, as to the
accuracy, completeness or fairness of the information or opinions contained in this presentation, and any reliance you place on them will be at
your sole risk. Without prejudice to the foregoing, none of SES, or its directors, officers or advisors accept any liability whatsoever for any loss
however arising, directly or indirectly, from use of this presentation or its contents or otherwise arising in connection therewith.
This presentation includes “forward-looking statements”. All statements other than statements of historical fact included in this presentation,
including without limitation those regarding SES’s financial position, business strategy, plans and objectives of management for future
operations (including development plans and objectives relating to SES products and services), are forward-looking statements. Such forward-
looking statements involve known and unknown risks, uncertainties and other important factors that could cause the actual results, performance
or achievements of SES to be materially different from future results, performance or achievements expressed or implied by such forward-
looking statements. Such forward-looking statements are based on numerous assumptions regarding SES and its subsidiaries and affiliates,
present and future business strategies, and the environment in which SES will operate in the future, and such assumptions may or may not
prove to be correct. These forward-looking statements speak only as at the date of this presentation. Forward-looking statements contained in
this presentation regarding past trends or activities should not be taken as a representation that such trends or activities will continue in the
future. SES, and its directors, officers and advisors do not undertake any obligation to update or revise any forward-looking statements, whether
as a result of new information, future events or otherwise.