this memo includes six figures as well as tables and text
TRANSCRIPT

UNITED STATES ENVIRONMENTAL PROTECTION AGENCY REGION 10
1200 Sixth Avenue, Suite 900 Seattle, WA 98101-3140
OFFICE OF ENVIRONMENTAL CLEANUP
TECHNICAL MEMORANDUM
Date:
Subject:
From:
February 13, 2013
Evolution of Integrated Lower Watershed Source Control 2002- 2012 For the Lower Duwamish Waterway (LOW) - eattle, Washington
Kristine A. Flint, Environmental Scient Remedial Project Manager for LOW Source US EPA Region 10, ECL-111
RichardThomas ,~?,~-
a Project Manager and Technical Lead for LOW Source Control Washington State Department of Ecology
To: US EPA Administrative Record for LOW Superfund Site Proposed Plan for Sediment Remediation 2013
Controlling sources of contamination is an integral part of the remediation strategy for the LOW. The long-term goal of the source control strategy for this site is to minimize, if not eliminate, recontamination where possible. The Washington State Department of Ecology (Ecology) and local source control agencies have been working collaboratively on implementing a comprehensive effort since early 2002 to identify and reduce or eliminate sources to the LOW. This collaboration has worked well. However, even with this comprehensive and aggressive effort, there is likely to be some recontamination of LOW sediments after cleanup due to the ongoing and unidentified sources, the impacts of atmospheric pollutant deposition on stormwater quality, the current limits of control technologies, and the availability of resources. EPA and Ecology anticipate that recontamination will be localized, have different contaminant signatures from pre-cleanup conditions, and that concentrations of risk driver chemicals of concern (COCs) will be lower than those seen before cleanup. The LOW cleanup areas need to be monitored along with the rest of the waterway to determine how effective source control is and where source inputs can be reduced. The agencies also expect that source control technologies will continue to improve in the long term and should lessen the impact of recontamination.
The development of LOW source control and the work described in this memo spans the time from 2002 through 2012. This memo summarizes how source control has been implemented for the LOW, as well as the accomplishments to date by Ecology and local source control agencies. These explanations describe how Ecology became lead agency for LOW source control work, how that shaped the Source Control Strategies for LOW, and how the collaborative federal, state, and local approach to source control evolved. In sum, this memo explains why and how we developed an integrated approach to source control for the LOW, much like EPA's and Ecology's many guidance documents for integrated watershed management.
Page 1 of 44
Page 2 of 44
Both authors of this memo have been involved with LDW source control since 2002. The following
memo is based on the authors’ accumulated experience and observations and is generally intended to
illustrate the history of source control as it developed for the purpose of cleaning up the Lower Duwamish
Waterway.
Notes to Readers
This memo includes six figures as well as tables and text boxes with key ideas or messages. Wherever
possible, these features are presented in the text, close to the information describing their purpose;
however, there are two exceptions. First, readers will find a Quick Reference and Acronym List at the
end of the memo. This list is intended for use strictly in the context of this memo about source control and
is not intended for use with other documents. Second, Figure 1 is attached at the end of the memo because
it is simply too large to locate with the text describing it. Finally, readers should be aware that annotations
throughout are presented as end-notes on the final pages of this memo.
Source Control Overview
Beginnings
The LDW evolved from a natural estuary to a channelized, commercial waterway. The current nature and
extent of chemicals in LDW sediments is based largely on the way the LDW industrialized as Seattle
grew between the 1880s and 1960s. It is important to remember that many of the sediment contaminants
released during this time of industrial/commercial development were not regulated. EPA and Ecology
were both created in 1970. The 1970s is the decade when the environmental statutes as we know them
today originated. Figure 1 is a source control timeline which illustrates the events that shaped the
regulatory framework for LDW source control, along with the nature and extent of the sources that are
being controlled. As early as 1945, the Washington Water Pollution Control Board1 commissioned a
report on the sources of pollution in the Duwamish-Green River drainage. Although the 1945 report
contains some inaccuracies, it is generally very informative about the types of different industries
operating along the waterway that eventually became a Superfund site. The timeline highlights the origin
dates for some of the key federal and state regulations used to control sources today. As an additional
frame of reference, the figure also contains some environmental highlights from other areas of Puget
Sound, around the United States, and industrial history. The timeline ends with a general summary of the
source control milestones in the LDW and includes a summary of the accomplishments listed in Table 3
of this memo.
In 1999 EPA completed a study of contaminants in the LDW sediments and found multiple contaminants
posed threats to people, fish, and wildlife. Those contaminants were: polychlorinated biphenyls (PCBs),
polycyclic aromatic hydrocarbons (PAHs), dioxins/furans, phthalates, mercury, arsenic, and other metals.
In December 2000, EPA and Ecology entered into an Administrative Order on Consent (AOC) with the
Lower Duwamish Waterway Group (LDWG). LDWG was composed of the City of Seattle, King County,
the Port of Seattle, and The Boeing Company. Under the joint AOC with EPA and Ecology, LDWG was
required to perform a remedial investigation (RI) and to propose a feasibility study (FS) for cleanup.
Meanwhile, subsequent to the 1999 study, EPA added the LDW site to the National Priorities List (NPL)
in 2001. Ecology added the site to the Washington’s Hazardous Sites List in February 2002. Ecology and
EPA cleanup programs convened the first meetings about source control with the City of Seattle (Seattle),
King County (County) and the Port of Seattle (Port) in March and April of 2002. This group became

Page 3 of 44
Basic Source Control Questions Organize Thought, Process, and Work
What do you know?
about the sources you have
about the sources you suspect
about the data you have, where it came from, and what data gaps may exist
What regulatory tools do you have? Determine which, of all the possible regulatory options available to control a given source, could do the most thorough or effective job. Regulations are often called “source control tools.” What works? What doesn’t?
Determine which regulatory options are actually being used (or have been used in the past) for the given source.
Identify any regulatory gaps and/or additional controls that might be needed.
Why do/don’t the tools work? The time it takes to approve or issue permits, orders, etc. may be barriers to timely control of the source. Other barriers to timely control include:
delays due to negotiation
administrative processes (e.g., public comment period extensions, litigation)
funding and staffing limits
changes to policies rules, codes, etc. – Before one of these can be used, a change or
basis for taking exception may be needed to make the regulatory tool a more effective fit for a given source or type of source.
– A policy, code, or rule may change after control action is underway and this might cause delay.
What to do next to control the source? Use the best source control tools for the job based on the above line of questioning in order to fill the data gaps or implement effective source control. For any given source control situation, this may include a mix of federal, state, and/or local authorities.
known as the LDW Source Control Work
Group (SCWG) and has been chaired by
Ecology, with representation and support from
EPA.
In 2002, EPA and Ecology signed a
Memorandum of Understanding (MOU) for
the LDW that required Ecology to provide a
strategy for source control, which was issued
in 2004 (2004 Strategy).2 This MOU was
established between EPA’s Office of
Environmental Cleanup (Superfund program)
and Ecology’s Toxics Cleanup Program (TCP)
and does not acknowledge the need for other
programs at either agency to participate in
source control at the site.
Source Control and Progress at
Institutional Levels
From 2002 to the present, a great deal of
source control work has occurred. At first, the
LDW SCWG was focused on finding sources
or issues in the field—organizing a basic level
of knowledge about what we knew, what we
needed to know, and which agencies or
programs were already doing something to
control sources and how. The SCWG worked
with a shared purpose and used their collective
expertise and common sense to develop basic
operating principles and to generally organize
collaborative thinking and process. The Basic
Source Control Questions text box describes
the thought process that has shaped source
control in the LDW. The early period of
SCWG development offered insights about
how different programs and different agencies
actually implemented various regulatory
programs.
The SCWG formed in 2002 and in 2004
Ecology published a Source Control Strategy
(2004 Strategy). During these early years,
coordination within and between agencies
became smoother, and source control progress
increased throughout the LDW. Ecology’s TCP
began issuing notices and administrative orders for environmental investigations and cleanups at specific
sites. Ecology’s TCP also started working with their Water Quality Programs on several issues;
meanwhile, Seattle and the County focused their programs on tracing sources in combined sewer

Page 4 of 44
overflows/storm drains (CSO/SD), and the Port began forming its own strategy for dealing with its
historically contaminated properties.
From about 2003 to 2005, it became clear that source control work exceeded the job scope of the people
representing particular programs or divisions of their agencies on the SCWG. That is, representatives to
the SCWG were continually working within their own agencies to coordinate with work being done by
other programs or groups whose projects coincided with SCWG’s. This illustrated a fundamental issue for
source control in the LDW—no single agency (federal, state, or local) had a comprehensive regulatory
authority to control sources, especially complex sources such as the ones existing around the LDW.3 On
an even more basic level, it was clear that there was more source control work for each agency than one
representative to the SCWG could manage. As EPA started work on the sediment Feasibility Study in
2010 and as the time for proposing an LDW cleanup approached, SCWG agencies began to consider how
to formalize their commitment to more integrated source control and minimizing recontamination of the
LDW.
As EPA worked on the sediment Feasibility Study throughout 2011, Ecology began updating and revising
the 2004 Strategy, calling it the 2012 Revised Source Control Strategy (2012 Strategy). The 2012
Strategy has the same basic goals as the 2004 Strategy and clarifies some of the concepts and issues raised
in the 2004 Strategy. Differences between the 2004 and 2012 Strategies are shaped by lessons learned in
the first ten years of working with the SCWG to identify, characterize, and put effective controls in place
at the wide variety of sources found throughout the LDW. For the 2012 Strategy, Ecology has called upon
each SCWG agency to develop its own, agency-specific source control implementation plan. Ecology,
EPA, Seattle, and the County are all developing their own source control approaches. These are currently
called source control implementation plans and are meant to describe how each agency will conduct its
various programs to address source control work for the LDW source area, explain how programs can
interact to support others’ work (i.e., coordination within an agency), and how the agencies can support
each others’ work related to source control in the LDW source area.4 Source control implementation
plans are discussed later in this memo, along with examples of successful cross-program and inter-agency
coordination
One of the key lessons learned in the LDW is that relatively few sources or pathways are subject entirely
to a single agency or program authority. More often, it happens that actions taken before the beginning of
LDW source control in 2002 (e.g., from tank removals to flood control) aren’t necessarily sufficient
source control for the LDW. A comprehensive perspective of the source control problem and the solutions
most likely to succeed requires a coordinated approach. Regardless of the extra time and meetings that
multi-agency, multi-program coordination requires, LDW source control accomplishments to-date show
positive results because of this coordination effort. At LDW sources, more, if not all of the elements of
the source (release, contaminated media, and pathway) are considered for control to protect the sediments
or water quality. Consequently, the source control actions are more thorough and practical, with the added
benefit that business or property owners deal with coordinated disruption rather than a series of separate
investigations or actions over time that may involve costly interruptions, re-investigation and/or re-work.5
Coordination of this type between large agencies is complex and takes extra effort in times of shifting
capital priorities and shrinking budgets, but as SCWG agencies have developed the communication
channels and knowledge needed to “do source control,” they have reached general agreement that
continuing a coordinated watershed approach to source control will make the best progress toward
meeting goals set for the LDW.
Page 5 of 44
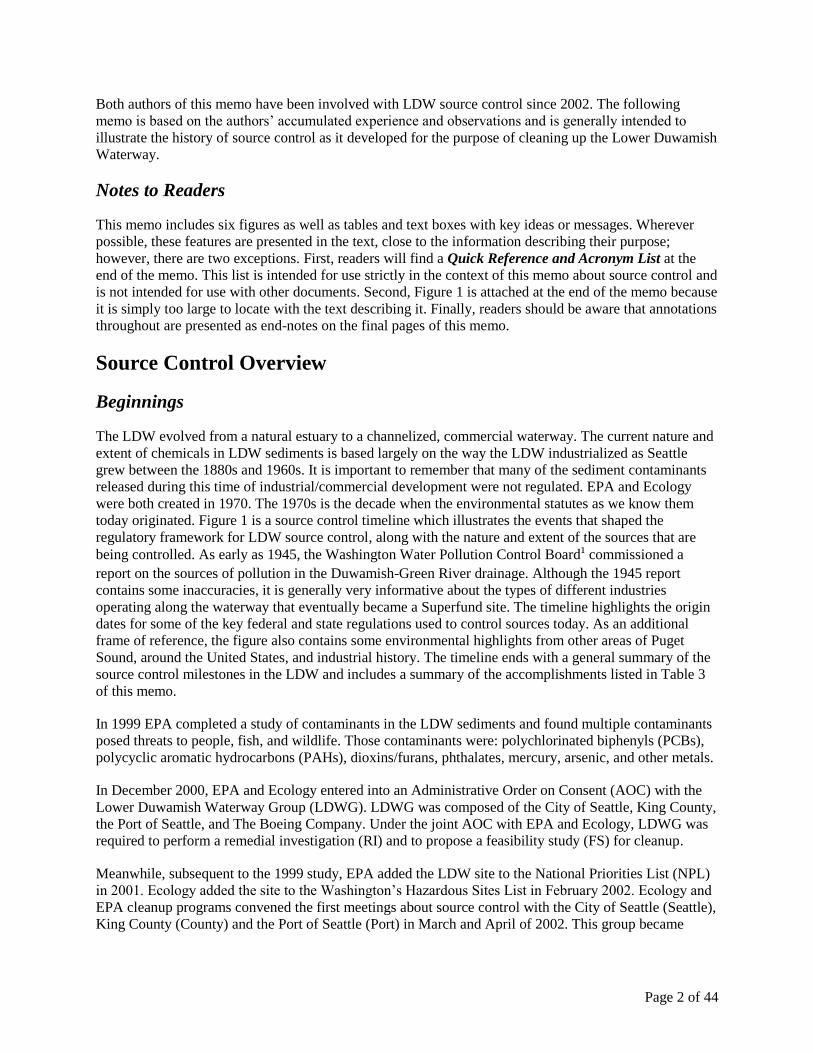
Agreement EPA/State
Sediments Source Control
Superfund RI process Organize source control agencies and programs
Early Action cleanups
Multiple agencies’ investigations, orders,
permits
Superfund FS and Proposed Plan
Multiple agencies do inspections, reviews, reports
Superfund Record of Decision
Multiple agencies apply best source control tools
Cleanup Control
Acceptable Risk Clean Sediments
2002–2004 Parallel Administrative Processes Established
The 2002 MOU between EPA and Ecology essentially created two parallel processes, with EPA leading
and controlling schedules for RI/FS work, while Ecology
organized and led the collaborative SCWG. There are
inherent differences between the parallel sediment and
source control processes which have been challenges
for source control. The differences begin with the fact
that the MOU is between two cleanup programs (i.e.,
EPA’s Superfund and Ecology’s TCP) and only
commits these two programs to completing all of the
work associated with the site. EPA leads the sediment
investigation and cleanup inside the LDW, while
Ecology TCP leads source control for everything
coming into the LDW site.
Parallels are Uneven, Not Equal
As described above and shown in the Agreement text
box, EPA and Ecology leads for the LDW are set up to
occur on parallel tracks, but the parallels are not equal
in terms of controlling schedules, the types or the
amount of work that need to be conducted, the roles
that agencies have in carrying out the work or, most
importantly, the authorities used to conduct the work.
The sheer physical scale of work is also vastly
different: EPA leads an investigation of sediments
totaling about 500 acres, while Ecology leads source
control over an area of about 20,400 acres that drain to the
sediment study area.
One question often asked at source control and public meetings is: “Why don’t the schedules for
controlling sources and sediment cleanups match?” A second question often asked is: “Why isn’t
Ecology or EPA as certain about source control effectiveness as they are about a remedy?” The best
answers to these questions are not simple. The shortest, general answer is that the parallel processes are
not equal in terms the levels of control EPA and Ecology can exert on their own side of the parallel
process. Two realities influence this answer. First, “EPA lead” on sediment cleanups means EPA’s
Superfund program controls the decisions and the schedules proposed for cleanups, all of which is
entirely within the authority and control of that single cleanup program. However, “Ecology lead” for
source control means Ecology’s TCP tracks and supports the work of several other agencies and programs
without complete authority or control of other programs’ or other agencies’ priorities, decisions, or
schedules. The result is that EPA is able to plan a cleanup schedule with a fair amount of certainty that all
of the technical reviews, community involvement, public comments, and so forth will stay more or less on
schedule. In contrast, Ecology’s TCP can identify all the work they and other programs or agencies need
to do but cannot offer the same level of assurance that identified work will be done on-schedule because
TCP does not control all of the regulatory “source control tools” and processes that may be needed to
control a particular source.

Page 6 of 44
Challenges of Uneven Parallels Shaped Structure of Source Control
The source control approach Ecology developed and first described in the 2004 Strategy provided a very
broad framework by which various programs at Ecology, EPA, City, County, and Port could leverage
their respective roles and responsibilities to conduct source control collaboratively and efficiently within
the area of drainage to the LDW site. The 2012 Strategy describes that same framework and is revised to
the level that SCWG agencies are all providing more detailed information about their specific
organizations and how source control can/will be prioritized and coordinated for the LDW. It is also
worth noting that the Port is withdrawing from the SCWG in 2013. The Port believes their role in source
control is primarily that of responding to regulations imposed upon them by state, federal, or other local
authorities; however, they are developing work plans, investigations, and cleanup strategies for their
properties in the LDW.
Source Control Strategies—2004 and 2012
The Basics
The basis of the 2004 Strategy was to control sources as early as possible, starting with identifying,
investigating, and controlling ongoing sources to the waterway and remediating industrial properties. The
2012 Strategy is based on the same approach. Although most of the high priority and larger sources to the
waterway have been identified and characterized, there are always new source discoveries and changes to
evaluate and address, such as the impacts of atmospheric pollutant deposition affects on stormwater,
improvements in pollutant control technologies, as-yet undiscovered historical sources, and changes in the
types and practices of industry/business throughout the LDW. This is one of the reasons that EPA and
Ecology state that, even with comprehensive and aggressive source control, LDW sediments will
recontaminate.
Physical Size of Source Control Area
The 2004 Strategy identified the potential source area to be the combined storm and sanitary sewer
service area and separated storm drainage basin. Mapping and calculations based on those drainages
showed a total source area of 20,400 acres, i.e., approximately 32 square miles, discharging to the LDW.
A total of 24 sub-areas were prioritized for source control within the 32-square mile source area. Figure 2
shows the source area and Figure 3 shows the 24 sub-areas along the LDW. The 2012 Strategy is based
on this updated spatial perspective.

Page 7 of 44
Figure 2: Total Source Control Area for the LDW

Page 8 of 44
Figure 3: 24 Source Control Sub-Areas on the LDW

Page 9 of 44
Organizing Priorities in the Source Control Area
The 2004 Strategy also provided a 4-tier scheme for different priorities of source control based on the
schedule for the cleanup process and the need to address sources to the entire sediment study area, not just
the sources related to sediment cleanup areas. The four tiers were helpful during the initial stages of
organizing source control but became less useful as source control agencies gained experience with
sources throughout the LDW source area and combined that knowledge. The 2012 Strategy describes that
source control priorities are now determined according to specific facts or issues and the work outlined in
Source Control Action Plans (SCAPs) and Source Control Status Reports (see Source Control Reporting
to Support Cleanup Decisions, below).
The 2012 Strategy prioritizes source control actions as follows:
High (needs to be complete before sediment cleanup),
Medium (can be completed before or at the same time as sediment cleanup), or
Low (can be completed as resources are available because source is likely not critical to
preserving the cleanup).
The 2012 Strategy also clarifies the questions and lines of evidence that influence source control
priorities. The following descriptions of influences on source control priority are based on experiences of
the SCWG agencies and capture the practical considerations that affect source control work.
1. When is source control needed? Ideally, source control action is needed before sediment
cleanup. The sequencing and timing of sediment remedial action is a critical consideration, and
this knowledge helps various source control agencies determine when and where to focus their
efforts and resources in different sub-basins. EPA and Ecology have continually discussed
sequencing and timing for sediment cleanups and coordinate them with source control, especially
at Early Action Areas and properties adjacent to the waterway. This practice will continue.
2. How contaminated is the source media? Environmental sample results obtained through source
tracing, investigations, site inspections/sampling, and site characterizations indicate what and
how much contamination is present in a particular media (soil, groundwater, surface water,
stormwater, etc.) or how contamination may be reaching the LDW by any particular pathway
(stormwater runoff, air deposition, etc.).
3. How much impact could the source have? The impact is determined by the size and type of
release, what the contaminated media are, the distance between the release and the LDW, and the
contaminant itself. These factors are evaluated in relation to a particular sediment cleanup action.
The number and nature of high priority actions identified in the appropriate SCAP(s) and the
length of time to complete the high to medium priority actions is also considered. Several years of
lead time may be needed before the source is effectively controlled.
4. Reassessment of Source Control Priorities in the Future. Source control is an iterative
process. As new information or data become available concerning a specific location or a
geographic area, the source control agency(ies) reevaluate what the new information reveals
about sources and pathways or how previous actions may have affected sources and pathways.
Occasionally, new regulatory requirements in the form of permit requirements and regulations or
statute changes will require a reassessment of Ecology’s source control priorities.

Page 10 of 44
Source Control Reporting to Support Sediment Cleanup Decisions
The 2004 Strategy set up an administrative process for Ecology to document and report on the whole of
source control efforts to EPA. The purpose of the reporting process was to build the administrative record
for source control in the LDW source area to support EPA’s Proposed Plan and eventual Record of
Decision (ROD) for sediment cleanup. Over time, however, the reporting and documentation process
anticipated in the 2004 Strategy changed a little, mainly in terms of document titles and content
organization.
The essential reporting scheme is straightforward. For each of the 24 source areas, Ecology issues two
reports. The first report compiles the information and data available about sources and evaluates it in
comparison to the sediment information. This is known as a Data Gaps Report. The second report,
mentioned earlier, is the Source Control Action Plan or SCAP. The SCAPs are based on the information
from the Data Gaps Report and list the source control investigations and actions that are needed, along
with the various agencies that would conduct the work. Finally, Ecology issues an annual Source Control
Status Report, which tracks and updates source control work and status for all 24 of the source areas.
Table 1 shows the various reports Ecology has compiled and plans to complete.
Table 1: LDW Source Control Documentation
Source Control Area Data Gaps Report
Publication Date SCAP Publication Date
EAA-1 (Duwamish/Diagonal Way) August 2009(a) December 2004
EAA-2 (Trotsky Inlet) February 2007 June 2007
EAA-3 (Slip 4) (b) July 2006
EAA-4 (Boeing Plant 2/Jorgensen Forge) June 2007 December 2007
EAA-5 (Terminal 117) June 2004(c) July 2005
EAA-6 (Boeing Isaacson/Central KCIA) May 2008 March 2009
EAA-7 (Norfolk CSO/SD) September 2007 September 2007
RM 0.0 - 0.1 East (Spokane Street to Ash Grove Cement) December 2008 June 2009
RM 0.9 - 1.0 East (Slip 1) August 2008 May 2009
RM 1.0 – 1.2 East (King County Lease Parcels) June 2010 January 2011
RM 1.2 – 1.7 East (St. Gobain to Glacier Northwest) February 2009 June 2009
RM 1.7 – 2.0 East (Slip 2 to Slip 3) February 2009 July 2009
RM 2.0 – 2.3 East (Slip 3 to Seattle Boiler Works) June 2008 April 2009
RM 2.3 – 2.8 East (Seattle Boiler Works to Slip 4) June 2008 June 2009
RM 3.9 – 4.3 East (Slip 6) March 2008 September 2008
RM 4.3 – 4.9 East (Boeing Developmental Center) September 2010 December 2010
RM 0.0 – 1.0 West (Spokane Street to Kellogg Island) September 2012 February 2013
RM 1.0 – 1.3 West (Kellogg Island to Lafarge Cement) April 2011 June 2011
RM 1.3 – 1.6 West (Glacier Bay) June 2007 November 2007
RM 1.6 – 2.1 West (Terminal 115) June 2011 October 2011
RM 2.1 West (1st Avenue S Storm Drain) September 2012 Estimated February 2013
RM 2.2 – 3.4 West (Riverside Drive) April 2012 August 2012
RM 3.8 – 4.2 West (Sea King Industrial Park) Estimated June 2013 Estimated June 2013
RM 4.2 – 4.8 West (Restoration Areas) Estimated June 2013 Estimated June 2013
Source Control Status Report 2003 – June 2007 July 2007
Source Control Status Report July 2009 – March 2008 May 2008
Source Control Status Report April 2008 – August 2008 October 2008
Source Control Status Report September 2008 – June 2009 August 2009

Page 11 of 44
Source Control Area Data Gaps Report
Publication Date SCAP Publication Date
Source Control Status Report July 2009 – September 2010 August 2011
Source Control Status Report October 2010 – December 2011 June 2012
Source Control Status Report January 2012 – December 2012 Estimated June/July 2013
CSO = combined sewer overflow; EAA = Early Action Area; KCIA = King County International Airport; RM = river mile as
referenced in project documents for the LDW RI/FS; SD = storm drain
(a) For the Diagonal/Duwamish CSO/SD, the SCAP pre-dated the Data Gaps Report format so several separate reports were
issued instead: Terminal 108 Soil and Groundwater Data Report for Oregon Street ROW, January 2007; Terminal 108
Final Report for Groundwater Investigation, October 2007; Terminal 108 Source Control Strategy Work Plan, February
2008; Terminal 108 Environmental Conditions Report, January 2009; Terminal 108 Western Parcel Source Control Strategy Plan, October 2009.
(b) For Slip 4, the SCAP pre-dated the Data Gaps Report format so several separate reports were issued instead: Property
Reviews from October 2006 – February 2007; Data Gaps Report for North Boeing Field and Georgetown Steam Plant,
February 2007; Supplemental Data Gaps for North Boeing Field and Georgetown Steam Plant, August 2009; Interim Source Control Status Report, July 2011.
(c) For Terminal 117, the SCAP pre-dated the Data Gaps Report format so separate property reviews were issued in June
2004: Basin Oil, Boeing South Park, South Park Marina, T-117/Former Malarkey Asphalt.
The 2012 Strategy identifies the basic reports and evaluations that Ecology issues to for source control
and these are outlined on Table 2. As they have all along, Ecology publishes and posts all of these reports
on their LDW source control web-pages.6 Beginning with the earliest documents, Ecology established the
practice of having SCWG and stakeholders review these reports as way of ensuring that the documents
addressed source control needs and issues in the LDW. The 2012 Strategy will continue this practice.
Table 2: Source Control Reports (2012 Strategy)
Document Description Frequency Reviewers
Summary of Existing
Information and Data
Gaps
Compiles existing information on
sources/ pathways in each of 24
source control areas. Summarizes
data gaps and source control needs.
Issued once with updates as
needed in Source Control
Status Report. If necessary,
publish Supplemental
reports.
Ecology, EPA, Seattle,
King County, tribes,
stakeholders
Source Control Action
Plan
Identifies source control actions,
implementing parties/agencies,
priorities, and schedules.
Issued once with updates as
needed in Source Control
Status Report.
Ecology, EPA, Seattle,
King County, tribes,
stakeholders
Source Control Status
Report
Summarizes source control actions
with updates reflecting new
information in each SCAP area.
Tracks and summarizes source
control accomplishments and
documents issues affecting source
control.
Annually and as resources
allow
Ecology, EPA, Seattle,
King County
Source Control
Evaluation
Determines whether source control
has reached the point where a
sediment cleanup can proceed with
some reasonable idea that
recontamination potential has been
(or is being) reduced.
Letter or memo as needed Ecology
Other Studies and
Reports
Technical and data reports, fact
sheets, public notices for permits,
etc.
As needed Ecology, EPA, Seattle,
King County, tribes,
stakeholders

Page 12 of 44
Definition of a Source
For the purpose of “controlling” an LDW source, historical or ongoing, every source has three elements which must be considered:
Contaminant: The origin or actual “source” is typically a release of contaminants caused by some action, event, industrial or business practice.
Media: This means an area or volume of air, surface water, groundwater, or soils affected by one or more contaminants. The media must be controlled to either reduce or completely stop the amount of the contaminated media from reaching the waterway. If it is not possible to completely stop or prevent media from reaching the waterway, then the aim is to achieve the most source control that is practical.
Pathway: This refers to the route or pathway to the river which is affected by a contaminated media. Pathways are described in the 2004 and 2012 Strategies.
Source control evaluates each of these elements for every potential source, whether historical or ongoing. Source control focuses on chemicals with the potential to exceed SMS criteria or LDW sediment cleanup goals. It is important to note that soil, groundwater, surface water, or other contamination issues exist within the LDW source area that do not have potential to exceed LDW cleanup goals. These issues are generally not addressed by the source control program; instead, they are referred to the appropriate agency and program for action. All three elements of a “source” can be present, but they may not always be active. For example:
Sheet flow potential exists everywhere but a pathway may not always active because it may be a dry season with no water runoff anywhere; or during a single storm, one site may have runoff while another may not.
Groundwater contaminated by some past or current activity may follow either or both of two pathways to the waterway: a contaminant plume in the natural flow of groundwater to the waterway; or as infiltration to storm drains that discharge to the waterway.
Table 2 also refers to reports for other source
control studies and reports, but they are not
specifically written for the purpose of tracking
and documenting source control progress for
sediment cleanup decisions. These are
described later in this memo and include reports
by Seattle and King County related to source
tracing, passive air deposition studies,
Ecology’s survey of PCBs in historical
buildings, and contaminant background studies.
Reports and documents associated with these
studies will continue to be reviewed by the
SCWG and posted or linked to Ecology’s
source control web pages.
Definitions and Key Ideas for
“Doing Source Control”
“Source”—Three-Part Definition
The 2004 Strategy listed nine types of
“sources” to the LDW and the 2012 Strategy
contains the same list. Although the list is
somewhat re-arranged from 2004, there are two
important differences to note. First, the 2012
Strategy clarifies the idea that there are three
elements or parts to the “sources” shown in the
conceptual model in Figure 4. Second, based on
the revised perspective, the 2012 Strategy lists
“pathways” rather than “sources” because
collaborative experience has shown pathways
are the most critical part of a “source” to
control and are often the first part of a source to
be controlled.
To talk about sources, it is important to
understand what a source is and, more
importantly, the pathway a source travels to
reach the LDW. For the purpose of
“controlling” an LDW source (historical or
ongoing), the three elements listed below and in
the Definition of a Source text box must be
considered. To achieve source control, actions
may be taken to control the contaminant release,
the media, or the pathway.
Contaminant: This is the origin or release of a chemical caused by some action, event, industrial
or business practice.

Page 13 of 44
Media: This is the volume of air, surface water, groundwater, or soil affected by one or more
contaminants. Contaminated media need to be controlled to either reduce or completely stop the
amount of contaminants reaching the waterway.
Pathway: This is the route to the river that contaminated media travels. Two examples are dusts
on hard surfaces that wash into stormwater discharges (stormwater pathway), or chemical spills
that contaminate soils, which then contaminate groundwater that seeps into the waterway
(groundwater pathway).
“Worst First”—General Approach to Organizing Work
When the sediment investigation began, it was clear for source control purposes that sources drained to
the whole sediment study area, not just to contaminated areas that would likely be identified for clean up.
Consequently, source control work needed to include the whole source area, which presented challenges
to Ecology and the SCWG in terms of organizing the work and finding the resources to do it. “Worst
first” is one of the key ideas behind the way source control work has been organized to-date. This idea
shaped the way source control priorities were set in the 2004 Strategy and the way they are described in
the 2012 Strategy. It means that Ecology and the SCWG have generally dealt with the known, obvious,
and more significant sources (i.e., “worst first”) before they directed resources toward identifying and
characterizing sources in the rest of the LDW source area.7 Another aspect of “worst first” is the idea that
sources directly adjacent to the waterway are typically assumed to have a higher potential to impact
sediments than sources located away from the waterway.
In practical terms, the dates in Table 1 show the general progression of source control work according to
the idea of dealing with the “worst first.” Note that source control reports and actions for Early Action
Area cleanups were done first, followed by reports for heavily industrial areas on the east side of the
waterway and Glacier Bay source control area on the west side of the LDW. Source control investigations
and reports for the less heavily industrialized sources areas along the west side of the waterway have been
issued more recently.
Worst-Case Assumptions without Data
Experience in evaluating potential sources to the waterway showed us that existing data about a site or
suspected source are often not sufficient to draw conclusions about the need to control an ongoing release,
contaminated media, and/or a pathway to the LDW. Often, actual environmental sampling data (e.g., soil,
groundwater, water discharges, storm water, or solids) are simply not available for the contaminants of
concern to source control. Existing data are often not useful because detection limits were too high, data
weren’t validated, older analytical methods were used, or there simply isn’t enough data to determine
nature and extent of the contamination. In these cases, source control evaluations typically include worst-
case assumptions about contaminant releases to environmental media and the potential for
recontamination. Practically speaking, lack of data is a gap in understanding the nature and extent of a
source and its potential to recontaminate and LDW cleanup area. Conservative, worst-case assumptions
can only be replaced by data that complete and add certainty to the understanding of recontamination
potential. In some cases, data collected to fill an information gap have shown contaminants are absent, or
present in smaller areas or at lower levels than were assumed as a worst-case. In this sense it is as
important to understand what is missing as it is to know what is present at a source.
Without environmental data as a basis for determining the nature and extent of contamination and thus the
need for source control, several lines of evidence are used to guide further investigation and/or determine
what types of source control may be needed. The lines of evidence used in source control include site
Page 14 of 44
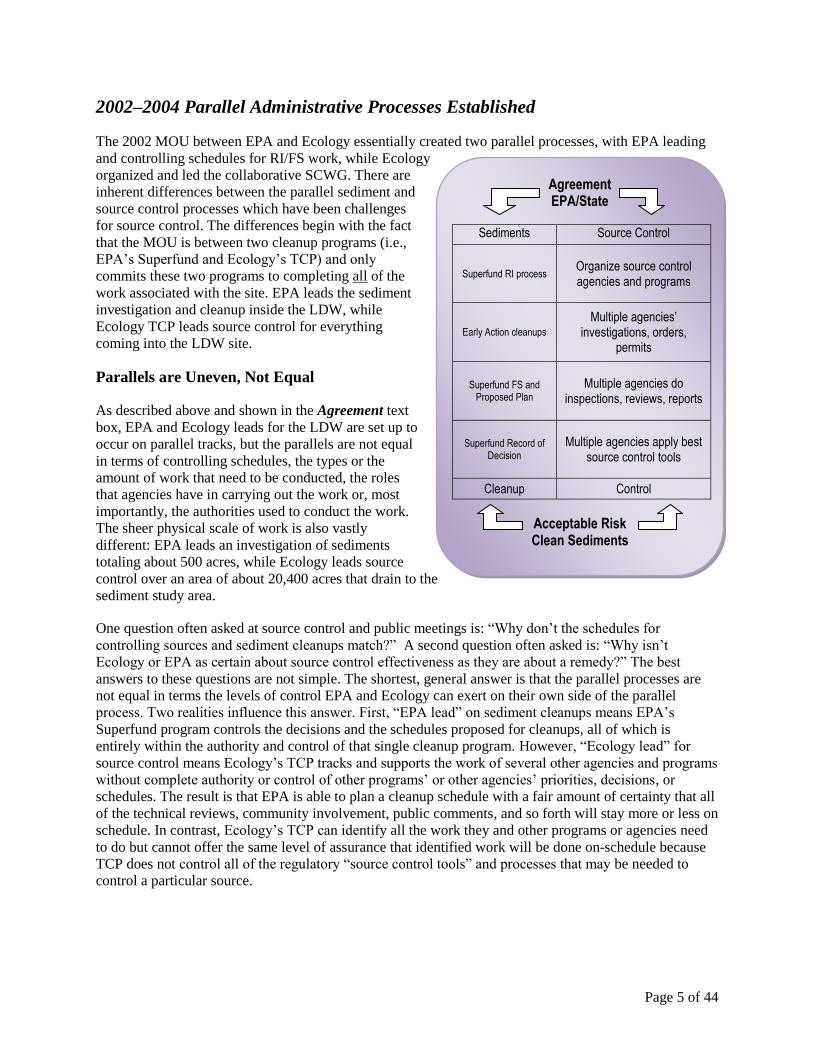
Direct Discharge Pathways in LDW
In the direct discharge pathway, pollutants enter the waterway through three major types of discharges:
Stormwater
Combined sewer overflows
Industrial wastewater
assessments and cleanup actions at nearby sites, historical and current information regarding industrial
activities and businesses, other agency inspections and documentation, and whatever sampling results
may be available from neighboring sites or from sites with similar operations.
Pathways and Conceptual Model for LDW Sources
The 2004 Strategy outlined nine types of sources in the LDW and the list has been refined slightly in the
2012 Strategy to describe eight types of sources affecting LDW sediments, below. Figure 4 shows the
conceptual model of these pathways and how contaminants in the LDW source area reach sediments in
the site.
1. Direct discharges: Direct discharges to the
LDW are from the following point-sources:
public and private storm drain systems, industrial
wastewater facilities, and public combined sewer
systems that carry municipal and industrial
wastewater and stormwater. The direct discharge
of pollutants to the waterway from these
numerous point-sources may affect sediment
quality, depending on the origin and character of
the effluent. These discharges are regulated under
the Clean Water Act (CWA), National Pollutant Discharge Elimination System (NPDES), and the
Washington State Water Pollution Control Act [RCW 90.48] and associated state waste discharge
program. These discharges, whether or not they exceed permit conditions, may contribute to
sediment contamination. Each type of direct discharge is described below:
a. Stormwater (industrial and municipal): Stormwater enters the waterway via a combination of
storm drains, pipes, ditches, or creeks, and directly from properties adjacent to the waterway.
Stormwater pollution is generated when rain contacts pollutants that have accumulated in or
on exposed soils and surfaces, and those pollutants become entrained in the stormwater
runoff. Pollutants present in soil and on paved surfaces come from urban activities such as
lawn and garden maintenance, spills/leaks from vehicles and equipment, vehicular and other
air emissions, and a variety of industrial activities (e.g., vehicle and equipment refueling,
chemical storage, outdoor manufacturing). Stormwater pollution also comes from illegal
discharges or illicit connections to stormwater systems. Contaminated solids that collect in
storm drains/pipes and ditches may be carried to the waterway by stormwater. In the LDW
source control area, there are more than 100 NPDES permittees for industrial stormwater
discharges to municipal storm drains or directly to the waterway. The Cities of Seattle and
Tukwila, King County, the Port of Seattle, and the Washington State Department of
Transportation are covered under municipal stormwater permits.
b. Combined sewer overflows: Some areas of the LDW are served by combined sewer systems,
which carry both stormwater and municipal wastewater (including industrial process
wastewater) in a single pipe. Most of the time, the combined wastewater and stormwater are
conveyed to a wastewater treatment facility for treatment prior to discharging to surface
waters. However, during large storm events, the total volume of untreated wastewater and
stormwater can exceed the conveyance capacity of the combined sewer system. When this
occurs, the combined sewer system is designed to overflow through relief points, called
CSOs, which discharge the untreated wastewater and stormwater to the LDW. CSOs prevent
the combined sewer system from backing up into homes and businesses and creating flooding
problems in local streets. CSOs may also occur due to equipment (i.e., pump station)

Page 15 of 44
Water Quality Permits
A permit prohibits certain discharges and allows a facility to discharge a specified amount of a pollutant into a water body under certain conditions consistent with water quality regulations. In Washington, NDPES permits are typically issued as both NPDES and State Waste Discharge permits (RCW 90.48). NPDES permits are issued for 5 years and must be renewed at that time. There are two basic types of NPDES permits: Individual Permit: An individual permit is tailored to an individual facility. Once a facility submits the appropriate applications(s), Ecology develops their permit based on the type of activity, nature of discharge, and receiving water quality. General Permit: General permits are developed for a category of discharge instead of an individual facility. General permits are cost-effective because they cover a large number of similar facilities under one permit, which enables Ecology to allocate resources more efficiently and provide timelier permit coverage.
malfunction. CSO discharges carry sediments and contaminants that affect sediments. The
City of Seattle’s CSO network is regulated under an NPDES permit. King County’s CSOs are
regulated under the NPDES permit for the West Point Wastewater Treatment Plant (WWTP).
c. Industrial Wastewater: Industrial
activities located along the LDW
may involve processes that generate
wastewater, which is not permitted
to enter the sanitary or combined
sewer for treatment at the WWTP. In
these situations, the industrial
facility must obtain an NPDES and
state waste discharge permit that
authorizes the discharge of process
wastewater under specific
conditions. There are currently a
handful of industrial wastewater
discharges to the LDW that are
regulated under individual industrial
wastewater permits.
2. Surface runoff (sheet flow): In areas
lacking effective stormwater collection
systems, contaminants are picked up by
stormwater runoff to flow directly from
properties adjacent to the LDW or to
creeks tributary to the LDW. Current
practices at different shoreline properties
may contribute to the movement of
contaminants to the LDW via runoff. Sheet flow is not considered a point-source discharge.
3. Groundwater discharges: Contaminants in soil resulting from spills and releases to adjacent and
upland properties may be transported to groundwater and subsequently be released to the LDW.
Contaminated groundwater may enter directly into the LDW via seeps, groundwater discharge, or
it may infiltrate into storm drains/pipes, ditches, or creeks that discharge to the waterway.
4. Erosion/leaching: The banks of the LDW shoreline are susceptible to erosion by wind and
surface water, particularly in areas with steep slopes. Contaminants in soils along the banks of the
LDW could be released directly to sediments via erosion. Waterway bank soil, contaminated fill,
waste piles, landfills, and surface impoundments close to the banks may release contaminants
directly to the LDW through erosion into the river or into stormwater or by leaching to
groundwater.
5. Spills, dumping, leaks, and inappropriate management practices: Near-water and over-water
spills, dumping, and leaks may result in contaminant releases directly to the river that may affect
both sediments and the water column. Activities on docks, wharves, and piers have the potential
to affect sediments from spills of material containing contaminants of concern. Accidental spills
during loading/unloading operations or from a mechanical failure may result in transport of
contaminants to sediments. Poor housekeeping and management practices for waterside
construction, hull maintenance, and waste disposal at marinas and small boatyards may affect
Page 16 of 44
sediment quality. Dumping material such as wood waste or debris directly into the waterway may
also adversely affect sediments and the water column.
6. Waterway operations and traffic: Contaminants from discharges from operating engines and
gray, bilge, ballast, or other waters may affect sediments. Discharges of gray, bilge, and ballast
water without treatment are prohibited in the national vessel discharge general permit; however,
there is a potential for spills in the waterway.
7. Atmospheric deposition: Atmospheric deposition refers to contaminants in the air that fall onto
surfaces during wet or dry conditions. Atmospheric deposition occurs on the surface of the
waterway and everywhere within the source control area. These contaminants can be collected by
stormwater conveyance systems and discharged to the LDW as stormwater pollution. Air
pollutants may be generated from point or non-point sources. Point sources include industrial
facilities, and air pollutants generated from painting, sandblasting, loading/unloading of raw
materials, and other activities, or through industrial smokestacks. Non-point sources include
dispersed sources such as vehicle emissions, aircraft exhaust, and off-gassing from common
materials such as plastics. Air pollutants may be transported over long distances by wind, and can
be deposited to land and water surfaces by precipitation or particle deposition.
8. Transport of contaminated sediments: Generally, the issue of sediment transport is currently
outside the scope of Ecology’s source control work. Sediment transport from the upstream
portion of the Green-Duwamish River has been assessed by the RI/FS and Ecology (Ecology and
Environment 2009). However, the following two aspects of sediment transport are important to
note:
a. Upstream sediments and sources: At this time, it is unclear whether sources and sediments
upstream of the LDW should be subject to LDW-specific source control activities. Ecology
and King County are assessing sources to the sediments upstream of the LDW in 2012–2015,
and efforts are underway to refine pollutant loading estimates from the upstream portion of
the Green-Duwamish River. Decisions about expanding source control efforts to the areas
upstream of the LDW study area will be made after the assessments are complete.
b. In-waterway sediments and cleanups: Transportation of contaminated sediments within the
LDW study area will be addressed as part of the LDW RI/FS work and during individual
sediment cleanup construction activities. Transport of sediments from contaminated areas is
influenced by a number of variables including hydrodynamics, vessel traffic, dredging, and
other waterway activities. During planning for sediment cleanup, recontamination potential
from other areas of contaminated sediments will be considered. During sediment cleanup
construction activities, best management practices (BMPs) are required to minimize transport
of contaminated sediments.
Historical Perspective Also Important to Conceptual Model
Time and history also play key roles in evaluating sources for control, as highlighted by Figure 1. Much
of the existing contamination in sediments and throughout the LDW source area was released before
environmental regulations and controls that exist today. Understanding historical uses and releases of
contaminants, along with historical pathways to the LDW, often helps determine which of the current
regulations or authorities can be used most effectively to control a source. As noted at the beginning of
this memo, source control is strongly influenced by the extent of historical practices. The 1945 report8
mentioned earlier and other historical records and reports have greatly informed the SCWG and Ecology
about where to investigate.

Page 17 of 44
Figure 4: Pathways of Pollution to the Lower Duwamish Waterway
Steps for Finding and Controlling Sources
Initially SCWG used a simple three-step process for identifying, characterizing and controlling sources
and pathways for impacted sediments. The three-step model was based on the conceptual model of the
nine sources identified in the 2004 Strategy as shown above. Over time, source control experience from
the field added to the three basic steps for the following, overall process:
Identify the nature and extent of ongoing sources of COCs to LDW sediments that have the
potential to exceed Sediment Management Standards (SMS) or other LDW sediment cleanup
goals, including water quality standards. This includes various types of sampling and monitoring
such as stormwater source tracing, CSO investigations, site inspections/sampling, and site
characterizations. When data are not available for particular chemicals, media, or pathways,
source evaluations often include worst-case assumptions about what might have been released
historically or what is currently being released that may affect potential to recontaminate.9
Identify and schedule source control and cleanup activities, including working with businesses to
implement BMPs in the upland basins contributing to contaminated sediments.

Page 18 of 44
Use existing administrative and legal authorities to require source control in areas contributing to
contaminated sediments.
Educate businesses, residents, and others who handle hazardous materials including COCs on
ways to reduce and control pollution from their activities.
Monitor and evaluate source control efforts and revise source control plans accordingly.
Source Control is Iterative and Affects Certainty about Effectiveness
Source control is not just a matter of “find it, characterize it, and stop it”; rather, it’s necessary to
understand that source control is actually a series of different processes that overlap and that source
control takes time. As described above, there are three parts to a physical source and, without sufficient
data (groundwater, soil, surface water, air) worst-case assumptions can be made about historical or
ongoing sources based on the information that is available about them. There are many lines of evidence
that influence the priority of different source control actions and, of course, reporting is needed to track
all of the data, actions, and other issues associated with “doing source control.”
Each step of the source control process uses several lines of evidence. This memo and other source
control reports (e.g., Data Gaps Reports and SCAPs) describe them as though they happen in an orderly
sequence; however, in practice, the process is iterative and several actions may occur at the same time or
overlap. Examples include situations where the existing evaluation of a site for source control is affected
by later site assessments and cleanup actions at adjacent or nearby sites. New and different information
about historical and current industrial activities and businesses as well as documentation from other
agency inspections and sampling can change the perspectives about the levels of source control needed in
any given situation. The process of “doing source control” is iterative: early conclusions and source
control actions may be revisited and refined as new information becomes available.
Sediment cleanup decisions need to balance the demands of future use of the waterway with human and
ecological health concerns and with community visions. These same considerations highlight the
importance of providing effective source control. As described earlier, the parallel processes of sediment
cleanup and source control share a common beginning (EPA/State MOU) and conclusion (cleaned up
sediments, lower risk); however, the two processes do not share the same levels of certainty about their
effectiveness. The Superfund sediment cleanup process predicts post-cleanup conditions based on a set of
assumptions about source control that are different from the lines of evidence that Ecology and the
SCWG review to determine recontamination potential. The 2004 Strategy explained that source control
effectiveness needed to be based on post-cleanup monitoring for recontamination and the 2012 Strategy
provides additional, detailed insight about the importance of combining data and information from source,
pathway, and sediment monitoring to determine trends in recontamination.
Other Key Ideas
COCs in RI/FS Are Sub-set of Source Control Concerns
Source control for the LDW is based on the discovery of potential sources of water or sediment quality
exceedance, while the COCs featured in the sediment RI and FS are those that present risk for human
health or the environment by their presence in sediments and the food web. Throughout the sediment RI
and FS, a very short list of COCs are discussed in terms of source control and recontamination; however,
the regulatory suite of potential sediment and water quality contaminants of concern for LDW source

Page 19 of 44
control is longer because of the series of Ecology regulations used for source control and how they’re
implemented. The differences are not easy to understand, but they are important. The LDW COC list of
risk-drivers for sediment cleanup is: PCBs, dioxins/furans, arsenic, and carcinogenic PAHs (cPAHs).10
The lists of chemicals of concern in source control include the State’s water and sediment quality
standards, as well other regulations which may add to the list of chemicals of potential concern for source
control at particular sites (e.g., Toxic Substances Control Act [TSCA], Model Toxics Control Act
[MTCA], Comprehensive Environmental Response, Compensation and Liability Act [CERCLA],
Resource Conservation Recovery and Act [RCRA]), plus any additional chemicals named in the sediment
cleanup decisions for which there are no regulatory values.11
The 2004 Strategy section on Source Control Priorities states that soil, groundwater, surface water, or
other contamination issues within the LDW source area that do not have potential to exceed sediment
cleanup goals will generally not be addressed by the LDW source control program. The 2012 Strategy
describes this same focus, but in a different way and with more practical detail. The 2012 Strategy
describes several questions and lines of evidence that are used to prioritize source control actions (see
description in the Organizing Priorities section earlier in this memo). In particular, the answers to
questions about how contaminated the source media is (question 2) and how much or what kind of impact
the source might have in the waterway (question 3) may reveal cases where a source does not affect
sediments but does exceed water quality levels of concern. Details for how contaminants of concern for
source control vary from site-to-site are available in the Data Gaps Reports and SCAPs published for each
of the 24 source areas around the LDW. Any updated information and subsequent changes in the priority
of a given source are discussed in the annual Status Reports.
Recontamination Uncertainties
As explained throughout this memo, there are many variables contributing to Ecology’s and EPA’s
expectation that, even with comprehensive source control, some recontamination will occur. The RI and
FS documents predict that recontamination for the PCBs, arsenic, and cPAHs (i.e., the COCs that drive
risk and sediment cleanup decisions) will not generally exceed background conditions or concentrations
seen in sediments entering the study area from upstream in the Duwamish/Green River watershed. The
bases of RI and FS recontamination predictions are models12 of how sediment mass moves through the
LDW study area; unfortunately, these models only account for a portion of solids entering the site via
municipal discharge with chemical concentrations assigned to them. The RI/FS models do not account for
all of the sources and pathways shown in Figure 4 or have loading terms for the following, potentially
major, sources in the LDW:
Banks and erosion, which are important given historical straightening of the river and filling since
1913, before it was important to characterize fill materials;
Groundwater, which is important since it may be running through historically contaminated fill or
it may be contaminated and reaching the LDW via historically filled channels; or
Surface water discharges from industrial storm and/or process water outfalls.
Because the sediment RI/FS models were not developed to fully represent sources with terms for the key
sources above, the source control and recontamination assumptions presented in the RI and FS are
extremely uncertain. Ecology and SCWG agencies have been filling in information about all important
types of sources with various investigations over the past decade. For instance, the “worst-first” approach

Page 20 of 44
described earlier in this memo led to issuance of a number of different regulatory orders for investigation
of banks/soils, groundwater, and stormwater around the waterway.
At this time, neither EPA nor Ecology has developed a more thorough model to estimate recontamination
potential for the LDW according to the source control concepts shown in Figure 4. There are several
reasons that a source control loading model has not been run for the LDW—the most important is a lack
of data sufficient for loading analyses. Over the years as different regulatory source control tools have
been applied, monitoring has been conducted for all sorts of reasons; though in general, sampling
conducted before 2002 or 2003 is rarely useful for source control other than to indicate data gaps and the
need for more complete monitoring.13 It is important to understand that environmental data are often
costly and physically difficult to obtain, so filling data gaps is neither a simple nor swift process. In some
situations, regulatory orders14 may be required to justify the expense of obtaining data to develop better
ideas about the nature and extent of a source.
Recontamination is anticipated and, as yet, the source control process cannot offer a great deal of
certainty about its magnitude for the entire LDW. To understand why the agencies anticipate some
recontamination and how we are currently positioned to address it, it is critically important to remember
the following points about source control and the overall uncertainties associated with them.
Existing Sediments: Sediments themselves are a source of contamination and risk in the
waterway. Sediment cleanups are effective source control actions in terms of removing volumes
of contamination from the river and reducing risk. Residual sediment contamination may factor
into recontamination of the waterway as well.
Historical Sources: The major historical sources of contaminant release adjacent to the LDW
have been identified by reviewing a combination of historical records and existing environmental
investigations (see Data Gaps Reports). This type of review has identified large historical sources
in the upland15 (e.g., North Boeing Field, Georgetown Steam Plant, and numerous industrial
developments and practices at locations of current Port Terminals 106, 108, 115, and 117) and
other industrialized properties. Additional environmental investigations are still needed where
historical source potential is but actual data is scarce (see “worst-case assumptions”). As noted
earlier, data and information that become available over time may change the current level of
certainty about where and how significant historical sources are, but for now EPA and Ecology
believe the source control knowledge about historical sources adjacent to the LDW is fairly
complete and that major historical upland sources are identified. Readers are encouraged to refer
to SCAPs and Status Reports for the priority of sources in each of the 24 source control areas for
the LDW.
Ongoing Sources: Ongoing sources offer uncertainty from several different levels. First,
regulatory source control tools are not perfect. Many of the current operations adjacent to the
river, as well as upland, are regulated in some way by a federal, state, or local environmental
program. Most of these regulations, however, were not written to specifically address all three
elements of a source as defined for source control in the LDW (i.e., chemical releases,
contaminated media, or pathways to the LDW). Equally important, many of these regulations do
not require monitoring or generate data about many of the source control chemicals of concern.16
Finally, we note that most of the current regulations went into effect well before 2002 when key
ideas and watershed perspectives for source control specific for the LDW began to form. The net
effect of these facts is that while regulations do exist, they may not, by themselves, offer fully
effective or straightforward ways to control sources. For this reason it is often necessary for

Page 21 of 44
Change Takes Time! Control for a particular LDW source might be much easier “if only” a law, a regulation, or a policy was written differently to suit a particular LDW source control problem. But making the actual change happen is never as easy or as swift as just thinking “if only.” Change is, by definition, a process—and process takes time. In the real world, changes to regulatory source control tools (laws, regulations, codes, policies, etc.) take time. Change tailored to a particular LDW source control situation may not work …
For the rest of the City (“if only” the local code or policy needed to change);
For the rest of Washington (“if only” a statewide general permit or statewide policy, or state law needed to change); or
For the rest of the U.S. (“if only” a federal law, regulations or guidance needed to change).
Our general observation is that improvements to source control regulatory tools will take time. The amount of process (i.e., time) required to make these kinds of change increases with the level of government that needs to make the change.
different SCWG agencies to combine their knowledge and coordinate different actions under
different authorities in order to effectively control sources in the context of the LDW cleanup site.
It is a fact that sometimes, even when used in combination, source control results from existing
regulations may not totally prevent a source’s impact on the waterway. Additional uncertainties stemming
from this situation include the fact that different agencies and regulations have different administrative
processes for taking actions or making decisions—and when several agencies or programs are attempting
to coordinate source control for one source, sequencing and timing are often challenging to manage. This
means that the dates predicted for completing source control actions can be uncertain.
Another important type of source control uncertainty is that many upland sources are discovered by
sampling solids (sand, clay, silts, etc.) that collect within municipal stormwater lines over time.
Depending on the chemicals detected in these samples and the sampling location relative to different
businesses or types of operations, particular chemical releases may be traced17 and controlled. However,
solids that have accumulated for 6 months to a year or longer before being sampled may contain
contamination from businesses that have since moved away. So the turn-over rate of operations in
commercial/industrial areas adds uncertainty because it’s difficult to correlate time-weighted data from
stormwater lines to an ongoing source that may have moved out of an area. Some areas around the LDW
have higher business turn-over rates, which means that source control has a higher level of data-based
uncertainty that specific sources have been identified and are still present for subsequent source control
action.
Recontamination Expectations
Not all source control regulations are effective
at totally preventing impacts to the LDW.
Controlling ongoing sources to the LDW to the
best of the SCWG’s abilities will take ongoing
commitment because source control is iterative
and will likely never be completely “done.” It
will take a long time to make improvements to
federal or state laws and regulations that are
used to control sources. The reason is that the
higher the level of government that needs to
make change, the broader the effect will be and
it will take more time to propose and finalize the
change. The Change Takes Time text box
shows our observations of why change is slow
to occur. Public and political commitment are
needed to continue staffing and funding levels
for the type of work that has been done to date,
not to mention for the studies and improvements
needed to fill-in data and knowledge gaps
identified throughout source control Data Gaps
Reports, SCAPs, and Status Reports. Control
technologies and monitoring schemes are
expected to improve over time, but the rates of
change will likely be tied to regulatory shifts
and regional/local economics supporting those
changes.

Page 22 of 44
Reports and More Details
Check Ecology’s web page where the 2004 and 2012 Strategies and all of these reports are posted. The web page includes links to further information about specific sites such as the Early Action Areas, RCRA and MTCA cleanups. http://www.ecy.wa.gov/programs/tcp/sites_brochure/lower_ duwamish/lower_duwamish_hp.html Also check the following links for additional information about ongoing source control work those agencies conduct throughout the LDW area. Seattle Public Utilities http://www.seattle.gov/util/Services/Drainage_&_Sewer/ PollutionControl/LowerDuwamishSediment/index.htm King County CSOs and source control http://www.kingcounty.gov/environment/wastewater/cso.aspx King County Duwamish Waterway Programs http://www.kingcounty.gov/environment/wastewater/ Duwamish-waterway.aspx Port of Seattle http://www.portseattle.org/Environmental/Pages/default.aspx
Despite the rather intangible but very real challenges listed above, EPA and Ecology agree that current
levels of source control need to be maintained, despite the fact that some recontamination is anticipated
once sediments are cleaned up. With inputs from the waterway models in the RI/FS, it appears that some
smaller and more localized areas of the waterway will recontaminate; however, with continued source
control and eventual improvements over time, those areas of recontamination will likely not present as
much human health or environmental risk as current sediment conditions.
Actual Source Control Work—Examples and Accomplishments
To recap, the LDW SCWG has existed since 2002 and has developed a collaborative approach to
conducting source control. The approach is based on collecting and sharing information to develop
practical understanding of the physical sources to LDW (i.e., releases, contaminated media, and
pathways) and support subsequent regulatory approaches to controlling them. The basic principles,
concepts, and practicalities described previously were developed while Ecology and the SCWG agencies
conducted the daily business of source control throughout the LDW.
Tracking and Documentation are Resources for Source Control
The Data Gaps Reports, SCAPs, and Status Reports described above are not only important for
supporting EPA’s administrative record and cleanup decisions, they are also important resources for
source control decisions being made throughout
the LDW source areas. These reports represent
the most current and comprehensive
information about sources of pollution in the
LDW and should serve as basic references for
source control work well into the future. There
are 24 sub-areas around the LDW that drain to
it. A Data Gaps Report and SCAP are issued
for each area (see Tables 1 and 2). Ecology also
issues Source Control Status Reports, which
track progress and changes related to source
control actions or decisions throughout the
source area.
The Data Gaps Reports and SCAPs conducted
so far have led to the identification of
contaminated sites requiring evaluation of
potential sources previously unknown to
Ecology. The Status Reports are summary
updates based on information learned over the
reporting period (e.g., the past year; see
Table 1), including reports from SCWG
agencies. Exact numbers of different types of
sources for various programs change from
month to month, depending on new
information, projects being completed, and new
sites being identified. Each SCWG agency
(Ecology, EPA, Seattle, King County) has one or
more databases to track their unique programs and source work across their specific regulatory
jurisdictions. Change is constant so precise numbers of sources within the LDW sub-areas are difficult to

Page 23 of 44
determine at any given point in time. Additional sources of information for the public about source
control and resources are noted in the Reports and More Details text box.
Ecology Source Control Accomplishments
Table 3 is a summary of mainly Ecology’s source control work up to mid-2012 and shows that 196
confirmed or suspected contaminated upland facilities have been identified within the LDW18 drainage
basin, though not all of the sites listed in this database are actually sources to LDW sediments. For the
sites that Ecology has determined have a high source potential to LDW sediment, Ecology is requiring an
RI/FS and/or interim action under the MTCA regulatory process [WAC 173-340]. To address soil,
groundwater, stormwater, and sediment contamination, Ecology has currently placed 13 sites under
MTCA Administrative Orders (AOs) administered by Ecology’s TCP. Several other sites have been
identified as having a high potential to be contaminating LDW sediments by Ecology and, as of 2013,
TCP is waiting for staffing resources in order to develop AOs for those sites.
Figure 5 shows the contaminated sites that are subject to EPA or Ecology orders or investigations.
Ecology is awaiting the necessary resources to manage these additional sites before proceeding with a
MTCA administrative order to conduct an investigation and cleanup of those sites. Other facilities in the
LDW basin are under MTCA AOs administered by Ecology’s Hazardous Waste Treatment and Reduction
(HWTR) Program. The primary chemicals of concern for the HWTR sites are perchloroethylene19 and its
break down product, vinyl chloride. Because these volatile organic compounds (VOCs) do not typically
adhere to sediments, they are not considered a significant sediment recontamination threat. However,
remediation of these HWTR sites is expected to result in an improvement of water quality in the LDW.
At other sites, investigations are being conducted by contractors under Ecology management. These
investigations are used to determine if the site is a potential source of sediment contamination. Depending
on the results, sites are prioritized for action under MTCA.
Ecology also implements federally delegated sections of the Clean Water Act through their Water Quality
Program (WQP). The source control focus of the WQP is on the prevention and systematic reduction of
contaminant discharges through NPDES and state waste discharge permits. Water quality permits and
regulations are important components of source control in the long term, and the 2012 Strategy contains
detailed descriptions of the permits that are relevant to LDW dischargers.
Table 3: General Summary of Source Control Actions (as of 2012)
All of the work conducted to-date and summarized below has involved one or more of the following elements: source control
investigations, site assessment and cleanup, inspections, source tracing, sampling, and monitoring. For comprehensive accounts,
check the most recent of Ecology’s Source Control Status Reports.
Thirteen facilities along or near the LDW are under agreed orders administered by Ecology’s Toxic Cleanup Program.
* Jorgensen Forge8801 East Marginal Way (former Paccar site)
* South Park Landfill
* Crowley Marine Services
* Industrial Containers/Trotsky/NW Cooperage
* Boeing Isaacson-Thompson and Port of Seattle
* Duwamish Marine Center
* North Boeing Field/Georgetown Steam Plant
* Fox Avenue/Great Western Chemical
* Glacier NW/Reichhold
* Duwamish Shipyard
* Douglas Management Properties
* Port of Seattle – Terminal 115 North

Page 24 of 44
Table 3 (continued)
General Summary of Source Control Actions (as of 2012)
Five additional facilities in the LDW source area are under agreed orders for investigation and cleanup administered by Ecology’s
HWTR Program.
* Art Brass Plating
* Capital Industries
* Philip Services Georgetown
* Blaser Die Casting
* General Electric – Dawson Street Plant
Ecology has conducted site investigations at:
* South Park Marina (former A and B Barrel)
* Washington State Liquor Control Board Warehouse
* Industrial Container Services (formerly Northwest Cooperage)
* Basin Oil
* Douglas Management Company
Four voluntary cleanups under Ecology’s MTCA program adjacent to the waterway are occurring or have been completed:
* Boeing Developmental Center
* City of Seattle 7th Ave Pump Station
* Port of Seattle Terminal 106/108
* General Services Administration – Federal Center South
(Approximately ten other voluntary cleanups have occurred or are occurring within the LDW Source Area, including
several at the Boeing Developmental Center.)
Eight facilities along or near the LDW are under an EPA cleanup process:
* Boeing Plant 2 (RCRA)
* Rhône-Poulenc (RCRA)
* Boeing Electronics Manufacturing Facility (CERCLA)
* 24” stormwater line Boeing/Jorgensen property line (CERCLA)
* Jorgensen Forge shoreline (CERCLA)
* Port of Seattle Terminal 117 (CERCLA)
* Tully’s/Rainier Commons (TSCA)
* North Boeing Field/ King Co. International Airport
Storm Drain Treatment System (CERCLA)
Since 2003, the City of Seattle and King County have completed more than 3,000 inspections at more than 1,400 businesses in the
LDW. In addition, they have collected over 800 sediment samples from storm drains and combined sewer systems to help identify
and characterize sources discharging to the municipal storm and wastewater collection systems.
In 2008, Ecology signed an interagency agreement with the City of Seattle to expand source tracing sampling. As part of this
agreement, Seattle Public Utilities (SPU) installed twenty additional sediment traps in the LDW study area, including areas on King
County International Airport (KCIA) and unincorporated King County.
As of January 2013, 421 combined hazardous waste and water quality inspections have been completed under the Ecology LDW
Urban Waters Initiative. The following list is an example of the source control activities from Urban Waters’ work for one year
(October 2009 through September 2010):
66 water quality inspections were conducted,
33 notices of violation were issued,
4 administrative orders were issued, and
4 penalties were assessed.
Approximately 100 facilities in the LDW drainage basin have Ecology water quality discharge permits (NPDES); approximately 90
facilities are regulated under a general industrial stormwater permit; two active facilities have individual industrial stormwater
permits; two facilities operate under general discharge permits for boatyards; and four facilities operate under general discharge
permits for sand and gravel facilities.
Four local governments have municipal stormwater general discharge permits (Phase I for the City of Seattle and King County,
secondary permittee under Phase I for the Port of Seattle, and Phase II for the City of Tukwila).
Two local governments (the City of Seattle and King County) have individual discharge permits for their CSO/SD systems.

Page 25 of 44
Figure 5: Contaminated Sites—Ecology and EPA in LDW

Page 26 of 44
EPA Combining Work With Ecology
As noted in Table 3, EPA is also actively involved with cleanups at facilities along or near the waterway
through their cleanup programs (CERCLA, RCRA, and TSCA). Between Ecology and EPA, there are
over 30 separate major cleanup actions occurring in the immediate vicinity of the LDW. Several of the
more complex sites and actions began before the LDW site was listed on the NPL in 2001 and are
expected to be complete around 2020 and the time of sediment cleanup (e.g., Boeing Plant 2, Rhone
Poulenc, Duwamish Shipyard, Boeing Isaacson/Thompson). Many of the 30+ cleanup actions have
started since the LDW site was listed and are expected to reach a level of source control sufficient to
protect the sediment cleanup by the time it begins (currently estimated to be 2018–2019), even though
these cleanups may not meet the regulatory or statutory definitions of “final” or be absolutely “complete”
according to cleanup regulations (RCRA, CERCLA, or MTCA). The aggregate effect of these ongoing
and future cleanups will reduce or eliminate the known majority of historically contaminated sites
adjacent to or in the immediate LDW vicinity, especially for PCBs.
Ecology is also working to integrate source control concerns for the LDW with NPDES and other water
quality-based work. As Table 3 notes, approximately 100 facilities have NPDES discharge permits. Many
of these facilities are regulated by general permits, which cover general categories of storm or waste
water in very large areas such as Western Washington or the entire state. In the LDW, however, the RI
data raise very specific concerns about sediment impacts that are not addressed by the current permits.
With some input from EPA, Ecology is considering several different approaches to address issues such as:
1. The effects of demolition and construction projects at contaminated sites, which is not factored
into the current construction stormwater general permit;
2. Hydrophobic COCs, which tend to not be detected in whole water or suspended solids and have
not, thus far, been addressed by traditional water quality-based effluent monitoring or with permit
limits; and
3. TMDLs and associated waste load allocations for sediment and water COCs, which may also
serve as a way to fill some important data gaps for source control, such as:
a. Need for consistent data from discharge-to-discharge (e.g., the same data from each outfall
regardless of the industrial subcategory, which currently defines the COCs being monitored
and the frequency of monitoring);
b. Enough data for sediment COCS to generate for better loading estimates to use in
recontamination analyses; and
c. Better data to use in investigating sources that contribute to stormwater impairment at
discharge to the LDW.
Ecology and EPA must continue to be mindful and balance the ramifications that selected approaches for
LDW may have elsewhere in the state with the need to provide better source control to reduce
recontamination potential. It is also important to understand that water quality programs must continue to
work with cleanup and other programs because, typically, no single statute, regulation or permit action
will totally control a source.

Page 27 of 44
Example: Implementation of One Source Control Action Plan - EAA-2 Trotsky
The Example of Comprehensive Source Control text box for this Early Action cleanup area is an
example of one drainage basin (the Early Action Area 2 – Trotsky Inlet) and the comprehensive source
control work accomplished there using the source control 2004 Strategy. Briefly, Early Action Area 2
(EAA-2) is located at approximately river mile 2.2 on the west bank of the LDW, just south of the First
Avenue South Bridge (see Industrial Container on Figure 3). It consists of a small inlet, approximately 80
feet wide at its mouth and tapering to a narrow stream at its head. The inlet is surrounded by property
owned by the Douglas Management Company to the north and by Herman and Jacqualine Trotsky to the
south. The inlet itself was formed when the area to the north was filled to create the triangular area that
currently comprises the Douglas Management Company site (see Figure 6). The total drainage, or source
area, for the inlet is 40-45 acres.
Based on the results of prior sediment sampling, the following chemicals are considered to be COCs at
EAA-2 with regard to potential sediment recontamination: PCBs, dichlorodiphenyltrichloroethane (DDT),
bis(2-ethylhexyl)phthalate (BEHP), dieldrin, mercury, lead, and zinc. Source control actions to address
these COCs are identified in the Data Gaps Report and prioritized in more detail the SCAP. The reports
for EAA-2 organize the total drainage area in five sub-sections, which are discussed in the Example of
Comprehensive Source Control text box: Second Avenue South Stormwater Outfall; Trotsky
Property/Industrial Container; Douglas Management Property/Alaska Marine Lines; Boyer Towing; and
Other Upland sources. The SCAP sorts the data gaps, sources, and associated tasks into high, medium,
and low priority. As noted earlier, these priorities are based on many variables, the three most common of
which are: (a) the importance of missing information or data to deciding which actions will most
effectively control the source or pathway; (b) the nature and extent of contaminated media combined with
the viability of the pathway to sediments; and (c) the length of time and resources needed to ultimately
either fill the information/data gap or control the source or pathway.
In 2012, Ecology used historical information about the site to target sampling conducted for the
characterization work required by the MTCA order for the Industrial Container Services/Trotsky
Property. Sampling was targeted at suspected problem areas (e.g., waste lagoon, sumps) from past
operations at the site. The targeted sampling verified the suspected hotspots and increased certainty for
future source control actions and decisions at this portion of the site.

Page 28 of 44
Example of Comprehensive Source Control for One Site EAA-2 Trotsky Source Control Data Gaps and Action Plan Results
The Data Gaps report for EAA-2 was prepared in February 2007, and identified the following potential contaminant sources: Industrial Container Services/Trotsky Property/ Former Northwest Cooperage, Douglas Management Company/Alaska Marine Lines Dock 2, Boyer Towing, Inc., and other upland properties with stormwater drainage to the Second Avenue South outfall – for a total estimated drainage area of 40–45 acres. The Action Plan was published by Ecology on June 29, 2007. Of the 34 various actions outlined in the SCAP, 15 are complete, 7 are in process or ongoing, and 12 are not yet started. These actions are detailed in Table ES-1 of the SCAP (posted on Ecology’s website for LDW source control) and are generally summarized below. For the entire EAA 2 drainage area: Completed Source Control Actions: Since 2002 (when LDW source control started), business inspectors have completed 34 full inspections, 4 screening inspections, and 39 follow-up inspections at 30 sites in the source area for EAA-2. Ongoing Source Control Plans: Seattle Public Utilities (SPU) is currently conducting inspections at 16 businesses in this drainage basin as part of its cycle of business inspections. For the Second Avenue South Stormwater Outfall: Completed Source Control Actions: SPU collected samples from onsite catch basins, in-line sediment samples from the Second Avenue South ditch, and right-of-way catch basins. Arsenic, copper, lead, mercury, zinc, total petroleum hydrocarbons, low density polyaromatic hydrocarbons, 2-methylnaphthalene, BEHP, dimethylphthalate, butylbenzylphthalate, di-n-butylphthalate, 4-methylphenol, pentachlorophenol, and benzyl alcohol concentrations were above the SMS or MTCA Method A. Stormwater discharges from the Second Avenue South drainage basin may represent an ongoing source of COCs to the EAA-2 inlet. Ongoing Source Control Plans: SPU and Ecology will continue source tracing of upland sites as needed. Ecology’s Water Quality Program will continue to review and update NPDES permits. For Industrial Container Services/Trotsky Property (former Northwest Cooperage): Industrial Container Services, LLC, is the current owner/operator of a steel drum reconditioning facility located adjacent to the EAA-2 inlet. This facility operated under several names over its 60-year history. Operations include storage, cleaning, and repainting of empty used drums. Drums accepted for reconditioning contain hazardous wastes, resins, solvents, petroleum products, paints, adhesives, or pesticides. Soil and groundwater underlying the facility are confirmed to be contaminated. In soils 19 chemicals were identified, and in groundwater 18 chemicals were identified that could potentially recontaminate EAA-2 inlet sediments. These include metals, PCBs, VOCs, semivolatile organic compounds, and pesticides. Completed Source Control Actions: On May 18, 2010, Ecology entered into an Agreed Order (DE-6720) with the property owners and leasee. The Agreed Order requires the parties to conduct an RI/FS to define the nature and extent of contamination and to evaluate cleanup alternatives and conduct interim actions if appropriate. The Agreed Order also requires preparation of a draft Cleanup Action Plan (CAP) that identifies a preferred cleanup action and cleanup schedule. RI sampling occurred in 2012. Ongoing Source Control Plans: Ecology’s Toxics Cleanup Program (TCP) will continue to implement the Agreed Order for RI/FS, draft CAPs, and interim actions. Pending results of the RI sampling, a workplan for cleanup is expected in 2013 and MTCA interim actions for source control may occur as soon as 2013–2014. Meanwhile, Ecology’s Water Quality Program, with King County and SPU, will evaluate the need for stormwater characterization from this facility due to runoff/overflow during heavy rainfall. Puget Sound Clean Air Agency will conduct periodic air permit inspections to ensure compliance with permit conditions and BMPs.

Page 29 of 44
(Example – continued) For Douglas Management Company/Alaska Marine Lines: This site was used for shipbuilding and salvage, handling of containerized marine freight, parking and light maintenance, equipment storage, and operation of a concrete batch plant including a concrete waste disposal facility with settling and storage basins. In 1990, widespread contamination was identified in groundwater including benzene, toluene, xylene, and diesel. Underground storage tanks were removed in 1991. Completed Source Control Actions: The facility operates under the Industrial Stormwater General Permit. Past compliance inspections noted several items for correction, including draining wash water to the storm drain system and mapping where the oil/water separator discharged. On May 6, 2011, Ecology entered into a MTCA Agreed Order (DE-8258) with the property owner to conduct an RI/FS and prepare a draft CAP and conduct interim actions as appropriate. Ongoing Source Control Plans: Ecology’s TCP will continue to implement the Agreed Order for RI/FS, draft CAP, and interim actions. Source control actions related to soils in the bank and sediments at this site will likely be sequenced with actions taken at Industrial Container Services/Trotsky Property because the two sites are adjacent. For Boyer Towing Inc.: Boyer Towing owns 13 parcels; activities include operation of a commercial fishing terminal, automotive and equipment repair, equipment and vehicle storage, and operation of warehouses and a machine shop. Boyer Logistics operates a terminal that provides contract stevedoring and freight operations, and shipping and temporary storage for untreated cut lumber from Alaska. At least two private outfalls discharge directly to the LDW. Completed Source Control Actions: In January 2003, SPU inspected and found numerous issues associated with high-risk pollution-generating activities. Sediments from an oil/water separator at the site contained phthalates, cadmium, and zinc concentrations above the sediment quality standard. Runoff from the western and southern edges of the property was observed to flow toward the Second Avenue South drainage system. Catch basins, sumps, and oil/water separators were subsequently cleaned. Storm drains along the western and southern ends of the Boyer Towing properties discharge to the Second Avenue South drainage system. Additional information is needed to assess whether activities at these parcels may pose a potential risk of sediment recontamination. Ongoing Source Control Plans: SPU will conduct a source control inspection at this facility to verify compliance with applicable regulations and BMPs and to verify the storm drainage pathway. If stormwater discharges to EAA-2, Ecology and SPU will evaluate the need for stormwater characterization and will review Boyer Towing’s Storm Water Pollution Prevention Plan to ensure that contaminant releases to sediment from stormwater are controlled. Ecology and SPU will continue periodic inspections. For Other Upland Properties: Several upland properties in addition to Boyer Towing may generate COCs and are potential sources of sediment recontamination via the stormwater drainage system. Ongoing Source Control Plans: No major sources have been revealed by recent investigations (e.g., business inspections or historical document review). However, recent basin reconnaissance does indicate new businesses began operating in the basin in the past few years. The SPU/ Ecology Business Inspection Program will continue.

Page 30 of 44
Figure 6: Map of Early Action Area 2 Ownership (from SCAP for EAA-2)
Page 31 of 44
SCWG – Other Agencies’ Source Control Work
Implementation of source control through SCWG collaboration has worked well. In addition to the type
of work described above, Seattle Public Utilities (SPU), King County, and the Port have also conducted
extensive work, some of which is briefly summarized below. For a comprehensive summary, see the
Status Reports, which are listed in Table 2 and posted on Ecology’s website.
Business Inspections and Joint Inspection Group for LDW
From 2003 to 2005, SPU and King County conducted a joint business inspection program in the Diagonal
Avenue S CSO/SD area to evaluate stormwater, industrial wastewater, spill containment, and hazardous
waste management practices at each site and to bring businesses into compliance with local code
requirements. During that time, 1,100 inspections were completed at approximately 625 businesses. In
2006, SPU took over the joint business inspection program and King County continued to inspect the
businesses in the LDW permitted under its Industrial Waste Program. The King County Industrial Waste
Program began in 1969 and has delegated authority from Ecology and EPA to regulate the discharge of
industrial wastewater to the sanitary sewer. In the LDW basin, the King County Industrial Waste Program
regulates over 25 industrial facilities through full waste discharge permits and over 140 lower-risk
facilities through some form of written discharge authorization. King County also provides technical
assistance to SPU inspectors as needed on issues related to industrial waste and hazardous waste. In 2010,
the City completed the first round of inspections at the approximately 1,275 high-risk pollution-
generating businesses operating in areas of the City that drain to the LDW. Between 2003 and 2012,
approximately 3,290 inspections have been completed at 1,414 businesses20 throughout the LDW
drainage basin.
The County also inspects businesses in unincorporated King County, tenants of county-owned parcels
within Seattle, and tenants at King County International Airport that drain to the Duwamish as required
under its Phase 1 NPDES municipal stormwater permit. In addition, King County and SPU participate in
Ecology’s Urban Waters Initiative to coordinate inspections and share information. Many tenants on Port
properties are subject to NPDES industrial stormwater permit requirements. The Port provides technical
guidance and support to its tenants to help them comply with their permits.
Through the LDW SCWG, a joint inspection group meets to coordinate on inspections that are believed to
be of interest to more than a single agency. Participants in this group include inspectors for various
programs at Ecology, EPA, Seattle, and King County and, on an as-needed basis, from Tukwila and the
Port of Seattle.
Hazardous Waste Management Programs
The Local Hazardous Waste Management Program, a coalition of local governments in King County,
provides outreach and support to households and small businesses regarding the proper handling of
hazardous waste. The program operates a household hazardous waste collection center at the South Park
transfer station. Other source control-related elements of the program include: (1) the Mercury-Reduction
Program, which strives to reduce the quantity of mercury in commercial products through outreach and
legislative activities; (2) EnviroStars Program, which recognizes and certifies businesses to provide
positive incentives for properly managing and reducing hazardous wastes; (3) Voucher Incentive
Program, which reimburses small quantity generator businesses half their costs, up to $500, for
implementing and permanently incorporating BMPs into their operations; and (4) Small Business Site
Visit and Technical Program, which provides no-cost technical assistance to businesses to develop

Page 32 of 44
Line Cleaning—An Important Part of Maintenance
Whether or not a specific source is found, SPU jets and cleans the storm drain/combined sewer lines and associated structures when inspections and source tracing have been finished. Since 2004, SPU has cleaned over 25,000 feet of storm drains in the LDW. A year or so after cleaning, SPU re-samples to determine whether there are ongoing sources in the drainage system. Repeat inspections and source tracing are initiated if warranted. This process is repeated periodically to verify that sources are controlled. King County and the Port have also begun cleaning structures (e.g., regulator structures, lines, and catch basins) based on source tracing data and re-sampling newly accumulated solids to determine whether there are ongoing sources in the combined sewer system.
Pending CSO Decision will Affect Source Control in the LDW
Recommendations placed before the King County Executive and County Council in 2012 are that, of the several capital improvement projects for CSO control across the county, treatment for the Brandon Street and South Michigan CSOs in the LDW be given top priority. The current proposal is to construct a 66-mgd primary treatment plant (chemically enhanced with lamella plates) at the regulator stations. A fact sheet and the entire County CSO plan are online at: http://www.kingcounty.gov/environment/wastewater/cso.aspx . Meanwhile, King County is implementing plans for additional sampling in the pipe and in sediments at/near the outfall to LDW. King County’s Industrial Waste Program is also re-evaluating chemical loading to the CSO for industrial contributors to the system.
hazardous waste handling programs, reduce waste, and become compliant with state and federal
regulations.
Drainage and Combined Sewer System Maintenance
SPU operates and maintains the City drainage
and wastewater systems. Catch basins in the
drainage system are inspected each year and
cleaned when the depth of sediment
accumulation in the sump is within 18 inches
of the lowest pipe entering or exiting the
structure or if the sump is more than 60
percent full, whichever is less. SPU has also
implemented a preventative maintenance
program in the wastewater collection system
to routinely inspect and clean/repair the
system. Inspection schedules are based on an
evaluation of critical system components to
ensure effective operation of the system. King
County also maintains catch basins and
oil/water separators at the King County
International Airport (KCIA). (See text box,
Line Cleaning—An Important Part of
Maintenance.)
Combined Sewer Overflow Control
Projects
King County and SPU have been working to
control the volume, frequency, and duration of
CSOs. King County’s estimated $100 million
in CSO control investments in the LDW have
resulted in decreased CSO volumes by 90
percent since 1988. Five of the eleven CSOs
are controlled and the county will begin the
estimated $170 million final CSO control
projects remaining in the LDW over the next
several years (as proposed in the 2013 CSO
Control Plan Update (see text box, Pending
CSO Decision). Since 1980 (the baseline for
City CSO modeling), the City has reduced the
annual citywide volume of CSOs by
approximately 75 percent. The Diagonal CSO
remains the only uncontrolled LDW City
CSO; however, SPU intends to construct
multiple storage tanks to control overflows at
that location.
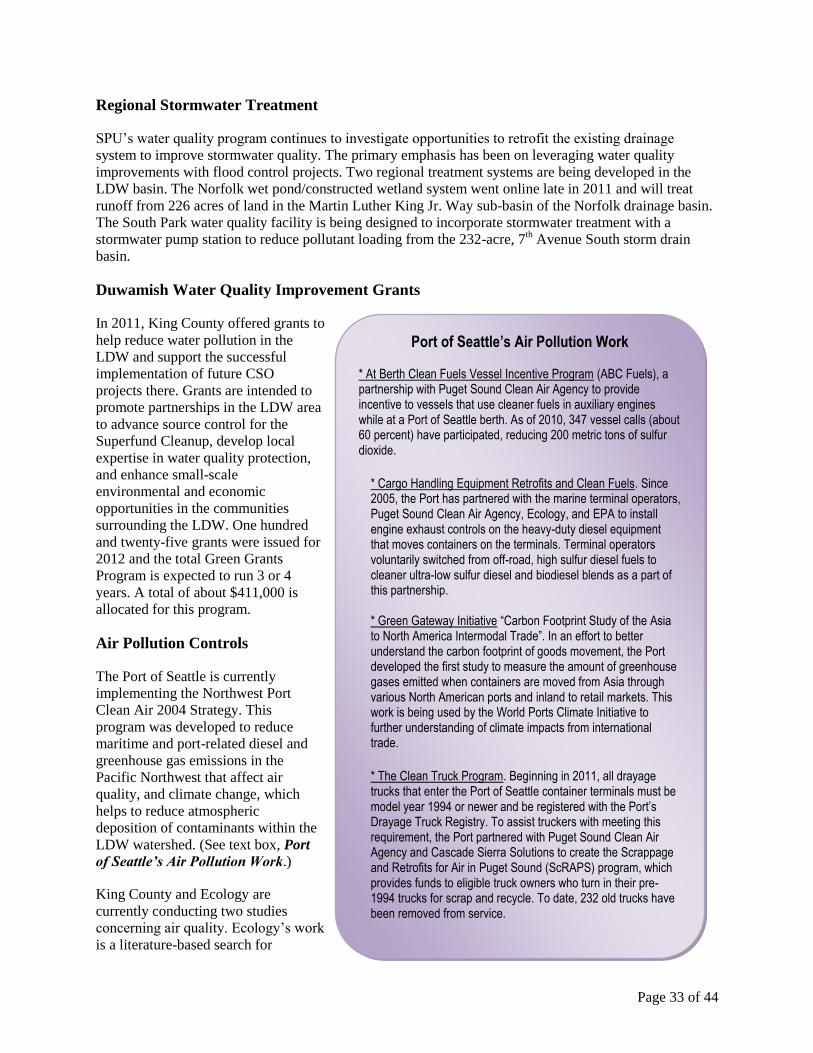
Page 33 of 44
Port of Seattle’s Air Pollution Work
* At Berth Clean Fuels Vessel Incentive Program (ABC Fuels), a partnership with Puget Sound Clean Air Agency to provide incentive to vessels that use cleaner fuels in auxiliary engines while at a Port of Seattle berth. As of 2010, 347 vessel calls (about 60 percent) have participated, reducing 200 metric tons of sulfur dioxide.
* Cargo Handling Equipment Retrofits and Clean Fuels. Since 2005, the Port has partnered with the marine terminal operators, Puget Sound Clean Air Agency, Ecology, and EPA to install engine exhaust controls on the heavy-duty diesel equipment that moves containers on the terminals. Terminal operators voluntarily switched from off-road, high sulfur diesel fuels to cleaner ultra-low sulfur diesel and biodiesel blends as a part of this partnership. * Green Gateway Initiative “Carbon Footprint Study of the Asia to North America Intermodal Trade”. In an effort to better understand the carbon footprint of goods movement, the Port developed the first study to measure the amount of greenhouse gases emitted when containers are moved from Asia through various North American ports and inland to retail markets. This work is being used by the World Ports Climate Initiative to further understanding of climate impacts from international trade.
* The Clean Truck Program. Beginning in 2011, all drayage trucks that enter the Port of Seattle container terminals must be model year 1994 or newer and be registered with the Port’s Drayage Truck Registry. To assist truckers with meeting this requirement, the Port partnered with Puget Sound Clean Air Agency and Cascade Sierra Solutions to create the Scrappage and Retrofits for Air in Puget Sound (ScRAPS) program, which provides funds to eligible truck owners who turn in their pre-1994 trucks for scrap and recycle. To date, 232 old trucks have been removed from service.
Regional Stormwater Treatment
SPU’s water quality program continues to investigate opportunities to retrofit the existing drainage
system to improve stormwater quality. The primary emphasis has been on leveraging water quality
improvements with flood control projects. Two regional treatment systems are being developed in the
LDW basin. The Norfolk wet pond/constructed wetland system went online late in 2011 and will treat
runoff from 226 acres of land in the Martin Luther King Jr. Way sub-basin of the Norfolk drainage basin.
The South Park water quality facility is being designed to incorporate stormwater treatment with a
stormwater pump station to reduce pollutant loading from the 232-acre, 7th Avenue South storm drain
basin.
Duwamish Water Quality Improvement Grants
In 2011, King County offered grants to
help reduce water pollution in the
LDW and support the successful
implementation of future CSO
projects there. Grants are intended to
promote partnerships in the LDW area
to advance source control for the
Superfund Cleanup, develop local
expertise in water quality protection,
and enhance small-scale
environmental and economic
opportunities in the communities
surrounding the LDW. One hundred
and twenty-five grants were issued for
2012 and the total Green Grants
Program is expected to run 3 or 4
years. A total of about $411,000 is
allocated for this program.
Air Pollution Controls
The Port of Seattle is currently
implementing the Northwest Port
Clean Air 2004 Strategy. This
program was developed to reduce
maritime and port-related diesel and
greenhouse gas emissions in the
Pacific Northwest that affect air
quality, and climate change, which
helps to reduce atmospheric
deposition of contaminants within the
LDW watershed. (See text box, Port
of Seattle’s Air Pollution Work.)
King County and Ecology are
currently conducting two studies
concerning air quality. Ecology’s work
is a literature-based search for
Page 34 of 44
information related to finding localized air source impacts on the waterway. It is aimed at determining
what data gaps need to be filled, what types of study or data are missing that would enable SCWG to
determine whether there are specific air sources that could be controlled and reduce recontamination
potential of the waterway.
King County’s Atmospheric Deposition Study compares the measurements of bulk deposition (dry
particulate and rainfall) in areas of different land use within the Green/Duwamish River Basin and
provides information to assist in understanding atmospheric sources to the Lower Duwamish Waterway.
The study collected samples at a total of six stations from July 2011 to October 2012. For each sampling
location, up to 25 samples were collected for metals, mercury, and PAHs and up to 10 samples were
collected for PCB congeners and dioxins/furans. The data report will be completed in 2013.
Street Sweeping
The City and County have active sweeping programs that cover portions of the LDW basin. Public rights-
of-way encompass approximately 25 percent of the total land area draining to the LDW. The City has
swept streets in Seattle since the turn of the century to control litter. In 2011, SPU and the Seattle
Department of Transportation modified the street sweeping program to improve pollutant removal
capabilities. Sweeping is conducted by Seattle Department of Transportation staff with funding for the
pollutant removal improvements provided by SPU. Modifications to the street sweeping program include
using high efficiency, regenerative air sweepers in areas served by separated storm drains, and reducing
sweeper speed to enhance particle pickup. In areas served by the separated drainage system that discharge
to the LDW, approximately 5 miles of roadway are swept on a weekly basis and 50 miles are swept every
other week. King County Department of Transportation sweeps roads in unincorporated King County,
and the King County International Airport also mechanically sweeps the flight lines and taxiways at the
airport on a regular basis.
Green River Input Studies
King County is conducting three studies in the Green River Basin: whole water, stream sediments, and
stream suspended solids. All three studies will provide information to assist in understanding upstream
sources to the Lower Duwamish Waterway.
The whole water study will make relative comparisons of PCBs, arsenic, and PAHs in the Green
River and its major tributaries. The study collected samples at upper and lower boundary
locations along the main stem of the Green River and from four major tributaries to the Green
River. Between September 2011 and October 2012, a total of 9 composite samples were collected
at each location: 3 dry season/base flow and 6 storm/wet season sampling events. The data report
will be completed in 2013.
The stream sediment study will characterize bulk sediment chemical concentrations in four
stream basins that drain to the Green River and four locations on the Green River to evaluate
sediment quality and to better understand the relative differences of sediment quality within
streams in the Green Basin. Approximately 40 composite samples were collected in August 2012
and analyzed for metals, mercury, PCBs, PAHs, and other organic compounds. These data as well
as previously collected stream sediments from three different Green River stream basins will be
summarized in a data report in 2013.
The Suspended Solids Study will make relative comparisons of PCBs, arsenic, dioxins/furans,
and PAHs associated with suspended solids in the Green River and its major tributaries. The

Page 35 of 44
study will use two types of collection methods at the same six locations being sampled for whole
water samples. One method (sediment trap) will collect suspended solids over a 2 to 3-month
period and the other method (using a filter bag) will collect suspended solids during storm events
(up to five per location) and one base flow event. Sampling will occur during 2013 and a data
report will be completed in 2014.
Brandon Basin Study
King County’s Brandon Basin Study will evaluate chemical input apportionment between
sanitary/wastewater (dry base flow), stormwater (storm), and infiltration/inflow (wet base flow). The
Brandon CSO is a priority for CSO control within the LDW. Combined sewer basins include inputs from
domestic wastewater, industrial wastewater, groundwater infiltration into combined sewer lines
(infiltration), and stormwater runoff (inflow). Stormwater runoff is being collected from streets, parking
lots, roof drains, and other impervious surfaces. The chemical input differences will be used to better
understand the general sources of chemicals within the combined sewer system (i.e., stormwater versus
wastewater). Three locations in the CSO basin were sampled in September 2011 for six dry baseflow
events, and between October 2011 and May 2012 for six wet base flow events and up to 15 storm events.
All of the samples were analyzed for metals, mercury, PAHs, and a subset for PCB and dioxin/furan
congeners. The data report will be completed in 2013.
Ecology-Conducted Studies with SCWG Assistance
Lateral Loading Study
The Lateral Loading Study monitored stormwater and storm solids to estimate the mass of contaminants
discharged from four drain systems contributing to the source area known as Diagonal/Duwamish
CSO/SD. This study showed the logistical difficulties and high cost of getting even a rough estimate of
contaminant loading. It also indicates that this type of sampling needs to be done for more than one year,
at least 2 to 3 years. The study results may, however, be compared with loading estimates developed in
other ways. The data collected and the challenges encountered in this study will be used to plan future
monitoring or modeling efforts.
Source Tracing Study
Source tracing involves sampling solids in storm drains and catch basins. This helps identify facilities
where there is historical, unidentified contamination, inadequate implementation of BMPs, and/or illegal
waste disposal. In-line sediment traps provide a general picture of the average contaminant concentrations
in a portion of the storm drain line. This can be used to prioritize inspections or conduct more focused
sampling in a drainage basin. The City of Seattle conducts source tracing and collects storm drain solids
samples from catch basins in LDW storm drain systems (see text box, Source Tracing FAQs).21
SPU
compiles these data, which the SCWG uses, along with data collected by King County and other parties,
to identify sources throughout the LDW drainage area. The discovery of PCBs in various building
materials such as paint and caulk at sites including Rainier Commons, Terminal 117, North Boeing
Field/Georgetown Steam Plant, and Boeing Plant2/Jorgensen Forge are examples of the value of source
tracing and other studies. Follow-up source control actions are either underway or complete at these sites.
In 2008, Ecology signed an interagency agreement with the City of Seattle to expand source tracing
sampling. As part of this agreement, SPU installed 20 additional sediment traps in the LDW study area,
including the KCIA and unincorporated King County. The work started under this agreement will
continue until June of 2013, at which time it may be renewed.

Page 36 of 44
Source Tracing FAQs What kinds of samples are used? A variety of sampling techniques are used. In most cases, sediment from the storm lines are preferred rather than whole water samples because sediment is more likely to contain the chemicals of concern. So, storm line sediments are expected to provide a more direct measure of potential contributions to waterway sediment concentrations. Sampling accumulated solids from key locations is also more cost effective than collecting stormwater samples. Are there different types of samples? What do they tell you? SPU uses three types of solids samples to track and identify contaminant sources in the LDW. The three types of samples represent different spatial scales and different kinds of sediment that can collect in different areas of the drainage/wastewater systems.
inline sediment trap or inline grab samples for basin or sub-basin scale (e.g., testing lateral lines for larger sub-areas of a drain)
catch basin grab samples for smaller areas generally less than ¼ acre How long has storm solids sampling been going on? How many samples are there? Ecology has provided funding over the past 3 years to expand SPU’s source tracing efforts. As of September 2011, SPU has installed 42 traps and collected 157 sediment trap samples; and collected 210 inline grab samples and 363 catch basin samples. More data are always being added but, as of January 2013, there are data from: 282 sediment traps, 343 catchbasin grabs, 201 inline grabs, and 11 soil samples. What do the storm solids samples show? Results indicate that while many chemicals are present in the samples, only a limited number of specific problem areas/hotspots have been identified (for PCBs, mercury, and high molecular weight PAHs). The primary exception to being found in a hotspot is phthalates, a class of chemicals known as plasticizers. Phthalates are found throughout the LDW at elevated concentrations. Is the water sampled too? Yes. King County and Seattle both sample wastewater. Industries with permits for discharge to the LDW are also required to sample their waste water. Is King County tracing sources too? How do they do it? Yes. On a periodic basis, King County samples wastewater at key locations in the combined sewer system to provide baseline data to evaluate contaminant contributions. This kind of source tracing is conducted when elevated levels of COCs are found through routine monitoring in King County CSO basins. From 2007 to 2010, King County collected 45 whole water samples to characterize CSO discharges within the Duwamish Basin and identify any basins that may have elevated contaminant concentrations that would need further source tracing. In 2010, King County expanded the source tracing investigations in the combined sewer system to support source control efforts in the LDW. These efforts include collection of in-line solids grabs and sediment trap samples from pipes and associated structures in CSO basins that discharge to the LDW. Currently four CSO basins are targeted for this work. Does King County look at stormwater too? Yes. In a CSO the “base flow” (when it isn’t raining hard enough to cause an overflow event from the sanitary system) is actually stormwater. King County is also collecting wastewater samples at three locations during base flow and storm flow conditions in the Brandon CSO system to evaluate potential differences in COCs from wastewater, infiltration and inflow, and stormwater contributions to the system. The goal is to identify potential sources of contaminants to the CSO system and aid in evaluating the potential for CSO discharges to recontaminate sediments following CSO control. King County also regularly collects stormwater samples at King County International Airport as required by its NPDES industrial stormwater permit and conducts source tracing as needed.

Page 37 of 44
Stormwater Sampling Logistics Lateral Loading Lessons
There are approximately 250 outfalls along the LDW shorelines. Of those, only 66 were large enough in diameter to install the sampling equipment (ISCO pumps) next to sediment traps for the Lateral Loading Study. Of those 66 pipes, only 20 sampling locations proved to be viable for sampling when surveyed in the field (e.g., not entirely submerged, near enough the end of pipe to represent all lateral connection to the outfall, far enough from the end-of-pipe to allow sampling without tidal influence). Of the 20 viable locations, only 15 were situated where staff could access the pipe during a 24-hour storm. Of those 15 locations, only four were actually accessible when considering things like security (gates, guards) and safety (e.g., confined space entry, police escort, traffic control). Ultimately there were four sample locations in this study. Two were not influenced by tides at all and it was possible to get water samples for the duration of each storm. The other two locations were tidally influenced and could only be sampled during a storm while the tide was out—at times it was only possible to sample 4 to 6 hours of a 24-hour storm event.
Accelerated Source Tracing Study
The Accelerated22 Source Tracing Study
compared various storm solids sampling
methods for identifying potential sources.
The goal was to determine if there are
significant differences among the various
methods with regard to the contaminants of
concern identified and the pros and cons of
each sample type. Overall, one type of
solids sampling method is not significantly
different than the other. This study also
demonstrated the logistical difficulties
associated with stormwater sampling, which
reduced the number of sample locations to 4
from the 250 outfalls along the LDW (see
text box, Stormwater Sampling Logistics).
This type of sampling would be more
informative if it could be conducted over a
longer period of time to see whether
different types of sample methods bias data
high or low for a given contaminant. This
information will be used in planning future
source tracing and monitoring efforts.
PCB Building Material Study
The PCB Building Material Study attempted to determine the relationship between elevated levels of
PCBs in specific storm drains and PCBs in paint and caulking materials. The limited number of property
owners that allowed sampling prevented such an analysis; however, the study did find PCBs are common
in building materials and are a potential source for PCBs found in LDW sediments. The summary report
for the study results was issued in June 2011 and is helping plan future sampling to determine the
relationship of building materials (e.g., paints, caulking) to catch basin sediment concentrations, and to
define specific areas for focused source tracing investigations and source control.
Outfall Study
The Outfall Study sampled sediments in areas of the LDW where data near outfalls of possible sources
were limited or non-existent and updated the inventory of outfalls. The objective of the study was to
catalog the following:
Information on NPDES discharges associated with each outfall sampled in the study,
The available data for each drainage sub-basin sampled in the study,
The data collected by SPU (e.g., source tracing) for the entire LDW drainage, and
Sediment data collected within 100 feet for the LDW RI Report.
The December 2011 Outfall Study report indicates that some of the objectives were not met. For instance,
most facilities have more than one pipe discharging to the waterway, yet the initial industrial stormwater
general permit did not specify that all pipes needed to be monitored or that the monitored pipe needed to
be marked on the map in the Stormwater Pollution Prevention Plan. As a result, it was often difficult to
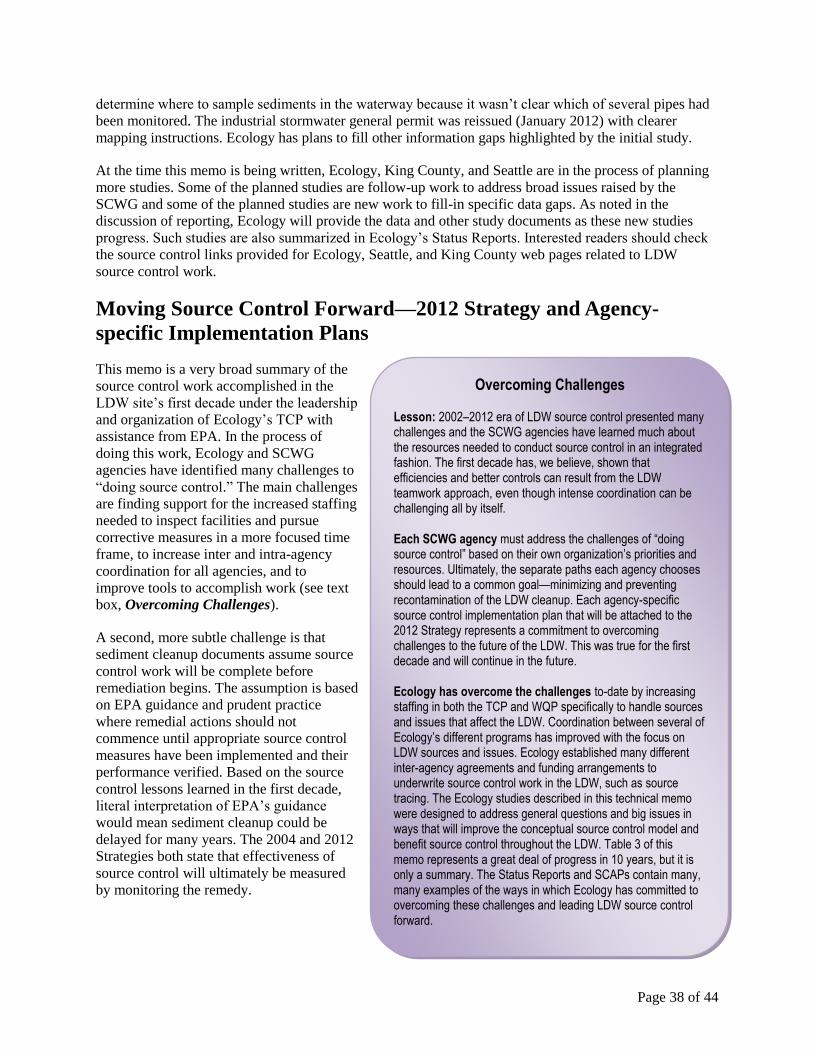
Page 38 of 44
Overcoming Challenges
Lesson: 2002–2012 era of LDW source control presented many challenges and the SCWG agencies have learned much about the resources needed to conduct source control in an integrated fashion. The first decade has, we believe, shown that efficiencies and better controls can result from the LDW teamwork approach, even though intense coordination can be challenging all by itself. Each SCWG agency must address the challenges of “doing source control” based on their own organization’s priorities and resources. Ultimately, the separate paths each agency chooses should lead to a common goal—minimizing and preventing recontamination of the LDW cleanup. Each agency-specific source control implementation plan that will be attached to the 2012 Strategy represents a commitment to overcoming challenges to the future of the LDW. This was true for the first decade and will continue in the future. Ecology has overcome the challenges to-date by increasing staffing in both the TCP and WQP specifically to handle sources and issues that affect the LDW. Coordination between several of Ecology’s different programs has improved with the focus on LDW sources and issues. Ecology established many different inter-agency agreements and funding arrangements to underwrite source control work in the LDW, such as source tracing. The Ecology studies described in this technical memo were designed to address general questions and big issues in ways that will improve the conceptual source control model and benefit source control throughout the LDW. Table 3 of this memo represents a great deal of progress in 10 years, but it is only a summary. The Status Reports and SCAPs contain many, many examples of the ways in which Ecology has committed to overcoming these challenges and leading LDW source control forward.
determine where to sample sediments in the waterway because it wasn’t clear which of several pipes had
been monitored. The industrial stormwater general permit was reissued (January 2012) with clearer
mapping instructions. Ecology has plans to fill other information gaps highlighted by the initial study.
At the time this memo is being written, Ecology, King County, and Seattle are in the process of planning
more studies. Some of the planned studies are follow-up work to address broad issues raised by the
SCWG and some of the planned studies are new work to fill-in specific data gaps. As noted in the
discussion of reporting, Ecology will provide the data and other study documents as these new studies
progress. Such studies are also summarized in Ecology’s Status Reports. Interested readers should check
the source control links provided for Ecology, Seattle, and King County web pages related to LDW
source control work.
Moving Source Control Forward—2012 Strategy and Agency-
specific Implementation Plans
This memo is a very broad summary of the
source control work accomplished in the
LDW site’s first decade under the leadership
and organization of Ecology’s TCP with
assistance from EPA. In the process of
doing this work, Ecology and SCWG
agencies have identified many challenges to
“doing source control.” The main challenges
are finding support for the increased staffing
needed to inspect facilities and pursue
corrective measures in a more focused time
frame, to increase inter and intra-agency
coordination for all agencies, and to
improve tools to accomplish work (see text
box, Overcoming Challenges).
A second, more subtle challenge is that
sediment cleanup documents assume source
control work will be complete before
remediation begins. The assumption is based
on EPA guidance and prudent practice
where remedial actions should not
commence until appropriate source control
measures have been implemented and their
performance verified. Based on the source
control lessons learned in the first decade,
literal interpretation of EPA’s guidance
would mean sediment cleanup could be
delayed for many years. The 2004 and 2012
Strategies both state that effectiveness of
source control will ultimately be measured
by monitoring the remedy.
Page 39 of 44
Contrast and Coordinate—Monitoring for Remedy and Source Control
The conversation about monitoring the remedy and monitoring for source control effectiveness will have to address some difficult issues, since the remedy and source control are closely linked.
1. Source control addresses a wider suite of chemicals in sediments and the water column than the RI/FS, as noted in this memo. Consequently, monitoring in the LDW will have to address source control COCs, not just the contaminants indicating risk in sediments.
2. LDW water and sediments that make up the receiving
environment are dynamic, and it is entirely possible that any sediment area will be affected by sources entering the river from upstream or downstream. Known and high-priority sources to the site should be monitored where they enter the site, regardless of whether or not the sediments in that area are being addressed by cleanup.
3. Data from source control monitoring (i.e., at the sources
and in the LDW water column and sediments) should be evaluated with water and sediment quality standards, as well as with LDW cleanup values and goals. The FS and Proposed Plan discuss cleanup goals on a “site-wide average” for approximately 500 acres; unfortunately, this concept does not conform to the reality of source control where the focus is on the many, many individual sources/ pathways in a 20,400 acre source area. Monitoring for source control effectiveness must encompass the entire waterway, not just the approximately 150 acres proposed for active cleanup or the 200+ acres proposed for forms of natural recovery.
4. Long-term monitoring plans for sediment cleanups tend to
measure progress in annual or even 2 to 3-year increments of time. Depending on the types of sources, additional sampling (e.g., at the ends-of-pipes, seeps, banks) may be needed on a more frequent basis (e.g., quarterly, biannually) and combined with in-waterway data before any useful determinations can be made about source control effectiveness or recontamination trends in the receiving environment.
The Contrast and Coordinate Monitoring
text box outlines four of the key
discussions facing EPA and Ecology as
the time to conduct and monitor cleanups
approaches.
The reality is that current levels of source
control will only reduce the risks of
recontamination. EPA and Ecology
anticipate that recontamination will be
localized, have different contaminant
signatures from pre-cleanup conditions,
and that concentrations of risk driver
COCs will be lower than those seen before
cleanup. The entire LDW site needs to be
monitored to determine how effective
source control is and where source inputs
can be reduced. The agencies also expect
that source control technologies will
continue to improve in the long term and
should lessen the impact of
recontamination.
Ecology and EPA have learned that,
although Ecology’s source control
leadership is based on the MOU between
cleanup programs at the two agencies,
source control success relies on all levels
of local, state, and federal environmental
programs working to control any or all of
the three parts of a source to LDW
sediments (i.e., contaminant, media,
pathway). Source control on a large scale
like the LDW (i.e., 32-square mile sub-set
of 490-square mile Green-Duwamish
watershed) requires institutions and
regulations to be flexible since source
control is not mandated by any one
environmental statute or subject to the
jurisdiction of a single agency. The work
and coordination of source control is
complicated because watersheds follow
drainage, not political or regulatory lines
of jurisdiction. To help address this, the
2012 Strategy is fashioned to provide a
broad organizing plan for all of the SCWG agencies and Ecology has called upon all of the separate
agencies to write source control implementation plans. As each agency completes its plan, it will be added
to the 2012 Strategy. Ecology and EPA are currently developing their agency-specific implementations
plans, as are Seattle and King County. EPA and Ecology plan to finalize their implementation plans by
the time EPA issues the Record of Decision for the LDW cleanup. At this point in time, schedules for
Seattle and King County to finalize their implementation plans are not certain.

Page 40 of 44
Ecology will propose the 2012 Strategy for public review and comments with EPA’s publication of the
Proposed Plan for sediment cleanup. The 2012 Strategy, combined with agency-specific source control
implementation plans, is vital to providing for effective source control and maintaining the LDW
sediment cleanups. The 2012 Strategy explains that, at a minimum, agency-specific implementation plans
should do the following:
Describe how each agency will conduct its various programs to address source control work for
the LDW source area.
Set their agency’s priorities for source control on both a near term (5 years) and long-term (after
sediment cleanup).
Emphasize coordination at two levels:
o inter-departmental coordination with the agency
o inter-agency coordination with the SCWG as a focal point
The 2012 Strategy is based on the expectation that each agency’s implementation plan will reflect their
regulatory obligations (e.g., NPDES permits, orders), business inspections, implementation and
enforcement of local codes and regulations, and other existing programs related to source control.
Ecology is preparing its own source control implementation plan which will detail the specific actions
required by Ecology to continue addressing the SCAPs action item lists, and administering discharge
permits, inspections and enforcement, MTCA site cleanups, and long-term monitoring.
EPA’s implementation plan will detail actions based on the agency’s broad roles in coordinating,
implementing, and participating in controlling sources to the LDW. These roles are the shared
responsibility for the EPA Region 10’s Office of Environmental Cleanup; Office of Air, Waste, and
Toxics; Office of Enforcement; and Office of Water.
The 2012 Strategy expands the 2004 Strategy based on the lessons-learned and the challenges and issues
identified since 2004. Source control is complex and actually occurs within agencies as well as in the field
at sites. The regulatory tools used for source control rarely overlap perfectly with the more modern
concerns of source control for the LDW. The agencies conducting source control require resources to
implement it and ensure it is done efficiently and effectively. Integrated management of sources requires
coordination and adds time to the processes. Source-specific actions, and the technical difficulties
associated with them, are often not in the control of any one agency or program. Source control in the
LDW requires federal, state, and local agencies to adapt according to what is known, the regulatory tools
that are available, and which of those will work best in a given situation in order to proceed. For all of
these basic reasons, the agencies must unequivocally commit to working together to control sources and
minimize recontamination potential.
Attachments
1. Quick Reference and Acronym List
2. End Notes
3. Figure 1: Timeline of Environmental Regulations and Events that Shaped Source Control at LDW

Page 41 of 44
Quick Reference and Acronym List
for Terms Relevant to LDW Source Control 2002–2012
Acronym or
Term Meaning or Use in this Memo
AO Administrative Order (legal document issued under some regulatory authorities)
AOC Administrative Order on Consent (legal document issued under some regulatory authorities)
BEHP bis(2-ethylhexyl)phthalate
BMP best management practice
CAP Cleanup Action Plan
CERCLA Comprehensive Environmental Response, Compensation and Liability Act (also referred to as
Superfund)
COC chemical of concern (term is used differently for source control than for the sediment RI/FS)
County King County (includes departments for stormwater, sanitary wastewater treatment plants, industrial
waste management [contributions to sanitary system], CSOs, and King County International Airport)
cPAH carcinogenic polycyclic aromatic hydrocarbon (a 7 PAH sub-set of the larger class of PAH chemicals)
CSO Combined Sewer Overflow (refers to collection of sanitary wastewater and stormwater that flows to a
wastewater treatment facility. An “overflow” or direct discharge to the LDW occurs when heavy
rainfall exceeds capacity of the collection system.)
CWA Clean Water Act
Data Gaps Existing Information and Data Gaps reports or equivalent (Ecology documents; see notes for Table 2)
DDT dichlorodiphenyltrichloroethane (chlorinated pesticide)
DIG Duwamish Inspection Group (includes representatives from different programs in Seattle, King
County, Ecology, and EPA)
EAA Early Action Area
Ecology Washington State Department of Ecology
EPA Environmental Protection Agency
FS Feasibility Study (Superfund reference to feasibility study of cleanup scenarios for the LDW)
HWTR Hazardous Waste Treatment and Reduction (program managing Ecology's RCRA authorities)
KCIA King County International Airport (one of departments representing King County on the SCWG)
LDW Lower Duwamish Waterway (Superfund/MTCA site)
LDWG Lower Duwamish Waterway Group (consists of representatives from Seattle, Port of Seattle, King
County, and The Boeing Company. Group worked with EPA and Ecology under a joint order for the
LDW sediment RI and FS)
MOU Memorandum of Understanding (refers to the 2002 agreement between EPA and Ecology for
management of LDW and sources to it. Reference also includes the 2004 revision of the agreement.)
MTCA Model Toxics Control Act (state regulatory program managed by Ecology's Toxics Control Program)
NPDES National Pollutant Discharge Elimination System (in Washington the federal program has been
delegated and is managed by Ecology's Water Quality Program)
NPL National Priorities List (where Superfund sites are officially listed)
PAH polycyclic aromatic hydrocarbon (a class of contaminants or pollutants)
PCB polychlorinated biphenyl
Port Port of Seattle
RCRA Resource Conservation and Recovery Act (commonly used in reference to state or federal hazardous
waste management program. Ecology's RCRA authority is managed by the Hazardous Waste and
Toxics Reduction program while EPA Region 10's RCRA authorities are managed by the Office of
Air, Waste and Toxics)
RCW Revised Code of Washington
RI Remedial Investigation (Superfund reference to remedial investigation of the LDW)
RM river mile
ROD Record of Decision
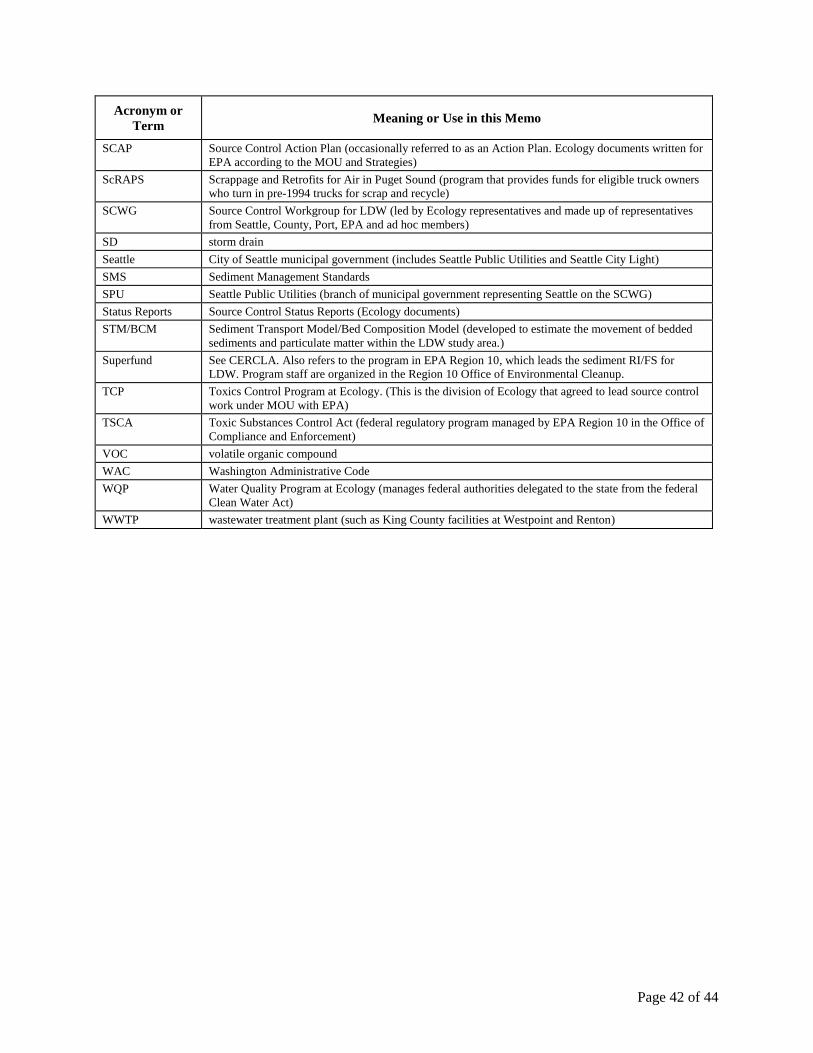
Page 42 of 44
Acronym or
Term Meaning or Use in this Memo
SCAP Source Control Action Plan (occasionally referred to as an Action Plan. Ecology documents written for
EPA according to the MOU and Strategies)
ScRAPS Scrappage and Retrofits for Air in Puget Sound (program that provides funds for eligible truck owners
who turn in pre-1994 trucks for scrap and recycle)
SCWG Source Control Workgroup for LDW (led by Ecology representatives and made up of representatives
from Seattle, County, Port, EPA and ad hoc members)
SD storm drain
Seattle City of Seattle municipal government (includes Seattle Public Utilities and Seattle City Light)
SMS Sediment Management Standards
SPU Seattle Public Utilities (branch of municipal government representing Seattle on the SCWG)
Status Reports Source Control Status Reports (Ecology documents)
STM/BCM Sediment Transport Model/Bed Composition Model (developed to estimate the movement of bedded
sediments and particulate matter within the LDW study area.)
Superfund See CERCLA. Also refers to the program in EPA Region 10, which leads the sediment RI/FS for
LDW. Program staff are organized in the Region 10 Office of Environmental Cleanup.
TCP Toxics Control Program at Ecology. (This is the division of Ecology that agreed to lead source control
work under MOU with EPA)
TSCA Toxic Substances Control Act (federal regulatory program managed by EPA Region 10 in the Office of
Compliance and Enforcement)
VOC volatile organic compound
WAC Washington Administrative Code
WQP Water Quality Program at Ecology (manages federal authorities delegated to the state from the federal
Clean Water Act)
WWTP wastewater treatment plant (such as King County facilities at Westpoint and Renton)
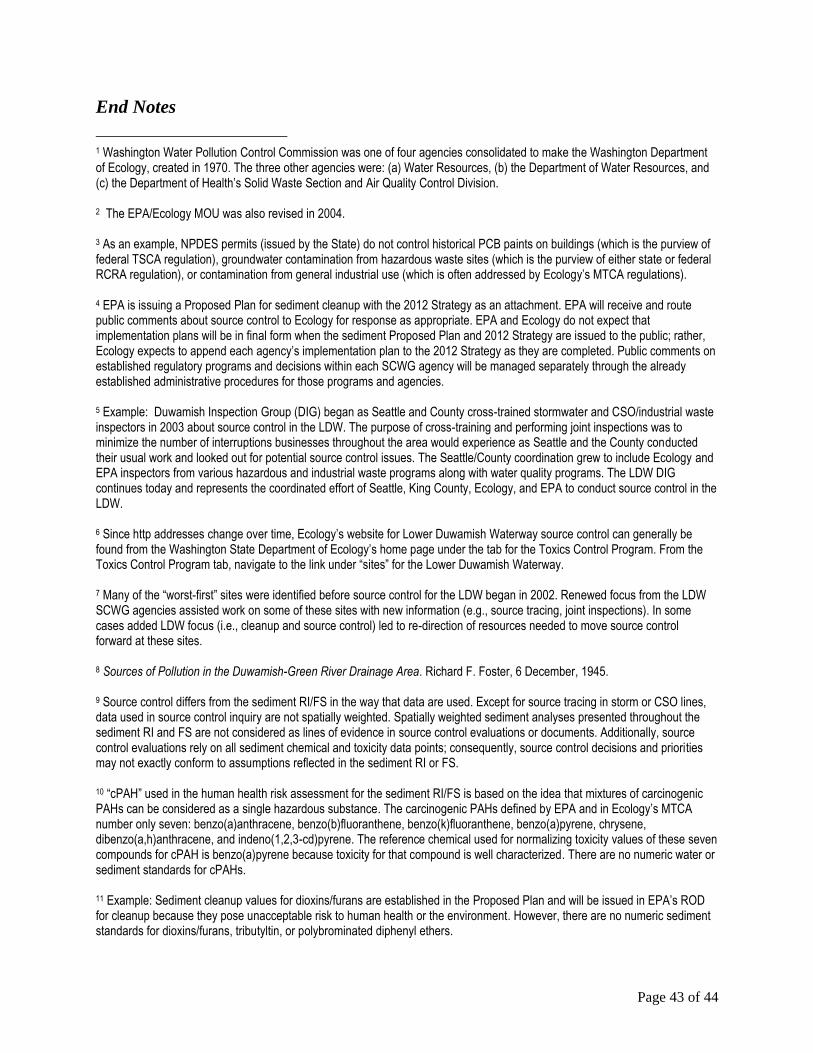
Page 43 of 44
End Notes
1 Washington Water Pollution Control Commission was one of four agencies consolidated to make the Washington Department of Ecology, created in 1970. The three other agencies were: (a) Water Resources, (b) the Department of Water Resources, and (c) the Department of Health’s Solid Waste Section and Air Quality Control Division. 2 The EPA/Ecology MOU was also revised in 2004. 3 As an example, NPDES permits (issued by the State) do not control historical PCB paints on buildings (which is the purview of federal TSCA regulation), groundwater contamination from hazardous waste sites (which is the purview of either state or federal RCRA regulation), or contamination from general industrial use (which is often addressed by Ecology’s MTCA regulations). 4 EPA is issuing a Proposed Plan for sediment cleanup with the 2012 Strategy as an attachment. EPA will receive and route public comments about source control to Ecology for response as appropriate. EPA and Ecology do not expect that implementation plans will be in final form when the sediment Proposed Plan and 2012 Strategy are issued to the public; rather, Ecology expects to append each agency’s implementation plan to the 2012 Strategy as they are completed. Public comments on established regulatory programs and decisions within each SCWG agency will be managed separately through the already established administrative procedures for those programs and agencies. 5 Example: Duwamish Inspection Group (DIG) began as Seattle and County cross-trained stormwater and CSO/industrial waste inspectors in 2003 about source control in the LDW. The purpose of cross-training and performing joint inspections was to minimize the number of interruptions businesses throughout the area would experience as Seattle and the County conducted their usual work and looked out for potential source control issues. The Seattle/County coordination grew to include Ecology and EPA inspectors from various hazardous and industrial waste programs along with water quality programs. The LDW DIG continues today and represents the coordinated effort of Seattle, King County, Ecology, and EPA to conduct source control in the LDW. 6 Since http addresses change over time, Ecology’s website for Lower Duwamish Waterway source control can generally be found from the Washington State Department of Ecology’s home page under the tab for the Toxics Control Program. From the Toxics Control Program tab, navigate to the link under “sites” for the Lower Duwamish Waterway. 7 Many of the “worst-first” sites were identified before source control for the LDW began in 2002. Renewed focus from the LDW SCWG agencies assisted work on some of these sites with new information (e.g., source tracing, joint inspections). In some cases added LDW focus (i.e., cleanup and source control) led to re-direction of resources needed to move source control forward at these sites. 8 Sources of Pollution in the Duwamish-Green River Drainage Area. Richard F. Foster, 6 December, 1945. 9 Source control differs from the sediment RI/FS in the way that data are used. Except for source tracing in storm or CSO lines, data used in source control inquiry are not spatially weighted. Spatially weighted sediment analyses presented throughout the sediment RI and FS are not considered as lines of evidence in source control evaluations or documents. Additionally, source control evaluations rely on all sediment chemical and toxicity data points; consequently, source control decisions and priorities may not exactly conform to assumptions reflected in the sediment RI or FS. 10 “cPAH” used in the human health risk assessment for the sediment RI/FS is based on the idea that mixtures of carcinogenic PAHs can be considered as a single hazardous substance. The carcinogenic PAHs defined by EPA and in Ecology’s MTCA number only seven: benzo(a)anthracene, benzo(b)fluoranthene, benzo(k)fluoranthene, benzo(a)pyrene, chrysene, dibenzo(a,h)anthracene, and indeno(1,2,3-cd)pyrene. The reference chemical used for normalizing toxicity values of these seven compounds for cPAH is benzo(a)pyrene because toxicity for that compound is well characterized. There are no numeric water or sediment standards for cPAHs. 11 Example: Sediment cleanup values for dioxins/furans are established in the Proposed Plan and will be issued in EPA’s ROD for cleanup because they pose unacceptable risk to human health or the environment. However, there are no numeric sediment standards for dioxins/furans, tributyltin, or polybrominated diphenyl ethers.

Page 44 of 44
12 Sediment Transport Model (STM) and Bed Composition Model (BCM) are mass movement models designed to show solids transport through the waterway from the upstream of the study area to Elliott Bay. The models were also designed to show areas of deposition and erosion within the waterway and along its length. 13 Examples include the following. (1) NPDES permits have not required effluent sampling for contaminants found in sediments, nor have the permits required monitoring of sediments or stormwater solids at all. (2) Soil and groundwater monitoring designed and conducted for underground storage tank removal typically assess total petroleum hydrocarbons, but not the specific PAH chemicals for which water and sediment quality standards exist. These monitoring projects also did not typically look at groundwater pathways to nearby surface waters such as the LDW, such as infiltration to storm drains. 14 Most regulatory orders are not developed or implemented quickly, especially when the regulation being used for the order involves any sort of negotiation. Additionally, some types of regulatory orders or decisions include a public information or involvement process, which typically runs 15 to 30 days or longer, depending on the agency and regulation. One example would be specific monitoring requirements related to a project being done in navigable waters under an Army Corps of Engineers application and permit for which the public review period is 15 days. Other examples are the three points of time in the MTCA process where 30-day public reviews for comment are mandated (i.e., at the start of negotiating an order, for the final RI/FS stage, and for the Final Cleanup Plan). 15 In source control work in the LDW, “upland” generally refers to an area or specific source that is not located adjacent to the river but which may have a pathway to it. Common examples include direct discharge (e.g., pipe extending from property to the river bank such as King County Airport), discharge or release to municipal conveyances that reach the river (e.g., via stormwater discharge or combined sewer overflow line such as Diagonal/Duwamish Avenue SD/CSO), or groundwater contamination that either flows to the river or infiltrates stormwater lines discharging to the river. 16 The Clean Air Act is an example of how different regulations may not require monitoring or generate data source control chemicals of concern. The source control issue is that many of the chemicals that accumulate in sediments causing benthic impacts or adding to human health risk arrive in the water via stormwater but they are released to the environment as air emissions. The Clean Air Act requires monitoring for air toxics on the basis of human health risk by inhalation, not for toxics that deposit on hard surfaces, runoff to sediments, and then impact human health. Similar discrepancies occur between NPDES permits, which may require monitoring for “typical” water quality or stormwater pollutants but not for specific PAHs, metals, or other contaminants that are present in sediments and require cleanup. 17 Notable sources identified by source tracing in the past include Rainier Commons LLC and a 20-acre portion of North Boeing Field (both for PCBs). In 2011–2012, SPU confirmed identification of seven new hotspots for PCBs, four hotspots for mercury, and three hotspots for high molecular weight PAHs. SPU’s Beth Schmoyer presented this recent information to stakeholders in a public presentation about LDW source control on December 6, 2012. 18 Ecology’s Confirmed and Suspected Contaminated Sites list. 19 In chemical nomenclature, perchloroethylene is also known as tetrachloroethylene. Breaks down to vinyl chloride. 20 Information from the December 6, 2012, public presentation about source control by Seattle Public Utilities to LDW stakeholders. Slide presentation by Beth Schmoyer, SPU. 21 Other parties, such as The Boeing Company and the Port of Seattle, also collect source tracing samples at their sites. 22 In this study, “accelerated” is different from typical source tracing for two reasons. First, this was a study of sampling methods, not sites. Second, the samples at four locations were taken during the same storms with the same kind of equipment at each site; this rarely happens when actual forensic source tracing is being done.

1940s
& '50s
•Older Authorities & Events
•1945 State Washington Water Pollution Control Board Report mention businesses along river still existing 2002 & 2012
•1948: Federal Water Pollution Control Act issued
•1948 & 1952: Air quality fatalities in Donora, Pennsylvania and London, England incite studies leading to development of air regulations
1960s
•Begin to See New Authorities
•1963: Clean Air Act issued to fund air quality studies (federal)
•1965: Solid Waste Disposal Act (later revised by RCRA) (federal)
1970s
• New Agencies & Authorities Appear
•1970: Clean Air Act revised & issued to regulate air sources studied previously (federal)
•1970: Environmental Protection Agency created (federal)
•1970: Washington Department of Ecology created (state)
•1972: Clean Water Act revisions issued to Federal Water Pollution Control Act (also revised 1981 & 1987) (federal)
•1974: Safe Drinking Water Act passed (federal)
•1976: Resource Conservation & Recovery Act revisions issued to Solid Waste Disposal Act (federal)
•1976: Toxic Substances Control Act signed (federal)
1980s
•More New Laws Added
•1980: Superfund created (federal)
•1987: Washington Cleanup Law (state)
•1987: National Estuary Program begins with Clean Water Act revisions
•1988: Ocean dumping banned for sewage sludge & industrial waste (federal)
•1989: Model Toxics Control Act voted in (state)
1990s
•Current Generation of Amendments & Programs Appear
•1990: Model Toxics Control Act rules issued (state)
•1990: Stormwater rule revised per 1987 Clean Water Act amendment (federal)
•1990: Toxics Release Inventory for communities (federal)
•1990: Pollution Prevention Act signed - importance of preventing, not just correcting, environmental damage (federal)
•1994: Brownfields Program launched (federal)
•1998: Clean Water Action Plan signed - aimed at fishable & swimmable goals (federal)
2000s
& 2010s
• LDW SOURCE CONTROL MILESTONES •2002: LDW MOA between EPA & Ecology splits leadership on RI/FS & Source Control
•2002: LDW first source control work group meeting
•2003: Independent PCB removals & stormwater source control in Dallas Ave (T117) (Seattle)
•2003 -'09: LDW Early Action decisions & removals at T117 (federal/Seattle & Port)
•2004: LDW Source Control Strategy issued (state)
•2004: LDW Early Action cleanup at Slip 4 delayed based on source control new information
•2004-2012: Source Control Action Plans issued for 20 source control areas, along with Existing Information & Data Gaps Reports
•2004-2012: 6 comprehensive Source Control Status Reports issued
•2013: LDW sediment Proposed Plan for remedy & Revised Source Control Strategy issued (February)
•2013: Reports for last 4 source control areas anticipated June 30, 2013
•2013: Source Control Status Report for 2012 anticipated June 30, 2013
• 2002-2013 TOTALS of SOURCE CONTROL ACTIONS • Ecology: 5 site investigations conducted, 13 MTCA Orders issued, 5 Hazardous Waste orders, 5 Voluntary MTCA cleanups, about 500 combined hazardous waste/water quality inspections (33 notices of violation, 4 water quality orders, 4 penalties), source control reporting per MOA
•EPA: 8 facilities being managed under RCRA or CERCLA for source control
•SPU & KC: 2500 inspections at 1300 businesses, about 850 sediment samples from storm & CSO lines, stormwater & CSO treatment pilots run, hotspots for PAH, PCB, mercury found, Seattle 42 sediment traps deployed for source tracing
• Multiple studies (not site-specific) conducted by Ecology, King County, Seattle
Along the Duwamish – Industrialization starts 1890s. Boeing
facilities, rendering plant, plywood glue, pesticides & other chemical mfg, glass manufacture, rail & marine transportation, cooperage, shipyards, landfills, glass mfg, wood treating, brick mfg, concrete mfg, 1906: Georgetown Steam Plant built 1913: River channelization started. Filling of old channels & mudflats continued late into 1970s. 1929: PCBs invented and begin wide use for thermal properties – carried in oils, added to various building materials, waste oils commonly used for dust suppression 1930s to 1945: WW2 Military development & support – drum recycling, ship building/breaking, foundries, concrete & aggregate, marine & rail shipping, gas mask filter mfg, de-tinning, fuel storage/transport, 1945 – Present: Aeronautics & aerospace industrial focus continues, military presence reduced but support industrialization remains with shifted focus
In Puget Sound - Commencement Bay Superfund Site listed
1983 and sediment ROD issued 1989 1979-1983: METRO gets grant to inventory pollution in Duwamish. 1980-1985: Ecology creates Urban Bay Action Teams. 1981: METRO receives pretreatment authority for industrial wastes. 1984: METRO Toxicant Pretreatment Study – results cause METRO, EPA & Ecology to form Elliott Bay Toxics Action Team.
LDW Superfund Milestones 1999: LDW study accumulated pollutants = health & environmental risks (federal) 2000: LDW joint order with parties (federal & state) 2001: LDW listed on NPL (federal) 2001 - '10: LDW sediment RI conducted & reports written/issued (federal/state) 2002: LDW listed as state site 2003: LDW sediment EAA Diagonal/Duwamish CSO/SD dredged & capped (federal/King County) 2005: LDW additional cleanup next to Norfolk CSO/SD area (state/Boeing) 2010: Final RI issued (federal) 2012: LDW Feasibility Study issued 2012: LDW EAA Slip 4 dredged & capped 2013: LDW Proposed Plan issued (2012 Strategy attached)
In Puget Sound & On LDW 1992: Ecology issues Commencement Bay source control strategy 1995: Ecology issued 1
st Phase 1 Municipal Stormwater
General NPDES permit – applied to Tacoma, Seattle, King County, Ports and State Department of Transportation 1999: LDW sediment area Norfolk CSO/SD dredged & capped (federal/King County NRDA)
Figure 1: Timeline of Environmental Regulations & Events that Shaped Source Control At LDW
In the US - DDT banned 1972; PCB phase out
starts 1976; Love Canal 1978; Three Mile Island 1979; Times Beach (dioxin) 1982; Chesapeake Bay cleanups start (sewage, agricultural runoff, stormwater) 1983; CFCs phased out 1987 .
In Puget Sound & for the LDW 2003: Commencement Bay last source control milestones complete for all problem areas in the ROD 2007: State legislature funds Urban Waters Initiative – Lower Duwamish, Spokane River & Commencement Bay designated priorities 2007: Ecology issued 2
nd Phase 1 Municipal Stormwater
General NPDES permit.