this paper includes details on how pay changed in 2010/11, how investors reacted in the 2011...
TRANSCRIPT

www.haygroup.co.uk
This paper includes details on how pay changed in 2010/11, how investors reacted in the 2011 reporting season, what we might expect to happen in the next reporting season and what you should do to put you and your organisation in the best possible place.
Executive reward:Review of the year 2011
your nextWhat’s
move?


Change, change and more change?Executive reward continues to be society’s anathema. With executive salaries starting to move again and with bonus payments at historical highs, it is no wonder the subject continues to grab the headlines.
Over the past year we have seen unprecedented regulatory movement and consultations, albeit often driven by real and perceived shortcomings in the financial services sector. The alphabet soup of interested parties has included the FSA, the EU, BIS and the ABI, which has carried out the most significant rewrite of its guidelines for many years.
This environment has implications not only for executive reward, but also for wider corporate governance. Whilst investors continue to be concerned about the overall quantum of executive reward and the performance required to obtain it, they are becoming increasingly interested in the process around how it is determined. Investors are demanding that companies explain clearly what their executive reward is for, and how it is achieved.
Over the year we have seen some companies taking a revised approach to their executive reward, internally reviewing and externally testing their policy and going beyond the normal, market-focused ‘review’.
We believe that further change is inevitable and that the conditions have never been better for companies to break free from the tried and tested remuneration mould.
Peter BorehamUK head of executive remuneration, Hay Group
What’s your next move?4
©2011 Hay Group. All rights reserved
What happened in 2010/11
SalaryAfter modest increases in 2010, salary increases were more prevalent in 2011 hinting that the ‘freeze’ has started to thaw. According to our salary databases the increases in the FTSE 350 have been between three and four per cent for executive directors, and between two and five per cent for the executive population. These figures reflect many companies’ continued desire to show relative restraint in uncertain economic times; however, they are slightly higher than typical increased budgets for other employees. As in 2010, there was some variation by sector, as businesses recovered from the downturn at differing rates.
Annual bonusShort-term incentive payout levels (paid in 2011 for 2010 performance) were up on average on last year’s levels by 10-20 per cent for the executive population, despite continued economic uncertainty. As a result, bonuses are now at historically high levels.
These figures raise questions about appropriate target setting – in the most recent financial year, 80 per cent of executive directors in the FTSE 60 beat their targets. (Looking more broadly, over the last ten years, bonus plans in the FTSE 350 for executive directors have paid out on average between 70 and 80 per cent of the notional maximum level, and around 85 per cent of maximum in the most recent financial year.) In this context, there is a need for remuneration committees to ensure that targets are robust, budgets are challenging and that close to maximum payouts are a rare occurrence.
The practice of bonus deferral has also become more prevalent and there has been an increase in the introduction of ‘clawback’ arrangements, particularly in the financial services sector. However, in a recent survey of the financial services sector, only one in three bank executives believed the new FSA guidelines would reduce risk-taking, whereas four in five believed it would harm the City’s competitiveness. Whilst on paper bonus deferral seems an appropriate method of mitigating risk, companies need to be careful not to take a blanket approach to it. With executives discounting the present value of any remuneration deferred by at least 20 per cent per annum, we believe companies need to assess the reason for the deferral. If it is indeed to mitigate risk, perhaps this might be delivered by more appropriately designed incentives with risk-aligned performance metrics, rather than the rather abrupt disincentive of deferral.
Annual bonus design is never off the agenda and nearly all remuneration committees claim that they “pay for performance”. However, we believe that in some cases investors (and companies) are asking too much of their bonus plan, demanding that it aligns the executives to both the financial and strategic performance of the company whilst delivering competitive levels of reward.

www.haygroup.co.uk
Long-term incentive plansLong-term incentive practice changed modestly in 2011, with companies proposing amendments to current plans around performance measures and target setting. Some shareholders continued to express concerns regarding performance conditions, and whether targets were challenging enough given market expectations.
Where new plans were introduced, shareholders focused their attention on quantum and the nature of the targets applied to the performance conditions. Much of the shareholder dissatisfaction stemmed from either disproportionately large grants, or relatively weak performance conditions resulting, at times, in substantial votes against the remuneration report.
There continues to be a gradual move towards multi-measure vesting conditions. Given the inherent complexity of measuring performance effectively in some companies, this approach has much to commend it. However, some investors are concerned that multi-measure plans are being used to spread the pay risk for the executives; in other words, to ensure that at least part of the LTIP vests in any given cycle.
For executive directors, typical median grant levels of performance share plans (PSPs) are between 125 and 150 per cent of base salary in the FTSE 250 and between 150 and 300 per cent of salary in the FTSE 100. These plans tend to be more transparently performance related than current annual bonus practice both in terms of design and variety of outcome.
If it’s about disguising increases to bonus maxima, no-one is fooled by the deferral fig leaf anymore
What’s your next move?6
©2011 Hay Group. All rights reserved
A regulatory update, and a glimpse into the future?
ABI updateRemuneration committees will be grateful to see that the revised ABI guidelines were published in September rather than December and can therefore be taken into account when setting salaries and incentive plans for next year.
The guidelines have been extensively rewritten and the ABI has endeavoured to create a set of principles that companies can interpret intelligently rather than a set of ‘rules’ that must be obeyed. They are also clear to spell out the extent to which shareholders do and do not want to be involved in the running of investee companies.
The ABI’s hope is that, under the new guidelines, it will be possible to have a business-focused conversation rather than one focused primarily on remuneration technicalities.
Some of the key themes in the new guidelines are as follows.
n A plea for benchmarking data to be interpreted intelligently rather than for companies to chase the median.
n A request for significant greater transparency around annual bonus design, decision-making and outcomes (with an explicit statement that an “exceptional negative event” should lead to zero payments).
n An explicit statement that quantum is an issue of concern for shareholders and that market data should be considered within the context of performance, affordability and pay for other employees.
n A strong focus on long-term performance (including deferral, clawback, malus and so on).
n Support for the use of discretion within agreed plan boundaries to ensure the right alignment between performance and pay outcomes.

www.haygroup.co.uk
BIS investigation into executive remunerationOn the day of his speech at the Liberal Democrats Party Conference, the Business Secretary, Dr Vince Cable launched his formal investigation into the subject of executive pay. Alongside the investigation into executive remuneration, Dr Cable will also look into the subject of company reporting.
The Business Secretary intends to investigate the role of shareholders and remuneration committees in the process of setting pay and how remuneration is structured to both incentivise and reward. The investigation will also look at the makeup of remuneration committees, again raising the question of diversity and the possibility of introducing non-traditional representation onto the board. In addition, it will look at the role of shareholders in holding companies to account on pay, discussing the effectiveness of advisory voting on executive pay decisions. Finally, it will look at the nature and complexity of executive remuneration, considering the possibilities and implications of simplified executive pay.
We are not convinced that all of these proposals have been well thought-through. For example, it is difficult to imagine employee representation having an effective role in remuneration decision-making without broader changes to UK corporate governance. Examples of where employee involvement works well come from countries where corporate governance arrangements are rather different to those prevailing in the UK. It is also unclear how employee participation can or should work in a company that has most of its operations outside of the UK, whether this is due to its vast geographic footprint (for example BP plc) or because it is UK listed rather than UK based (e.g. Kazakhmys plc).

What’s your next move?8
©2011 Hay Group. All rights reserved
Similarly, whilst simplicity is generally preferable to complexity, in reality there is often a trade-off between simplicity and design effectiveness with some of the complexity we currently see in executive pay arising from a desire to avoid perverse pay outcomes and to fulfil multiple, sometimes conflicting, demands from shareholders.
The subject of complexity is discussed from a different angle in the second consultation paper from the Department for Business, Innovation and Skills (BIS). The consultation is part of the Government’s drive to increase the standard of narrative reporting, but also to reduce the administrative burden on companies of producing large, complex accounts. The so called “narrative reporting” consultation intends to test the appropriateness of current company reporting practices, asking where they can be altered to improve clarity for investors about company strategy and performance. Any new reporting would need to be more eloquent in its explanation of company strategy, and the link to executive pay.
As part of this consultation, the possibility of greater standardisation of executive remuneration disclosures is raised. Whilst this would make life easier for many readers, it risks too much focus on compliance and disclosure and not enough on the story about how pay has been determined and how it relates to the performance achieved.
The consultation period for both investigations will close on 25 November 2011. It is intended that any regulatory solutions which arise out of the consultation on narrative reporting will apply to companies with financial years beginning on or after 1 October 2012.

www.haygroup.co.uk
The situation in Europe
On 30 September 2011 we published our 2011 report on Top executive compensation in Europe which examines executive remuneration for 312 companies drawn from the FT Europe 500.
It also uncovered the impact of regulation on senior executive pay across Europe in the past year. (A companion report on non-executive director fees and board practice across Europe will be published on 27 October 2011.)
The report reveals that executive salaries remained relatively flat across Europe with below-inflation base pay rises witnessed in the UK, France and Italy.
However, annual bonuses continued to rise significantly and payments were up 10.5 per cent as firms placed greater emphasis on performance-related pay to drive growth in a difficult market. This trend was most pronounced in Switzerland, where total cash rose 12.5 per cent, whilst base salaries in the country grew just 0.7 per cent. Around 60 per cent of executives Europe-wide were paid at least their target amount of bonus – indicating that the majority of companies see themselves as performing above expectation and/or that target setting remains difficult in a volatile environment.
Compared to last year’s study, the value of long-term incentives as a proportion of overall executive compensation grew significantly and LTIs now make up 33 per cent of the total direct compensation packages, compared with 25 per cent in 2010 suggesting that as in the UK, committees are seeking to increase pay levels.
Annual bonuses continued to rise significantly and payments were up 10.5 per cent as firms placed greater emphasis on performance-related pay to drive growth in a difficult market

The 2010/2011 reporting season
UK investors are increasingly looking at pay in the specific context of the business and its performance.
When remuneration committees did review their incentive arrangements in 2011, there was a subtle change in their approach, with an increased aspiration to tailor plans to suit their businesses going forward, this in turn reflecting investors’ desires for improved clarity and linkage to strategy.
Attracting an ABI amber or red top is still a minority sport, however, the number of companies in the FTSE 350 attracting an amber top has risen steadily over the last two years. In addition, if the global economy slows and this is not reflected in lower pay outcomes, the proportion may increase further.
In the 2010/11 season, 29 per cent of companies in the FTSE 350 received an amber top warning (which means, “shareholders should make their own decisions on this unusual or non-compliant feature”) and six per cent received a red top warning (which means, “we recommend a vote against”).
The rising number of amber tops should not necessarily be interpreted purely as an increase in investor dissatisfaction. Amber tops are used as much to draw attention to non-standard approaches as to highlight issues that may be of concern to investors. As companies move away from one-size-fits-all approaches an increase is only to be expected.
What’s your next move?10
©2011 Hay Group. All rights reserved
Perc
enta
ge
Percentage receivingof amber tops
Percentage receivingof red tops
0
0.05
0.1
0.15
0.2
0.25
0.3
2008/09
2008/09
2009/10
2009/10
2010/11
2010/11
Percentage of FTSE 350 companies who received red top or amber top guidance from the ABI/IVIS since 2008/09

If we look at the issues or themes that result in an amber or red top, quantum is the most common issue, continuing the trend from last year’s reporting season. Quantum has only recently become a significant issue, for in the past investors were more concerned about the structure and balance of pay rather than the absolute figure (arguably this was a key factor in the significant inflation in executive pay over the last ten years or so).
Issues relating to performance targets and performance measures have increased markedly over the last year, as investors question the stretch and nature of the performance measures to ensure they are suitably testing given the company’s strategy and business model.
If we analyse by remuneration element, the majority of both amber and red tops were given in relation to LTIs. There has also been a large increase in the number of concerns relating to multiple issues, as companies have pushed current plans to their extremes before proposing new arrangements or where it is no longer so easy to pinpoint exactly what it is that feels wrong about a company’s pay.
www.haygroup.co.uk
■ Salary
■ Bonus
■ LTI
■ One-o�
■ Elements combined
846
118
27
■ Salary
■ Bonus
■ LTI
■ One-o�
■ Elements combined
10 33
10
1433
■ Salary
■ Bonus
■ LTI
■ One-o�
■ Elements combined
846
118
27
■ Salary
■ Bonus
■ LTI
■ One-o�
■ Elements combined
10 33
10
1433
Percentage of amber tops issued
ABI/IVIS guidance – October 2009 to October 2010 – by remuneration element
Percentage of red tops issued
■ Quantum
■ Performance conditions
■ Structure
■ One-o�
■ Multiple issues
8
10
31
25
26
■ Quantum
■ Performance conditions
■ Structure
■ One-o�
■ Multiple issues
95
19
1948
■ Quantum
■ Performance conditions
■ Structure
■ One-o�
■ Multiple issues
8
10
31
25
26
■ Quantum
■ Performance conditions
■ Structure
■ One-o�
■ Multiple issues
95
19
1948
Percentage of amber tops issued
ABI/IVIS guidance – October 2009 to October 2010 – by issue
Percentage of red tops issued

What’s your next move?12
©2011 Hay Group. All rights reserved
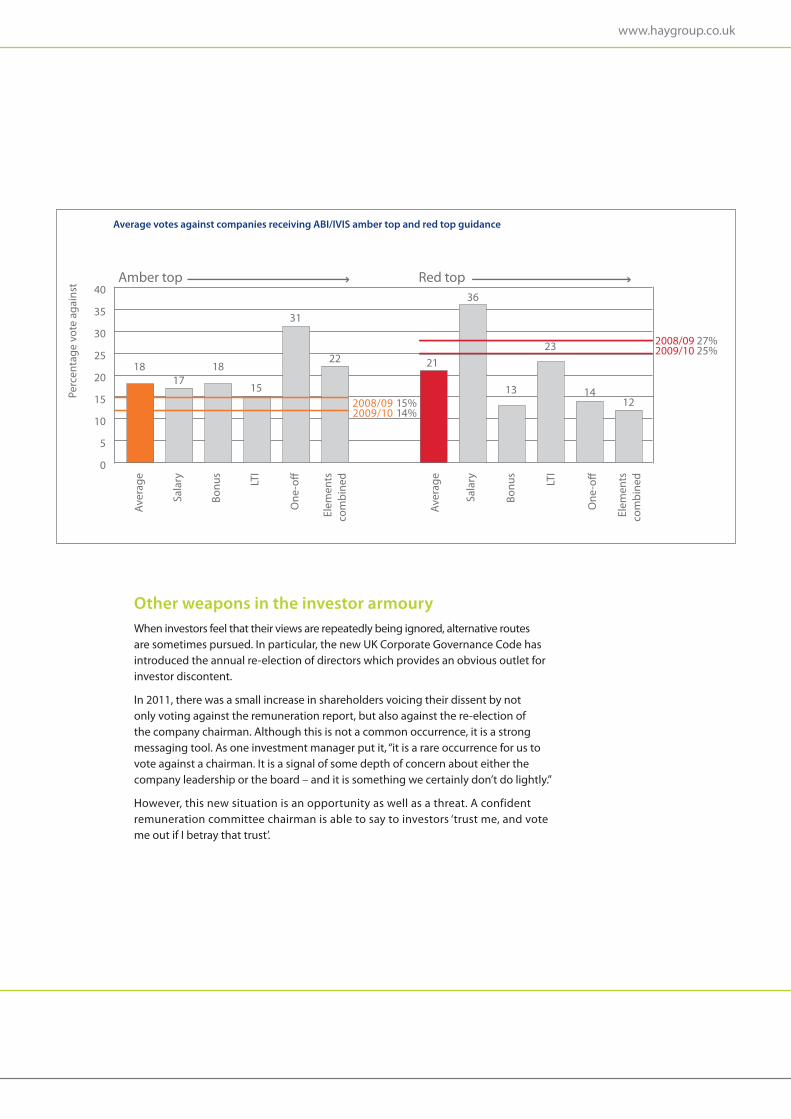
We have also analysed the impact of amber and red tops on voting patterns.
ABI/IVIS amber topsAn amber top rating indicates that there may be areas of concern, and shareholders should exercise judgment before voting. Last season an amber top translated to an average vote against the remuneration report of 18 per cent, a noticeable increase on the previous year. Almost half of issues raised were in relation to concerns about the long-term incentive arrangements, but this generally translated into a smaller than average vote against the remuneration report. Investors have paid particular attention to salary increases. While large increases were not widespread, they have continued to be the proverbial salt in the investors’ wounds, automatically attracting an amber top.
Although only a small proportion of the issues raised, those relating to one-off arrangements attracted the largest vote against at over 30 per cent, with investors sceptical about the need for these stop-gap plans in the current economic climate. Also noticeable is the proportion of amber tops issued with regards to elements combined. This proportion has been growing year-on-year.
ABI/IVIS red topsA red top rating indicates that shareholders should vote against one or more of the proposed resolutions. Last season a red top translated to an average vote against the remuneration report of 21 per cent, a drop from last year. Issues relating to salary were in the minority, but attracted the highest average vote against at the AGM of over 35 per cent. One-off arrangements on the other hand attracted a below average vote against of 14 per cent.
www.haygroup.co.uk
Perc
enta
ge v
ote
agai
nst Amber top Red top
Aver
age
Sala
ry
Bonu
s
LTI
One
-o�
Elem
ents
co
mbi
ned
Aver
age
Sala
ry
Bonu
s
LTI
One
-o�
Elem
ents
co
mbi
ned
0
5
10
15
20
25
30
35
40
1817
18
15
31
22
2008/09 15%2009/10 14%
21
36
13
23 2008/09 27%2009/10 25%
1412
Average votes against companies receiving ABI/IVIS amber top and red top guidance
Other weapons in the investor armouryWhen investors feel that their views are repeatedly being ignored, alternative routes are sometimes pursued. In particular, the new UK Corporate Governance Code has introduced the annual re-election of directors which provides an obvious outlet for investor discontent.
In 2011, there was a small increase in shareholders voicing their dissent by not only voting against the remuneration report, but also against the re-election of the company chairman. Although this is not a common occurrence, it is a strong messaging tool. As one investment manager put it, “it is a rare occurrence for us to vote against a chairman. It is a signal of some depth of concern about either the company leadership or the board – and it is something we certainly don’t do lightly.”
However, this new situation is an opportunity as well as a threat. A confident remuneration committee chairman is able to say to investors ‘trust me, and vote me out if I betray that trust’.
What’s your next move?14
©2011 Hay Group. All rights reserved
A new remuneration policy?
Whilst investors maintain their concerns about overall quantum of executive reward and the performance required to obtain it, they are becoming increasingly interested in the process around how it is determined and the extent to which policy and practice have been designed with individual company circumstances and people in mind.
Companies need to approach investors in a clearer fashion with a strong confidence in their remuneration policy, explaining what their executive reward is for, and how it is achieved. In our experience, an executive remuneration policy is usually shaped by the desire to:
1 align the executives to financial performance
2 align the executives to company strategy
3 align the executives to the general pay market
4 deliver pay.
It is our view that there should be a ‘healthy tension’ between these four forces; executive reward can be, in its simplest form, a finessed balancing act. Investors and their proxy agencies want executive pay aligned to the company strategy and the underlying financial performance, whereas remuneration committees also need to ensure that their executives are rewarded competitively through market benchmarking and pay delivery.
The examples in the next sections highlight where some FTSE 350 companies have managed this balancing act, sometimes with mixed results.

www.haygroup.co.uk
Financial alignmentThe importance of financial alignment is clear; strong financial alignment of pay mitigates unwelcome ‘reward for failure’ – investors rightly desire financial underpinning of incentive schemes. Below we have highlighted four companies’ approaches to financial alignment with differing results.
Weir Group plc amended the performance metrics under their LTIP, with the introduction of a new international comparator group and by strengthening their old absolute EPS targets. Shanks Group plc introduced a new LTIP in 2011 with one performance condition; absolute EPS growth. Both companies were improving the link to financial performance, but both companies were amber topped, with investor concern being centred on whether the proposed EPS targets were sufficiently stretching.
Both companies had strong votes in favour of their remuneration report (Weir 95 per cent in favour and Shanks 97 per cent in favour, perhaps largely driven by strong historical performance against the backdrop of challenging trading conditions). Elsewhere however, companies were viewed differently by their investors. Investec plc had not changed its EPS range for share matching awards for a number of years, as the Committee has no discretion to amend the plan without shareholder approval. Instead of reviewing the EPS targets as Weir did, the Committee considered the targets to be challenging given the current market conditions. Investors disagreed, with a 25 per cent vote of dissent.
Similarly, when RPS Group plc introduced a new bonus plan to replace the old annual bonus plan and the LTIP for executive directors. Although some investors were comfortable with the proposal during the consultation and felt that the structure mirrored the cyclical nature of the business, others felt that the single performance condition of PBTA (profit before tax and intangible amortisation) for all remuneration was inappropriate, resulting in a 20 per cent vote against.
“ While annual bonus targets should be set in line with the Company’s expectations for the year ahead, payment levels should move in line with increases and decreases in profitability”
NAPF Guidelines
“ Bonus awards should be viewed as a cost that is financed from a ‘pool’ that is funded from profits”
ISS/RiskMetrics
What’s your next move?16
©2011 Hay Group. All rights reserved
Strategic alignmentStrategic alignment has become increasingly important over the last few years, with investors seeking an explanation of the link between long-term strategy and remuneration policy. Such is the commercially sensitive nature of a company’s strategy, that alignment to it is often seen to be done poorly. It is often claimed that executive pay is aligned to strategy, but without adequate disclosure, investors tend to react poorly, as seen in two of the three examples on the next page.
Strategic alignment has become increasingly important over the last few years, with investors seeking an explanation of the link between long-term strategy and remuneration policy
“ The company should provide clearer explanations of the relationship between strategy and executive pay policy”
NAPF Guidelines
“ Long term targets should be clearly linked to a company’s pre-stated long term strategy”
ISS/RiskMetrics
“ Remuneration policies should be set so as to promote value creation through transparent alignment with the agreed corporate strategy”
ABI Guidelines
www.haygroup.co.uk
Kingfisher plc sought to increase the exceptional award limit of their PSP from 300 per cent of salary to 500 per cent. This was to enable participants to receive a single award in 2011 in lieu of awards which would otherwise be made in 2011, 2012 and 2013. Due to the large increase in opportunity, this was flagged as an amber top. However, investors who were involved in the consultation were comfortable with the proposals. In part this was because it was closely aligned with the second phase of the strategic recovery plan, but also because the same award structure, albeit with differently emphasised performance conditions, was intended to be used across the entire leadership team of the Group to ensure internal consistency. The one-off grant was approved with a 95 per cent vote in favour.
A similar one-off plan was proposed to shareholders by Capita Group plc for its CEO. The Committee considered that the introduction of this plan was key to supporting the business strategy going forward. The plan was also intended to retain and motivate the CEO, whilst also helping to bridge the competitive pay gap for the CEO bringing him in line with the market median. Perhaps investors questioned the strategic merit of the one-off award, with a 19 per cent vote of dissent.
Tullow Oil plc had an equally testing time with investors when it proposed 20 per cent salary increases for their executive directors for the current financial year. The Committee believed that the salary increase was appropriate to ensure it aligned the interest of executives and shareholders, whilst supporting delivery of the business strategy. It is possible that investors found it hard to see how a large salary increase aligned the executives to business strategy, resulting in a 20 per cent vote against the remuneration report.
Despite both Capita and Tullow’s best intentions, their plans were not seen to reflect strategic alignment as such, but more market alignment.
What’s your next move?18
©2011 Hay Group. All rights reserved
Market alignmentMarket benchmarking is viewed as one of the principal drivers of the marked increase in executive remuneration over the past decade. Evidence is hard to deny; earnings over the last decade for CEOs have increased 2.5 fold in the FTSE 100, and 2.2 fold in the FTSE 250, whereas share prices have been relatively flat over the same period. Despite best intentions, there now appears to be a ‘going rate’ for CEOs in companies at various size points, driven largely by a perceived war for talent, the desire to be a ‘median base payer’ and the executives’ own expectations that their incentive plans will payout at a certain level. Public perception is that executive reward is broken, but some companies are now taking a revised approach to benchmarking, reassessing peer groups and rigorously testing performance metrics. Careless benchmarking inflames investors, ‘high definition’ benchmarking garners support.
“ The emphasis on setting pay with regard to the results of annual peer benchmarking should be significantly reduced”
NAPF Guidelines
“ Salary decisions should not be taken purely on the basis of simple benchmarking against peer companies. If benchmarking is used, the aim should not solely be to match the “median” but to provide a point of reference for determining the appropriate salary for the specific job”
ABI Guidelines
www.haygroup.co.uk
Each year since Vedanta Resources plc listed, the Committee has awarded significant salary increases to its Directors. Last year, the Remuneration Committee increased the salaries by 36.5 per cent for the CEO, and this year the Committee approved further increases by 20 per cent to all Directors. The Committee said they considered a broad range of comparative information including a benchmarking exercise against comparable roles in similar sized Indian manufacturing business and global mining companies. Normally, investors would view such large increases in executive pay over a short and consistent period in a poor light, however, when the remuneration arrangements were assessed holistically, Vedanta still remunerates relatively modestly, driven largely by their modest long-term arrangements granted every two years. Investors only showed a 14 per cent vote of dissent.
QinetiQ Group plc’s approach to market benchmarking was somewhat different however. Its blanket approach reviewed all elements of the executive plans aiming to bring them in line with market competitiveness and the market median, specifically by increasing salaries for the FD, increasing annual bonus caps for all directors (as well as mandatory deferral levels) whilst reducing awards under their Value Sharing Plan. In principle, the re-balancing of the incentive plans seems sensible and was broadly supported by investors, however, the large salary increase for the FD of 23 per cent was badly received and resulted in a 34 per cent vote of dissent.
Market benchmarking is viewed as one of the principal drivers of the marked increase in executive remuneration over the past decade
What’s your next move?20
©2011 Hay Group. All rights reserved
Pay deliveryNotwithstanding the need to align pay to strategy and financial performance, one of the fundamental and arguably most important features of a remuneration policy is to deliver pay to the executives, which is often one of the hardest things to admit. Pay delivery has changed over the years from the simple days where an executive would receive a base salary and potentially receive some value from their annual bonus plan, to multiple arrangements with complicated and sometimes opaque performance measures.
Some commentators are calling for a massive overhaul of executive reward, judging that this over complication has formed an insurmountable barrier between company performance and executive payouts. However, blanket approaches are dangerous and should be approached with caution. We have strongly maintained that whenever a company reviews its remuneration arrangements, it must come up with a solution that is right for its circumstances, and explain it clearly to its investors. A lack of clarity on incentive arrangements, combined with a lack engagement will result in a torrid response.
To give an example, Eurasian Natural Resources Corporation plc (ENRC) is not shy of investor discord, attracting three amber tops over the last four years. Most recently ENRC has proposed to increase the bonus opportunity from 200 per cent of salary to 300 per cent of salary over two years, and from 150 per cent / 175 per cent to 250 per cent salary for other executive directors. While one third of any bonus will be deferred in shares for three years under the Deferred Share Plan introduced in 2011, investors noted this was the second large increase to annual bonus opportunity, and any potential alignment with shareholders created by deferral was weakened by the fact that the cash opportunity remained broadly unchanged. The lack of explanation and engagement with investors was telling; a 35 per cent vote of dissent.
“ There should be continued restraint in the total pay other than in exceptional circumstance”
NAPF Guidelines
“ Excessive or undeserved remuneration undermines the efficient operation of the company, adversely affects its reputation and is not aligned with shareholder interests”
ABI Guidelines
www.haygroup.co.uk
Conclusions
We set out below four themes for remuneration committees to consider over the next few years, in the context of the overall strategy of their business.
Conclusion one – pull everything togetherAn effective executive remuneration policy needs to balance all four of the elements discussed: financial performance, strategy, market and pay delivery. This will mean making choices: it is simply not possible to prioritise all four objectives and attempting to do so will lead to either complex or ineffectual pay arrangements.
Conclusion two – look inside as well as outIf the last 20 years of executive reward have been dominated by the external market, a key influence over the next two to three years is likely to be internal relativities and the degree to which pay is internally fit for purpose. Dealing with this shift requires a change of mindset which many will struggle with and a different set of skills to those which people involved with executive reward have deployed to date.
With employee incomes shrinking in real terms, public spending contacting in the UK and elsewhere and inflation for lower paid roles being well above the published headline figure, significant increases to executive pay will need a clear rationale if they are not to provoke unhelpful regulation or – worse – have a negative impact on employee engagement. Forward-thinking remuneration committees are increasingly concerned with this issue and there are far more sophisticated tools and techniques for assessing pay dispersal than the publication of crude top-to-bottom pay ratios.
Often the same committees are paying more attention to how executive pay is connected to pay below the board, the behaviour it encourages and the extent to which it enables rather than hinders the delivery of strategy instead of less controllable, financial outcomes.
Conclusion three – communicate betterIt is clear that too many shareholder communications on executive remuneration are at best dated and at worst outright confusing, as picked up by the Business Secretary in his latest consultation paper. This is an area that clearly needs to improve, as companies try to rebuild their executive reward with a coherent story, born of a narrative that starts with their business, so that it can pass muster with investors. Unluckily for the lazy this isn’t about better PR or slicker prose. No degree of erudition will convince a sceptical audience that a hippo in a dress is elegant. In other words this is about content as much as presentation.
Conclusion four – a brave new world?Investors have delivered a clear message and to be frank it hasn’t changed much since we were in the depths of recession. They are looking for pay arrangements that are aligned to strategy, reflect business performance and do not slavishly follow the market. And the ABI in particular has perhaps shown this most clearly by shifting from a largely rules-based approach to one based on principles.
We believe that investor guidance and dissent will continue to be company specific, rather than necessarily issue or pay element led. When we asked the ABI for its opinion about a recent pay controversy in a particular company, the focus was on the company’s poor financial performance and apparent lack of strategic direction rather than the pay arrangements themselves.
It remains to be seen exactly how these changes will play-out in the 2011/12 reporting season. Whilst the low cost business model employed by some proxy voting agencies is not an obvious fit with anything other than a box-ticking, compliance-driven approach, in our experience shareholders are generally prepared to listen and accept tailored designs that have a clear business case.
This brave new world is bad news for consultants peddling ‘flavour of the month’ incentive plans. However it’s good news for boards that wish to develop pay arrangements that are truly aligned to strategy, the operating model and the culture of the business.

For more information please contactPeter Borehame [email protected] +44 (0) 20 7856 7146 Jon Dymonde [email protected] +44 (0) 20 7856 7249
Our approach to executive rewardHay Group is a global management consultancy with over 60 years of experience helping organisations improve their performance through the way they organise, lead, develop and reward their people.
This breadth of expertise allows us to offer a different perspective on executive reward.
We focus on the things that are unique to you: your strategy and business model, the way you operate, your people and your culture before considering an ideal solution and testing it for practicality. Our approach uses unique tools, techniques, research and expertise, enabling us to consider the bigger picture and for you to get the best from your executive reward.
We think an executive reward engagement should add value to how you do business, give insight into how you can best make your strategy stick and should produce results which are instinctively understood by both executives and investors. We don’t make assumptions about what executive reward should look like but work with you to determine what it should look like for you.
Hay Group gives you executive reward to suit your business.
Strategy
What makes you tick?
Operations
People Culture
The ideal solution
Blank sheet of paper design
Better executive reward
Marketproperlytested
Rigorous testing
Your realinvestors
Risk appetite Cost/bene�t

Hay Group is a global management consulting firm that works with leaders to transform strategy into reality. We develop talent, organise people to be more effective and motivate them to perform at their best. Our focus is on making change happen and helping people and organisations realise their potential.
We have over 2600 employees working in 84 offices in 48 countries. Our clients are from the private, public and not-for-profit sectors, across every major industry. For more information please contact your local office through www.haygroup.co.uk
AfricaCape TownJohannesburgPretoria
AsiaBangkokBeijingHo Chi Minh CityHong KongJakartaKuala LumpurMumbaiNew DelhiSeoulShanghaiShenzhenSingaporeTokyo
EuropeAmsterdamAthensBarcelonaBerlinBilbaoBirminghamBratislavaBrusselsBucharestBudapestDublin
FrankfurtGlasgowHelsinkiIstanbulKievLilleLisbonLondonMadridManchesterMilanMoscowOsloParisPragueRomeStockholmStrasbourgViennaVilniusWarsawZeistZurich
Latin AmericaBogotáBuenos AiresLimaMexico CitySan JoséSantiagoSão Paulo
Middle EastDubaiRiyadhTel Aviv
North AmericaAtlantaBostonCalgaryChicagoDallasEdmontonHalifaxKansas CityLos AngelesMontrealNew York MetroOttawaPhiladelphiaReginaSan FranciscoTorontoVancouverWashington DC Metro
PacificAucklandBrisbaneMelbournePerthSydneyWellington