this pdf is a selection from an out-of-print volume from ... · volume author/editor: paul krugman,...
TRANSCRIPT
This PDF is a selection from an out-of-print volume from the National Bureauof Economic Research
Volume Title: Trade with Japan: Has the Door Opened Wider?
Volume Author/Editor: Paul Krugman, editor
Volume Publisher: University of Chicago Press, 1991
Volume ISBN: 0-226-45458-4
Volume URL: http://www.nber.org/books/krug91-1
Conference Date: October 19-20, 1989
Publication Date: January 1991
Chapter Title: Market Structure, Comparative Advantage, and Japanese Tradeunder the Strong Yen
Chapter Author: Peter A. Petri
Chapter URL: http://www.nber.org/chapters/c8660
Chapter pages in book: (p. 51 - 84)
2 Market Structure, Comparative Advantage, and Japanese Trade under the Strong Yen Peter A. Petri
2.1 Introduction
Between February 1985 and December 1988 the yen appreciated 33 percent in real and 57 percent in nominal terms against a trade-weighted currency basket, and 93 percent against the U.S. dollar. This round of appreciation- called enduku, the rampaging yen-was roughly twice as large as that in 1970-73, when the yen first emerged as a major international currency, and also larger than that in 1975-78, when the yen recovered from the first oil crisis. Visible signs of the economic impact of this change abound in Tokyo’s streets, shops, and factories-from BMWs and Benetton clothes to Samsung TVs and Taiwanese electronic components. Real Japanese exports are flat, and Japanese firms are aggressively shifting manufacturing operations nearer to markets and to countries with lower production costs.
Recent popular discussions of these developments-for example, most ma- jor business journals have recently featured articles on the internationalization of the Japanese economy-have focused on three theses regarding the impact of endaku on Japanese trade. The first is that Japan has begun to undergo structural changes that will eventually make it as open to imports as are other advanced economies. Fortune, for example, reported that the “retailing revo- lution the West has been waiting for is here. . . . That’s good news for Amer- ican goods” (as quoted in Rapoport 1989). In a similar, if less sensational,
Peter A. Petri is professor of economics and Director of the Lemberg Program in International Economics and Finance at Brandeis University.
The author wishes to thank Robert Corker (IMF), Sam Lair (World Bank), Masahiko Shimizu (Keio University), Robert Stem (University of Michigan), Andy Symwick (MIT), and Nobuhiro Toni (Brandeis University) for data; without their help this paper would have contained at best a fraction of the evidence it now presents. The author is also grateful to Anne Carter, Daniel Citrin, Dennis Encarnation, Marcus Noland, Robert Stem, and participants in the Japan Economic Sem- inar for valuable comments on an earlier draft.
51
52 Peter A. Petri
vein the Ministry of International Trade and Industry’s new White Paper on International Trade (MITI 1989) also argued that Japanese import patterns have shifted and presented evidence that imports in recent years have ex- ceeded expectations based on pre- 1985 experience.
A second thesis receiving considerable attention is that currency realign- ments and other recent changes have accelerated the integration of East and Southeast Asian economies, including especially Japan, South Korea, Tai- wan, and some ASEAN countries. The Economist speaks of “a swirl of forces-not all emanating from Japan-that is re-shaping East and South- East Asia by bringing their economies closer together” (Rapoport 1989, p. 159). Dornbusch (1988) noted that the “recent strength of the yen, relative to the dollar, has surely helped develop this new division of labor. But it is cer- tain that, once established, it will now develop much further.” These changes could be extremely significant, since an integrated “yen bloc,” combining large markets, advanced technology, and low-cost labor and raw materials, would be a formidable competitor in the world economy (Maidment 1989).
A third thesis, however, is challenging the view that Japan has become more open with enduku. It emphasizes the relatively slow adjustment of the Japanese trade surplus in general and of the Japanese bilateral trade surplus with the United States in particular, notwithstanding sharp improvements in U.S. price competitiveness. The proponents of this view have argued that en- duku shows that exchange rate adjustments, no matter how large, cannot sat- isfactorily open Japan. In their view, the “best” Japanese markets continue to be closed by invisible structural impediments such as the domestic bias of the Japanese distribution system and the stable, inward-looking pattern of Japa- nese business-group relationships. I
These theses have been buttressed by bits of economic data, but have not been, for the most part, subject to rigorous analysis. This paper examines the recent evolution of Japanese trade under three headings: aggregate trade, part- ner composition, and product structure. Under the first two headings, the pa- per provides a detailed empirical review of ongoing developments. Under the last heading, it presents a model with new evidence on the effects of Japanese market structure on the pattern of Japanese trade. The model shows that vari- ables reflecting product distribution, market concentration, and other poten- tial market barriers, in combination with conventional determinants of com- parative advantage, play important roles in explaining the structure of Japanese imports.
2.2 Aggregate Trade
At first glance, aggregate measures of Japanese trade paint a pessimistic picture of the effectiveness of exchange rate changes. The dollar value of Jap-
I . These arguments are stressed, for example, by the Advisory Committee for Trade Policy and Negotiations (1989).
53 Market Structure, Comparative Advantage, and Japanese Trade
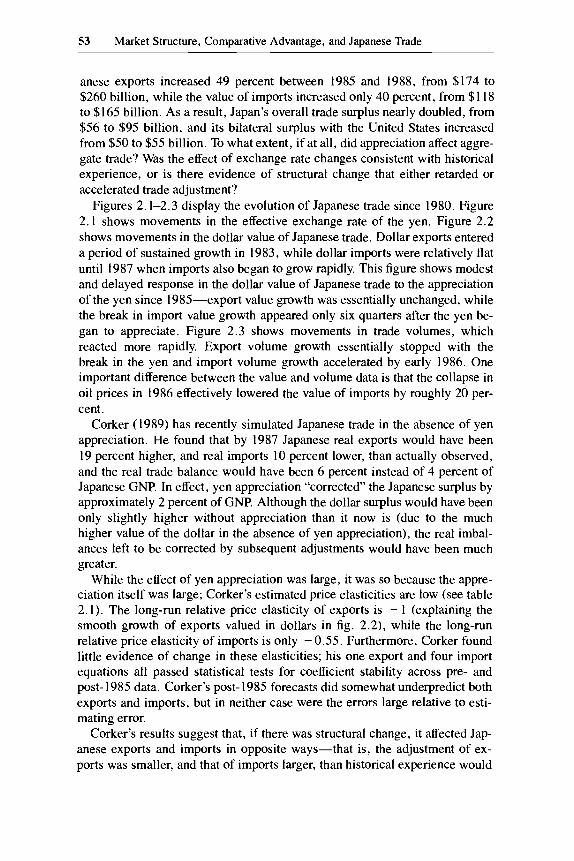
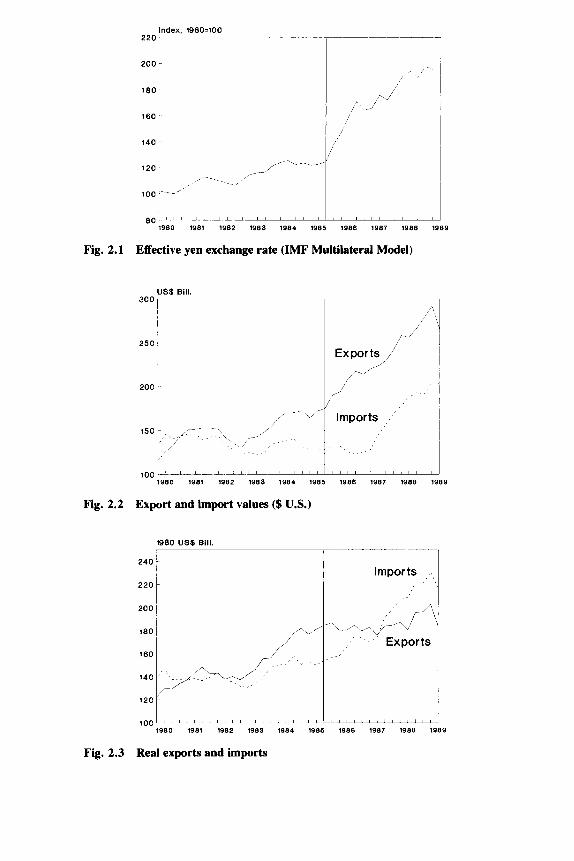
anese exports increased 49 percent between 1985 and 1988, from $174 to $260 billion, while the value of imports increased only 40 percent, from $1 18 to $165 billion. As a result, Japan’s overall trade surplus nearly doubled, from $56 to $95 billion, and its bilateral surplus with the United States increased from $50 to $55 billion. To what extent, if at all, did appreciation affect aggre- gate trade? Was the effect of exchange rate changes consistent with historical experience, or is there evidence of structural change that either retarded or accelerated trade adjustment?
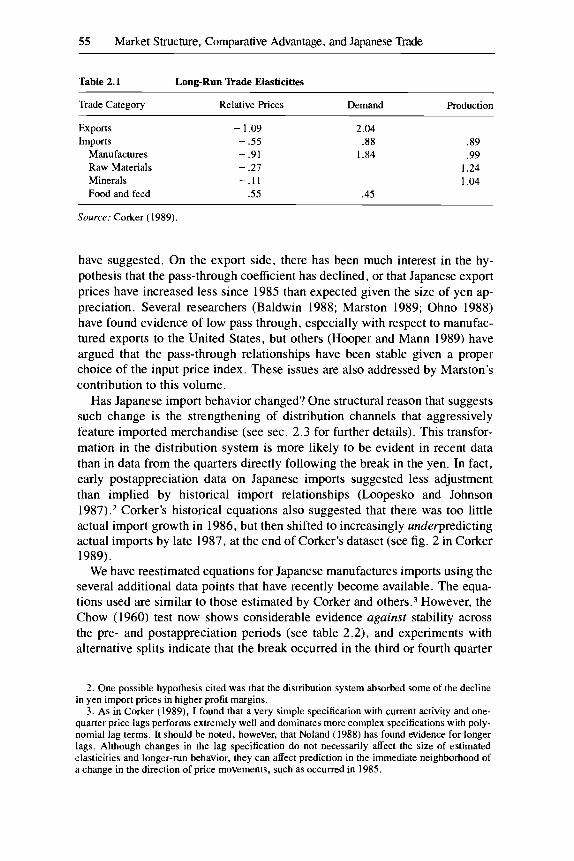
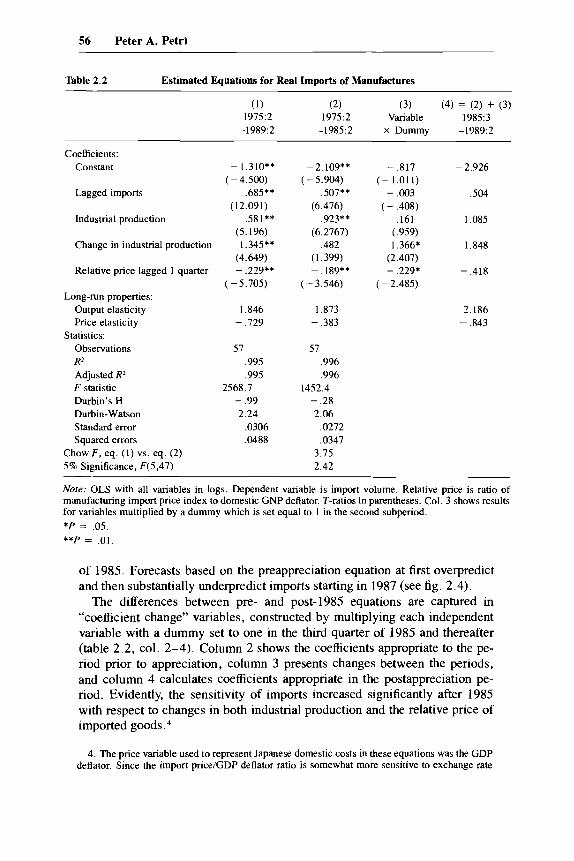
Figures 2.1-2.3 display the evolution of Japanese trade since 1980. Figure 2.1 shows movements in the effective exchange rate of the yen. Figure 2.2 shows movements in the dollar value of Japanese trade. Dollar exports entered a period of sustained growth in 1983, while dollar imports were relatively flat until 1987 when imports also began to grow rapidly. This figure shows modest and delayed response in the dollar value of Japanese trade to the appreciation of the yen since 1985-export value growth was essentially unchanged, while the break in import value growth appeared only six quarters after the yen be- gan to appreciate. Figure 2.3 shows movements in trade volumes, which reacted more rapidly. Export volume growth essentially stopped with the break in the yen and import volume growth accelerated by early 1986. One important difference between the value and volume data is that the collapse in oil prices in 1986 effectively lowered the value of imports by roughly 20 per- cent.
Corker (1989) has recently simulated Japanese trade in the absence of yen appreciation. He found that by 1987 Japanese real exports would have been 19 percent higher, and real imports 10 percent lower, than actually observed, and the real trade balance would have been 6 percent instead of 4 percent of Japanese GNP. In effect, yen appreciation “corrected” the Japanese surplus by approximately 2 percent of GNP. Although the dollar surplus would have been only slightly higher without appreciation than it now is (due to the much higher value of the dollar in the absence of yen appreciation), the real imbal- ances left to be corrected by subsequent adjustments would have been much greater.
While the effect of yen appreciation was large, it was so because the appre- ciation itself was large; Corker’s estimated price elasticities are low (see table 2.1). The long-run relative price elasticity of exports is - 1 (explaining the smooth growth of exports valued in dollars in fig. 2.2), while the long-run relative price elasticity of imports is only - 0.55. Furthermore, Corker found little evidence of change in these elasticities; his one export and four import equations all passed statistical tests for coefficient stability across pre- and post- 1985 data. Corker’s post- 1985 forecasts did somewhat underpredict both exports and imports, but in neither case were the errors large relative to esti- mating error.
Corker’s results suggest that, if there was structural change, it affected Jap- anese exports and imports in opposite ways-that is, the adjustment of ex- ports was smaller, and that of imports larger, than historical experience would
Index, 1980=100 220 I
200
160
2501 I 1 5 0 L
'/--- \ /'-I'
100 I U L L U l L U 1 1 , , 1
140 1
Exports I
I
I I Imports I
, i I J , , , , , , , , ,
1980 1981 1982 1983 1984 1986 1988 1987 1988 1989
Fig. 2.1 Effective yen exchange rate (IMF Multilateral Model)
300 7-p
100LIUL~LUILU1 1 , , 1
250 1 /
Exports
I
Imports
, , I J , , , , , , , , , I
200 I
Fig. 2.2 Export and import values ($ U.S.)
1980 US$ Bill.
100' " " ' ' " " ' ' ' ' " " ' ' 1980 1981 1982 1983 1984 1986 1988 1987 1988 1989
Fig. 2.3 Real exports and imports
55 Market Structure, Comparative Advantage, and Japanese Trade
Table 2.1 Long-Run ’lkade Elasticities
Trade Category Relative Prices Demand Production
Exports - 1.09 Imports - .55
Manufactures - .91 Raw Materials - .27 Minerals - . I 1 Food and feed - .55
2.04 .88
I .84
.45
.89
.99 I .24 1.04
Source: Corker (1989).
have suggested. On the export side, there has been much interest in the hy- pothesis that the pass-through coefficient has declined, or that Japanese export prices have increased less since 1985 than expected given the size of yen ap- preciation. Several researchers (Baldwin 1988; Marston 1989; Ohno 1988) have found evidence of low pass through, especially with respect to manufac- tured exports to the United States, but others (Hooper and Mann 1989) have argued that the pass-through relationships have been stable given a proper choice of the input price index. These issues are also addressed by Marston’s contribution to this volume.
Has Japanese import behavior changed? One structural reason that suggests such change is the strengthening of distribution channels that aggressively feature imported merchandise (see sec. 2.3 for further details). This transfor- mation in the distribution system is more likely to be evident in recent data than in data from the quarters directly following the break in the yen. In fact, early postappreciation data on Japanese imports suggested less adjustment than implied by historical import relationships (Loopesko and Johnson 1987).’ Corker’s historical equations also suggested that there was too little actual import growth in 1986, but then shifted to increasingly underpredicting actual imports by late 1987, at the end of Corker’s dataset (see fig. 2 in Corker 1989).
We have reestimated equations for Japanese manufactures imports using the several additional data points that have recently become available. The equa- tions used are similar to those estimated by Corker and other^.^ However, the Chow ( 1960) test now shows considerable evidence against stability across the pre- and postappreciation periods (see table 2 . 2 ) , and experiments with alternative splits indicate that the break occurred in the third or fourth quarter
2. One possible hypothesis cited was that the distribution system absorbed some of the decline in yen import prices in higher profit margins.
3. As in Corker (1989), I found that a very simple specification with current activity and one- quarter price lags performs extremely well and dominates more complex specifications with poly- nomial lag terms. It should be noted, however, that Noland (1988) has found evidence for longer lags. Although changes in the lag specification do not necessarily affect the size of estimated elasticities and longer-run behavior, they can affect prediction in the immediate neighborhood of a change in the direction of price movements, such as occurred in 1985.
56 Peter A. Petri
Table 2.2 Estimated Equations for Real Imports of Manufactures
(1) (2) (3) (4) = (2) + (3) 19752 1975:2 Variable 1985:3
-1989:2 -1985:2 X Dummy -1989:2
Coefficients: Constant - 1.310** - 2.109** - ,817 - 2.926
Lagged imports .685** .507** - ,003 ,504
Industrial production .581** .923** .I61 1.085
Change in industrial production 1.345** ,482 1.366* 1.848
Relative price lagged 1 quarter - .229** - .189** - .229* - ,418
(-4.500) ( - 5.904) (-1.011)
(12.091) (6.476) ( - ,408)
(5.196) (6.2767) (.959)
(4.649) (1.399) (2.407)
(-5.705) ( - 3.546) ( - 2.485) Long-run properties:
Output elasticity 1.846 1.873 2.186 Price elasticity - .729 - ,383 - ,843
Observations 57 57 R2 .995 ,996 Adjusted R2 .995 ,996 F statistic 2568.7 1452.4 Durbin’s H - .99 - .28 Durbin-Watson 2.24 2.06 Standard error ,0306 ,0272 Squared errors .0488 .0347
Statistics:
Chow F , eq. (1) vs. eq. (2) 3.75 5% Significance, F(5,47) 2.42
Note: OLS with all variables in logs. Dependent variable is import volume. Relative price is ratio of manufacturing import price index to domestic GNP deflator. T-ratios in parentheses. Col. 3 shows results for variables multiplied by a dummy which is set equal to 1 in the second subperiod. *P = .05. **P = .01.
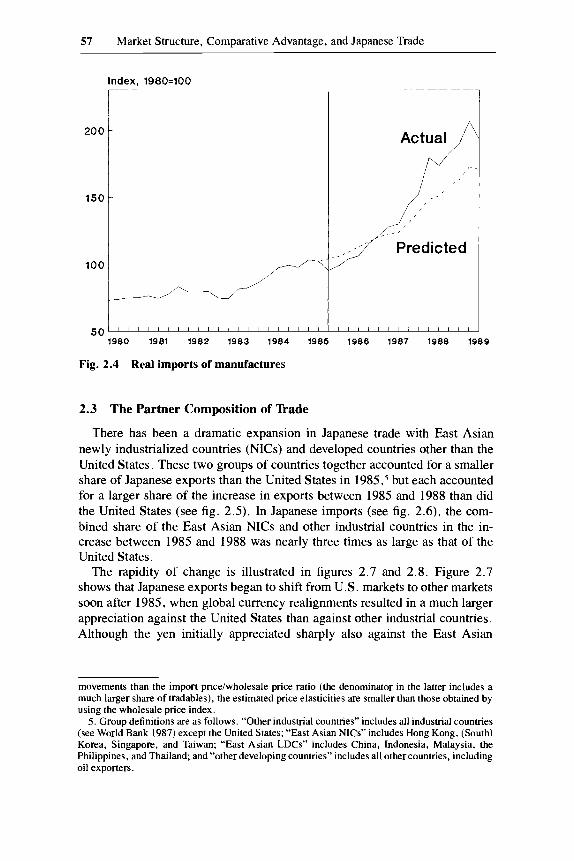
of 1985. Forecasts based on the preappreciation equation at first overpredict and then substantially underpredict imports starting in 1987 (see fig. 2.4).
The differences between pre- and post- 1985 equations are captured in “coefficient change” variables, constructed by multiplying each independent variable with a dummy set to one in the third quarter of 1985 and thereafter (table 2.2, col. 2-4). Column 2 shows the coefficients appropriate to the pe- riod prior to appreciation, column 3 presents changes between the periods, and column 4 calculates coefficients appropriate in the postappreciation pe- riod. Evidently, the sensitivity of imports increased significantly after 1985 with respect to changes in both industrial production and the relative price of imported goods.4
4. The price variable used to represent Japanese domestic costs in these equations was the GDP deflator. Since the import price/GDP deflator ratio is somewhat more sensitive to exchange rate
57 Market Structure, Comparative Advantage, and Japanese Trade
Index, 1980=100
1980 1981 1982 1983 1984 1986 1986 1987 1988 1989
Fig. 2.4 Real imports of manufactures
2.3 The Partner Composition of ’lkade
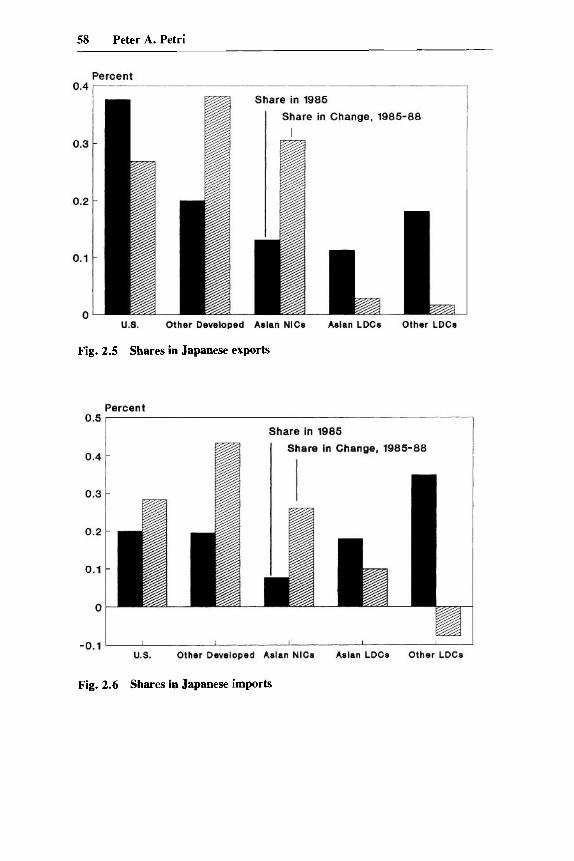
There has been a dramatic expansion in Japanese trade with East Asian newly industrialized countries (NICs) and developed countries other than the United States. These two groups of countries together accounted for a smaller share of Japanese exports than the United States in 1985,5 but each accounted for a larger share of the increase in exports between 1985 and 1988 than did the United States (see fig. 2.5). In Japanese imports (see fig. 2.6), the com- bined share of the East Asian NICs and other industrial countries in the in- crease between 1985 and 1988 was nearly three times as large as that of the United States.
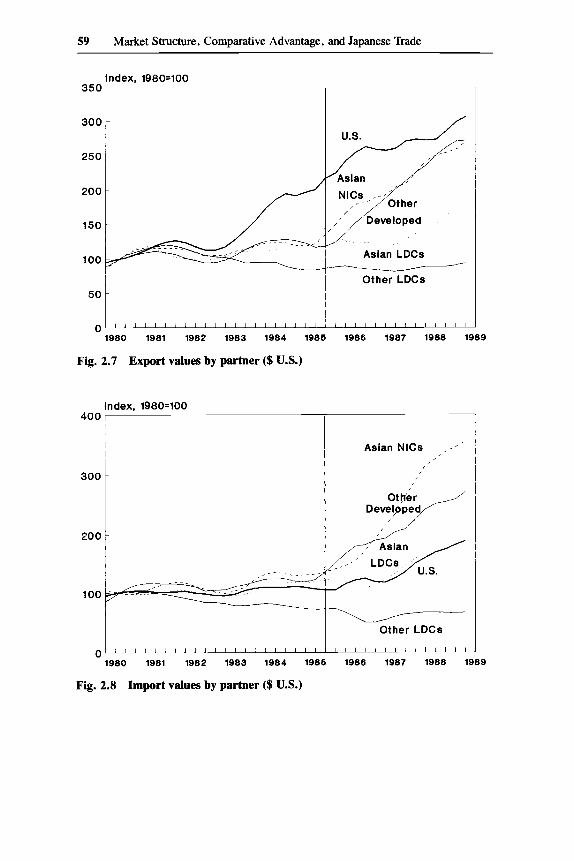
The rapidity of change is illustrated in figures 2.7 and 2.8 . Figure 2.7 shows that Japanese exports began to shift from U.S. markets to other markets soon after 1985, when global currency realignments resulted in a much larger appreciation against the United States than against other industrial countries. Although the yen initially appreciated sharply also against the East Asian
movements than the import priceiwholesale price ratio (the denominator in the latter includes a much larger share of tradables), the estimated price elasticities are smaller than those obtained by using the wholesale price index.
5 . Group definitions are as follows. “Other industrial countries” includes all industrial countries (see World Bank 1987) except the United States; “East Asian NICs” includes Hong Kong, (South) Korea, Singapore, and Taiwan; “East Asian LDCs” includes China, Indonesia, Malaysia, the Philippines, and Thailand; and “other developing countries” includes all other countries, including oil exporters.
58 Peter A. Petri
Fig. 2.5 Shares in Japanese exports
Fig. 2.6 Shares in Japanese imports
59 Market Structure, Comparative Advantage, and Japanese Trade
5 0 Other LDCs
-
1980 1981 1982 1983 1984 1986 1986 1987 1988 1989
Fig. 2.7 Export values by partner ($ U.S.)
index, 1980=100 400
300
200
n 3
Asian NlCs ,,'
Develyped p U.S. - Other LDCs
1 1 1 1 1 1 1 1 1 1 1 1 1 1 - 1980 1981 1982 1983 1984 1986 1986 1987 1988 1989
Fig. 2.8 Import values by partner ($ U.S.)
60 Peter A. Petri
NICs, Japanese exports to these countries nevertheless expanded. A key rea- son for this was that endaka enabled the East Asian NICs to capture markets in the United States and elsewhere in products that required Japanese compo- nents and capital goods.6
Figure 2.8 shows sharp increases in Japanese imports from the NICs and other developed countries. The remarkable fact behind these statistics is that Japanese consumers have responded very positively to the availability of at- tractively priced imports. Contrary to conventional wisdom, this response has not been limited to high-quality, luxury goods from Europe, but has included inexpensive clothing, appliances, and consumer electronics from East Asia. To take advantage of these trends, a merchandising boom has developed, com- plete with the institution of the bahgen say-ru. Discount chains such Jusco, Daiei, and I World, feature aggressively priced, imported goods, and have been growing twice as fast as mainline department stores.’
These developments are clearly reflected in the changing patterns of Japa- nese manufactures trade with the NICs and other developed countries (table 2.3). Consumer goods are prominent among the most rapidly expanding man- ufactures imports, including wearing apparel and consumer electronics from the NICs and automobiles from other developed countries. Exports are domi- nated by electronic components and machinery to the NICs, and automobiles, consumer electronics, and machinery to other developed countries.
Is this evidence of a “yen bloc” and a new phase in East Asian economic integration? The answer to this question is far from self-evident. Trade links between Japan and its East Asian neighbors have been historically strong, and, given East Asia’s high growth relative to the rest of the world, the re- gion’s importance to Japan (and every other country) has increased. From the perspective of the East Asian partners, however, the importance of Japanese linkages has declined relative to extraregional trade, especially during the pe- riod of the strong dollar and U.S. economic recovery in the mid-1980s. Re- cent increases in East Asian-Japanese trade have partially retraced this decline (see table 2.4), but only for Malaysia was the share of trade with Japan actu- ally higher in 1988 than in 1975. Thus, the period since 1985 may be alterna- tively viewed as retracing or slowing the secular disintegration of the East Asian economy, which, in turn, is driven by growing worldwide economic integration.
The growth of Japan’s trade with the East Asian “ 2 s has recently slowed: exports plus imports grew at a 32 percent annual rate between the second quarter of 1985 and the first quarter of 1988 but only at a 13 percent rate since, as compared to 14 and 13 percent for Japan’s overall trade over the two peri-
6. The import content of Korean exports, for example, is 43 percent. 7. See, e.g., articles by Meyer, Hoshiai, and Takayama (1987), Darlin (1988), and Rapoport
(1989).

61 Market Structure, Comparative Advantage, and Japanese Trade
Table 2.3 Shares of Categories in Increase of made, 1985-88
Japanese Imports % Japanese Exports %
TRADE WITH EAST ASIAN NICS: Wearing apparel 22.8 Radio, TV, components 10.5 Basic iron & steel 9.6 Miscellaneous products 6.0
Other metal products 3.2 Office machinery 3. I Leather footwear 2.9 Yarn and fabric 2.9 Electrical industrial machinery 2.8 Top 10 categories 67.7
Plastic products 3.9
Radio, TV, components Basic iron & steel General industrial machinery Special industrial machinery Electrical industrial machinery Motor vehicles Basic industrial chemicals Office machinery Synthetic resin Electronics Top 10 categories
TRADE WITH OTHER DEVELOPING COUNTRIES: Motor vehicles 16.0 Motor vehicles Basic industrial chemicals 12.6 Radio, TV, components Drugs and medicines 6.6 Office machinery Pulp 5 . 5 General industrial machinery Lumber and plywood 5.4 Photographic equipment Special industrial machinery 5 . 1 Special industrial machinery Yarn and fabric 5.0 Basic industrial chemicals Miscellaneous products 4.2 Electrical industrial machinery Wearing apparel 3.8 Electronics Scientific instruments 3.7 Scientific instruments Top 10 Categories 67.8 Top 10 categories
24.2 8.2 8.1 6.4 6.1 6.0 5 .8 4.8 3.9 3.6
77.2
29. I 19.7 12.5 5.0 4.2 4.2 2.7 2.6 2.3 2.2
84.5
ods. It is possible that some of the rapid increase in East Asian trade during the early months of enduku was related to the delayed adjustment of the re- gion’s currencies to yen appreciation. Alternatively, the slowdown in recent trade may reflect supply problems in the NICs and thus may be temporary.
Ultimately, however, the outlook for strong economic linkages between Ja- pan and other East Asian economies has to be bright. Japanese demand for foreign consumer goods is coming of age just as East Asian economies are assuming leading positions in the supply of high-quality consumer goods. There is also evidence of increasing direct integration in production. Accord- ing to Takeuchi’s (1989b) data, Japanese direct investment in Asian manufac- turing has increased from $642 million per annum in 1980-84 to $1.7 billion in 1987 and $2.4 billion in 1988. More than half of this investment now goes into the machinery industries, where firms often export back into Japan; Asian subsidiaries of Japanese firms exported 16.7 percent of their output to Japan in 1987 as compared to 9.8 percent in 1980. These magnitudes, although not yet large relative to overall Japanese trade, do foreshadow the continued ex- pansion of regional integration and trade.

62 Peter A. Petri
Table 2.4 Japanese lkade with East Asia
As % of Country’s As % of Japan’s Exports, Imports Imports, Exports
1975 1985 1988 1975 1985 1988
East Asian NICs: Exports to Japan Imports from Japan
Exports to Japan Imports from Japan
Exports to Japan Imports from Japan
Exports to Japan Imports from Japan
Exports to Japan Imports from Japan
Exports to Japan Imports from Japan
Exports to Japan Imports from Japan
Exports to Japan Imports from Japan
Exports to Japan Imports from Japan
Exports to Japan Imports from Japan
Exports to Japan Imports from Japan
Hong Kong
Korea
Singapore
Taiwan
East Asian LDCs:
China
Philippines
Thailand
Malaysia
Indonesia
16.0 32.6
4.1 20.4
25.7 30.9
7.4 18.7
32.9 28.6
19.9 28.5
48.8 27.3
32.8 29.2
19.8 15.9
48.3 38.8
12.0 26.6
2.6 22.1
13.7 23.0
7.0 14.8
32.0 25.0
23.9 29.6
27.2 17.3
14.5 22.2
28.1 17.8
54.8 21.4
15.3 31.4
3.3 18.3
19.5 29.8
5.9 18.9
27.9 19.8
20.7 17.2
29.1 20.0
31.1 26.4
22.5 18.5
49.3 22.6
4.6 13.0
.4 2.5
2.3 4.0
2.3 4.0
1.2 3.7
13.0 11.9
2.6 4.1
1.9 1.8
1.3 I .7
I .2 1 .O
5.9 3.3
7.6 13.1
.6 3.7
3.2 4.0
3.2 4.0
2.6 3.1
17.9 11.3
5.0 7.1
1 .o .5
.8 1.2
3.3 1.2
7.8 I .2
13.3 18.9
1.1 4.4
6.3 5.8
6.3 5.8
4.6 5.5
15.5 8.5
5.3 3.6
1 . 1 .7
I .5 I .9
2.5 I .2
5.1 1.2
2.4 The Product Structure of Rade
2.4.1 Key Trends
In terms of the broadest categories, Japan’s imports of manufactures have increased substantially relative to raw materials and now account for nearly one-half of total imports (fig. 2.9). This change is partly due to declining raw materials relative to prices, but, as demonstrated earlier, manufactures have also responded much more vigorously to income growth and appreciation than

63 Market Structure, Comparative Advantage, and Japanese Trade
30
_-___ Percent 60 r--
~
- Raw Materials
20 t
.” 1980 1981 1982 1983 1984 1985 1986 1987 1988
Fig. 2.9 Shares in Japanese imports
other imports. More important, however, the structure of trade in manufac- tures is also changing rapidly.
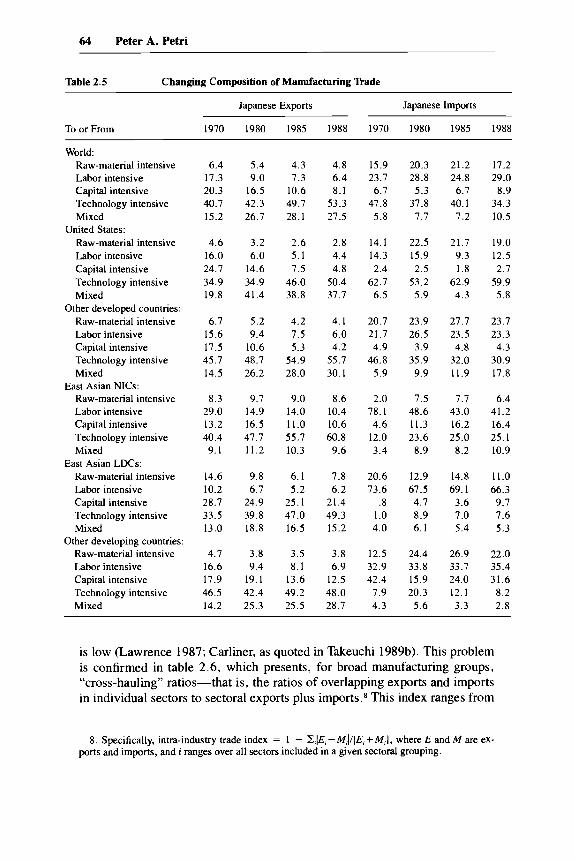
Table 2.5 presents trade data for 49 manufacturing sectors grouped into five categories according to their relative requirements for four inputs, raw mate- rials (including energy), labor, capital, and technology. To determine the as- signment of a particular sector, I computed its standardized deviation from the manufacturing average in each of the four input dimensions, and then placed it into, say, the labor-intensive category if its deviation was larger in this di- mension than in others. Sectors near overall averages in all four dimensions were classified as “mixed.” Sectoral assignments are presented in the ap- pendix.
The lead story of table 2.5 is Japan’s increasing specialization in technology-intensive products. On the export side, the share of raw-material- intensive, labor-intensive, and capital-intensive exports declined from 44 per- cent of all manufactures exports in 1970 to just 19 percent in 1988. The share of mixed exports grew between 1970 and 1980 but has been stagnant since. Only technology-intensive exports have shown steady gains in shares. Oppo- site trends are evident on the import side. Here the shares of labor-intensive, capital-intensive, and mixed imports increased from 36 to 50 percent, while raw-material-intensive imports fluctuated (mostly reflecting relative valuation effects) and the share of technology-intensive imports sharply declined.
A second important feature of Japanese trade patterns is that competitively strong Japanese industries tend to export and not import-intra-industry trade
64 Peter A. Petri
Table 2.5 Changing Composition of Manufacturing Trade
Japanese Exports Japanese Imports
To or From 1970 1980 1985 1988 1970 1980 1985 1988
World: Raw-material intensive Labor intensive Capital intensive Technology intensive Mixed
Raw-material intensive Labor intensive Capital intensive Technology intensive Mixed
Other developed countries: Raw-material intensive Labor intensive Capital intensive Technology intensive Mixed
East Asian NICs: Raw-material intensive Labor intensive Capital intensive Technology intensive Mixed
East Asian LDCs: Raw-material intensive Labor intensive Capital intensive Technology intensive Mixed
Other developing countries: Raw-material intensive Labor intensive Capital intensive Technology intensive Mixed
United States:
6.4 17.3 20.3 40.7 15.2
4.6 16.0 24.7 34.9 19.8
6.7 15.6 17.5 45.7 14.5
8.3 29.0 13.2 40.4 9.1
14.6 10.2 28.7 33.5 13.0
4.7 16.6 17.9 46.5 14.2
5.4 9.0
16.5 42.3 26.7
3.2 6.0
14.6 34.9 41.4
5.2 9.4
10.6 48.7 26.2
9.7 14.9 16.5 47.7 11.2
9.8 6.7
24.9 39.8 18.8
3.8 9.4
19.1 42.4 25.3
4.3 7.3
10.6 49.7 28.1
2.6 5.1 7.5
46.0 38.8
4.2 7.5 5.3
54.9 28.0
9.0 14.0 11.0 55.7 10.3
6.1 5.2
25.1 47.0 16.5
3.5 8.1
13.6 49.2 25.5
4.8 6.4 8.1
53.3 27.5
2.8 4.4 4.8
50.4 37.7
4.1 6.0 4.2
55.7 30.1
8.6 10.4 10.6 60.8 9.6
7.8 6.2
21.4 49.3 15.2
3.8 6.9
12.5 48.0 28.7
15.9 23.7 6.7
47.8 5.8
14.1 14.3 2.4
62.7 6.5
20.7 21.7 4.9
46.8 5.9
2.0 78.1 4.6
12.0 3.4
20.6 73.6
.8 1 .o 4.0
12.5 32.9 42.4 7.9 4.3
20.3 28.8 5.3
37.8 7.7
22.5 15.9 2.5
53.2 5.9
23.9 26.5 3.9
35.9 9.9
7.5 48.6 11.3 23.6 8.9
12.9 67.5 4.7 8.9 6.1
24.4 33.8 15.9 20.3 5.6
21.2 24.8 6.7
40.1 7.2
21.7 9.3 1.8
62.9 4.3
27.7 23.5 4.8
32.0 11.9
7.7 43.0 16.2 25 .O 8.2
14.8 69.1 3.6 7.0 5.4
26.9 33.7 24.0 12.1 3.3
17.2 29.0 8.9
34.3 10.5
19.0 12.5 2.7
59.9 5.8
23.7 23.3 4.3
30.9 17.8
6.4 41.2 16.4 25.1 10.9
11 .o 66.3 9.7 7.6 5.3
22.0 35.4 31.6 8.2 2.8
is low (Lawrence 1987; Carliner, as quoted in Takeuchi 1989b). This problem is confirmed in table 2.6, which presents, for broad manufacturing groups, “cross-hauling” ratios-that is, the ratios of overlapping exports and imports in individual sectors to sectoral exports plus imports.8 This index ranges from
8. Specifically, intra-industry trade index = 1 - Z,IE,-M,I/[E,+M,l, where E and M are ex- ports and imports, and i ranges over all sectors included in a given sectoral grouping.
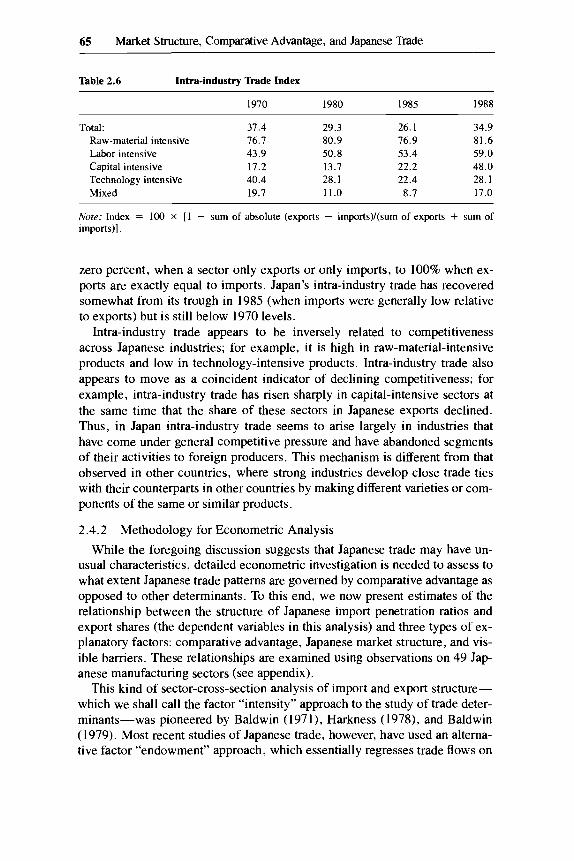
65 Market Structure, Comparative Advantage, and Japanese Trade
Table 2.6 Intra-industry ’Rade Index
1970 1980 1985 1988
Total: 37.4 29.3 26.1 34.9 Raw-material intensive 76.7 80.9 76.9 81.6 Labor intensive 43.9 50.8 53.4 59.0 Capital intensive 17.2 13.7 22.2 48.0 Technology intensive 40.4 28.1 22.4 28.1 Mixed 19.7 11.0 8.7 17.0
Nore: Index = 100 X [l - sum of absolute (exports - imports)/(sum of exports + sum of imports)].
zero percent, when a sector only exports or only imports, to 100% when ex- ports are exactly equal to imports. Japan’s intra-industry trade has recovered somewhat from its trough in 1985 (when imports were generally low relative to exports) but is still below 1970 levels.
Intra-industry trade appears to be inversely related to competitiveness across Japanese industries; for example, it is high in raw-material-intensive products and low in technology-intensive products. Intra-industry trade also appears to move as a coincident indicator of declining competitiveness; for example, intra-industry trade has risen sharply in capital-intensive sectors at the same time that the share of these sectors in Japanese exports declined. Thus, in Japan intra-industry trade seems to arise largely in industries that have come under general competitive pressure and have abandoned segments of their activities to foreign producers. This mechanism is different from that observed in other countries, where strong industries develop close trade ties with their counterparts in other countries by making different varieties or com- ponents of the same or similar products.
2.4.2 Methodology for Econometric Analysis
While the foregoing discussion suggests that Japanese trade may have un- usual characteristics, detailed econometric investigation is needed to assess to what extent Japanese trade patterns are governed by comparative advantage as opposed to other determinants. To this end, we now present estimates of the relationship between the structure of Japanese import penetration ratios and export shares (the dependent variables in this analysis) and three types of ex- planatory factors: comparative advantage, Japanese market structure, and vis- ible barriers. These relationships are examined using observations on 49 Jap- anese manufacturing sectors (see appendix).
This kind of sector-cross-section analysis of import and export structure- which we shall call the factor “intensity” approach to the study of trade deter- minants-was pioneered by Baldwin (1971), Harkness (1978), and Baldwin (1979). Most recent studies of Japanese trade, however, have used an alterna- tive factor “endowment” approach, which essentially regresses trade flows on

66 Peter A. Petri
factor endowments in a country-cross-section sample (Saxonhouse 1983; Lea- mer 1984; Saxonhouse and Stem 1989). It is useful to review the theoretical underpinnings of these alternative approaches.
The theoretical justification of the endowment approach is based on Heckscher-Ohlin assumptions, including factor price equalization (FPE) .9 These assumptions imply that exports and imports, in effect, trade away the differences between each country’s relative factor supplies and international relative factor supplies. In Learner’s (1984) notation, trade has to satisfy the relationship:
(1) At = v - SV,,
where A is the factors-by-products matrix of input coefficients, t is the net trade vector, and v - sv, is the vector of excess factor endowments-the difference between a country’s factor endowments v and its general share s of world factor endoments v,.
If A is invertible (more on this below), then each product’s net trade will be a linear function of the elements of the excess endowment vector:
( 2 ) t = A - ’ ( V - SV,) .
This is the equation estimated in the endowment approach, essentially by using data on factor endowments to estimate the coefficients A-I . A good fit is then taken to confirm the underlying theoretical model.
Leamer and Bowen (1981) also use equation (2) to point out errors in the intensity approach. They argue that, in order to estimate relative factor abun- dance, it is necessary to estimate the excess factor endowment vector (v - sv,). They then show that to recover this vector, r should be regressed on data that are equivalent to columns of A - I . But A- l is not observed. The usual procedure of regressing t on input intensities A (which are observed) is not a satisfactory alternative, since this regression does not have stable coefficients across sectors and will not yield coefficients that are in any simple way related
Looked at this way, the intensity approach is an incorrect substitute for the endowment approach. Yet the failure of the intensity approach rests on the strong assumptions used to derive equation (2). A satisfactory rationale for the intensity approach can be built in the framework of Heckscher-Ohlin theory, provided, however, that the strong assumption of FPE is relaxed.
Suppose factor prices differ at home and abroad. Let product and factor units be normalized so that foreign product and factor prices equal 1. Let the vector of the costs of home products, p , be given by:
to (v - sv,).
9 . The basic model is developed in detail in Leamer (1984). Lawrence (1987) has sketched a version of the model emphasizing product differentiation; Saxonhouse and Stem (1989) develop a hybrid model which combines a version of the differentiated-products model with the Heckscher- Ohlin framework.

67 Market Structure, Comparative Advantage, and Japanese Trade
(3) p = c(w) ,
where w is the vector of home factor prices and the vector of cost functions, c, is based on internationally shared technologies. For small deviations of home factor prices from factor prices abroad, dw, home costs will be given by:
(4) p = 1 + dp = 1 + c,(w)dw.
Since the derivative of cost with respect to factor prices is factor demand, c,(w) = A’ , and equation (4) becomes:
( 5 ) p = 1 + A’dw,
and since, by definition, A’1 = 1, equation (5) can be rewritten as:
(5’) p = A ’ ( l + dw) = A’w.
The intensity model is completed by adding relationships between p and trade t . Assume that goods are differentiated by country of origin,I0 demand is homothetic, and demand is separable so that the choice among the varieties of one product does not depend on the choice among the varieties of other prod- ucts.” Then the home country will produce some of each product even if its costs are higher than those abroad, with market shares given by the demand relationships s:
(6)
where denotes diagonalization, d is the vector of demands for the composite goods that encompass the several varieties of the various products, and b rep- resents trade barriers. Substituting equation (5’) into question (6) yields:
(7) tld = ?i[A’w + b] .
In other words, home producers’ market shares,I2 both in home demand (where the home market share is simply 1 minus the import penetration ratio) and foreign demand (where the home market share is represented as the coun- try’s share of world exports) will be a function of the input matrix A multiplied
t = i[p + b]d,
10. The assumption of “differentiation by country of origin” is used in a stronger sense than by Helpman and Krugman (1985); in their model, if x has lower costs than y in making a particular variety, then x will win that market and become a producer of y-type products. In the present context the stronger Armington assumption is used; y’s differentiated products remain perma- nently associated with y; that is, they possess some technical feature that cannot be duplicated by x .
I 1 . This demand specification is widely used in computable general equilibrium models, e .g . , Petri (1984).
12. The share functions that apply to different products may reflect differing elasticities of substitution between domestic and foreign varieties, so that a particular cost differential may be associated with different trade effects across the several sectors. In the econometric application, these differences are treated as noise. The effect of this noise on the accuracy of the estimates is mitigated by the fact that it appears in both the import and export equations for a particular sector and can therefore be estimated with Zellner’s seemingly unrelated regression method.
68 Peter A. Petri
by factor prices plus the tariff equivalent of trade barriers relevant to the mar- ket. In general, the form of this function is unknown, but in at least one im- portant case it can be shown to be linear.I3
The intensity approach involves estimation of equation (7). Thus, if factor prices are not fully equalized, then there is a rigorous justification for estimat- ing the intensity model, and, furthermore, the endowment model is incorrect since trade is not a linear function of endowments and the coefficients A - I are not fixed across countries. It would not be surprising, however, if the endow- ment model produced a good fit in empirical applications, since the excess endowment vector may still be an excellent proxy for international factor price differences.
The fact is that recent results based on the endowment approach are not easily reconciled with Heckscher-Ohlin FPE assumptions. Several studies based on this approach have found that trade performance in many industries is accurately predicted with a small number of factor endowment variables. I 4 Paradoxically, the theory does not predict such “good’ results. If the number of products is greater than the number of factors, then the theory predicts either that net exports in most product categories will be indeterminate (if transport costs are negligible) or that trade will be confined to a small number of goods (if transport costs are significant). l 5 Alternatively, should the number of products equal the number of factors, then the theory predicts that a large number of factors will be needed to explain satisfactorily trade in a large num- ber of product categories. Nu version of the theory predicts that a few factors will be sufficient to explain many categories of trade. By contrast, the inten- sity approach predicts meaningful international rankings of competitiveness for any number of products, regardless of how many factors matter.
2.4.3 Implementation
In this study, the intensity approach (eq. [7]) is used to estimate Japanese trade performance in both domestic markets and world markets. In the domes- tic market, for the sake of comparability with other similar studies, the depen-
13. It is possible to derive a strictly linear version of the relationship between import- penetration ratios (or export market shares) and factor intensities under Cobb-Douglas technolo- gies and market shares. In this case, costs are given by: log p = A’, log w, and rld = e(A’ log w + 4). where e is a substitution elasticity and q is the vector of ad valorem tariff equivalents. In this case, the sector-cross-section regression of tld on A’ and q directly yields the coefficient vector [e log (w), el.
14. Saxonhouse (1983) and Saxonhouse and Stem (1989). e.g., work with 109 products and only seven factors. In the 74 manufacturing sectors of this sample, only three have R* below 0.50, and 17 have R2 greater than 0.90.
15. Learner (1984, p. 18) suggests that one way around the dimensionality problem is to assume small transport costs and that trade is determined by a linear program that minimizes transport costs subject to the constraint of eq. (1). It is not clear how agents would know how to trade consistently with the results of such a linear program. In any case, the number of nonzero trading activities will be generally equal to the number of constraints, or, in this case, the number of factors. Most goods would not be traded.
69 Market Structure, Comparative Advantage, and Japanese Trade
dent variable was defined as import penetration, that is, the ratio of imports to total domestic demand. In the world market, the dependent variable was Ja- pan’s share ofworld exports. This means, of course, that comparable compar- ative advantage variables will have opposite signs in the two estimated equa- tions. The estimates were implemented using trade and structural data for 49 manufacturing industries in 1985.
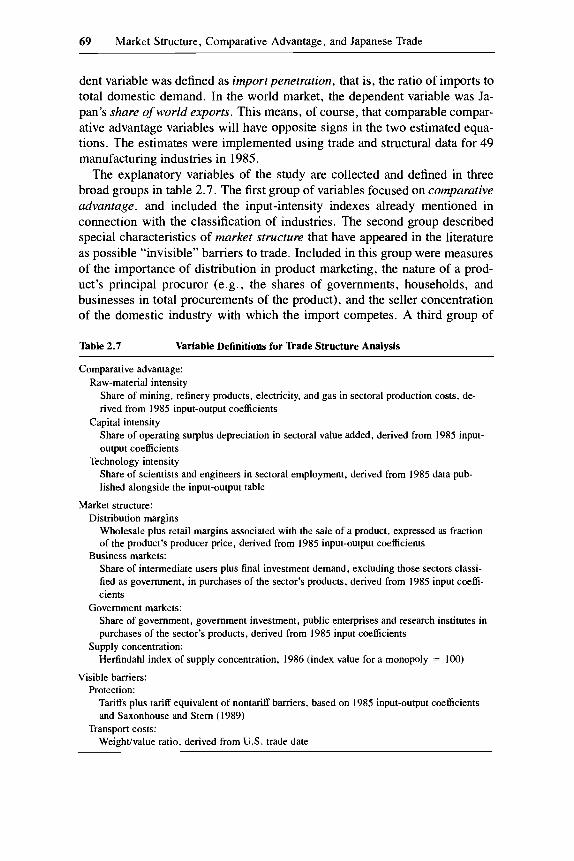
The explanatory variables of the study are collected and defined in three broad groups in table 2.7. The first group of variables focused on comparative advantage, and included the input-intensity indexes already mentioned in connection with the classification of industries. The second group described special characteristics of market structure that have appeared in the literature as possible “invisible” barriers to trade. Included in this group were measures of the importance of distribution in product marketing, the nature of a prod- uct’s principal procuror (e.g., the shares of governments, households, and businesses in total procurements of the product), and the seller concentration of the domestic industry with which the import competes. A third group of
Table 2.7 Variable Definitions for Trade Structure Analysis
Comparative advantage: Raw-material intensity
Share of mining, refinery products, electricity, and gas in sectoral production costs, de- rived from 1985 input-output coefficients
Share of operating surplus depreciation in sectoral value added, derived from 1985 input- output coefficients
Technology intensity Share of scientists and engineers in sectoral employment, derived from 1985 data pub- lished alongside the input-output table
Capital intensity
Market structure: Distribution margins
Wholesale plus retail margins associated with the sale of a product, expressed as fraction of the product’s producer price, derived from 1985 input-output coefficients
Share of intermediate users plus final investment demand, excluding those sectors classi- fied as government, in purchases of the sector’s products, derived from 1985 input coeffi- cients
Share of government, government investment, public enterprises and research institutes in purchases of the sector’s products, derived from 1985 input coefficients
Herfindahl index of supply concentration, 1986 (index value for a monopoly = 100)
Business markets:
Government markets:
Supply concentration:
Visible barriers: Protection:
Tariffs plus tariff equivalent of nontariff barriers, based on 1985 input-output coefficients and Saxonhouse and Stem ( 1989)
Weightlvalue ratio, derived from U.S. trade date Transport costs:
70 Peter A. Petri
variables focused on visible barriers such as formal protection, including tar- iffs and the estimated tariff equivalent of nontariff barriers and transportation costs.
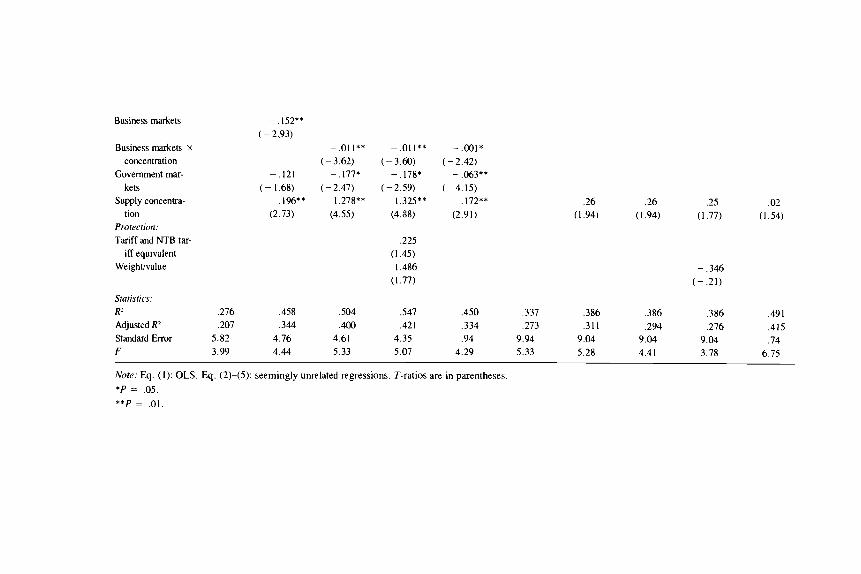
Zellner’s “seemingly unrelated equations” technique was used to take ad- vantage of correlation between the residuals of the import and export relation- ships. This correlation was negative and substantial (-0.37 for the trade structure equations reported in table 2.8, and -0.56 for the trade growth equations reported in table 2.9), presumably reflecting missing factors that affect Japan’s competitiveness in both domestic and foreign markets.
The theoretical rationale of the intensity approach, as outlined in the previ- ous section, is consistent with a linear specification of the effects of input- intensity variables, but does not strictly require this functional form. Results are therefore presented both for the simple linear specification and for an equation using log transformations of the dependent variables. In addition, quadratic terms were tried for each independent variable. Except in the case of technology intensity (as discussed below), the quadratic terms had little effect on the results and are not reported here.
2.4.4 Results
The results for import penetration and export shares in 1985 are presented in table 2.8. Most obviously, the results highlight the importance of technol- ogy intensity as a determinant of both imports and exports. However, technol- ogy intensity does not behave as a simple factor intensity variable; in both the import and export equations, its effects are best captured in quadratic form. A closer look at the quadratic estimates helps to explain why this happens. Typ- ical sample values of the technology-intensity variable imply that the contri- bution of the quadratic term is generally greatest (most positive in the export equation, most negative in the import equation) for a technology intensity value of approximately 5-6 percent. This is a relatively high value; only one- third of manufacturing sectors have an index value this high or higher-ma- chinery sectors, for example, fall in the 5-7 percent range. With technology values above 6 percent, exports generally decline and imports rise. Evidently, Japan’s technology advantage peaks in the second highest quintile of indus- tries and falls off for ultra-technology-intensive products, suggesting perhaps some missing factor (basic research?) that is correlated with very high levels of the technology intensity.
Trade patterns are weakly related to other input intensity measures beside technology. There is a hint that exports are negatively related to raw material intensity and that imports are negatively related to capital intensity, but neither of these coefficients is statistically significant at the 5 percent level. Further- more, the signs of some of these variables change depending on whether the dependent variables are linearly or logarithmically specified.
The most interesting findings involve the market-structure variables. These variables approximately double the explained proportion of variance in the
71 Market Structure, Comparative Advantage, and Japanese Trade
import equation and also improve the fit of the export equation;I6 the hypoth- esis that industry structure coefficients are zero is rejected at the 1 percent level for both the import equation and export equations.
Two of the market structure variables, distribution margins and the share of business in the product’s market, were introduced both by themselves and in interaction with concentration. The interaction variants reflect the hypothesis that distribution channels and business procurement will have an import- dampening character only when “activated’ by a strong domestic supplier. For example, a concentrated domestic supplier should have greater voice in what other products are carried by its distribution channel than a competitive do- mestic supplier. As the results show, the distribution and business procure- ment variable indeed have more explanatory power when used in interaction with concentration.
1 . Distribution margins are negatively related to import penetration. This finding is significant at a 1 percent level in the linear model, but only at a 12 percent level in the logarithmic variant. In general, the sign of the esti- mated coefficient is consistent with the hypothesis that the Japanese distri- bution system acts as a barrier against imports. This hypothesis is dis- cussed, for example, by Christelow (1985-86), the Advisory Committee for Trade Policy and Negotiations (1989), and Japan Economic Institute (1989).
2. Markets where businesses account for a large share of purchases tend to have relatively low import penetration. The excluded variable in this case is the share of purchases made by households, which has an implicit coef- ficient of zero. Goods purchased by businesses appear to have import pen- etration rates 15 percentage points lower than those purchased by house- holds.
3. Markets where the government accounts for a large share of purchases tend to have relatively low import penetration. Goods purchased by the government appear to have import penetration rates 16 percentage points lower than those purchased by households. (The difference between busi- ness and government import behavior is not statistically significant.)
4. Producer concentration is positively related both to import penetration and to exports. This is an unexpected finding, but consistent with recent industrial organization models of international trade. In models of oligo- polistic markets, concentrated industries sell into each other’s markets in order to take advantage of high prices and price elasticities abroad. Since industries that are concentrated in Japan are also concentrated abroad
In general, four variables play particularly significant roles:
16. The improvement of fit in the export equation is expected to be much smaller, since market- structure variables that might have a substantial effect on Japanese exports-variables that capture the effect of foreign market characteristics facing Japanese exporters-are not available for this study.
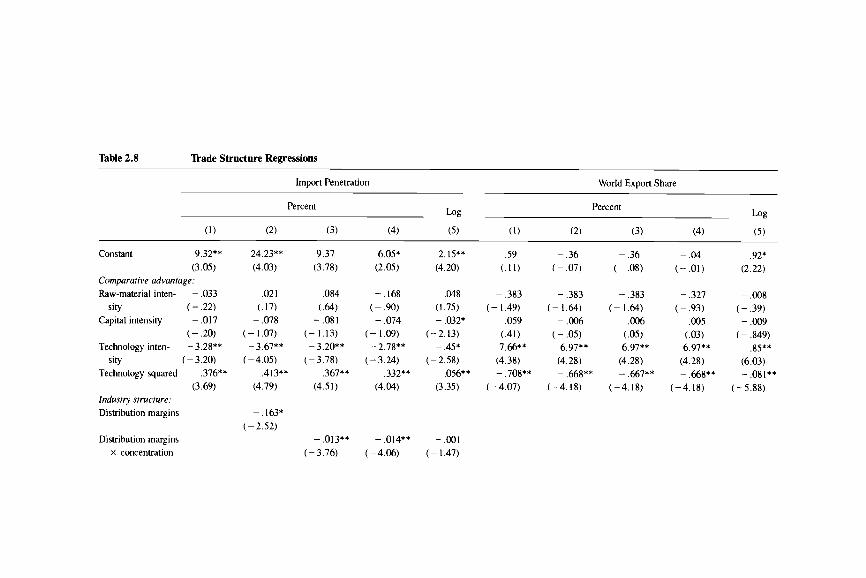
Table 2.8 lkade Structure Regressions
Import Penetration World Export Share
Percent Percent
Constant 9.32** (3.05)
Comparative advantage: Raw-material inten- - ,033
sity ( - .22) Capital intensity - ,017
( - .20) Technology inten- - 3.28**
sity ( - 3.20) Technology squared .376**
Industry structure: Distribution margins
(3.69)
Distribution margins X concentration
24.23** (4.03)
,021 (.17) - ,078
( - 1.07) -3.67**
(-4.05)
(4.79) .413**
- . l63* (-2.52)
9.37 (3.78)
,084 ( .64 - ,081
(-1.13) - 3.20**
( - 3.78)
(4.51) .367**
- .013** ( - 3.76)
6.05* (2.05)
- .I68 (-.W - ,074
(-1.09)
( - 3.24)
(4.04)
-2.78**
.332**
- .014** (-4.06)
2.15** (4.20)
.048 (1.75) - .032*
( - 2.13) - .45*
( - 2.58)
(3.35) .056**
- .001 ( - 1.47)
.59 (. 1 1 )
- .383 ( - 1.49)
.059 (.41) 7.66**
(4.38)
( - 4.07) - .708**
~ .36 ( - .07)
- .383 ( - 1.64) - .006
( - .05) 6.97"'
(4.28) - .668**
(-4.18)
- .36 (~ .08)
- ,383 ( - 1.64)
,006 ( . 0 3 6.97**
(4.28) - .667**
( - 4.18)
- .04 (-.01)
- ,327 ( - .93)
,005 (.03) 6.97**
(4.28) - .668**
(-4.18)
.92* (2.22)
- ,008 ( - .39) - ,009
( - ,849) .85**
(6.03)
(-5.88) - .08l**
Business markets
Business markets x concentration
Government mar- kets
Supply concentra- tion
Protection: Tariff and NTB tar-
iff equivalent Weightivalue
Statistics: R2 ,276 Adjusted R? .207 Standard Error 5.82 F 3.99
- .152** ( - 2,93)
-.I21 (-1.68)
(2.73) .196**
,458 .344
4.76 4.44
-.011** -.011** -.001*
-.177* - .178* - .063**
1.278** 1.325** .172**
(-3.62) (-3.60) (-2.42)
(-2.47) (-2.59) (-4.15)
(4.55) (4.68) (2.91)
.225 (1.45) 1.486
(1.77)
,504 ,547 ,450 ,400 .421 ,334
4.61 4.35 .94 5.33 5.07 4.29
.26 .26 .25 .02 ( I .94) (1.94) (1.77) ( I .54)
- ,346 ( - .21)
,337 ,386 ,386 ,386 ,491 ,273 .3 1 I ,294 ,276 ,415
9.94 9.04 9.04 9.04 .74 5.33 5.28 4.41 3.78 6.75
Note: Eq. ( 1 ) : OLS. Eq. (2)-(5): seemingly unrelated regressions. T-ratios are in parentheses *P = .05. **P = . O l .
74 Peter A. Petri
Table 2.9 ’kade Growth Regressions
Import Growth Export Growth
(1 ) (2) (1 ) (2)
Constant 1.04** 1.02** ,019 - ,025 (5.03) (4.99) (. 11) (-.16)
Comparative advantage: Raw-material intensity - .0033 - ,0081 - ,0083 - .0085
( - .30) ( - .7l) ( - .91) ( - 1.01) Capital intensity .0069 ,0095 ,0054 .0037
(1.12) (1.52) (1.04) (.76)
( - 3.81) (-3.54) (2.48) ( I .96) Technology intensity - .0769** - .0806** .0418* .0325*
Industry structure. Distribution margins x concentration
Business markets X concentration
Government markets
Supply concentration
.oO02 (.87) .oO03
(1.17) ,0055
(.97) - ,4270
( - .72) ,8179
(1.69)
Statistics: R2 ,253 ,281 .I84 .231
Standard Error ,424 ,402 .354 ,329 F 4.74 2.34 3. I6 3.15
Note: Eq. (1): OLS. Eq. (2): seemingly unrelated equations. 7’-ratios in parentheses. Dependent variable is log[x( l988)/x( 1985)], where x is exports or imports. *P = .05. **P = .01.
Adjusted R’ .201 ,152 .I27 ,158
(Caves 1976), it appears that strategic behavior in mutually concentrated industries tends to enhance intra-industry trade.
In interpreting these results, three caveats must be noted. First, since this study addresses only the effects of industrial organization variables in Japan, it cannot determine whether the variables examined have an unusual impact in Japan as compared to other countries. For example, it is possible that high household procurement or low distribution margins are also positively related to import penetration in, say, Germany.” We are not aware of other studies
17. Low distribution margins may be associated with high import penetration in general. As- sume, for example, some preference bias for domestic goods, implying that foreign products must enjoy a price advantage over similar domestic products in order to be imported. Now consider two different potential imports with the same relative producer’s price advantage over their domestic competitors. Of these two, the product with a lower domestic distribution margin will have a greater relative consumer’s price advantage (even if the exact same margin is applied to its domes- tic competitor) and is therefore more likely to be imported.
75 Market Structure, Comparative Advantage, and Japanese Trade
that have estimated these effects; clearly, it would be useful to know whether they can be found in other economies.
Second, the estimated effects provide information only on relative aspects of the trade performance. Consider a negative coefficient on, say, the distri- bution margin variable in the import equation. All that the foregoing analysis suggests is that high values of distribution are associated with low value of import penetration and vice versa; the analysis cannot determine whether high values of distribution are associated with too little imports, or low values of distribution with too much imports.
Third, the analysis cannot determine whether any particular relationship is good or bad from a welfare perspective. For example, even if it is known that close buyer-supplier relationships inhibit international trade, it does not fol- low that such inhibited trade is “distorted.” Indeed, such relationships may play a valuable economic role, say, by facilitating the diffusion of informa- tion and technology. Countries without such relationships may in effect import too much-that is, have a distorted trade profile relative to the welfare- maximizing benchmark.
The final group of variables show that explicit barriers, including protection and transportation costs, play a modest role in determining the relative trade performance of different industries. The coefficients of both the protection and transportation variables have incorrect signs and are not significantly different from zero. The likely reason for this is that there is very little formal protec- tion in Japanese manufacturing; average tariff rates are 4.1 percent and the tariff equivalent of NTBs is only 0.9 percent (Deardorff and Stem 1986). Transportation costs are proxied by weighthalue ratios; it is possible that transportation costs do not matter, or that more comprehensive measures of transportation and communication costs would produce better results.
To get a better sense of the estimated effects, let us abstract from the caveats and assume that the results reflect the popular hypotheses that distribution and government and business procurement depress Japanese imports. Consider some rough upper limits on the effects of eliminating these biases. Average import penetration rates in Japanese manufacturing in 1985 were approxi- mately 6 percent. Households account for one-third of manufactures demand, and business and government purchasing behavior was estimated to reduce import penetration, on average, by roughly 13.5 percentage points below household rates. Thus, if governments and businesses suddenly behaved like households, then manufactured imports would rise by .135 X .667, or 9 per- cent of manufactures demand. Similarly, average wholesale and retail margins in manufacturing were approximately 20 percent, and a I percent increase in such margins has been estimated to reduce import penetration by . I6 percent- age points of demand. Thus, if products requiring distribution suddenly achieved import penetration ratios similar to products that are sold directly to purchasers, then imports would increase by - .16 X - .20, or an additional 3.2 percent of demand.

76 Peter A. Petri
Together, the first-round effects appear to triple manufactures imports to 18 percent of demand. Of course, if imports of the manufactured products con- strained by these barriers increased, other imports would likely decline, yield- ing a substantially smaller net effect-say, a doubling of manufactured im- ports. This would represent a large change, but the resulting ratio of trade in manufactures relative to GNP (approximately 4 percent) would still amount to less than half that of the next-lowest-ranking industrial country (Takeuchi 1989a).
2.4.5 Recent Compositional Changes
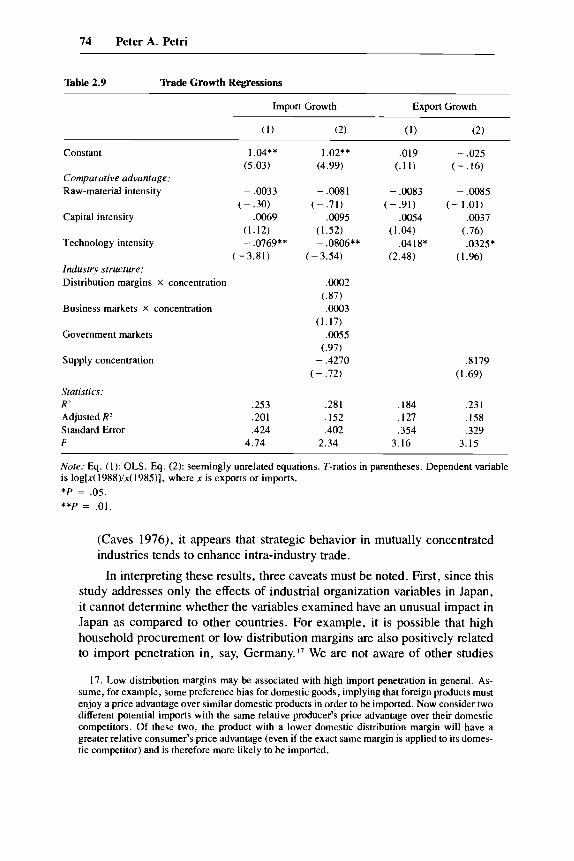
In light of the earlier discussion of structural change since 1985 in the ag- gregate import and export relationships, it is natural to ask whether these changes are related to changes in the determinants of import and export com- position. To this end, additional equations were estimated to see how import and export growth since 1985 have been affected by the explanatory variables used above. The dependent variables for this analysis, for both imports and exports, are the logs of the ratios of 1988 trade to 1985 trade.18
The import and export growth equations are presented in table 2.9. Com- parative advantage variables carry a substantial part of the explanation of trade growth rates and confirm the earlier finding of increasing specialization in technology-intensive products. Technology intensity is negatively related to import growth and positively related to export growth. l9 In these equations, raw material and capital intensity appear with the same signs in both equa- tions, presumably reflecting general trends in demand growth for these prod- ucts relative to demand for technology-intensive goods.
Market-structure variables are less helpful in explaining changes in exports and imports than trade composition at a particular time. In the case of import growth, none of the market-structure variables is significant at the 5 percent level. However, the coefficients for distribution margins, business purchases, and government purchases have signs opposite to those estimated in the earlier composition equations. In other words, it appears that import growth during the last three years has been faster in goods that had relatively low penetration ratios in 1985-that is, in goods with larger distribution margins and with markets dominated by business demand. These results, though statistically weak, are tantalizing in light of the earlier finding of structural chaqge in aggregate imports as well as anecdotal evidence on the development of dis- counted distribution channels.
18. The reason for using these dependent variables instead of changes in import penetration ratios and world export shares is that the denominators needed to construct these variables were not available for 1988.
19. In these equations there is no clear statistical preference for a quadratic technology term, and therefore the simpler single-variable specification is used.
77 Market Structure, Comparative Advantage, and Japanese Trade
2.5 Conclusions
This paper has collected evidence from several data sets regarding trends in Japanese trade behavior since the yen began its steep rise in 1985. On the whole, the evidence suggests that Japanese trade is changing in each of the three dimensions analyzed: in aggregate level, partner structure, and com- modity structure.
In line with historically estimated price elasticities, yen appreciation has only marginally reduced the dollar value of Japan’s large trade surplus. But there is some evidence that the “normalcy” of the trade balance hides departures by both imports and exports from historical relation- ships. Some researchers have concluded that export prices have risen less than suggested by historical pass-through relationships and that export market shares have been held unusually firmly. This paper has presented evidence that imports are now running 10-20 percent ahead of historically estimated import functions and that import functions based on recent data show increased sen- sitivity to economic determinants.
Japan has rapidly expanded its trade linkages with the East Asian NICs and developed countries other than the United States. This trade consists of the exchange of exports of advanced consumer goods and (espe- cially in the case of NICs) capital goods and sophisticated components, for imports of consumer goods (at both ends of the quality spectrum) and indus- trial supplies. The outlook for regional economic integration is bright, but the increase in intraregional trade so far has no more than retraced the decline in the relative importance of East Asian linkages since 1975. The data do not yet suggest a dramatically new regional economy.
Japanese trade data have been widely scrutinized for evi- dence that Japan imports fewer manufactured goods than other similarly en- dowed countries. This study does not compare Japanese trade to international norms, but it does provide new, related evidence regarding the determinants of Japanese trade. Among the conventional comparative advantage determi- nants, it appears that Japanese products are competitive in technology- intensive sectors (although not in the most technology intensive sectors).
It also appears that industry-structure variables are important correlates of trade performance:
products with high distribution margins are less likely to be imported than those with low margins, especially when the import-competing Japanese industry is concentrated;
products purchased by business are less likely to be imported than those pur- chased by households, especially when the import-competing Japanese in- dustry is concentrated;
products purchased by government are also less likely to be imported than those purchased by households;
Aggregate Trade.
Partner Trade.
Product Trade.
78 Peter A. Petri
products with high supplier concentration in Japan are more likely to be both exported and imported than other products.
As discussed in the text, these findings need cautious interpretation since they are consistent with several alternative hypotheses. Nevertheless, they represent the only empirical evidence we are aware of regarding the relation- ship between widely conjectured “causes” of Japan’s low imports of manufac- tured goods and measures of trade performance. This evidence needs to be further refined, but it suggests that distribution and business and government procurement are indeed negatively correlated with import penetration.
The effect of market-structure variables on recent changes in import pene- tration are opposite the effects of these variables on levels of penetration. Thus, while the trade structure regressions are consistent with some anti- import bias in the distribution system and in business and government pro- curement, the trade growth regressions suggest a diminution in this bias.
Overall, the changes reported in this paper raise intriguing questions about the evolution of Japan’s external sector. There is evidence of statistically sig- nificant breaks with the past, but the economic significance of the changes that can be documented at this time is limited. The key question is whether the changes observed so far represent shijits or trends. If, say a decade from now, Japan imports a wide range of goods for household, business, and gov- ernment uses, and engages in substantial intraindustry trade, perhaps with other East Asian countries, then 1985 will be seen as a turning point. But it is also possible that the changes identified so far are once-and-for-all shifts- completed responses to the appreciation of the yen. In this extreme, enduka and the changes it wrought have modest long-term significance. It is too soon to tell which scenario lies closer to the truth.
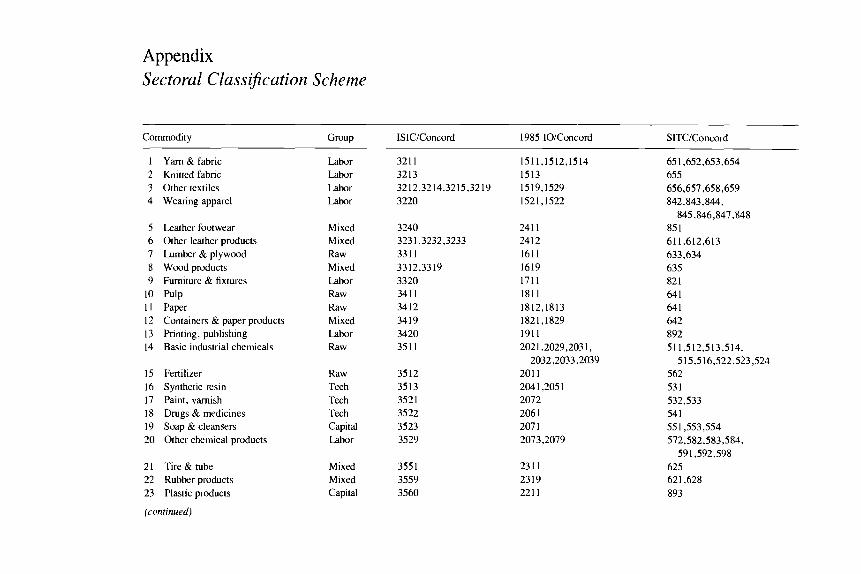
Appendix Sectoral Classification Scheme
Commodity Group ISlC/Concord 1985 IOiConcord SITC/Concord
I 2 3 4
5 6 I 8 9
10 11 12 13 14
15 16 17 18 19 20
21 22 23
Yam & fabric Knitted fabric Other textiles Wearing apparel
Leather footwear Other leather products Lumber & plywood Wood products Furniture & fixtures
Paper Containers & paper products Printing, publishing Basic industrial chemicals
Fertilizer Synthetic resin Paint, varnish Drugs & medicines Soap & cleansers Other chemical products
Tire & tube Rubber products Plastic products
Labor Labor Labor Labor
Mixed Mixed Raw Mixed Labor Raw Raw Mixed Labor Raw
Raw Tech Tech Tech Capital Labor
Mixed Mixed Capital
321 1 3213 3212,3214,3215,3219 3220
3240 3231,3232,3233 331 1 3312,3319 3320 341 I 3412 3419 3420 351 I
3512 3513 3521 3522 3523 3529
355 I 3559 3560
151 1,1512,1514 1513 1519,1529 1521,1522
241 1 2412 161 1 1619 171 1 1811 1812,1813 1821, I829 191 1 2021,2029,2031,
201 1 204 1,205 1 2072 206 1 207 1 2073,2079
2032,2033,2039
2311 2319 221 1
651,652,653,654 655 656,657,658,659 842,843,844,
85 1 611,612,613 633,634 635 82 1 641 641 642 892 51 1,512,513,514,
562 53 1 532,533 54 1
572,582,583,584, 591,592,598
625 621,628 893
845,846,847,848
5 1 5 3 16,522,523,524
551,553,554
(continued)
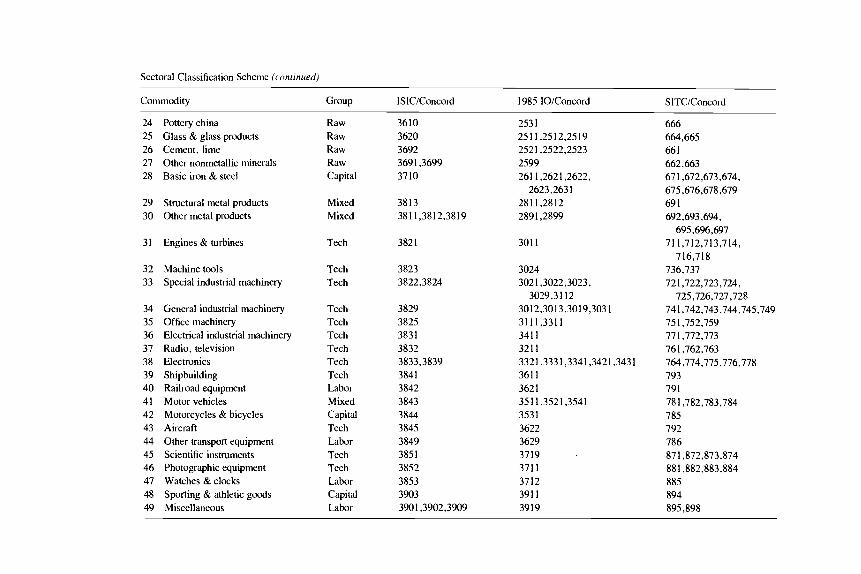
Sectoral Classification Scheme (cunrinued)
SlTCiConcord Commodity Group ISICiConcord 1985 IOiConcord
24 25 26 21 28
29 30
31
32 33
34 35 36 31 38 39 40 41 42 43 44 45 46 41 48 49
Pottery china Glass & glass products Cement, lime Other nonmetallic minerals Basic iron & steel
Structural metal products Other metal products
Engines & turbines
Machine tools Special industrial machinery
General industrial machinery Office machinery Electrical industrial machinery Radio, television Electronics Shipbuilding Railroad equipment Motor vehicles Motorcycles & bicycles Aircraft Other transport equipment Scientific instruments Photographic equipment Watches & clocks Sporting & athletic goods Miscellaneous
Raw Raw Raw Raw Capital
Mixed Mixed
Tech
Tech Tech
Tech Tech Tech Tech Tech Tech Labor Mixed Capital Tech Labor Tech Tech Labor Capital Labor
3610 3620 3692 3691,3699 3110
3813 381 1,3812,3819
3821
3823 3822,3824
3829 3825 3831 3832 3833,3839 3841 3842 3843 3844 3845 3849 385 1 3852 3853 3903 3901,3902,3909
253 1 25 I 1.25 12,25 19 2521,2522,2523 2599 261 1,2621,2622,
281 1,2812 2891.2899
2623,2631
301 1
3024 3021,3022,3023,
3029,3112 3012,3013,3019,3031 31 11.33 11 341 1 321 1 3321,3331,3341,3421,3431 361 1 3621 351 1,3521,3541 353 1 3622 3629 3119 311 1 3112 391 1 3919
666 664,665 66 1 662,663 611,612,613,614, 615,616,618,619 69 1 692,693,694,
695,696,691 71 1,712,113,714,
7 16,118 136,131 121,122,123,124,
741,742,743,144,145,149 751,152,159 111,112,113 161,162,163 164,714,175,116,118 193 191 181,182,783,784 785 192 186 871,872,873,874 881,882,883,884 885 894 895,898
125,126,121,128
81 Market Structure, Comparative Advantage, and Japanese Trade
References
Advisory Committee for Trade Policy and Negotiations. 1989. Analysis of the U S . - Japan Trade Problem. Washington, D.C.: U.S. Trade Representative.
Baldwin, Richard E. 1988. Hysteresis in Import Prices: The Beachhead Effect. Amer- ican Economic Review 78:773-85.
Baldwin, Robert E. 1971. Determinants of the Commodity Structure of U.S. Trade. American Economic Review 6 1 : 126-47.
. 1979. Determinants of Trade and Foreign Investment: Further Evidence. Re- view of Economics and Statistics 61 (February):40-48.
Caves, Richard, with Masu Uekusa. 1976. Industrial Organization. In Asia’s New Giant: How the Japanese Economy Works, ed. Hugh Patrick and Henry Rosovsky. Washington, D. C. : Brookings.
Chow, Gregory C. 1960. Tests of Equality between Sets of Coefficients in Two Linear Regressions. Econometrica 28 (July): 591-605.
Christelow, Dorothy. 1985-86. Japan’s Intangible Barriers to Trade in Manufactures. Federal Reserve Bank of New York Quarterly Review 10 (Winter): 1 1-18.
Corker, Robert. 1989. External Adjustment and the Strong Yen: Recent Japanese Ex- perience. Inlernaiional Monetary Fund Staff Papers 36, no. 2: 464-93.
Darlin, Damon. 1988. Japan Is Getting a Dose of What It Gave U.S.: Low-Priced Imports. Wall Street Journal, July 20, p. 1.
DeardorE, Alan V., and Robert M. Stern. 1986. The Michigan Model of World Pro- duction and Trade: Theory and Applications. Cambridge: MIT Press.
Dornbusch, Rudiger. 1988. Comment in NBER Macroeconomics Annual 1988, ed. Stanley Fisher, pp. 259-67. Cambridge, Mass.: MIT Press.
Harkness, Jon. 1978. Factor Abundance and Comparative Advantage. American Eco- nomic Review 68 (December): 784-800.
Helpman, Elhanan, and Paul R. Krugman. 1985. Market Structure and Foreign Trade: Increasing Returns, Imperfect Competition, and the International Economy. Cam- bridge, Mass.: MIT Press.
Hooper, Peter, and Catherine L. Mann. 1987. The U.S. External Trade Deficit: Its Causes and Persistence. International Finance Discussion Papers no. 316. Board of Governors of the Federal Reserve System, Washington, D.C.
. 1989. Exchange Rate Pass-through in the 1980s: The Case of U.S. Imports of Manufactures. Brookings Papers on Economic Activity, no. 1, pp. 297-331.
Japan Economic Institute. 1989. Japan’s Distribution System: The Next Major Trade Confrontation? JEI Report, no. 1 lA, March 17.
Lawrence, Robert Z. 1987. Imports in Japan: Closed Markets or Minds. Brookings Papers on Economic Activity, no. 2, pp. 511-54.
Leamer, Edward E. 1984. Sources of International Comparative Advantage. Cam- bridge, Mass.: MIT Press.
Leamer, Edward E., and Harry P. Bowen. 1981. Cross-Section Tests of the Heckscher- Ohlin Theorem: Comment. American Economic Review 71 (December): 1040-43.
Loopesko, Bonnie, E., and Robert A. Johnson. 1987. Realignment of the Yen-Dollar Exchange Rate: Aspects of the Adjustment Process in Japan,” International Finance Discussion Papers no. 3 11. Board of Governors of the Federal Reserve System, Washington, D.C.
Maidment, Paul. 1989. The Yen Bloc: A New Balance in Asia? The Economist, v. 71, July 15.
Marston, Richard. 1989. Pricing to Market in Japanese Manufacturing. University of Pennsylvania, Philadelphia.
Meyer, Michael, Yuriko Hoshiai, and Hideko Takayama. 1987. Harnessing the “Yen Monster.” Newsweek, September 21, p. 60.
82 Peter A. Petri
Ministry of International Trade and Industry (MITI). 1989. White Paper on Interna- tional Trade 1989, June. Tokyo: MITI.
Noland, Marcus. 1989. Japanese Trade Elasticities and the J-Curve. Review of Eco- nomics and Statistics 71 (February): 175-79.
Ohno, Kenichi. 1988. Export Pricing Behavior of Manufacturing: A U.S.-Japan Com- parison. Working Paper no. WP-88-78. International Monetary Fund, Washington, D.C.
Petri, Peter A. 1984. Modeling Japanese-American Trade: A Study of Asymmetric Interdependence. Cambridge, Mass. : Harvard University Press.
Rapoport, Carla. 1989. Ready, Set, Sell-Japan Is Buying. Fortune, September 11,
Saxonhouse, Gary. 1983. The Micro- and Macroeconomics of Foreign Sales to Japan. In Trade Policy for the I980s, ed. William R . Cline. Cambridge, Mass.: MIT Press.
Saxonhouse, Gary, and Robert M. Stem. 1989. An Analytical Survey of Formal and Informal Barriers to International Trade and Investment in the United States, Can- ada, and Japan. In Trade and Investment Relations among the United States, Can- ada, and Japan, ed. Robert M. Stem. Chicago: University of Chicago Press.
Takeuchi, Kenji. 1989a. Japan’s Market Potential for Manufactured Imports from De- veloping Economies: A Survey of the Literature. Washington, D.C.: World Bank.
. 1989b. Effects of Japanese Direct Foreign Investment on Japan’s Imports of Manufactures from Developing Economies. Washington, D.C.: World Bank.
World Bank. 1987. Korea: Managing the Industrial Transition. Washington, D.C.
pp. 159-64.
Comment Daniel A. Citrin
Peter Petri’s paper provides an interesting analysis of recent developments in Japanese trade flows. I focus my comments on the section that deals with structural changes to aggregate Japanese trade, and on that which looks at the product composition of Japanese trade.
On Structural Changes in Aggregate lkade
The first portion of the paper reviews and presents further evidence, based on the predictive abilities of standard trade equations, that suggests structural changes have affected Japanese export and import behavior in recent years.
With regard to exports, updated predictions of Corker’s model through 1988 do indeed indicate a continued underprediction of export volume (and value). This underprediction is reflected in a rise in the measured income elas- ticity and a fall in the relative price elasticity when the export volume equation is estimated through 1988.
Before reaching any conclusions however, I would note the following. First, Japanese exports, especially of capital goods, were pushed up consid- erably in 1988 by the global investment boom as well as by direct investment
Daniel A. Citrin is a senior economist in the Asian Department of the International Monetary Fund.
83 Market Structure, Comparative Advantage, and Japanese Trade
overseas by Japanese firms. The activity variable in the export volume equa- tion would not fully capture this investment-oriented demand. Second, some preliminary results of further work on measuring competing prices indicates that Japanese exporters may have lost less competitiveness since 1985 than had been previously estimated. This result largely reflects the use of competi- tor weights that assign a larger weight to non-U.S. third-country suppliers- both European countries and the NICs-against whom the real effective appreciation of the yen has been smaller. In addition, use of a fixed-weight manufacturing export unit value for the United States, rather than nonoil ex- port unit values results in higher competing U.S. export prices. Of course, one would expect the use of such a revised indicator of competitiveness to predict higher Japanese exports over the recent period.
On imports, updated predictions of Corker’s model show an increasing underprediction of Japanese import volumes. At the same time, estimation results indicate a significant rise in the relative price elasticity of Japanese imports, particularly of manufactured imports. These results are in line with those contained in the paper and indeed would suggest an increased prefer- ence for imported goods on the part of Japanese consumers as well as positive effects of trade liberalization. The results do not seem to reflect the drop in the household saving rate or the strength of investment in Japan, since the mea- sured income elasticity is unchanged. A recent Bank of Japan study also yielded substantial underpredictions using disaggregated equations where the real consumption and capital goods shipments were used as the relevant do- mestic activity variables. ’
More generally, however, I think that it is important to remember-and particularly when forecasting future movements in Japanese trade flows-that the increases in measured elasticities are likely picking up the temporary ef- fects of structural transition or adjustments. Once the shift in preferences, or the adjustment to a more liberal trade regime has taken place, it is by no means certain that the elasticities will remain at these higher levels.
On the Product Composition of Wade
The portion of the paper that analyzes the commodity structure of Japanese exports and imports is the most interesting part of the paper and thus naturally the most difficult to comment on. I would like to offer the following remarks.
1. To what extent is the use of 1985 data in the cross-sectional analysis influencing the results of estimation? This was the year that the Japanese econ- omy was subjected to a large exchange rate shock. As a result, real product prices changed substantially, and producers must not have operated on their long-run equilibrium supply curves. In particular, there were substantial
I . Bank of Japan, “Balance of Payments Adjustment in Japan: Recent Developments and Pros- pects,” Research and Statistics Department, Special Paper no. 178 (May 1989).
84 Peter A. Petri
swings in producers’ profit shares, which, inclusive of depreciation, is the measure of capital intensity in the paper. As the exchange rate shock presum- ably had differential impacts across the spectrum of industries in the sample, one would think that the estimation results would have been affected substan- tially.
2. The significance of the consumer-markets variable in the import penetra- tion equations could be picking up the influence of comparative advantage. Namely, to the extent that the consumer goods industries are relatively labor- intensive ones in which Japan had already lost comparative advantage by 1985, one would expect that the import-market share would be higher.
3. As I think the paper itself acknowledges, the distribution margin variable is itself an endogenous variable and thus its estimated coefficient is subject to simultaneity bias. In other words, one would expect low rates of import pen- etration to lead to rents and to higher distribution margins, particularly in a country where close relationships between manufacturers and distributors are common. Moreover, the existence of large margins does not necessarily imply the existence of import restraints. They could just reflect the often-noted ob- servations that the Japanese place a high premium on service and have a high degree of brand loyalty. Thus, I am not convinced that the results can be used to claim that the Japanese distribution system acts as a barrier to imports.
4. In a similar vein, the paper argues that markets where businesses account for a large share of purchases tend to have relatively low rates of import pen- etration. However, this does not necessarily reflect an anti-import bias amongst Japanese producers. Rather, it could reflect a production structure that is not vertically integrated in a formal sense, but one in which affiliated producers supply goods to other business customers that are tailored to their specific demands.
In sum, it is not at all clear what the market-structure variables are actually capturing. Thus, while the paper presents some interesting correlations, these results should not be taken as new evidence regarding the determinants of Japanese trade.