this simple definition regards predictive analytics’ output … · · 2012-03-07synonyms of...
TRANSCRIPT

0
1
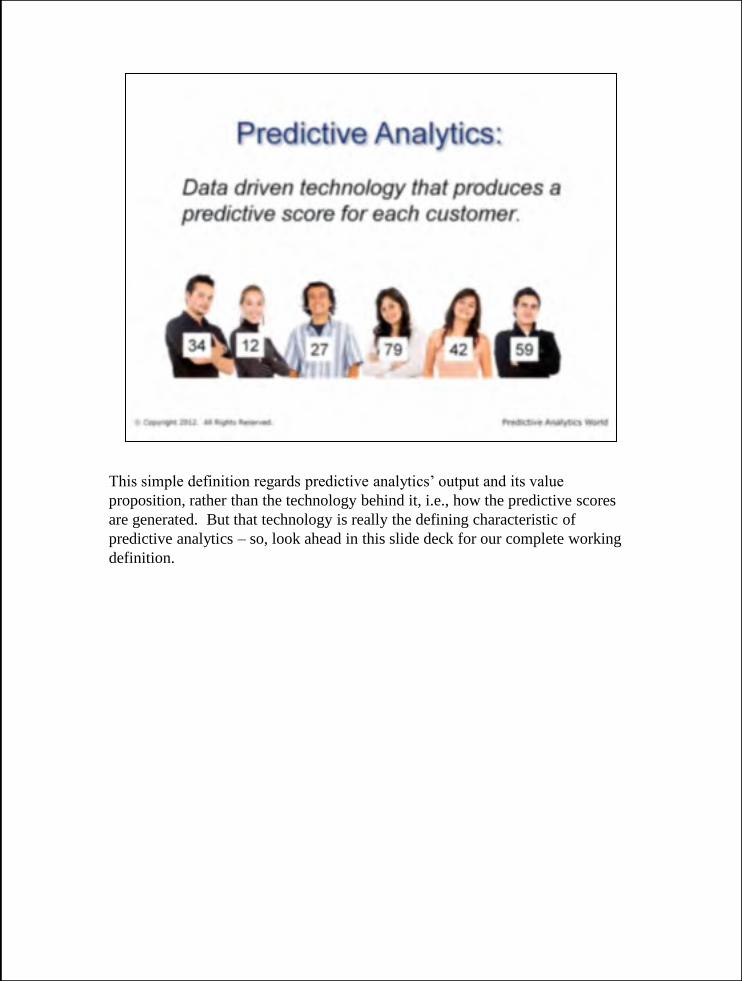
This simple definition regards predictive analytics’ output and its value
proposition, rather than the technology behind it, i.e., how the predictive scores
are generated. But that technology is really the defining characteristic of
predictive analytics – so, look ahead in this slide deck for our complete working
definition.
3
4
6

7

8

10
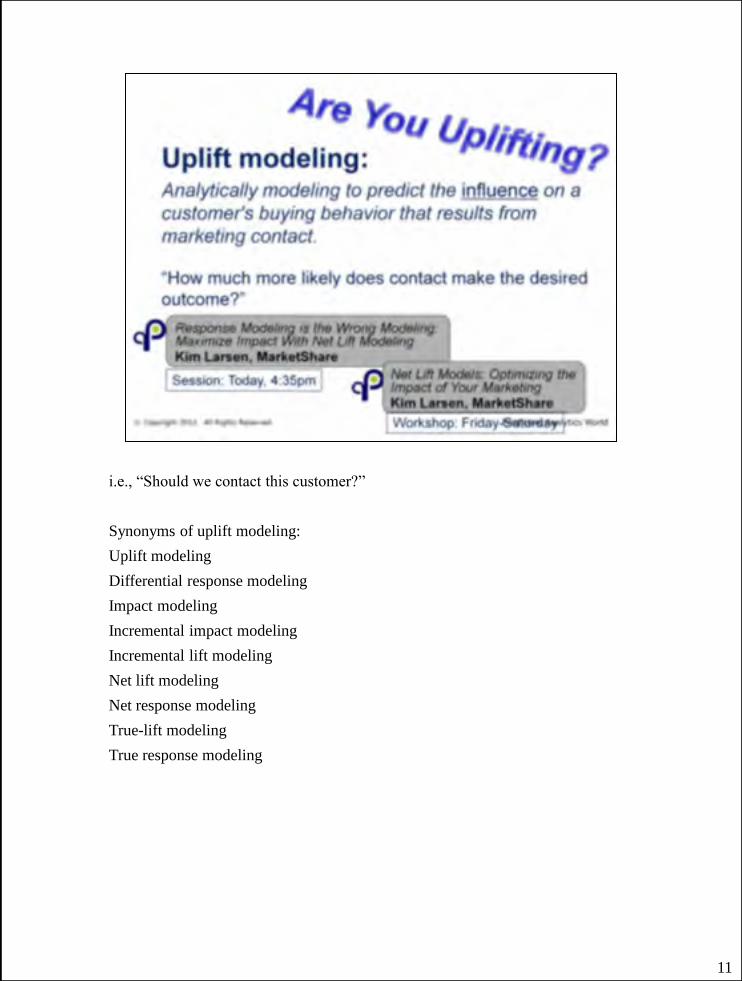
i.e., “Should we contact this customer?”
Synonyms of uplift modeling:
Uplift modeling
Differential response modeling
Impact modeling
Incremental impact modeling
Incremental lift modeling
Net lift modeling
Net response modeling
True-lift modeling
True response modeling
11
Does contacting the customer make them more likely to respond?
MEDICAL:
Will the patient survive if treated?
"My headache went away!“ Proof of causality by example.
Driving medical decisions with personalized medicine: selecting treatment, e.g.,
treating heart failure with betablockers
Personalized medicine. Naturally, healthcare is where the term treatment
originates. While one medical treatment may deliver better results on average
than another, personalized medicine aims to decide which treatment is best suited
for each patient, since a treatment that helps one patient could hurt another. For
example, to drive beta-blocker treatment decisions for heart failure, researchers
"use two independent data sets to construct a systematic, subject-specific
treatment selection procedure." (Claggett et al 2011) Certain HIV treatment is
shown more effective for younger children. (McKinney et al 1998) Cancer
treatments are targeted by the patient's genes. (Winslow 2011)
Brian Claggett, Lihui Zhao, Lu Tian, Davide Castagno, and L. J. Wei.
"Estimating Subject-Specific Treatment Differences for Risk-Benefit Assessment
with Competing Risk Event-Time Data." Harvard University Biostatistics
12

13

15
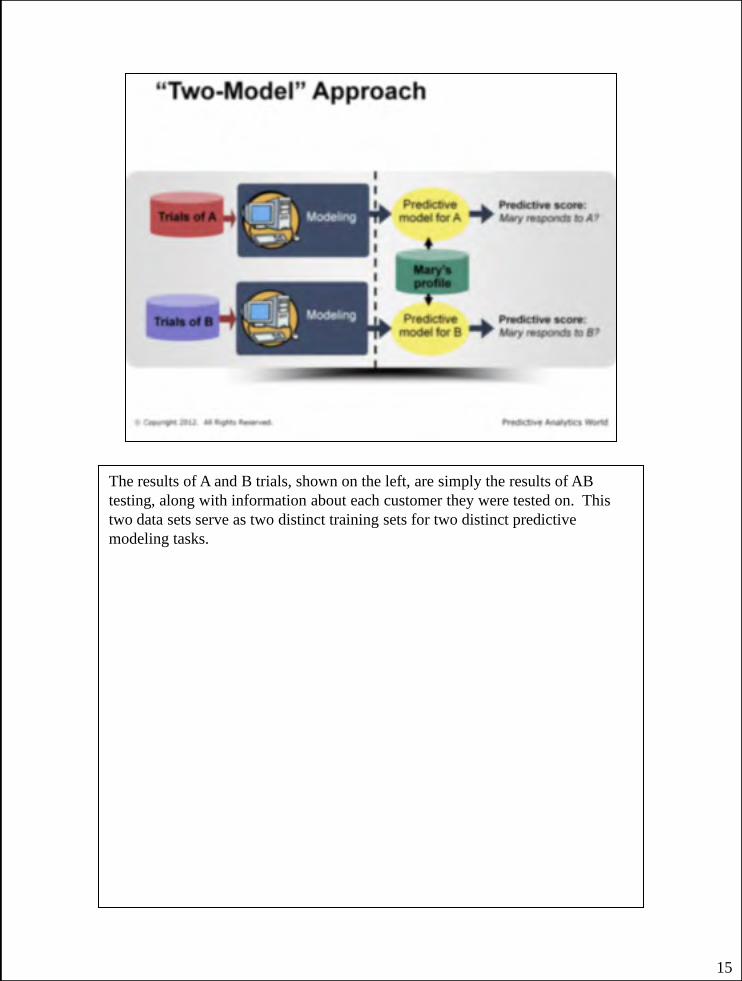
The results of A and B trials, shown on the left, are simply the results of AB
testing, along with information about each customer they were tested on. This
two data sets serve as two distinct training sets for two distinct predictive
modeling tasks.

16
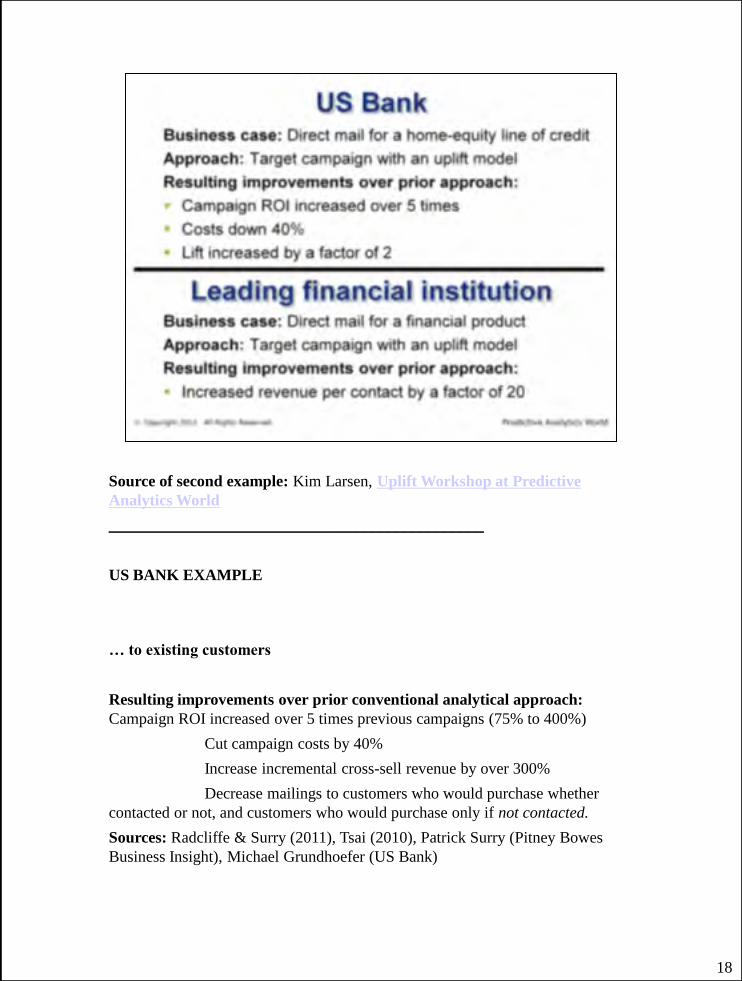
Source of second example: Kim Larsen, Uplift Workshop at Predictive
Analytics World
_______________________________________________
US BANK EXAMPLE
… to existing customers
Resulting improvements over prior conventional analytical approach:
Campaign ROI increased over 5 times previous campaigns (75% to 400%)
Cut campaign costs by 40%
Increase incremental cross-sell revenue by over 300%
Decrease mailings to customers who would purchase whether
contacted or not, and customers who would purchase only if not contacted.
Sources: Radcliffe & Surry (2011), Tsai (2010), Patrick Surry (Pitney Bowes
Business Insight), Michael Grundhoefer (US Bank)
18

Graph image reproduced with permission, courtesy of Kane et al (2011), as
depicted in their Predictive Analytics World presentation
19
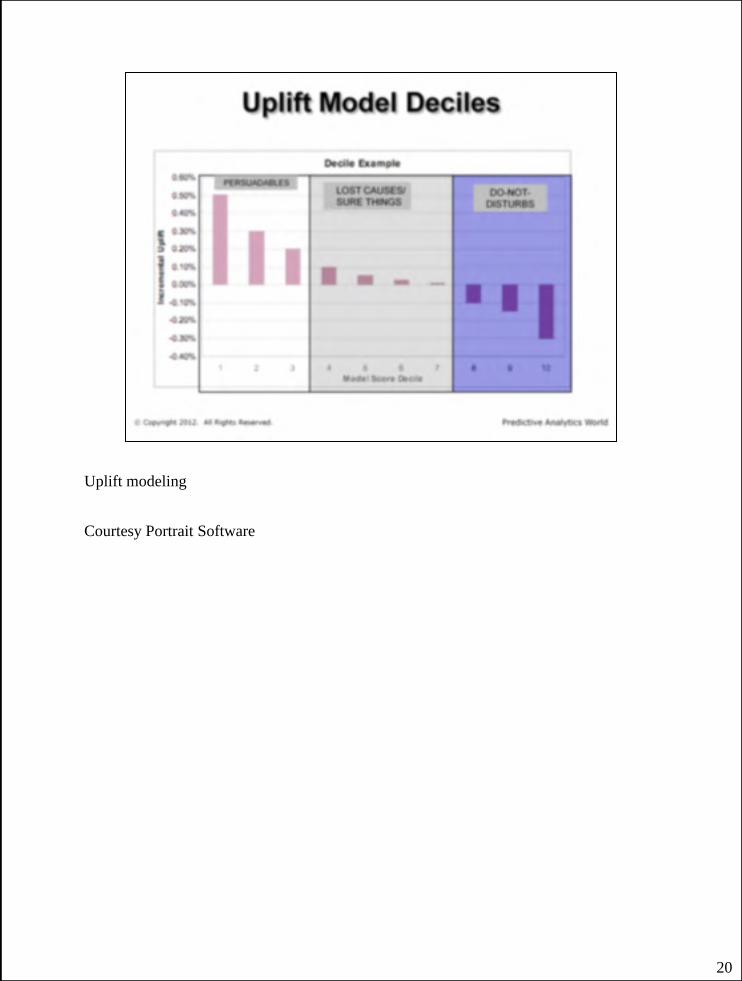
20
Uplift modeling
Courtesy Portrait Software

21
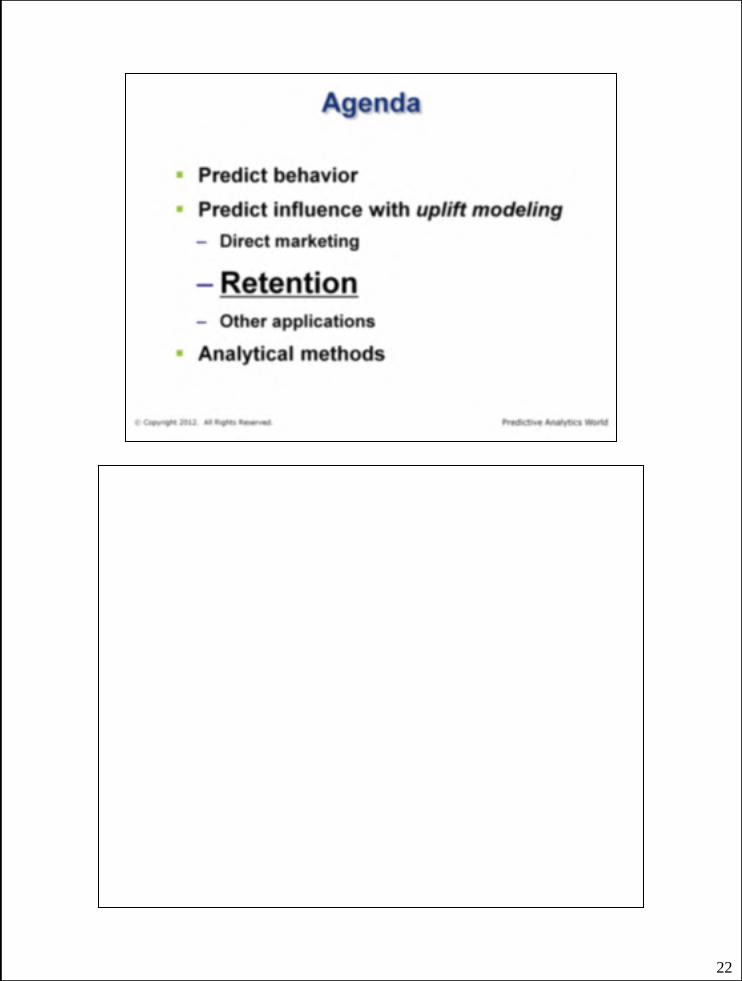
22
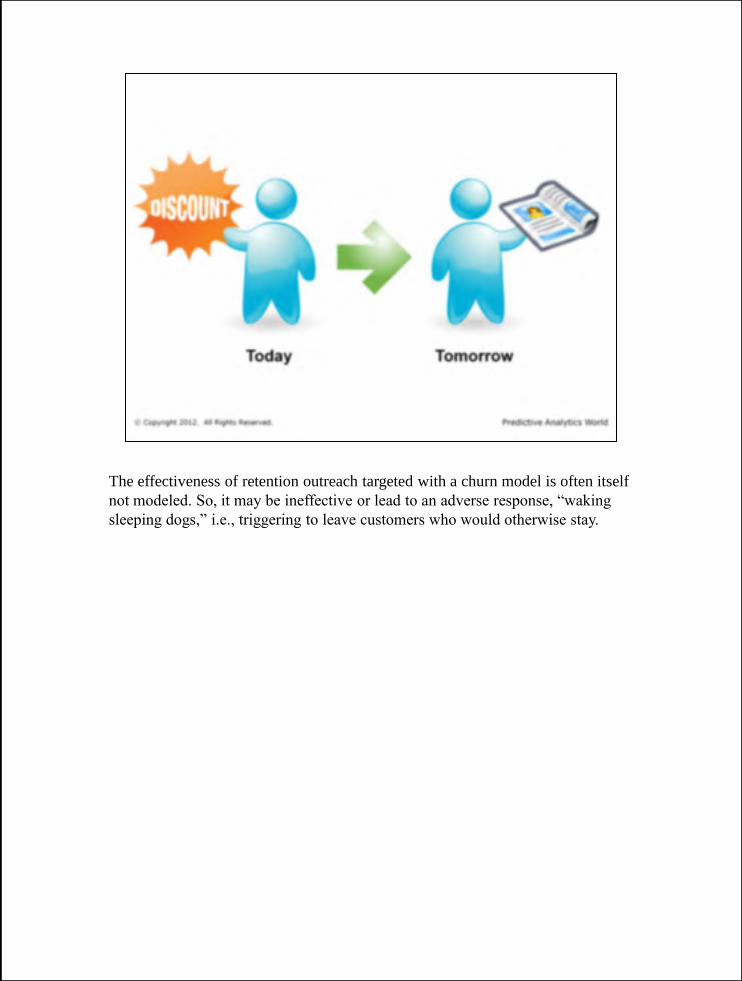
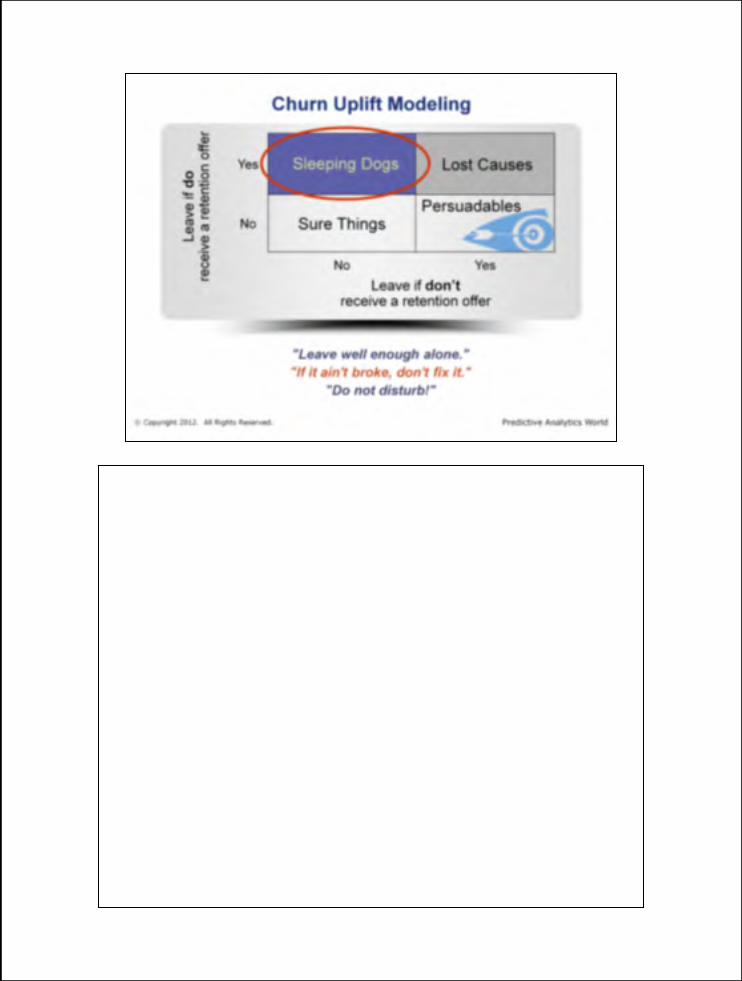
The effectiveness of retention outreach targeted with a churn model is often itself
not modeled. So, it may be ineffective or lead to an adverse response, “waking
sleeping dogs,” i.e., triggering to leave customers who would otherwise stay.
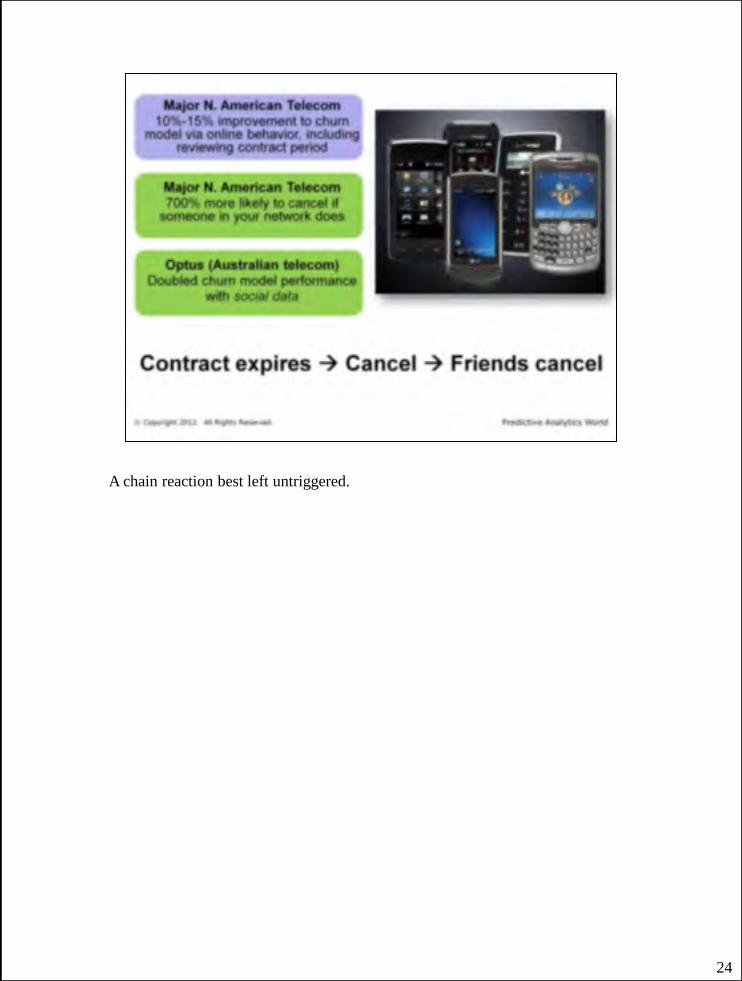
A chain reaction best left untriggered.
24

25


Improvements are relative to their existing best-practice retention models.
Case study presented at Predictive Analytics World, February 2009, San
Francisco.
Case study and graph courtesy of Pitney Bowes Business Insight.
30

31

32

33
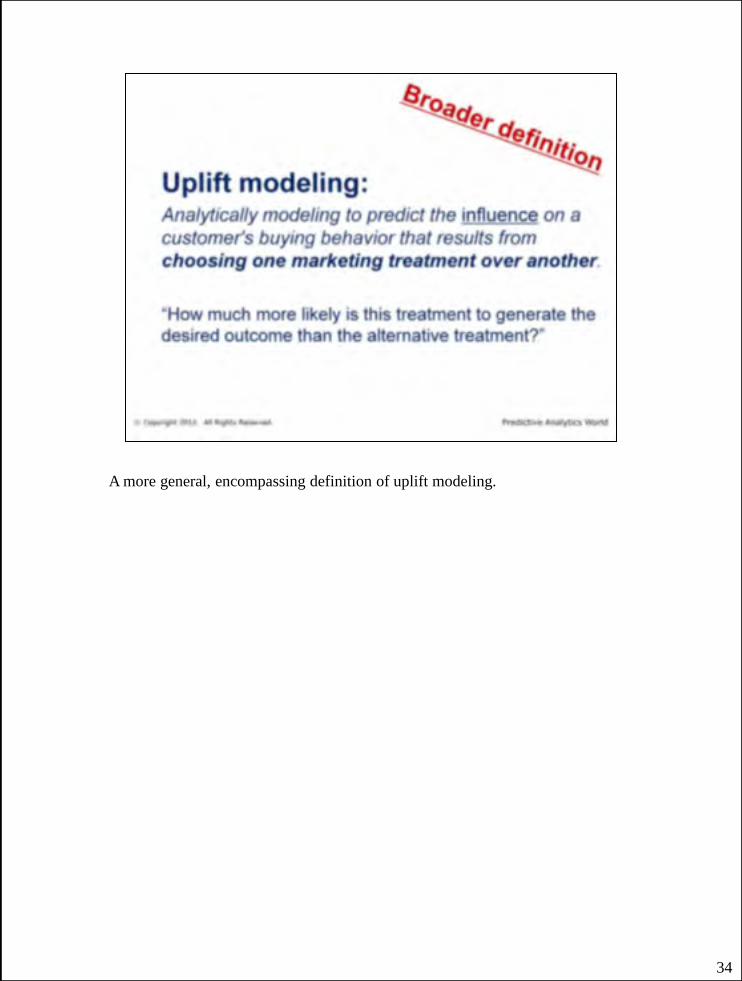
A more general, encompassing definition of uplift modeling.
34

35
Could be the results of a simple A/B test.
36
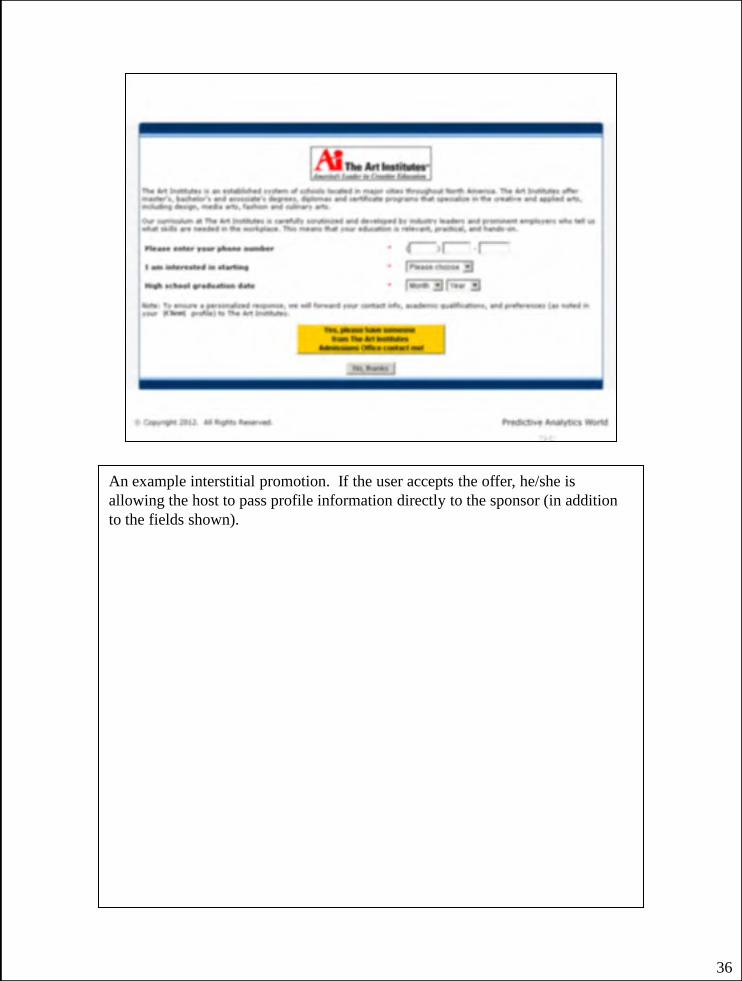
An example interstitial promotion. If the user accepts the offer, he/she is
allowing the host to pass profile information directly to the sponsor (in addition
to the fields shown).
37
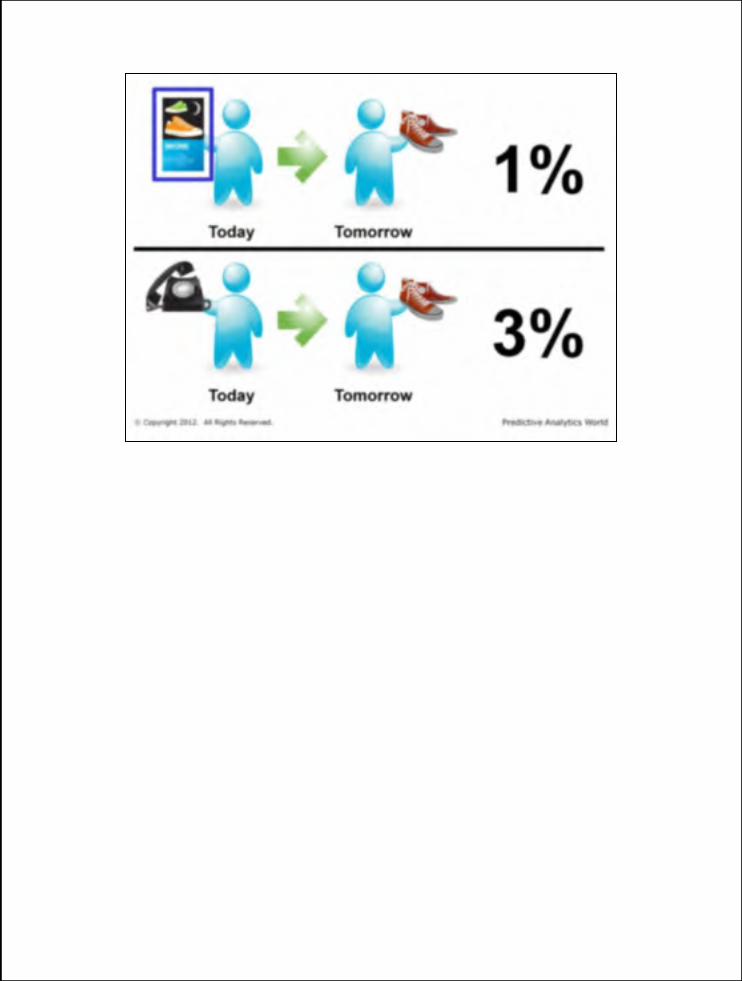
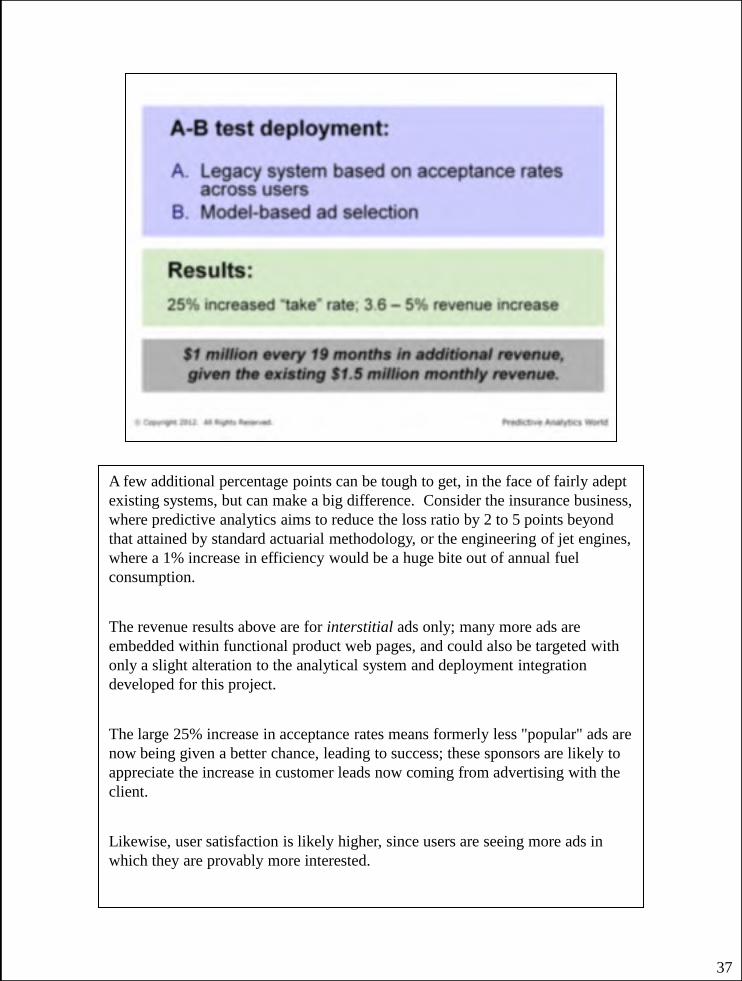
A few additional percentage points can be tough to get, in the face of fairly adept
existing systems, but can make a big difference. Consider the insurance business,
where predictive analytics aims to reduce the loss ratio by 2 to 5 points beyond
that attained by standard actuarial methodology, or the engineering of jet engines,
where a 1% increase in efficiency would be a huge bite out of annual fuel
consumption.
The revenue results above are for interstitial ads only; many more ads are
embedded within functional product web pages, and could also be targeted with
only a slight alteration to the analytical system and deployment integration
developed for this project.
The large 25% increase in acceptance rates means formerly less "popular" ads are
now being given a better chance, leading to success; these sponsors are likely to
appreciate the increase in customer leads now coming from advertising with the
client.
Likewise, user satisfaction is likely higher, since users are seeing more ads in
which they are provably more interested.
38
39
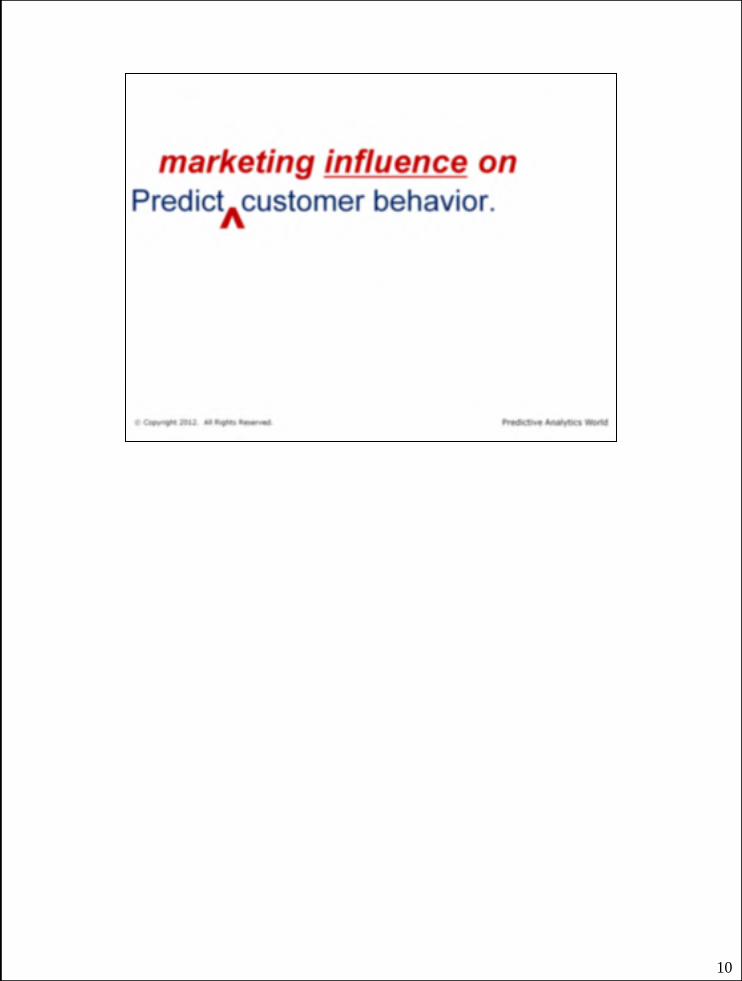
Persuasion; influence.
40

41
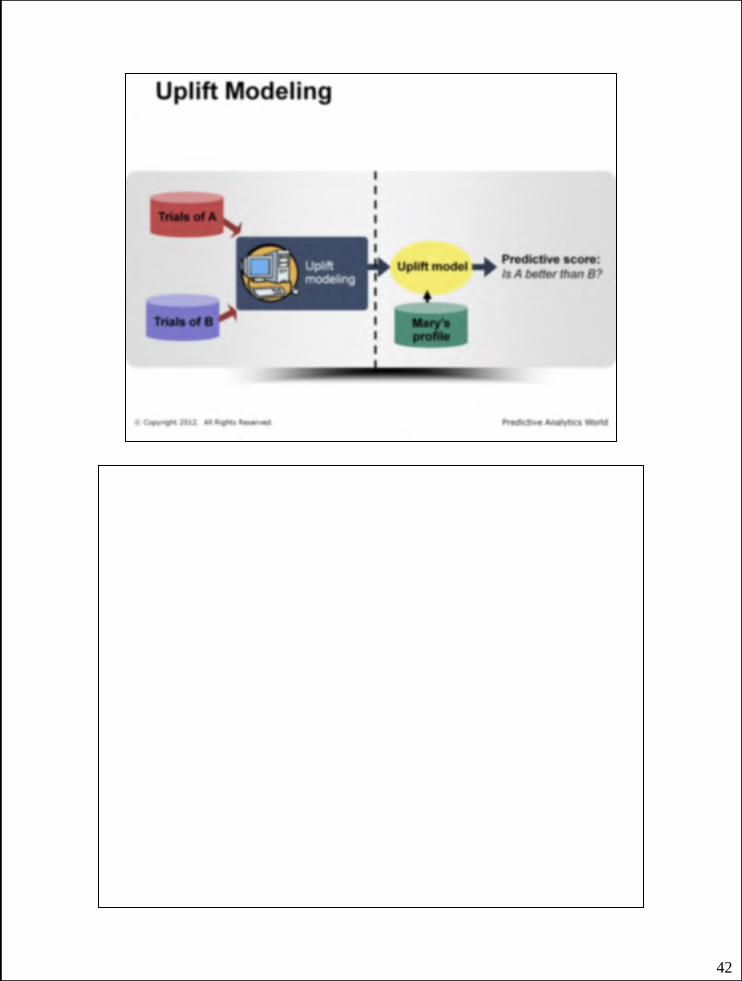
The results of A and B trials, shown on the left, are simply the results of AB
testing, along with information about each customer they were tested on. This
two data sets serve as two distinct training sets for two distinct predictive
modeling tasks.
42
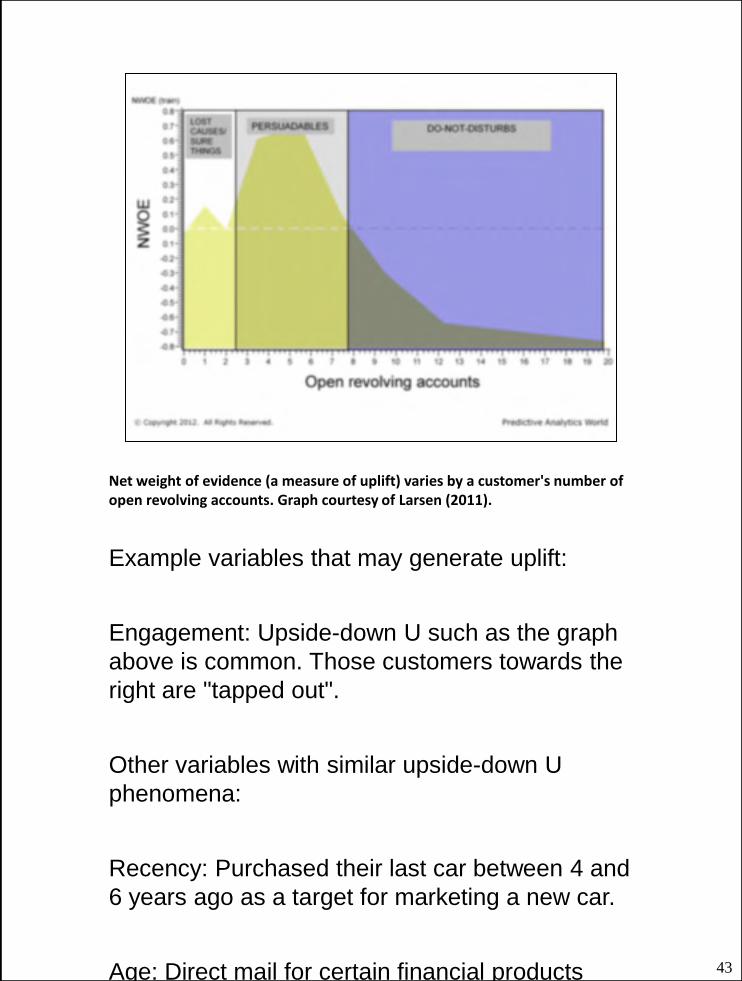
Net weight of evidence (a measure of uplift) varies by a customer's number of open revolving accounts. Graph courtesy of Larsen (2011).
Example variables that may generate uplift:
Engagement: Upside-down U such as the graph
above is common. Those customers towards the
right are "tapped out".
Other variables with similar upside-down U
phenomena:
Recency: Purchased their last car between 4 and
6 years ago as a target for marketing a new car.
Age: Direct mail for certain financial products
may have a stronger uplift for customers higher
43
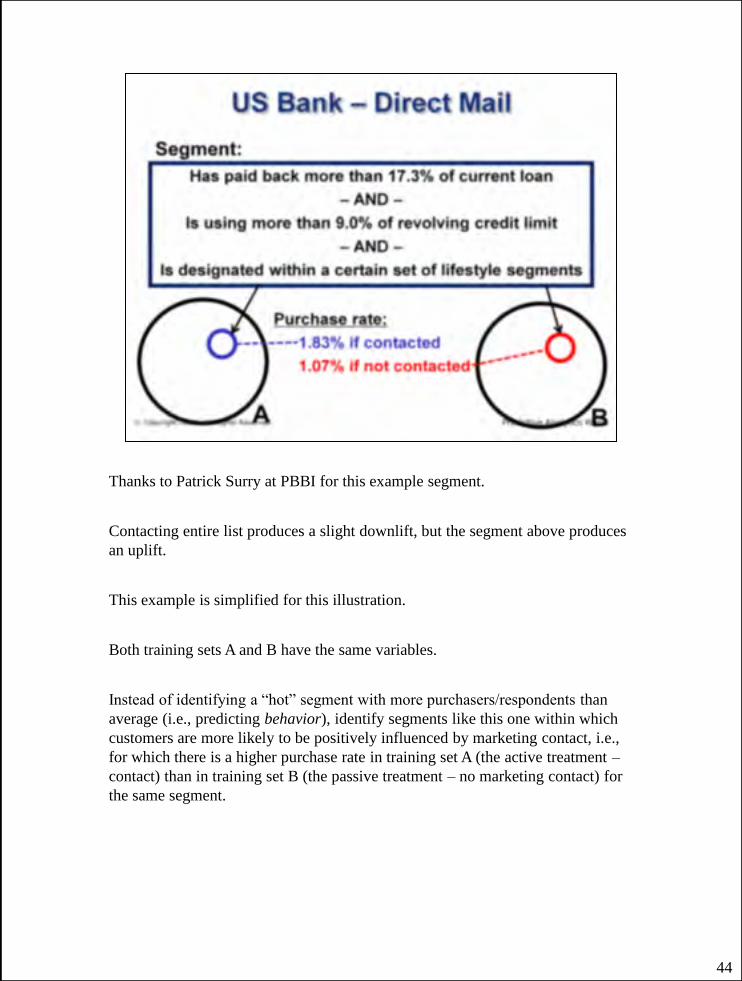
Thanks to Patrick Surry at PBBI for this example segment.
Contacting entire list produces a slight downlift, but the segment above produces
an uplift.
This example is simplified for this illustration.
Both training sets A and B have the same variables.
Instead of identifying a “hot” segment with more purchasers/respondents than
average (i.e., predicting behavior), identify segments like this one within which
customers are more likely to be positively influenced by marketing contact, i.e.,
for which there is a higher purchase rate in training set A (the active treatment –
contact) than in training set B (the passive treatment – no marketing contact) for
the same segment.
44

45

(This paper in turn references all the core technical papers on this topic.)
Free white paper: www.predictiveanalyticsworld.com/signup-uplift-
whitepaper.php
46
47

48
