threats to water quality in the deep basalt aquifer, city ... · pdf filethreats to water...
TRANSCRIPT

Threats to Water Quality in the Deep Basalt Aquifer, City of Walla Walla, Washington By Mary Jane Coombs1
A thesis in partial fulfillment of a Bachelor of Arts degree in
Geology/Environmental Studies
Whitman College
2000*
1 Dept. of Geological Sciences, University of California, Santa Barbara, Calif. 93106-9630; [email protected]* published April 2002

2
Contents
Abstract ----------------------------------------------------------------------------------------------------------01
Introduction -----------------------------------------------------------------------------------------------------01
Hydrogeology---------------------------------------------------------------------------------------------------02
History of the municipal water supply---------------------------------------------------------------------04
Columbia River Basalt Group groundwater characteristics -----------------------------------------05
State of groundwater in Walla Walla----------------------------------------------------------------------08
Water quality and laws ---------------------------------------------------------------------------------------09
Health risks -----------------------------------------------------------------------------------------------------10
Arsenic------------------------------------------------------------------------------------------------------10
Calcium-----------------------------------------------------------------------------------------------------11
Chloride-----------------------------------------------------------------------------------------------------11
Chromium--------------------------------------------------------------------------------------------------11
Copper ------------------------------------------------------------------------------------------------------11
Fluoride -----------------------------------------------------------------------------------------------------11
Iron-----------------------------------------------------------------------------------------------------------11
Lead ---------------------------------------------------------------------------------------------------------12
Magnesium ------------------------------------------------------------------------------------------------12
Manganese ------------------------------------------------------------------------------------------------12
Nitrate -------------------------------------------------------------------------------------------------------12
Sulfate ------------------------------------------------------------------------------------------------------12
Color---------------------------------------------------------------------------------------------------------12
Hardness ---------------------------------------------------------------------------------------------------12
Total dissolved solids (TDS)---------------------------------------------------------------------------13
Turbidity ----------------------------------------------------------------------------------------------------13
Data---------------------------------------------------------------------------------------------------------------13
Data analyses---------------------------------------------------------------------------------------------13
Summary and recommendations --------------------------------------------------------------------------16
Acknowledgments---------------------------------------------------------------------------------------------17
References------------------------------------------------------------------------------------------------------17
Appendix A: Full data set ------------------------------------------------------------------------------------19
Appendix B: Time-of-travel zones -------------------------------------------------------------------------25
1
Threats to Water Quality in the Deep Basalt Aquifer, City of Walla Walla, Washington
By Mary Jane Coombs
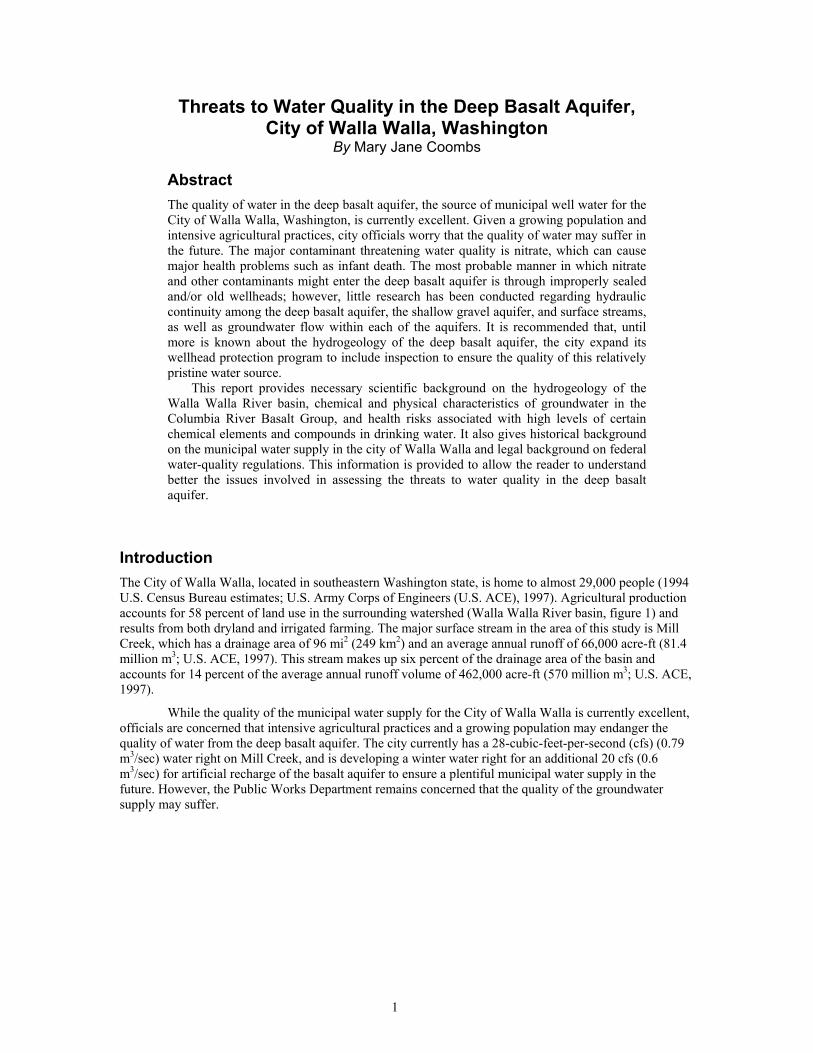
AbstractThe quality of water in the deep basalt aquifer, the source of municipal well water for the City of Walla Walla, Washington, is currently excellent. Given a growing population and intensive agricultural practices, city officials worry that the quality of water may suffer in the future. The major contaminant threatening water quality is nitrate, which can cause major health problems such as infant death. The most probable manner in which nitrate and other contaminants might enter the deep basalt aquifer is through improperly sealed and/or old wellheads; however, little research has been conducted regarding hydraulic continuity among the deep basalt aquifer, the shallow gravel aquifer, and surface streams, as well as groundwater flow within each of the aquifers. It is recommended that, until more is known about the hydrogeology of the deep basalt aquifer, the city expand its wellhead protection program to include inspection to ensure the quality of this relatively pristine water source.
This report provides necessary scientific background on the hydrogeology of the Walla Walla River basin, chemical and physical characteristics of groundwater in the Columbia River Basalt Group, and health risks associated with high levels of certain chemical elements and compounds in drinking water. It also gives historical background on the municipal water supply in the city of Walla Walla and legal background on federal water-quality regulations. This information is provided to allow the reader to understand better the issues involved in assessing the threats to water quality in the deep basalt aquifer.
Introduction The City of Walla Walla, located in southeastern Washington state, is home to almost 29,000 people (1994 U.S. Census Bureau estimates; U.S. Army Corps of Engineers (U.S. ACE), 1997). Agricultural production accounts for 58 percent of land use in the surrounding watershed (Walla Walla River basin, figure 1) and results from both dryland and irrigated farming. The major surface stream in the area of this study is Mill Creek, which has a drainage area of 96 mi2 (249 km2) and an average annual runoff of 66,000 acre-ft (81.4 million m3; U.S. ACE, 1997). This stream makes up six percent of the drainage area of the basin and accounts for 14 percent of the average annual runoff volume of 462,000 acre-ft (570 million m3; U.S. ACE, 1997).
While the quality of the municipal water supply for the City of Walla Walla is currently excellent, officials are concerned that intensive agricultural practices and a growing population may endanger the quality of water from the deep basalt aquifer. The city currently has a 28-cubic-feet-per-second (cfs) (0.79 m3/sec) water right on Mill Creek, and is developing a winter water right for an additional 20 cfs (0.6 m3/sec) for artificial recharge of the basalt aquifer to ensure a plentiful municipal water supply in the future. However, the Public Works Department remains concerned that the quality of the groundwater supply may suffer.

2
Figure 1.—Walla Walla River basin.
Although some municipal wells are used only in the case of an emergency, such an emergency has occurred. In 1996 a major flood washed out sections of the Mill Creek pipeline, which delivers water from the city’s protected watershed to Walla Walla; between the months of February and May, all municipal water came from wells (Economic and Engineering Services, Inc. (EES), 1998). After the February floods, more than 50 percent of tested domestic wells were found to be contaminated with bacteria (Walla Walla County-City Health Department, 1997). A recent city report also noted that abandoned wells pose a threat to water quality within the basalt aquifer (EES, 1998). City employees are especially concerned that nitrates from fertilized croplands may contaminate the basalt aquifer. Although municipal water-consumption needs are small in comparison to the water-consumption needs of agriculture, water quality is a more important issue for the municipality than for the farmer.
Hydrogeology The Walla Walla River basin has an area of 1,758 mi2 (4,553 km2), with a semiarid climate, and an annual precipitation ranging from 10 in. (25 cm) at the mouth of the Walla Walla River to 40 in. (100 cm) at the headwaters (U.S. ACE, 1997). The average annual temperature in the City of Walla Walla, located slightly southwest of the center of the basin, is 47.6 ºF (8.7 ºC) (Rousu, 2000). Streamflow primarily comes from Mill Creek and the Walla Walla and Touchet Rivers, and most flow occurs during the winter months (MacNish and others, 1973).
The deep basalt aquifer is contained within the Columbia River Basalt Group (CRBG); 99 percent of the volume of the CRBG was erupted between 16.5 and 14 million years B.P., with additional flows occurring as recently as 6 million years B.P. These Miocene basalts have an estimated area of 163,700 km2

3
and an estimated volume of 174,300 km3 (Tolan and others, 1989), and are up to 8,000 ft (2,400 m) thick in parts of the valley. Fissures in the Blue Mountains produced the basalt flows found throughout the Walla Walla Valley. The most important part of the CRBG in the Walla Walla area is the Wanapum Basalt, as most municipal wells tap this section of flows (EES, 1998). Also present are the Saddle Mountains Basalt, which is very thin in the area, and the Grande Ronde Basalt, which few wells are deep enough to tap.
The basalt aquifer covers 200 mi2 (520 km2) in the central Walla Walla Valley, can yield 20 to 4,000 gpm (1.3 to 190 L/s) at an individual well, and is overlain by a shallow gravel aquifer (MacNish and others, 1973; EES, 1998). The two aquifers are separated by an impermeable layer of clay in places (U.S. ACE, 1997). The storage capacity of the basalt aquifer within the whole basin is 4 million acre-ft (4.9 billion m3) (U.S. ACE, 1997). This aquifer is recharged directly in the Blue Mountains and Horse Heaven Hills and indirectly in the valley via percolation from the gravel aquifer (MacNish and others, 1973). It discharges into streams in the Blue Mountains and Horse Heaven Hills and controls flows in Mill Creek, especially during the dry summer months. Discharge in the valley mainly occurs through wells (MacNish and others, 1973). On the west and northwest margins of the basin, the aquifer discharges to the Snake and Columbia Rivers, respectively (MacNish and others, 1973). Discharge to the gravel aquifer is estimated at 12,000 acre-ft/yr (14.8 million m3/yr); 22,500 acre-ft/yr (27.8 million m3/yr) of groundwater are pumped to the surface, most of it for irrigation (U.S. ACE, 1997). The water in the basalt is estimated to be as old as 20,000 years (EES, 1998). Interflow zones (aquifers) within the basalt flows are estimated to make up 10 percent of the total basalt thickness; however, current well log data are not detailed enough to relate distinct aquifers within the basalt (EES, 1998). Groundwater flow occurs along vesicular basalt flow tops as well as within brecciated basalt and interbeds. Interbeds are common in the Columbia River basalts; there are generally 10 ft (3.05 m) of clay, shale, or tuffaceous materials for every 340 ft (104 m) of basalt (Newcomb, 1965). Flow brecciation within the CRBG in the valley is rare.
The gravel aquifer covers 188 mi2 (486 km2) in the basin, is as thick as 700 ft (210 m) in the western part of the basin, and can yield 5 to 900 gpm (0.3 to 57 L/s) at an individual well. It has a storage capacity of 3 million acre-ft (3.7 billion m3), and is recharged by precipitation, surface waters, and the deep basalt aquifer. Total annual recharge is 177,000 acre-ft (218 million m3); 100,000 acre-ft (120 million m3) of this water are lost through evapotranspiration, 113 acre-ft (139,000 m3) are lost to surface streams, and 25,000 acre-ft (31 million m3) are extracted through pumping (U.S. ACE, 1997). Water of the shallow gravel aquifer is believed to be approximately 50 to 3,000 years old, and is recharged from infiltration of precipitation within the last 40 years or by upward leakage from the basalt (EES, 1998).
Little is known about the hydraulic continuity among the deep basalt aquifer, shallow gravel aquifer, and surface streams. Because of the shallow nature of the gravel aquifer, it is recharged by surface waters; specific relationships between the two aquifers and between the basalt aquifer and surface streams are unknown. More studies into the interchange of water between the two aquifers and flow of water within each respective aquifer are needed.
The Blue Mountains are located at the eastern end of the Walla Walla Valley; the ridges of these mountains descend westward at an incline of three to five degrees (Newcomb, 1965). The maximum heights of the Blues are 5,000 ft (1,500 m) at the drainage divide and 6,000 ft (1,800 m) at Table Rock (Newcomb, 1965). The headwaters of tributaries leading into the Walla Walla River are located at the crest of the Blues; however, several areas within the Blue Mountains remain undissected. The valleys in the uplands tend to be steep-sided, narrow, and as deep as 1,500 ft (460 m), with canyon walls stepped with CRBG flows.
The Horse Heavens Hills are located on the southern side of the Walla Walla Valley, and rise 1,000 ft (300 m) over a “series of steplike escarpments [faults associated with the Olympic-Wallowa lineament] connected by flat sections or short ramp slopes” (Newcomb, 1965). They slope somewhat evenly down to Umatilla County, Oregon, in the south.
The sides of the Walla Walla Valley are composed of alluvial slopes and CRBG flows. The slopes are coalescing alluvial fans with gravelly surfaces. They descend from an altitude of 1,200 to 1,500 ft (366 to 457 m) (Newcomb, 1965). The valley bottom is relatively flat and underlain by Palouse silt and Touchet beds, which were deposited during periodic outburst floods (jökulhlaups), occurring between 15,300 and 12,700 B.P. and originated at glacially dammed Lake Missoula in modern-day Montana (Baker and Bunker, 1985). The slope of the valley is 0.95 to 1.89 degrees towards its center (Newcomb, 1965).

4
Discharge of groundwater from the CRBG of the hills and canyons mostly occurs along flow contacts, which are the primary water-bearing zones (Newcomb, 1965). This occurs because of the incomplete closure of one flow over another. Flow may occur through basalt vesicles, but because they generally are not connected, they usually do not contribute to the permeability of the rock (Newcomb, 1965). Some flows, however, are permeable throughout due to fracturing and vuggy texture (Newcomb, 1965). If discharge occurs between porous interflow zones, the resulting water-bearing section can be up to 25 ft (7.6 m) thick and crop out for as much as one mile (1.6 km) in lateral extent. Stratigraphic discontinuities that restrict groundwater flow include pinching out, overlapping, and fusion of flows.
Groundwater reservoirs are formed by vertical displacement of strata that form barriers transverse to the dip of the basalt (Newcomb, 1961). Faults provide zones of low lateral permeability, as water can only move through them vertically (Newcomb, 1961). Fault traces are commonly marked by small seepage springs. Dikes can form barriers as well (Newcomb, 1961). Known faults in the area include the Olympic-Wallowa lineament (OWL; the Wallula fault zone, figure 1, is part of this lineament) and the Hite fault (figure 1). The OWL is a northwest-trending oblique fault (Tolan and Reidel, 1989). It is aligned with anticlines of the Yakima fold belt. The Hite fault intersects the OWL at a right angle approximately 22 mi (35 km) southeast of Walla Walla and likely played a role in the location of parts of Mill Creek and the upper section of the North Fork of the Walla Walla River.
A groundwater reservoir is situated behind a fold or sharp fault in the basalt north of College Place. This structure is marked on the surface by a 200 ft-(61 m-)high ridge that trends east-northeast across part of the southern limb of the Walla Walla syncline (Newcomb, 1961). Groundwater reservoirs are likely to be present along the South Fork of the Walla Walla River near the center of sec. 7, T.4N., R.38E., upstream from the Hite fault; along Mill Creek near the northeast corner of sec. 19, T.6N., R.38E., upstream from the Kooskooskie Fault; and along the South Fork, near the east line of sec. 14, T.4N., R.37E., upstream from the Elbow Bend fault (Newcomb, 1961).
Confining (hydrostatic) pressures1 of 500 to 1000 ft (150 to 300 m) have been measured in deep basalt wells (EES, 1998). The depth of the basalt aquifer within the Walla Walla area is variable and depends on the thickness of clay, gravel, and basalt that must be drilled through before a water-bearing zone is reached (EES, 1998). Depths of municipal wells for the City of Walla Walla vary from 500 to 1,300 ft (150 to 400 m), and average static water level is about 150 ft (46 m) below ground surface.
History of the municipal water supply The City of Walla Walla was founded in 1862, and its municipal water-supply rights to Mill Creek were established four years later. This water supply was developed in 1906 with the construction of an intake at Kooskooskie, Washington, and a gravity transmission line connecting the intake to the City. This intake was extended 4 mi (6 km) into Oregon in 1922, and two 7.5 million-gallon (MG) (28.4 million-liter) towers were built 2 mi (3 km) east of the city limits. Municipal wells 1, 2, and 3 were drilled in the 1940’s, wells 4 and 5 in the early 1950’s, well 6 in the early 1960’s, and well 7 in the early 1970’s (table 1) (EES, 1998).
1 Confining pressure is defined as “an equal, all-sided pressure” (Bates and Jackson, 1987).

5
Table 1.—Municipal well characteristics. (EES, 1998)
Well Date drilled Depth Well casing Misc. Well 1 1941, 1942 810 ft (250 m) 15 in to 138 ft (0.38 to 42 m) Primary well Well 2 1942 797 ft (243 m) 16 in to 130 ft (0.41 to 40 m) Last of four wells to be regularly used Well 3 1946, 1947 1,169 ft (356 m) 20 in to 177 ft (0.51 to 54 m) Used after wells 1 & 6 Well 4 1953 789 ft (241 m) 24 in to 400 ft (0.61 to 120 m) Infrequent use Well 5 1957 1,100 ft (330 m) 26 in to 463 ft (0.66 to 141 m); 24
in from 449-567 ft (0.61 m from 137-173 m); 20 in to 803 ft (0.5 to 245 m)
Infrequent use
Well 6 1961 1,330 ft (405 m) 24 in to 285 ft (0.61 to 87 m) Second pump called when needed Well 7 1971 1,412 ft (430 m) Variable Standby
Wells 1, 2, and 3 discharge into the twin reservoirs, while wells 4 through 7 pump directly into the City’s water distribution system (EES, 1998). An eighth well, recently added to the system, is located at Walla Walla Community College (WWCC). Water from this well is pumped into the 7.5 MG twin reservoirs, mixing with water from Mill Creek and wells 1 through 3 (EES, 1998). See table 2 for well discharge data. Table 2.—Well discharge data [L/s = liters per second; gpm = gallons per minute. (EES, 1998) Well Depth Discharge Transmissivity Length open to basalt
ft (m) gpm (L/s) ft2/day (m2/day) ft (m) 1 810 (250) 2,500 (160) 9,700 (900) 670 (204) 2 808 (246) 1,780 (110) 10,000 (930) 700 (210) 3 1,170 (357) 4,000 (250) 13,000 (1,210) 1,000 (300) 4 789 (240) 2,800 (180) 7,800 (730) 400 (120) 5 1,090 (332) 1,700 (110) 8,500 (790) 640 (200) 6 1,330 (405) 2,600 (160) 8,000 (740) 1,050 (320) 7 1,410 (430) 3,000 (190) 8,400 (780) 350 (110)
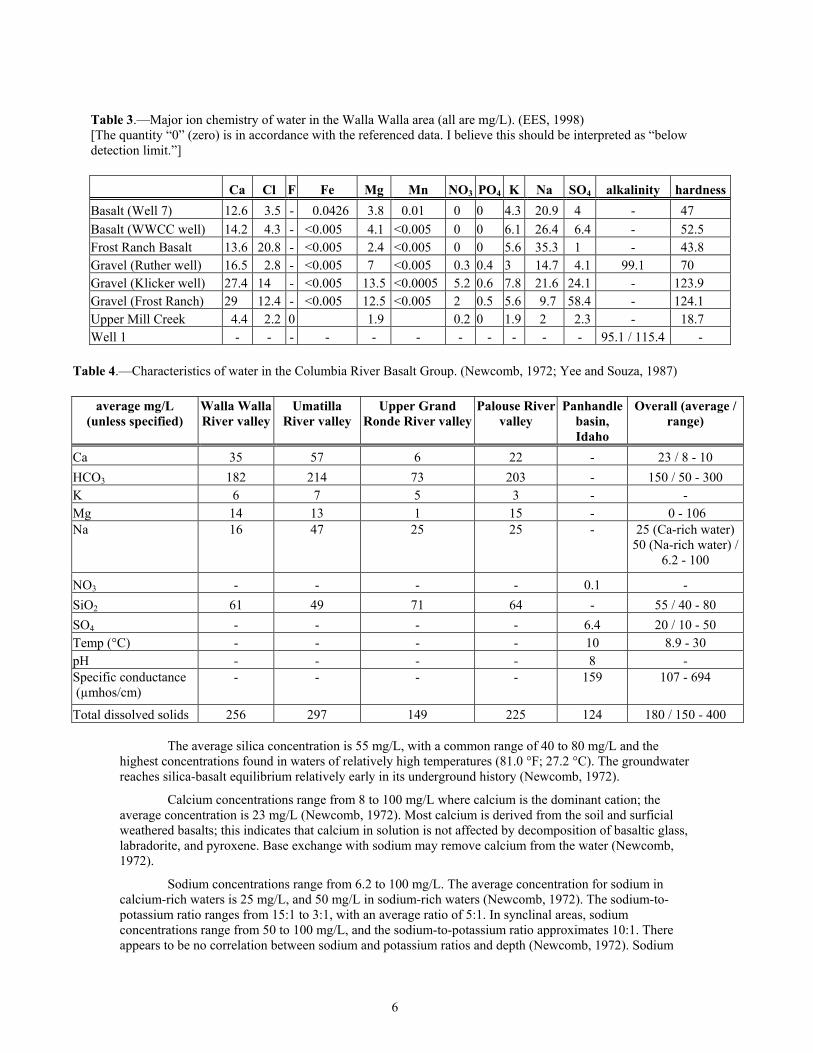
The city, in conjunction with the U.S. Forest Service, manages 36 mi2 (93 km2) of protected watershed above Kooskooskie in Washington and Oregon (EES, 1998). This area is closed to the public. At the point of diversion, Mill Creek has a drainage basin of 33 mi2 (86 km2). This watershed is a hilly, grass-tree mosaic without roads, and is located in the northwestern section of the Blue Mountains (EES, 1998). Research by the U.S. Geological Survey has determined that current conditions are very close to predevelopment conditions within the Mill Creek watershed. Columbia River Basalt Group groundwater characteristics The principle cations in water of the Columbia River Basalt Group (CRBG) are calcium and sodium, and there is a large amount of silica. Sodium-rich water is common in synclinal valleys, such as the Walla Walla Valley, and calcium-rich water is common elsewhere. The natural radioactivity in the water is low (maximum radium and uranium contents were 0.6 pCi/L and 10 µg/L2, respectively). Tables 3 and 4 outline the major ion chemistry of water in the deep basalt aquifer. 2 Maximum contaminant levels (see “Water quality and laws”) for radium and uranium are 5 pCi/L and 30g/L, respectively.
6
Table 3.—Major ion chemistry of water in the Walla Walla area (all are mg/L). (EES, 1998) [The quantity “0” (zero) is in accordance with the referenced data. I believe this should be interpreted as “below detection limit.”]
Ca Cl F Fe Mg Mn NO3 PO4 K Na SO4 alkalinity hardnessBasalt (Well 7) 12.6 3.5 - 0.0426 3.8 0.01 0 0 4.3 20.9 4 - 47 Basalt (WWCC well) 14.2 4.3 - <0.005 4.1 <0.005 0 0 6.1 26.4 6.4 - 52.5 Frost Ranch Basalt 13.6 20.8 - <0.005 2.4 <0.005 0 0 5.6 35.3 1 - 43.8 Gravel (Ruther well) 16.5 2.8 - <0.005 7 <0.005 0.3 0.4 3 14.7 4.1 99.1 70 Gravel (Klicker well) 27.4 14 - <0.005 13.5 <0.0005 5.2 0.6 7.8 21.6 24.1 - 123.9 Gravel (Frost Ranch) 29 12.4 - <0.005 12.5 <0.005 2 0.5 5.6 9.7 58.4 - 124.1 Upper Mill Creek 4.4 2.2 0 1.9 0.2 0 1.9 2 2.3 - 18.7 Well 1 - - - - - - - - - - - 95.1 / 115.4 -
Table 4.—Characteristics of water in the Columbia River Basalt Group. (Newcomb, 1972; Yee and Souza, 1987)
average mg/L (unless specified)
Walla Walla River valley
Umatilla River valley
Upper Grand Ronde River valley
Palouse River valley
Panhandle basin, Idaho
Overall (average / range)
Ca 35 57 6 22 - 23 / 8 - 10 HCO3 182 214 73 203 - 150 / 50 - 300 K 6 7 5 3 - - Mg 14 13 1 15 - 0 - 106 Na 16 47 25 25 - 25 (Ca-rich water)
50 (Na-rich water) / 6.2 - 100
NO3 - - - - 0.1 - SiO2 61 49 71 64 - 55 / 40 - 80 SO4 - - - - 6.4 20 / 10 - 50 Temp (°C) - - - - 10 8.9 - 30 pH - - - - 8 - Specific conductance (µmhos/cm)
- - - - 159 107 - 694
Total dissolved solids 256 297 149 225 124 180 / 150 - 400
The average silica concentration is 55 mg/L, with a common range of 40 to 80 mg/L and the highest concentrations found in waters of relatively high temperatures (81.0 °F; 27.2 °C). The groundwater reaches silica-basalt equilibrium relatively early in its underground history (Newcomb, 1972).
Calcium concentrations range from 8 to 100 mg/L where calcium is the dominant cation; the average concentration is 23 mg/L (Newcomb, 1972). Most calcium is derived from the soil and surficial weathered basalts; this indicates that calcium in solution is not affected by decomposition of basaltic glass, labradorite, and pyroxene. Base exchange with sodium may remove calcium from the water (Newcomb, 1972).
Sodium concentrations range from 6.2 to 100 mg/L. The average concentration for sodium in calcium-rich waters is 25 mg/L, and 50 mg/L in sodium-rich waters (Newcomb, 1972). The sodium-to-potassium ratio ranges from 15:1 to 3:1, with an average ratio of 5:1. In synclinal areas, sodium concentrations range from 50 to 100 mg/L, and the sodium-to-potassium ratio approximates 10:1. There appears to be no correlation between sodium and potassium ratios and depth (Newcomb, 1972). Sodium

7
and potassium content in basin groundwater is greater at shallow depths than at greater depths. Calcium-sodium-chloride water is the most common form of high-sodium water (Newcomb, 1972). In groundwater recently recharged by irrigation water, sodium is associated primarily with bicarbonate and sulfate and secondarily with chloride.
Bicarbonate is the principal anion in CRBG groundwater (Newcomb, 1972). Its concentrations range from 50 to 300 mg/L, and averages 150 mg/L. There appears to be no correlation between concentration and depth. Bicarbonate is found primarily in sodium-rich waters.
Chloride concentrations range from 1 to 50 mg/L, with a common range of 5 to 30 mg/L and an average concentration of 10 mg/L (Newcomb, 1972). Water with chloride concentrations higher than 30 mg/L is rare, and is found at shallow depths in semiarid basins where recharge water acquires chloride ions from evaporite deposits (Newcomb, 1972).
Fluoride concentrations range from 0 to 2 mg/L, with a common range of 0.2 to 0.8 mg/L (Newcomb, 1972). A range of 0.7 to 2 mg/L occurs in the sodium-bicarbonate water of synclinal basins (for example, the structural basin extending from Ephrata to Wallula). Fluorine commonly occurs as fluorite (CaF2) and fluoroapatite (Ca10(PO4)6F2) (SDWC, 1977).
There is no apparent correlation between water hardness (bicarbonate concentration) and depth of the basalt aquifer. The softest water is adjacent to areas of substantial natural recharge (for example, the Blue Mountains; Newcomb, 1972). Hardness ranges from soft to very hard (soft is 0 to 60 mg/L HCO3
-; moderately hard is 61 to 120 mg/L HCO3
-; hard is 121 to 180 mg/L HCO3-; very hard is >180 mg/L
HCO3-), with a common range of 50 to 250 mg/L (Newcomb, 1972).
In studies conducted by Newcomb in the 1970’s, 85 percent of water samples had less than 0.30 mg/L dissolved Fe. There appears to be no correlation between iron concentration and depth, and no pattern in its lateral distribution (Newcomb, 1972).
Magnesium concentrations range from 0 to 106 mg/L. The sources of this magnesium are the solution of magnesium silicate minerals such as basaltic glass, pyroxene, and olivine (Newcomb, 1972). As with calcium, base-exchange removal of magnesium may occur in sodium-rich water. Calcium and magnesium combine with soap to form the relatively insoluble compounds that cause hard water (Newcomb, 1972).
Nitrates are easily leached beyond the root zone of crops by excessive irrigation or heavy rainfall (Feigin and Halevy, 1994). Less nitrate is found in loamy, fine sand soils of subirrigation systems than in furrow and sprinkler systems (Pye and others, 1983) because the combination of high soil permeability and water transport of the furrow and sprinkler systems encourages nitrate movement.
Phosphate concentrations range from 0 to 2.8 mg/L PO4, with a common range of 0.02 to 0.30 mg/L (Newcomb, 1972). There is no apparent correlation among different geologic or geographic settings.
Sulfate concentrations vary from 1 to 130 mg/L SO4, with a common range of 10 to 50 mg/L SO4 and an average value of 20 mg/L SO4 (Newcomb, 1972). Large amounts of sulfate can be present in shallow aquifers beneath synclinal basins, but this trend is not consistent. Sulfate concentrations may vary with the age of the water (Newcomb, 1972).
CRBG water tends to have less bicarbonate, calcium, and magnesium, and more sodium and potassium with increasing depth (Newcomb, 1972).
Specific conductivity ranges from 107 to 694 µmhos (Newcomb, 1972). Conductivity measures the ability of water to conduct electricity; a low conductivity value indicates the presence of few ions and purer water (Boese and Buchanan, 1996).
Total-dissolved-solid concentrations, a measure of dissolved mineral salts in water, vary from 68 to 568 mg/L, with a common range of 150 to 400 mg/L (Newcomb, 1972). It is possible that fewer dissolved solids occur in groundwater near natural recharge areas (Newcomb, 1972). In the Walla Walla Valley in the early 1970’s, total dissolved solids averaged 180 mg/L. Total dissolved solid concentrations vary with sulfate concentration.

8
Water temperature is usually a few degrees higher than the annual mean air temperature of the area and increases with geothermal gradient (Newcomb, 1972). The temperature can vary greatly and ranges from 48 to 86 °F (8.9 to 30 °C). Southeastern Walla Walla Valley’s groundwater is warmer than normal ground temperatures (Newcomb, 1972). State of groundwater in Walla Walla In 1998 the average static water levels for wells taping the basalt aquifer were 150 ft (46 m) below ground surface and the aquifer was measured to be dropping 3 ft/yr (0.9 m/yr)(EES, 1998). Declines in groundwater level “do not correlate well with records on the distribution of the total basalt aquifer pumpage. Basalt aquifer water level declines may be more widespread than… known, but without appropriate information, there is no way to document the entire area of basalt aquifer level decline” (EES, 1998). Because of this alarming rate of decline of groundwater level, the City has begun an artificial storage and recovery program, recharging the basalt aquifer with surface waters.
Areas within the one-year time-of-travel zones (zones within which it will take one year for water that enters the basalt aquifer to reach certain wells), as noted in Appendix B, are prioritized for wellhead protection (EES, 1998). Hydrogeologic mapping by Economic and Engineering Services, Inc. (1998) determined potential capture zones, but these data and analyses are limited. More hydrogeologic fieldwork and modeling are needed in order to draw more comprehensive conclusions.
Table 5 shows the susceptibility and vulnerability ratings, determined by time-of-travel estimates, of the seven municipal wells. Susceptibility is a qualitative assessment of the potential for groundwater contamination from land surface activities. For example, a well within highly fractured basalt would have high susceptibility. Vulnerability is a qualitative assessment of the risk of exposure to contaminants based on land surface activities within a certain geographic area. For example, a well located within intensely fertilized fields would have high vulnerability.
Table 5.—Well susceptibility/vulnerability rating. (EES, 1998) Well Susceptibility Vulnerability
1 Medium Low 2 Medium Low 3 Medium Low 4 Low - 5 Low - 6 Low - 7 Low -
The current water-supply strategy of the city is to establish a groundwater-monitoring program to understand better groundwater dynamics within and between the basalt and gravel aquifers (EES, 1998).
The city has established a Wellhead Protection Program to help ensure the safety of groundwater tapped by municipal wells. The program includes, but is not limited to, enforcement of hazardous material storage requirements, restrictions on garbage disposal and landfilling of wastes, development of feed lots and residential septic systems, closure of abandoned wells, and protection of wellhead facilities (EES, 1998). The last two parts of the plan are especially important, as surface water and wastes may infiltrate the deep basalt aquifer through unsealed, poorly sealed, and/or old wells.
Pat Youngman, a long-time well driller in the Walla Walla Valley, believes that well casings will corrode to an unsafe point 50 years after installation (oral commun., February, 2000). He believes that there are “lots” of abandoned and/or corroded wells in the area, and recommends that every well should be videotaped right after drilling, checked for suitability, and rechecked 35 years after drilling. He is careful to note that this time scale is suitable only for properly drilled wells. There is no known list of abandoned or

9
corroded wells in the area; such wells pose a risk to the deep basalt aquifer in that surface waters and waters from the shallow gravel aquifer may cascade down basalt aquifer wells. The vulnerability of the basalt aquifer was demonstrated when an outbreak of Cryptosporidium, an organism that causes illnesses ranging from mild gastrointestinal disorders to deadly disease, occurred in the northwestern part of the City in 1994 as a result of irrigation water infiltrating a domestic well3 that tapped the deep basalt aquifer and had rusted casing (Dworkin and others, 1996; David Eaton, oral commun., May, 2000). Eighty-six residents reported gastrointestinal disturbance in this case of groundwater contamination.
Water quality and laws The EPA Office of Ground Water and Drinking Water is responsible for enforcement of the National Primary Drinking Water Regulations, as outlined in the Safe Drinking Water Act. There are several different designations of drinking water quality; the most important in this study are the maximum contaminant level (MCL), which is the maximum level of a contaminant in public water, and the action level, which indicates that steps must be taken to treat water if this level is exceeded in more than 10 percent of tap water samples (U.S. EPA, 1999). There are both primary and secondary MCL’s; primary MCL’s are legally enforceable and are meant to ensure that contaminants do not exceed a level that may be detrimental to public health, while secondary MCL’s are non-enforceable cosmetic and aesthetic guidelines. There are also maximum concentration levels goals (MCLG), which indicate the maximum level of a contaminant with no adverse public health effects; because of the broad scope of this study MCLG’s will not be addressed. Table 6 outlines the standards for inorganic compounds and for physical parameters important in this study. The 1996 amendments to the Safe Drinking Water Act require that public water system users must be notified within 24 hours if their water has been contaminated with a substance that could cause immediate illness (Barzilay and others, 1999). Federal statutes that limit use and disposal of certain contaminants include the Federal Water Pollution Control Act, the Resource Conservation and Recovery Act of 1976, the Federal Insecticide, Fungicide and Rodenticide Act, and the Hazardous Materials Transportation Act (Blodgett and others, 1977).
3 This well is neither owned nor operated by the City of Walla Walla; it is a private well.

10
Table 6.—Inorganic compound and physical parameter standards, effects, and source (sources in italics are not likely to be found in water of the deep basalt aquifer of the Walla Walla area) [CU = color unit; IOC = inorganic compounds; NTU = nephelometric turbidity unit; TDS = total dissolved solids]. (U.S. EPA, 1999; EES, 1998; Barzilay and others, 1999; Safe Drinking Water Committee, 1977].
IOC or physical parameter in
drinking water Standard* Potential health effects from ingestion Possible sources of contamination
As 0.05 skin damage; circulatory problems;
increased risk of cancer animal feed additives; herbicides; erosion of natural deposits; wood preservatives
Cl 250 poor taste; corrosion of pipes road salt Cr 0.1 liver and kidney disease natural deposits; mining Cu 1.3 temporary gastrointestinal disturbance corrosion of pipes F 4 bone disease; mottled teeth in children erosion of natural deposits; discharge
from fertilizer and aluminum factories; water additive
Fe 0.3 poor taste; laundry stains erosion of natural deposits Pb 0.015 delays in development of children;
kidney problems and high blood pressure in adults
corrosion of pipes; erosion of natural deposits
Mn 0.05 poor taste; laundry stains erosion of natural deposits NO4 10 blue baby syndrome: can cause death
without immediate medical attention runoff from fertilizer use; leaching from septic tanks; sewage; erosion of natural
deposits Na 20# hypertension erosion of natural deposits; road salt SO4 250 diarrhea erosion of natural deposits
Color 15 CU n/a presence of natural organic matter in
water Conductivity 700
µmhos/cm n/a n/a
TDS 500 poor taste; possible heart disease with low levels
pipe corrosion
Turbidity 1 NTU high levels may interfere with water treatment and monitoring
presence of suspended matter in water
* values are mg/L unless otherwise noted # EPA guidance level
Health risks For concentration and/or range of inorganic compounds and physical characteristics in CRBG groundwater, see tables 3 and 4. Arsenic Arsenic compounds vary greatly in their toxicity to humans. Generally, a lethal oral dose of more toxic compounds4 is approximately 1-25 mg/kg body weight. A lethal oral dose of those less toxic compounds can range from 10-400 times this amount. Exposure to arsenic can lead to abdominal pain, forceful vomiting, leg cramps and spasms, diarrhea (SDWC, 1977), thickening of the skin, increase in skin
4 Inorganic-arsenic compound groups, in order of decreasing toxicity, are as follows: arsines, arsenite, arsenoxides, arsenate, pentavalent arsenicals, and metallic arsenic.

11
pigmentation, and skin cancer (Barzilay and others, 1999). There is a correlation with other cancers, as well, including lung, kidney, bladder, and colon cancers. Studies from Taiwan indicate that the MCL of 0.05 mg/L may be too high (Barzilay and others, 1999). The World Health Organization has a provisional level of 0.01 mg/L, Canada a level of 0.025 mg/L, and there is currently a proposal in the U.S. to lower the level to 0.02 mg/L (Barzilay and others, 1999).
Arsenic is usually found in shales, clays, phosphorites, coals, sedimentary iron ores, and manganese ores (SDWC, 1977). It is primarily a byproduct of smelting of nonferrous metal ores, especially copper (SDWC, 1977). Calcium Calcium may lower blood pressure, although further studies are needed to confirm this, and is known to increase bone strength (Barzilay and others, 1999). It is found in over 75 percent of kidney stones, yet there are lower rates of kidney stone formation in areas with harder water (Barzilay and others, 1999). There also appears to be a link between harder water and decreased occurrence of cardiovascular disease by as much as ten percent (Barzilay and others, 1999). (See "Hardness" below.) Chloride Chloride is one of the most widespread water contaminants (Pye and others, 1983) and causes poor-quality taste. Chloride sources include pipe corrosion, industrial discharge, sewage, animal wastes, and commercial fertilizers containing potassium chloride (Boese and Buchanan, 1996).
Chromium Chromium can cause gastrointestinal tract hemorrhaging (SDWC, 1977), renal failure (Gordon, 1984), skin sensitivity, and cancer (Gordon, 1984). Naturally occurring chromium is present in minor concentrations in igneous rocks and in greater concentrations in basic and ultrabasic rocks (SDWC, 1977). Human-introduced chromium comes from manufacturing processes and sewage sludge (Cherry and others, 1984). The stable species, HCrO3 and CrO4
2-, are formed under oxidizing conditions, and are poorly soluble. CrO4-
is usually present because of pollution by industrial wastes (SDWC, 1977). Copper Ingestion of copper causes infant death (SDWC, 1977), short-lived vomiting, diarrhea, nausea, and abdominal pain, and comes from corrosion of pipes and waste dumped into landfills (Barzilay and others, 1999). Trace metals such as copper can also contaminate water through chemical weathering and soil leaching. Copper salts (for example, sulfates and chlorides) are highly soluble in water with a low pH (SDWC, 1977). Under conditions of normal alkalinity they can hydrolyze and may precipitate copper, greatly reducing the likelihood of transport of copper to humans through water. Fluoride High concentrations (4 mg/L or greater) of fluoride in water can cause discoloration of teeth (Barzilay and others, 1999), vomiting, abdominal pain, nausea, diarrhea, convulsions, and death due to respiratory paralysis or cardiac failure (SDWC, 1977), whereas controlled levels protect against cavities (Barzilay and others, 1999). A level of 1 mg/L is optimal (Barzilay and others, 1999). A lethal dose of sodium fluoride is approximately 5 g for humans, but death has occurred from smaller quantities and people have ingested larger quantities and lived (SDWC, 1977). Iron High iron concentrations pose no known health risk, but are disliked for bad water taste and poor color. Large concentrations of iron can be caused by improperly sealed wells or rusted well casings (Newcomb, 1972). Lead Lead can cause neurological and behavioral disorders, especially in children (Barzilay and others, 1999), anemia, impaired kidney and testicular function (Barzilay and others, 1999), miscarriage, birth defects, and infant death (Gordon, 1984). Lead is naturally derived from galena (lead sulfide), occurs as oxides, and

12
replaces the potassium in potassium feldspar (SDWC, 1977). Human-generated sources include agricultural fuel, industrial plants, chemical pesticides and fungicides, and corrosion of lead pipes (Barzilay and others, 1999). Corrosion may be controlled by increasing the amount of calcium and phosphate ions in the water to promote a protective mineral sediment layer inside the pipes. Lead pipes may also be replaced. Risk may be minimized by flushing faucets that have been unused for more than six months, not using hot water from the faucet, and using a filtration device (Barzilay and others, 1999). Magnesium Although magnesium has been called one of the most important electrolytes in the body (SDWC, 1977) and may be connected to lowered occurrence of osteoporosis (Barzilay and others, 1999), high concentrations of magnesium can cause diarrhea (SDWC, 1977). It has a high solubility and is geologically abundant (SDWC, 1977).
Manganese There appears to be no manganese toxicity in drinking water, just undesirable taste and discoloration of the water (SDWC, 1977). Inhalation of high concentrations of manganese dust can cause permanent crippling and deterioration of the central nervous system (SDWC, 1977). Manganese resembles iron in chemical behavior and occurrence, but is less abundant. Nitrate High concentrations of nitrate can cause methemoglobinemia (“blue baby syndrome”) in infants and potentially form carcinogenic nitrosamines (SDWC, 1977); because of a long latency period, it is difficult to determine if nitrates increase the incidence of cancer (Barzilay and others, 1999). Nitrate concentrations may be three to sixty times higher in agricultural areas than in nonagricultural areas (Barzilay and others, 1999). Possible sources of high nitrate concentrations include animal manure, effluence from septic systems, nitrogen fertilizers, municipal waste, and natural sources (Boese and Buchanan, 1996). Sulfate Sulfate acts as a laxative and, once dissolved in water, becomes a permanent solute except when anaerobically reduced to sulfide and precipitated in sediments, released to the atmosphere as H2S, or incorporated in living organic matter (SDWC, 1977). It can be produced through the oxidation of sulfides, comes from evaporite sediments, and is ubiquitous in drinking water (SDWC, 1977). Color5 Sediment and suspended matter usually occur when a well is poorly cased (Newcomb, 1972); however, basaltic water is usually clear. Hardness Hardness is a measure of the number of polyvalent cations in water; the most common cations include calcium and magnesium (SDWC, 1977). Hard water (>75 mg/L CaCO3) is associated with increased rates of morbidity and mortality and decreased rates of cardiovascular disease (SDWC, 1977). Nationwide, there tend to be hardness halos near landfills (Roy, 1994).
Total dissolved solids (TDS) High concentrations of TDS can cause diarrhea (U.S. Army Center for Health Promotion and Preventative Medicine, 2000), poor taste, heart disease with low concentrations, and, in the Walla Walla valley, occur as a result of pipe corrosion.
5 “Color is measured by visual comparison of the sample with platinum-cobalt standards. One unit of color is that produced by 1 mg/L platinum in the form of the chloroplatinate ion.” (U.S. Environmental Protection Agency Office of Environmental Information, 2001).

13
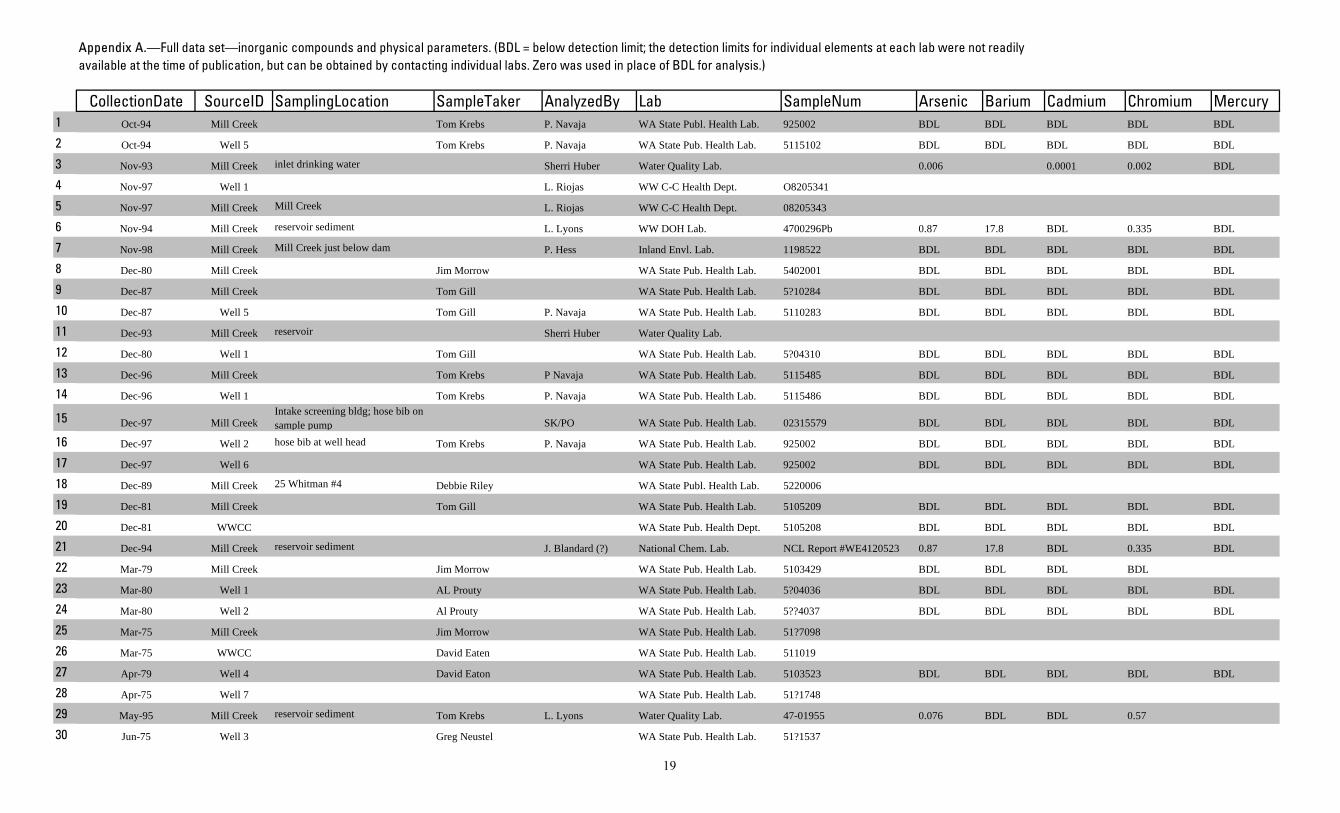
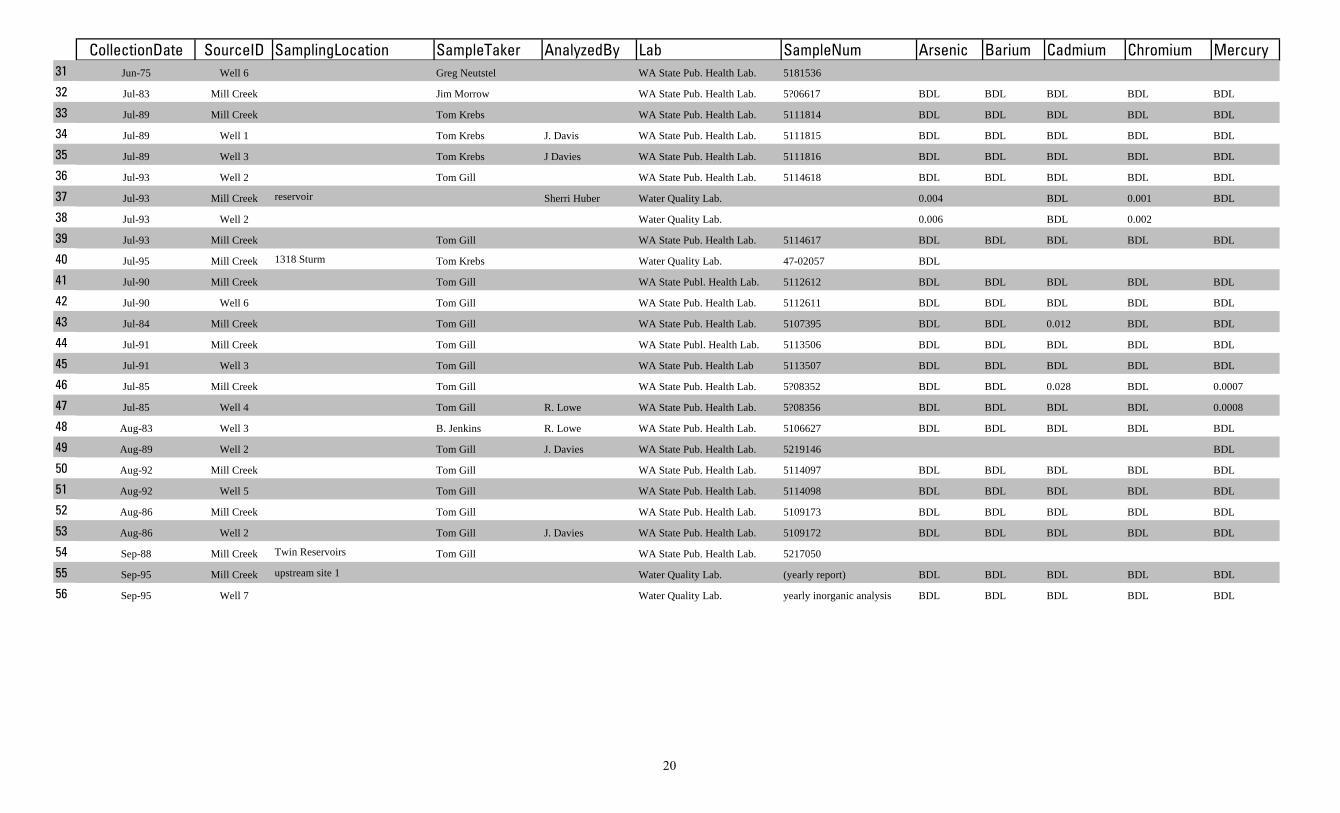
Turbidity There are no known health effects caused by turbidity, but high concentrations can interfere with disinfection, provide a medium for growth of microbes, and may indicate the presence of microbes (U.S. EPA water, 2000). Turbidity is caused by soil runoff. Data Samples 1 through 39 in Appendix A were taken from private wells between December 1993 and February 1994 and in November of 1994 for a study by the Washington State Department of Ecology. The wells sampled tapped the shallow gravel aquifer (Larson, 1995) and were located in and around College Place, southwest Walla Walla, and along the Walla Walla River west of College Place. Scientists analyzed the samples for pesticides, nitrates, and conductivity; because this study looks at inorganic compounds and physical characteristics, the pesticide data were not included in Appendix A. An average date of January 1994 was used for initial samples (verification samples were collected in November of 1994).
Samples 40 through 387 in Appendix A were part of the 205J study by the Walla Walla County Regional Planning Department. Domestic wells tapping the shallow gravel aquifer in an unincorporated area southeast of the City of Walla Walla and east of the City of College Place were tested for coliform bacteria, fecal coliform, and nitrates six times each over a period of 12 months (Walla Walla Regional Planning Department (WWRPD), 1989). As with the Department of Ecology Study, only nitrate data were included in this study.
The remaining samples, 376 through 431 in Appendix A, were collected by employees of the City of Walla Walla Public Works Department over the last 25 years. The sampling area includes all seven municipal wells, the Walla Walla Community College (WWCC) well, and Mill Creek. These data have not previously been published, but are retained by the Public Works Department. Data analyses Nitrate was chosen for careful analysis because of its dangerous health effects, high solubility, and subsequent ease of migration within groundwater (Cherry and others, 1984). Nitrate exposure can cause methemoglobinemia in infants, and may lead to death. Samples with maximum concentrations and with concentrations exceeding EPA standards of nitrate are listed in Appendix A with regard to percentage of EPA standard, well depth, and time. Data from Mill Creek and the shallow gravel aquifer were included, in addition to areas outside the municipal wells, because any surface or ground waters have the potential to enter parts of the deep basalt aquifer tapped by city wells. Definitive knowledge of water migration within the deep basalt aquifer, and between it and the shallow gravel aquifer, must be gained in order to draw more significant conclusions about these data.
Of the 67 times when high concentrations (over 10 mg/L) of nitrate were recorded, 11 samples were collected in the Larson study, 56 from the WWRPD study, and none by the City of Walla Walla (figure 2). These clusters of high concentrations occurred in 1989 and 1994, when the WWRPD and Larson studies respectively were carried out. Both WWRPD and Larson data were collected from shallow wells to the southwest of city wells, out of the area of municipal deep aquifer wells. We may conclude from this information that there was a significant amount of pollution by nitrates in the shallow basalt aquifer in southwest Walla Walla in 1989 and 1994. These polluted waters could potentially enter the deep basalt aquifer in the area tapped by city wells, but this is unlikely due to the extremely slow rate of groundwater migration and indications that the municipal well area is upgradient from southwestern Walla Walla.

14
Figure 2.—Maximum nitrate. Municipal-well samples with detectable nitrate concentrations were most numerous in March, July, November, and December (figure 3). Winter rains and spring melt may account for the peaks in November, December, and March; however, if this were the case, it would be expected that peaks would also occur in January and February (see figures 4 and 5 for precipitation data). Intensive crop watering might account for the July peak.
Figure 3.—Number of municipal-well samples with detectable nitrate concentrations by month, 1975 to 1998.
0 5
10 15 20 25
30 35
Mar-75 Aug-80 Feb-86 Aug-91 Jan-97
Date
Nitr
ate
(mg/
L)
0
1
2
3
4
5
6
January April July October

15
Figure 4.—Mean days of precipitation per month.
Figure 5.—Mean monthly precipitation in inches.
Well-depth analysis (figure 6) indicates that high concentrations of nitrate were measured most commonly at wells less than 80 m deep, thereby revealing that most contamination was in the shallow gravel aquifer. This is consistent with the fact that 90 percent of nitrate data points were from the WWRPD and Larson studies, both of which addressed water quality within the shallow aquifer.
0
2
4
6
8
10
12
14
January April July October
0
0.5
1
1.5
2
2.5
3
January April July October

16
Figure 6.—Well depth vs. nitrate level. Most inorganic compounds (IOCs) were found not to be useful as indicators of water quality because they were rarely detected and, when detected, were generally at concentrations well below allowable EPA levels. A major exception occurred in November and December of 1994, when relatively high concentrations of arsenic (0.87 mg/L), chromium (0.335 mg/L), copper (8.56 mg/L), and lead (6.57 mg/L), were recorded in reservoir sediments. Tom Krebs, the current Water Treatment Supervisor at the City’s ozone plant, believes that these samples are from reservoir sludge at the twin reservoirs (Tom Krebs, oral commun., 2000). The city flushes these reservoirs approximately twice each year, and sometimes samples the reservoir bottoms. Reservoir sludge would concentrate contaminants that have settled out of surface waters. The EPA and the Washington Department of Health do not require sampling of the sludge. It is not certain that these high concentrations of IOC’s are a result of sludge sampling, so results are included in this study. Summary and recommendations The quality of water of the deep basalt aquifer, and hence the municipal groundwater supply, is currently excellent. This is because the recharge area for the aquifer is sparsely populated, has little agriculture, a portion of the recharge area is closed off to use by the public, and the water is very old (up to 20,000 years). Although these wells are not used on a regular basis, they can be, as in the case of the 1996 flood that damaged the municipal water line. Because of the growing population of the City of Walla Walla and intensive agriculture practices, city officials are especially concerned about ensuring municipal well-water quality.
Increased contamination of water by nitrate is known to be a result of intensive fertilizer use in agriculture. Nitrate is dangerous because of its effects on human health. Although concentrations of nitrate within the deep basalt aquifer historically have been below maximum concentrations allowed by EPA, contamination of the aquifer has been known to occur, as shown by an outbreak of Cryptosporidium in 1994.
0
5
10
15
20
25
30
35
0 50 100 150 200 250 300 350 400 450 500
well depth
nitr
ate
(mg/
L)

17
Given the excellent municipal water quality, the intensive agricultural use in the area believed to be upgradient from municipal wells, and the possibility of pollution via old and/or damaged wells, I recommend that, until definitive research regarding shallow-deep aquifer continuity and groundwater flow within the deep aquifer has been conducted, the city expand its wellhead protection program to include periodic inspection. A geographic information system with information on ownership, date of drilling or last date of inspection, and aquifer tapped should be compiled, and all wells over 50 years old should be checked periodically. If monies are available, city officials should use video cameras to inspect old and/or unused wells. Even without videotaping, a comprehensive wellhead protection program may cost a significant amount of money, but it would be cheaper than the cost of aquifer decontamination if the deep basalt aquifer were to become polluted.
Acknowledgments Appreciation and thanks go to Bob Carson of Whitman College, who sponsored this research and provided valuable advice; Robert Gordon, water system manager for the City of Walla Walla, who indicated a need for information about contamination within the deep aquifer and provided information on city policies; Darin Christen, Water Quality Specialist, for supplying the data, as well as use of his computer; David Eaton, Director of Environmental Health for the Walla Walla County-City Health Department, for making me aware of the Larson, WWRPD, and Dworkin and others studies; Pat Youngman, who provided invaluable and undocumented information about wellhead protection; and to Michael Diggles and Victor Mossotti of the U.S. Geological Survey, who reviewed this paper. References Baker, V.R., and Bunker, R.C., 1985, Cataclysmic late Pleistocene flooding from glacial Lake Missoula: a
review: Quaternary Science Reviews, vol. 4, p. 1-41. Barzilay, J.I., Weinberg, W.G., and Eley, J.W., 1999, The water we drink: water quality and its effects on
health: New Brunswick, New Jersey, Rutgers University Press, 152 p. Bates, R.L., and Jackson, J.A., eds., 1987, Glossary of geology (3d ed.): Alexandria, Va., American
Geological Institute, 788 p. Blodgett, J.E., Musgrove, C.A., and Reisch, M.E.A., 1977, Water contamination by toxic pollutants: an
assessment of regulation: Washington, D.C., U.S. Government Printing Office, 81 p. Boese, R.M., and Buchanan, J.P., 1996, Aquifer delineation and baseline groundwater-quality investigation
of a portion of north Spokane County, Washington: Cheney, Wash., Eastern Washington University, 98 p.
Cherry, J.A., Gillham, R.W., and Barker, J.F., 1984, “Contaminants in groundwater: chemical processes,” in Groundwater contamination: Washington, D.C., National Academy Press, p. 46-62.
Dworkin, M.S., Goldman, D.P., Wells, T.G., Kobayashi, J.M., and Herwaldt, B.L., 1996, “Cryptosporidiosis in Washington State: and outbreak associated with well water”: Journal of Infectious Diseases, v. 174, p. 1372-6.
Economic and Engineering Services, Inc. (EES) in association with CH2M HILL, 1998, City of Walla Walla Comprehensive Water System Plan.
Feigin, A., and Halevy, J., 1994, “Effect of crops and fertilization regimes on the leaching of solutes in an irrigated soil,” in Adriano, D.C., Iskandar, A.K., and Murarka, I.P., eds., Contamination of groundwaters: Surrey, U.K., Laws & Stimson Associates, p. 367-392.
Gordon, Wendy, 1984, A citizen’s handbook on groundwater protection: New York, Natural Resources Defense Council, 193 p.
Larson, A.G., 1995, Pesticide residues in the Walla Walla surficial aquifer: Washington Department of Ecology Pesticides in Ground Water Report 7, 25 p.
MacNish, R.D., Myers, D.A., and Barker, R.A., 1973, Appraisal of ground-water availability and management projections, Walla Walla River basin, Washington and Oregon: U.S. Geological Survey Water-Supply Bulletin 37, 25 p.
Newcomb, R.C., 1961, Storage of ground water behind subsurface dams in the Columbia River Basalt, Washington, Oregon, and Idaho: U.S. Geological Survey Professional Paper 383-A, 15 p.
Newcomb, R.C., 1965, Geology and ground-water resources of the Walla Walla River basin, Washington-Oregon: Washington Division of Water Resources Water Supply Bulletin 21, 151 p.

18
Newcomb, R.C., 1972, Quality of the ground water in basalt of the Columbia River group, Washington, Oregon, and Idaho: U.S. Geological Survey Water-Supply Paper 1999-N, 71p.
Pye, V.I., Patrick, Ruth, and Quarles, John, 1983, Groundwater contamination in the United States: Philadelphia, University of Pennsylvania Press, 291 p.
Rousu, Robin, visited Feb. 10, 2000, Summary of the climate of Walla Walla, Washington: Walla Walla, Wash., Whitman College (URL http://www.whitman.edu/offices_departments/
environmental_studies/WWRB/climate.html). Roy, W.R., 1994, “Groundwater contamination from municipal landfills in the USA,” in Adriano, D.C., Iskandar, A.K., and Murarka, I.P., eds., Contamination of groundwaters: Surrey, U.K., Laws & Stimson Associates, p. 411-439. Safe Drinking Water Committee (SDWC), 1977, Drinking water and health, v. 6: Washington, D.C.,
National Academy of Sciences, 919 p. Tolan, T.L., and Reidel, S.P., 1989, Structure map of a portion of the Columbia River flood-basalt
province, in Reidel, S.P., and Hooper, P.R., eds., Volcanism and tectonism in the Columbia River flood-basalt province: Geol. Soc. America Special Paper 239.
Tolan, T.L., Reidel, S.P., Beeson, M.H., Fecht, K.R., and Swanson, D.A., 1989, Revisions to the estimates of the areal extent and volume of the Columbia River Basalt Group, in Reidel, S.P., and Hooper, P.R., eds., Volcanism and tectonism in the Columbia River flood-basalt province: Geol. Soc. America Special Paper 239, p. 1-20.
U.S. Army Center for Health Promotion and Preventative Medicine, visited Feb. 12, 2000, Appendix 3 in Drinking water regulations: (URL http://chppm-www.apgea.army.mil/dwater/regulations/
tbmed577/appendix_3.html; link no longer active). U.S. Army Corps of Engineers (U.S. ACE), 1997, Walla Walla River watershed reconnaissance report—
Oregon and Washington, variously paged. U.S. Environmental Protection Agency, visited June 17, 2001, Major environmental laws:
(URL http://www.epa.gov/epahome/laws.htm). U.S. Environmental Protection Agency Office of Environmental Information, 2001, Guidance for Preparing Standard Operating Procedures (SOPs): Washington, D.C., U.S. Environmental Protection Agency Office of Environmental Information, variously paged. (Available at URL http://www.epa.gov/ Region10/offices/oea/epaqag6.pdf) U.S. Environmental Protection Agency Office of Water (U.S. EPA water), visited November 29, 1999,
EPA Office of Water website: (URL http://www.epa.gov/safewater/). U.S. Environmental Protection Agency Office of Water (U.S. EPA water), visited Feb. 12, 2000, EPA
Office of Water website: (URL http://www.epa.gov/safewater/mcl.html). Walla Walla County-City Health Department, 1997, The health of Walla Walla County: Walla Walla,
Wash., Walla Walla County-City Health Department, variously paged. Walla Walla Regional Planning Department (WWRPD), 1989, 205J Study: a study of water quality from
wells in gravel aquifer in the Walla Walla/College Place area: Walla Walla, Wash., Walla Walla Regional Planning Department, 12 p.
Yee, J.J.S., Souza, W.R., 1987, Quality of ground water in Idaho: U.S. Geological Survey Water-Supply Paper 2272, 53 p.
CollectionDate SourceID SamplingLocation SampleTaker AnalyzedBy Lab SampleNum Arsenic Barium Cadmium Chromium Mercury1 Oct-94 Mill Creek Tom Krebs P. Navaja WA State Publ. Health Lab. 925002 BDL BDL BDL BDL BDL
2 Oct-94 Well 5 Tom Krebs P. Navaja WA State Pub. Health Lab. 5115102 BDL BDL BDL BDL BDL
3 Nov-93 Mill Creek inlet drinking water Sherri Huber Water Quality Lab. 0.006 0.0001 0.002 BDL
4 Nov-97 Well 1 L. Riojas WW C-C Health Dept. O8205341
5 Nov-97 Mill Creek Mill Creek L. Riojas WW C-C Health Dept. 08205343
6 Nov-94 Mill Creek reservoir sediment L. Lyons WW DOH Lab. 4700296Pb 0.87 17.8 BDL 0.335 BDL
7 Nov-98 Mill Creek Mill Creek just below dam P. Hess Inland Envl. Lab. 1198522 BDL BDL BDL BDL BDL
8 Dec-80 Mill Creek Jim Morrow WA State Pub. Health Lab. 5402001 BDL BDL BDL BDL BDL
9 Dec-87 Mill Creek Tom Gill WA State Pub. Health Lab. 5?10284 BDL BDL BDL BDL BDL
10 Dec-87 Well 5 Tom Gill P. Navaja WA State Pub. Health Lab. 5110283 BDL BDL BDL BDL BDL
11 Dec-93 Mill Creek reservoir Sherri Huber Water Quality Lab.
12 Dec-80 Well 1 Tom Gill WA State Pub. Health Lab. 5?04310 BDL BDL BDL BDL BDL
13 Dec-96 Mill Creek Tom Krebs P Navaja WA State Pub. Health Lab. 5115485 BDL BDL BDL BDL BDL
14 Dec-96 Well 1 Tom Krebs P. Navaja WA State Pub. Health Lab. 5115486 BDL BDL BDL BDL BDL
15 Dec-97 Mill CreekIntake screening bldg; hose bib on sample pump SK/PO WA State Pub. Health Lab. 02315579 BDL BDL BDL BDL BDL
16 Dec-97 Well 2 hose bib at well head Tom Krebs P. Navaja WA State Pub. Health Lab. 925002 BDL BDL BDL BDL BDL
17 Dec-97 Well 6 WA State Pub. Health Lab. 925002 BDL BDL BDL BDL BDL
18 Dec-89 Mill Creek 25 Whitman #4 Debbie Riley WA State Publ. Health Lab. 5220006
19 Dec-81 Mill Creek Tom Gill WA State Pub. Health Lab. 5105209 BDL BDL BDL BDL BDL
20 Dec-81 WWCC WA State Pub. Health Dept. 5105208 BDL BDL BDL BDL BDL
21 Dec-94 Mill Creek reservoir sediment J. Blandard (?) National Chem. Lab. NCL Report #WE4120523 0.87 17.8 BDL 0.335 BDL
22 Mar-79 Mill Creek Jim Morrow WA State Pub. Health Lab. 5103429 BDL BDL BDL BDL
23 Mar-80 Well 1 AL Prouty WA State Pub. Health Lab. 5?04036 BDL BDL BDL BDL BDL
24 Mar-80 Well 2 Al Prouty WA State Pub. Health Lab. 5??4037 BDL BDL BDL BDL BDL
25 Mar-75 Mill Creek Jim Morrow WA State Pub. Health Lab. 51?7098
26 Mar-75 WWCC David Eaten WA State Pub. Health Lab. 511019
27 Apr-79 Well 4 David Eaton WA State Pub. Health Lab. 5103523 BDL BDL BDL BDL BDL
28 Apr-75 Well 7 WA State Pub. Health Lab. 51?1748
29 May-95 Mill Creek reservoir sediment Tom Krebs L. Lyons Water Quality Lab. 47-01955 0.076 BDL BDL 0.57
30 Jun-75 Well 3 Greg Neustel WA State Pub. Health Lab. 51?1537
Appendix A.—Full data set—inorganic compounds and physical parameters. (BDL = below detection limit; the detection limits for individual elements at each lab were not readily available at the time of publication, but can be obtained by contacting individual labs. Zero was used in place of BDL for analysis.)
19
CollectionDate SourceID SamplingLocation SampleTaker AnalyzedBy Lab SampleNum Arsenic Barium Cadmium Chromium Mercury31 Jun-75 Well 6 Greg Neutstel WA State Pub. Health Lab. 5181536
32 Jul-83 Mill Creek Jim Morrow WA State Pub. Health Lab. 5?06617 BDL BDL BDL BDL BDL
33 Jul-89 Mill Creek Tom Krebs WA State Pub. Health Lab. 5111814 BDL BDL BDL BDL BDL
34 Jul-89 Well 1 Tom Krebs J. Davis WA State Pub. Health Lab. 5111815 BDL BDL BDL BDL BDL
35 Jul-89 Well 3 Tom Krebs J Davies WA State Pub. Health Lab. 5111816 BDL BDL BDL BDL BDL
36 Jul-93 Well 2 Tom Gill WA State Pub. Health Lab. 5114618 BDL BDL BDL BDL BDL
37 Jul-93 Mill Creek reservoir Sherri Huber Water Quality Lab. 0.004 BDL 0.001 BDL
38 Jul-93 Well 2 Water Quality Lab. 0.006 BDL 0.002
39 Jul-93 Mill Creek Tom Gill WA State Pub. Health Lab. 5114617 BDL BDL BDL BDL BDL
40 Jul-95 Mill Creek 1318 Sturm Tom Krebs Water Quality Lab. 47-02057 BDL
41 Jul-90 Mill Creek Tom Gill WA State Publ. Health Lab. 5112612 BDL BDL BDL BDL BDL
42 Jul-90 Well 6 Tom Gill WA State Pub. Health Lab. 5112611 BDL BDL BDL BDL BDL
43 Jul-84 Mill Creek Tom Gill WA State Pub. Health Lab. 5107395 BDL BDL 0.012 BDL BDL
44 Jul-91 Mill Creek Tom Gill WA State Publ. Health Lab. 5113506 BDL BDL BDL BDL BDL
45 Jul-91 Well 3 Tom Gill WA State Pub. Health Lab 5113507 BDL BDL BDL BDL BDL
46 Jul-85 Mill Creek Tom Gill WA State Pub. Health Lab. 5?08352 BDL BDL 0.028 BDL 0.0007
47 Jul-85 Well 4 Tom Gill R. Lowe WA State Pub. Health Lab. 5?08356 BDL BDL BDL BDL 0.0008
48 Aug-83 Well 3 B. Jenkins R. Lowe WA State Pub. Health Lab. 5106627 BDL BDL BDL BDL BDL
49 Aug-89 Well 2 Tom Gill J. Davies WA State Pub. Health Lab. 5219146 BDL
50 Aug-92 Mill Creek Tom Gill WA State Pub. Health Lab. 5114097 BDL BDL BDL BDL BDL
51 Aug-92 Well 5 Tom Gill WA State Pub. Health Lab. 5114098 BDL BDL BDL BDL BDL
52 Aug-86 Mill Creek Tom Gill WA State Pub. Health Lab. 5109173 BDL BDL BDL BDL BDL
53 Aug-86 Well 2 Tom Gill J. Davies WA State Pub. Health Lab. 5109172 BDL BDL BDL BDL BDL
54 Sep-88 Mill Creek Twin Reservoirs Tom Gill WA State Pub. Health Lab. 5217050
55 Sep-95 Mill Creek upstream site 1 Water Quality Lab. (yearly report) BDL BDL BDL BDL BDL
56 Sep-95 Well 7 Water Quality Lab. yearly inorganic analysis BDL BDL BDL BDL BDL
20

1
2
3
4
5
6
7
8
9
10
11
12
13
14
15
16
17
18
19
20
21
22
23
24
25
26
27
28
29
30
Selenium Fluoride NitrateN Beryllium Nickel Antimony Thallium NitriteN Cyanide TotalNitrateNitrite Iron Manganese Silver Chloride Sulfate Zinc TurbidityBDL BDL BDL BDL BDL BDL BDL BDL BDL BDL BDL BDL BDL BDL 0.5
BDL 0.8 BDL BDL BDL BDL BDL BDL BDL 0.73 0.102 BDL BDL BDL 3.7
0.001 0.1 1.2 BDL BDL 0.555 BDL 0.0006 2.2 3.9 BDL 0.25
1.4
0.5
BDL 0.73 3.35 0.02 0.082 12.4 5 102
BDL 0.052 BDL BDL BDL BDL BDL BDL BDL BDL 0.132 BDL BDL BDL 0.8 BDL 0.87
BDL BDL BDL BDL
BDL BDL 0.2 BDL BDL BDL BDL 4.6
BDL 0.8 BDL 1.21 0.158 BDL BDL 4
0.6 BDL
BDL BDL 0.9 BDL BDL BDL 0.5
BDL BDL BDL BDL BDL BDL BDL BDL BDL 0.16 BDL BDL BDL BDL 1.1
BDL 0.3 0.7 BDL BDL BDL BDL BDL BDL BDL BDL BDL BDL BDL 0.1
BDL BDL BDL BDL BDL BDL BDL BDL BDL 0.46 BDL BDL BDL BDL 2.9
BDL 0.3 0.6 BDL BDL BDL BDL BDL BDL BDL BDL BDL BDL BDL 0.1
BDL 0.7 BDL BDL BDL BDL BDL BDL BDL BDL 0.011 BDL BDL BDL 0.1
BDL
BDL BDL BDL 0.18 BDL BDL BDL 0.7
BDL 0.2 0.3 BDL BDL BDL BDL 0.3
BDL 3.35 0.082 102
BDL 0.3 1.9 0.2 BDL BDL 2.2
BDL BDL 7.4 0.5 0.058 BDL 0.4
BDL BDL 6.8 0.4 0.023 BDL 1
0.3 0.5 BDL 0.5 0.15 BDL 3.5 0.5
0.3 0.3 BDL 0.3 0.08 BDL BDL 1 0.3
BDL 0.8 0.2 0.7 0.042 BDL 0.9
0.6 0.5 BDL 0.5 BDL 0.05 4.5 1.5 0.3
BDL 0.118 BDL BDL BDL 0.446 4.016 BDL 0.758
0.4 0.3 0.01 0.3 0.08 BDL 5.8 0.4
21

31
32
33
34
35
36
37
38
39
40
41
42
43
44
45
46
47
48
49
50
51
52
53
54
55
56
Selenium Fluoride NitrateN Beryllium Nickel Antimony Thallium NitriteN Cyanide TotalNitrateNitrite Iron Manganese Silver Chloride Sulfate Zinc Turbidity0.8 0.2 0.02 0.2 0.07 0.4 13.8 0.3
BDL BDL BDL BDL BDL BDL BDL 0.2
BDL 0.3 0.7 BDL BDL BDL BDL BDL 0.1
BDL BDL 0.5 BDL BDL BDL BDL BDL 0.4
BDL 0.3 0.6 BDL BDL BDL BDL BDL 0.1
BDL 0.3 0.5 BDL BDL BDL BDL BDL BDL BDL BDL BDL BDL BDL 0.1
0.002 0.032 1.07 0.018 BDL 0.144 0.002 BDL 4.78 66.35 BDL 0.48
0.18 1.32 BDL 5.35 67.19 0.45
BDL 0.2 0.2 BDL BDL BDL BDL 0.05 0.01 BDL BDL BDL 5 BDL 0.2
BDL 0.23 BDL BDL BDL BDL
BDL BDL BDL BDL BDL BDL BDL BDL 0.3
BDL 0.7 BDL BDL 0.013 BDL BDL BDL 0.2
BDL 0.3 BDL 1.93 0.022 BDL BDL 0.1
BDL BDL BDL BDL BDL BDL BDL 0.2
BDL 0.3 0.3 BDL BDL BDL BDL BDL 0.1
BDL BDL BDL 0.05 BDL BDL BDL 0.2
BDL 0.6 BDL 0.39 0.039 BDL BDL 0.9
BDL BDL 0.2 0.09 0.013 BDL BDL 0.3
BDL BDL BDL BDL BDL BDL BDL BDL
BDL 0.9 BDL BDL BDL BDL BDL BDL
BDL BDL BDL BDL BDL BDL BDL 0.2
BDL 0.2 1.1 BDL BDL BDL BDL 0.1
BDL 0.4 0.3 BDL BDL BDL BDL BDL BDL BDL BDL BDL 1.5 BDL 0.09
BDL 0.9 0.05 BDL BDL BDL BDL BDL BDL BDL 0.0182 BDL 3.4 BDL 0.37
22

1
2
3
4
5
6
7
8
9
10
11
12
13
14
15
16
17
18
19
20
21
22
23
24
25
26
27
28
29
30
Sodium Hardness Conductivity Color TDS Lead Copper Orthophosphate Silica Aluminum Alkalinity Magnesium Calcium AmmoniaBDL 28 60 5 BDL BDL
30 53 210 5 BDL BDL
2 27.5 69 72 BDL BDL 0.1 30 2 BDL
1.7 30.3 6.57 8.56 2.9 7.4 0.5
2.29 20 55 BDL 65 BDL BDL
BDL
BDL 20 70 BDL BDL
30 60 240 10 BDL
BDL 70 170 BDL BDL
BDL 22 50 10 BDL BDL
9 87 190 5 BDL BDL
BDL 19 50 20 BDL BDL
8 76 180 10 BDL BDL
21 71 230 5 0.002 BDL
BDL 30 60 BDL BDL
5 84 180 BDL BDL
6.57 8.56
16 BDL BDL
230 530 5 BDL
210 480 BDL 0.015
1.6 44 66 14.4 52 5.8 8
7.6 60 5 104 32.8 69 5.4 15.2
70 BDL BDL
16.4 64 4 168 71.9 83 4.9 17.6
10.3 BDL 0.312
8.9 76 1 128 37.2 7.3 18.4
23

31
32
33
34
35
36
37
38
39
40
41
42
43
44
45
46
47
48
49
50
51
52
53
54
55
56
Sodium Hardness Conductivity Color TDS Lead Copper Orthophosphate Silica Aluminum Alkalinity Magnesium Calcium Ammonia23.5 72 1 168 42.8 100 6.6 18
BDL 20 70 BDL BDL
10 100 210 BDL BDL BDL
BDL 30 70 BDL BDL BDL
10 80 210 BDL BDL BDL
8 75 180 BDL BDL BDL
0.86 26.72 73 69 0.002 0.013 1.49 1.97
77.32 202 122 0.009 0.9
BDL 27 70 5 BDL BDL
0.002 42
BDL 20 70 BDL BDL BDL
25 80 240 BDL BDL BDL
BDL 30 70 BDL BDL
BDL 25 70 BDL BDL BDL
9 77 200 BDL BDL BDL
BDL 30 70 BDL BDL
20 90 230 BDL BDL
BDL 40 110 BDL BDL
BDL 29 BDL BDL
7 77 BDL BDL
BDL 40 80 BDL BDL
BDL 80 200 BDL BDL
BDL
2.7 16 72 BDL BDL BDL
22 37.4 201 BDL BDL 0.004
24

Walla Walla
Airport
Highway 12
5
5
1
5
1
1010
1010
Mill
Creek
1010
Well #6
Well #4
Well #5
Well #7
Wells #1-31
Appendix B.—Time-of-travel zones—measure the time (in years) it takes for water entering the deep basalt aquifer at a certain point to reach a particular well (after EES, 1998).
N
LEGEND
surface stream
City of Walla Walla (approximate boundary)
miles20 4
kilometers20 4
25