three delusions: paper wealth, a booming economy, and bitcoin · three delusions: paper wealth, a...
TRANSCRIPT

Three Delusions: Paper Wealth, a Booming Economy,and Bitcoin
December 18, 2017by John Hussmanof Hussman Funds
Let us not, in the pride of our superior knowledge, turn with contempt from the follies of our predecessors. Thestudy of the errors into which great minds have fallen in the pursuit of truth can never be uninstructive.”
– Charles MackayExtraordinary Popular Delusions and the Madness of Crowds
Delusions are often viewed as reflecting some deficiency in reasoning ability. The risk of thinking about delusions in thisway is that it encourages the belief that logical, intelligent people are incapable of delusion. An examination of the history offinancial markets suggests a different view. Specifically, faced with unusual or extraordinary price advances, there is anatural tendency (particularly in the presence of crowds, feedback loops, and potential rewards) to look for explanations.The problem isn’t that logic or reason has failed, but that the inputs have been distorted, and in the attempt to justify theadvance amid the speculative excitement, careful data-gathering is replaced by a tendency to confuse temporary factors forfundamental underpinnings.
While true psychological delusions are different from financial ones, a similar principle is suggested by psychologicalresearch. Delusions are best understood not as deficiencies in logic, but rather as explanations that have been logicallyreached on the basis of distorted inputs. For example, individuals with delusions appear vulnerable to differences inperception that may involve more vivid, intense, or emotionally-charged sensory input. While those differences might bedriven by neurological factors, the person experiencing these unusual perceptions looks to develop an explanation. Maheremphasized that despite the skewed input, the delusions themselves are derived by completely normal reasoningprocesses. Similarly, Garety & Freeman found that delusions appear to reflect not a defect in reasoning itself, but a defect“which is best described as a data-gathering bias, a tendency for people with delusions to gather less evidence” so theytend to jump to conclusions.
The reason that delusions are so hard to fight with logic is that delusions themselves are established through the exerciseof logic. Responsibility for delusions is more likely to be found in distorted perception or inadequate information. Theproblem isn’t disturbed reasoning, but distorted or inadequate inputs that the eyes, ears, and mind perceive as undeniablyreal.
Let’s begin by examining the anatomy of speculative bubbles. We’ll follow with a discussion of three popular delusions thathave taken hold of the crowd, and the premises that drive them: the delusion of paper wealth, the delusion of a boomingeconomy, and the delusion that is Bitcoin.
The anatomy of speculative bubbles
Across centuries of history, speculative financial bubbles have repeatedly emerged from the seeds of distorted financialenvironments, where speculative behavior increasingly produces self-reinforcing feedback. Specifically, the speculativebehavior of the crowd results in rising prices that both impress and reward speculators, and in turn encourage even greaterspeculation. The more impressed the crowd becomes with the result of its own behavior, the more that behavior persists,and the more unstable the system becomes, until finally the flapping wings of a butterfly become sufficient to provoke acollapse, launching a self-reinforcing feedback loop in the opposite direction.
The 1929 bubble was built on the foundation of real economic prosperity during the roaring 20’s, but the late stages of thatboom were largely fueled by debt and easy money. Observing the persistent market advance, investors largely ignored thecontribution of their own speculation in producing that advance. Rather, as traditional valuation measures becameincreasingly stretched, the first impulse of investors was to try to justify the elevated valuations in novel ways, whichgradually became nothing but excuses for continued speculation. As John Kenneth Galbraith wrote decades ago in his
Page 1, © 2020 Advisor Perspectives, Inc. All rights reserved.
book, The Great Crash 1929:
“It was still necessary to reassure those who required some tie, however tenuous, to reality. This process of reassuranceeventually achieved the status of a profession. However, the time had come, as in all periods of speculation, when mensought not to be persuaded by the reality of things but to find excuses for escaping into the new world of fantasy.”
Keep in mind that yes, the economy was strong, business was booming, and money was easy. The problem was thatinvestors stopped thinking about stocks as a claim on a very, very long-term stream of discounted cash flows. Valuationsdidn’t matter. It was enough that the economy was expanding. It was enough that earnings were rising. Put simply, thetrend of earnings and the economy, not the actual level of valuation, became the justification for buying stocks. Graham &Dodd described this process:
“During the latter stage of the bull market culminating in 1929, the public acquired a completely different attitude towardsthe investment merits of common stocks… Why did the investing public turn its attention from dividends, from asset values,and from average earnings to transfer it almost exclusively to the earnings trend, i.e. to the changes in earnings expectedin the future? The answer was, first, that the records of the past were proving an undependable guide to investment; and,second, that the rewards offered by the future had become irresistibly alluring.
“Along with this idea as to what constituted the basis for common-stock selection emerged a companion theory thatcommon stocks represented the most profitable and therefore the most desirable media for long-term investment. Thisgospel was based on a certain amount of research, showing that diversified lists of common stocks had regularly increasedin value over stated intervals of time for many years past.
“These statements sound innocent and plausible. Yet they concealed two theoretical weaknesses that could and did resultin untold mischief. The first of these defects was that they abolished the fundamental distinctions between investment andspeculation. The second was that they ignored the price of a stock in determining whether or not it was a desirablepurchase.
“The notion that the desirability of a common stock was entirely independent of its price seems incredibly absurd. Yet thenew-era theory led directly to this thesis… An alluring corollary of this principle was that making money in the stock marketwas now the easiest thing in the world. It was only necessary to buy ‘good’ stocks, regardless of price, and then to letnature take her upward course. The results of such a doctrine could not fail to be tragic.”
– Benjamin Graham & David L. Dodd, Security Analysis, 1934
The 2000 tech bubble featured the same process in a slightly different form. The inputs and premises that investorsobserved were valid, but incomplete. Economic growth and employment were strong, and money was easy. The internetdid indeed have tremendous growth prospects. But again, as the advance became more speculative, investors largelyignored the impact of their own speculation in producing that advance. Instead, their first impulse was again to try tojustifythe elevated valuations in novel ways (recall “price-to-eyeballs”). By March 2000, on the basis of historically reliablevaluation measures, I projected that a retreat to normal valuations would require an -83% plunge in tech stocks. In the 19months that followed, that estimate turned out to be precise for the tech-heavy Nasdaq 100 Index.
The mortgage bubble leading up to the global financial crisis was built on the same sort of distorted inputs, this time fueledby the insistence of the Federal Reserve to hold interest rates at just 1% after the tech collapse. As yield-starved investorslooked for relatively safe alternatives to low-yielding Treasury securities, they turned to mortgage securities, which had to-date never experienced major losses. Wall Street responded to the appetite for more “product” by creating new mortgagesecurities, which required the creation of new mortgages, and led to the creation of no-doc, zero-down mortgages and thewillingness to lend to anyone with a pulse. All of this produced a glorious period of temporary prosperity and rising prices.As usual, instead of recognizing the impact of their own speculation in producing the advance, the first impulse of investorswas to try to justify why elevated asset and housing valuations made sense.
As the bubble expanded, Janet Yellen, then the head of the San Francisco Federal Reserve, offered this benignassessment of the risks:
“First, if the bubble were to deflate on its own, would the effect on the economy be exceedingly large? Second, is it unlikelythat the Fed could mitigate the consequences? Third, is monetary policy the best tool to use to deflate a house-pricebubble? My answers to these questions in the shortest possible form are, ‘no,’ ‘no,’ and ‘no’ … It seems that the argumentsagainst trying to deflate a bubble outweigh those in favor of it. So, my bottom line is that monetary policy should react torising prices for houses or other assets only insofar as they affect the central bank’s goal variables—output, employment,and inflation.”
Page 2, © 2020 Advisor Perspectives, Inc. All rights reserved.
Missing from Yellen’s benign assessment was the fact that the speculative distortion and debt buildup enabled by thebubble itself would be the primary driver of the worst economic collapse since the Great Depression. The Fed appears toexclude such risks from its thinking, despite the fact that the worst economic collapses in history have generally gone hand-in-hand with episodes of financial speculation and their inevitable collapse.
In the apparent attempt to bookend her term as Fed Chair by brushing aside the current progression toward financialcollapse with an equally benign and milquetoast risk assessment, Janet Yellen observed on December 14, 2017:
“If there were an adjustment in asset valuations, the stock market, what impact would it have on the economy, and would itprovoke financial stability concerns? … I think when we look at other indicators of financial stability risks, there’s nothingflashing red there, or possibly even orange.”
Despite risks that I fully expect to devolve into a roughly -65% loss in the S&P 500 over the completion of the currentmarket cycle, it’s absolutely critical to distinguish the long-term effects of valuation from the shorter-term effects speculativepressure. Historically-reliable valuation measures are remarkably useful in projecting long-term and full-cycle marketoutcomes, but the behavior of the market over shorter segments of the market cycle is driven by the psychologicalinclination of investors toward speculation or risk-aversion. The most useful measure we’ve found of that psychologicalinclination is the uniformity or divergence of market internals across a broad range of individual stocks, industries, sectors,and security types (including debt securities of varying creditworthiness). When investors are inclined to speculate, theytend to be indiscriminate about it.
Faced with extreme valuations, the first impulse of investors should not be to try to justify those valuation extremes,but to recognize the impact of their own speculative behavior in producing and sustaining those extremes. It thenbecomes essential to monitor market conditions for the hostile combination of extreme valuations and deterioratingmarket internals.
In the recent advancing half-cycle, the speculation intentionally provoked by zero-interest rate policy forced us to elevatethe priority of market internals to a far greater degree than was required during the tech and mortgage bubbles. It wasnecessary to prioritize the behavior of market internals even over extreme “overvalued, overbought, overbullish” features ofmarket action. Those syndromes were effective in other cycles across history, but in the advancing half-cycle since 2009,our bearish response to those syndromes proved to be our Achilles Heel. The process of adaptation was very incremental,and therefore painful in the face of persistent speculation. We’ve adapted our investment discipline so that withoutexception, a negative market outlook can be established only in periods when our measures of market internals have alsodeteriorated. A neutral outlook is fine when conditions are sufficiently unfavorable, but establishing a negative outlookrequires deterioration and dispersion in market internals.
Faced with extreme valuations, the first impulse of investors should not be to try to justify those valuation extremes, but torecognize the impact of their own speculative behavior in producing and sustaining those extremes. It then becomesessential to monitor market conditions for the hostile combination of extreme valuations and deteriorating market internals.At present, we observe that combination, but would still characterize the deterioration in market internals as “early,” in thesense that it’s permissive of abrupt market losses, but not severe enough to infer a clear shift from speculation to risk-aversion among investors.
The delusion of paper wealth
Across history, the evaporation of paper wealth following periods of speculation has repeatedly taught a lesson that isnever retained for long. Unfortunately, the lesson has to be relearned again and again because of what J.K. Galbraithreferred to as “the extreme brevity of the financial memory.” Speculation is dangerous because it encourages the belief thatjust because prices are elevated, they must somehow actually belong there. It encourages the belief that the paper itselfiswealth, rather than the stream of future cash flows that investors can expect their securities to deliver over time.
On Saturday, December 16, the St. Louis Fed posted a rather disturbing tweet: “Negative interest rates may seemludicrous, but not if they succeed in pushing people to invest in something more stimulating to the economy thangovernment bonds.”
This tweet was disturbing because it reflects a strikingly flawed understanding of financial markets. A moment’s reflectionshould make it obvious that once a security is issued, whether it’s a government bond or a dollar of base money, thatsecurity must be held by someone, at every point in time, until that security is retired. The only way to get people to investin something “more stimulating to the economy” than government bonds is to stop issuing government bonds.
Page 3, © 2020 Advisor Perspectives, Inc. All rights reserved.

It takes only a bit more thought to recognize that securities, in themselves, are not net wealth. Rather, every security is anasset to the holder, and an equivalent liability to the issuer. If Joe borrows dollars from Mary to buy something from Bob,Joe issues an IOU to Mary, Mary transfers her dollars to Joe, and the dollars end up in Bob’s hands. The IOU is a newsecurity, but it doesn’t represent new economic wealth. It’s just evidence of the transfer of current purchasing power fromMary to Joe, and a claim on the transfer of future purchasing power from Joe to Mary.
Neither the creation of securities, nor changes in their price, create net wealth or purchasing power for the economy. Yes,an individual holder of a security can obtain a transfer of wealthfrom someone else in the economy, provided that theholder actually sells the security to some new buyer while the price remains elevated. But in aggregate, the economycannot consume off of its paper “wealth,” because in aggregate, those paper securities cannot be sold without someoneelse to buy them, and those paper securities must be held by someone until they are retired.
What actually matters, in aggregate, is the stream of cash flows. Specifically, the activity that produces actual economicwealth is value-added production, which results in goods and services that did not exist previously with the same value.Value-added production is what actually “injects” purchasing power into the economy, as well as the objects available to bepurchased.
I’ve detailed the mechanics of “stock-flow accounting” in previous commentaries, so it will suffice here to cut to the bottomline. If one carefully accounts for what is spent, what is saved, and what form those savings take (securities that transferthe savings to others, or tangible real investment of output that is not consumed), one obtains a set of “stock-flowconsistent” accounting identities that must be true at each point in time:
1) Total real saving in the economy must equal total real investment in the economy;
2) For every investor who calls some security an “asset” there’s an issuer that calls that same security a “liability”;
3) The net acquisition of all securities in the economy is always precisely zero, even though the gross issuance ofsecurities can be many times the amount of underlying saving;
4) When one nets out all the assets and liabilities in the economy, the only thing that is left – the true basis of a society’snet worth – is the stock of real investment that it has accumulated as a result of prior saving, and its unused endowment ofresources. Everything else cancels out because every security represents an asset of the holder and a liability of theissuer. Securities are not net wealth.
Conceptualizing the “stock of real investment” as broadly as possible, the wealth of a nation consists of its stock of realprivate investment (e.g. housing, capital goods, factories), real public investment (e.g. infrastructure), intangible intellectualcapital (e.g. education, knowledge, inventions, organizations, and systems), and its endowment of basic resources such asland, energy, and water. In an open economy, one would include the net claims on foreigners (negative, in the U.S. case).A nation that expands and defends its stock of real, productive investment is a nation that has the capacity to generate ahigher long-term stream of value-added production, and to sustain a higher long-term standard of living.
Understand that securities are not net economic wealth. They are a claim of one party in the economy – by virtue of pastsaving – on the future output produced by others. When paper “wealth” becomes extremely elevated or depressed relativeto the value-added produced by an economy, it’s the paper “wealth” that adjusts to eliminate the gap.
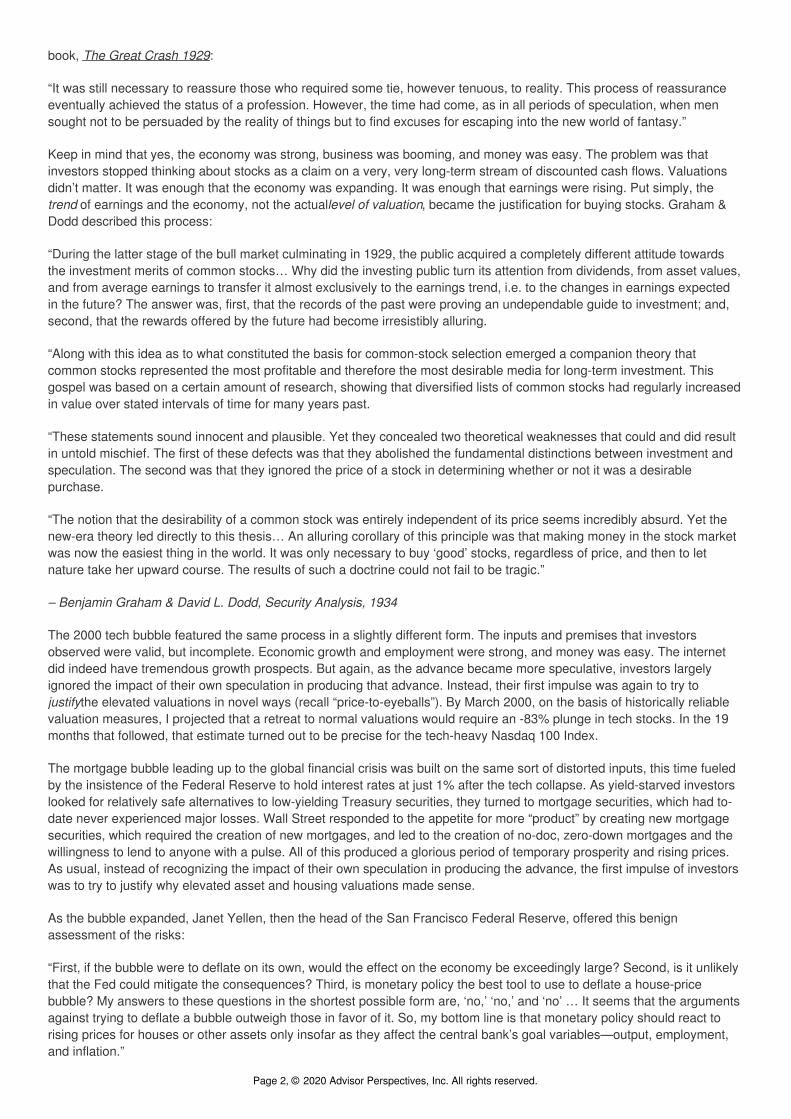
Several years ago, I introduced what remains the single most reliable measure of valuation we’ve ever developed or tested,easily outperforming popular measures such as the Fed Model, price/forward operating earnings, the Shiller CAPE,price/NIPA profits, and a score of other alternatives. From the above discussion, it shouldn’t be surprising that this measureis based on the ratio of equity market capitalization to corporate gross-value added. Specifically, the chart below shows themarket capitalization of U.S. nonfinancial equities, divided by the gross value-added of U.S. nonfinancial companies,including estimated foreign revenues. This measure is shown on an inverted log scale (blue line, left scale). The red lineshows actual subsequent S&P 500 average annual nominal total return over the following 12-year period. We prefer a 12-year horizon because that’s where the “autocorrelation profile” of valuations (the correlation between valuations at onepoint and valuations at any other point) reaches zero. Presently, we estimate negative total returns for the S&P 500 overthe coming 12-year period.
Page 4, © 2020 Advisor Perspectives, Inc. All rights reserved.
Among the valuation measures we find best correlated with actual S&P 500 total returns in market cycles across history,the S&P 500 is currently more than 2.8 times its historical norms. Importantly, this estimate of overvaluation is notsomehow improved by accounting for the level of interest rates. The reason is that interest rates and economic growth ratesare highly correlated across history. Lower interest rates only “justify” higher market valuations provided that the trajectoryof future cash flows is held constant. But if interest rates are low because growth rates are also low (which we’ll establish inthe next section below), no valuation premium is “justified” at all.
So even given the level of interest rates, we expect a market loss of about -65% to complete the current speculative marketcycle. That’s a much different proposition, however, than saying that this collapse will occur right away. If you watchfinancial television, you’ll hear a great deal of chatter about the “fundamental support” below current prices. But attendcarefully, and you’ll find that nearly all of these arguments reduce to a list of factors that make the investment environmentfeel good at the moment. These feel-good factors are being extrapolated into the future just as surely as Irving Fisher did in1929 when he proposed that stocks had reached “a permanently high plateau.”
The best place to watch for cracks in this narrative is not valuations; they are already extreme, and are uninformative aboutnear-term outcomes. Rather, it’s essential to monitor the uniformity of market internals across a wide range of individualsecurities (when investors are inclined to speculate, they tend to be indiscriminate about it). We’ve already observeddeterioration in our key measures of market internals, but I would still characterize that deterioration as “early.”
When paper ‘wealth’ becomes extremely elevated or depressed relative to the value-added produced by aneconomy, it’s the paper ‘wealth’ that adjusts to eliminate the gap.
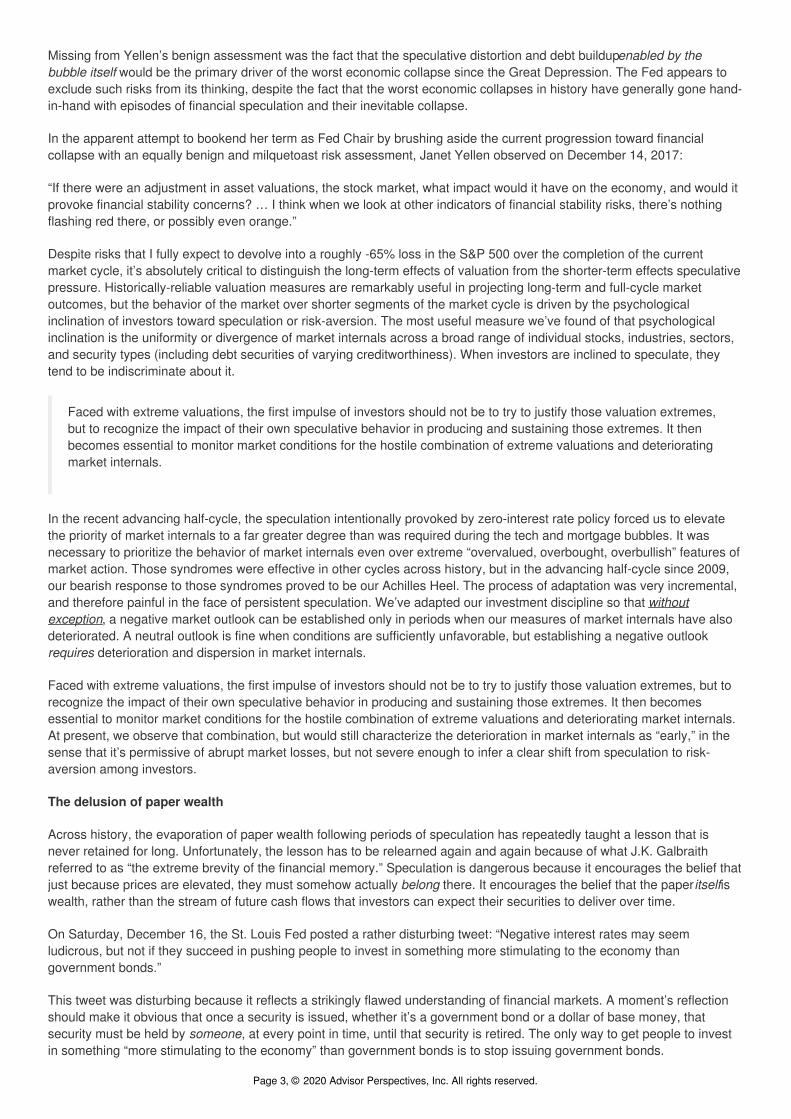
Extending our focus beyond immediate conditions, the chart below shows the total market capitalization of nonfinancial andfinancial U.S. corporations, along with three lines. The lowest red line shows total gross-value added (GVA) of U.S.corporations. The green line shows 1.2 times total GVA, representing the pre-bubble norm around which marketcapitalization has historically traded. That green line is the level historically associated with S&P 500 total returns of roughly
Page 5, © 2020 Advisor Perspectives, Inc. All rights reserved.
10% annually, though the same level today would be associated with lower expected future returns, because structuraleconomic growth is lower today than in the past. The purple line is essentially the most “optimistic” value-line, in that nobear market in history, including the 2002 low, has failed to reach or violate that level.
The upshot is this. At present, U.S. investors are under the delusion that the $37.3 trillion of paper wealth in their equityportfolios represents durable purchasing power. Unfortunately, as in 2000 and 2007, they are likely to observe anevaporation of this paper wealth. Nobody will “get” that wealth. It will simply vanish. If a dentist in Poughkeepsie sells asingle share of Apple a dime lower than the previous trade, over $500 million dollars of paper wealth is instantly wiped fromthe stock market. That’s how market capitalization works. Over the completion of this market cycle, we estimate thatbetween $19.8 and $24.2 trillion in paper “wealth” will evaporate into thin air.
A nation that expands and defends its stock of real, productive investment is a nation that has the capacity togenerate a higher long-term stream of value-added production, and to sustain a higher long-term standard of living.
While our immediate market outlook remains only moderately negative, based on the still-early deterioration we observe inmarket internals, recognize that from a valuation perspective, we are now witnessing the single most offensive speculative
Page 6, © 2020 Advisor Perspectives, Inc. All rights reserved.
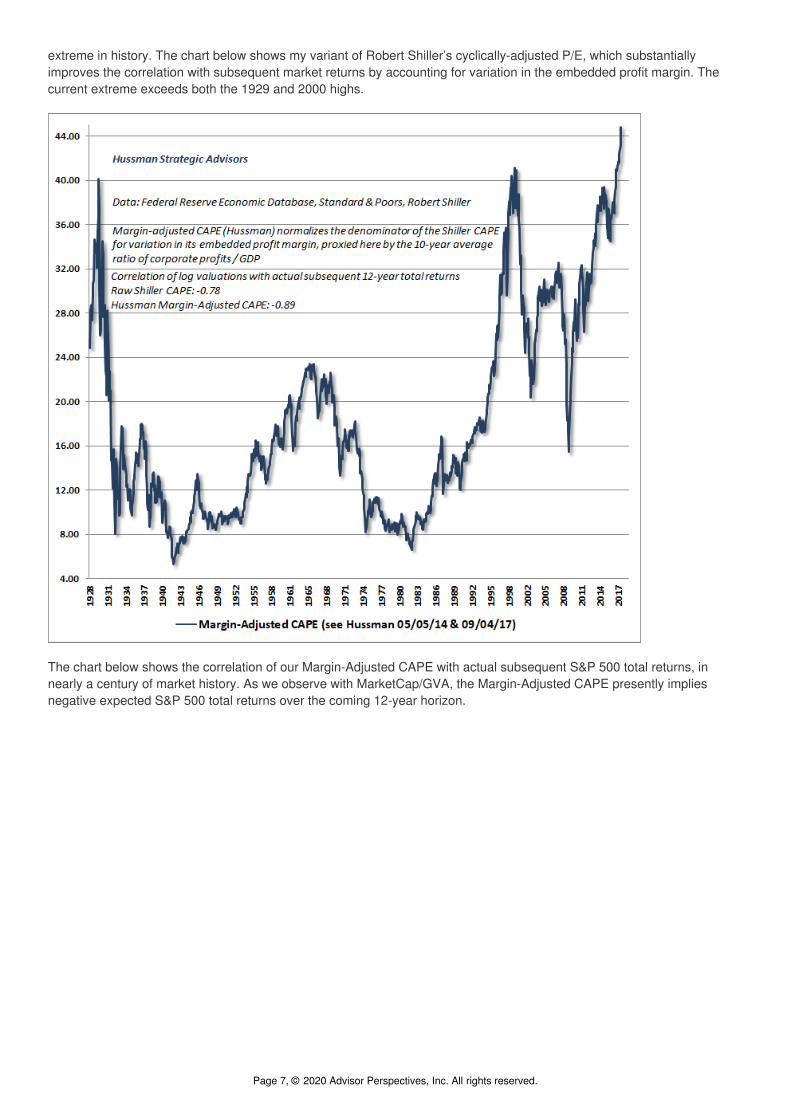
extreme in history. The chart below shows my variant of Robert Shiller’s cyclically-adjusted P/E, which substantiallyimproves the correlation with subsequent market returns by accounting for variation in the embedded profit margin. Thecurrent extreme exceeds both the 1929 and 2000 highs.
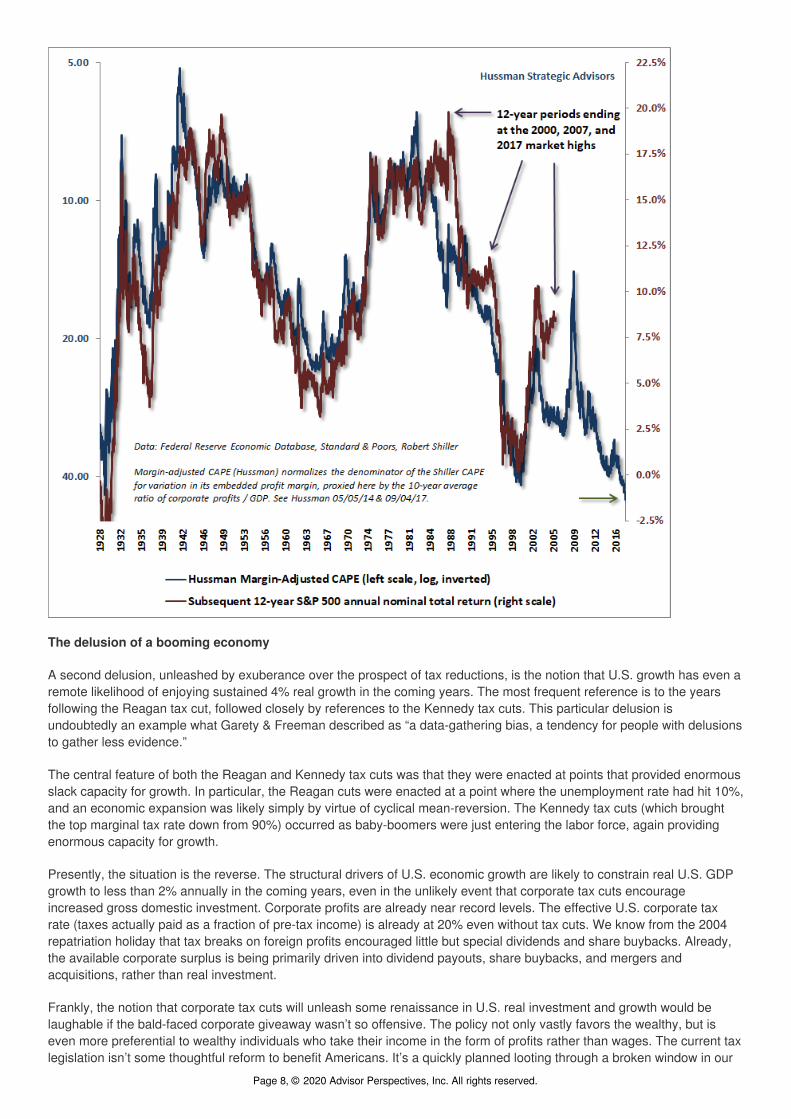
The chart below shows the correlation of our Margin-Adjusted CAPE with actual subsequent S&P 500 total returns, innearly a century of market history. As we observe with MarketCap/GVA, the Margin-Adjusted CAPE presently impliesnegative expected S&P 500 total returns over the coming 12-year horizon.
Page 7, © 2020 Advisor Perspectives, Inc. All rights reserved.
The delusion of a booming economy
A second delusion, unleashed by exuberance over the prospect of tax reductions, is the notion that U.S. growth has even aremote likelihood of enjoying sustained 4% real growth in the coming years. The most frequent reference is to the yearsfollowing the Reagan tax cut, followed closely by references to the Kennedy tax cuts. This particular delusion isundoubtedly an example what Garety & Freeman described as “a data-gathering bias, a tendency for people with delusionsto gather less evidence.”
The central feature of both the Reagan and Kennedy tax cuts was that they were enacted at points that provided enormousslack capacity for growth. In particular, the Reagan cuts were enacted at a point where the unemployment rate had hit 10%,and an economic expansion was likely simply by virtue of cyclical mean-reversion. The Kennedy tax cuts (which broughtthe top marginal tax rate down from 90%) occurred as baby-boomers were just entering the labor force, again providingenormous capacity for growth.
Presently, the situation is the reverse. The structural drivers of U.S. economic growth are likely to constrain real U.S. GDPgrowth to less than 2% annually in the coming years, even in the unlikely event that corporate tax cuts encourageincreased gross domestic investment. Corporate profits are already near record levels. The effective U.S. corporate taxrate (taxes actually paid as a fraction of pre-tax income) is already at 20% even without tax cuts. We know from the 2004repatriation holiday that tax breaks on foreign profits encouraged little but special dividends and share buybacks. Already,the available corporate surplus is being primarily driven into dividend payouts, share buybacks, and mergers andacquisitions, rather than real investment.
Frankly, the notion that corporate tax cuts will unleash some renaissance in U.S. real investment and growth would belaughable if the bald-faced corporate giveaway wasn’t so offensive. The policy not only vastly favors the wealthy, but iseven more preferential to wealthy individuals who take their income in the form of profits rather than wages. The current taxlegislation isn’t some thoughtful reform to benefit Americans. It’s a quickly planned looting through a broken window in our
Page 8, © 2020 Advisor Perspectives, Inc. All rights reserved.
nation’s character.
On the subject of economic growth, an examination of the structural drivers of economic growth will illuminate the currentsituation. Real economic growth is the sum of two components: employment growth plus productivity growth. That meansgrowth in the number of employed workers, plus growth in the level of output per-worker.
We can further break employment growth into “structural” and “cyclical” components. The structural part is determinedprimarily by demographics, particularly population growth and the age distribution of the working-age population. Thecyclical part is determined by fluctuations in the unemployment rate (which is equal to 1-civilian employment/civilian laborforce). If civilian employment grows faster than the civilian labor force, the unemployment rate falls. If the civilian labor forcegrows faster than civilian employment, the unemployment rate rises.
Let’s take a look at these components, and how they’ve changed over the decades. You’ll quickly see that while a quarterlypop in GDP growth is always possible, expectations of sustained 4% real GDP growth fall into the category of “delusion.”
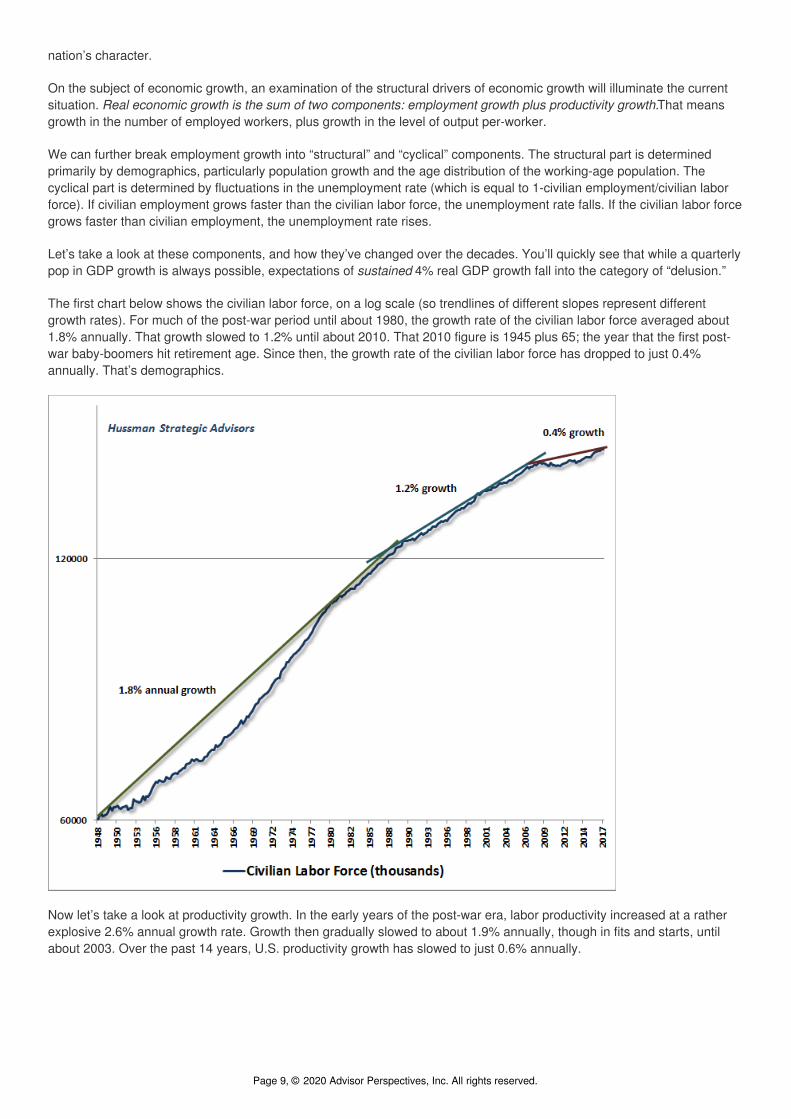
The first chart below shows the civilian labor force, on a log scale (so trendlines of different slopes represent differentgrowth rates). For much of the post-war period until about 1980, the growth rate of the civilian labor force averaged about1.8% annually. That growth slowed to 1.2% until about 2010. That 2010 figure is 1945 plus 65; the year that the first post-war baby-boomers hit retirement age. Since then, the growth rate of the civilian labor force has dropped to just 0.4%annually. That’s demographics.
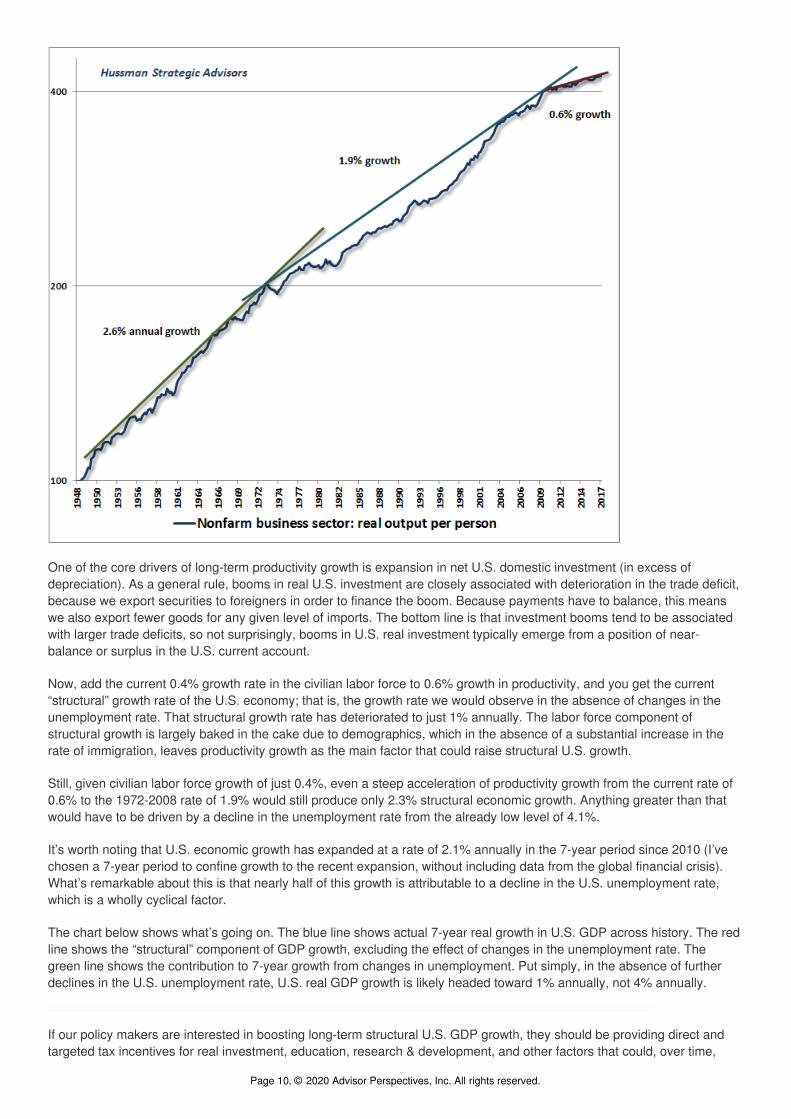
Now let’s take a look at productivity growth. In the early years of the post-war era, labor productivity increased at a ratherexplosive 2.6% annual growth rate. Growth then gradually slowed to about 1.9% annually, though in fits and starts, untilabout 2003. Over the past 14 years, U.S. productivity growth has slowed to just 0.6% annually.
Page 9, © 2020 Advisor Perspectives, Inc. All rights reserved.
One of the core drivers of long-term productivity growth is expansion in net U.S. domestic investment (in excess ofdepreciation). As a general rule, booms in real U.S. investment are closely associated with deterioration in the trade deficit,because we export securities to foreigners in order to finance the boom. Because payments have to balance, this meanswe also export fewer goods for any given level of imports. The bottom line is that investment booms tend to be associatedwith larger trade deficits, so not surprisingly, booms in U.S. real investment typically emerge from a position of near-balance or surplus in the U.S. current account.
Now, add the current 0.4% growth rate in the civilian labor force to 0.6% growth in productivity, and you get the current“structural” growth rate of the U.S. economy; that is, the growth rate we would observe in the absence of changes in theunemployment rate. That structural growth rate has deteriorated to just 1% annually. The labor force component ofstructural growth is largely baked in the cake due to demographics, which in the absence of a substantial increase in therate of immigration, leaves productivity growth as the main factor that could raise structural U.S. growth.
Still, given civilian labor force growth of just 0.4%, even a steep acceleration of productivity growth from the current rate of0.6% to the 1972-2008 rate of 1.9% would still produce only 2.3% structural economic growth. Anything greater than thatwould have to be driven by a decline in the unemployment rate from the already low level of 4.1%.
It’s worth noting that U.S. economic growth has expanded at a rate of 2.1% annually in the 7-year period since 2010 (I’vechosen a 7-year period to confine growth to the recent expansion, without including data from the global financial crisis).What’s remarkable about this is that nearly half of this growth is attributable to a decline in the U.S. unemployment rate,which is a wholly cyclical factor.
The chart below shows what’s going on. The blue line shows actual 7-year real growth in U.S. GDP across history. The redline shows the “structural” component of GDP growth, excluding the effect of changes in the unemployment rate. Thegreen line shows the contribution to 7-year growth from changes in unemployment. Put simply, in the absence of furtherdeclines in the U.S. unemployment rate, U.S. real GDP growth is likely headed toward 1% annually, not 4% annually.
If our policy makers are interested in boosting long-term structural U.S. GDP growth, they should be providing direct andtargeted tax incentives for real investment, education, research & development, and other factors that could, over time,
Page 10, © 2020 Advisor Perspectives, Inc. All rights reserved.

increase our nation’s productive capacity. Instead, they’ve opted for a giveaway to corporations and wealthy individuals,which will likely expand the deficit while doing virtually nothing for economic growth. Since 1950, the U.S. unemploymentrate has been below 4.5% about 20% of the time. Over the following 5-year period, real federal tax revenues grew at anaverage rate of less than 1% annually. Given current structural economic constraints, and barring a further decline in theunemployment rate from an already low 4.1%, there’s a significant likelihood that government revenues will actuallycontract in the coming years.
The current tax legislation isn’t some thoughtful reform to benefit Americans. It’s a quickly planned looting through abroken window in our nation’s character.
The delusion of Bitcoin
“We find that whole communities suddenly fix their minds upon one object, and go mad in its pursuit; that millions of peoplebecome simultaneously impressed with one delusion, and run after it, till their attention is caught by some new folly morecaptivating than the first”– Charles Mackay
With regard to Bitcoin, my view is that the Blockchain algorithm itself is brilliant. Bitcoin itself, however, is just oneapplication of Blockchain, and a rather awkward one. It’s not unique, meaning that other competing “cryptocurrencies” canbe established just as easily. It’s not fiat, meaning that no country requires it to be used as legal tender. But beyondanything else, its inefficiency is so mind-boggling that the continued operation of the Bitcoin network could plausiblycontribute to global warming. So be careful to distinguish Blockchain from Bitcoin. The Blockchain algorithm willundoubtedly become a useful component of validating transactions, tracking supply chain movements, and all sorts of otherapplications, but Bitcoin itself is likely to become the same thing to cryptocurrencies as Visicalc was to spreadsheets, or ifyou’re younger, what MySpace was to social networking.
Bitcoin essentially uses a decentralized network of computers (anyone can join) that “listen” for transactions that arebroadcast over the network. Each computer can accept and attempt to validate any “block” of transactions, which is doneby discovering a particular “hash” for those transactions. The hash is a long string of ones and zeros corresponding to theinput, and has to satisfy the current level of “difficulty” (specifically, a certain number of leading zeros). The difficulty is setso that only one block of transactions is validated every 10 minutes or so, across the entire network. The maximum size ofa Bitcoin transaction block is 1MB, which is about 2000 transactions. That’s the total number of Bitcoin transactions thatcan be processed worldwide in any 10-minute interval.
When you’re trying to validate a block of transactions, an extra transaction is included which designates a reward to yourown account if you’re successful. Whoever discovers a hash that validates their block gets a reward, in Bitcoin. That’s what“mining” means. The validated block is added to the Blockchain – essentially a running ledger of every transaction evermade. The header for the next block has to contain the hash of the previously validated block (which is what creates theblock “chain”).
But here’s the thing. Every time a block is validated, a single node in the network gets a reward, and everyone else’scomputing time is completely wasted. Those required computations already absorb the same amount of energy as theentire country of Denmark. Some people will get mad at that statement, arguing that it may only be half of Denmark. Ok.Ireland, along with more than 150 other countries. We can wait a few months to include Denmark.
So ultimately, the Bitcoin features a combination of breathtaking inefficiency and constrained scalability. The systemalready features a rather steep cost per transaction, and hardly any of those transactions are for the purchase of goodsand services. I’ve regularly observed that the value of a currency is essentially the present value of the stream of “services”that the currency can be expected to deliver over time, either by serving as a means of payment or as a store of value. Thatdepends greatly on the willingness of other individuals to hold it and accept it into the indefinite future. My sense is that, aswith all speculative bubbles, buyers are conflating “rising price” with “store of value.” Meanwhile, there’s little evidence tosuggest that Bitcoin will ever be an efficient means of payment for ordinary goods and services.
Episodes of speculation can persist for some time, so there may be some speculative profit potential in Bitcoin yet. Lookingover the very long-term, it may also be worth something in the future, because value is always ascribed to things that havesome combination of scarcity and usefulness. To the extent that Bitcoin is assured to have a limited supply, and isundoubtedly being used for money-laundering already, I doubt that the future value of Bitcoin will be identically zero,assuming governments refrain from any regulatory effort. There will likely be numerous alternative cryptocurrencieslaunched in the future, each one constructed to first enrich its originator with a large number of units, and then released in
Page 11, © 2020 Advisor Perspectives, Inc. All rights reserved.

the hope that it will catch on. In evaluating these alternatives, efficiency and scalability will be worth considering.
A final note
While I have little to offer in support of speculative delusions about paper wealth, improbable growth expectations, orBitcoin, I’d be remiss to write a commentary without acknowledging the many things that can be fully embraced. From aninvestment standpoint, every market cycle in history has ended at valuations consistent with prospective future marketreturns of at least 8% annually, and more often well above 10% annually. Even if the future will be permanently different,and even 8% return prospects will never ever be seen again, the prospect of negative12-year returns is likely to beresolved in far fewer than 12 years (as similarly poor prospects were within 2 years of the 2000 market peak).
The strongest expected market return/risk classifications we identify emerge when a material retreat in valuations is joinedby an early improvement in market action. While we can’t identify when that opportunity will occur, I expect that thecumulative market return between now and that point will be negative, because even a gradual 2-year improvement inprospective 12-year S&P 500 returns to just 4% would require a market loss of more than 20% over that 2-year period. Inmy view, a defensive posture here is an optimistic stance, because it recognizes the likelihood that prospective returns willagain be positive before too long. I actually expect a much more substantial improvement in prospective market returns,but as in 2000 and 2007, that would require much deeper market losses than investors seem to contemplate.
So if there is something in the financial markets to be optimistic about, it’s the prospect of opportunities that will evolve overthe completion of the current market cycle. Despite extreme valuations in this cycle, we’ve learned to limit negative marketoutlooks to periods featuring deteriorating and divergent market internals. We observed that shift last month, but I’d still callit “early” deterioration; permissive of abrupt losses but not yet encouraging aggressive downside expectations. We’llrespond to market conditions as they change.
Of course, there are so many more things to fully embrace, particularly this holiday season. To be alive, breathing, sharinghumanity with others we love on this little blue and green rock, spinning around a star, floating through a vast infinity, ismiracle enough to demand no delusions at all.
Wishing you the joy that comes from recognizing all of your blessings. With gratitude to so many of you, who are amongmine.
The foregoing comments represent the general investment analysis and economic views of the Advisor, and are providedsolely for the purpose of information, instruction and discourse.
Prospectuses for the Hussman Strategic Growth Fund, the Hussman Strategic Total Return Fund, the Hussman StrategicInternational Fund, and the Hussman Strategic Dividend Value Fund, as well as Fund reports and other information, areavailable by clicking “The Funds” menu button from any page of this website.
Estimates of prospective return and risk for equities, bonds, and other financial markets are forward-looking statementsbased the analysis and reasonable beliefs of Hussman Strategic Advisors. They are not a guarantee of futureperformance, and are not indicative of the prospective returns of any of the Hussman Funds. Actual returns may differsubstantially from the estimates provided. Estimates of prospective long-term returns for the S&P 500 reflect our standardvaluation methodology, focusing on the relationship between current market prices and earnings, dividends and otherfundamentals, adjusted for variability over the economic cycle.
© Hussman Funds
Page 12, © 2020 Advisor Perspectives, Inc. All rights reserved.