three-dimensional analysis of momentary liquefaction near ...121311/shabani_afmc_16_07.pdf · the...
TRANSCRIPT
16th Australasian Fluid Mechanics Conference Crown Plaza, Gold Coast, Australia 2-7 December 2007
Three-Dimensional Analysis of Momentary Liquefaction near Submarine Pipelines
Behnam Shabani1 and Dong-Sheng Jeng1
1School of Civil Engineering, The University of Sydney, Sydney, NSW, 2006 AUSTRALIA
Abstract Wave-induced seabed liquefaction and shear failure have been identified as important mechanisms of submarine buried pipelines failure. Most previous studies evaluated the potential of seabed instability around underwater pipelines using two-dimensional numerical/analytical solutions. In real ocean environments, however, waves can approach the pipeline from an oblique direction. In this study, a three-dimensional FE numerical model is established and validated to simulate the wave-seabed-pipeline interaction. The seabed consolidation under the dynamic loading of ocean waves is simulated to evaluate the wave-induced seabed response. Simulation results are used to carry an instability analysis around pipeline. The numerical study reveals that the risk of seabed shear failure near the pipeline is considerably dependant to the wave angle of incidence. Introduction The passage of ocean waves exerts a dynamic pressure on seabed soil. The porous seabed consolidates under the wave loading and therefore pore pressure and effective and shear stresses are generated within the seabed soil. In the presence of an impermeable pipeline, the distribution of such wave-induced seabed responses becomes significantly more sophisticated. On the other hand, large pore pressure and shear stresses, generated by severe storms, will result in seabed instability around this structure and thus in its failure. Wave-induced liquefaction and shear failure are well-addressed important mechanisms of the so-called seabed instability, which has been identified as the source of failure of several submarine buried pipelines. Ocean waves generate excessive pore pressure within the porous bed. Increasing pore pressure, in turn, results in the reduction of effective stress and loss of soil particles contacts and, thus, soil structural strength in carrying normal and shear stresses. Hence, the submarine pipeline will float or sink into this liquefied seabed soil. Shear failure, however, occurs when shear stress in a plane within the seabed soil exceeds the shear bearing capacity of the soil. Such a failure, resulted from soil particles slipping on each other, is accompanied by the large horizontal deformation and the breakage of pipeline. Early studies have been concerned only about the pore pressure distribution within the seabed. Ref. [1] applied potential theory to the wave-seabed interaction problem to evaluate the pore pressure field. Later, [2], [3] and [4] applied the same theory to the wave-seabed-pipeline interaction and derived a series of two-dimensional analytical solutions to estimate seepage forces on underwater buried pipelines. Ref. [5] and [6] used a 3-D Boundary Integral Equation Model to solve the Laplace equation numerically and evaluate pore pressure near the pipeline. They reported the seepage force on the pipe slightly changing when waves approach it from different angles. The potential theory, however, is far from a realistic solution to this problem since it
does not provide any information about seabed stresses and thus is unable to evaluate the potential of seabed instability. On the other hand, the pore pressure obtained by applying this theory is reliable only in highly permeable and/or very dense soils. The first analytical solution to the wave-induced seabed response, which considered seabed soil consolidation, was derived in [7] and [8] for the seabed of infinite depth. Later, [9] solved soil consolidation equations of [10] analytically to obtain a close form solution in the finite seabed depth. Ref. [11] used a domain decomposition technique to extended the analytical solution of [7] and develop a semi-analytical solution to the pore pressure and effective stresses around a buried pipeline. Meanwhile, numerical methods, BIEM and FEM, have been applied by [12], [13] and [14] to simulate the similar problem. The FE model has later been improved in [15] and [16] to consider cross-anisotropic and inhomogeneous seabed soils. Furthermore, [17], [18] and [19] took effects of pipeline internal stresses, non-linear waves and trenches into the account. The work by [20] applied this Finite Element model to simulate the soil response around buried pipelines in 3-D. Numerical results, however, were almost identical for all wave incidence angles. Several studies have been conducted to justify the occurrence of seabed instability, i.e. liquefaction and shear failure. Ref. [21] used the Mohr-Coulomb shear failure criterion to analyze the failure of a sandy seabed in North Sea design conditions. Later, a liquefaction criterion was developed in [22] based on the concept of excess pore pressure. Ref. [23] suggested that the liquefaction occurs when the mean effective stress with the seabed vanishes. Nevertheless, [24] extended the work in [22] and [23] using the concept of excess pore pressure and mean geostatic effective stresses and developed a three-dimensional liquefaction criterion. They have shown that their criterion reproduces field observations of [25] better than other aforementioned criteria. ([24]). Recently, [26] has introduced a non-dimensional index to qualitatively identify the potential of momentary liquefaction in seabed. In the present study, a three-dimensional numerical model is developed to study the wave-seabed-pipeline interaction problem. The proposed Finite Element model is established with the aid of Comsol Multiphysics. Using this model, the wave-induced seabed response, pore pressure and principal and maximum shear stresses within the seabed are studied. The soil response is further used to carry a shear failure and liquefaction analysis in seabed near the pipeline. Finally, the effect of wave angle of incidence on seabed instabilities is examined. Theory Three-dimensional Seabed Consolidation Theory Wave pressure at seabed bottom exerts a periodic loading on the seabed soil (See Fig. 1). The porous seabed consolidates under this loading; whereas, the deformation of soil matrix is
1083

accompanied with the change of pore pressure within the seabed. Biot three-dimensional general theory of soil consolidation, [10], and Verruijt storage equation, [27], are used to express the wave-induced seabed behavior. The latter, for a hydraulically isotropic porous medium, becomes:
2w w
pk p nt t
∂ ∂ε∇ − γ β = γ
∂ ∂. (1)
in which, k is soil permeability; p is pore fluid pressure; n is seabed porosity; γw is the specific weight of pore water; ε is soil volumetric strain; and t is time. The pore fluid compressibility (β) in (1) significantly changes with the soil’s degree of saturation (S) and is given as:
1 1
w wo
SK p
−β = + . (2)
where, Kw is the true bulk modulus of elasticity of water (2×10⁹ Pa) and pwo is the absolute pore pressure. Assuming that the Hook’s law is valid, equations of force equilibrium for soil skeleton in x, y and z directions are respectively described by Biot theory as followings:
21 2
G pG ux x
∂ε ∂∇ + =
− μ ∂ ∂. (3)
21 2
G pG vy y
∂ε ∂∇ + =
− μ ∂ ∂. (4)
21 2
G pG wz z
∂ε ∂∇ + =
− μ ∂ ∂. (5)
whereas, G is the shear stiffness of soil; μ is the Poisson’s ratio; and u, v and w are soil displacements in x, y and z directions, respectively. Strains and Stresses The pore pressure and seabed soil displacements are evaluated using the coupled system of equations in (1) to (5). Strains in soil matrix are further used to evaluate effective and shear stresses within the seabed soil:
u v wx y z
∂ ∂ ∂ε = + +
∂ ∂ ∂. (6)
21 2xx
uGx
⎛ ⎞∂ μ′σ = + ε⎜ ⎟∂ − μ⎝ ⎠. (7)
21 2yy
vGy
⎛ ⎞∂ μ′σ = + ε⎜ ⎟∂ − μ⎝ ⎠. (8)
21 2zz
wGz
⎛ ⎞∂ μ′σ = + ε⎜ ⎟∂ − μ⎝ ⎠. (9)
xy yxu vGy x
⎛ ⎞∂ ∂τ = τ = +⎜ ⎟∂ ∂⎝ ⎠
. (10)
xz zxu wGz x
∂ ∂⎛ ⎞τ = τ = +⎜ ⎟∂ ∂⎝ ⎠. (11)
yz zyv wGz y
⎛ ⎞∂ ∂τ = τ = +⎜ ⎟∂ ∂⎝ ⎠
. (12)
where, σii is the effective normal stress in i direction; and τij is shear stress acting in j direction on the soil element face, which is normal to i direction. Boundary Conditions The submarine pipeline is assumed to be buried within the seabed and to be protected by a trench, as illustrated in Fig. 1a. The centre of pipeline cross-section is located at (0,-b), while trench walls are located at x = ±W/2. Ocean waves are assumed to propagate along positive X axis and approach the buried pipeline by an angle of α (See top view in Fig. 1b). Therefore, α is 0 for waves propagating along the pipeline and 90° for those approaching normal to it. The distance between the wave crest and through in y direction, along the pipeline, is simply obtained as L/(2.cos α), in which L is the wave length. The linear wave theory is used to express the wave dynamic pressure at seabed surface (mudline). Thus, the pore pressure at mudline (z = 0) is: 0 cos( sin . cos . )bedp p x y t= κ α + κ α − ω . (13) in which, κ is the wave number; ω is the wave frequency. The wave pressure amplitude at mudline (po) is related to wave height (H) and water depth (d) by:
( )2cosh
wo
Hp
dγ
=κ
. (14)
Since the total stress and pore pressure at seabed surface are equal to the wave dynamic pressure, vertical effective stress (σ′zz) vanishes at mudline. The viscous fluid boundary layer near the seabed surface exerts shear stresses on the seabed soil. However, effects of viscous shear stresses on seabed soil consolidation are assumed to be negligible. Thus, the remaining mudline boundary conditions are: 0zz xz yz′σ = τ = τ = . (15)
On the other hand, pipeline and trench surface are considered completely impermeable. Therefore, to maintain zero seepage flow through these surfaces, the pore pressure gradient normal to these impermeable interfaces (∂p/∂n) is restricted to zero. In this study, no relative displacement is considered between the soil and pipeline, as well as between the soil and trench walls. Hence, boundary conditions, enforced at pipeline and trench surfaces, are written as:
0p u v wn∂ = = = =∂ . (16)
As it is illustrated in Fig. 1b, the length of computational domain in y direction is chosen L/(2.cos α). Consequently, at the same time, the wave phase at any point located on mm is π radians ahead of its counterpart on nn. Thus the periodic (mirror) boundary condition between the wave-induced seabed response (ϕ) on mm and that on nn is written as:
1084

( ), , , , for 902cos
Lx y z x y z⎛ ⎞ϕ + = −ϕ α ≠⎜ ⎟α⎝ ⎠. (17)
Meanwhile, an arbitrary computational domain length in y direction can be chosen when α = 90°; whereas, a periodic (identity) boundary condition is considered between mm and nn:
( ), , , , for 902cos
Lx y z x y z⎛ ⎞ϕ + = ϕ α =⎜ ⎟α⎝ ⎠. (18)
Justification of Seabed Instability (1) Liquefaction Criterion: The realistic prediction of liquefaction occurrence near the pipeline is crucial for design engineering proposes. Ref. [28] defines liquefaction as “the transformation of a granular material from a solid to a liquefied state as a consequence of increased pore-water pressure and reduced effective stress” ([29] and [30]). To quantitatively justify the seabed liquefaction potential, the first group of researchers considered the “reduction in effective stress” as the liquefaction criterion. Among those, [31] considered the tensile (positive) phase of absolute vertical effective stress, (19), to justify the liquefied state of a sandy soil; Later, [23] suggested a criterion concerning about the tensile mean-effective-stress (σmean) as in (20). ˆ 0zz′σ ≥ . (19)
1ˆ ˆ ˆ ˆ( ) 03mean xx yy zz′ ′ ′ ′σ = σ + σ + σ ≥ . (20)
Since the seabed soil, under calm-sea conditions, is in a compressive stress mode from its submerged self-weight, superscript “^” is used in (19) and (20) to differentiate the use of absolute effective stresses from wave-induced effective stresses in (7) to (9). Absolute effective stresses are as followings: ˆ xx s xxK z′ ′ ′σ = γ + σ . (21) ˆ yy s yyK z′ ′ ′σ = γ + σ . (22) ˆ zz s zzz′ ′ ′σ = γ + σ . (23) in which, γ′s is the submerged specific weight of seabed soil. The coefficient of lateral earth pressure at-rest (Ko) can be related to the internal friction angle of soil (φf) by Jacky formula [32]: 1 sin fK = − φ . (24) The measurement of effective stresses near the soil liquefaction limit, however, involves significant uncertainties ([25]). Therefore, applying assumptions of a one-dimensional consolidation problem, [22] replaced the change of vertical effective stress from its static state to absolute value (i.e. wave-induced vertical effective stress) by the excess pore pressure. Thus, (19) and (23) leads to: ˆ 0zz s excessz p′ ′σ = γ + ≥ . (25) where, the excess pore pressure is p excess = p - p bed. Later, [24] approximated a three-dimension liquefaction criterion with an analogy to (20) and (25). They have shown that this liquefaction
(a)
Pipeline
(b)
Figure 1. (a) Pipeline cross-section. (b) Waves approaching the pipeline. criterion, (26), reproduces the observed liquefaction in field measurements of [25] better than other aforementioned criteria. Therefore in this study, (26) is adopted to justify the occurrence of liquefaction within the seabed soil.
1ˆ (1 2 ) 03zz s excessK z p′ ′σ = + γ + ≥ . (26)
The adopted liquefaction criterion is illustrated in Fig. 2 for a seabed without the presence of a structure. As it is shown, the excess pore pressure and thus wave-induced effective stress becomes positive (tensile) under the wave trough. The positive excess pore pressure may exceed the mean geostatic stresses (dashed line), under a server storm condition. Therefore, the liquefied state of seabed soil is observed in a layer just below the mudline. The seabed surface is always considered to be liquefied. (2) Shear Failure Criterion: The shear failure occurs when the shear stress in a plane, inside the soil, exceeds the soil shear bearing capacity. In the present study, a Mohr-Coulomb shear failure criterion is used. Thus, the shear failure criterion is as: ˆ
fφ ≥ φ . (27)
1085

in which, φ̂ is the stress-angle that can be determined using three-
dimensional Mohr circles (See Fig. 3). As it is illustrated:
1 1max max
ave 11 33
ˆ ˆ2ˆ sin sinˆ ˆ ˆ
− −⎛ ⎞ ⎛ ⎞τ τφ = =⎜ ⎟ ⎜ ⎟′ ′ ′σ σ + σ⎝ ⎠ ⎝ ⎠
. (28)
where, 11ˆ ′σ and 33ˆ ′σ are respectively major and minor absolute
effective stresses in principal directions; and maxτ̂ is the absolute
shear stress in a plane, where it is the largest. For a seabed in calm sea condition, x-, y-, and z- are principal directions. Therefore, at-rest (initial) stress angle (φo) corresponding to the geostatic state of stresses can be defined as:
1 1 1sin sin
1z x
x z
KK
− −′ ′⎛ ⎞ ⎛ ⎞σ − σ −φ = =⎜ ⎟ ⎜ ⎟′ ′σ + σ +⎝ ⎠⎝ ⎠
. (29)
Substituting Ko from Jacky formula (24) in the equation for initial stress angle (29), at-calm stress angle is related to the soil’s internal friction angle by:
sin
sin2 sin
f
f
φφ =
− φ. (30)
Ref. [33] has reported the internal friction angle of a sandy seabed to be ranging from 20° to 30° ([26]). Thus, in this range, (30) can be approximated by a linear relation as: f Cφ = φ + . (31) where, C is a constant conservatively around 9°. Therefore, a wave-induced perturbation in soil stress-angle ( ˆφ = φ − φ ) brings
the sandy seabed from its geostatic stress state to shear failure, if it is as large as approximately 9°. The concept of wave-induced stress-angle is introduced for the first time in this study. This concept enables authors to gauge changes in the stress angle resulted from 3-D effects against that required for soil shear failure (i.e. 9°), and thus to justify the importance of three-dimensional modeling. Finite Element Model and Validation Finite Element Method is used in this study to numerically simulate the wave-induced seabed behavior around the pipeline. The numerical model is developed with the aid of Comsol Multiphysics’ PDE module. Fig. 4 shows the specific finite element mesh pattern near the pipeline. As illustrated, the specific mesh pattern extends double the pipeline diameter from the center of pipe cross-section. Outside this specific region (not shown here), rectangular elements with the dimensions of axa are used within xz plane. A detailed study is carried out to obtain the adequate resolution of finite element mesh. It is found, for the cases studied, that it is sufficient to divide the pipeline circumference into 32 segments. At the same time, the required number of divisions in the radial direction of specific mesh region is 7. Besides, it is revealed to be enough to split the sweep (z) direction into segments of length L/20. Second-order Lagrange elements have been used in the present model. Since the three-dimensional model for the wave-seabed-pipeline interaction is new, simulation results should be validated.
excess bedp p p= −
1 (1 2 )3 sK z′− + γ
′σ
z
Mudline
Liquefied
Figure 2. Concept of wave-induced liquefaction after Hsu et al. (1995).
Figure 3. Stress angle: three-dimensional Mohr circles. To the authors’ knowledge, however, no experimental/field study has been carried out to investigate the effect of wave’s obliquity on seabed responses around submarine buried pipelines. Therefore, one way to validate the 3-D model is to verify numerical results for the simplified case of α = 90˚ against available wave tank’s two-dimensional experimental data. Fig. 5 shows the simulated pore pressure amplitude around the pipeline circumference and the comparison with measurements in the wave tank experiment by [34]. As it is shown, numerical results agree very well with experimental data. Wave, soil, pipeline and trench characteristics, used in this study, are listed in Table. 1. As can be seen, the wave incidence angles (α) of 0˚, 22.5˚, 45˚, 67.5˚, 90˚ have been considered to study the effect of wave’s obliquity on seabed response near the pipeline. A severe storm condition (wave heights of 4.0 and 5.0 m) is assumed. Results and Discussion Pore Pressure The amplitude of pore pressure around pipeline circumference is normalized by the mudline pressure amplitude and depicted in Fig. 6. As expected, the pore pressure amplitude at pipeline crest (θ=90°) is the largest, while its minimum occurs under the pipeline base (θ=270°). On the other hand, the wave angle of incidence (α) is varied from 0 to 90 to investigate the dependency of wave-induced pore pressure to the wave obliquity. However, a relatively complicated behavior is observed by changing the wave direction. Whereas, for input data studied here, the pore pressure at the upper part of pipeline (θ=0° to 180°) is not sensitive to the wave direction. Meanwhile, despite the behavior at the upper part,
^
^
^
^ ^
^ ^
^
1086

the pore pressure at the lower section of pipeline (θ=180° to 360°) undergoes some changes with the wave incidence angle. The pore pressure in this region is the least when α=3π/8, while its maximum occurs for α=π/2. Potential of Complete Liquefaction As discussed earlier in this paper, the excess pore pressure, i.e. p excess = p - p bed is the key factor to estimate the potential of wave-induced seabed liquefaction and thus the pipeline instability. Fig. 7 shows the distribution of amplitude of excess pore pressure around pipeline circumference. As it is shown, the peak amplitude of excess pore pressure is over the pipeline crest. In this region, the high attenuation of wave pressure inside the seabed generates large upward seepage forces and tensile effective stresses within the soil skeleton. Similar to the behavior of pore pressure around pipeline, the excess pore pressure undergoes changes when the wave angle of incidence varies. The excess pore pressure for different wave directions is found to monotonically vary between that of α=0 and α=90. Therefore, these two extreme conditions are plotted in Fig. 7. The seabed soil liquefies where the excess pore pressure exceeds the mean geostatic stresses within the seabed (see (26). Therefore, the changes in excess pore pressure, which are resulted from 3-D effects, should be viewed in conjunction with the geostatic stresses. This enables authors to justify the importance of three-dimensional modeling in the estimation of liquefaction potential. Mean geostatic stresses normalized by mudline pressure amplitude are shown in Fig. 7 for two relatively severe storms as high as of 4 and 5 m. As can be seen, in the case studied here, the variation of excess pore pressure with the wave incidence angle are small comparing with what is required to bring the soil into the state of liquefaction. Thus the effect of wave incidence on excess pore pressure and liquefaction near the pipeline, though complicated, may be neglected without seriously underestimating the risk of pipeline instability. Wave-induced Principal and Shear Stresses Fig. 8 shows the time-series of normalized wave-induced principal effective stresses in a sample point located at θ=135° on the pipeline circumference. As can be seen, distributions of principal stresses (σ11, σ22 and σ33), over a wave period, fall over three distinguished curves, where the lower and upper curves respectively introduce minor and major wave-induced principal effective stresses. Mohr circles for the wave-induced state of stress at a specific time are confined between these two extreme curves, and are illustrated in the figure. The radius of Mohr circle defines the maximum wave-induced shear stress experienced by the soil element at a moment. Fig. 8 illustrates four snapshots of time evolution of Mohr circle over a wave period. As shown, the soil element experiences the largest shear stress in a wave period when curves of major and minor principal stresses diverge from each other. In this text, such a shear stress is referred to as “peak wave-induced shear stress” and is denoted by maxτ . Alternatively, wave-induced shear stress is the least when the curves of major and minor principal stresses are converged. Peak values of wave-induced major principal effective stress and shear stress ( 11 max,σ τ ) are studied in coming sections of this paper. As it is illustrated in Fig. 9 and Fig. 10, the peak wave-induced major principal effective stress and shear stress vary significantly around the pipeline. Discussing about the case of α=0 (shown with circles), the lowest peak normal and shear stresses occur near the pipeline bottom (θ≈270). The largest values of major stress, however, are observed at θ≈45°, 135°. Meanwhile, the seabed soil experiences its largest shear stress at about θ≈22°, 157°. The
D 2D
a2D
Figure 4. Finite Element mesh pattern near the pipeline.
Figure 5. Pore pressure amplitude around pipe: validation of numerical
model.
Wave characteristics
Wave period T 8.36 s Wave length L 100 m Water depth d 25 m Wave (storm) height H 4.0, 5.0 m Wave angle of incidence α (deg ) 0, 22.5, 45, 67.5, 90
Soil characteristics Shear modulus G 1 MPa Poisson’s ratio μ 0.40 Porosity n 0.30 Degree of saturation S 0.97 Permeability K 10-3 Submerged specific gravity γ′s/γw 0.969
Geometry Trench depth h 2 m Pipe diameter D 1 m Trench width (W/D) 1.5, 4.0 Pipe burial depth b 1 m
Table 1. Input data for numerical simulations general trend is that the wave-induced peak principal stress is larger than the peak shear stress at the same point. Ocean waves approaching the pipeline can generate asymmetric responses in naked and sheltered sides of pipeline, as defined in Fig. 11 with respect to the direction of wave propagation. For
1087

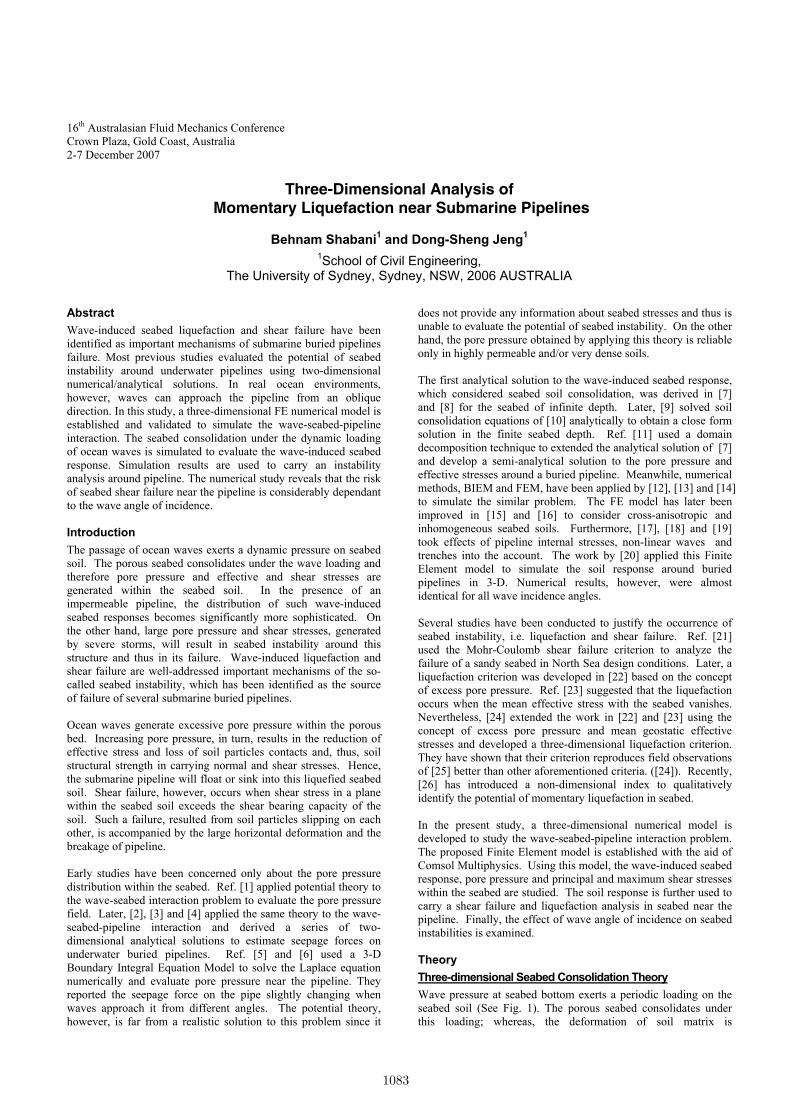
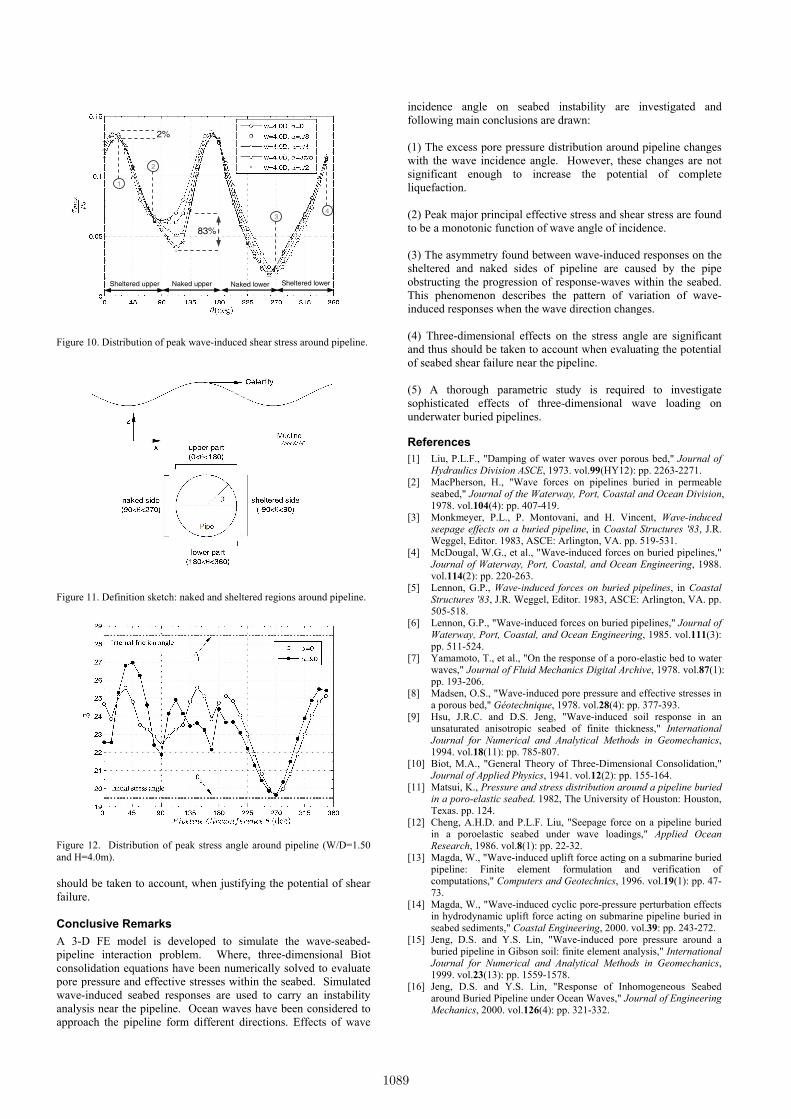
Figure 6. Distribution of wave-induced pore pressure amplitude around pipeline circumference (W/D=1.5). waves traveling parallel with the pipeline (α=0), however, it is expected that the response of sheltered and naked sides of pipeline becomes symmetric. In the other word, the distributions of wave-induced responses around pipeline in Fig. 9 and Fig. 10 is symmetric (when α=0) with respect to θ=90° and θ=270°. As it is shown, a characteristic feature of stress distribution around pipeline is that the symmetry, which has been discussed for the case of α=0, no longer exists when waves propagate oblique with respect to the pipeline (α≠0). This is resulted from the pipeline obstructing the propagation of wave-induced response waves within the soil. Based on this interpretation of phenomenon, the obstruction from the pipeline should be maximum when α=90. Therefore, another important characteristic feature of Fig. 9 and Fig. 10 can be described: i.e. at a single point around pipeline, wave-induced stresses monotonically change from α=0 to α=90. As discussed, the wave-induced stress, in the cases studied here, is a monotonic function of wave angle of incidence. The direction of such a monotonic function alters at several (four) points along the pipeline circumference. These points are marked in Fig. 9 and Fig. 10. However, a more sophisticated parametric study is needed before linking these four points to the four region defined in Fig. 11. The value of peak effective major principal stress and peak shear stress changes respectively up to 50% and 83% for some points around the pipeline, when the wave direction varies. The maximum values of these stresses, ever experienced around the pipeline, however, are respectively affected about 5% and 2%. Stress Angle The distribution of peak stress angle around pipeline is shown in Fig. 12. Besides, the initial (at-calm) stress angle and soil internal friction angle are illustrated. The smallest stress angle is observed at θ=270°, where it is left almost unchanged comparing with its geostatic (initial) value. On the other hand, maximum stress angle around pipeline and for α=0 occurs at about θ=35° and 145°, where a severe storm of H=4.0 m increases the stress angle about 6 degrees from its initial value (19.5° to 25.5°). It is important to note that if a wave-induced increase in stress angle reaches to 9°, the seabed will undergo shear failure (see (31)). Although only α=0 and α=90 are presented here, the stress angle for other wave directions falls between that of these two extremes. As it is shown, when wave approaches perpendicular to the pipeline (α=90), the aforementioned symmetry between sheltered
Figure 7. Distribution of wave-induced excess pore pressure amplitude around pipeline circumference (W/D=1.5).
Figure 8. Time series of principal effective stresses (θ=135°, α=45°, W/D=2.0).
Sheltered upper Naked upper Naked lower Sheltered lower
5%
50% 50%
1
2 3
4
Figure 9. Distribution of peak wave-induced major principal effective stress around pipeline. and naked sides of pipeline disappears. Consequently, at some points around the pipeline, the stress angle increases up to 3° comparing with the case of α=90. Knowing that according to (31), only 9° of increase in initial stress angle is enough to cause a shear failure, the change of stress angle resulted from three-dimensional effects is considerable. Therefore, the three-dimensional effects
max2MohrD τ=
major stress
minor stress
11σ
1088
1
2
3 4
2%
Naked upper Sheltered upper Sheltered lower Naked lower
83%
Figure 10. Distribution of peak wave-induced shear stress around pipeline.
Figure 11. Definition sketch: naked and sheltered regions around pipeline.
Figure 12. Distribution of peak stress angle around pipeline (W/D=1.50 and H=4.0m). should be taken to account, when justifying the potential of shear failure. Conclusive Remarks A 3-D FE model is developed to simulate the wave-seabed-pipeline interaction problem. Where, three-dimensional Biot consolidation equations have been numerically solved to evaluate pore pressure and effective stresses within the seabed. Simulated wave-induced seabed responses are used to carry an instability analysis near the pipeline. Ocean waves have been considered to approach the pipeline form different directions. Effects of wave
incidence angle on seabed instability are investigated and following main conclusions are drawn: (1) The excess pore pressure distribution around pipeline changes with the wave incidence angle. However, these changes are not significant enough to increase the potential of complete liquefaction. (2) Peak major principal effective stress and shear stress are found to be a monotonic function of wave angle of incidence. (3) The asymmetry found between wave-induced responses on the sheltered and naked sides of pipeline are caused by the pipe obstructing the progression of response-waves within the seabed. This phenomenon describes the pattern of variation of wave-induced responses when the wave direction changes. (4) Three-dimensional effects on the stress angle are significant and thus should be taken to account when evaluating the potential of seabed shear failure near the pipeline. (5) A thorough parametric study is required to investigate sophisticated effects of three-dimensional wave loading on underwater buried pipelines.
References [1] Liu, P.L.F., "Damping of water waves over porous bed," Journal of
Hydraulics Division ASCE, 1973. vol.99(HY12): pp. 2263-2271. [2] MacPherson, H., "Wave forces on pipelines buried in permeable
seabed," Journal of the Waterway, Port, Coastal and Ocean Division, 1978. vol.104(4): pp. 407-419.
[3] Monkmeyer, P.L., P. Montovani, and H. Vincent, Wave-induced seepage effects on a buried pipeline, in Coastal Structures '83, J.R. Weggel, Editor. 1983, ASCE: Arlington, VA. pp. 519-531.
[4] McDougal, W.G., et al., "Wave-induced forces on buried pipelines," Journal of Waterway, Port, Coastal, and Ocean Engineering, 1988. vol.114(2): pp. 220-263.
[5] Lennon, G.P., Wave-induced forces on buried pipelines, in Coastal Structures '83, J.R. Weggel, Editor. 1983, ASCE: Arlington, VA. pp. 505-518.
[6] Lennon, G.P., "Wave-induced forces on buried pipelines," Journal of Waterway, Port, Coastal, and Ocean Engineering, 1985. vol.111(3): pp. 511-524.
[7] Yamamoto, T., et al., "On the response of a poro-elastic bed to water waves," Journal of Fluid Mechanics Digital Archive, 1978. vol.87(1): pp. 193-206.
[8] Madsen, O.S., "Wave-induced pore pressure and effective stresses in a porous bed," Géotechnique, 1978. vol.28(4): pp. 377-393.
[9] Hsu, J.R.C. and D.S. Jeng, "Wave-induced soil response in an unsaturated anisotropic seabed of finite thickness," International Journal for Numerical and Analytical Methods in Geomechanics, 1994. vol.18(11): pp. 785-807.
[10] Biot, M.A., "General Theory of Three-Dimensional Consolidation," Journal of Applied Physics, 1941. vol.12(2): pp. 155-164.
[11] Matsui, K., Pressure and stress distribution around a pipeline buried in a poro-elastic seabed. 1982, The University of Houston: Houston, Texas. pp. 124.
[12] Cheng, A.H.D. and P.L.F. Liu, "Seepage force on a pipeline buried in a poroelastic seabed under wave loadings," Applied Ocean Research, 1986. vol.8(1): pp. 22-32.
[13] Magda, W., "Wave-induced uplift force acting on a submarine buried pipeline: Finite element formulation and verification of computations," Computers and Geotechnics, 1996. vol.19(1): pp. 47-73.
[14] Magda, W., "Wave-induced cyclic pore-pressure perturbation effects in hydrodynamic uplift force acting on submarine pipeline buried in seabed sediments," Coastal Engineering, 2000. vol.39: pp. 243-272.
[15] Jeng, D.S. and Y.S. Lin, "Wave-induced pore pressure around a buried pipeline in Gibson soil: finite element analysis," International Journal for Numerical and Analytical Methods in Geomechanics, 1999. vol.23(13): pp. 1559-1578.
[16] Jeng, D.S. and Y.S. Lin, "Response of Inhomogeneous Seabed around Buried Pipeline under Ocean Waves," Journal of Engineering Mechanics, 2000. vol.126(4): pp. 321-332.
1089

[17] Jeng, D.S., P.F. Postma, and Y.S. Lin, "Stresses and Deformation of Buried Pipeline under Wave Loading," Journal of Transportation Engineering, 2001. vol.127(5): pp. 398-407.
[18] Gao, F.P., D.S. Jeng, and H. Sekiguchi, "Numerical study on the interaction between non-linear wave, buried pipeline and non-homogenous porous seabed," Computers and Geotechnics, 2003. vol.30(6): pp. 535-547.
[19] Gao, F.-P. and Y.-X. Wu, "Non-linear wave-induced transient response of soil around a trenched pipeline," Ocean Engineering, 2006. vol.33(3-4): pp. 311-330.
[20] Chen, T.N., K.F. Cai, and Y.S. Lin, "Three-dimensional finite element modeling for wave-seabed pipeline interaction," in OCEANS 2005, Proceedings of MTS/IEEE. 2005. Washington D.C.
[21] Yamamoto, T., Wave induced instability in seabeds, in Coastal Sediments '77: Proceedings of Fifth Symposium of the Waterway, Port, Coastal and Ocean Division of ASCE. 1977, ASCE, New York, NY: Charleston, SC, USA. pp. 898-913.
[22] Zen, K. and H. Yamazaki, "Mechanism of wave-induced liquefaction and densification in seabed," Soils and Foundations, 1990. vol.30(4): pp. 90-104.
[23] Tsai, C.P., "Wave-induced liquefaction potential in a porous seabed in front of a breakwater," Ocean Engineering, 1995. vol.22(1): pp. 1-18.
[24] Hsu, J.R.C., D.S. Jeng, and C.P. Lee, "Oscillatory soil response and liquefaction in an unsaturated layered seabed," International Journal for Numerical and Analytical Methods in Geomechanics, 1995. vol.19(12): pp. 825-849.
[25] Zen, K. and H. Yamazaki, "Field observation and analysis of wave-induced liquefaction in seabed," Soils and Foundations, 1991. vol.31(4): pp. 161-179.
[26] Wang, J.G., M.R. Karim, and P.Z. Lin, "Analysis of seabed
instability using element free Galerkin method," Ocean Engineering, 2007. vol.34(2): pp. 247-260.
[27] Verruijt, A., "Elastic storage of aquifers," in Flow through porous media, R.J.M. De Wiest, Editor. 1969, Academic Press: New York. pp. 331-376.
[28] Marcuson, W.F., "Definition of terms related to liquefaction," Journal of Geotech. Eng. Div., ASCE, 1978. vol.104(9): pp. 1197-1200.
[29] Youd, T.L., et al., Liquefaction Resistance of Soils: Summary Report from the 1996 NCEER and 1998 NCEER/NSF Workshops on Evaluation of Liquefaction Resistance of Soils. 2001, ASCE. pp. 817-833.
[30] de Groot, M.B., et al., "Physics of Liquefaction Phenomena around Marine Structures," Journal of Waterway, Port, Coastal, and Ocean Engineering, 2006. vol.132(4): pp. 227-243.
[31] Okusa, S., "Wave-induced stresses in unsaturated submarine sediments," Géotechnique, 1985. vol.35(4): pp. 517-532.
[32] Jacky, J., "The coefficient of earth pressure at rest," Journal for Society of Hungarian Architects and Engineers, 1944: pp. 355-358.
[33] Poulos, H.G., Marine geotechnics. 1988, London ; Boston: Unwin Hyman. 473.
[34] Turcotte, B.R., P.L.-F. Liu, and F.H. Kulhawy, Laboratory evaluation of wave tank parameters for wave-sediment interaction. 1984, School of Civil and Environmental Engineering, Cornell University: Ithaca, New York.
1090