thriving places full report | powered by happy city · scale from a single street to a whole...
TRANSCRIPT

THRIVING PLACES FULL REPORT | Powered by Happy City
page 1 of 86 February 2018

THRIVING PLACES FULL REPORT | Powered by Happy City
CONTENTS FOREWORD 3
1. EXEC SUMMARY 5
2. OVERVIEW 7
2.1. INTRODUCTION 7
2.2. BACKGROUND & CONTEXT 8
2.3. PROJECT AIMS & OBJECTIVES 9
2.4. PROJECT AUDIENCE 10
2.5. PROJECT DEVELOPMENT TIMELINE 11
3. FRAMEWORK 13
3.1. FRAMEWORK OUTLINE 13
3.2. INDICATOR SELECTION CRITERIA 17
4. RESULTS 19
4.1. MAP VIEW 20
4.2. HEADLINES 21
4.3. LOCAL AUTHORITY HEADLINE SCORES 22
4.4. HIGHLIGHTS AND LOWLIGHTS BY DOMAIN 27
5. ANALYSIS 28
5.1. ANALYSIS BY GEOGRAPHY 28
5.1.1. Overall Geographical Analysis 29
5.1.2. Regional Analysis 31
5.1.3. The Best Places to Thrive? 42
5.1.4. Case Studies 43
5.2. ANALYSIS BY THEME 48
5.2.1. Mental & Physical Health 48
5.2.2. Work & Local Economy 49
5.2.3. Education & Learning 51
5.2.4. Place & Environment 53
5.2.5. People & Community 54
5.2.6. Equality & Sustainability 56
5.2.7. Key Thematic Correlations 60
5.3. ANALYSIS ALONGSIDE THE INDEX OF MULTIPLE DEPRIVATION 62
6. USES 64
6.1. BIG PICTURE AIMS 64
6.2. LOCAL PRACTICAL USAGE 64
6.2.1. A Universal Measure of Local Progress 65
6.2.2. Integrated Local Wellbeing Priorities 66
6.2.3. Tailored Wellbeing Policies 67
6.2.4. Innovation and Success Sharing 68
7. CONCLUSIONS AND NEXT STEPS 70
7.1. CURRENT USAGE AND INTEREST 70
7.2. FUTURE PLANS 71
7.3. GET INVOLVED 72
8. ACKNOWLEDGEMENTS 73
9. APPENDICES 74
Cover image courtesy of the brilliant www.playingout.net
page 2 of 86 February 2018

THRIVING PLACES FULL REPORT | Powered by Happy City
FOREWORD By Liz Zeidler, Co-founder of Happy City
For over 50 years there has been talk about the need to ‘measure what matters’. US Senator Robert
Kennedy’s bold speech in 1968 challenged society to find a better measure of progress than merely the sum
of our consumption of goods and services.
While some progress has been made in meeting Kennedy's challenge over the years, it still falls short of his
original vision. The OECD reports on its ‘Better Lives Index’, the UN’s annual ‘World Happiness Report’ makes
headlines every year and nations, including the UK, are now measuring wellbeing.
But just as it took many decades after the development of GDP as a measure for it to become the compass by
which we steer our society, so any challengers to its supremacy have a long hard road ahead. It will surely be
a long time before a sufficient global accord is reached, to conceivably allow new measures to sit at the heart
of our economic or political psyches.
When Happy City was founded in 2010, we recognised that a new measure of progress was urgently needed
on the ground, where innovation was happening and decisions could be made more swiftly and with more
immediate effects on people’s lives. We searched for a place-based measure that encompassed far more of
what Kennedy described as ‘the things that make life worthwhile’, and failed to find one.
Since then, others have joined this endeavour. Some good recent examples are from big retailers or 1
accountancy firms , others from richly funded ‘think tanks ’, or from individual cities or places . These are 2 3 4
welcome moves but not enough for us to happily hang up our boots and declare the work is done. Many of
these new measures are important steps towards a ‘softening’ of the edges of our economic model. They put
human and environmental elements into a model of growth to make it ‘inclusive growth’, ‘green growth’,
‘sustainable growth’. They are largely focused on what economic growth is delivering – which is important,
but only part of the wider question.
Too little is asked about the fundamental assumption behind this model – that growth is the goal, regardless
of the context or needs of the place that is aiming to ‘grow’. As the economist Kate Raworth says: “We need
1 Including Sainsbury’s Living Well Index
2 Including Grant Thornton’s Vibrant Economy Index
3 Including Legatum Institute’s Prosperity Index
4 Santa Monica in California and a group of London
boroughs forming the ‘London Prosperity Board’
page 3 of 86 February 2018

THRIVING PLACES FULL REPORT | Powered by Happy City
to move from an economy that grows whether or not we thrive, to an economy where we thrive whether or
not it grows. ” 5
Happy City’s Thriving Places Index (TPI) is designed to ask this more fundamental question: What is it all
FOR? What is politics, economics, business, education, health services, community, civil society for – what are
we all trying to achieve? If we are clear on the answer to this question, then we can design our economy, our
political and public life, our public services, our communities and the very streets we live in, to deliver that.
Our answer to that big question is that all that collective endeavour and investment (of time, money,
resources and wisdom) is to support everyone to thrive – now and in the future.
We have, with the help of so many others , designed a broad measure of the local conditions that most 6
influence this aim.
But our societal focus on GDP growth as an end in itself has also led to an almost inexorable rise in inequality
and degradation of the environment. These are not accidental by-products, but an inevitable consequence of
putting the maximisation of consumption-based profit at the heart of the decision making process.
Happy City’s TPI puts the conditions for wellbeing at the heart, but equal importance is given to growing a
more equitable distribution of those conditions and ensuring they are delivered in a way that does not
compromise the capacity for future generations to thrive.
Our model is not for the faint hearted. It is designed to support those pioneers who really want to ‘measure
what matters’ and ‘make what matters count’. It is a practical tool, that can be used today, to help leaders
who want to ensure the sum of our work – in every sector – is a better life for today’s and tomorrow’s
generations.
To those leaders we say – join us.
Join us in embedding these very different goals and measures of growth, progress and success at the heart of
how your organisation, your area and our society – work.
5 Kate Raworth, Doughnut Economics. 2017 Random House
6 See page 74 for list of advisory board and partners
page 4 of 86 February 2018
THRIVING PLACES FULL REPORT | Powered by Happy City
1 EXECUTIVE SUMMARY Until now there has been no consistent and accessible framework that uses local level indicators to measure
and inform progress towards supporting the wellbeing of all citizens, now and in the future. Happy City’s TPI
is designed to fill this gap – to provide a robust reporting framework to support decision-makers in local areas
to improve lives on the ground and to help shift the focus, place by place, towards measuring what matters.
This report shares the results from the first national-scale pilot of this groundbreaking tool. It shares findings
on how well areas across England are doing at growing the conditions for equitable, sustainable wellbeing.
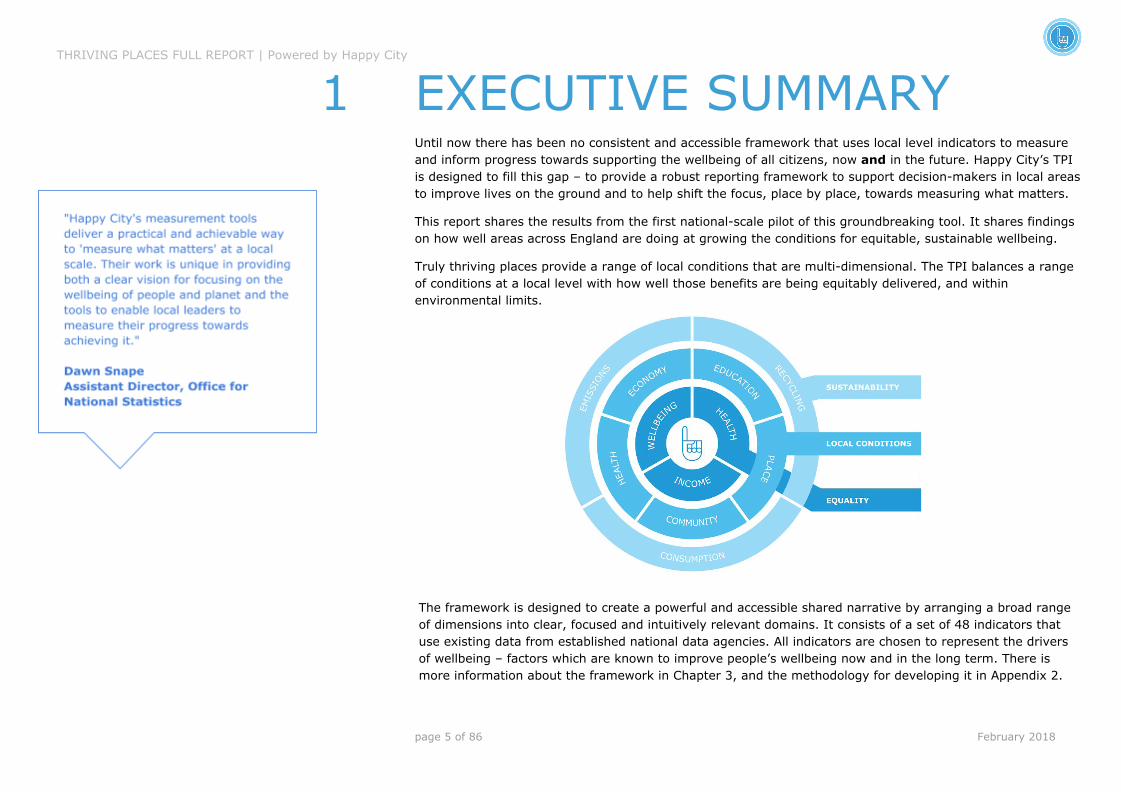
Truly thriving places provide a range of local conditions that are multi-dimensional. The TPI balances a range
of conditions at a local level with how well those benefits are being equitably delivered, and within
environmental limits.
The framework is designed to create a powerful and accessible shared narrative by arranging a broad range
of dimensions into clear, focused and intuitively relevant domains. It consists of a set of 48 indicators that
use existing data from established national data agencies. All indicators are chosen to represent the drivers
of wellbeing – factors which are known to improve people’s wellbeing now and in the long term. There is
more information about the framework in Chapter 3, and the methodology for developing it in Appendix 2.
page 5 of 86 February 2018

THRIVING PLACES FULL REPORT | Powered by Happy City
The TPI has ambitions to support wide social change. It is designed to challenge the current paradigm that
narrowly defines progress by economic measures of consumption and wealth creation. It aims to play a part
in putting far more of what matters most to people’s lives, at the heart of our decision-making in all sectors
and in all regions of the country. Like any index, it is only as good as the data available, so we aim to spur
significant improvements in the quality of data gathered on all the many vital and interconnected elements
that make a thriving place. For more information see Chapter 2.
It is also is a practical tool for implementing joined-up, innovative and evidence-based policy that delivers on
wellbeing.
When embedded in local processes, it can be a powerful influence on the shape of local development. By
assessing the conditions for thriving communities at a ‘whole-place’ level, different local actors – from civil
society, local government, academia and business, to citizens and small community groups – can
collaboratively tackle even very entrenched problems. It provides a consistent and comparable way of
agreeing, measuring and tracking progress towards shared goals, a ‘common currency’ across and between
sectors and geographies. For more information see Chapter 6.
This report is just the tip of an iceberg of the breadth and depth of information that the TPI holds. Here we
are only able to share a few illustrative ways the data can be explored.
In Chapters 4 and 5 we have shared some of the headline findings by geography and by theme, and begun to
outline the ways this framework can be used to support real and lasting change in communities across the
UK. You can explore more of the results yourself online at www.thrivingplacesindex.org
This work has already started. Some pioneering places around the UK are already using the TPI as a tool to
support better planning, policymaking and action. For a little more information on this see Chapter 7.
The TPI has a sister tool, the Happiness Pulse, which measures individual and community wellbeing at any
scale from a single street to a whole region. When used together these tools provide a unique picture of
community wellbeing, that includes the external conditions and drivers, people’s personal resources, and how
citizens feel and function in their everyday lives.
We hope publication of the TPI for England (with Wales to follow in Spring 2018), will be embraced by more
farsighted leaders and changemakers who are seeking better measures of what matters, and who will to join
us in making what matters count.
page 6 of 86 February 2018

THRIVING PLACES FULL REPORT | Powered by Happy City
2 OVERVIEW
2.1 INTRODUCTION
Happy City is a UK charity with a big mission, to ‘make what matters count’. It offers a place-based model of
change that puts the wellbeing of current and future generations centre stage. It does this by providing a
focus on creating equitable and sustainable conditions for people to thrive.
Happy City’s measurement tools deliver a practical and achievable way to refocus the economy at a local
scale. They bridge academic rigour and practical action, linking the best thinking on new economics and
resilient communities with the people building those communities on the ground.
This report shares the results from the first national-scale pilot of Happy City’s groundbreaking TPI, a report
on how well areas across England are doing at growing the conditions for equitable, sustainable wellbeing.
Truly thriving places provide a range of local conditions that are multi-dimensional. They include people’s
mental and physical health, work and the local economy, education and learning opportunities, the qualities of
the place and its environment and the connections between people and community.
Taken alone, these vital elements can mask deep inequalities in the distribution of those conditions that
jeopardise both individual and social long term wellbeing. They can also mask unsustainable means of
creating those conditions, thus jeopardising the chances of future generations to thrive. Crucially and uniquely
therefore, this TPI balances these local conditions with local equality and environmental impacts.
We need an economy where we thrive whether or not it grows. Happy City’s TPI and report aims to call us all
to account – from small community groups, to powerful mayors – for how well we are making progress
towards that aim, within the limits of our planet.
page 7 of 86 February 2018

THRIVING PLACES FULL REPORT | Powered by Happy City
2.2 BACKGROUND & CONTEXT
On a national and international scale, policymakers are increasingly focusing on measures of prosperity
beyond traditional economic indicators, such as GDP and wealth creation. A focus on economic growth as an
end in itself has delivered neither equality nor sustainable wellbeing. The global economy has doubled in 25
years whilst carbon emissions have gone up 40%, and 60% of our ecosystem has been degraded . Inequality 7
is reaching such epic proportions that a handful of the richest people on Earth now own more wealth than the 8
bottom half of the world’s population – 3.7 billion people. Further, the top 1% now have more money than
the bottom 99% and in 2017 a new billionaire was created every two days . This global trend is repeated at 9
national and local level here in the UK and elsewhere.
Wellbeing is emerging as the front-runner in the search for a better way of defining success and prosperity in
our communities. In the last decade, significant progress has been made in our understanding of what the
key drivers of wellbeing are, and crucially, how to measure them . In the UK, the National Wellbeing 10
Programme uses national level indicators to ‘measure what matters’. These measures can be used to monitor
the nation’s progress, and to assess and develop policy.
We know what counts and NOW we also know how to count it.
While a lot of effort is going into finding alternative models at a national and international scale, far less has
gone into supporting a practical place-based shift at a local and regional scale. This is despite urbanisation
and localism being global trends that are putting local leaders at the coalface of innovation in policy and
action. This is where change is happening now.
Until now there has been no consistent and accessible framework that uses local level indicators to measure
and inform progress towards supporting the wellbeing of all citizens, now and in the future.
Happy City’s TPI is designed to fill this gap. To provide a robust reporting framework for local areas to support
decision makers in their work to improve lives on the ground AND to help shift the focus, place by place,
towards measuring what matters
7 Prosperity without Growth: Economics for a Finite Planet,
Tim Jackson, March 2009
http://www.sd-commission.org.uk/publications.php?id=914 8 Studies vary from 6 people to 42, but always only enough
to fit in a single room
9 Oxfam Report: Reward Work, Not Wealth: To end the
inequality crisis, we must build an economy for ordinary
working people, not the rich and powerful. 22 Jan 2018 10
Links to some examples can be found in Appendix 3
page 8 of 86 February 2018

THRIVING PLACES FULL REPORT | Powered by Happy City
2.3 PROJECT AIMS AND OBJECTIVES
Happy City’s TPI is designed to be used. It is not a PR stunt, a campaign tool, or merely some interesting
research to add to the office shelf.
It is designed to support both a radical system change in how we run the society of tomorrow AND to support
TODAY’s change-makers from local government, business and civil society to start to better monitor local
progress and implement policies that improve people’s wellbeing in the here and now.
2.3.1 PROJECT AIMS
● Challenge the current paradigm which sets the compass of progress towards how much we grow consumption
by the many, wealth for the few and use of earth’s resources
● Grow recognition that what we measure influences what we value, and the direction in which we develop
● Provide better measures of what people most ‘value’ and help make those measures more widely used -
starting with the local scale
● Challenge society to grow the number of quality indicators of real progress year on year
The TPI can deliver these four interconnected aims here and now, using a practical methodology that shifts
the focus at a local level. It shows the impact of measuring more of what we value and using that to guide
decisions. By being open about the imperfections of our current indicators, we also aim to support continual
improvement in the quality of the data we gather on the conditions for thriving places now and in the future.
However its real power may lie in its capacity to support very new conversations across very old divides:
● Cross-sectoral. A cross cutting index like this can spark new conversations among people who might not
normally meet in other ways. Community groups and local government, environmental experts with health
officials and economic advisors. The TPI recognises that our lives – and communities – are not silo-based but
complex and interconnected. We need ways of working and thinking that reflect this.
● Within communities. The TPI, like any index, is partial and selective. It tells just a piece of the story, but
much more of the story than a narrow economic index does. The TPI is a step towards having ongoing,
challenging and vitally important conversations in the heart of our communities, about much more of what
really matters to people’s lives.
● Political. Too much discussion in society argues about the facts. An index like this helps provide a common
starting point for all sides in the political debate. Once people have a common set of facts that they trust,
examples around the world have shown that it is easier to find agreement on a new direction on the
foundation of common ground.
page 9 of 86 February 2018

THRIVING PLACES FULL REPORT | Powered by Happy City
2.3.2 PROJECT OBJECTIVES
Alongside these big picture aims of the TPI are a range of practical and immediate objectives at a local scale
across the UK. These include supporting as many local areas across the UK as possible to use the TPI to:
1. Monitor local progress towards delivering the conditions for equitable, sustainable wellbeing and
use the framework as a shared roadmap towards it
2. Develop integrated local wellbeing policy across and between sectors
3. Develop and deliver tailored policies and initiatives to improve local conditions for wellbeing
4. Highlight innovative and successful policies and practice
5. Encourage responsible progress towards better shared goals
Together, these five uses of the TPI can create a powerful force towards implementing joined-up, innovative,
evidenced-based wellbeing policy. In this way we can reshape how local development is delivered. By
assessing the conditions for thriving communities at a ‘whole-place’ level, different local actors – from civil
society, local government, academia and business, to citizens and small community groups – can
collaboratively tackle even very entrenched problems. It provides a consistent and comparable way of
agreeing, measuring and tracking progress towards shared goals, a ‘common currency’ across and between
sectors and geographies.
For more information on the different uses of the TPI please see Chapter 7.
2.4 AUDIENCE
The TPI is designed with the following audiences in mind:
● Local Authority decision makers and officers
● Local Public Health leaders and teams
● Health & Wellbeing Boards
● Private Sector organisations who are interested in place-based development or cross-sector partnerships
● Civil Society organisations large and small, who play a crucial role in improving the conditions for citizens to
thrive
page 10 of 86 February 2018

THRIVING PLACES FULL REPORT | Powered by Happy City
2.5 PROJECT DEVELOPMENT TIMELINE
The work to develop an Index within Happy City’s model began back in 2011. Since then there have been a
number of stages of development:
2011-2014
Widespread consultation and grassroots research into what was needed and what ‘mattered’ in local
communities. This period included:
○ Discussions, workshops, events, focus groups and interviews in communities – including community
projects, community spaces, faith groups, schools, local businesses, prisons, health centres and public
spaces 11
○ Consultation with policymakers and frontline workers across a wide range of public sector and cross
sector bodies 12
○ Consultation with a range of academic and expert ‘partners’ as well as desk research on existing tools
and evidence 13
2014-2015
Intensive development period in partnership with New Economics Foundation and a wide ranging ‘advisory
board ’ to develop the first version of the Index framework, criteria for indicator selection and the first full 14
indicator set
2016
Publication of the first pilot results for the nine English Core Cities, launched alongside Happy City’s other two
measurement and policy tools – The Happiness Pulse and the Wellworth Tool – at a national launch in Bristol
UK in November 2016
11 Estimated 20,000 people engaged over 4 years
12 Including 9 city councils, 7 county/district councils, 3
devolved governments, LGA, DEFRA, DCLG, PHE, ONS, The
Health Foundation 13
See Appendix 3 for links 14
See Page 74 for details
page 11 of 86 February 2018

THRIVING PLACES FULL REPORT | Powered by Happy City
2016-17
Major consultation on the framework, indicator set and initial pilot including:
○ Project with What Works Centre for Wellbeing (WWCW), Office for National Statistics (ONS) and
Public Health England (PHE) to develop guidelines for UK local authorities on local wellbeing
indicators, based on version 1 of the TPI as a straw man for discussion with consultees UK-wide. Full
report from that work available here
○ Further discussion with local authorities UK-wide, devolved governments, academic partners,
members of the WWCW consortia, and key national bodies.
2017-18
Development of version 2 of the TPI:
○ Building on the feedback, learning and newest evidence, research and data availability, a new
version of the TPI was developed and tested
○ Data gathering for all upper-tier local authorities in England
○ Adaptation work begun on a Welsh version of the TPI, using the different data and social context in
the devolved nation.
2018
● Launch of the England-wide findings in February 2018
● Launch of the Welsh-wide findings of an adapted Welsh TPI to follow in May 2018
● Development of ‘real-time’ data updates for the online TPI portal and bank of resources for finding world
wide best practice in policy and local action for each domain
● Support the 25+ Local Authorities in England and Wales already interested in embedding the Happy City
wellbeing frameworks and measurement tools into policy and practice.
page 12 of 86 February 2018

THRIVING PLACES FULL REPORT | Powered by Happy City
3 THE FRAMEWORK
3.1 FRAMEWORK OUTLINE
The TPI is designed as a measure of the drivers of wellbeing. In the diagram below, the TPI focuses on the
key elements of the middle box:
Figure 1: The Happy City TPI intends to fill the middle box
in this diagram.
The TPI does not measure the inputs that are invested into achieving the drivers of wellbeing, nor does it
measure wellbeing itself (though our other measurement tool, the Happiness Pulse, measures wellbeing at an
individual, organisational, community and place-based scale).
Both these sets of data are available at a local authority level, but the TPI design is focused on the conditions
for wellbeing as a priority for policy, resources and action. However we do gather subjective wellbeing data
and include it in the TPI raw data file to support our outputs analysis.
The framework is designed to create a powerful and accessible shared narrative by arranging a broad range of
dimensions into clear, focused and intuitively relevant domains. It consists of a set of 48 indicators that use
existing and (mainly) accessible data from established national data agencies such as ONS, PHE and the
Index of Multiple Deprivation (IMD). All indicators are chosen to represent the drivers of wellbeing – factors
which are known to improve people’s wellbeing now and in the long term.
page 13 of 86 February 2018

THRIVING PLACES FULL REPORT | Powered by Happy City
These indices are arranged into three headline elements:
● SUSTAINABILITY
● LOCAL CONDITIONS
● EQUALITY
These headline elements support a broad dialogue about whether an area is creating the conditions for people
to thrive, within environmental limits and in a socially just way.
We then use a layered approach to drill down to the detail: within each headline element there are domains –
with a focus on what can be influenced at local scale.
SUSTAINABILITY comprising:
● CO2 emissions
● Energy consumption
● Waste and recycling rates
LOCAL CONDITIONS comprising:
● Work & local economy
● Mental & physical health
● Education & learning
● Place & environment
● People & community
EQUALITY comprising:
● Wellbeing inequalities
● Health inequalities
● Income inequalities
page 14 of 86 February 2018

THRIVING PLACES FULL REPORT | Powered by Happy City
Domains are further broken down into a series of subdomains. This enables us to capture the key dimensions
of wellbeing within the topic area of the overall domain. This is especially the case for the Local Conditions
domains which has 17 subdomains, for example Place and Environment comprises transport, safety, housing
and green space. Sustainability and Equality currently have three domains each.
This is done in order to make the breadth of information the TPI holds accessible to citizens and statisticians
alike, and to support the cross-sector use of the framework as a roadmap for collaborative change. The Local
Conditions element is therefore broken down into the following domains and subdomains:
page 15 of 86 February 2018

THRIVING PLACES FULL REPORT | Powered by Happy City
This layered structure of the framework is intended to support the use of the tool both as a data tool
AND a communication tool. Each local authority gets a headline results graphic and an easily understood
scorecard: 15
For each subdomain, domain and category we have applied a simple categorisation scheme, as follows:
Score Label
< 3.5 Lowest
3.5 - 4.5 Low
4.5 - 5.5 Average
5.4 - 6.5 High
> 6.5 Highest
For the full set of Indicators within each subdomain, see Appendix 1.
The detailed methodology including the formula used to produce the
scorecards can be found in Appendix 2.
15For all headline results see pages 21-26 and for more case
studies and example scorecards see pages 43-47
page 16 of 86 February 2018

THRIVING PLACES FULL REPORT | Powered by Happy City
3.2 INDICATOR SELECTION CRITERIA
The identification and selection of indicators is a painstaking and careful process as the TPI is only as good as
the indicators it contains. As the TPI is something that can be used today, we have drawn on data that is
already available, rather than creating a wishlist of ideal indicators. This means that sometimes we have used
a proxy indicator if we have been unable to find a suitable indicator to fully measure a factor of a subdomain.
All the indicators included are available for 150 upper-tier English local authorities. With each new year, and
through our wider work and that of many of our partners, what is measured to capture wellbeing locally and
nationally is improving and we are adding new indicators or substituting more appropriate ones as they
become available.
The technical features of the indicators
Evidence-based The TPI measures the drivers of wellbeing. One key requirement for indicators was that
they measure (or are a good proxy for) something that research and evidence has demonstrated influences
subjective wellbeing;
Validity All the indicators we use achieve a good level of confidence. The indicators are sourced from national
data agencies such as ONS, IMD, Public Health Outcomes Framework (PHOF). We pay attention to both
sample size and representativeness in our selections, as well as the wording of the questions and what data
that captures;
Geographical scale The TPI is designed to provide data at the local authority level. We don’t drill down any
further than local authority level, as the availability of robust data is more patchy and would therefore not
allow us to offer such a comprehensive indicator list.
As current as possible The indicators in the 2017 version of the TPI are dated between 2011 and 2017, and
are the most up-to-date indicators available at the time we analysed the data. Our aim is to update the TPI
annually in order to keep it current.
The content and focus of the indicators
Drivers not inputs – The TPI measures the drivers of wellbeing, it does not measure the inputs that local
authorities invest into achieving the drivers of wellbeing.
Conditions for wellbeing – The TPI measures the drivers of wellbeing, not wellbeing itself. However we do
collect wellbeing data (in terms of subjective wellbeing) as it is available at the local level and the data from
this is provided in the raw data file to complement the interpretation of the TPI results.
page 17 of 86 February 2018
THRIVING PLACES FULL REPORT | Powered by Happy City
Amenable to local action The TPI is intended to be used by local authorities and their partners. As such,
the indicators included need to reflect things that can be influenced by local action.
Asset based The TPI attempts to look at assets, not just deficits. So it measures the percentage of people in
good jobs (based on data from the Labour Force Survey), rather than just the percentage of people in
employment.
Broad and balanced The TPI recognises that many determinants of wellbeing are too complex to be
measured using objective data alone. For example, including subjective wellbeing inequality (as well as health
and income inequality) allows us to capture elements which are not easily measured objectively.
Appropriate for all local authority areas, whether urban or rural We have selected indicators that are
equally applicable for and relevant cities, towns, villages, remote hamlets and all points in between, and will
yield meaningful and revealing data for all.
See Appendix 2 for our full Methodology including an overview of the indicators selected.
page 18 of 86 February 2018
THRIVING PLACES FULL REPORT | Powered by Happy City
INTRODUCTION TO THE RESULTS AND ANALYSIS
SECTIONS
Happy City’s TPI is not designed to be used purely as a league table. It is the start of a discussion and a tool
for change. It creates domains to help prioritise action, not create winners and losers. Yet it is also designed
to help encourage greater sharing of good practice, and it can be used to unearth places that are succeeding
in creating the conditions for equitable and sustainable wellbeing.
As such the results visualisations and analysis need to come with a strong reminder - that Happy
City’s TPI is a place-based tool. It is designed to be used by individual local places - to explore their own
strengths and needs, to help guide decisions and make priorities around a shared framework of progress. Any
comparisons to other areas only have a degree of usefulness – to understand what others are doing well and
to learn from them, as well as to benchmark targets and progress against agreed norms.
We recommend any area interested in using the TPI does so by focusing on its own scores, or working
with us to understand and improve its own individual indicator results behind those scores.
The following pages offer a range of ways of visualising and exploring the wealth of data the TPI provides.
These include:
Section 4 presents results visually.
Section 4.1 comprises three maps of England, showing the distribution of Local Conditions, Equality and Sustainability.
Section 4.2 presents a visualisation of the average score for the three headlines elements for each of the 150 upper-tier
local authorities, in alphabetical order.
Section 4.3 presents some highlights and lowlights of the scores by domain
Section 5 presents our analysis of the results. Before you read this section you may wish to refer to Appendices 1 and
2, which outline the indicator set in more detail and our overall methodology, including scoring formula.
Section 5 offers three distinctive lenses of analysis:
Section 5.1 offers an analysis by Geography (including England-wide, regional and five local authority case studies)
Section 5.2 offers an analysis by Theme (domain themes)
Section 5.3 offers an analysis of the scores alongside the IMD to bring out similarities and differences against a more
conventional deprivation index
page 19 of 86 February 2018

THRIVING PLACES FULL REPORT | Powered by Happy City
4 THE RESULTS
4.1 ENGLAND MAPS
SUSTAINABILITY LOCAL CONDITIONS EQUALITY
page 20 of 86 February 2018

THRIVING PLACES FULL REPORT | Powered by Happy City
4.2 HIGHLIGHTS
page 21 of 86 February 2018

THRIVING PLACES FULL REPORT | Powered by Happy City
4.3 LOCAL AUTHORITY HEADLINE SCORES
page 22 of 86 February 2018

THRIVING PLACES FULL REPORT | Powered by Happy City
page 23 of 86 February 2018

THRIVING PLACES FULL REPORT | Powered by Happy City
page 24 of 86 February 2018

THRIVING PLACES FULL REPORT | Powered by Happy City
page 25 of 86 February 2018

THRIVING PLACES FULL REPORT | Powered by Happy City
page 26 of 86 February 2018

THRIVING PLACES FULL REPORT | Powered by Happy City
4.4 HIGHLIGHTS AND LOWLIGHTS BY DOMAIN
Local
Conditions Sustainability Equality
Place and
environment
Mental and
physical health
Education
and learning
Work and
local economy
People and
community
Top of Table
1st Wokingham Tower Hamlets Harrow Wirral Richmond upon
Thames Trafford Wokingham Herefordshire
2nd Buckinghamshire Bournemouth Shropshire Bracknell Forest Wokingham Richmond upon
Thames Sutton North Yorkshire
3rd Surrey Southwark Lambeth Central
Bedfordshire Buckinghamshire
Kingston upon
Thames
Central
Bedfordshire Cornwall
4th Richmond-upon-
Thames Ealing Devon Thurrock Rutland York
Bracknell
Forest Wokingham
5th Rutland North Somerset Rutland Wokingham West Berkshire Southwark Surrey Devon
Bottom of table
146th Manchester Rutland Newcastle upon
Tyne Nottingham Middlesbrough Bradford Manchester Bournemouth
147th Kingston upon
Hull
Kensington and
Chelsea Middlesbrough Islington Manchester Liverpool Nottingham Manchester
148th Nottingham Stockton-on-
Tees Wirral Hackney Knowsley Knowsley Hartlepool Newham
149th Middlesbrough North
Lincolnshire Liverpool Westminster Liverpool Wolverhampton Middlesbrough
Hammersmith
and Fulham
150th Liverpool Redcar and
Cleveland Camden
Kensington and
Chelsea Blackpool Sandwell
Kingston upon
Hull Tower Hamlets
page 27 of 86 February 2018

THRIVING PLACES FULL REPORT | Powered by Happy City
5 OVERALL DATA ANALYSIS The following section is an analysis of the results for England. It looks at some of the geographical and
thematic patterns emerging across and between some of the 150 Local Authority areas covered.
As outlined earlier in this report (page 19), any such analysis needs to come with a strong reminder - that
Happy City’s TPI is a place-based tool. It is designed to be used by individual local places - to explore their
own strengths and needs, to help guide decisions and make priorities around a shared framework of progress.
We recommend any area interested in using the TPI does so by focusing on its own scores, or working with us
to understand and improve their own individual indicator results behind those scores.
5.1 ANALYSIS BY GEOGRAPHY
The following sections look at some of the England-wide geographical difference at an overall and regional
scale, then illustrated with a small number of case studies, looking at the results for five local authorities.
A guide to our terminology in section 6
When referring to geographies, we use the former Government Office region titles, and within that
occasionally more general geographical attribution: London, South East, South West, (the South) West
Midlands, East Midlands, (the Midlands) Yorkshire and Humber, North West and the North East (the
North).
Below regional level, we refer to local authorities by their name.
We have noted several times in this report that we have produced scorecards for the 150 upper-tier
English local authorities. A full list of upper tier local authorities by region is provided in the footnotes of
each regional section.
page 28 of 86 February 2018
THRIVING PLACES FULL REPORT | Powered by Happy City
5.1.1 Overall Geographical Analysis
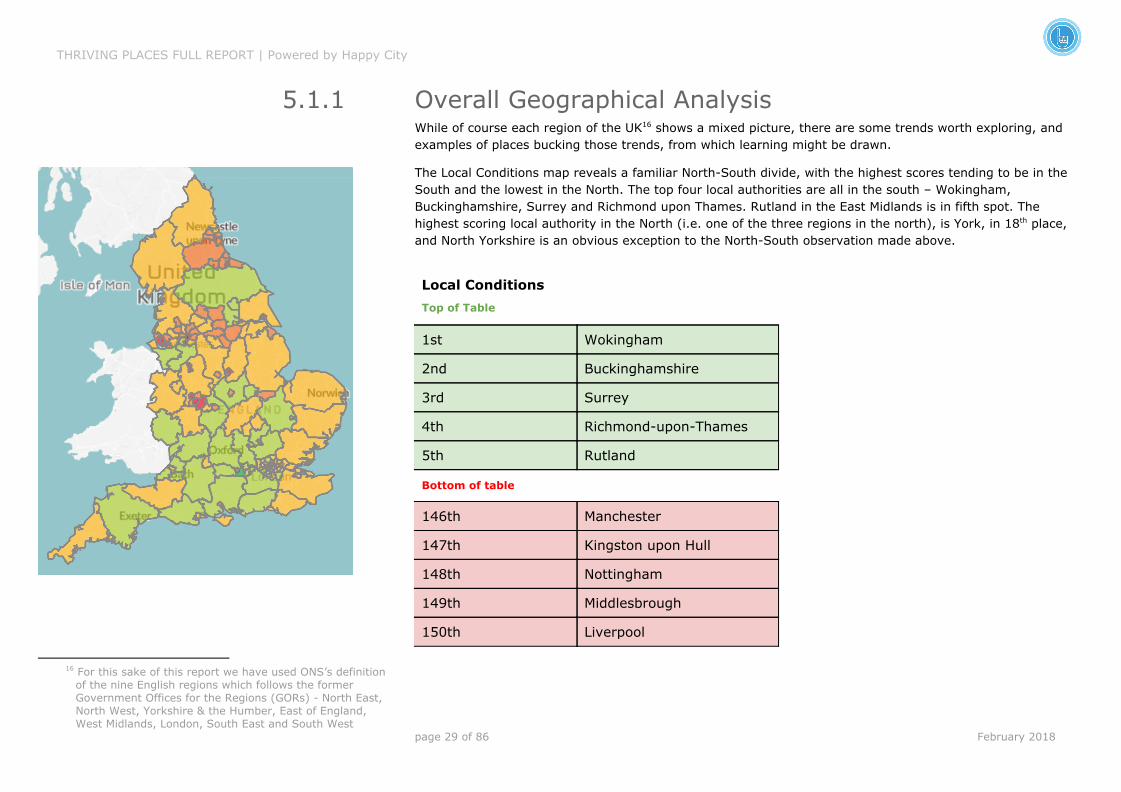
While of course each region of the UK shows a mixed picture, there are some trends worth exploring, and 16
examples of places bucking those trends, from which learning might be drawn.
The Local Conditions map reveals a familiar North-South divide, with the highest scores tending to be in the
South and the lowest in the North. The top four local authorities are all in the south – Wokingham,
Buckinghamshire, Surrey and Richmond upon Thames. Rutland in the East Midlands is in fifth spot. The
highest scoring local authority in the North (i.e. one of the three regions in the north), is York, in 18th place,
and North Yorkshire is an obvious exception to the North-South observation made above.
Local Conditions
Top of Table
1st Wokingham
2nd Buckinghamshire
3rd Surrey
4th Richmond-upon-Thames
5th Rutland
Bottom of table
146th Manchester
147th Kingston upon Hull
148th Nottingham
149th Middlesbrough
150th Liverpool
16 For this sake of this report we have used ONS’s definition
of the nine English regions which follows the former
Government Offices for the Regions (GORs) - North East,
North West, Yorkshire & the Humber, East of England,
West Midlands, London, South East and South West
page 29 of 86 February 2018

THRIVING PLACES FULL REPORT | Powered by Happy City
But the border between North and South isn’t where one might assume. After the North East, the second
lowest scoring region is actually the West Midlands. By contrast, the East Midlands scores similarly to London.
Generally, urban local authorities in the North and the Midlands record the lowest scores – Liverpool,
Middlesbrough, Nottingham, Kingston upon Hull and Manchester. Tower Hamlets and Barking & Dagenham in
East London are the lowest scoring authorities that don’t match this description (18th and 22nd from bottom
respectively). The lowest scoring authority that is not purely urban is North-East Lincolnshire (which includes
the town of Grimsby), which comes 124th out of 150.
Looking in more detail, the North East shows the most consistently low scores. No local authorities in the
North East are above the English average, and all except two are scored low or lowest. In contrast, there are
some exceptions in the North West and Yorkshire (namely North Yorkshire, Trafford, Cheshire East, Cheshire
West and Chester, and the aforementioned York). But, as we noted earlier, the North West also has some of
the lowest scoring authorities.
The West Midlands also has some very low scores (Sandwell, Wolverhampton, Stoke-on-Trent and
Birmingham), only partly balanced out by relatively high scoring Herefordshire and Warwickshire. In the East
Midlands, Nottingham does worst, but Rutland and Leicestershire both emerge with high scores. The East of
England broadly has average scores, although a couple of local authorities have low scores (Peterborough and
Luton), and three have high scores (Central Bedfordshire, Hertfordshire and Cambridgeshire).
Moving to the South, it is the South East which shows the most consistently high scores with eight of the top
10 local authorities in that region. The highest ranking council in the South West is Bath and North East
Somerset (13th). But there is greater variation in the South East, and it is Southampton (South East) which is
the only council in the two regions with a low score. Unsurprisingly, London does not fit the pattern for the
rest of the South. Eight boroughs are high scoring (aforementioned Richmond upon Thames scoring the
highest), but seven are low (we have already mentioned Tower Hamlets, which is the lowest scoring). Overall,
London scores exactly at the mean for England (5.0).
As the above paragraphs probably make clear, there is a sharp rural-urban divide as well as the North-South
divide, with rural areas tending to score more highly than urban ones. All 11 local authorities scoring within
the lowest bracket are urban, and only one rural council (County Durham) is low. There is a strong correlation
between the percentage of a local authority which is rural and the Local Conditions score (R=0.45). There are
councils that are predominantly urban that score well, with top ranking Wokingham being the obvious
exception. But Wokingham is 17.5% rural, and third place Surrey has a similar percentage. Perhaps more
interesting is the high score for Bracknell Forest – ranks 12th, only 2% rural. And of course, several wealthier
London boroughs score well (as does Trafford in Manchester), though the context of boroughs within the
same urban areas that have very low scores needs to be taken into account.
page 30 of 86 February 2018

THRIVING PLACES FULL REPORT | Powered by Happy City
5.1.2 Regional Analysis
North East 17
Overall, the North East is the lowest performing region in the Local Conditions map. All its 12 local authorities
score below the English average. The lowest ranking council in the region is Middlesbrough – second from
bottom.
The region has the lowest scores overall for Mental & Physical Health, Work & Local Economy – scoring 3.4
and 3.3 respectively. In both domains, eight out of 12 local authorities score below 3.5 (thus colouring them
red on the map). The North East scores below average in all the subdomains that form part of these domains,
but the worst score is in relation to Local Business. Middlesbrough scores lowest in many of these areas, and
indeed has the second lowest score in England for Work & Local Economy. Middlesbrough’s job seeker rate
(3.3% of working population) is the highest in England.
For People & Community, the picture in the North East is mixed: while Northumberland ranks 25th from top,
Middlesbrough ranks 12th from bottom.
The North East’s strongest card is Place & Environment. Here it scores in general above the English average,
with Stockton-on-Tees, Redcar & Cleveland, and Darlington all in the High score category. This good
performance seems to be particularly driven by Housing, and in particular the indicator on housing condition.
According to our indicator on housing condition (which is sourced from the IMD), three of the top five councils
in England with regards to housing are in the North East – Hartlepool, Middlesbrough and Stockton-on-Tees.
In all three cases, only 15% of housing fails to meet the Decent Homes Standard, compared to an average of
24% in England. The North East also has very low levels of homelessness, even in the metropolitan area
around Newcastle. The North East also scores above average on Local Environment, with Stockton-on-Tees
ranking third overall, thanks to high levels of use of outdoor space and above average air quality levels.
However, aside from Place & Environment, the TPI reveals that the North East’s challenges in terms of Local
Conditions extend to the other core elements of wellbeing. The region is lowest for Sustainability, and second
lowest for Equality. With regards to Sustainability, Redcar & Cleveland stands out as England’s overall worst
performer (thanks to huge industrial CO2 emissions). On the other hand, Northumberland has net negative
CO2 emissions due to extensive reforestation. With regards to Equality, all 12 local authorities are below the
17 LAs in the North East Region: County Durham,
Darlington, Hartlepool, Middlesbrough, Newcastle upon
Tyne, North Tyneside, Northumberland, Redcar and
Cleveland, South Tyneside, Stockton on Tees, Sunderland,
Gateshead
page 31 of 86 February 2018

THRIVING PLACES FULL REPORT | Powered by Happy City
English average, with Middlesbrough and Newcastle-upon-Tyne coming fourth and fifth from bottom in
England respectively.
North West 18
The North West – from Merseyside to Cumbria – generally scores low on Happy City’s TPI. Three domains fall
in the Low category, and two in the Average category. It ranks second from bottom for Mental & Physical
Health (ahead of the North East), and Education and Learning (ahead of the West Midlands). It scores Low on
equality, and also Average on Sustainability.
But there is considerable variation within the region. Liverpool is bottom overall in Local Conditions, and
Manchester fifth from bottom – but Trafford, Cheshire West and Chester, and Cheshire East all score High
overall. This distinguishes the North West from the North East, where no council scores above average
overall.
The North West’s weakest subdomain is Mortality and Life Expectancy. Thirteen out of 23 local authorities are
categorised as having Lowest scores, with Blackpool and Manchester scoring 0 out of 10. These two cities
have the worst scores in England on the indicators ‘Years of Potential Life Lost’ and ‘Preventable Mortality
Rate’. Liverpool, Salford and Blackburn with Darwen do little better. Cheshire East, Cheshire West and
Chester and Trafford, however, all score above English average on this subdomain, with Cheshire East scoring
in the High category.
Beyond health, the North West also scores low on Local Business, with eight councils scoring in the Lowest
category – Liverpool coming last, and ranking 11th from bottom overall. On this indicator, Cheshire West and
Chester also scores low, but Cheshire East, and Bury both score in the high category.
As noted, Trafford is an interesting contrast to most of the North West. It scores well overall, with the highest
score in England for Education and Learning (whilst nearby Liverpool and Knowsley are third and fourth from
bottom). Cheshire West and Chester also does very well – in this case ranking sixth on People & Community
overall, scoring consistently well in this domain, well above average on voting, volunteering and culture.
Cumbria also does well on People & Community, in this case because of an exceptional score on Culture (it
ranks ninth overall).
Even amongst the low scoring councils, there are some bright spots. Blackpool is fourth in England for
Culture, with a score of 9.3 out of 10, and it also scores in the Highest category for Local Environment.
Blackburn with Darwen also scores well on Culture. Manchester is in the High category for Transport, Culture
18 LAs in the North West Region: Blackburn with Darwen,
Blackpool, Bolton, Bury, Cheshire East
Cheshire West and Chester, Cumbria, Halton, Knowsley,
Lancashire, Liverpool, Manchester, Oldham, Rochdale,
Salford, Sefton, St Helens, Stockport, Tameside, Trafford,
Warrington, Wigan, Wirral
page 32 of 86 February 2018

THRIVING PLACES FULL REPORT | Powered by Happy City
and Adult Education. And generally speaking, the North West does above average for Community Cohesion
and Housing, with 12 out of 23 local authorities in the High category for each of these subdomains.
Lastly, it is worth noting the Wirral – which ranks top for Place & Environment, thanks to a good balance
between rural and urban advantages. But Wirral is also third from bottom overall for Equality, one place
ahead of Liverpool. Indeed the region overall is the lowest performing region on this core element, Sefton and
Bolton also falling in the Lowest category.
The North West overall is just below the English average for Sustainability. Manchester, ranked 16th overall,
leads the way, followed by Tameside. However six LAs fall in the Low category, with Cumbria and Blackpool
bringing up the rear.
Yorkshire and the Humber 19
Broadly speaking, Yorkshire and the Humber does the best of the three ‘Northern’ regions – scoring 4.6 out of
10 (compared to 4.5 for the North West, and 4.2 for the North East). Across domains, it presents a relatively
flat profile, with no scores below four out of 10. Its worst domain is Work & Local Economy, where it comes
above only the North East. In the best scoring domain, People & Community, the score does not exceed the
English average (5.0 out of 10).
As with the North West, there is considerable variation in the region. Kingston-upon-Hull is fourth from
bottom overall in Local Conditions, whilst York and North Yorkshire are 18th and 20th respectively. Most of the
major urban areas are in the Low category (3.8 for Bradford up to 4.4 for Leeds) – the only exception being
Sheffield, which reaches the Average category (scoring 4.6 out of 10).
In the case of Kingston upon Hull, poor performance is driven by Work & Local Economy, where it ranks
bottom overall in England. It scores 0 out of 10 for Local Business. Other areas of particular concern, are the
low Work & Local Economy scores for North East Lincolnshire (seventh from bottom, and second from bottom
on the Good Jobs subdomain), and the low Mental & Physical Health score for Barnsley (15th from bottom
overall).
York does well in most domains, particularly Education and Learning, where it ranks fourth in England. York
comes second on Healthy & Risky Behaviours in England, and third for Participation. Meanwhile, North
Yorkshire stands out as second highest in England for People & Community – driven by an exceptional Culture
score. North Yorkshire also has the third lowest unemployment rate. But even these two strongly performing
19 LAs in the Yorkshire and Humber Region: Barnsley,
Bradford, Calderdale, Doncaster, East Riding of Yorkshire,
Kingston upon Hull, Kirklees, Leeds, North East
Lincolnshire, North, Lincolnshire, North Yorkshire,
Rotherham, Sheffield, Wakefield, City of York
page 33 of 86 February 2018

THRIVING PLACES FULL REPORT | Powered by Happy City
councils have weak spots. York is 14th from bottom for Local Business, and also scores Low for Mental Health
and Community Cohesion. North Yorkshire, perhaps unsurprisingly, scores Low for Transport.
And amongst the lower-performing authorities there are also some positives. Most of Yorkshire and the
Humber scores well for Housing and Community Cohesion. For example, Rotherham – 127th for the TPI as a
whole – comes ninth for Community Cohesion. Eight out of 15 councils score High for Housing.
However, Yorkshire and the Humber does poorly for Equality and Sustainability. Leeds and Rotherham rank
10th and 11th from bottom overall for Equality. North Lincolnshire, thanks to very high CO2 emissions, ranks
second from bottom for Sustainability, North Yorkshire and North East Lincolnshire are not far ahead. The
only bright spot for Sustainability is Kingston upon Hull, which ranks 11th overall thanks to a rare
combination of high recycling rates and low domestic energy consumption.
And how do the three major urban areas of Yorkshire compare – Sheffield, Leeds and Bradford? For Local
Conditions, Sheffield comes out top. It particularly outperforms Leeds and Bradford on Education and
Learning, but also for Transport and Housing. Leeds pips Sheffield for Participation. As for Bradford, it does
slightly better on Community Cohesion. Leeds and Bradford are neck-and-neck for Sustainability, with
Sheffield having the lowest score.
East Midlands 20
Middle of the country, it is also middle of the table in Happy City’s TPI. It ranks fifth out of nine for Local
Conditions overall and for three of five domains. Indeed, overall, it scores Average for 14 out of 17
subdomains.
But there are sharp differences between urban and rural areas in the region. Rural Rutland is fifth overall in
England, whilst urban Nottingham is third from bottom. Leicestershire is 28th from top and in the High
category. Leicester itself is 12th from bottom, and only just creeps into the Low category (scoring 3.5 out of
10). Derby and Derbyshire show a similar contrast between high and low scores, with the city in the Low
Category.
This general pattern is reflected across domains. Nottingham is fourth from bottom for Work & Local
Economy, fifth from bottom for Place & Environment and 10th from bottom for Education and Learning. Indeed
it scores in the Low or Lowest category for 15 out of 17 subdomains. It has the lowest score in England for
Safety. The only exceptions are Culture and Transport, where it scores High.
20 LAs in the East Midlands Region: Derby, Derbyshire,
Leicester, Leicestershire CC, Lincolnshire CC,
Northamptonshire CC, Nottingham, Nottinghamshire CC,
Rutland
page 34 of 86 February 2018
THRIVING PLACES FULL REPORT | Powered by Happy City
Meanwhile, only 25 miles away, Rutland ranks fourth for Mental & Physical Health, and eighth for People &
Community. It ranks top in England for Mental Health and Safety. The contrast could hardly be more extreme.
Similarly Leicestershire ranks 11th for Place & Environment, whilst the city of Leicester itself is 18th from
bottom.
Having said that, the rural areas of the East Midlands do have their challenges. Rutland in particular has the
second worst Transport score in England – Northamptonshire and Lincolnshire also fall in the Low category for
this subdomain. Rutland also falls into the low category for Good Jobs – which is interesting given that it
ranks eighth highest for Employment. However, given that the good jobs data comes from a survey, there is
some risk that this figure is unreliable – Rutland being one of England’s smallest LAs. Meanwhile,
Leicestershire is in the Lowest category for Culture.
And the urban areas have some bright spots. We’ve already mentioned Transport and Culture in Nottingham.
Leicester scores even better than Nottingham on Transport. Meanwhile, Derby – which scores Low overall –
has the 11th best score for Participation in England.
The East Midlands is fairly middle of the road when it comes to Equality, though Derby is particularly low
(eighth from bottom).
With regards to Sustainability, however, the region is third from bottom. And it is here that Rutland’s achilles
heel is – coming fifth from bottom overall. This appears to be particularly due to high industrial CO2
emissions, but the little county also scores very low on energy consumption. Conversely, it’s recycling rates
are amongst the highest in the country. Meanwhile, Leicester ranks 18th best in the country for Sustainability.
West Midlands 21
The West Midlands scores second lowest overall on Local Conditions, ahead of the North East and falling
behind the North West and Yorkshire. Its particular weakness is in Education and Learning, where it scores
well below all other regions (3.8 out of 10).
As with the East Midlands, there is a contrast between rural and urban areas, with rural Herefordshire and
Warwickshire scoring best (32nd and 34th respectively), whilst Sandwell, Stoke-on-Trent and Birmingham are
all in the bottom 10 overall. Sixth from bottom overall is Sandwell, which ranks lowest in England for
Education and Learning, and seventh lowest for Employment.
Interestingly, compared to the East Midlands and the North West, the West Midlands’ rural areas don’t do so
well. Shropshire, Staffordshire and Worcestershire all score Average overall. It appears that Education and
21 LAs in the West Midlands Region: Birmingham, Coventry,
Dudley, Herefordshire, Sandwell, Shropshire, Solihull,
Stoke on Trent, Staffordshire, Telford and Wrekin, Walsall,
Warwickshire, Wolverhampton, Worcestershire
page 35 of 86 February 2018

THRIVING PLACES FULL REPORT | Powered by Happy City
Learning is the shared low point across all areas, with no LAs scoring High in this domain, and seven out of 14
scoring in the Lowest category. Likewise, nowhere in the West Midlands scores high on Place & Environment.
But there are some bright spots. Herefordshire ranks top in England for People & Community. It does well
across all subdomains, particularly Culture. Shropshire does well for Mental & Physical Health, and ranks sixth
overall for Mental Health in particular. Overall, the region’s best subdomain is Community Cohesion. And,
surprisingly, it’s an urban area – Dudley – that gets the best score – ranking fourth in England. Staffordshire
also does very well on this subdomain, as do urban Walsall and Sandwell.
Coventry is another interesting council. It scores very low on Community Cohesion, but scores in the High
category for Good Jobs and Mental Health.
The region’s best performance perhaps is with Equality, where it is only beaten by the South West. Shropshire
ranks second overall in the country, particularly thanks to very low health inequality. Telford and Wrekin, and
Herefordshire also fall in the High category for Equality. Solihull is the only authority in the Low category.
On Sustainability, West Midlands doesn’t do so well. Despite the fact that most urban areas tend to do
relatively well on Sustainability, Solihull, Stoke-on-Trent and, importantly, Birmingham, all score Low. In the
case of Birmingham, this is particularly due to low recycling rates. For more affluent Solihull, the problem is
more to do with high CO2 emissions and domestic energy consumption.
East England 22
The East of England is the third highest scoring region in Local Conditions, only beaten by the South East and
South West. Indeed, it scores ahead of the South West on Mental & Physical Health and Work & Local
Economy – ranking second best on both domains. However, it is lower on Place & Environment and Education
and Learning.
As with most of England there is a clear urban-rural split. The best scoring local authorities in the region are
more rural or commuter belt – Central Bedfordshire, Hertfordshire and Cambridgeshire. Central Bedfordshire
is 17th overall in Local Conditions. The lowest scoring councils are Peterborough and Luton. But even these
two don’t score all that badly – Peterborough coming 38th from bottom. Bedford meanwhile, scores at the
English average, which is a good performance for a town.
As noted, the East of England’s strengths are in Mental & Physical Health and Work & Local Economy. With
regards to the latter, Central Bedfordshire ranks third overall in the country, and Hertfordshire is not far
behind in 13th spot. Both counties perform well across the domain. Central Bedfordshire, for example, ranks
22 LAs in the East of England Region: Bedford Borough,
Cambridgeshire CC, Central Bedfordshire, Essex CC,
Hertfordshire CC, Luton BC, Norfolk CC, Peterborough,
Southend on Sea BC, Suffolk CC, Thurrock
page 36 of 86 February 2018

THRIVING PLACES FULL REPORT | Powered by Happy City
second for Employment and fifth for Local Business, whilst Hertfordshire ranks 13th for Good Jobs and Basic
Needs. Central Bedfordshire also comes second on Community Cohesion and eighth on Safety.
Returning to Work, Peterborough is in the High category for Employment. Indeed this subdomain is one
where no LA is in the Low or Lowest category. The same goes for Overall Health Status. Community Cohesion
is also an area where most places do well, including Thurrock – which is an urban area close to London.
The two lowest scoring councils overall, also score in the Lowest category for Education and Learning – Luton
and Peterborough. Norfolk and Bedford also score low in this domain. In the case of Peterborough and
Bedford, the lower score is in Children’s Education. Peterborough, for example, is ninth from bottom for
England overall. For Luton in particular, it’s Adult Education – where it is sixth from bottom in England.
It’s also worth noting some low scores in People & Community, particularly thanks to low Culture scores.
Luton ranks second from bottom. Thurrock and Southend-on-Sea are not far ahead. Whilst rural areas tend to
do very well on People & Community, that’s not the case for Essex.
The East of England ranks second overall for Sustainability as well, only behind the South West. But this is
not because of any particularly high scores - all LAs in the region fall consistently in the middle category for
this core element. Recycling rates are generally above average, and domestic energy consumption is
marginally below average.
The East of England scores Average on Equality. Norfolk and Central Bedfordshire are in the High category,
whilst Southend-on-Sea is in the Low category.
London 23
The capital city is also England’s second largest region in terms of population, and there is a huge diversity in
scores. As a whole London ranks fourth for Local Conditions. But, whereas most regions tend to either score
high in all domains, or score low in all domains, London shows extremes. It ranks bottom for Place &
Environment, and bottom for People & Community. But it comes second for Education and Learning, and third
for Work & Local Economy. For Mental & Physical Health, it’s fourth overall.
Within the city, eight local authorities are in the High category for Local Conditions and seven are in the Low
Category. There is definitely an Inner/Outer London split happening here, with Richmond upon Thames,
23 LAs in the London Region: Barking and Dagenham,
Barnet, Bexley, Brent, Bromley, Camden, Croydon, Ealing,
Enfield, Greenwich, Hackney, Hammersmith and Fulham,
Haringey, Harrow, Havering, Hillingdon, Hounslow,
Islington, Kensington and Chelsea, Kingston upon Thames,
Lambeth, Lewisham, Merton, Newham, Redbridge,
Richmond upon Thames, Southwark, Sutton, Tower
Hamlets, Waltham Forest, Wandsworth, Westminster. Not
included: City of London
page 37 of 86 February 2018

THRIVING PLACES FULL REPORT | Powered by Happy City
Bromley and Kingston upon Thames scoring the best. Richmond upon Thames is fourth overall in England.
Meanwhile, Tower Hamlets, Barking & Dagenham, and Islington scoring worst – with Tower Hamlets ranking
18th from bottom overall. But there are exceptions to that trend. Wandsworth scores 5.4 out of 10, just below
leafy Bexley. Brent and Enfield both score 4.6, below Haringey.
As mentioned, it is Education and Learning where London scores very well. Although top score in this domain
is actually in the North West (Trafford), Richmond upon Thames and Kingston upon Thames are second and
third. And most interestingly, several Inner London LAs are close behind, with Southwark fifth best overall.
Twenty out of 32 boroughs are in the High or Highest category for this domain.
There is another stand out result for Work & Local Economy, where Sutton ranks second best overall. That’s
due primarily to having the best score in England on the Good Jobs indicator. Wandsworth ranks 12th in
England for Work & Learning, again because of the Good Jobs indicator, where it ranks fifth in England.
London also does quite well on the Mortality and Life Expectancy and Overall Health Status subdomains. For
example, four of the top five councils for Mortality and Life Expectancy are in London – Kensington and
Chelsea, Richmond upon Thames, Harrow and Barnet. Richmond upon Thames and Kensington and Chelsea
also rank in the top five for Overall Health Status, and Richmond upon Thames scores best overall for Healthy
& Risky Behaviour. Harrow is fourth best for Mental Health.
The more deprived local authorities score much lower here, with eight local authorities scoring in the Low
category for Mental & Physical Health.
But the area where London does almost universally poorly is People & Community – seven councils in the
Lowest category, a further 15 in the Low category, and only two in the High category. The lowest-scoring
three authorities in the country in this domain are here – Tower Hamlets, Hammersmith & Fulham and
Newham. Digging deeper, it is Community Cohesion where London scores consistently low – nine of the
bottom 10 councils in the country are here. But within this domain, there are some very good scores.
Kensington & Chelsea score 10/10 for Culture, Westminster, Camden, Richmond-upon-Thames and Bromley
are all close behind and in the Highest category. Meanwhile, Haringey ranks 10th in the country for
Participation, Richmond-upon-Thames is 13th.
Place & Environment also presents an interesting picture. Housing is consistently poor, all the lowest 10 local
authorities in the country being in London. Local Environment and Safety are also broadly poor areas.
Kensington and Chelsea is bottom for Local Environment, with Hackney just ahead of it. Westminster is fourth
from bottom for Safety, Lambeth fifth from bottom. But much of outer London scores fairly well for Safety,
including less affluent areas such as Havering. Kingston upon Thames, Havering and Lambeth also all score in
the High category for Local Environment. In the Transport subdomain, nine out of the top 10 councils are in
London (Bristol takes 10th place ahead of Lambeth).
page 38 of 86 February 2018

THRIVING PLACES FULL REPORT | Powered by Happy City
What are the biggest positive surprises in London? Perhaps the exceptionally high scores on Education and
Learning for inner London boroughs such as Southwark, Lambeth and Lewisham. Local Business is another
area where good scores are found across London. Top score in the country is Harrow, followed by Hackney,
Barnet and Redbridge. Also, Mental Health scores are in the High category for two deprived East London
boroughs – Newham and Barking & Dagenham.
Meanwhile, at the top of the table, Kingston upon Thames and Hillingdon both score in the Low category for
Culture.
And there are more surprises for London. London comes third in England for both Sustainability and Equality.
With regards to Sustainability, this is partly driven by urban life involving less driving and smaller houses.
Nine boroughs are in the High category – with Tower Hamlets in top place. Southwark is third and Ealing is
fourth in England overall, Bexley is seventh, so it’s worth noting that the high scoring boroughs are not all in
Inner London. Conversely, Kensington upon Chelsea is amongst the bottom five scores in the country for
Sustainability. Westminster, Hammersmith and Fulham, Wandsworth, and Richmond upon Thames are also
all in the Low category.
With regards to Sustainability, London’s weak point is recycling. Newham has the lowest rates in the country,
with Westminster and Lewisham not far ahead. Even Tower Hamlets is below average for recycling -
otherwise its Sustainability score would be very high. But there are exceptions - Bexley and Ealing being
above the English average.
With regards to Equality, it’s important to remember that our inequality indicators look at inequality within
boroughs, not between them. Bearing that in mind, it is still fascinating to see that the local authority with the
best Equality score in England is Harrow, in North West London. In third place is a very different borough:
Lambeth in South London. Hackney, Newham and Islington are amongst the nine boroughs that are in the
High category. But the most unequal local authority in England is also in London: Camden, which scores only
2.4 out of 10 for this core element, driven by extremely high income inequality.
South East 24
In terms of population, the South East is the largest region in England. It is also the region with the highest
average Local Conditions score – 5.8 out of 10. The region is consistent, it is top for four out of five domains,
24 LAs in the South East Region: Bracknell Forest, Brighton
and Hove, Buckinghamshire, East Sussex, Hampshire, Isle
of Wight, Kent, Medway, Milton Keynes, Oxfordshire,
Portsmouth, Reading, Slough, Southampton, Surrey, West
Berkshire, West Sussex, Windsor and Maidenhead,
Wokingham
page 39 of 86 February 2018
THRIVING PLACES FULL REPORT | Powered by Happy City
coming second to the South West for People & Community. Across subdomains, the South East is High in 12
out of 17.
And good scores are consistent geographically too. The top three councils in the country are in the South East
– Wokingham, Buckinghamshire, and Surrey. Four more make it into the top 10. Only one council –
Southampton – is in the Low category. Unlike most of England, generally cities and larger towns score well.
Aside from Wokingham, Brighton & Hove scores 5.4 out 10, and Milton Keynes and Reading both beat the
English average.
Wokingham of course stands out. It ranks top for Work & Local Economy, second for Mental & Physical
Health, fourth for People & Community, fifth for Place & Environment, and 15th for Education & Learning.
Looking at specific subdomains, it has the top score in the country for Overall Health Status, Housing,
Employment, Participation and Community Cohesion. But it does have some weak points. It is 13th from
bottom for Culture, and 19th from bottom for Transport.
Bracknell Forest is another interesting example. It ranks second overall for Place & Environment – an
excellent performance for a predominantly urban local authority.
Turning to bottom of the table Southampton – it suffers particularly in terms of Mental & Physical Health and
Work & Local Economy. It is eighth from bottom in terms of Local Business, and also is in the Lowest category
for Community Cohesion, Mental Health, and Safety.
Windsor & Maidenhead (ranked sixth overall), is third from bottom for Local Environment, and 18th from
bottom for Transport. Indeed, Transport, is the subdomain where the South East does worst, with six of the
19 local authorities in the Low category. Reading and Brighton & Hove are the only exceptions.
Brighton & Hove is interesting for many reasons. It scores 10/10 for Culture, and is in the Highest category
for Participation (sixth in England), Adult Education (third) and Healthy & Risky Behaviours (fifth). But it is in
the Lowest category for Mental Health, ranking fifth from bottom in England, and 11th from bottom for
Community Cohesion.
The South East doesn’t do so well, however, in terms of Equality – outperformed by the South West, the West
Midlands, London and the East of England. Having said that, there are some good scores here, with
Southampton ranking ninth best in the country, and Portsmouth and Bracknell Forest not far behind.
With regards to Sustainability, it is below average. The second largest LA in the region, Hampshire, is
particularly low, with a score well below the English average, thanks in particular to low recycling rates.
Windsor and Maidenhead, and Wokingham score about the same, though for these wealthy LAs, domestic
energy consumption is a bigger problem. Conversely, three LAs in the region emerge green on the map:
Milton Keynes, Oxfordshire and Medway.
page 40 of 86 February 2018
THRIVING PLACES FULL REPORT | Powered by Happy City
South West 25
The South West comes second overall in Local Conditions. Its strongest domain is People & Community where
it comes ahead of the South East. For Work & Local Economy, however, it is in third place, behind London and
the East of England.
Bath & North East Somerset is the highest scoring local authority here in 13th place overall. Dorset, Wiltshire
and South Gloucestershire follow close behind. But the key difference between the South West and the South
East is that in the former performance is consistent. The South West is the only region where no councils are
in the Low category for Local Conditions. Bristol scores lowest, just falling into the Average category, though
it is 10th lowest overall for Place & Environment.
Returning to Bath, it is a very balanced performer across domains. It’s best ranking is 12th for People &
Community, and it ranks 15th for Mental & Physical Health. The only subdomain where it has a Low score is
Community Cohesion, but this is compensated for by an exceptionally high Culture score (third best in the
country).
And indeed, it’s because of the Culture domain that the South West does so well on People & Community.
Aside from Bath, five other authorities are in the Highest category for Culture, including Cornwall (which
ranks sixth overall), Dorset (12th), Gloucestershire, Devon and Torbay. Participation is also generally very
high in the region, led by Devon (fifth overall in the country).
The South West also does very well in terms of Local Environment, Devon again leading the way (fourth
overall in the country), followed immediately by Bournemouth and Swindon (fifth and sixth in the country).
These latter two councils are of particular interest given that it is rural areas that tend to do best on this
subdomain. North Somerset comes in ninth overall. Perhaps more surprising are the high scores for Adult
Education. Plymouth – which scores below average overall – is second best in the country for Adult Education.
Wiltshire also does very well (13th place overall), which is surprising for a rural county.
What are the South West’s weak spots? Most of them fall in the Work & Local Economy domain. Five out of
the 15 local authorities are in the Lowest category for Local Business. Plymouth, here, does very poorly –
ranking fourth from bottom in England. Meanwhile, Torbay, Cornwall, Plymouth and Somerset are all in the
Lowest category for Good Jobs – Torbay is fifth from bottom in the country.
Beyond the Work & Local Economy domain, it’s also worth noting that Plymouth is in the Lowest category for
Children’s Education (contrasting with its high score for Adult Education). Bristol and Swindon are seventh
25 LAs in the South West Region: Bath and North East
Somerset, Bournemouth, Bristol, Cornwall, Devon, Dorset,
Gloucestershire, North Somerset, Plymouth, Poole,
Somerset, South Gloucestershire, Swindon, Torbay,
Wiltshire. Not included: Isles of Scilly
page 41 of 86 February 2018

THRIVING PLACES FULL REPORT | Powered by Happy City
and eighth worst on Safety in the country. Torbay also scores very low on Overall Health Status – 13th from
bottom.
Perhaps the most interesting aspect of the South West is its ability to combine good scores on Local
Conditions with good scores on Sustainability and Equality. The South West is the best scoring region for both
these core elements. Of the six LAs in the country that achieve high scores on all three core elements, four
are in the South West: Bath and North East Somerset, Dorset, South Gloucestershire and Devon.
Nowhere in the South West is in the Lowest category for any of the core elements. The only scores in the Low
category are for Equality in North Somerset and Swindon. Bournemouth ranks second in the country for
Sustainability, with high scores for all indicators within this element. Top score for Equality in the region is
Devon – ranking fourth overall in the country. Poole comes sixth overall.
5.1.3 The Best Places To Thrive?
As already highlighted, Happy City’s TPI is not designed to be used as a league table. It creates domains in
order to help prioritise action, not create winners and losers. Yet it is also designed to help encourage greater
sharing of good practice, and as such it can be used to unearth places that are succeeding in creating the
conditions for equitable and sustainable wellbeing.
With such different patterns for Local Conditions, Sustainability and Equality, you might speculate that it is
impossible for any local authority to score well on all three. For example, Wokingham, which comes top for
Local Conditions, scores Low for Sustainability. Tower Hamlets - which is top for Sustainability - scores Low
for both Local Conditions and Equality.
Nevertheless, six local authorities successfully achieve high scores in all three core elements: Bath and North
East Somerset, South Gloucestershire, Dorset, Devon, Oxfordshire and Kingston upon Thames. As one can
see, four of these are in the South West, and Oxfordshire in the South East is not far from these LAs. These
five LAs are a mix of rural and semi-rural areas, though Kingston-upon-Thames in London is obviously an
interesting exception to this rule.
page 42 of 86 February 2018
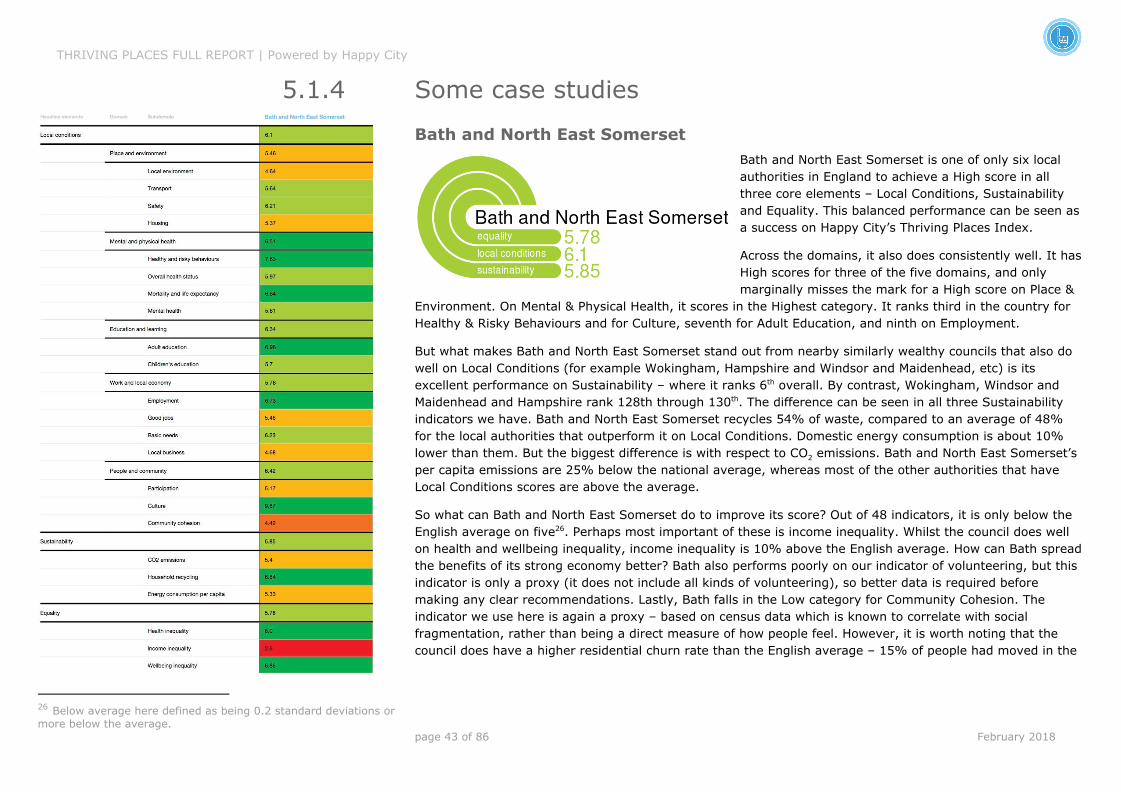
THRIVING PLACES FULL REPORT | Powered by Happy City
5.1.4 Some case studies
Bath and North East Somerset
Bath and North East Somerset is one of only six local
authorities in England to achieve a High score in all
three core elements – Local Conditions, Sustainability
and Equality. This balanced performance can be seen as
a success on Happy City’s Thriving Places Index.
Across the domains, it also does consistently well. It has
High scores for three of the five domains, and only
marginally misses the mark for a High score on Place &
Environment. On Mental & Physical Health, it scores in the Highest category. It ranks third in the country for
Healthy & Risky Behaviours and for Culture, seventh for Adult Education, and ninth on Employment.
But what makes Bath and North East Somerset stand out from nearby similarly wealthy councils that also do
well on Local Conditions (for example Wokingham, Hampshire and Windsor and Maidenhead, etc) is its
excellent performance on Sustainability – where it ranks 6th overall. By contrast, Wokingham, Windsor and
Maidenhead and Hampshire rank 128th through 130th. The difference can be seen in all three Sustainability
indicators we have. Bath and North East Somerset recycles 54% of waste, compared to an average of 48%
for the local authorities that outperform it on Local Conditions. Domestic energy consumption is about 10%
lower than them. But the biggest difference is with respect to CO2 emissions. Bath and North East Somerset’s
per capita emissions are 25% below the national average, whereas most of the other authorities that have
Local Conditions scores are above the average.
So what can Bath and North East Somerset do to improve its score? Out of 48 indicators, it is only below the
English average on five . Perhaps most important of these is income inequality. Whilst the council does well 26
on health and wellbeing inequality, income inequality is 10% above the English average. How can Bath spread
the benefits of its strong economy better? Bath also performs poorly on our indicator of volunteering, but this
indicator is only a proxy (it does not include all kinds of volunteering), so better data is required before
making any clear recommendations. Lastly, Bath falls in the Low category for Community Cohesion. The
indicator we use here is again a proxy – based on census data which is known to correlate with social
fragmentation, rather than being a direct measure of how people feel. However, it is worth noting that the
council does have a higher residential churn rate than the English average – 15% of people had moved in the
26 Below average here defined as being 0.2 standard deviations or
more below the average.
page 43 of 86 February 2018

THRIVING PLACES FULL REPORT | Powered by Happy City
previous year, compared to the English average of only 12%. Whilst this is not atypical of towns, it is a much
higher rate of churn than neighbouring boroughs such as North Somerset and South Gloucestershire.
As noted, four other local authorities achieve a High score on all three core elements: South Gloucestershire,
Doset, Oxfordshire and Kingston upon Thames. Of these four, all except Kingston upon Thames in London are
particularly close to Bath and North East Somerset suggesting a regional pattern.
Lambeth
Lambeth in South London is a perfect example of how Happy City’s TPI
presents a different picture to traditional measures of local conditions,
such as the Index of Multiple Deprivation (IMD). Whilst Lambeth ranks
115th out of 150 local authorities in the IMD, it rises to 72nd place in Local
Conditions. Furthermore, this is complemented by good scores on the
other core elements, 49th overall for Sustainability and third for Equality.
How is this possible? Like many inner London boroughs, Lambeth’s per
capita impact on the planet is below the national average. Per capita
domestic energy consumption is almost 20% below the English average and CO2 emissions are almost half
the English average (though recycling levels leave something to be desired). These results may not be too
surprising. Lambeth’s high ranking on Equality may be more surprising. It can be explained predominantly by
very low health inequality – measured in terms of variation in life expectancy. Lambeth has the fifth lowest
health inequality in England, only bettered by affluent places such as Richmond upon Thames, Bath and
Windsor. It is tempting to wonder whether this is because everyone’s health is bad in Lambeth, but that’s not
the case – average life expectancy is 80.8 years only marginally below the English average of 81.3.
Within the Local Conditions element, Lambeth’s better than expected performance is mostly a result of
indicators that are not included in the IMD. For example has the highest score in the country for Adult
Education, the sixth best score for Local Business, and 11th best for Transport.
But of course, Happy City’s TPI does not ignore the issues which provide challenges for inner city boroughs
such as Lambeth. Lambeth ranks fifth from bottom for Safety – somewhat lower than neighbouring
Southwark, and a lot lower than its other neighbour Wandsworth. It has the second worst youth offending
rate in London (behind Lewisham). It also comes 14th from bottom for Housing – noise being the worst
indicator here. Deprivation affecting older people, road accidents, teenage pregnancies and social
fragmentation are four more indicators where Lambeth scores more than two standard deviations below the
English average.
These low scores make it clear which areas Lambeth needs to focus on to improve its Local Conditions and
the wellbeing of its residents.
page 44 of 86 February 2018

THRIVING PLACES FULL REPORT | Powered by Happy City
Herefordshire
Herefordshire is an interesting county council to explore. Overall, in
Local Conditions, it ranks 32nd. Not a terrific score, albeit the best placed
authority in the West Midlands. But it presents quite an unusual picture.
It has the highest score in England for People & Community – a feature
typical of rural councils. But unlike most rural local authorities – for
example Leicestershire, which ranks four places higher overall – it
achieves this not because of a particularly strong Community Cohesion
score, but rather due to high scores on Culture (it ranks fifth overall),
and Participation (ranking 15th).
Also, unlike many rural areas, Herefordshire’s weakest score is for Place & Environment, where it scores
slightly below the English average. Like many other rural areas, its weakest score is Transport – where it is
fifth from bottom. But it also scores low on Safety and Housing. Indeed, in the case of Housing, its score is
similar to much more urban local authorities such as Bristol, Coventry and Hammersmith & Fulham. This low
score is driven by one number in particular: 43% of housing is categorised as being in poor condition. This is
the highest percentage in the country (the average is 24%). Whilst there does appear to be a geographic
trend here, as the second highest percentage is for neighbouring Shropshire (40%), Herefordshire’s other
neighbours Gloucestershire and Wiltshire are both at roughly the English average.
Herefordshire’s low Safety score is driven by the 16th highest youth offending rates in the country, ranking it
above Croydon, Tower Hamlets and Manchester, and by far the highest rate for any rural area.
But Herefordshire also has many positive notes. It ranks second best for Local Environment, 16th best for
Mental Health, and 27th for Healthy & Risky Behaviour.
Herefordshire ranks 15th in the country for Equality but only 96th for Sustainability.
page 45 of 86 February 2018

THRIVING PLACES FULL REPORT | Powered by Happy City
Manchester
Manchester comes in fifth from bottom in Local Conditions, with low
scores across the five domains. Whilst fifth from bottom sounds a lot
better than Liverpool – which is at the very foot of the table, their scores
are the same to one decimal place – both scoring 3.1 out of 10.
Manchester is fourth from bottom for both Mental & Physical Health and
People & Community, fifth from bottom for Work & Local Economy, and
eighth from bottom for Place & Environment. Its best performance is for
Education & Learning – but even there it only comes in at 31st from
bottom.
In many ways, Manchester represents the archetypal urban area, with all the challenges that that entails. But
it does have some bright spots in Happy City’s TPI. It scores in the High category for three subdomains:
Transport, Adult Education and Culture. In all three cases, it does significantly better than similar places such
as Birmingham, Liverpool and Leeds. Interestingly, it is Newcastle that performs most similarly on these
subdomains. Comparing to its closest core city – Liverpool – it scores a lot higher for Healthy & Risky
Behaviours, but a lot lower for Employment, Good Jobs, Participation and Safety. Indeed Safety is one of the
worst subdomains for Manchester where it ranks third from bottom. It also ranks joint bottom for Mortality
and Life Expectancy, sixth from bottom for Mental Health, and seventh from bottom for Good Jobs. It has the
lowest score in England for Basic Needs.
It is clear that Manchester has a lot of challenges. But it is also positive to see that it does very well on
Sustainability – ranking 16th overall. This stands in sharp contrast to comparable cities such as Liverpool,
Birmingham or Leeds. Liverpool ranks 98th for Sustainability, whilst the other two large cities are both in the
bottom third of the distribution. In all cases, Manchester has lower domestic energy consumption.
page 46 of 86 February 2018

THRIVING PLACES FULL REPORT | Powered by Happy City
Darlington
Darlington, a town of around 90,000 inhabitants in the North East of
England, ranks 106th out of 150 in Local Conditions, scoring 4.4 out of 10.
Whilst this score is below average, it scores higher than most of its
neighbours in the Tees Valley – only Stockton-on-Tees ranks six places
higher. But what is interesting is that Darlington doesn’t do nearly as
poorly on the Index of Multiple Deprivation (IMD). There it ranks 79th out
of 150, closer to the English average, and much further ahead of its
neighbours. What explains the difference?
Darlington has some quite contrasting scores across the five domains. It scores 5.5 for Place & Environment,
placing it in the top 30 for England. But it scores only 3.3 for Work & Local Economy, placing it in the bottom
30. It is also in the bottom 30 for People & Community.
The low score on People & Community – which is entirely comprised of indicators which are not in the IMD –
goes a long way to explaining why Darlington scores much less well in Happy City’s Local Conditions, than on
the IMD. Like the other local authorities in the Tees Valley area, it scores low on Culture – ranking 17th from
bottom overall (though this is higher than next door Stockton-on-Tees here). It also follows the pattern of low
Participation scores. But perhaps less typical, is that it also scores low on Community Cohesion – scoring 4.9
on this indicator, compared to 6.0 for Stockton-on-Tees.
Other indicators where Darlington scores low include Local Business – 15th from bottom, and Good Jobs – 19th from bottom. Both these are new indicators developed for Happy City’s TPI, and revealing previously
unidentified challenges in Darlington. Indeed, on both these indicators, most of its neighbours also do poorly,
underlying a local trend.
But the North East in general, performs quite well on Place & Environment, and Darlington is typical of that
too. Its best performance is in Housing, where the town ranks second overall in England, nestled between
Wokingham and Windsor and Maidenhead. It scores well above average on three of the indicators here – only
17% of houses are categorised as being in poor condition (compared to 23% in England overall), housing
affordability is high and it has some of the lowest levels of homelessness in the country.
Happy City’s TPI goes beyond the IMD in another way – it considers Sustainability and Equality. Here, further
challenges for Darlington are revealed: it is 12th from bottom for Equality, and 16th from bottom for
Sustainability. Despite being a small borough, it has particularly high health inequality (so do Middlesbrough
and Stockton-on-Tees), and above average inequality in subjective wellbeing. It has higher income inequality
than its neighbours. As for Sustainability, domestic energy consumption is higher than that of any urban LA in
the North East and one of the highest for any urban local authority in the country.
page 47 of 86 February 2018
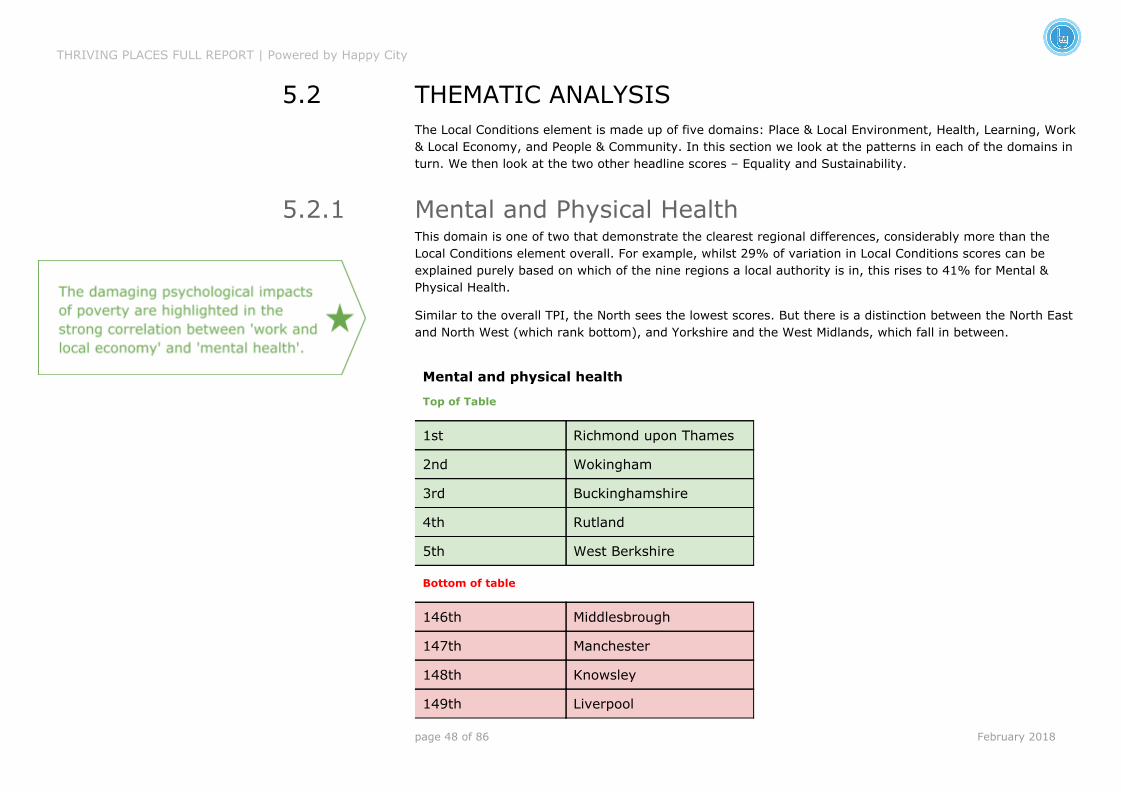
THRIVING PLACES FULL REPORT | Powered by Happy City
5.2 THEMATIC ANALYSIS
The Local Conditions element is made up of five domains: Place & Local Environment, Health, Learning, Work
& Local Economy, and People & Community. In this section we look at the patterns in each of the domains in
turn. We then look at the two other headline scores – Equality and Sustainability.
5.2.1 Mental and Physical Health
This domain is one of two that demonstrate the clearest regional differences, considerably more than the
Local Conditions element overall. For example, whilst 29% of variation in Local Conditions scores can be
explained purely based on which of the nine regions a local authority is in, this rises to 41% for Mental &
Physical Health.
Similar to the overall TPI, the North sees the lowest scores. But there is a distinction between the North East
and North West (which rank bottom), and Yorkshire and the West Midlands, which fall in between.
Mental and physical health
Top of Table
1st Richmond upon Thames
2nd Wokingham
3rd Buckinghamshire
4th Rutland
5th West Berkshire
Bottom of table
146th Middlesbrough
147th Manchester
148th Knowsley
149th Liverpool
page 48 of 86 February 2018
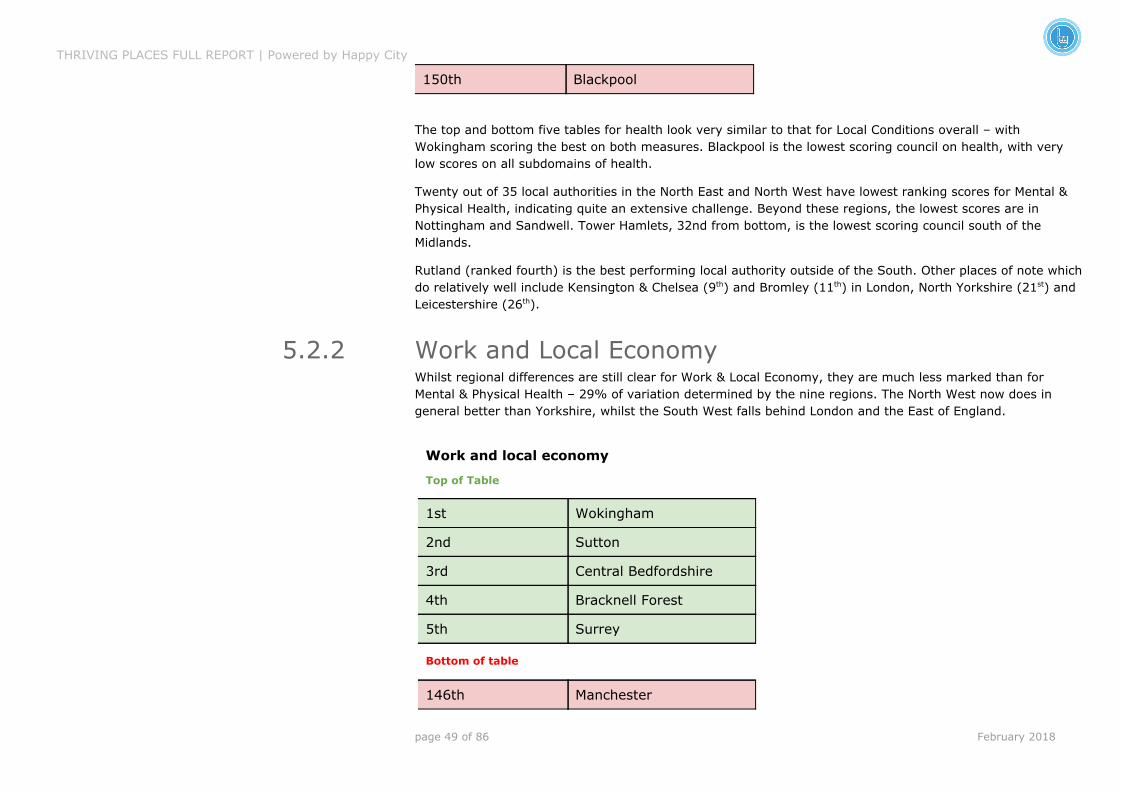
THRIVING PLACES FULL REPORT | Powered by Happy City
150th Blackpool
The top and bottom five tables for health look very similar to that for Local Conditions overall – with
Wokingham scoring the best on both measures. Blackpool is the lowest scoring council on health, with very
low scores on all subdomains of health.
Twenty out of 35 local authorities in the North East and North West have lowest ranking scores for Mental &
Physical Health, indicating quite an extensive challenge. Beyond these regions, the lowest scores are in
Nottingham and Sandwell. Tower Hamlets, 32nd from bottom, is the lowest scoring council south of the
Midlands.
Rutland (ranked fourth) is the best performing local authority outside of the South. Other places of note which
do relatively well include Kensington & Chelsea (9th) and Bromley (11th) in London, North Yorkshire (21st) and
Leicestershire (26th).
5.2.2 Work and Local Economy
Whilst regional differences are still clear for Work & Local Economy, they are much less marked than for
Mental & Physical Health – 29% of variation determined by the nine regions. The North West now does in
general better than Yorkshire, whilst the South West falls behind London and the East of England.
Work and local economy
Top of Table
1st Wokingham
2nd Sutton
3rd Central Bedfordshire
4th Bracknell Forest
5th Surrey
Bottom of table
146th Manchester
page 49 of 86 February 2018

THRIVING PLACES FULL REPORT | Powered by Happy City
147th Nottingham
148th Hartlepool
149th Middlesbrough
150th Kingston upon Hull
Wokingham again scores highest, but behind it there are some interesting results. Second place goes to the
South London borough of Sutton. This can be primarily explained by the borough having the highest
proportion of people in ‘good jobs’. These are defined as jobs that pay Living Wage, are permanent (if the
employee wants permanent work), full-time (if the employee want full-time work) and do not involve
extremely long hours (over 49 hours a week). 63% of the labour force in Sutton have good jobs, compared to
an English average of 53%. Bracknell Forest, which also has a good job employment rate of 63% comes in
fourth place.
Third place goes to Central Bedfordshire which had the lowest unemployment rate in the whole of England at
the time of data collection (just ahead of Wokingham), and the fifth highest level of local business.
The East coast of England dominates the bottom of the table, Kingston upon Hull, Middlesbrough and
Hartlepool taking the bottom three spots. Kingston upon Hull has the third lowest score for unemployment
and for deprivation, as well as the lowest score for local business. Hartlepool has the lowest score both in
terms of standard measures of unemployment, and for our new good jobs indicator (only 42% of the labour
force have good jobs). Two local authorities in the South West score lowest – Plymouth (which ranks 18th from bottom overall) and Torbay. The Isle of Wight, Portsmouth and Southampton don’t score much better.
Tower Hamlets has the lowest score in London.
Unlike with Health, rural areas are not immune to low scores on Work & Local Economy. North East
Lincolnshire is seventh from bottom, Cornwall also scores low on this domain, and Norfolk similarly.
Contrastingly, North Yorkshire – one of the most rural parts of the country – actually does fairly well,
achieving a high score, the best in the North, outperforming York, Trafford and Cheshire East. Other
surprisingly positive areas include Wandsworth (12th) and Leicestershire (22nd).
page 50 of 86 February 2018

THRIVING PLACES FULL REPORT | Powered by Happy City
5.2.3 Education and Learning
It is Education & Learning which is most strongly shaped by regional differences – 36% of variation
attributable to GOR. But the pattern is not quite the same as for overall Local Conditions. For Education &
Learning, London now rises to perform almost as well as the rest of the South East. And, overall the West
Midlands falls below all other regions by quite some way.
Education and learning
Top of Table
1st Trafford
2nd Richmond upon Thames
3rd Kingston upon Thames
4th York
5th Southwark
Bottom of table
146th Bradford
147th Liverpool
148th Knowsley
149th Wolverhampton
150th Sandwell
Furthermore, the top scoring local authority is not in the South. Trafford, in the greater Manchester area, has
the best score overall on this domain. This is particularly driven by the excellent results of schoolchildren in
Trafford – 71% achieving five or more GCSEs A* to C, compared to an English average of 57%. But adult
education is also very high here, and more adults are engaged in lifelong learning here than in other LAs
which achieve high children’s qualifications (e.g. Kingston upon Thames, which has the best GCSE results).
Kingston upon Thames takes third place overall, behind neighbouring Richmond upon Thames (which also
does very well on children’s education). For fourth place we return North, to York. Then fifth place falls to the
page 51 of 86 February 2018

THRIVING PLACES FULL REPORT | Powered by Happy City
Inner London borough of Southwark. Southwark has many challenges – it scores lowest on four out of the 17
subdomains. But Education & Learning is a bright spot in the borough. Its results for children’s education are
very high, and it has the fourth highest score on adult education.
London boroughs dominate this domain. Three of the top five councils are in London, and 20 out of the 32
London boroughs score high or highest. Indeed, the top of the table is dominated by urban areas. The best
ranking areas that are not purely urban are Buckinghamshire (ninth) and Surrey (10th).
Having said that, the bottom of the table is also dominated by urban councils. Sandwell and Wolverhampton
in the West Midlands take the bottom two spots, followed by Knowsley and Liverpool in Merseyside. For the
West Midlands, it seems to be adult education which is the weakest subdomain, with four of the bottom five
local authorities in this subdomain being found in the West Midlands metropolitan area. Generally, this seems
to be driven by the low levels of qualifications amongst adults – for example 25% of adults in Sandwell have
no qualifications.
Looking at the bottom of the table for this domain, there probably aren’t too many surprises for most people.
Education & Learning seems to be a pressure point for Peterborough, which ranks 18th from bottom on this
indicator.
page 52 of 86 February 2018

THRIVING PLACES FULL REPORT | Powered by Happy City
5.2.4 Place and Environment
Place & Environment is a broad domain which includes four distinct subdomains: Safety, Housing, Transport
and Local Environment. Three of these subdomains – safety, local environment and transport – are influenced
strongly by levels of urbanisation. But while two of them – safety and local environment – strongly favour
rural areas, transport scores are considerably better in urban ones. As such, local authorities that do well on
this subdomain have to do so by achieving a balance between these four, often conflicting, subdomains.
Regional patterns are not so clear – only 24% of variation explained by regional analysis. Furthermore the
patterns that do exist are somewhat different to those for other domains. The North East scores almost as
highly as the South East and South West. And London has by far the lowest score at the regional level.
Place and environment
Top of Table
1st Wirral
2nd Bracknell Forest
3rd Central Bedfordshire
4th Thurrock
5th Wokingham
Bottom of table
146th Nottingham
147th Islington
148th Hackney
149th Westminster
150th Kensington and Chelsea
page 53 of 86 February 2018
THRIVING PLACES FULL REPORT | Powered by Happy City
The top five table certainly presents some surprises. In top spot is the Wirral, across the Mersey from
Liverpool. As noted above, this is not achieved by scoring particularly highly on any one subdomain, but by
achieving a balance. The Wirral ranks 10th for local environment (which is measured in terms of use of
outdoor space for health or exercise), 22nd for safety and housing, and only 67th for transport.
Bracknell Forest takes second spot on this subdomain. It scores higher than the Wirral in terms of safety and
housing (ninth and eighth respectively), but does worse in terms of transport. A similar pattern explains
Central Bedfordshire’s third place. Thurrock is a rather surprising fourth place on this subdomain. It does
reasonably well on safety, but the main reason is that it has the highest score for local environment. 37% of
respondents said they use outdoor space for health and exercise reasons, compared to only 18% for England
overall. Having said that, we are a little bit cautious about over-interpreting this finding – as the question only
asks about use of outdoor space for health and exercise reasons, not, for example, because a person likes
being in outdoor space, or because they typically use outdoor space to get about.
Wokingham – which has the highest score on the housing subdomain, takes fifth place on the overall domain
because of its low score on transport (20th from bottom). The same goes for Rutland with the highest score
for safety, but second lowest overall for transport.
Nevertheless, it is fair to say the overall balance of this domain favours semi-rural areas. The bottom four
local authorities are all inner city London boroughs – with wealthy Kensington and Chelsea taking the bottom
spot. For these boroughs, low local environment, housing and safety scores combine to bring the domain
score down. For example, Islington scores second best for transport (behind neighbouring Camden), but it
scores fourth worst for housing. The only two London boroughs to get high scores on this domain are the
outer London boroughs of Kingston upon Thames and Havering.
Nottingham has the lowest score on this domain outside of London, driven by having the lowest levels of
safety in England. Bristol is 10th from bottom, also due to a low score on the safety subdomain.
Returning to the top of the table, there are some notable positive scores. Stockton-on-Tees in the North East,
which ranks 100th overall, is sixth best for Place & Local Environment. It comes third for use of local
environment, and ninth for housing. This high score is particularly interesting as the LA is predominantly
urban. Dorset ranks ninth overall, as it ranks fourth for safety.
5.2.5 People and Community
As noted earlier, the People & Community domain – comprising participation, culture, and community
cohesion – represents the biggest departure from traditional models of deprivation and assessments of which
local authorities are scoring high or low. For this, the first England-wide Happy City TPI, it has been a
challenge to identify suitable indicators to populate this domain, and some of the proxies we have identified
are only satisfactory (the Welsh TPI which we have developed using a similar framework includes much better
page 54 of 86 February 2018
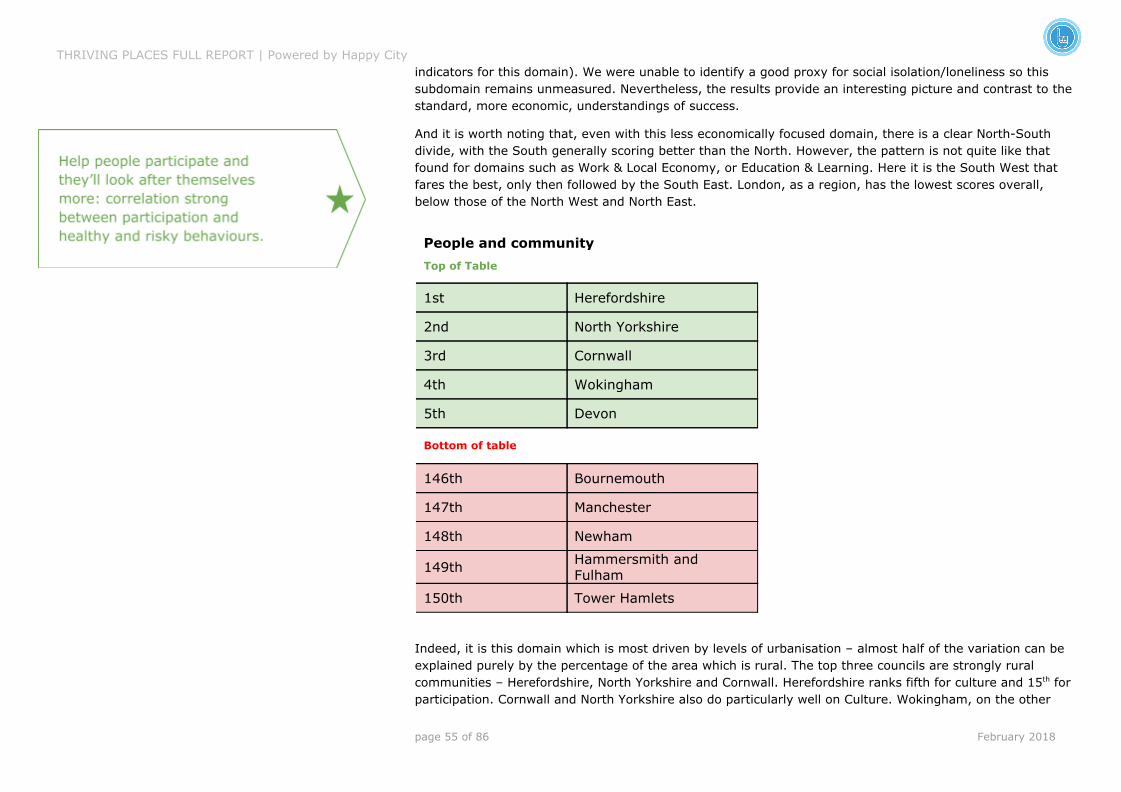
THRIVING PLACES FULL REPORT | Powered by Happy City
indicators for this domain). We were unable to identify a good proxy for social isolation/loneliness so this
subdomain remains unmeasured. Nevertheless, the results provide an interesting picture and contrast to the
standard, more economic, understandings of success.
And it is worth noting that, even with this less economically focused domain, there is a clear North-South
divide, with the South generally scoring better than the North. However, the pattern is not quite like that
found for domains such as Work & Local Economy, or Education & Learning. Here it is the South West that
fares the best, only then followed by the South East. London, as a region, has the lowest scores overall,
below those of the North West and North East.
People and community
Top of Table
1st Herefordshire
2nd North Yorkshire
3rd Cornwall
4th Wokingham
5th Devon
Bottom of table
146th Bournemouth
147th Manchester
148th Newham
149th Hammersmith and
Fulham
150th Tower Hamlets
Indeed, it is this domain which is most driven by levels of urbanisation – almost half of the variation can be
explained purely by the percentage of the area which is rural. The top three councils are strongly rural
communities – Herefordshire, North Yorkshire and Cornwall. Herefordshire ranks fifth for culture and 15th for
participation. Cornwall and North Yorkshire also do particularly well on Culture. Wokingham, on the other
page 55 of 86 February 2018

THRIVING PLACES FULL REPORT | Powered by Happy City
hand, occupies fourth place despite a lowest score in Culture - which is compensated for by the highest
Participation score in England (voting and volunteering).
Cheshire West & Chester – in sixth place - is the highest ranking local authority that is clearly more urban
than rural. Other councils doing well are Devon, Norfolk, Rutland and West Sussex.
Within London, Bromley is the top scoring borough, ranking 20th overall. Cumbria is another interesting
surprise for this domain (13th overall for the domain), thanks to a highest ranked Culture score.
The bottom of the table is dominated by inner city London boroughs: Tower Hamlets, Hammersmith and
Fulham, and Newham. For all three boroughs, there are lowest level scores for Community Cohesion, and low
to average scores for the other two subdomains. Manchester comes fourth from bottom, the lowest score
outside of London. Other low scoring areas outside London include Bournemouth (fifth from bottom), Kingston
upon Hull (10th from bottom), and Salford.
5.2.6 EQUALITY AND SUSTAINABILITY
Alongside Local Conditions, we also calculate scores for all local authorities on sustainability and equality.
These categories are comprised of fewer indicators than the local conditions, but they are no less important.
There is no point achieving good conditions for wellbeing in an area if it is at the expense of future
generations. Also, when these results are achieved unequally, this highlights risks for social sustainability.
Broadly speaking, results in terms of Equality correlate with the Local Conditions overall – places that achieve
high local conditions scores also tend to be more equal. But this is not the case when it comes to
Sustainability.
Equality
Equality is measured based on three elements – income inequality amongst workers, health inequality
between neighbourhoods, and inequality in subjective wellbeing.
Perhaps surprisingly, there is a North-South gradient for this category as well, with the lowest scores at the
regional level in the North West and Yorkshire, and the highest scores in the South West, West Midlands and
London. Looking at a map, there are some more interesting geographical patterns worth noting. There is an
arc of high inequality curving round from the Tyne & Wear Metropolitan area, through Cumbria, the North
West and West and South Yorkshire.
page 56 of 86 February 2018
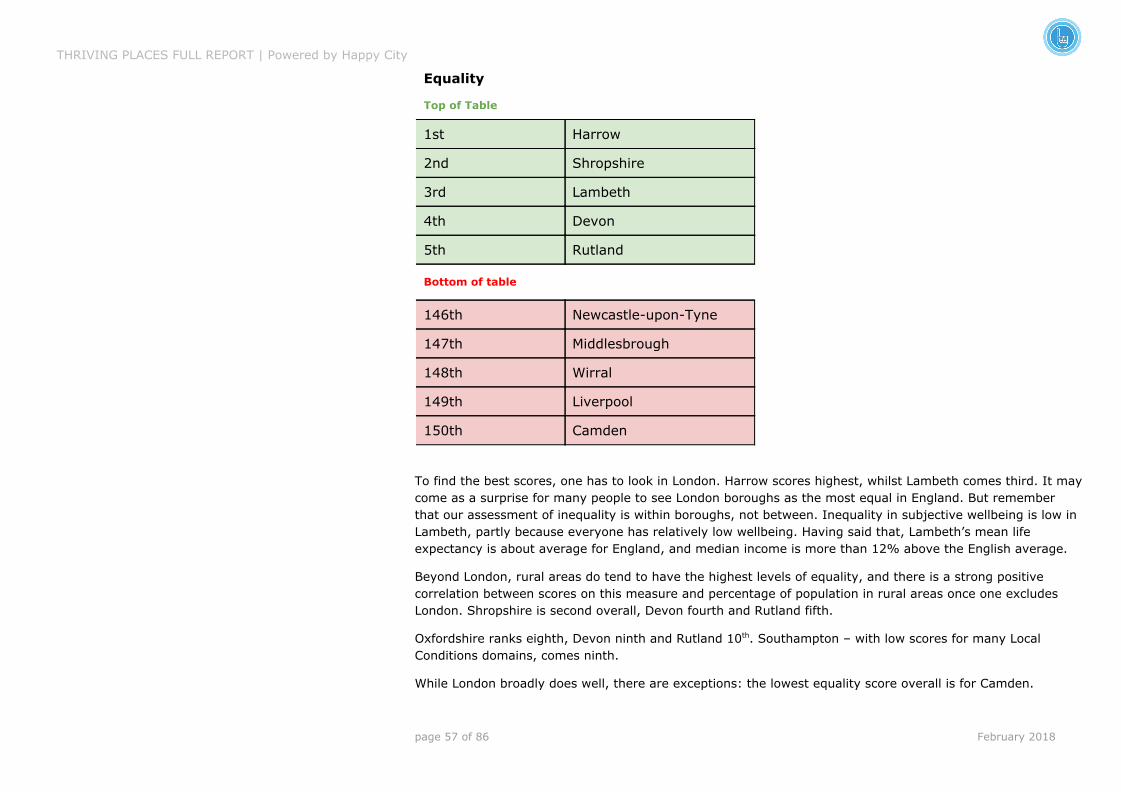
THRIVING PLACES FULL REPORT | Powered by Happy City
Equality
Top of Table
1st Harrow
2nd Shropshire
3rd Lambeth
4th Devon
5th Rutland
Bottom of table
146th Newcastle-upon-Tyne
147th Middlesbrough
148th Wirral
149th Liverpool
150th Camden
To find the best scores, one has to look in London. Harrow scores highest, whilst Lambeth comes third. It may
come as a surprise for many people to see London boroughs as the most equal in England. But remember
that our assessment of inequality is within boroughs, not between. Inequality in subjective wellbeing is low in
Lambeth, partly because everyone has relatively low wellbeing. Having said that, Lambeth’s mean life
expectancy is about average for England, and median income is more than 12% above the English average.
Beyond London, rural areas do tend to have the highest levels of equality, and there is a strong positive
correlation between scores on this measure and percentage of population in rural areas once one excludes
London. Shropshire is second overall, Devon fourth and Rutland fifth.
Oxfordshire ranks eighth, Devon ninth and Rutland 10th. Southampton – with low scores for many Local
Conditions domains, comes ninth.
While London broadly does well, there are exceptions: the lowest equality score overall is for Camden.
page 57 of 86 February 2018
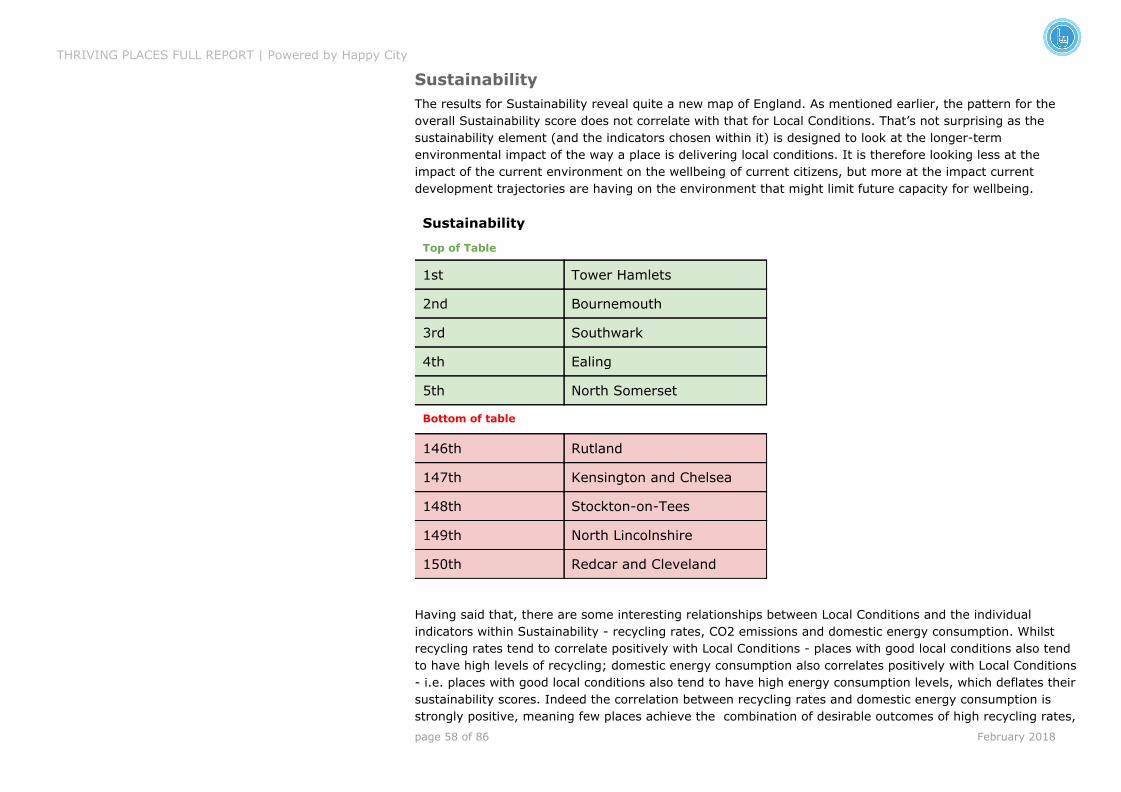
THRIVING PLACES FULL REPORT | Powered by Happy City
Sustainability
The results for Sustainability reveal quite a new map of England. As mentioned earlier, the pattern for the
overall Sustainability score does not correlate with that for Local Conditions. That’s not surprising as the
sustainability element (and the indicators chosen within it) is designed to look at the longer-term
environmental impact of the way a place is delivering local conditions. It is therefore looking less at the
impact of the current environment on the wellbeing of current citizens, but more at the impact current
development trajectories are having on the environment that might limit future capacity for wellbeing.
Sustainability
Top of Table
1st Tower Hamlets
2nd Bournemouth
3rd Southwark
4th Ealing
5th North Somerset
Bottom of table
146th Rutland
147th Kensington and Chelsea
148th Stockton-on-Tees
149th North Lincolnshire
150th Redcar and Cleveland
Having said that, there are some interesting relationships between Local Conditions and the individual
indicators within Sustainability - recycling rates, CO2 emissions and domestic energy consumption. Whilst
recycling rates tend to correlate positively with Local Conditions - places with good local conditions also tend
to have high levels of recycling; domestic energy consumption also correlates positively with Local Conditions
- i.e. places with good local conditions also tend to have high energy consumption levels, which deflates their
sustainability scores. Indeed the correlation between recycling rates and domestic energy consumption is
strongly positive, meaning few places achieve the combination of desirable outcomes of high recycling rates,
page 58 of 86 February 2018
THRIVING PLACES FULL REPORT | Powered by Happy City
low energy consumption and low CO2 emissions. The only two LAs which achieve a High score on all three
indicators are Bournemouth in the South East, and Ealing in West London.
As a result, no LA can be said to do really well on Sustainability - there are no LAs that are bright green on
the map. Having said that, the bottom five LAs are all red on the map - mostly due to astronomically high
CO2 emissions. The three lowest scoring LAs are all heavily industrialised, and relatively deprived, areas.
Redcar & Cleveland takes bottom spot, thanks to its CO2 emissions – per capita emissions are over 10 times
higher than the England average. These emissions are associated with large industrial sites. It may be that
the recent closure of the steelworks in Redcar may lead to these emissions falling (the latest data available
publicly is from 2015, the year that the steelworks closed down).
After Redcar & Cleveland comes the predominantly rural North Lincolnshire, also due to industrial CO2
emissions, probably from the Tata steel works. Rutland, 5th from bottom, tells a similar story.
Kensington and Chelsea, fourth from bottom, does poorly for different reasons. Whilst CO2 emissions are
also above the English average, this is not due to industrial facilities. The very high domestic energy
consumption in the London borough is instead the driving factor, alongside below average recycling rates.
Most of these places are somewhat anomalous unusual LAs. Predominantly, low scores on Sustainability are
driven by high energy consumption, particularly in rural areas. Relatively affluent Northern rural areas, such
as Cumbria and North Yorkshire tend to do worse than similar rural areas in the south perhaps due to climate.
Which parts of the country score best on Sustainability? Of the 23 LAs that have High scores on Sustainability,
nine are in London, seven are in the South West, three are in the South East, two are in the North West, and
one each in Yorkshire and the Humber, and the East Midlands.
Top spot goes to the Inner London borough of Tower Hamlets, with Southwark and Ealing in 3rd and 4th
spots respectively. In the case of Tower Hamlets and Southwark, this can be explained by very low domestic
energy consumption - the lowest and third lowest emissions in the country respectively. That’s not surprising
given the smaller hoses and lower median incomes of these two inner city boroughs. Ealing’s high score, as
noted earlier, is due to a more balanced profile, doing better than the English average on all three
Sustainability indicators. Indeed the profile for Ealing is very similar to 2nd placed Bournemouth, on the
South coast.
It is also worth noting the cluster of High scores in the South West. North Somerset, Bath and North East
Somerset, Bristol and South Gloucestershire are all in the top 12 for Sustainability. All four present relatively
balanced profiles for sustainability, with domestic energy consumption in particular below the English average
for all four.
page 59 of 86 February 2018

THRIVING PLACES FULL REPORT | Powered by Happy City
5.2.7 Key Thematic Correlations
● The Local Conditions Element overall correlates moderately with equality (R=0.38), but not at all with
Sustainability. That means that we can divide LAs into four quadrants – good conditions, sustainable; good
conditions, unsustainable; bad conditions, sustainable; bad conditions, unsustainable. The table below shows
a few examples of each:
Bad Conditions Good Conditions
Unsustainable Redcar & Cleveland
Blackpool
Sunderland
Birmingham
Rutland
Wokingham
Hampshire
Richmond upon Thames
Sustainable Tower Hamlets
Manchester
Kingston upon Hull
Leicester
Bath and North East Somerset
North Somerset
Oxfordshire
Kingston upon Thames
● In general, there is high inter-correlation between domains, in particular between Work & Local Economy on
the one hand, and Mental & Physical Health on the other (R=0.86). that means that there aren’t any
trade-offs between domains.
● However, Sustainability correlates negatively with Place & Environment (R=-0.32), and People & Culture
(R=-0.25). That’s particularly to do with the subdomains of Housing, Safety and Community Cohesion. Places
with few housing problems, less crime and less community cohesion tend to be less sustainable (R=-0.44,
-0.36 and -0.39 respectively). While this is probably a lot to do with rurality – more rural areas tending both
to be less sustainable and having better Housing, Safety and Cohesion, all these subdomains seem to
correlate with Sustainability (negatively) more than our proxy for rurality (percentage of area which is rural).
Indeed in a regression, the best predictor of sustainability is Housing (negatively).
page 60 of 86 February 2018

THRIVING PLACES FULL REPORT | Powered by Happy City
● Of course, most subdomains also positively inter-correlate, and those correlations are typically strongest for
subdomains within one domain. (e.g. Overall Health Status with Mortality & Life Expectancy – R=0.83).
Having said that, the strongest correlations between subdomains are actually across domains, with Basic
Needs correlating better with three of the Health subdomains – Mortality & Life Expectancy (R=0.87), Overall
Health Status (R=0.84) and Healthy & Risky Behaviours (R=0.83), than they do with each other. This
highlights the importance of economic conditions in determining health outcomes.
● Beyond those, other strong cross-domain correlations are:
○ Children’s Education and Mortality & Life Expectancy (R=0.75)
○ Community Cohesion and Housing (R=0.74)
○ Safety and Basic Needs (R=0.72)
○ Participation and Healthy & Risky Behaviours (R=0.68)
The last of these is particularly interesting, as it shows a correlation between behaviours in different domains
– specifically voting, volunteering and physical activity)
● Transport significantly correlates negatively with 11 of the 17 other subdomains. The strongest negative
correlations are with Community Cohesion (R=-0.76), Housing (R=-0.62) and Safety (R=-0.54). This means
that ensuring good Transport in a local authority whilst doing well on other domains and subdomains is a real
challenge. Only 11 councils in England achieve good scores for Transport and for Local Conditions overall.
Nine of these are London boroughs, mostly Outer London (Richmond upon Thames is the council with the best
Local Conditions score among them), the other two are Bath & North East Somerset and York.
● Subjective wellbeing correlates positively with all five domains. The strongest correlation is with People &
Community (R=0.69) followed by Place & Environment (R=0.59). Looking within subdomains, Safety
(R=0.66) and Community Cohesion (R=0.62) seem the most important. Transport correlates strongly
negatively (R=-0.72)
page 61 of 86 February 2018

THRIVING PLACES FULL REPORT | Powered by Happy City
5.3 ANALYSIS ALONGSIDE THE INDEX OF MULTIPLE
DEPRIVATION
Happy City’s TPI is not the first measure to assess local conditions for the UK. The Index of Multiple
Deprivation (IMD) has been calculated since 2007, and provides an authoritative assessment of areas in the
UK that suffer deprivation. The fact that it can do so down to the Lower Super Output Area means it is a very
powerful tool for local authorities.
The TPI is not intended to replace the IMD, but offers a more asset based approach to comparing places. It
can help identify thriving places, instead of focusing only on deprivation. It includes assets, rather than just
deficits.
The two indices correlate very strongly (r=0.95) demonstrating the validity of the TPI. But a consideration of
where the two indices diverge leads to some interesting insights. The table below shows the biggest risers
and fallers when considering the Happy City Local Conditions score in contrast to the IMD.
Places with worse scores on Happy City’s TPI compared to IMD
Where Difference between IMD and HCI Why?
Dudley 36 places (74th best in IMD, 110th in HCI) Low scores in Education & Learning, healthy behaviours, and participation
Gateshead 28 places (93rd in IMD, 121st in HCI) Health, particularly healthy and risky behaviours, and local business
Darlington 27 places (79th in IMD, 106th in HCI) People & Community, and local business
North Tyneside 24 places (64th in IMD, 88th in HCI) Health, particularly mental health, and local business
Newcastle 22 places (109th in IMD, 131st in HCI) Health, particularly mental health, and local business
Places with better scores on Happy City’s TPI compared to IMD
Where Difference between IMD and HCI Why?
Lambeth 43 places (115th best in IMD, 72nd in HCI) High scores in Learning (top for adult education), and Work & Local economy (sixth for local business), and transport
Southwark 40 places (118th in IMD, 78th in HCI) High scores in Learning (both adult and children’s education), and transport
Brighton & Hove 38 places (77th in IMD, 39th in HCI) People & Community (particularly participation and culture), and adult education
Haringey 37 places (127th in IMD, 90th in HCI) Work & Local Economy (particularly good jobs and local business), participation, and transport
Waltham Forest 33 places (122nd in IMD, 89th in HCI) Work & Local Economy (particularly Good Jobs and Local Business)
Lewisham 33 places (113th in IMD, 80th in HCI) Learning, local business, and transport
page 62 of 86 February 2018

THRIVING PLACES FULL REPORT | Powered by Happy City
As one can see, there are patterns here – both geographical and thematic. Four of the five biggest fallers are
in the North East, while five of the six biggest risers are in London – indeed the two biggest risers are
neighbouring boroughs Lambeth and Southwark, and most London boroughs do better in the TPI than in the
IMD (Hillingdon being an interesting exception, falling 19 places). Thematically, one can see that particular
domains and subdomains explain the changes most of the time. The People & Community domain, for
example, can explain the lower scores of Darlington, and the high scores of Brighton & Hove. This is not
surprising, as this domain perhaps introduces the greatest proportion of novel indicators into the TPI – for
example on volunteering and culture.
The local business indicator (which assesses the percentage of businesses in an area that are not branches of
chains) also frequently helps explain the divergence between the IMD and the TPI – for example being partly
responsible for the low TPI scores in the North East and the high scores in London.
But it is also clear that there are differences in relatively standard areas of policy that the TPI picks up. For
example, the Learning domain explains high scores in London, and the big fall in score for Dudley, while our
Health domain (which includes mental health and healthy behaviours) explains many of the big fallers.
page 63 of 86 February 2018
THRIVING PLACES FULL REPORT | Powered by Happy City
6 USES OF HAPPY CITY’S TPI Happy City’s TPI is designed to be used. It is not a PR stunt, a campaign tool, or merely some interesting
research to add to the office shelf.
It is designed to support both a radical system change in how we run the society of tomorrow AND support
TODAY’s change-makers from local government, business and civil society, to start to better monitor local
progress and implement policies that improve people’s wellbeing in the here and now.
With this in mind, the TPI has been designed to be used in the following ways:
6.1 DELIVER ‘BIG PICTURE’ CHANGE
Including:
● Challenge the current paradigm which sets the compass of progress towards how much we grow consumption
by the many, wealth for the few and use of earth’s resources
● Grow recognition of how what we measure influences what we value, and therefore the direction in which we
develop
● Provide better measures of what people most ‘value’ and help make those measures more widely used –
starting with the local scale
● Challenge society to measure more of what matters – thus growing the number of quality indicators of real
progress year on year
The TPI can deliver these four interconnected aims here and now, using a practical methodology that shifts
the focus at a local level. It shows the impact of measuring more of what we value and using that to guide
decisions. By being open about the imperfections of our current indicators, we also aim to support continual
improvement in the quality of the data we gather on the conditions for thriving places now and in the future.
6.2 LOCAL PRACTICAL USES:
Alongside these big picture aims of the TPI, there is a range of practical and immediate uses at a local scale
across the UK:
1. Common goal: Monitor local progress towards delivering the conditions for equitable, sustainable wellbeing
and use the framework as a shared roadmap towards it
page 64 of 86 February 2018

THRIVING PLACES FULL REPORT | Powered by Happy City
2. Collaborative: Develop integrated local wellbeing policy across and between sectors
3. Localised: Develop and deliver tailored policies and initiatives to improve local conditions for wellbeing
4. Innovative: Highlight innovative and successful policies and practice
5. Progressive: Encourage responsible progress towards better shared goals
Together, these five uses of the TPI can create a powerful force towards implementing joined-up, innovative,
evidenced-based wellbeing policy. More detail about each of these areas is outlined below.
6.2.1 A Universal Measure Of Local Progress
A common goal
Happy City’s TPI enables all local change-makers, from local governments, businesses and NGOs to different
public sector bodies, to have a common measure of wellbeing – a universal indicator of local progress.
A local authority can use this shared standard to see how well they are doing in comparison to other local
authorities. In addition, they can use this overall indicator to monitor their progress over time and compare it
against the progress being made across the UK.
A citizen-based measure of prosperity
All local authorities can use the TPI, regardless of their average income level or levels of poverty and
deprivation. Although many of the local conditions that make up the TPI are determined by economic factors,
this is not always the case. Economic and poverty measures can miss out a lot of important information, such
as how well a place is doing in terms of culture and place, life chances and opportunities, social capital and
trust, and so on. For instance, in the 2017 TPI results, Cornwall scores third highest in the People and
Community domain. This is an important finding that wouldn’t have been picked up by more traditional,
largely economic, measures of progress.
Moreover, citizens themselves do not just describe their lives with reference to their income level and whether
they are poor or not. Instead, citizens tend to think about the conditions that determine their wellbeing, which
are multi-dimensional in nature (health, work, education, place, community, etc.). In order to engage citizens
and communities in local decision-making, we need an overall measure of progress that reflects how people
tend to think about their lives.
Evidence-based policy
We also need a measure of progress that provides local change-makers with policy-relevant information. The
overall measure of progress provided by Happy City’s TPI can be broken down into domains and subdomains
that policymakers can use to improve wellbeing. For instance, on the basis of a low overall score,
page 65 of 86 February 2018

THRIVING PLACES FULL REPORT | Powered by Happy City
policymakers can invest in the wellbeing conditions most in need of improvement, such as education, place or
community. The multi-dimensional nature of the TPI simultaneously provides local authorities with a universal
indicator of progress on the one hand, and captures the complexity of wellbeing and how to improve it on the
other.
Regional change
Lastly, through collecting data for all local authorities across the UK, Happy City’s TPI provides geographical
information about the regions that are generally lowest or highest in wellbeing. This can help inform
policy-making on a national level, in particular forming different urban and rural wellbeing policies. For
instance, in the 2017 TPI results, rural areas tend to do better than urban (and mixed) areas. However, there
are a few particular conditions, such as transport and services and employment, where rural areas fare worse
than urban (and mixed) areas.
Geographical data from the TPI can also help foster regional alliances and partnerships between different local
authorities. For instance, in the 2017 TPI results, there is a large North-South divide, whereby northern
regions tend to have worse wellbeing conditions than southern regions. Local authorities within London tend
to have very low scores within the People and Community domain. This suggests the need for more
investment in northern local authorities in general, and in community conditions within London local
authorities.
6.2.2 Integrated Local Wellbeing Priorities
Collaborative policy making
Leaders in all sectors can prioritise improvements in the overall Local Conditions score of their place by
considering the domains and subdomains that make up that score. These include people’s mental and
physical health, work and local economy, learning and leisure, place and environment, and people and
community. The TPI can enable local governments, and other major local organisations, to come together to
improve wellbeing in two main ways.
Local priorities
Firstly, the common measure enables local authorities to set overall priorities. As mentioned above, on the
basis of a low Local Conditions score, policymakers can invest in the wellbeing conditions that are most in
need of improvement, such as education, place or community. These priorities will be evidence-based and can
be made transparent to all citizens and communities. In short, local authorities can use data from the TPI to
target the kinds of local conditions that are most in need of investment.
page 66 of 86 February 2018

THRIVING PLACES FULL REPORT | Powered by Happy City
Joined-up policy
Secondly, the universal indicator of progress provided by the TPI means that it is in everyone’s interest to
improve the conditions prioritised within a given local authority. For example, if a local authority is doing well
in the Health, Work, Education and Community domains, but not in the Place domain, the most effective way
of improving its overall wellbeing score is to target improvements within the place domain. This encourages
different sectors – health, education, economic development, environmental, etc – to work together the help
improve wellbeing within that domain. All sectors have an interest in working together to achieve these
improvements, which will lift the overall Local Conditions score of the local authority. They may do this in
innovative, joined-up ways.
6.2.3 Tailored Wellbeing Policies For Local Authorities
Localised wellbeing policy
The TPI is made up of several wellbeing domains (five in total), which are in turn made up of several
subdomains (17 in total), which are in turn made up of several wellbeing indicators (48 in total). This means
a local authority can dig deeper into the TPI results to find out how well their citizens are doing in terms of
multiple wellbeing conditions. This data can be used to create tailored wellbeing policies for the local
authority.
An asset-based approach
The strengths and weaknesses of a local authority can be presented on a score chart showing the scores and
categories for each wellbeing indicator, subdomain and wellbeing domain. This provides local authorities with
a clear representation of how well their citizens are doing and the ability to visually engage citizens and
communities in the process of making tailored wellbeing policies. Local authorities may decide to invest in
their particular weakness or capitalise on their particular strengths. Alternatively, they may use their
particular strengths to make up for some of their weaknesses. For example, a local authority that has
regularly accessed green spaces may focus their efforts on encouraging healthy behaviours (such as exercise
and physical activity), social cohesion, or community-led businesses, within those spaces.
‘Keystone’ conditions
A recognised feature of most wellbeing conditions (including people’s subjective wellbeing) is that they are
interconnected. A low score in a particular domain, subdomain or indicator can have adverse impacts on
many other conditions; conversely, a high score can have multiple positive impacts. For instance, mental
health and employment have been shown to have far-reaching effects. Both mental illness and unemployment
have been linked with physical health problems and antisocial behaviour. Although these indicators are
page 67 of 86 February 2018
THRIVING PLACES FULL REPORT | Powered by Happy City
weighted equally in the TPI, policymakers can be particularly aware of the potentially harmful or beneficial
impacts of low or high scores for these conditions.
After implementing tailored policies that may target particular indicators (e.g. mental health and
employment), local authorities can then track progress over time both in terms of the targeted indicators and
any impacts those improvements have on other conditions (e.g. physical health problems, antisocial
behaviour, etc.). Although data from the TPI cannot prove the causal relationships between these indicators,
trends in improvement (or the opposite) are suggestive of ‘keystone’ conditions for improving people’s overall
wellbeing.
6.2.4 Success Stories: Innovative And Effective Local
Wellbeing Policies
Innovative policymaking
In addition to implementing tailored local wellbeing policies, and forming regional (or rural/urban/mixed)
alliances, local authorities can find out from each other what works to improve people’s wellbeing. We have
already discussed potential ‘keystone’ conditions above, which may become apparent over time at a local
level. There may also be particular kinds of wellbeing policies that prove to be effective at improving people’s
wellbeing (either integrated priorities across different public sectors or innovative in other ways). Local
authorities can share the success (or failure) of implemented policies, creating a pooled resource of what
works – and why.
Success stories
One way of finding out whether a local authority is doing something right is to look at unexpected scores in
the TPI results. As mentioned above, many of the local conditions that make up the TPI are determined by
economic factors (this is why local authorities in Northern UK regions tends to score lower than local
authorities in Southern UK regions). However, even within local authorities with lower average income levels
or high levels of poverty and deprivation, we may find relatively high scores for certain wellbeing conditions.
For instance, in the 2017 TPI results, Middlesbrough has the second lowest overall Local Conditions score for
the UK, but has relatively high scores for the subdomains of local environment and housing.
Sharing what works
The most useful unexpected scores for a local authority will be those from other local authorities with similar
economic conditions and demographics. Success stories from these areas are most likely to be replicable in
similar areas, both on an economic and social level. These kinds of findings would ideally be shared within the
page 68 of 86 February 2018

THRIVING PLACES FULL REPORT | Powered by Happy City
kinds of partnerships and alliances discussed above: between regional (or urban/rural) groups of local
authorities.
Lastly, local authorities can use the indicators that make up the TPI to collect past data to show the success
of previously implemented wellbeing policies. For example, a local authority may collect past data to see the
extent to which they have improved in a particular domain (e.g. mental and physical health) and other
domains as a result of an implemented wellbeing policy (e.g. providing increased access to mental health
treatment). In this way, local authorities can build upon (and confirm and share) their existing knowledge of
what works.
page 69 of 86 February 2018
THRIVING PLACES FULL REPORT | Powered by Happy City
7 CONCLUSIONS
AND NEXT STEPS This is the inaugural publication of the national results for England. We have secured sponsorship, from
Triodos Bank to enable us to independently publish annually until at least 2020. This vital support means we
can continue to use this annual publication to highlight the central importance of better measures of progress
at every level of society.
But this is not just an annual progress report to wave at politicians – this is a live project, aiming to support
change, place by place, city by city, region by region, until local governance, UK-wide (and beyond) is driven
by a shared goal of improving the wellbeing of current and future generations. Perhaps then, national and
international governance will follow the lead of pioneering local leaders such as the ones already working with
us (see below), and any of you who would like to join this leading group of thinkers and doers, changing how
things work where you are.
7.1 CURRENT USAGE AND INTEREST
The following is a summary of some of the current activity around the TPI in the UK:
● We are working with the Data Unit Wales and a range of public sector organisations in Wales (see Gwent
below) to develop a TPI for Wales. It is based on the same framework, but adapted for the different context in
the devolved nation, and the different indicator sets they use to capture national progress. This work sits
closely alongside Wales’ pioneering Future Generations Act, which puts the prioritisation of the wellbeing of
current and future generations into law. We are in discussion with the Future Generations Commission to
work much more closely with them to help support stronger and more consistent measurement nationwide.
● We are currently working with five local authorities that make up the Gwent area of south east Wales on a
major pilot of our suite of measurement tools. Alongside publishing the TPI for the five areas, we have been
training their staff to better understand, use and embed the measures into their strategy and delivery. We
have also worked with them to translate the Happiness Pulse tool into the Welsh language, and it is now
being used across their departments and commissioned work to gain a picture of individual wellbeing in
communities across the five authorities. Results of both trials will be shared in April 2018.
page 70 of 86 February 2018
THRIVING PLACES FULL REPORT | Powered by Happy City
● We are in discussion with a further six English local authority areas, from major combined urban authorities to
smaller rural regions, in ways they might embed the TPI framework into their strategic plans, public data
dashboards and reporting mechanisms.
● We are also working with partners interested in using and adapting the TPI model to work in other parts of
the world, including Europe, Asia and South America
● Our partnership with the What Works Centre for Wellbeing is set to strengthen in 2018 as we work much
more closely with them to help local, placed based change with a focus on supporting civil society groups of
every size measure their wellbeing impacts.
7.2 NEXT STEPS
Our measurement tools are always ‘in development’. We always seek to respond to the best current research
into wellbeing, and to make use of the fast evolving world of data capture by incorporating the very best
indicators for any particular domain. For this reason we will continue to work closely with our advisors,
academic and community partners and the What Works Centre for Wellbeing to ensure they are the best they
can possibly be for our users. We feed developmental changes into our tools on an annual cycle. Alongside
this programme of continual improvement we have a few specific developments in the pipeline:
● We are hoping to work more closely with the Local Government Association to be offering closer to ‘real-time’
data within the TPI tool. By partnering with their Inform programme, we plan to offer the capacity for data
updates as and when they are released, and a wider variety of interactive options online for analysing and
visualising local data
● We also have exciting plans to work with a range of partners to develop a bank of best practice examples to
sit behind the TPI. The aim is to help close the loop - from better diagnostics with our tools, to signposting
best practice (in policy, innovation and community action), to supporting change on the ground, to measuring
the impact of that change and so on.
page 71 of 86 February 2018

THRIVING PLACES FULL REPORT | Powered by Happy City
7.3 GET INVOLVED
Happy City’s measurement tools are designed to be used! If you’d like to benefit from using them get in touch
about any of the following ways we can help:
● Detailed data support: We can share with you and your teams the detailed data findings behind your
scorecard, and support them to better understand, analyse and use that data to improve performance and
impact
● Training: We offer training in the use of our tools, in improving practice to grow wellbeing and in supporting
the wellbeing of individuals, teams and communities
● Hyper-local community wellbeing measurement: Our ground-breaking Happiness Pulse is an online subjective
wellbeing measurement tool. It can be used to map the strengths and needs of a place – from a street, to a
team, to an organisation, community or local area – giving insights into the mental, emotional, behavioural
and social wellbeing of all who take it. It is designed to support individuals to understand and improve their
own wellbeing, as well as providing data that can help decision makers tailor support their needs. To find out
more go to our website or get in touch.
page 72 of 86 February 2018

THRIVING PLACES FULL REPORT | Powered by Happy City
8 ACKNOWLEDGMENTS The team behind the TPI
● Ruth Townsley
● Liz Zeidler
● Saamah Abdallah
● Dr Sam Wren-Lewis
● Dave Forman
● Marc George
● Helen Brown (2016/17)
● Elsa Symons (2017/18)
● Phoebe Harris (2017)
● Grace Youell (2017)
Funders and supporters
▪ Joseph Rowntree Charitable Foundation
▪ Tudor Trust
▪ Triodos Bank
▪ Greenhouse PR
▪ Innovate UK
▪ West of England LEP
▪ B2015
▪ Quartet Community Foundation
Partners and Advisory Board members (past and present)
▪ New Economics Foundation
▪ What Works Centre for Wellbeing
▪ University of Bristol
▪ University of the West of England
▪ University of Cambridge
▪ University of Exeter ▪ University of Swansea
▪ Office for National Statistics
▪ What Works Centre for Wellbeing
▪ Public Health England
▪ Happiness Works
▪ Action for Happiness
page 73 of 86 February 2018

THRIVING PLACES FULL REPORT | Powered by Happy City
APPENDICES
1. INDICATORS FOR EACH DOMAIN
2. METHODOLOGY AND CALCULATIONS
3. LINKS AND EVIDENCE PORTALS
page 74 of 86 February 2018

THRIVING PLACES FULL REPORT | Powered by Happy City
1: INDICATORS & SOURCES
Domain Sub-domain Topic Description Source
Place &
environment
Local Environment Exercise Utilisation of outdoor space for exercise/health reasons PHOF
Local Environment Air pollution Combined Air Quality Index (made of the levels of four pollutants) IMD
Transport Public transport breakdown % respondents who go to work by public transport ONS
Transport Active transport breakdown % respondents who go to work through active travel ONS
Transport Car traffic Car vehicle traffic thousand vehicle miles per capita DFT
Transport Distance to services Average of road distance to post office, a primary school, general store or supermarket and GP
surgery
IMD
Transport Traffic accidents Road traffic accidents rate (per 1000 resident and workplace population) IMD
Safety Youth offending First time entrants to the youth justice system (per 100,000) PHOF
Safety Crime severity Crime Severity Index ONS
Housing Poor housing Social and private housing in poor condition (proportion) IMD
Housing Housing affordability Difficulty of access to owner-occupation (local authority district level) – proportion of households
aged under 35 whose income means they are unable to afford to enter owner occupation
IMD
Housing Homelessness rate Number (per 100 households) accepted as being homeless and in priority need under the
homelessness provisions of the 1996 Housing Act
DCLG
Housing Noise Noise complaints (per year per local authority about noise per thousand population) PHOF
Mental &
physical health
Healthy & risky behaviours Obesity/overweight & child
obesity/overweight
% obesity and overweight in children in Year 6 (2014/15) PHOF
Healthy & risky behaviours Underage pregnancies Conceptions in those aged under 16 PHOF
Healthy & risky behaviours Physical activity % of adults doing 150+ minutes physical activity per week PHOF
Overall health status Subjective disability % of those with a reported long term illness disability (that limits day-to-day activities a lot) NOMIS
Overall health status Subjective health % rate health as very good, good, or fair NOMIS
Overall health status Illness and disability Comparative Illness and Disability Ratio – an age and sex standardised measure of morbidity and
disability
IMD
Mortality & life expectancy Life expectancy Life expectancy at birth (years) AVERAGE PHOF
Mortality & life expectancy Years of potential life lost Years of Potential Life Lost – an age and sex standardised measure of premature death IMD
Mortality and life
expectancy
Preventable mortality rate Mortality from causes that are preventable PHOF
Mental health Prevalence of MH disorders Index of all mental health disorders from Fingerprints (Mixed anxiety and depressive, generalised
anxiety, depressive, all phobias, OCD, panic, eating disorders, and PTSD)
PHOF
Mental health Prevalence of long term
mental health disorder
% of respondents to GP Patient Survey reporting a long-term mental health problem PHOF
page 75 of 86 February 2018
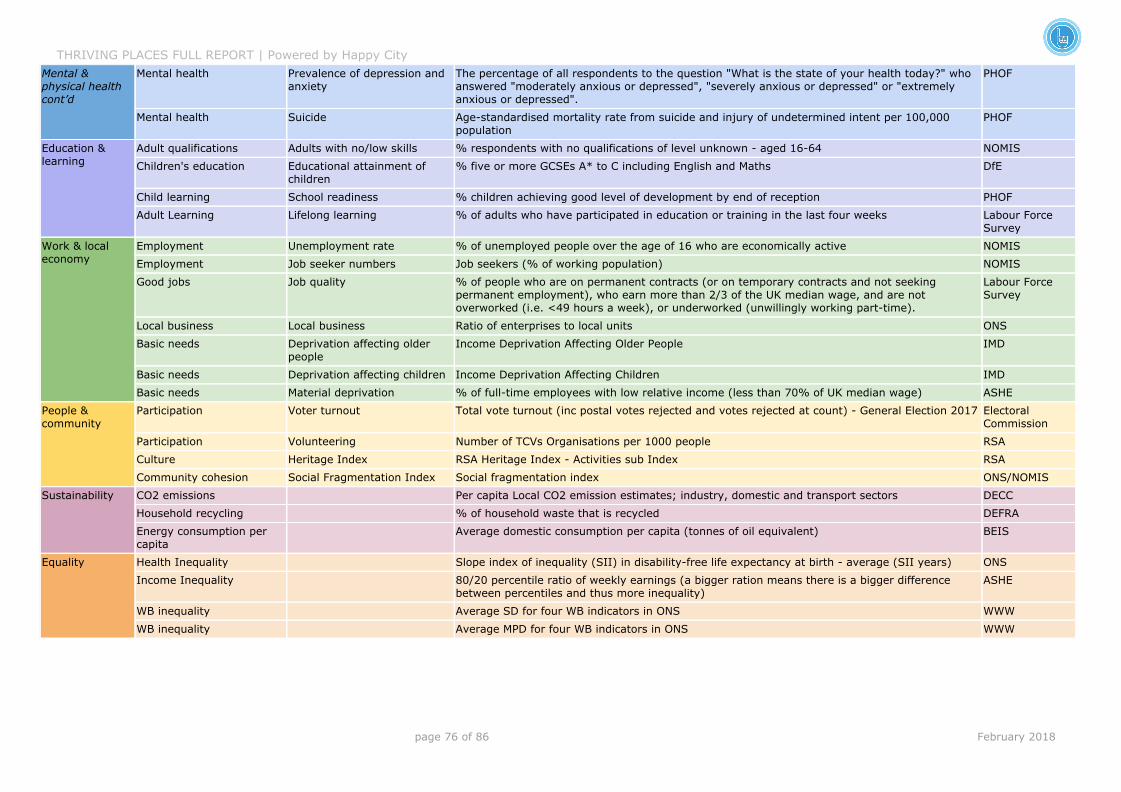
THRIVING PLACES FULL REPORT | Powered by Happy City
Mental &
physical health
cont’d
Mental health Prevalence of depression and
anxiety
The percentage of all respondents to the question "What is the state of your health today?" who
answered "moderately anxious or depressed", "severely anxious or depressed" or "extremely
anxious or depressed".
PHOF
Mental health Suicide Age-standardised mortality rate from suicide and injury of undetermined intent per 100,000
population
PHOF
Education &
learning
Adult qualifications Adults with no/low skills % respondents with no qualifications of level unknown - aged 16-64 NOMIS
Children's education Educational attainment of
children
% five or more GCSEs A* to C including English and Maths DfE
Child learning School readiness % children achieving good level of development by end of reception PHOF
Adult Learning Lifelong learning % of adults who have participated in education or training in the last four weeks Labour Force
Survey
Work & local
economy
Employment Unemployment rate % of unemployed people over the age of 16 who are economically active NOMIS
Employment Job seeker numbers Job seekers (% of working population) NOMIS
Good jobs Job quality % of people who are on permanent contracts (or on temporary contracts and not seeking
permanent employment), who earn more than 2/3 of the UK median wage, and are not
overworked (i.e. <49 hours a week), or underworked (unwillingly working part-time).
Labour Force
Survey
Local business Local business Ratio of enterprises to local units ONS
Basic needs Deprivation affecting older
people
Income Deprivation Affecting Older People IMD
Basic needs Deprivation affecting children Income Deprivation Affecting Children IMD
Basic needs Material deprivation % of full-time employees with low relative income (less than 70% of UK median wage) ASHE
People &
community
Participation Voter turnout Total vote turnout (inc postal votes rejected and votes rejected at count) - General Election 2017 Electoral
Commission
Participation Volunteering Number of TCVs Organisations per 1000 people RSA
Culture Heritage Index RSA Heritage Index - Activities sub Index RSA
Community cohesion Social Fragmentation Index Social fragmentation index ONS/NOMIS
Sustainability CO2 emissions Per capita Local CO2 emission estimates; industry, domestic and transport sectors DECC
Household recycling % of household waste that is recycled DEFRA
Energy consumption per
capita
Average domestic consumption per capita (tonnes of oil equivalent) BEIS
Equality Health Inequality Slope index of inequality (SII) in disability-free life expectancy at birth - average (SII years) ONS
Income Inequality 80/20 percentile ratio of weekly earnings (a bigger ration means there is a bigger difference
between percentiles and thus more inequality)
ASHE
WB inequality Average SD for four WB indicators in ONS WWW
WB inequality Average MPD for four WB indicators in ONS WWW
page 76 of 86 February 2018

THRIVING PLACES FULL REPORT | Powered by Happy City
2: METHODOLOGY & CALCULATIONS
Overall framework
Happy City’s TPI is a set of 48 indicators used to measure how well a local authority is doing in terms of
achieving the drivers of wellbeing – factors which are known to improve people’s wellbeing – and
sustainability and equality.
As well as creating three overall scores (for Local Conditions, Equality and Sustainability), we also create
scores for each of the five domains of Local Conditions, and each of the 17 subdomains, and indeed data on
each individual variable is available in the data file. The number of indicators that make up the TPI (48)
reflects the fact that we wanted to make the TPI as comprehensive as possible without making it too hard to
understand down to its greatest level of complexity.
As noted, the TPI measures the drivers of wellbeing, not wellbeing itself. Wellbeing data (in terms of
subjective wellbeing) is available at the local level and is provided in the data file to complement the TPI. At
the same time, it does not measure the inputs that local authorities invest into achieving the drivers of
wellbeing. So, for example, the TPI includes an indicator on the percentage of adults doing regular physical
activity, but it does not include an indicator on the amount local authorities spend on physical activity
programmes.
Figure 1: The Happy City TPI intends to fill the middle box
in this diagram.
The TPI is designed to provide data at the local authority level. This geographical level allows us to include
indicators which are not available at lower levels (e.g. Super Output Areas), giving us a greater choice of
indicators than similar indices such as the Index of Multiple Deprivation (IMD). In particular, this allows us to
take advantage of some survey data, which is available down to the local authority level, such as data from
the Labour Force Survey.
It is thanks to the survey data that we are able to make the TPI distinct from something like the IMD in two
ways. Firstly, the TPI attempts to look at assets, not just deficits. So it measures the percentage of people in
page 77 of 86 February 2018

THRIVING PLACES FULL REPORT | Powered by Happy City
good jobs (based on data from the Labour Force Survey), rather than just the percentage of people in
employment.
Secondly, it recognises that many determinants of wellbeing are too complex to be measured using objective
data alone. For example, as well as measuring income inequality and health inequality, we also measure
inequality in subjective wellbeing. That’s useful, because there are many factors that determine inequality
within a local authority, and including subjective wellbeing inequality allows us to capture some which are not
easily measured objectively.
Indicator selection
Our starting point for the 2017 TPI was a previous iteration conducted in 2016 for the nine core cities of
England
(see http://www.happycity.org.uk/wp-content/uploads/2016/10/Happy-City-Index-2016-Report-FINAL.pdf). Since then, Happy City has also created a set of local indicators with the What Works Centre for Wellbeing, on
behalf of the ONS and PHE, and an adaptation of the Happy City TPI for five Welsh local authorities. Both
those projects have helped inform the development of this new indicator set.
Five criteria were considered in selecting indicators for this set:
1. Availability. First and foremost, the TPI is something that can be used today. As such, we have drawn on
data that is already available, rather than creating a wishlist of ideal indicators. All the indicators included are
available for all (or almost all) English local authorities. Of course, this rules out any data that local authorities
choose to collect themselves – for example through resident surveys. Nevertheless, the TPI is intended to be
forward-looking, and the selection of domains and subdomains is intended to signal the direction where more
data collection is needed when currently available data is far from ideal. For example, the only indicator on
social isolation at present, refers only to those who are in social care, rather than the population as a whole.
In contrast, in Wales, we have been able to include an indicator of loneliness for the population as a whole –
we hope that such an indicator will become available in England in the future.
2. Related to subjective wellbeing. The TPI measures the drivers of wellbeing. One key requirement for
indicators was that they measure, or were a proxy for something which is known to influence subjective
wellbeing.
3. Valid We only include indicators that are robust. For example, when surveys were concerned, we only used
surveys with sample sizes large enough to provide estimates at the local authority level. Almost all indicators
come from pre-existing official data sets.
page 78 of 86 February 2018

THRIVING PLACES FULL REPORT | Powered by Happy City
4. Regularly updated. Happy City’s TPI is intended to be updated regularly. For that to be the case, the
constituent indicators need to be updated regularly. This is not the case for all indicators – for example some
are based on census data which is only updated every 10 years, but this was a selection criterion.
5. Amenable to local action. As noted, the TPI is intended to be used by local authorities and their partners to
improve local wellbeing. As such, the indicators included need to reflect things that can be influenced by local
action.
STANDARDISATION AND AGGREGATION
Local authorities included
The TPI covers all 150 upper-tier local authorities in England. That means it includes counties (but not
districts), unitary authorities, London and metropolitan boroughs. It does not include the two sui generis
councils of City of London and Isles of Scilly because many indicators are not available for them.
Data collection
First, values for all 150 local authorities for all 48 indicators were sourced. In most cases indicators were
readily available, or rates were simply calculated by dividing counts by the population of a local authority. In
some cases, basic bespoke calculation was required:
● Crime Severity Index
To calculate the Crime Severity Index for a particular local authority we first used the number of incidents for
all 158 different ‘categories’ of crime (eg. criminal damage to a vehicle) for each local authority and calculated
a rate per 1000 people. Then we used weightings from ONS that indicate the severity of the crime. The ONS
calculated these weightings based on average sentences associated with each crime category. Then for each
of these categories, we multiply the rate per 1000 people by the weighting of the crime. Then to calculate the
Crime Severity Index for an area we summed all these values across all the crime categories.
● Distance to services
In this case, the data available was average road distances to a post office, primary school, general store or
supermarket and GP surgery, each in kilometres. We took a simple average of these four values, to generate
our Distance to Services indicator.
● Mental health disorders
page 79 of 86 February 2018

THRIVING PLACES FULL REPORT | Powered by Happy City
With data containing the separately estimated prevalence of eight mental health disorders (Mixed Anxiety and
Depressive Disorder, Generalised Anxiety Disorder, Depressive Episode, All Phobias, Obsessive Compulsive
Disorder, Panic Disorder, Eating Disorder and Post-Traumatic Stress Disorder), we took an average of them.
● % of full-time employees with low relative income
Firstly, we took ‘low relative income’ to be an income that is less than 70% of the UK median wage. We used
weekly pay figures from 2016. The UK median weekly wage was £538.7 so for each of the 152 local
authorities we were looking for the percentage of people who work full-time and earn less than £377.09
weekly. We estimated a logarithmic best-fit line for the relationship between percentiles and income. This was
using data at percentiles 10, 20, 25, 30, 40, 60, 70, 75, 80 and 90 where available – some areas didn’t have
data for the 90th percentile for example (using the LOGEST function in Excel). Then we could estimate the
percentage of those with ‘low relative income’ using this best-fit line and finding the percentile value that
corresponds to the income value of £377.09.
● Local business
The data needed for this indicator was simply the number of enterprises and the number of local units for
each local authority. Then we divided the number of enterprises by the number of local units to produce the
ratio of enterprises to local units.
● Social fragmentation index
The Social Fragmentation Index was developed by Peter Congdon to study the predictors of suicide. We
calculated it at the local level using the following percentages drawn from census data:
○ percentage of 1-person household
○ percentage of people renting privately
○ percentage of people who have moved to their current address within the last year
○ percentage of people who are not living as a couple
The index is calculated from these percentages using a similar methodology to that used for Happy City’s TPI
overall (see section on standardisation below) – that is to say by calculating z-scores for each of the four
components and then taking an average. However, rather than calculate z-scores based on the 2011 census,
we have used the formula originally used by Peter Congdon, which is based on the 1991 census, in effect
benchmarking our TPI against levels of social fragmentation in that year.
● 80/20 income ratio
To calculate the ratio we took the 80th and 20th percentile of weekly earnings and divided the value at the
80th percentile by the value at the 20th for each local authority.
page 80 of 86 February 2018
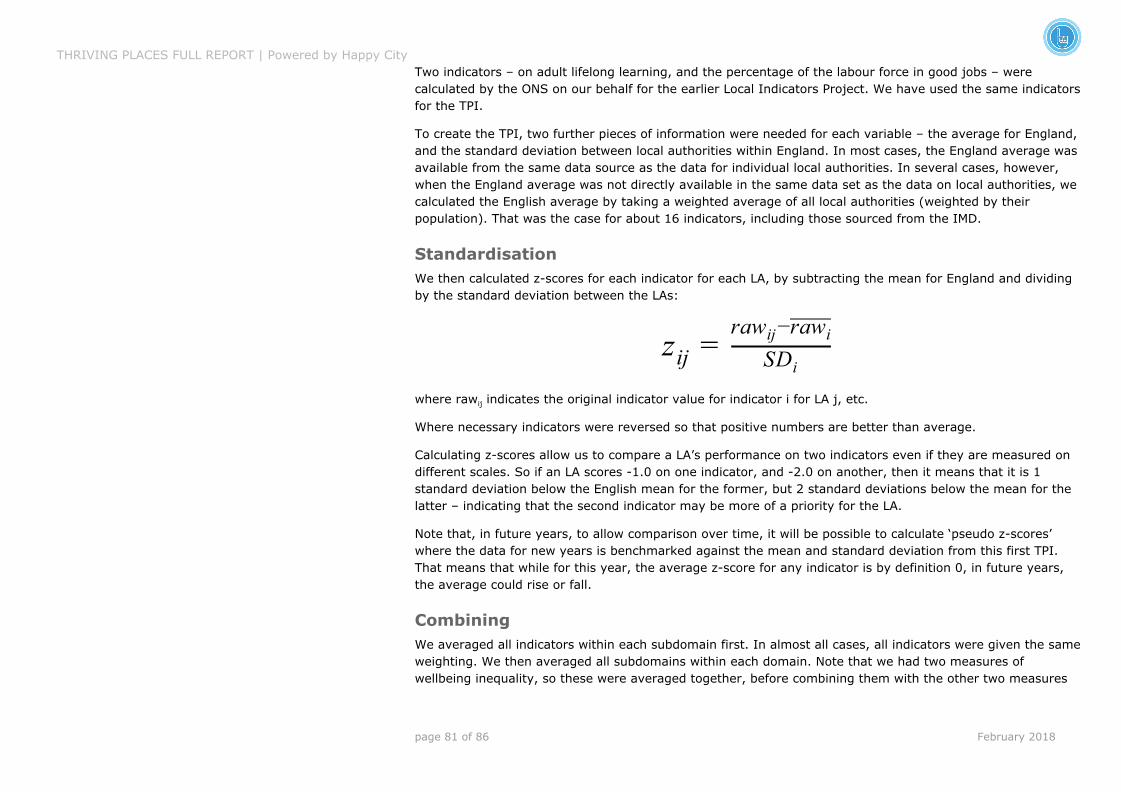
THRIVING PLACES FULL REPORT | Powered by Happy City
Two indicators – on adult lifelong learning, and the percentage of the labour force in good jobs – were
calculated by the ONS on our behalf for the earlier Local Indicators Project. We have used the same indicators
for the TPI.
To create the TPI, two further pieces of information were needed for each variable – the average for England,
and the standard deviation between local authorities within England. In most cases, the England average was
available from the same data source as the data for individual local authorities. In several cases, however,
when the England average was not directly available in the same data set as the data on local authorities, we
calculated the English average by taking a weighted average of all local authorities (weighted by their
population). That was the case for about 16 indicators, including those sourced from the IMD.
Standardisation
We then calculated z-scores for each indicator for each LA, by subtracting the mean for England and dividing
by the standard deviation between the LAs:
zij = SDi
raw −rawij i
where rawij indicates the original indicator value for indicator i for LA j, etc.
Where necessary indicators were reversed so that positive numbers are better than average.
Calculating z-scores allow us to compare a LA’s performance on two indicators even if they are measured on
different scales. So if an LA scores -1.0 on one indicator, and -2.0 on another, then it means that it is 1
standard deviation below the English mean for the former, but 2 standard deviations below the mean for the
latter – indicating that the second indicator may be more of a priority for the LA.
Note that, in future years, to allow comparison over time, it will be possible to calculate ‘pseudo z-scores’
where the data for new years is benchmarked against the mean and standard deviation from this first TPI.
That means that while for this year, the average z-score for any indicator is by definition 0, in future years,
the average could rise or fall.
Combining
We averaged all indicators within each subdomain first. In almost all cases, all indicators were given the same
weighting. We then averaged all subdomains within each domain. Note that we had two measures of
wellbeing inequality, so these were averaged together, before combining them with the other two measures
page 81 of 86 February 2018

THRIVING PLACES FULL REPORT | Powered by Happy City
of inequality. We then averaged for all the domains for the Local Conditions to create a Local Conditions
score.
Calibrating
z-scores are hard to interpret for most people. We converted them to a scale that runs between 0 and 10,
with 5 indicating the average for England (for this year). A 10 on such a scale indicates an exceptionally good
performance, and a 0 indicates an exceptionally bad performance. To do so, each z-score was multiplied by
5/3 and then 5 was added, as shown below:
Recalibratedij = zij + 5
Scores above 10 were capped at 10, and those below 0 were capped at 0.
This may seem, and indeed is, somewhat arbitrary, and the formula was designed purely to ensure a
reasonable spread of scores between 0 and 10. With this formula, any variation beyond 3 standard deviations
away from the mean is ignored. So, for example a LA which has a z-score of 3.1 on a particular domain would
get 10/10, as would a local authority which had a z-score of 7.1. The implication is that any variation beyond
a certain range is fairly irrelevant. As it happens, out of the 2700 subdomain scores for the 150 local
authorities, only 8 z-scores fell beyond the ±3 range, and were therefore capped.
Presentation
As well as calculating 0-10 scores, we also devised a colour scheme for presenting scores.
These are shown below.
The thresholds were chosen to ensure a reasonable spread across the colours. So for example, 18% of
subdomain scores are in the bottom category, 21% in the second category, 27% in the third category,
and so on.
Score Label
< 3.5 Lowest
3.5 - 4.5 Low
4.5 - 5.5 Average
5.4 - 6.5 High
> 6.5 Highest
page 82 of 86 February 2018

THRIVING PLACES FULL REPORT | Powered by Happy City
3: RESOURCES AND LINKS
Below are a selection of the many publically available resources that we have consulted in the development of
this project. There are many more than we have space to share here, but we are indebted to the exceptional
range of academic and policy experts who have created the wealth of knowledge on which we can build. Resource Link
ACEs - prevention/risk factors https://www.cdc.gov/violenceprevention/pdf/can-prevention-technical-package.pdf
ACEs (Adverse Childhood Experiences) https://www.cdc.gov/violenceprevention/acestudy/
ACEs and adult health http://static1.squarespace.com/static/500ee7f0c4aa5f5d4c9fee39/t/53ecfab7e4b03cc699a85f97/1408039607750/Adverse+Childhood+Experi
ences+and+Adult+Health.pdf
ACEs in Scotland http://www.scotphn.net/wp-content/uploads/2016/06/2016_05_26-ACE-Report-Final-AF.pdf
ACEs in Wales http://www.cph.org.uk/wp-content/uploads/2016/01/ACE-Report-FINAL-E.pdf
ACEs indicators http://www.childtrends.org/indicators/?research-topic%5B%5D=child-maltreatment-child-welfare
Campaign to End Loneliness (CEL) -
Loneliness Outcomes Framework
https://www.campaigntoendloneliness.org/wp-content/uploads/White-Paper-Response-Care-and-Support-White-Paper-July-2012.pdf
CEL - Public Health approaches to social
isolation in England
https://www.campaigntoendloneliness.org/wp-content/uploads/downloads/2013/07/Public-Health-Approaches-to-Social-Isolation-and-Loneline
ss-Part-1.pdf
Carnegie Trust - Measuring Wellbeing in
Northern Ireland
https://www.carnegieuktrust.org.uk/wp/wp-content/uploads/sites/64/2016/02/pub14550114941.pdf
Carnegie Trust - Northern Ireland report https://www.carnegieuktrust.org.uk/carnegieuktrust/wp-content/uploads/sites/64/2016/02/pub1455011423.pdf
Carnegie Trust UK - Enabling Wellbeing https://www.carnegieuktrust.org.uk/theme/enabling-wellbeing/
Carnegie Trust UK - Scotland and Oxfam
Humankind Index
https://www.carnegieuktrust.org.uk/wp/wp-content/uploads/sites/64/2016/02/pub1455011645.pdf
Carnegie Trust UK - Sharpening the Focus https://www.carnegieuktrust.org.uk/wp/wp-content/uploads/sites/64/2016/09/Sharpening-our-Focus.pdf
Cotswold Council - Loneliness and Isolation
in Gloucester; Strategic analysis team
http://www.cotswold.gov.uk/media/777430/Loneliness-Report.PDF
GCPH - Poverty, parenting & health http://www.gcph.co.uk/assets/0000/3817/Poverty__parenting_and_poor_health.pdf
page 83 of 86 February 2018
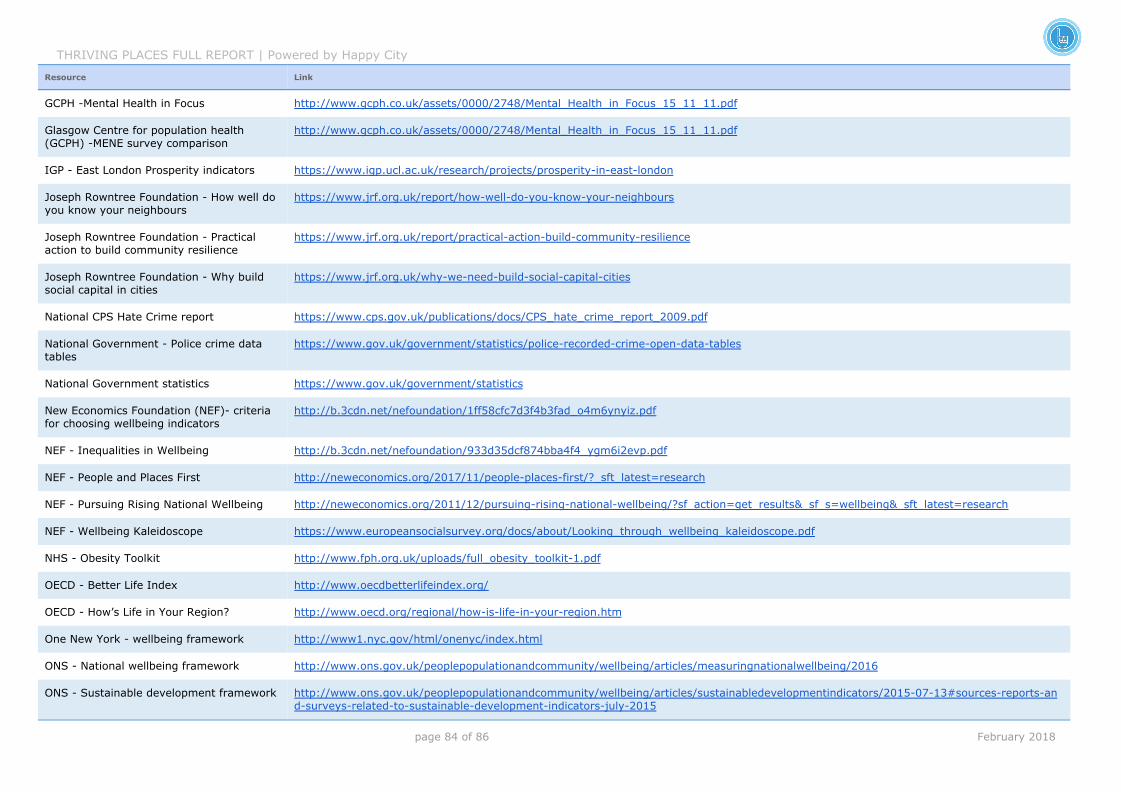
THRIVING PLACES FULL REPORT | Powered by Happy City
Resource Link
GCPH -Mental Health in Focus http://www.gcph.co.uk/assets/0000/2748/Mental_Health_in_Focus_15_11_11.pdf
Glasgow Centre for population health
(GCPH) -MENE survey comparison
http://www.gcph.co.uk/assets/0000/2748/Mental_Health_in_Focus_15_11_11.pdf
IGP - East London Prosperity indicators https://www.igp.ucl.ac.uk/research/projects/prosperity-in-east-london
Joseph Rowntree Foundation - How well do
you know your neighbours
https://www.jrf.org.uk/report/how-well-do-you-know-your-neighbours
Joseph Rowntree Foundation - Practical
action to build community resilience
https://www.jrf.org.uk/report/practical-action-build-community-resilience
Joseph Rowntree Foundation - Why build
social capital in cities
https://www.jrf.org.uk/why-we-need-build-social-capital-cities
National CPS Hate Crime report https://www.cps.gov.uk/publications/docs/CPS_hate_crime_report_2009.pdf
National Government - Police crime data
tables
https://www.gov.uk/government/statistics/police-recorded-crime-open-data-tables
National Government statistics https://www.gov.uk/government/statistics
New Economics Foundation (NEF)- criteria
for choosing wellbeing indicators
http://b.3cdn.net/nefoundation/1ff58cfc7d3f4b3fad_o4m6ynyiz.pdf
NEF - Inequalities in Wellbeing http://b.3cdn.net/nefoundation/933d35dcf874bba4f4_ygm6i2evp.pdf
NEF - People and Places First http://neweconomics.org/2017/11/people-places-first/?_sft_latest=research
NEF - Pursuing Rising National Wellbeing http://neweconomics.org/2011/12/pursuing-rising-national-wellbeing/?sf_action=get_results&_sf_s=wellbeing&_sft_latest=research
NEF - Wellbeing Kaleidoscope https://www.europeansocialsurvey.org/docs/about/Looking_through_wellbeing_kaleidoscope.pdf
NHS - Obesity Toolkit http://www.fph.org.uk/uploads/full_obesity_toolkit-1.pdf
OECD - Better Life Index http://www.oecdbetterlifeindex.org/
OECD - How’s Life in Your Region? http://www.oecd.org/regional/how-is-life-in-your-region.htm
One New York - wellbeing framework http://www1.nyc.gov/html/onenyc/index.html
ONS - National wellbeing framework http://www.ons.gov.uk/peoplepopulationandcommunity/wellbeing/articles/measuringnationalwellbeing/2016
ONS - Sustainable development framework http://www.ons.gov.uk/peoplepopulationandcommunity/wellbeing/articles/sustainabledevelopmentindicators/2015-07-13#sources-reports-an
d-surveys-related-to-sustainable-development-indicators-july-2015
page 84 of 86 February 2018

THRIVING PLACES FULL REPORT | Powered by Happy City
Resource Link
Public Health England - Outcomes
framework
http://www.phoutcomes.info/
RSA Heritage Index https://www.thersa.org/action-and-research/rsa-projects/public-services-and-communities-folder/heritage-and-place
Santa Monica Wellbeing project http://wellbeing.smgov.net/
Scotland Health and Wellbeing profiles http://www.scotpho.org.uk/comparative-health/profiles/online-profiles-tool
Scotland National datasets http://www.ndc.scot.nhs.uk/National-Datasets/
Scotland National Performance Framework http://www.gov.scot/About/Performance/scotPerforms
Social sustainability framework http://www.social-life.co/publication/Social-Sustainability/
State of the nation report: poverty,
worklessness and welfare dependency
https://www.bristol.ac.uk/poverty/downloads/keyofficialdocuments/CONDEM%20-poverty-report.pdf
Strengths & difficulties Questionnaire http://www.sdqinfo.org/
Thriving Cities – Human Ecology framework http://thrivingcities.com/human-ecology-framework
VicHealth- Community Resilience report https://www.vichealth.vic.gov.au/media-and-resources/publications/young-victorians-resilience-and-mental-wellbeing
Vital Signs Community Foundation http://quartetcf.org.uk/wp-content/uploads/2016/10/Vital-Signs-for-the-West-of-England-2016.pdf
Vital Signs Community Foundation -Quartet http://quartetcf.org.uk/wp-content/uploads/2016/10/Vital-Signs-for-the-West-of-England-2016.pdf
Wales National wellbeing indicators http://www.assembly.wales/ministerial%20statements%20documents/how-measure-nations-progress%E2%80%93the-national-well-being-in
dicators-wales/the%20national%20indicators%20to%20be%20laid%20before%20nafw%20pdf%20(english).pdf
Wellbeing in Northern Ireland- June 2016 https://www.nisra.gov.uk/sites/nisra.gov.uk/files/publications/Wellbeing%20in%20Northern%20Ireland%20-%20June%202016%20report.pd
f
Welsh Government - Future Generations http://gov.wales/topics/people-and-communities/people/future-generations-act/?skip=1&lang=en
What Works Wellbeing - Community Voice
of the User report
https://whatworkswellbeing.files.wordpress.com/2016/02/community-voice-of-the-user-report1.pdf
page 85 of 86 February 2018

THRIVING PLACES FULL REPORT | Powered by Happy City
Happy City is a small UK charity with a big mission:
to ‘make what matters count’. It offers a
place-based model of change that puts the
wellbeing of current and future generations centre
stage. It does this by developing new measures of
progress and delivering training, projects and
campaigns to help embed positive change.
Based in Bristol, Happy City is now working with
organisations large and small from the public,
private and community sector, right around the UK.
They have received interest in their work from
around the world.
To find out more go to:
Online: happycity.org.uk
thrivingplacesindex.org
Twitter: @HappyCityUK
Facebook: HappyCityUK
Email: [email protected]
The publication and launch of this report has been kindly
sponsored by Triodos Bank with additional in-kind support
from Greenhouse PR.
page 86 of 86 February 2018