thrombocytopenia-associated mutations in the ankrd26
TRANSCRIPT

Thrombocytopenia-associated mutations in the ANKRD26regulatory region induce MAPK hyperactivation
Dominique Bluteau, … , Remi Favier, Hana Raslova
J Clin Invest. 2014;124(2):580-591. https://doi.org/10.1172/JCI71861.
Point mutations in the 5′ UTR of ankyrin repeat domain 26 (ANKRD26) are associated with familial thrombocytopenia 2(THC2) and a predisposition to leukemia. Here, we identified underlying mechanisms of ANKRD26-associatedthrombocytopenia. Using megakaryocytes (MK) isolated from THC2 patients and healthy subjects, we demonstrated thatTHC2-associated mutations in the 5′ UTR of ANKRD26 resulted in loss of runt-related transcription factor 1 (RUNX1) andfriend leukemia integration 1 transcription factor (FLI1) binding. RUNX1 and FLI1 binding at the 5′ UTR from healthysubjects led to ANKRD26 silencing during the late stages of megakaryopoiesis and blood platelet development. Weshowed that persistent ANKRD26 expression in isolated MKs increased signaling via thethrombopoietin/myeloproliferative leukemia virus oncogene (MPL) pathway and impaired proplatelet formation by MKs.Importantly, we demonstrated that ERK inhibition completely rescued the in vitro proplatelet formation defect. Our dataidentify a mechanism for development of the familial thrombocytopenia THC2 that is related to abnormal MAPK signaling.
Research Article Hematology
Find the latest version:
https://jci.me/71861/pdf

Research article
580 The Journal of Clinical Investigation http://www.jci.org Volume 124 Number 2 February 2014
Thrombocytopenia-associated mutations in the ANKRD26 regulatory region
induce MAPK hyperactivationDominique Bluteau,1,2,3,4 Alessandra Balduini,5 Nathalie Balayn,1,2,3 Manuela Currao,5
Paquita Nurden,6,7 Caroline Deswarte,8,9 Guy Leverger,8,9,10 Patrizia Noris,11 Silverio Perrotta,12 Eric Solary,1,2,3 William Vainchenker,1,2,3 Najet Debili,1,2,3 Remi Favier,1,10 and Hana Raslova1,2,3
1Institut National de la Santé et de la Recherche Médicale, UMR 1009, Equipe Labellisée Ligue Contre le Cancer, Villejuif, France. 2University Paris-Sud 11, Villejuif, France. 3Gustave Roussy, Villejuif, France. 4Ecole Pratique des Hautes Etudes (EPHE), Paris, France.
5Biotechnology Research Laboratories, Department of Molecular Medicine, IRCCS San Matteo Foundation, University of Pavia, Pavia, Italy. 6Plateforme Technologique d’Innovation Technologique, Hôpital Xavier Arnozan, Pessac, France. 7Centre de Référence des Pathologies Plaquettaires,
Hôpital La Timone, Marseille, France. 8University Paris 6, Faculty of Medicine Saint Antoine, Paris, France. 9Institut National de la Santé et de la Recherche Médicale, UMR S938, Faculty of Medicine Saint Antoine, Paris, France.
10Assistance Publique-Hôpitaux de Paris, Hôpital Trousseau, CRPP, Services d’Hématologie Biologique et Clinique, Paris, France. 11Department of Internal Medicine, IRCCS San Matteo Foundation, University of Pavia, Pavia, Italy. 12Dipartimento della Donna,
del Bambino e di Chirurgia Generale e Specialistica, Second University of Naples, Naples, Italy.
Point mutations in the 5′ UTR of ankyrin repeat domain 26 (ANKRD26) are associated with familial throm-bocytopenia 2 (THC2) and a predisposition to leukemia. Here, we identified underlying mechanisms of ANKRD26-associated thrombocytopenia. Using megakaryocytes (MK) isolated from THC2 patients and healthy subjects, we demonstrated that THC2-associated mutations in the 5′ UTR of ANKRD26 resulted in loss of runt-related transcription factor 1 (RUNX1) and friend leukemia integration 1 transcription factor (FLI1) binding. RUNX1 and FLI1 binding at the 5′ UTR from healthy subjects led to ANKRD26 silencing dur-ing the late stages of megakaryopoiesis and blood platelet development. We showed that persistent ANKRD26 expression in isolated MKs increased signaling via the thrombopoietin/myeloproliferative leukemia virus oncogene (MPL) pathway and impaired proplatelet formation by MKs. Importantly, we demonstrated that ERK inhibition completely rescued the in vitro proplatelet formation defect. Our data identify a mechanism for development of the familial thrombocytopenia THC2 that is related to abnormal MAPK signaling.
IntroductionThrombocytopenia 2 (THC2 [MIM 188000]) is characterized by autosomal-dominant transmission, a moderate thrombo-cytopenia, reduction of platelet α-granules, normal in vitro platelet aggregation, and mean platelet volume and predis-position to leukemia. Bone marrow examination and serum thrombopoietin (TPO) levels suggest that thrombocytopenia results from dysmegakaryopoiesis (1, 2). The THC2 locus was mapped to chromosome 10p11.1-p12 (3, 4), and more recently, different heterozygous single-nucleotide substitutions within 5′ UTR of the ankyrin repeat domain 26 (ANKRD26) gene were detected in 78 patients from 21 families. Twelve different muta-tions (c.-118C>T, c.-127A>T, c.-128G>A, c.-134G>A, c.-125T>G, c.-116C>T, c.-126T>G, c.-121A>C, c.-119C>A, c.-118C>A, c.-113A>C, c.-127A>G) have been described so far, all of them localized in a short stretch of 22 nucleotides of the 5′ UTR (1, 5). In few cases, high values of hemoglobin and leukocytes were observed and, interestingly, a high incidence of acute leukemia was also reported (1). Recently, the ubiquitin/proteasome-rich particulate cytoplasmic structures (PaCSs) were detected in the platelets and megakaryocytes of THC2 patients (6). PaCSs show selective immunoreactivity for the proteasome as well as for poly-
ubiquitinated proteins. Their presence in different pathologies, including epithelial neoplasms, suggests a link of these struc-tures with oncogenesis (6).
ANKRD26 is the ancestral gene for the primate-specific gene family POTE (7). It encodes for a 192-kDa protein, which is highly abundant in the brain, particularly in the hypothalamus, as well as in the liver, the adipose tissue, the skeletal muscle, and the hema-topoietic tissue (8). The ANKRD26 protein is associated with the inner part of the cell membrane and contains ankyrin repeats and spectrin helices for interaction with signaling proteins. The par-tial inactivation of ANKRD26 induces obesity and gigantism (8). Obesity development is linked to enhanced adipogenesis mediated by increased ERK and mTOR pathway activation (9). The muta-tions in the 5′ UTR regulatory region of ANKRD26 suggested a deregulation of its expression in megakaryocytes (MKs). Here we show a runt-related transcription factor 1/friend leukemia inte-gration 1 transcription factor–mediated (RUNX1/FLI1-mediated) downregulation of ANKRD26 gene expression during megakaryo-poiesis, leading to its near absence in platelets. The loss of RUNX1/FLI1 binding in THC2 patients leads to the persistent expression of ANKRD26 in MKs and platelets followed by an increase in TPO/myeloproliferative leukemia virus oncogene (TPO/MPL) signaling, particularly in the MAPK/ERK1/2 pathway. Study of 11 Italian and French THC2 pedigrees showed no major alterations in MK dif-ferentiation, but a profound defect in proplatelet (PPT) formation, leading to thrombocytopenia. We demonstrated that the mecha-nism underlying this alteration in PPT formation may be ascribed
Authorship note: Dominique Bluteau and Alessandra Balduini, as well as Remi Favier and Hana Raslova, contributed equally to this work.
Conflict of interest: The authors have declared that no conflict of interest exists.
Citation for this article: J Clin Invest. 2014;124(2):580–591. doi:10.1172/JCI71861.

research article
The Journal of Clinical Investigation http://www.jci.org Volume 124 Number 2 February 2014 581
to the persistent activation of the MAPK/ERK1/2 pathway in THC2 patient–derived MKs as compared with controls. Importantly, this hypothesis was supported by the correction of the PPT defect in patient-derived MKs by the use of an MEK inhibitor.
ResultsANKRD26 gene expression is maintained in THC2 patient MKs and platelets. To get further insights in the mechanisms of THC2, we studied 11 pedigrees (Supplemental Table 1; supplemental material avail-able online with this article; doi:10.1172/JCI71861DS1), 9 of them with already described mutations and 2 with new gene alterations (c.-128G>C and c.-127delAT; Figure 1). First we investigated ANKRD26 gene expression during the differentiation of healthy donor CD34+ progenitor cells into MKs upon exposure to TPO. While the gene was highly expressed in CD34+ progenitor cells, its expression diminished along MK differentiation (Figure 2A). When immature MKs were sorted on CD41 expression at day 6 and cultured until day 12 to induce differentiation, a similar decrease in ANKRD26 expression was observed (Figure 2B). Similarly, ANKRD26 was less expressed in mature (CD41+CD42+) compared with immature (CD41+CD42–) MKs sorted at day 9 of culture (Figure 2C). Mature MKs (CD41+CD42+) from THC2 patients showed a persistent expression of the ANKRD26 gene in contrast to their normal counterparts, where its expression was nearly abolished (Figure 2D). Similarly, the ANKRD26 gene remained expressed in platelets from THC2 patients while being hardly detectable in healthy control platelets (Figure 2E). These results obtained in primary cells confirmed what was previously observed in a cell line model (5), that a mutation in 5′ UTR enhances ANKRD26 gene expression during megakaryopoiesis.
ANKRD26 gene is negatively regulated by the RUNX1 and FLI1 tran-scription factors. To predict which transcription factors bind to the 5′ UTR region of the ANKRD26 gene and could be affected by
mutations, we used the TRAP (10) and the CHipMapper (11) online software. Two transcription factors, RUNX1 and FLI1, which are known to coregulate megakaryo-poiesis (12) were found to potentially bind this affected region (Figure 3A). shRNA knockdown of RUNX1 and FLI1 (Figure 3, B–D) led to an increase in ANKRD26 gene expression in normal MKs, demonstrating that these 2 transcription factors could repress ANKRD26 gene expression (Figure 3E). ChIP assays demonstrat-ed that RUNX1 or FLI1 bound the 5′ UTR ANKRD26 gene region encompassing THC2 mutations in MKs (Figure 3F), which led us to test the functional relevance of this binding site. For that purpose, the ANKRD26 gene region from –347nt to +1nt was cloned upstream of the luciferase gene, and this reporter construct was cotransfected into K562 cells with an empty vector or vector expressing RUNX1 gene or FLI1 gene. Individu-ally, RUNX1 and FLI1 overexpression showed a mod-erate inhibitory effect on ANKRD26 gene expression, while their simultaneous overexpression showed a syn-ergistic inhibitory effect (Figure 3G). To confirm that the mutations found in the 5′ UTR of ANKRD26 gene of THC2 patients led to the loss of inhibitory regulatory function of RUNX1 and FLI1, we performed luciferase assays in K562 cells using reporter constructs encoding for the 5′ UTR ANKRD26 region with the c.-119C>T, the c.-127A>T, or the c.-127delAT mutations. These 3 dif-
ferent mutations led to a significant increase in luciferase activity in comparison with the WT sequence (Figure 3H).
Persistent ANKRD26 expression induces a deep defect in PPT formation. To understand how the persistent expression of the ANKRD26 gene could contribute to thrombocytopenia, we further studied the phenotype of patient MKs. We used 2 techniques in parallel to derive mature MKs. In the first, MKs were derived from puri-fied blood CD34+ cells in the presence of TPO and SCF; in the second, blood CD45+ cells were isolated and MKs were obtained after culture with TPO, IL-6, and IL-11. Both techniques gave very similar results. The percentage of mature CD41+CD42+ MKs was evaluated at day 10 (when derived from CD34+ cells) or 14 (when derived from CD45+ cells) of culture. No difference in MK differen-tiation was detected between patients and healthy donors (n = 14 for controls, n = 19 for patients) as shown in Figure 4A, except a slight decrease in ploidy level (n = 11.4 for controls [n = 4] to n = 9.5 for patients [n = 5], P = 0.0079) (Figure 4A and Supple-mental Figure 1A). Electron microscopy analysis was performed for 2 patients’ MKs after 10 days of culture (Figure 4B). In con-trols, mature MKs showed homogeneously distributed granules and demarcation membranes (DMS) with typical organization of DMS that form platelet territories. On the contrary, patient MKs showed a decreased concentration of granules (PD1_3, PD1_2). MKs formed thick and short cytoplasmic extensions with hetero-geneous distribution of granules (PD3_3) or fragile extensions with very thin attachment to the MK body (PD1_2). Frequently, within the MK cytoplasm with deformed elongated shape, the DMS system appeared to delineate areas of fragmentation instead of formation of long pseudopods (PD1_3, PD1_2). These results suggested a defect in PPT formation (Figure 4B).
Previously, a decrease in the expression of GPIa (CD49b), the α subunit (α2) of a transmembrane receptor for collagen, was detected in platelets of THC2 patients (1). Interestingly, we did not
Figure 1Two THC2 pedigrees with new germline alterations in the 5′ UTR region of the ANKRD26 gene. Left panels: pedigree 4 harbors the c.-128G>C mutation and pedigree 5 the c.-127delAT deletion. Black symbols stand for affected individu-als, white symbols for nonaffected individuals. Right panels: analysis of the 5′ UTR region of the ANKRD26 gene (NM_014915.2). Upper panel shows the point germline c.-128G>C mutation found in pedigree 4, and lower panel shows the c.-127delAT deletion found in pedigree 5.

research article
582 The Journal of Clinical Investigation http://www.jci.org Volume 124 Number 2 February 2014
observe a decrease in GPIa expression and in stress fiber forma-tion upon activation of α2β1 (GPIaGPIIa) integrin by MK adhesion to fibrillar collagen type I (n = 3 for controls, n = 4 for patients) (Figure 4C and Supplemental Figure 1B). Finally, the ability to form PPTs by MKs generated by the 2 protocols was investigated in liquid medium and after adhesion on poly-L-lysine or fibrinogen substrates. In all experimental designs, a profound decrease in the number of PPT-forming MKs in patients compared with controls (n = 14 for controls, n = 22 for patients, P < 0.0001) was observed (Figure 4D). Moreover, the branching area of PPT was significantly decreased in MKs of patients (Figure 4E), as demonstrated by a 4.6-fold decrease in the bifurcation number compared with con-trols (n = 10 for controls, n = 17 for patients, P < 0.05) (Figure 4E). To confirm that the ANKRD26 overexpression led to the defect in PPT formation, the CD34+ cells of 2 controls and 2 THC2 patients were transduced by an shRNA of ANKRD26 (shANK1). The inhi-bition of ANKRD26 expression in patients’ MKs led to a rescue of the defect in PPT formation (Supplemental Figure 2). Overall these results demonstrated that the persistent ANKRD26 expres-sion in MKs of THC2 patients does not alter MK differentiation, but leads to a profound defect in PPT formation, which could be at the origin of the thrombocytopenia.
Persistent ANKRD26 expression induces increased MAPK/ERK1/2 activation in patient MKs. ANKRD26 gene knockout was reported to modulate the ERK pathway in mouse embryo fibroblasts (MEF) (9). Through its receptor MPL, TPO is the principal physiologi-cal regulator of MK differentiation and platelet production. To understand how the preserved expression of the ANKRD26 gene could alter PPT formation through a signaling defect, we focused on the activation of JAK/STAT, MAPK, and PI3K in response to
TPO. First, the UT7 megakaryocytic cell line maintained under GM-CSF was transduced with HA-tagged MPL (HA-MPL) to make it sensitive to TPO. As these cells express the ANKRD26 gene, contrary to primary mature MKs, we subsequently transduced them with an shRNA targeting ANKRD26 (shANK1), which decreased its expression by about 80% compared with control cells transduced with an irrelevant shRNA (shSCR) (Supplemen-tal Figure 3, A and B). ANKRD26 knockdown led to a decrease in TPO/MPL signaling pathways as attested by a diminution in phosphorylation of STAT5, AKT, and ERK1/2 (Figure 5, A–D). These results were confirmed by using a second shRNA against ANKRD26 (shANK2, data not shown). Subsequently, peripheral blood CD34+ cells from a THC2 patient and a healthy individual were cultured for 8 days in the presence of TPO and SCF. The cells were then starved for 24 hours and stimulated with TPO. Activa-tion of the 3 signaling pathways was increased in MKs of patients compared with MKs of controls (Figure 5, E–H), without changes in the kinetics. This increased signaling was more pronounced for the ERK1/2 pathway, which was confirmed for 2 other patients (Supplemental Figure 3, C–F).
Decrease in MAPK signaling is necessary for PPT formation. To under-stand whether an increase in MAPK activation could alter PPT for-mation, we analyzed the ERK pathway during MK differentiation from CD34+ cells: early in MK differentiation (day 6 to 7 of cul-ture), during terminal maturation prior to PPT formation (day 10), and at time when mature MKs start to or display PPTs (day 14). As illustrated in Figure 6A, ERK activation induced by TPO dra-matically decreased at late stages of megakaryopoiesis. Indeed, at day 6, a sustained and strong ERK activation could be detected 5 minutes after TPO stimulation and reached its maximum after
Figure 2ANKRD26 expression is maintained during megakaryopoiesis of THC2 patients. In vitro MK differentiation was induced from control or patient peripheral blood CD34+ progenitors in the presence of TPO. RT-PCR analysis of ANKRD26 mRNA was performed at different stages of MK dif-ferentiation. (A) CD34+ cells were recovered before culture (D0) and at different days (D1, D4, D7, D10) of culture. (B) CD41+ cells were sorted at day 6, put in culture, and then studied on 3 different days of culture (D6 to D12, corresponding to cells with increasing maturity). (C) CD41+CD42– (immature MKs) and CD41+CD42+ (mature MKs) were sorted at day 6 of culture. (A–C) Data are normalized to PPIA transcript level and represent mean ± SD of triplicate. (D) CD41+CD42+ mature MKs were sorted at day 10 of culture. MKs of 5 THC2 patients (PD1_1, PD3_1, PD3_2, PD3_3, PD3_4) and of 3 control individuals were studied. (E) Platelets were purified from platelet-rich plasma. Platelets from 9 THC2 patients (PD1_1, PD1_2, PD2_1, PD2_2, PD3_1, PD3_2, PD3_3, PD4_1, PD4_2) and from 5 control individuals were studied. Data are normalized to PPIA tran-script level, and expression is compared with control C1. Data represent mean ± SEM. *P < 0.05; **P < 0.001, Mann-Whitney test.

research article
The Journal of Clinical Investigation http://www.jci.org Volume 124 Number 2 February 2014 583
10 to 30 minutes. At day 10, the ERK activation started to decrease and at day 14, when MKs began to shade PPTs, a weaker and tran-sient activation of ERK was detected (Figure 6A). This result was confirmed by measuring ERK1/2 phosphorylation by flow cytom-etry in the CD41+ cell population. A more transient and less intense ERK activation was detected at day 10 of culture in the CD41+ cell population in comparison with day 7 (Figure 6B). These results
strongly suggested that ERK activation by TPO is downregulated during MK differentiation. To further demonstrate ERK down-regulation involvement in PPT formation, the MEK inhibitor PD98059 was used. The CD34+ cell–derived MKs were sorted at day 6 on the expression of CD41. The inhibitor was added at day 8, prior to PPT formation. An important increase in the percent-age of PPT-forming MKs was observed in the presence of PD98059
Figure 3RUNX1 and FLI1 downregulate ANKRD26 expression during normal megakaryopoiesis. (A) Schematic representation of mutations in 5′ UTR ANKRD26 region in THC2 patients. Gray box represents RUNX1 and black box FLI1-binding sites. Gray numbers indicate genomic location in UCSC database (GRCh37/hg19). TSS (–172) indicates transcription start site, and +1 position indicates translation start site. (B–D) RUNX1 and FLI1 inhibition effects on ANKRD26 expression. CD34+ cell were transduced with lentiviruses encoding control shRNA (shSCR) and shRNA of RUNX1 or FLI1. These 2 shRNAs inhibited the expression of RUNX1 and FLI1, respectively, at mRNA levels by qRT-PCR (B and C) and at protein levels by Western blot (D) in CD41+CD42+ cells sorted at day 6 of culture. (E) qRT-PCR analysis in shRUNX1 or shFLI1 transduced MK cells showed an increase in ANKRD26 expression. (F–H) RUNX1 and FLI1 directly regulate ANKRD26 expression. (F) ChIP assays performed in primary MKs showing that RUNX1 and FLI1 directly bind the ANKRD26 5′ UTR region. ANK_A encompasses the ANKRD26 5′ UTR region including RUNX1- and FLI1-binding sites. C1- and C2-encompassing regions without RUNX1- or FLI1-binding sites were used as control. (G) An empty (mock) or 5′ UTR ANK RD26 (ANKRD26_WT) luciferase reporter construct was cotransfected into K562 cells with empty vector or plasmid expressing RUNX1, FLI1, or RUNX1 and FLI1 in synergy. Cells extracts were analyzed for luciferase activity. (H) Luciferase assays showing that mutations c.-119C>A, c.-127A>T and c.-127delAT found in the 5′ UTR ANKRD26 regulatory region block RUNX1 and FLI1 luciferase inhibition activity. In B, C, and E–G, data represent 1 of 3 independent experiments with similar results. Error bars represent mean ± SD of triplicate. *P < 0.05; **P < 0.001; ***P < 0.0001, Student’s t test.

research article
584 The Journal of Clinical Investigation http://www.jci.org Volume 124 Number 2 February 2014
(Figure 6, C and D). Importantly, PD98059 is not entirely specific of MEK, but also inhibits cyclooxygenase-1 (13). To demonstrate that PD98059 increases PPT formation through the MAPK pathway and not through cyclooxygenase inhibition, we used indomethacin,
an inhibitor of cyclooxygenase-1 at a 10-μM concentration. When added at day 8 of culture, indomethacin did not affect MAPK path-way activation and PPT formation, whereas PD98059 at 10 μM in presence of indomethacin almost completely inactivated ERK1/2
Figure 4In vitro–derived MK differentiation of THC2 patients. MK differentiation was induced from control or patient peripheral blood CD34+ (A–D) or CD45+ progenitors (D and E) and analyzed respectively at day 10 and day 14 of culture. (A) Gates represent mature (CD41+CD42+) MKs (left panel). The ploidy level (N) was analyzed in the gate of CD41+CD42+ MKs and was based on the percentage of cells in 8N, 16N, and 32N gates. (B) Gallery of electron micrographs showing MKs from 1 control (C) and 2 patients (PD3_3, and PD1_2). (C) Expression level of CD49b (integrin α2) on the surface of CD41+CD42+ MKs of 1 control and 2 patients (PD2_1 and PD2_2). CTRneg corresponds to the CD49b staining on the CD41–CD42– cell population for each sample. The pictures show the MKs forming stress fibers after adhesion on collagen type 1. Nucleus staining (DAPI) is in blue, phalloidin (Phal) in green and vWF in red colors. (D) The percentage of PPT-forming MKs was estimated by counting MKs exhibiting 1 or more cyto-plasmic processes with areas of constriction shown on the picture at the right. Data represent mean ± SD for 14 controls and for 20 THC2 patients (P). ***P < 0.001, Student’s t test. (E) Analysis of branching area in control and patients of PPT-forming MKs after adhesion on fibrinogen and staining with anti–α-tubulin Ab (green) and DAPI (blue). The number of bifurcation was counted for each PPT-forming MK in a total of 100 MKs. Data represent mean ± SD obtained for 10 controls and 17 THC2 patients. *P < 0.05, Student’s t test.

research article
The Journal of Clinical Investigation http://www.jci.org Volume 124 Number 2 February 2014 585
and increased the number of PPT-forming MKs (Supplemental Figure 4, A and B). Then, we verified that, at a concentration of 10 μM, PD98059 does not affect MK maturation and does not induce apoptosis. The inhibitor was added to the culture at day 0 and day 3, and the analysis was performed at day 7; no differences with the controls were observed (Supplemental Figure 4, C and D). To clearly demonstrate that inhibition of the MAPK/ERK pathway negatively regulates PPT formation, we overexpressed a dominant-negative (DNMEK1) (14) or active (MEKa) (15) form of MEK1 in primary MKs and showed that DNMEK1 leads to a 2-fold increase in the percentage of PPT-bearing MKs while, in opposition, MEKa leads to a decrease (Figure 6, E and F). This result demonstrated that ERK1/2 activation at late stages of MK differentiation inhibits PPT formation, as previously postulated (16).
MAPK inhibition restores PPT formation by THC2 patient MKs. To demonstrate that the elevated ERK activation plays a central role in the PPT defect of THC2 patients, we added the PD98059 inhib-
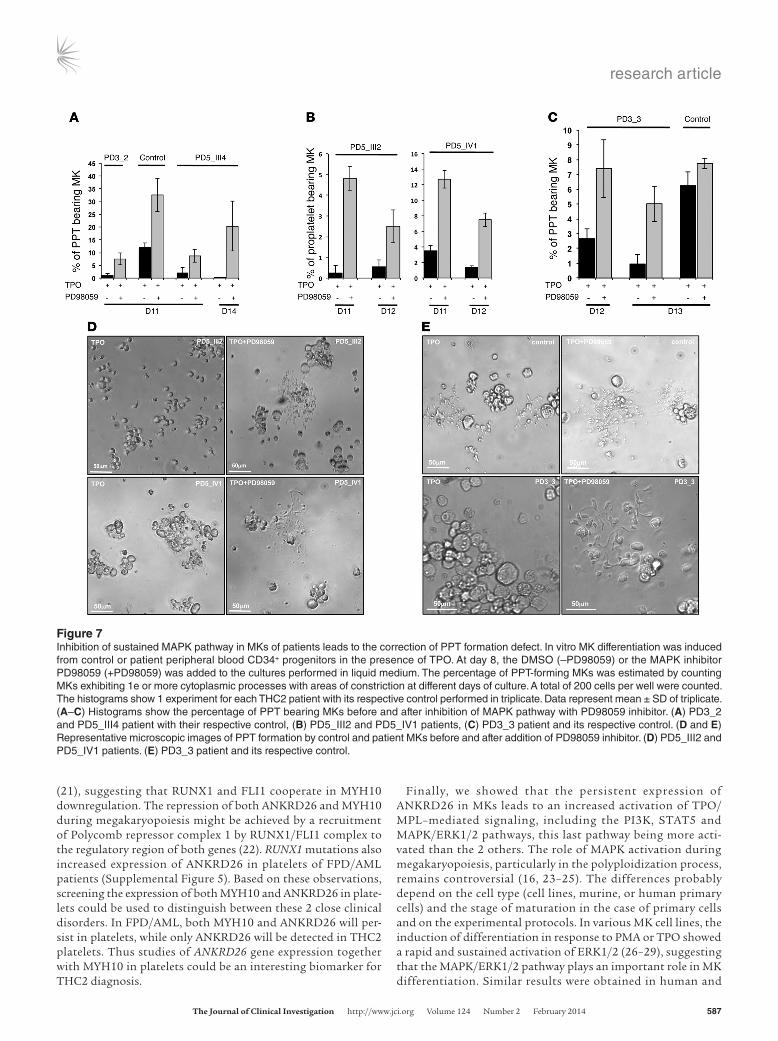
itor at day 8 of MK culture and studied the percentage of PPT-bearing MKs at different days. A significant 5- to 10-fold increase in PPT formation was detected in all the 5 studied patients after inhibition of the ERK pathway (n = 5, *P < 0.05, Student’s t test; Figure 7, A–E) demonstrating that the use of the MAPK inhibitor could at least partially restore the thrombocytopenia of THC2 patients. An increase in PPT formation was also observed in con-trol MKs, but did not exceed a 3-fold increase (n = 6, P < 0.05, Stu-dent’s t test). This can be explained by the presence of a residual activated ERK in normal MKs. Overall, MEK inhibition nearly abolished the differences between normal and THC2 MKs in their PPT formation abilities.
DiscussionTHC2 is one of the rare inherited pathologies with a mutation in the regulatory region of a gene, the deregulation of which affects megakaryopoiesis and early stages of hematopoiesis, as attested
Figure 5Deregulation of ANKRD26 expression affects TPO/MPL signaling. (A–D) ANKRD26 inhibition leads to the decreased STAT, AKT, and ERK signal-ing mediated by TPO in UT7-MPL cells. (A) Western blot analysis of ERK, phospho-ERK (PERK), AKT, phospho-AKT (PAKT), STAT5, phospho-STAT5 (PSTAT5), and actin expression in UT7-MPL cells. Cells were transduced by lentivirus encoding for shANKRD26 (shANK1) or for control (scramble) shRNA (shSCR). Two days later, cells were starved overnight (5% FBS, without cytokines) and stimulated by TPO (20 ng/ml) for 5, 10, 30, and 120 minutes. Experiments were performed 3 times with similar results. (E–H) Maintained ANKRD26 expression in mature MKs of THC2 patient leads to increased TPO-mediated signaling compared with control MKs. (E) Western blot analysis of ERK, PERK, AKT, PAKT, STAT5, PSTAT5, and actin expression in control MKs and in MKs of THC2 patient (PD5_III2). Mature MKs were derived from control or patient blood CD34+ cells in presence of TPO and SCF. At day 8 of culture, they were starved for 24 hours (without cytokines) and stimulated by TPO (50 ng/ml) for 10 minutes, 60 minutes, and 24 hours. (B and F) Histograms representing PSTAT5/STAT5 protein ratio. (C and G) Histograms representing PAKT/AKT protein ratio. (D and H) Histograms representing PERK/ERK protein ratio.

research article
586 The Journal of Clinical Investigation http://www.jci.org Volume 124 Number 2 February 2014
by thrombocytopenia and the leukemic predisposition (2). Only 2 other inherited platelet disorders with such mutations in regulato-ry regions have been reported till now: (a) a mutation in the 5′ UTR region of the GPIBb gene inducing a loss of GATA1 binding to this promoter region in MK results in Bernard-Soulier syndrome (17); and (b) recently, 2 regulatory SNPs leading to a diminished expres-sion of a subunit Y14 of exon junction complex in platelets have been described as responsible for the thrombocytopenia–absence of radius (TAR) syndrome (18).
Here, we demonstrated that mutations in the 5′ UTR of the ANKRD26 gene prevent the transcription factors RUNX1 and FLI1 from repressing ANKRD26 gene activity. Consequently, ANKRD26 remained expressed in the platelets of THC2 patients.
RUNX1, FLI1, SCL, GATA1, and GATA2 are known coregulators of megakaryopoiesis (12, 19) that simultaneously bind promoter regions of key regulators of MK differentiation and functions (19). Importantly, analysis of these ChiP-seq data revealed only an enrichment in RUNX1 and FLI1, but not in GATA and SCL, in the 5′ UTR region of ANKRD26 gene (19), strongly supporting our findings. We recently reported the silencing of MYH10 by RUNX1 during MK differentiation (20). Consistently, MYH10 was demonstrated to remain expressed at high levels in mature MKs and in platelets from patients with familial platelet disor-der with predisposition to acute myeloid leukemia (FPD/AML) characterized by RUNX1 mutations, but also from patients with the Paris-Trousseau syndrome associated with a FLI1 deletion
Figure 6Decrease in MAPK signaling pathway is necessary for PPT formation by MKs. MKs were differentiated from CD34+ cells in the presence of TPO. (A and B) Analysis of the MAPK pathway. Starved MKs were stimulated by TPO (100 ng/ml) for 5, 30, 60, and 120 minutes. (A) Western blot analysis of ERK and PERK performed at days 6, 10, and 14. (B) Flow cytometry analysis of PERK at days 7 and 10. The ratio of fluorescence intensity represents the ratio between the value obtained using PERK and control IgG isotype Abs for each time point of TPO stimulation. For A and B, experiments were performed 3 times with similar results. (C) Inhibition of MAPK pathway increases PPT formation. The CD41+ cells were sorted at day 6, the PD98059 inhibitor was added at day 8, and the percentage of PPT-bearing MKs was evaluated at days 11–13. One of 3 independent experiments with similar results is presented. Data were collected from triplicate wells and represent mean ± SD of triplicate. *P < 0.05, Student’s t test. (D) PPT-forming MKs cultured in presence or absence of PD98059 at day 13. (E and F) Inhibition or activation of MAPK pathway displayed an opposite effect on PPT formation. (E) CD34+ cells were transduced by retroviruses encoding for a dominant negative form of MEK1 and GFP (DNMEKGFP) or (F) for an active form of MEK1 (MEKa) and GFP. A retrovirus MIGR encoding for GFP was used as control. CD41+GFP+ cells were sorted at day 10 and the percentage of PPT-bearing MKs was evaluated at day 13 of culture. Data were collected from triplicate wells and represent mean ± SD.
research article
The Journal of Clinical Investigation http://www.jci.org Volume 124 Number 2 February 2014 587
(21), suggesting that RUNX1 and FLI1 cooperate in MYH10 downregulation. The repression of both ANKRD26 and MYH10 during megakaryopoiesis might be achieved by a recruitment of Polycomb repressor complex 1 by RUNX1/FLI1 complex to the regulatory region of both genes (22). RUNX1 mutations also increased expression of ANKRD26 in platelets of FPD/AML patients (Supplemental Figure 5). Based on these observations, screening the expression of both MYH10 and ANKRD26 in plate-lets could be used to distinguish between these 2 close clinical disorders. In FPD/AML, both MYH10 and ANKRD26 will per-sist in platelets, while only ANKRD26 will be detected in THC2 platelets. Thus studies of ANKRD26 gene expression together with MYH10 in platelets could be an interesting biomarker for THC2 diagnosis.
Finally, we showed that the persistent expression of ANKRD26 in MKs leads to an increased activation of TPO/MPL–mediated signaling, including the PI3K, STAT5 and MAPK/ERK1/2 pathways, this last pathway being more acti-vated than the 2 others. The role of MAPK activation during megakaryopoiesis, particularly in the polyploidization process, remains controversial (16, 23–25). The differences probably depend on the cell type (cell lines, murine, or human primary cells) and the stage of maturation in the case of primary cells and on the experimental protocols. In various MK cell lines, the induction of differentiation in response to PMA or TPO showed a rapid and sustained activation of ERK1/2 (26–29), suggesting that the MAPK/ERK1/2 pathway plays an important role in MK differentiation. Similar results were obtained in human and
Figure 7Inhibition of sustained MAPK pathway in MKs of patients leads to the correction of PPT formation defect. In vitro MK differentiation was induced from control or patient peripheral blood CD34+ progenitors in the presence of TPO. At day 8, the DMSO (–PD98059) or the MAPK inhibitor PD98059 (+PD98059) was added to the cultures performed in liquid medium. The percentage of PPT-forming MKs was estimated by counting MKs exhibiting 1e or more cytoplasmic processes with areas of constriction at different days of culture. A total of 200 cells per well were counted. The histograms show 1 experiment for each THC2 patient with its respective control performed in triplicate. Data represent mean ± SD of triplicate. (A–C) Histograms show the percentage of PPT bearing MKs before and after inhibition of MAPK pathway with PD98059 inhibitor. (A) PD3_2 and PD5_III4 patient with their respective control, (B) PD5_III2 and PD5_IV1 patients, (C) PD3_3 patient and its respective control. (D and E) Representative microscopic images of PPT formation by control and patient MKs before and after addition of PD98059 inhibitor. (D) PD5_III2 and PD5_IV1 patients. (E) PD3_3 patient and its respective control.

research article
588 The Journal of Clinical Investigation http://www.jci.org Volume 124 Number 2 February 2014
ANKRD26 is localized in the inner part of the cell membrane and can interact with transmembrane receptors (31). An attrac-tive hypothesis would be that ANKRD26 controls MPL signal-ing through its trafficking. In conclusion, our data show that the loss of inhibitory regulatory function of RUNX1 and FLI1 leads to ANKRD26 overexpression in MKs. ANKRD26 accu-mulation at the inner part of the MK membrane may alter the TPO/MPL, which is confirmed by the increase in MAPK/ERK pathway activity in patients’ MKs. ERK1/2 overactivation will, in turn, alter PPT formation and contribute to thrombocytopenia in THC2 patients (Figure 8).
TPO/MPL regulates not only MK differentiation, but also the HSC and progenitor (HSC/P) compartment. Thus, we cannot exclude that the ANKRD26-mediated deregulation of signaling pathways might also take place in HSC/HP and promote leukemic transformation of hematopoietic progenitors. MAPK signaling pathway upregulation in many cancer cells leads to increased proliferation and cell survival. Several MEK inhibitors have been developed for use in clinical trials and a recent phase III study of MEK1/MEK2 inhibitor Trametinib in patients with metastatic cutaneous melanoma showed improved survival (32). Therefore, this MAPK sustained activation in THC2 patients’ MKs could be considered, in the future, as a therapeutic target for controlling thrombocytopenia.
mouse primary MKs, clearly confirming that MAPK activation is necessary for initiation of MK differentiation (23, 25, 30). In human cord blood–derived CD34+ progenitors, MAPK pathway functions as a negative regulator of TPO-induced mitogenesis and, contrary to the cell lines, its inhibition does not affect the expression of MK-specific markers (23). According to these observations, the absence of a decrease in MK-specific markers and the small but significant decrease in ploidy levels in THC2 patients could be explained by increased ERK1/2 activation. Moreover, we show here that at later stages of MK differentia-tion, MAPK/ERK1/2 pathway signaling progressively decreases until it reaches nearly complete inactivation at the stage of PPT formation. To understand whether ERK1/2 inactivation is nec-essary for platelet generation, we used an MEK inhibitor at a concentration that did not affect MK differentiation. Using this approach, we confirmed the previously reported data (16) showing that MAPK pathway inhibition is necessary for PPT formation. This was further demonstrated by using a dominant negative and an active form of MEK. Thus, sustained ERK1/2 activation in MKs of THC2 patients could explain the profound alteration in PPT formation and could likely explain the throm-bocytopenia. This was confirmed by the rescue of PPT forma-tion by MEK inhibition.
Figure 8Schema of thrombocytopenia induction in THC2 patients. (A) In healthy individual, RUNX1/FLI1 complex negatively regulates ANKRD26 gene expression in MKs. The activity of the TPO/MPL/MAPK/ERK pathway progressively decreases during MK differentiation, which is necessary for efficient PPT formation. (B) In THC2 patients, the mutations in 5′ UTR of the ANKRD26 gene prevent RUNX1/FLI1 inhibition, leading to the over-expression of ANKRD26 expression in MKs. According to published data (31), ANKRD26 would accumulate at the inner part of the cell membrane and would modify TPO/MPL signaling, leading to the MAPK/ERK overactivation, followed by a profound defect in PPT formation.
research article
The Journal of Clinical Investigation http://www.jci.org Volume 124 Number 2 February 2014 589
copy and by immunofluorescence microscopy. Cells were stained with anti-CD61 (clone SZ21; Immunotech) and anti–α-tubulin (clone DM1A; Sigma-Aldrich) Abs, and MKs forming PPTs were identified as large CD61+ cells extending α-tubulin–positive long filamentous structures. The extent of PPT formation was calculated as the percentage of PPT-bearing CD61+ cells with respect to total CD61+ cells. For each specimen, at least 100 MKs were evaluated. The number of branching and platelet-like structures on each PPT-bearing MK was calculated. Images were acquired using an Olym-pus BX51 microscope (Olympus) through a ×20/0.5 UPlanF1 objective.
Virus construction and cell transduction. Lentiviral vector encoding for shRUNX1 was already described (35). shANK1, shANK2, and shFLI1 (Supplemental Table 2) were cloned into the sinPRRL-PGK-GFP lentivirus. The dominant negative of MEK1 (DNMEK) and the active form of MEK1 (MEKa) were cloned into the bicistronic retrovirus, which also encoded for GFP (14, 15). Viral particle production and cell transduction were per-formed, as previously described (36).
Control CD34+ cells (106/ml) were prestimulated for 24 hours with TPO, IL-3, SCF, and FLT3-L and transduced with concentrated lentivi-ral (shRUNX1, shFLI1, shANK1, shANK2, shSCR [control]) or retroviral (DNMEK1, MEK1a) particles for 12 hours at an MOI of 10 followed by a second transduction. Cells were then cultured in the presence of TPO alone.
Human factor-dependent cell line UT7/HA-MPL was maintained in DMEM supplemented with 10% heat-inactivated FCS, antibiotics, and 5 ng/ml of rhGM-CSF. Lentiviral particles (shANK1, shANK2, shSCR) were added for 12 hours at an MOI of 10.
Both CD34+ cells and UT7/HA-MPL cells were sorted by flow cytom-etry (FACS Vantage; BD Biosciences) 48 hours after transduction on GFP expression.
Quantitative RT-PCR. mRNA isolation, reverse transcription, and quanti-tative RT-PCR (qRT-PCR) analyses were performed as described (36). The expression levels of all genes studied were expressed relative to housekeep-ing genes PPIA and HPRT, with stable expression level during MK differen-tiation. Primer sequences are listed in Supplemental Table 2.
ChIP and promoter activity assays. ChIP assays were performed with a ChIP assay kit (Merck Millipore) using the anti-RUNX1 Ab and the anti-FLI1 Ab (ab23980 and ab15289, respectively; Abcam). Assays were performed using chromatin prepared from human MKs and analyzed as previously described (36, 37). Immunoprecipitated DNA was analyzed on a PRISM 7700 sequence detection system using SYBR green (Applied Biosystems) in duplicate. Two independent experiments were performed. Primer sequenc-es are listed in Supplemental Table 2.
Luciferase reporter assay. The 5′ UTR region of the ANKRD26 gene (from –347nt +1nt) was amplified by PCR on control or patient DNA and cloned into the reporter pLuc-MCS plasmid (Stratagene). HEL cells were cotransfected with the reporter plasmid plucANK without (WT) or with mutations found in 3 different THC2 pedigrees (c.-119C>A, c.-127A>T, c.-127delAT) and with TK-Renilla reporter (Promega) for normalization of transfection efficiency. Cells were harvested 48 hours after transfection. A dual luciferase assay was performed according to the manufacturer’s instructions (Promega). The luciferase activity was measured with an GloMax 96 Microplate Luminometer w/Dual Injec-tors (Promega). Sequences of primers used for promoter cloning are listed in Supplemental Table 2.
Western blot assays. For Western blot analysis, the UT7/HA-MPL trans-duced by lentivirus encoding for shRNA against ANKRD26 (shANK) or for control (scramble) shSCR was starved overnight (5% SVF, without cytokines) and stimulated by TPO (20 ng/ml). Primary MKs were derived from control or patient blood CD34+ cells in the presence of TPO and SCF. At day 8 of culture, they were starved for 24 hours without cytokines and stimulated by TPO (50 ng/ml. Nuclear and cytoplasmic extracts were pre-
MethodsPatients. Blood samples from THC2 patients, healthy subjects, and indi-viduals after mobilization were collected.
Samples. Peripheral blood CD34+ and CD45+ cells were separated by dou-ble-positive selection using a magnetic cell-sorting system (AutoMACS; Miltenyi Biotec SAS). The platelet-rich plasma was prepared by centrifuga-tion at 170 g for 10 minutes. Platelets were pelleted by centrifugation at 2,100 g for 10 minutes.
In vitro MK differentiation. Two different protocols were used for in vitro MK differentiation. In the first, patient or control CD34+ cells were grown in serum-free medium as previously reported (33). The medium was supple-mented with TPO (10 ng/ml; Kirin Brewery) alone or with TPO and stem cell factor (SCF 25 ng/ml; Biovitrum AB). In the second, patient or control CD45+ cells were cultured in Stem Spam medium (Stem Cell Technologies) supplemented with 10 ng/ml TPO, IL-6, and IL-11 (PeproTech EC Ltd.) (34).
Flow cytometry analysis. Cells were stained with directly coupled mAbs: anti-CD41 APC, anti-CD42 PE, and anti-CD49b FITC (BD Biosciences) for 30 minutes at 4°C. Depending on the experiments, MKs were sorted according to CD41 or CD41 and CD42 expression using an Influx flow cytometer equipped with 5 lasers (BD). For phospho-ERK staining, cells were fixed in 2% paraformaldehyde for 10 minutes, permeabilized with 0.2% Triton X-100 for 5 minutes, and incubated for 1 hour at 4°C with anti–P-ERK Ab (Cell Signaling) followed by incubation with Alexa Fluor 488–conjugated goat anti-rabbit IgG (Molecular Probes) for 30 minutes.
Ploidy analysis. At day 10 of culture, Hoechst 33342 (10 μg/ml; Sigma-Aldrich) was added in the medium of cultured MKs for 2 hours at 37°C. Cells were then stained with directly coupled mAbs: anti-CD41 APC and anti-CD42 PE (BD Biosciences) for 30 minutes at 4°C (20). Ploidy was measured in the CD41+CD42+ cell population by means of an Influx Flow Cytometer (BD) and calculated as previously described (20).
Fluorescence microscopy. Fibrillar collagen type I (Horm) from equine ten-dons (Nycomed) was incubated at a concentration of 50 μg/ml on coverslips overnight at 4°C. After washing, primary MKs grown in serum-free medium were plated on coated coverslips for 2 hours at 37°C (5% CO2 in air). Cells were then fixed in 2% paraformaldehyde for 10 minutes, permeabilized with 0.2% Triton X-100 for 5 minutes, and incubated with FITC-labeled phalloidin and monoclonal anti-vWF Ab for 1 hour; this was, followed by incubation with Alexa Fluor 546–conjugated goat anti-mouse IgG (Molecu-lar Probes) for 30 minutes. Finally, slides were mounted using Vectashield with Dapi (Molecular Probes). The MK (cells expressing vWF) exhibiting stress fibers were examined under a Leica DMI 4000, SPE, laser scanning microscope (Leica; Microsystems) with a ×63/1.4 numeric aperture (NA) oil objective. Images were processed using the Adobe Photoshop 6.0 software.
Quantification of PPTs bearing MKs. To evaluate the percentage of MKs forming PPTs in liquid medium, CD41+ cells were sorted at day 6 of culture and plated in 96-well plates at a concentration of 2,000 cells/well in serum-free medium in the presence of TPO (10 ng/ml). DMSO (control), indomethacin (10 μM; Sigma-Aldrich) and PD98059 (10 μM; Calbiochem) were added at day 8 of culture. MKs displaying PPTs were quantified between day 11 and day 13 of culture by enumerating 200 cells per well using an inverted microscope (Carl Zeiss,) at a magnification of ×200. MKs displaying PPTs were defined as cells exhibiting 1 or more cytoplasmic processes with constriction areas (3 wells were examined for each condition). Images were obtained using AxioVision 4.6 software. To evaluate the percentage of PPT-forming MKs after adhesion on different substrates, MKs were separated over a BSA gradient as previously described (34) and then plated onto coverslips coated with poly-L-lysine or fibrino-gen (100 μg/ml; Sigma-Aldrich) in 24-well plates (1 × 10⁵ cells per well) and allowed to adhere for 16 hours at 37°C and 5% CO2. The percentage of MKs extending PPTs was then evaluated by phase-contrast micros-
research article
590 The Journal of Clinical Investigation http://www.jci.org Volume 124 Number 2 February 2014
2009 to W. Vainchenker and 2013 to H. Raslova), the Centre de Référence des pathologies plaquettaires, INSERM ITMO IHP; by Italian grants from the Cariplo Fondation (2010.0807 to A. Baldu-ini; 2012.0529 to A. Balduini and P. Noris) and the Comitato Tele-thon Fondazione Onlus (grant GGP10089 to A. Balduini, P. Noris, and S. Perrota); and by European grant ERA-NET (to C. Balduini, 2013). D. Bluteau was supported by a postdoctoral fellowship from ANR. R. Favier, H. Raslova, N. Debili, and W. Vainchenker are recip-ients of a research fellowship from AP-HP-INSERM (to R. Favier and H. Raslova), from CHU Bordeaux (to N. Debili), and from IGR-INSERM (to W. Vainchenker). We thank P. Rameau for flow cell sorting and flow cytometry analysis (IRCIV, Gustave Roussy). We are grateful to C. Balduini (IRCCS San Matteo Foundation), A. Auvrignon (Hôpital Trousseau), and F. Boehlen (Geneva University Hospital, Geneva, Switzerland) for patient samples. We thank the patients and their families for participation in this study, F. Louache and D. Buet (INSERM U1009; Villejuif, France) for shFLI1 lentiviral vector, and Genethon for sinpRRL-PGK-GFP lentivirus vector.
Received for publication June 28, 2013, and accepted in revised form October 31, 2013.
Address correspondence to: Hana Raslova, INSERM UMR1009, Institut Gustave Roussy, 114 rue Edouard Vaillant, 94805, Ville-juif cedex, France. Phone: 33.1.42.11.46.71; Fax: 33.1.42.11.52.40; E-mail: [email protected].
pared as previously described (38). Western blot analyses were performed by using the following Abs: rabbit anti-ERK, anti–phospho-ERK, anti-AKT, anti–phospho-AKT, anti-STAT5, anti–phospho-STAT5 (Cell Signal-ing), mouse anti–β-actin (Sigma-Aldrich), rabbit anti-RUNX1, and rabbit anti-FLI1 (ab23980 and ab15289 respectively; Abcam). All protein blots were analyzed using Image Quant LAS 4000 (GE Healthcare) and protein expressions were quantified using ImageQuant TL 8.1 software.
Electron microscopy. In vitro–cultured MKs were fixed in 1.25% glutaral-dehyde (Fluka Chemie) and diluted in 0.1 M phosphate buffer (pH 7.2) for 1 hour at room temperature. Samples were processed for EM by standard procedures previously described (39). Sections were observed with a Jeol JEM-1010 transmission electron microscope at 80 kV.
Statistics. Data are presented as mean ± SD or ± SEM. Statistical signifi-cance was determined by Student’s t test or Mann-Whitney test. A P value of less than 0.05 was considered as statistically significant.
Study approval. Informed written consent was obtained from all human subjects in accordance with the Declaration of Helsinki. The study was approved by the Ethics Committee of INSERM RBM 01-14 for the proj-ect Network on the inherited diseases of platelet function and platelet production in France and by the IRBs of the IRCCS Policlinico San Matteo Foundation and of the Department of Pediatrics at the Second University of Naples.
AcknowledgmentsThis work was supported by French grants from the Agence Natio-nale de la Recherche (ANR-physiopathology, ANR-jeunes cherch-eurs to H. Raslova), the Ligue contre le Cancer (équipe labellisée
1. Noris P, et al. Mutations in ANKRD26 are respon-sible for a frequent form of inherited thrombocy-topenia: analysis of 78 patients from 21 families. Blood. 2011;117(24):6673–6680.
2. Noris P, et al. ANKRD26-related thrombocy-topenia myeloid malignancies. Blood. 2013; 122(11):1987–1989.
3. Savoia A, et al. An autosomal dominant thrombo-cytopenia gene maps to chromosomal region 10p. Am J Hum Genet. 1999;65(5):1401–1405.
4. Drachman JG, Jarvik GP, Mehaffey MG. Autoso-mal dominant thrombocytopenia: incomplete megakaryocyte differentiation linkage to human chromosome 10. Blood. 2000;96(1):118–125.
5. Pippucci T, et al. Mutations in the 5′ UTR of ANKRD26, the ankirin repeat domain 26 gene, cause an autosomal-dominant form of inherited thrombocytopenia, THC2. Am J Hum Genet. 2011; 88(1):115–120.
6. Necchi V, et al. Ubiquitin/proteasome-rich particu-late cytoplasmic structures (PaCSs) in the platelets and megakaryocytes of ANKRD26-related thrombo-cytopenia. Thromb Haemost. 2013;109(2):263–271.
7. Hahn Y, Bera TK, Pastan IH, Lee B. Duplication and extensive remodeling shaped POTE family genes encoding proteins containing ankyrin repeat and coiled coil domains. Gene. 2006;366(2):238–245.
8. Raciti GA, Bera TK, Gavrilova O, Pastan I. Par-tial inactivation of Ankrd26 causes diabetes with enhanced insulin responsiveness of adipose tissue in mice. Diabetologia. 2011;54(11):2911–2922.
9. Fei Z, Bera TK, Liu X, Xiang L, Pastan I. Ankrd26 gene disruption enhances adipogenesis of mouse embryonic fibroblasts. J Biol Chem. 2011; 286(31):27761–27768.
10. Thomas-Chollier M, et al. Transcription factor binding predictions using TRAP for the analysis of ChIP-seq data and regulatory SNPs. Nat Protoc. 2011; 6(12):1860–1869.
11. Marinescu VD, Kohane IS, Riva A. MAPPER: a search engine for the computational identification of putative transcription factor binding sites in multiple genomes. BMC Bioinformatics. 2005;6:79.
12. Huang H, et al. Differentiation-dependent inter-actions between RUNX-1 and FLI-1 during megakaryocyte development. Mol Cell Biol. 2009; 29(15):4103–4115.
13. Börsch-Haubold AG, Pasquet S, Watson SP. Direct inhibition of cyclooxygenase-1 and -2 by the kinase inhibitors SB 203580 and PD 98059. SB 203580 also inhibits thromboxane synthase. J Biol Chem. 1998;273(44):28766–28772.
14. Sabri S, et al. Differential regulation of actin stress fiber assembly and proplatelet formation by α2β1 integrin and GPVI in human megakaryocytes. Blood. 2004;104(10):3117–3125.
15. Besancenot R, et al. A senescence-like cell-cycle arrest occurs during megakaryocytic maturation: implications for physiological and pathological megakaryocytic proliferation. PLoS Biol. 2010; 8(9).pii:e1000476.
16. Minamiguchi H, et al. Simultaneous signalling through c-mpl, c-kit and CXCR4 enhances the proliferation and differentiation of human mega-karyocyte progenitors: possible roles of the PI3-K, PKC, and MAPK pathways. Br J Haematol. 2001; 115(1):175–185.
17. Ludlow LB, et al. Identification of a mutation in a GATA binding site of the platelet glycoprotein Ibbeta promoter resulting in the Bernard-Soulier syndrome. J Biol Chem. 1996;271(36):22076–22080.
18. Albers CA, et al. Compound inheritance of a low-frequency regulatory SNP and a rare null mutation in exon-junction complex subunit RBM8A causes TAR syndrome. Nat Genet. 2012;44(4):435–439.
19. Tijssen MR, et al. Genome-wide analysis of simul-taneous GATA1/2, RUNX1, FLI1, and SCL binding in megakaryocytes identifies hematopoietic regula-tors. Dev Cell. 2011;20(5):597–609.
20. Lordier L, et al. RUNX1-induced silencing of non-muscle myosin heavy chain IIB contributes to megakaryocyte polyploidization. Nat Commun. 2012;3:717.
21. Antony-Debré I, et al. MYH10 protein expression in platelets as a biomarker of RUNX1 and FLI1 altera-tions. Blood. 2012;120(13):2719–2722.
22. Yu M, et al. Direct recruitment of polycomb repres-sive complex 1 to chromatin by core binding tran-scription factors. Mol Cell. 2012;45(3):330–343.
23. Fichelson S, et al. Megakaryocyte growth and development factor-induced proliferation and differentiation are regulated by the mitogen-acti-vated protein kinase pathway in primitive cord blood hematopoietic progenitors. Blood. 1999; 94(5):1601–1613.
24. Rojnuckarin P, Drachman JG, Kaushansky K. Thrombopoietin-induced activation of the mito-gen-activated protein kinase (MAPK) pathway in normal megakaryocytes: role in endomitosis. Blood. 1999;94(4):1273–1282.
25. Guerriero R, et al. Inhibition of TPO-induced MEK or mTOR activity induces opposite effects on the ploidy of human differentiating megakaryocytes. J Cell Sci. 2006;119(pt 4):744–752.
26. Whalen AM, Galasinski SC, Shapiro PS, Nahreini TS, Ahn NG. Megakaryocytic differentiation induced by constitutive activation of mitogen-activated protein kinase kinase. Mol Cell Biol. 1997; 17(4):1947–1958.
27. Herrera R, Hubbell S, Decker S, Petruzzelli L. A role for the MEK/MAPK pathway in PMA-induced cell cycle arrest: modulation of megakaryocytic differentiation of K562 cells. Exp Cell Res. 1998; 238(2):407–414.
28. Racke FK, Lewandowska K, Goueli S, Goldfarb AN. Sustained activation of the extracellular signal-regu-lated kinase/mitogen-activated protein kinase path-way is required for megakaryocytic differentiation of K562 cells. J Biol Chem. 1997;272(37):23366–23370.
29. Rouyez MC, Boucheron C, Gisselbrecht S, Dusant-er-Fourt I, Porteu F. Control of thrombopoietin-induced megakaryocytic differentiation by the mitogen-activated protein kinase pathway. Mol Cell Biol. 1997;17(9):4991–5000.
30. Mazharian A, Watson SP, Séverin S. Critical role for ERK1/2 in bone marrow and fetal liver-derived primary megakaryocyte differentiation, motility, and proplatelet formation. Exp Hematol. 2009;37(10):1238–1249.

research article
The Journal of Clinical Investigation http://www.jci.org Volume 124 Number 2 February 2014 591
31. Liu XF, et al. ANKRD26 and its interacting partners TRIO, GPS2, HMMR and DIPA regulate adipogen-esis in 3T3-L1 cells. PLoS One. 2012;7(5):e38130.
32. Flaherty KT, et al. Improved survival with MEK inhibition in BRAF-mutated melanoma. N Engl J Med. 2012;367(2):107–114.
33. Debili N, Massé JM, Katz A, Guichard J, Breton-Gorius J, Vainchenker W. Effects of the recombi-nant hematopoietic growth factors interleukin-3, interleukin-6, stem cell factor, and leukemia inhibi-tory factor on the megakaryocytic differentiation
of CD34+ cells. Blood. 1993;82(1):84–95. 34. Balduini A, et al. Proplatelet formation in
heterozygous Bernard-Soulier syndrome type Bol-zano. J Thromb Haemost. 2009;7(3):478–484.
35. Bluteau D, et al. Dysmegakaryopoiesis of FPD/AML pedigrees with constitutional RUNX1 muta-tions is linked to myosin II deregulated expression. Blood. 2012;120(13):2708–2718.
36. Gilles L, et al. P19INK4D links endomitotic arrest and megakaryocyte maturation and is regulated by AML-1. Blood. 2008;111(8):4081–4091.
37. Bluteau D, et al. Down-regulation of the RUNX1-tar-get gene NR4A3 contributes to hematopoiesis dereg-ulation in familial platelet disorder/acute myelog-enous leukemia. Blood. 2011;118(24):6310–6320.
38. Komura E, et al. Spontaneous STAT5 activation induces growth factor independence in idiopathic myelofibrosis: possible relationship with FKBP51 overexpression. Exp Hematol. 2003;31(7):622–630.
39. Nurden P, et al. Impaired megakaryocytopoiesis in type 2B von Willebrand disease with severe throm-bocytopenia. Blood. 2006;108(8):2587–2595.