through data-driven life cycle management more railway for the money through data-driven life cycle...
TRANSCRIPT

1
More railway for the money Through data-driven life cycle management
23.11.2016 Presented at Intelligent Rail Summit 2016 by Peter Juel Jensen ([email protected])

2
Here is a railway line. It looks good, but up closer…

3
…in another perspective, we can see there is a problem.
- Let’s take a closer look together…

4
Introduction
– How Rail Net Denmark uses linear asset management software, that combines
master data and measurement data in a linear environment, to make smarter life
cycle management
– Specifically by identifying problem and solution for the shown track
– I’ll show you how we have done it, by telling you:
o What linear assets are
o How data is presented as linear data
o An example of using integrated data sources to smarter LCM:
Strategic renewal planning with ground penetrating radar
• GPR is more accurate than mathematical models based on track geometry
and probably 90% cheaper than conventional drilling on €/km
– Maybe you can use it in your country
– Maybe we can work together on making it even better
What this presentation is about
5
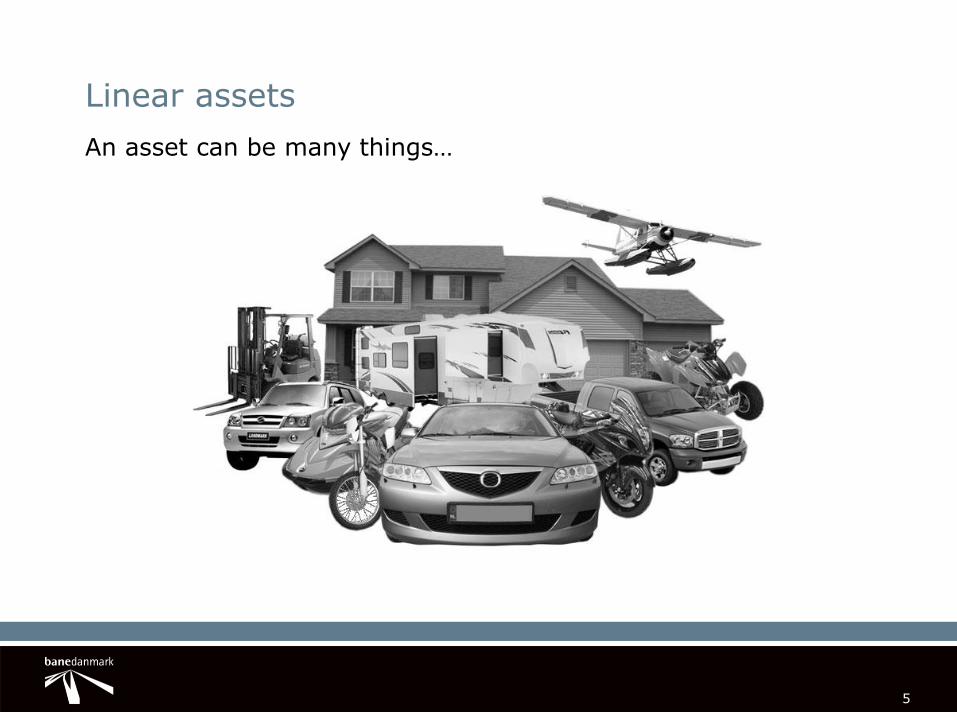
Linear assets
An asset can be many things…

6
Linear assets
”My” assets are railway tracks – in all kinds of shapes

7
Linear assets
Which is great for running trains from A to B, as a straight line is not always possible…
A
B
8
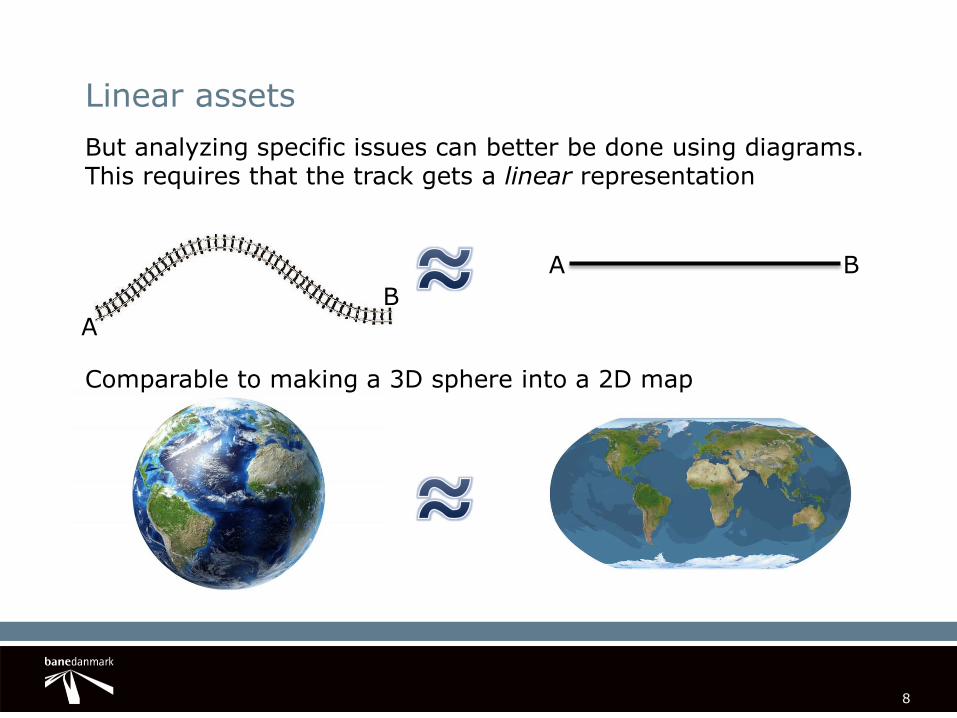
Linear assets
But analyzing specific issues can better be done using diagrams. This requires that the track gets a linear representation
Comparable to making a 3D sphere into a 2D map
A
B
A B

9
Linear assets
By representing the infrastructure linearly, as a track from one mileage to another, data can be presented on a diagram
A B

10
Linear asset management in IRISSYS
Asset data Infrastructure model Measurement data
Components needed to make an effective system
• Bridges • Level crossings • Curvature • Etc.
• Tracks • S&Cs • Line definitions • Etc.
• Track (geometric, corrugation etc.) • Rails (ultrasonic, eddy current) • Ballast (ground penetrating radar) • OCS (height, zigzag, thickness)
Each object identified by: • Line number • Track/S&C number • Mileage from/to

11
Case study
– The track mentioned in the introduction is to be renewed in 2019
– and the track geometry clearly has a problem, but…
o …what causes the problem?
o …what kind of renewal is needed? What is possible?
Strategic renewal analysis

12
To figure that out
We need to know something about the assets
Superstructure
Cant
Track geometry & deterioration rate
OCS wire height
Fine grade content
Moisture content
(Sub)ballast layer thickness
13
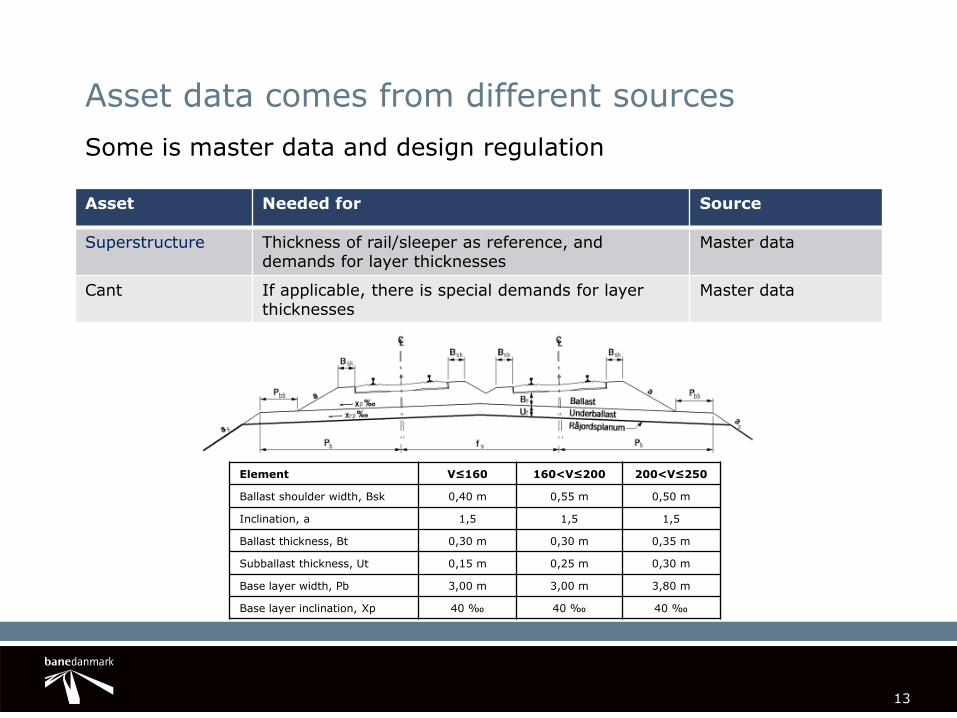
Asset data comes from different sources
Some is master data and design regulation
Asset Needed for Source
Superstructure Thickness of rail/sleeper as reference, and demands for layer thicknesses
Master data
Cant If applicable, there is special demands for layer thicknesses
Master data
Element V≤160 160<V≤200 200<V≤250
Ballast shoulder width, Bsk 0,40 m 0,55 m 0,50 m
Inclination, a 1,5 1,5 1,5
Ballast thickness, Bt 0,30 m 0,30 m 0,35 m
Subballast thickness, Ut 0,15 m 0,25 m 0,30 m
Base layer width, Pb 3,00 m 3,00 m 3,80 m
Base layer inclination, Xp 40 ‰ 40 ‰ 40 ‰
14
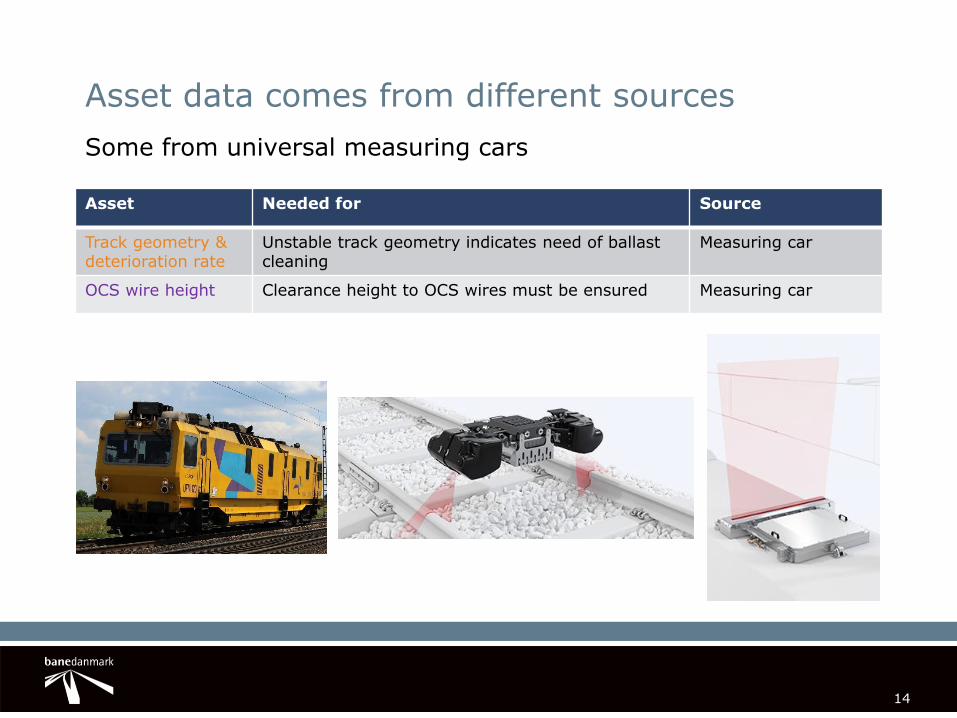
Asset data comes from different sources
Some from universal measuring cars
Asset Needed for Source
Track geometry & deterioration rate
Unstable track geometry indicates need of ballast cleaning
Measuring car
OCS wire height Clearance height to OCS wires must be ensured Measuring car

15
Asset data comes from different sources
And some from ground penetrating radar
Asset Needed for Source
(Sub)ballast layer thickness
Design criteria must be obeyed Ballast drillings GPR measurement
Moisture content Indicates if there is a drainage problem GPR measurement
Fine grade content Fouling limits must be obeyed GPR measurement
16
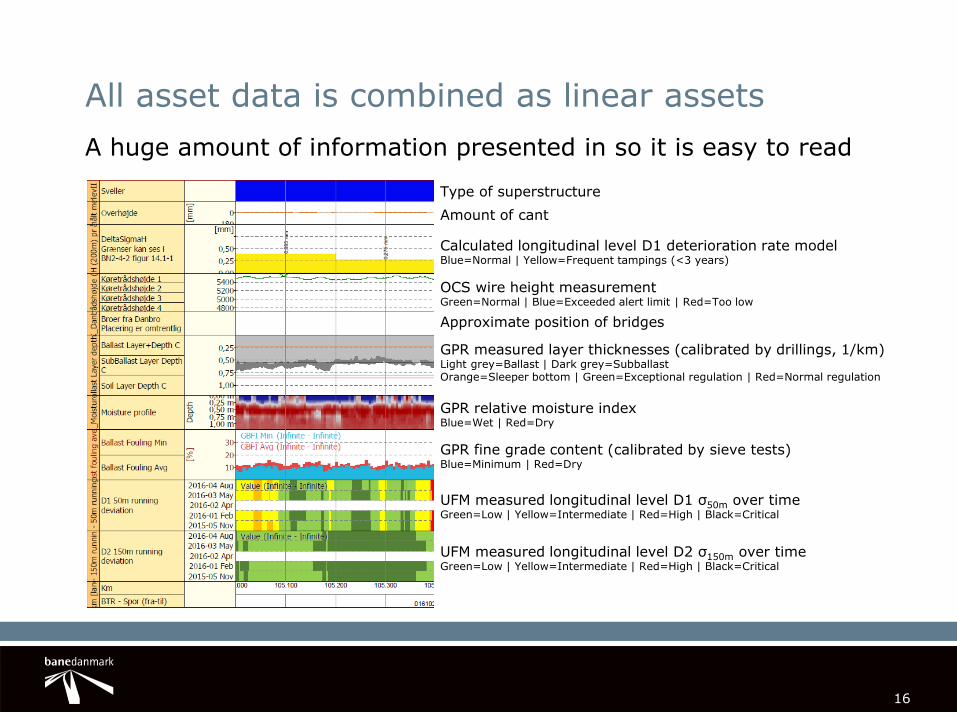
All asset data is combined as linear assets
A huge amount of information presented in so it is easy to read
Type of superstructure
Amount of cant
Calculated longitudinal level D1 deterioration rate model Blue=Normal | Yellow=Frequent tampings (<3 years)
OCS wire height measurement Green=Normal | Blue=Exceeded alert limit | Red=Too low
Approximate position of bridges
GPR measured layer thicknesses (calibrated by drillings, 1/km) Light grey=Ballast | Dark grey=Subballast Orange=Sleeper bottom | Green=Exceptional regulation | Red=Normal regulation
GPR relative moisture index Blue=Wet | Red=Dry
GPR fine grade content (calibrated by sieve tests) Blue=Minimum | Red=Dry
UFM measured longitudinal level D1 σ50m over time Green=Low | Yellow=Intermediate | Red=High | Black=Critical
UFM measured longitudinal level D2 σ150m over time Green=Low | Yellow=Intermediate | Red=High | Black=Critical
17
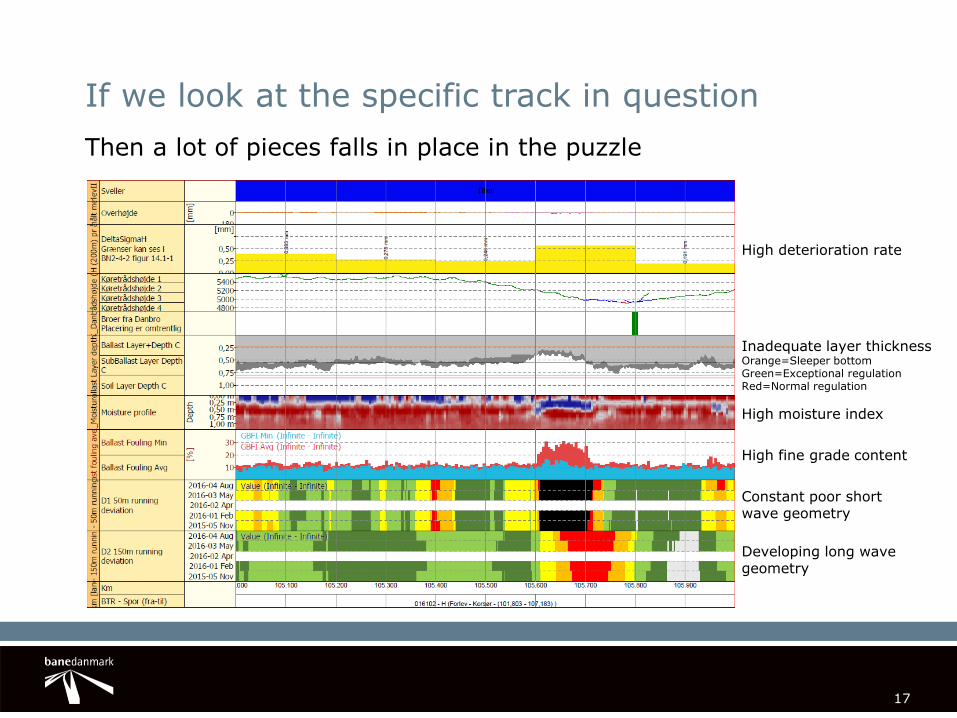
If we look at the specific track in question
Then a lot of pieces falls in place in the puzzle
High fine grade content
High moisture index
High deterioration rate
Inadequate layer thickness Orange=Sleeper bottom Green=Exceptional regulation Red=Normal regulation
Constant poor short wave geometry
Developing long wave geometry

18
What to do about it?
– The track geometry is unstable
indicating need of ballast cleaning
– There is a bridge which causes
the OCS wire height to be
lowered
– At present it is 180 mm lower
than it should be at renewal
– Just under the bridge there is
sufficient ballast, while 16 cm of
sub ballast is missing
– As there is no room upwards, this
can only be solved by making a
new track bed
Let’s take a closer look at the information
25
25

19
Conclusion
– Use of linear assets is useful for:
o Making it possible to overview huge amount of
information in a single view
o Combining data from different sources
– One example is use of master data, track geometry-, OCS-
and GPR-data for determining need of track bed renewal
– This combined use of data makes it possible to make smarter
renewal planning – and get more railway for the money
To summarize

20
If there is time… then I have a commercial
If any of you is interested in knowledge sharing, please do not hesitate to contact me. Here is an overview of our linear asset management software and interfaces: