throughput vs. distance tradeoffs and deployment
TRANSCRIPT

University of Nebraska - Lincoln University of Nebraska - Lincoln
DigitalCommons@University of Nebraska - Lincoln DigitalCommons@University of Nebraska - Lincoln
Faculty Publications in Computer & Electronics Engineering (to 2015)
Electrical & Computer Engineering, Department of
2008
Throughput vs. Distance Tradeoffs and Deployment Throughput vs. Distance Tradeoffs and Deployment
Considerations for a Multi-hop IEEE 802.16e Railroad Test Bed Considerations for a Multi-hop IEEE 802.16e Railroad Test Bed
Wei Wang University of Nebraska-Lincoln
Hamid Sharif University of Nebraska-Lincoln, [email protected]
Ting Zhou University of Nebraska-Lincoln
Puttipong Mahasukhon University of Nebraska
Follow this and additional works at: https://digitalcommons.unl.edu/computerelectronicfacpub
Part of the Computer Engineering Commons
Wang, Wei; Sharif, Hamid; Zhou, Ting; and Mahasukhon, Puttipong, "Throughput vs. Distance Tradeoffs and Deployment Considerations for a Multi-hop IEEE 802.16e Railroad Test Bed" (2008). Faculty Publications in Computer & Electronics Engineering (to 2015). 69. https://digitalcommons.unl.edu/computerelectronicfacpub/69
This Article is brought to you for free and open access by the Electrical & Computer Engineering, Department of at DigitalCommons@University of Nebraska - Lincoln. It has been accepted for inclusion in Faculty Publications in Computer & Electronics Engineering (to 2015) by an authorized administrator of DigitalCommons@University of Nebraska - Lincoln.

Throughput vs. Distance Tradeoffs and Deployment Considerations for a Multi-hop IEEE 802.16e
Railroad Test Bed Wei Wang, Hamid Sharif, Michael Hempel, Ting Zhou, Puttipong Mahasukhon
Computer and Electronics Engineering, University of Nebraska – Lincoln, USA [email protected]
Abstract—Throughput vs. distance analysis and coverage requirements are critical issues in planning wireless network deployments. With the recent availability of IEEE 802.16e and its promise of larger coverage areas for high-speed data communication, evaluating it in a real-world environment is very important to us in our ongoing study of standards based wireless technologies for the Federal Railroad Administration (FRA). In this paper, we present results obtained with our IEEE 802.16e module for NS-2, particularly throughput vs. distance performance, and its consideration for designing a real-world multi-hop IEEE 802.16e testbed. Firstly, a quantitative analysis of throughput vs. distance performance is conducted via extensive simulation, and the optimal modulation and coding scheme as well as channel bandwidth profiles are identified for specific distances. Secondly, we present a real-world multi-hop IEEE 802.16e testbed design intended for installation along BNSF Railway track in Nebraska. We apply our findings towards selecting various base station deployment locations and their appropriate communications parameters in order achieve best possible multi-hop throughput performance. We also provide a client access coverage analysis for the various locations.
Index Terms—IEEE 802.16e Wireless Networks, Railroad Mobile Multi-hop Test Bed.
I. INTRODUCTION The IEEE 802.16 standard [1] and its mobile service
enhancement 802.16e [2], known as Worldwide Interoperability for Microwave Access (WiMAX) are designed to provide broadband wireless access with high data rate [3] for large-scale coverage areas, especially for rural environments. Previous technologies, such as 802.11 WiFi, do not provide for sufficiently large coverage areas to be feasible in rural area deployments. This is a gap that 802.16e based networks promise to fill [4]. Also, for deployments alongside railroad tracks it is very important to achieve as large a coverage per location as possible in order to make it an economically viable solution.
In this paper, we study the IEEE 802.16e throughput and coverage performances and present our design of a real world IEEE 802.16e testbed located alongside to be located on approximately 52km of BNSF railroad track around Crete, Nebraska. The contribution of this paper is twofold: First, the throughput vs. distance performance for a single IEEE
802.16e base station is evaluated; the results of which we hope may serve as a valuable reference for the development of future multi-hop IEEE 802.16e networks. Secondly, we demonstrate how our simulation results we obtained assisted us in designing our own real world multi-hop IEEE 802.16e test bed and the end-to-end throughput and coverage we can expect from it. Our results show the feasibility of covering the entire 52 km long test bed area with as little as 7 base stations while still providing a high end-to-end throughput.
Existing publications focus on very narrow sets of specific parameters in their evaluations and there is a lack of studies that present studies useful for network planning and designs, especially when the scenario requires mobile clients. In [5], the authors evaluate and present the effectiveness of rtPS, nrtPS and BE scheduling services in managing multimedia traffic. The link layer evaluation results highlights that rtPS scheduling is very robust for meeting the delay requirements. In the research of [6], the realistic attainable throughput performance based on the IEEE 802.16d standard was presented. The authors’ evaluation benchmark shows that the total average downlink throughput can be expected to be between 3 and 7 Mbps using a 5 Mhz channel bandwidth. In [7] the authors evaluated the performance of voice packet transmissions and the base station (BS) resource utilization for IEEE 802.16 based backhaul networks. Their link layer evaluation results demonstrate the effectiveness of rtPS scheduling service in utilizing radio resources, and the flexibility of the tradeoff between packet transmission efficiency and radio resource allocation efficiency. However, all of the above mentioned publications focus only on link layer throughput or scheduling performance. A throughput and coverage performance analysis for rural area wireless communications that could be applicable to our particular application in a large scale railroad testbed is missing. In this paper we aim our studies at applying our findings for IEEE 802.16e’s capabilities of providing high data rate, long distance, and large scale coverage for rural environments, at the design of a real world IEEE 802.16e testbed for our railroad wireless networking project.
This multi-hop IEEE 802.16e testbed will be established along the railroad tracks of the BNSF Hastings subdivision west of Crete, NE. in the US. The network will be designed as a chain topology, with base stations strung along a line that
978-1-4244-1645-5/08/$25.00 ©2008 IEEE 2596
Published in VTC Spring 2008. IEEE Vehicular Technology Conference, 2008, pp. 2596-2600; doi: 10.1109/VETECS.2008.570 Copyright 2008 IEEE. Used by permission.
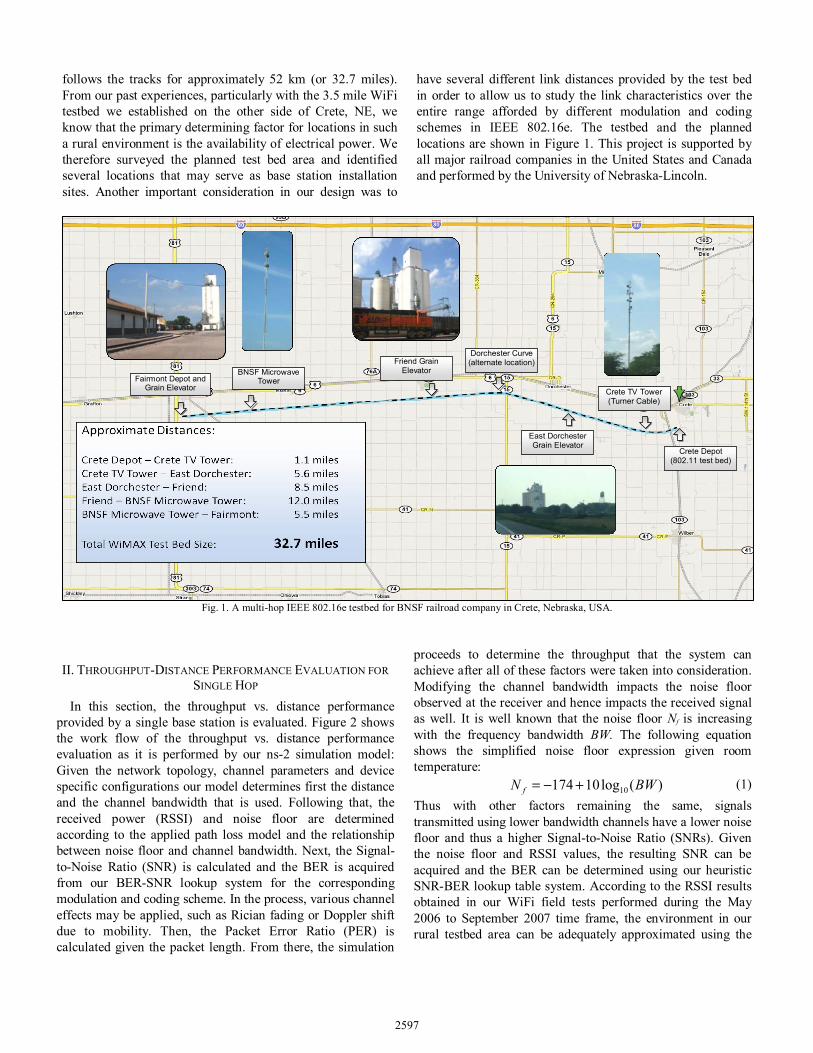
follows the tracks for approximately 52 km (or 32.7 miles). From our past experiences, particularly with the 3.5 mile WiFi testbed we established on the other side of Crete, NE, we know that the primary determining factor for locations in such a rural environment is the availability of electrical power. We therefore surveyed the planned test bed area and identified several locations that may serve as base station installation sites. Another important consideration in our design was to
have several different link distances provided by the test bed in order to allow us to study the link characteristics over the entire range afforded by different modulation and coding schemes in IEEE 802.16e. The testbed and the planned locations are shown in Figure 1. This project is supported by all major railroad companies in the United States and Canada and performed by the University of Nebraska-Lincoln.
Fig. 1. A multi-hop IEEE 802.16e testbed for BNSF railroad company in Crete, Nebraska, USA.
II. THROUGHPUT-DISTANCE PERFORMANCE EVALUATION FOR SINGLE HOP
In this section, the throughput vs. distance performance provided by a single base station is evaluated. Figure 2 shows the work flow of the throughput vs. distance performance evaluation as it is performed by our ns-2 simulation model: Given the network topology, channel parameters and device specific configurations our model determines first the distance and the channel bandwidth that is used. Following that, the received power (RSSI) and noise floor are determined according to the applied path loss model and the relationship between noise floor and channel bandwidth. Next, the Signal-to-Noise Ratio (SNR) is calculated and the BER is acquired from our BER-SNR lookup system for the corresponding modulation and coding scheme. In the process, various channel effects may be applied, such as Rician fading or Doppler shift due to mobility. Then, the Packet Error Ratio (PER) is calculated given the packet length. From there, the simulation
proceeds to determine the throughput that the system can achieve after all of these factors were taken into consideration. Modifying the channel bandwidth impacts the noise floor observed at the receiver and hence impacts the received signal as well. It is well known that the noise floor Nf is increasing with the frequency bandwidth BW. The following equation shows the simplified noise floor expression given room temperature:
)(log10174 10 BWN f +−= (1) Thus with other factors remaining the same, signals transmitted using lower bandwidth channels have a lower noise floor and thus a higher Signal-to-Noise Ratio (SNRs). Given the noise floor and RSSI values, the resulting SNR can be acquired and the BER can be determined using our heuristic SNR-BER lookup table system. According to the RSSI results obtained in our WiFi field tests performed during the May 2006 to September 2007 time frame, the environment in our rural testbed area can be adequately approximated using the
BNSF Microwave Tower
Friend Grain Elevator
Dorchester Curve (alternate location)
East Dorchester Grain Elevator
Crete TV Tower (Turner Cable)
Crete Depot (802.11 test bed)
Fairmont Depot and Grain Elevator
2597

free-space model with path loss exponent of 2.8, especially for distances larger than 100 meters. Other simulation parameters are stated as follows. The transmit and receive antenna gains are 18dB each. The transmission power of the base station (BS) is 29dBm and of the mobile subscriber station (MSS) is 23dBm. The frame duration is set to 0.02 second, and the packet size of the CBR traffic is chosen to be 1400 bytes. These parameters are chosen according to the IEEE 802.16e standard as well as hardware specifications for actual IEEE 802.16e devices.
Fig. 2. PHY Layer evaluation in simulation as part of the work flow for throughput vs. distance simulation
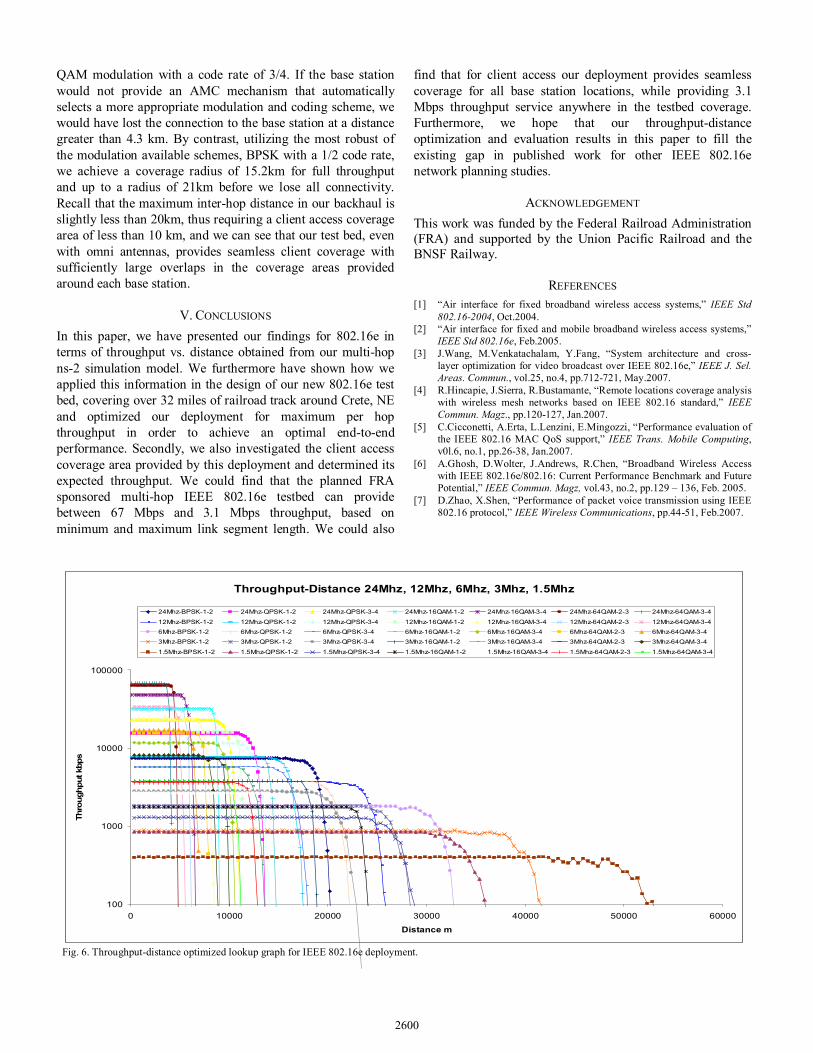
Figure 6, located at the end of the paper shows the throughput-distance performance for 24, 12, 6, 3, and 1.5 Mhz channel bandwidth respectively. It is clear that more robust modulation schemes with smaller frequency bandwidths can achieve larger communication distances but the tradeoff is found in the lower peak throughput. More efficient modulation and coding schemes with larger frequency bandwidths can achieve much higher peak throughput but incur a much shorter communication range. The throughput-distance optimization is simple once the throughput vs. distance curves are acquired: For a specific distance, the optimized modulation and coding scheme and channel bandwidth profile can be identified by selecting the desirable set satisfying the given requirements. The results in this figure also give throughput vs. distance boundaries for a single BS: Using the most efficient modulation and coding scheme and the largest frequency bandwidth, a single BS can cover an area with a radius of up to 5km (3 miles) while providing 67 Mbps throughput; using the most robust modulation and coding scheme and the lowest frequency bandwidth, this coverage area increases to a 51km (31.8 miles) radius, but at a reduced throughput of 400kbps. These results are especially positive for broadband access in rural areas and railroad applications where throughput-distance performance is critical.
III. OPTIMIZING MODULATION AND CODING SCHEME AND CHANNEL BANDWIDTH FOR A MULTI-HOP RAILROAD IEEE
802.16E TEST BED The backhaul end-to-end throughput is an important factor
for evaluating the performance of our testbed design. It is
straightforward to optimize the end-to-end throughput performance for the multi-hop IEEE 802.16e testbed by optimizing the throughput-distance performance of each individual link. We first need to measure the inter-AP distances for our testbed. To achieve this we utilized the GPS location information we obtained with our site survey. The resulting distances are shown in Figure 3. In the second step, we combine the single AP throughput-distance curves of different modulation and coding schemes, as well as the channel bandwidth profiles into one lookup graph. The combined lookup graph is shown in Figure 6, where the convex hull of throughput-distance performance is the optimized set of channel access profiles. Finally, we can directly lookup the best possible scheme in terms of throughput, given the individual distances we obtained between our test bed locations and thus optimize the entire test bed infrastructure.
Fig. 3. Link Segment Lengths for the FRA multi-hop IEEE 802.16e testbed in Crete, Nebraska, USA.
In order to show the achieved end-to-end throughput-distance performance gain using the proposed optimization, we compare our optimized solution with the maximum throughput scheme and the maximum distance scheme. For the maximum throughput scheme, the most efficient modulation scheme with the largest frequency bandwidth profile is applied. For the maximum distance scheme, the modulation and coding scheme and channel bandwidth profile resulting in the largest inter-AP distance is used for all inter-AP connections. The CBR traffic starts at the wired station located at Crete Depot (location 1). The mobile station is placed at a location closest to each one of the identified IEEE 802.16e base stations and is used to acquire the end-to-end throughput information. This simulation scenario is shown in Figure 1. We count the hops starting at the location Crete, NE, at the east end of our 802.16e test bed. Figure 4 shows the best possible throughput for each individual link segment, given its length and the appropriate optimal selection of channel bandwidth, modulation, and coding scheme. Clearly, we can observe two distinct bottlenecks. The first one is found at hop 2, which is between the Crete TV Tower and Dorchester’s grain elevator. This segment is almost 9 km long and results in a maximum throughput of slightly less than 15 Mbps. The second bottleneck, the major constraint in our network design and the longest link distance we have available, at close to 20 km, is
ns-2 simulator PHY Layer Receive Function (simplified)
Path Loss
Model
Noise Floor
BER Lookup
Channel Effects
Distance, etc.
Channel Bandwidth
Channel Effects
SNR
BER
2598
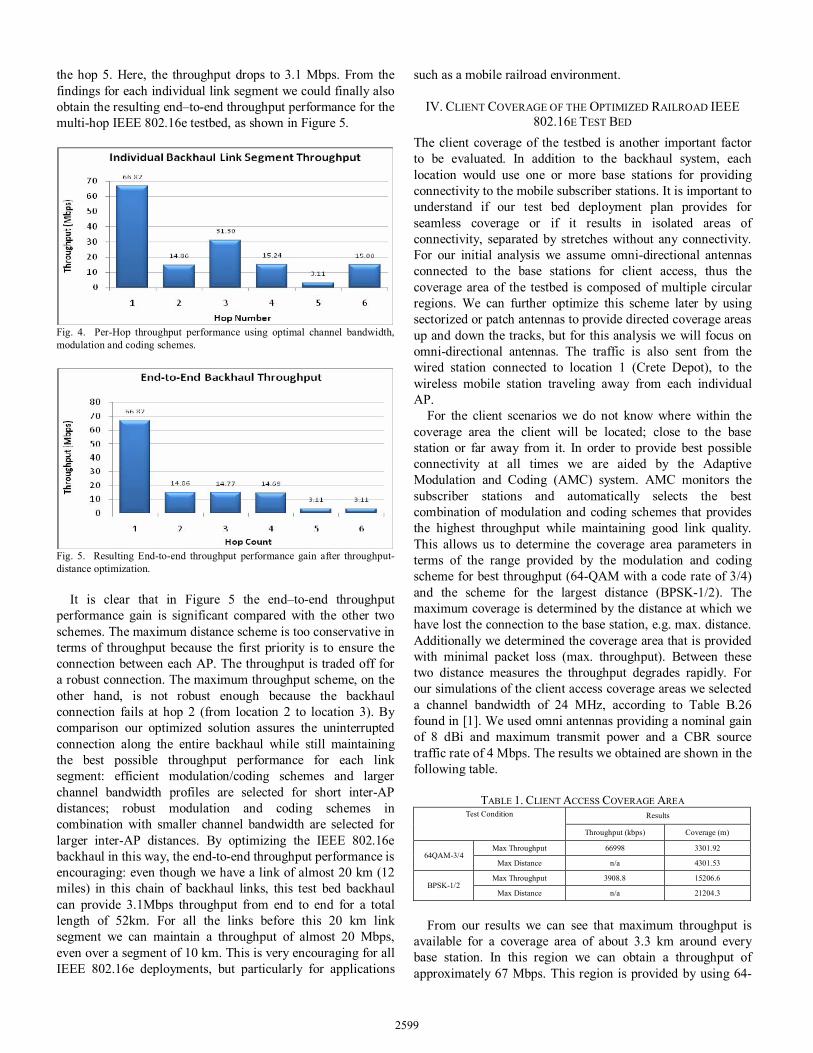
the hop 5. Here, the throughput drops to 3.1 Mbps. From the findings for each individual link segment we could finally also obtain the resulting end–to-end throughput performance for the multi-hop IEEE 802.16e testbed, as shown in Figure 5.
Fig. 4. Per-Hop throughput performance using optimal channel bandwidth, modulation and coding schemes.
Fig. 5. Resulting End-to-end throughput performance gain after throughput-distance optimization.
It is clear that in Figure 5 the end–to-end throughput performance gain is significant compared with the other two schemes. The maximum distance scheme is too conservative in terms of throughput because the first priority is to ensure the connection between each AP. The throughput is traded off for a robust connection. The maximum throughput scheme, on the other hand, is not robust enough because the backhaul connection fails at hop 2 (from location 2 to location 3). By comparison our optimized solution assures the uninterrupted connection along the entire backhaul while still maintaining the best possible throughput performance for each link segment: efficient modulation/coding schemes and larger channel bandwidth profiles are selected for short inter-AP distances; robust modulation and coding schemes in combination with smaller channel bandwidth are selected for larger inter-AP distances. By optimizing the IEEE 802.16e backhaul in this way, the end-to-end throughput performance is encouraging: even though we have a link of almost 20 km (12 miles) in this chain of backhaul links, this test bed backhaul can provide 3.1Mbps throughput from end to end for a total length of 52km. For all the links before this 20 km link segment we can maintain a throughput of almost 20 Mbps, even over a segment of 10 km. This is very encouraging for all IEEE 802.16e deployments, but particularly for applications
such as a mobile railroad environment.
IV. CLIENT COVERAGE OF THE OPTIMIZED RAILROAD IEEE 802.16E TEST BED
The client coverage of the testbed is another important factor to be evaluated. In addition to the backhaul system, each location would use one or more base stations for providing connectivity to the mobile subscriber stations. It is important to understand if our test bed deployment plan provides for seamless coverage or if it results in isolated areas of connectivity, separated by stretches without any connectivity. For our initial analysis we assume omni-directional antennas connected to the base stations for client access, thus the coverage area of the testbed is composed of multiple circular regions. We can further optimize this scheme later by using sectorized or patch antennas to provide directed coverage areas up and down the tracks, but for this analysis we will focus on omni-directional antennas. The traffic is also sent from the wired station connected to location 1 (Crete Depot), to the wireless mobile station traveling away from each individual AP.
For the client scenarios we do not know where within the coverage area the client will be located; close to the base station or far away from it. In order to provide best possible connectivity at all times we are aided by the Adaptive Modulation and Coding (AMC) system. AMC monitors the subscriber stations and automatically selects the best combination of modulation and coding schemes that provides the highest throughput while maintaining good link quality. This allows us to determine the coverage area parameters in terms of the range provided by the modulation and coding scheme for best throughput (64-QAM with a code rate of 3/4) and the scheme for the largest distance (BPSK-1/2). The maximum coverage is determined by the distance at which we have lost the connection to the base station, e.g. max. distance. Additionally we determined the coverage area that is provided with minimal packet loss (max. throughput). Between these two distance measures the throughput degrades rapidly. For our simulations of the client access coverage areas we selected a channel bandwidth of 24 MHz, according to Table B.26 found in [1]. We used omni antennas providing a nominal gain of 8 dBi and maximum transmit power and a CBR source traffic rate of 4 Mbps. The results we obtained are shown in the following table.
TABLE 1. CLIENT ACCESS COVERAGE AREA
Results Test Condition Throughput (kbps) Coverage (m)
Max Throughput 66998 3301.92 64QAM-3/4
Max Distance n/a 4301.53
Max Throughput 3908.8 15206.6 BPSK-1/2
Max Distance n/a 21204.3
From our results we can see that maximum throughput is
available for a coverage area of about 3.3 km around every base station. In this region we can obtain a throughput of approximately 67 Mbps. This region is provided by using 64-
2599
QAM modulation with a code rate of 3/4. If the base station would not provide an AMC mechanism that automatically selects a more appropriate modulation and coding scheme, we would have lost the connection to the base station at a distance greater than 4.3 km. By contrast, utilizing the most robust of the modulation available schemes, BPSK with a 1/2 code rate, we achieve a coverage radius of 15.2km for full throughput and up to a radius of 21km before we lose all connectivity. Recall that the maximum inter-hop distance in our backhaul is slightly less than 20km, thus requiring a client access coverage area of less than 10 km, and we can see that our test bed, even with omni antennas, provides seamless client coverage with sufficiently large overlaps in the coverage areas provided around each base station.
V. CONCLUSIONS In this paper, we have presented our findings for 802.16e in terms of throughput vs. distance obtained from our multi-hop ns-2 simulation model. We furthermore have shown how we applied this information in the design of our new 802.16e test bed, covering over 32 miles of railroad track around Crete, NE and optimized our deployment for maximum per hop throughput in order to achieve an optimal end-to-end performance. Secondly, we also investigated the client access coverage area provided by this deployment and determined its expected throughput. We could find that the planned FRA sponsored multi-hop IEEE 802.16e testbed can provide between 67 Mbps and 3.1 Mbps throughput, based on minimum and maximum link segment length. We could also
find that for client access our deployment provides seamless coverage for all base station locations, while providing 3.1 Mbps throughput service anywhere in the testbed coverage. Furthermore, we hope that our throughput-distance optimization and evaluation results in this paper to fill the existing gap in published work for other IEEE 802.16e network planning studies.
ACKNOWLEDGEMENT This work was funded by the Federal Railroad Administration (FRA) and supported by the Union Pacific Railroad and the BNSF Railway.
REFERENCES [1] “Air interface for fixed broadband wireless access systems,” IEEE Std
802.16-2004, Oct.2004. [2] “Air interface for fixed and mobile broadband wireless access systems,”
IEEE Std 802.16e, Feb.2005. [3] J.Wang, M.Venkatachalam, Y.Fang, “System architecture and cross-
layer optimization for video broadcast over IEEE 802.16e,” IEEE J. Sel. Areas. Commun., vol.25, no.4, pp.712-721, May.2007.
[4] R.Hincapie, J.Sierra, R.Bustamante, “Remote locations coverage analysis with wireless mesh networks based on IEEE 802.16 standard,” IEEE Commun. Magz., pp.120-127, Jan.2007.
[5] C.Cicconetti, A.Erta, L.Lenzini, E.Mingozzi, “Performance evaluation of the IEEE 802.16 MAC QoS support,” IEEE Trans. Mobile Computing, v0l.6, no.1, pp.26-38, Jan.2007.
[6] A.Ghosh, D.Wolter, J.Andrews, R.Chen, “Broadband Wireless Access with IEEE 802.16e/802.16: Current Performance Benchmark and Future Potential,” IEEE Commun. Magz, vol.43, no.2, pp.129 – 136, Feb. 2005.
[7] D.Zhao, X.Shen, “Performance of packet voice transmission using IEEE 802.16 protocol,” IEEE Wireless Communications, pp.44-51, Feb.2007.
Throughput-Distance 24Mhz, 12Mhz, 6Mhz, 3Mhz, 1.5Mhz
100
1000
10000
100000
0 10000 20000 30000 40000 50000 60000
Distance m
Thro
ughp
ut k
bps
24Mhz-BPSK-1-2 24Mhz-QPSK-1-2 24Mhz-QPSK-3-4 24Mhz-16QAM-1-2 24Mhz-16QAM-3-4 24Mhz-64QAM-2-3 24Mhz-64QAM-3-4
12Mhz-BPSK-1-2 12Mhz-QPSK-1-2 12Mhz-QPSK-3-4 12Mhz-16QAM-1-2 12Mhz-16QAM-3-4 12Mhz-64QAM-2-3 12Mhz-64QAM-3-46Mhz-BPSK-1-2 6Mhz-QPSK-1-2 6Mhz-QPSK-3-4 6Mhz-16QAM-1-2 6Mhz-16QAM-3-4 6Mhz-64QAM-2-3 6Mhz-64QAM-3-43Mhz-BPSK-1-2 3Mhz-QPSK-1-2 3Mhz-QPSK-3-4 3Mhz-16QAM-1-2 3Mhz-16QAM-3-4 3Mhz-64QAM-2-3 3Mhz-64QAM-3-4
1.5Mhz-BPSK-1-2 1.5Mhz-QPSK-1-2 1.5Mhz-QPSK-3-4 1.5Mhz-16QAM-1-2 1.5Mhz-16QAM-3-4 1.5Mhz-64QAM-2-3 1.5Mhz-64QAM-3-4
Fig. 6. Throughput-distance optimized lookup graph for IEEE 802.16e deployment.
2600