th's material has been cop-ed strictly prohibited
TRANSCRIPT

OOMMEECIA.T
Th's material has been cop-edunder licence from CANCOPY.
hesale or further copying of this material j.;strictly prohibited.
Le pr6sent document a 6tAPird.185.avec l'autorisation de CANCOPY.
Lea revente ou la reproduction ult~rieurr)A Preliminary Survey of the VO1rdarfaTptgh ent interdites.
of S.G.H.W.
by
D. C. LESLIE
and
P. A. B. MUDOCH*
-SU MARY-
The void coeffioient of SG.H.W. reactors has been surveyed over awide range of lattice parameters using the 5-group and 2-group schemes ofcalculation developed for this type of reactor. The results have beenused to infer the dependence of the void coefficient on the latticeparameters, to assist in the specification of the Winfrith experimentalprogramme on S.G.H.W., and to suggest howy the design of a power reactorshould be modified to achieve an acceptable void coefficient at the startof life.
It is concluded that, according to the 5-group scheme, the voidcoefficient may be reduced by reducing the pitch, by squeezing water butof the cluster (though if VD2 d U02 is allowed to increase at the same
time, most of the effect will be lost), by increasing the enrichment, andby using pins about 0.4P in diameter. The coefficient is insensitive tomoderator.and coolant temperature, and is increased by any departure froma regular fuel arrangement.
A.E.E.,
Winfrith.
July, 1962
IV.5040
*Attached from Babcock and Wilcox, Ltd.
. : ' -, -4:;:

CO NTENTS
1. Introduction 1
2. Review of general principles 2
3. Discussion of some detailed physics effects 6
4. Parametrio dependenoq of the void 10coefficient
5. Conclusions from this study 31
6. Implications for the design of a power 33reactor
7. Implications for the apeoifioation of an 34experimental programme
8. Acknowledgments 36
References 37-38
Appendix 39

1. Introduction
Two complote computer schemes are at present available for studying thelattice plhsics of PTiH/ reactors. These are the Winfrith 5-group scheme (1)and the SGtI! series of 2-group programmes (2). Studios reported in reference3 showed that the two schemes were in flat disagreement ovor the void-cooeffioient of reactivity of the "old" 61-rod SMGHV power reactor: a parameterlist for this reactor is given in .reference 3. The 2-group scheme suggestedthat the void coefficient (as defined below) was only just positive, whilethe 5-group scheme indicated that it was markedly positive.
Calculations using more elaborate and fundamental methods tended tosupport the verdict of the 5-group soheme that this 61-rod design would havean unacoeptably positive void coefficient. To assist in tho planning of anexperimental programme aimod at elucidating tha void coefficient of-an SHIrTboiling channel, a survey was made, with both sohemos, of all the SGhVl typecores which could be constructed With the fuel and lattice plates thenavailable at Ylinfrith.
The reasoning which led to the selection of the experimental programmewhich is now (June 1962) under way is briefly discussed in section 7 and will bereported in detail elsewhere. Mhen the results of-the survey were studied,certain general principles governing the value of the void coefficient beganto emerge. The survey was therefore continued in order to clarify theseprinciples, and the present Report is concerned with the findings of thissurvey. The main emphasis is on the predictions of the 5-group scheme, thoughthere is extensive reference to the 2-group scheme and some comparison withmore sophisticated methods of calculation. It must be remembered that the.5-group scheme is not necessarily reliable for the calculation of voidcoefficients' (though present evidence is encouraging) and that the conclusionsof this report must be treated with reserve until they have been compared withexperiment.
The 5-group calculations have all been made with the Mercury programmesSANDPIPER III (4) and ARlISTOS (5). rThe Fortran programme ASETIUJSELrH6)became available during the course of this study. Both the physics and thenuclear data of METHUSEILH are slightly different from those of SANDPIPMR,ARISTOS, and the void coefficients given by 10UT1IUSELAH do not agree exactlywith those given by SANDPIRER-ARISTOS; the differences have been carefullyreviewed by Allen (7). Although METUMSELAH is presumed to be more accuratethan the Meroury programmes, its adoption in this survey would have meantrepeating all the work done before it became available.
The discussion in this Report is confined to clean unpoisonod lattices,though some consideration is given to the effects of temperature.
- 1 -

2. Review of general principles
2.1 The definition of void coefficient. vie have chosen to define thevoid coefficient VC as
VO = 100 k (p= 0.4) -k0 ( 0 ~= 8)] % (2.1)
where e is the coolant density .in gm/co. koD is evaluated in areactor which is axially uniform and which has a uniform lattice inthe radial direction. Therefore no account is taken in the calcu-lation of either the radial and axial form factors, nor of thevariation of coolant density both up the channel and aoross the fuelcluster. The radial form factor should be adequately accounted forby the usual radial averaging procedures. Moxon (8) has shown that,in one case at least, replacing a flat distribution of bubbles acrossthe fuel cluster by the variation of density suggested by currentviews on bubble dynamics makes almost no difference to the voidcoefficient. The effect of the axial variation of neutron flux andcoolant density is currently being studied with the programmeSTAGNANT (9), and this work will be reported in due course.
It will be seen from equation (2.1) that a positive voidcoefficient implies a gain in reactivity as the coolant density isreduced. Thus a positive ooeffioient is destabilising whereas anegative coefficient is stabilising. [:Fell and co-workers (10) haveshown that if V0 is very negative, a different kind of instabilitymay ensue.]. Since leakage always increases as the coolant density pis decreased, the void coefficient of keff is always less than thatof koo, though the difference is not large for a big power reactor.The present design aim is to ensure that the void coefficient asdefined by equation (2.1) is near-zero.
In present SGMY designs, saturated water enters the channel ata density of about 0.7 gm/cc. The exit quality is about 13%, corres-ponding to an exit density of about 0.2 gm/oc., and the channel -averaged density is about 0.4 gm/oc. The reactivity held in voidsis therefore approximately
ko (e- 0.4) - o (o - 0.7)
kuo (= 0.4) (2.2)
and VO somewhat overestimates this quantity. However Vo is more con-venient to compute, and serves to reveal general trends just as wellas the quantity (2.2). In some oases, the curve of koD against p mayhave "wiggles" in it, and then no one parameter gives a completeguide to stability.
It should be noted that, because of the multiplying factor 100,VO is a number of the order of unity.
- 2 -
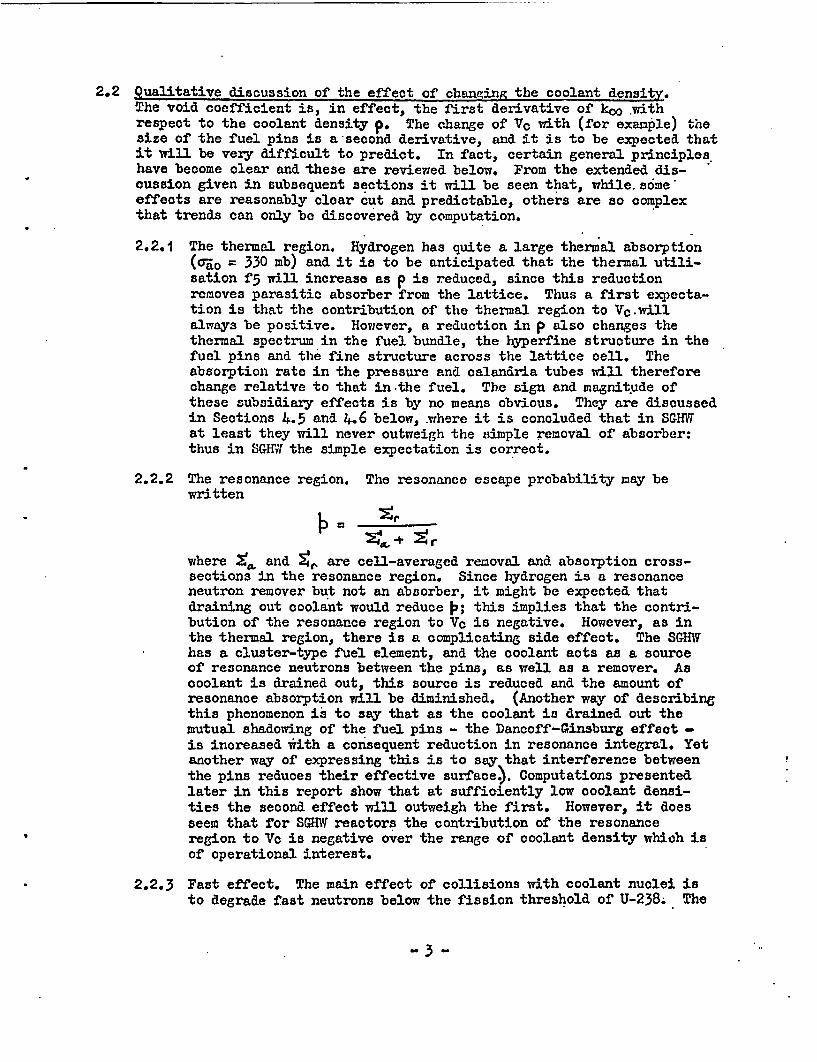
2.2 Qualitative discussion of the effect of chazging the coolant density.The void coefficient is, in effect, the first derivative of kIo withrespect to the coolant density p. The change of Vc with (for example) thesize of the fuel pins is a second derivative, and it is to be expected thatit will be very difficult to predict. In fact, certain general principleshave become clear and these are reviewed below. From the extended dis-cussion given in subsequent sections it will be seen that, while. smeeffects are reasonably clear cut and predictable, others are so complexthat trends can only be discovered by computation.
2.2.1 The thermal region. Hydrogen has quite a large thermal absorption(rao = 330 mb) and it is to be anticipated that the thermal utili-sation f5 will increase as p is reduced, since this reductionremoves parasitic absorber from the lattice. Thus a first expecta-tion is that the contribution of the thermal region to Vc.willalways be positive. However, a reduction in p also changes thethermal spectrum in the fuel bundle, the hyperfine structure in thefuel pins and the fine structure across the lattice cell. Theabsorption rate in the pressure and calandria tubes will thereforechange relative to that in the fuel. The sign and magnit ude ofthese subsidiary effects is by no means obvious. They are discussedin Sections 4.5 and 4.6 below, where it is concluded that in SGHWat least they will never outweigh the simple removal of absorber:thus in SG.HW the simple expectation is correct.
2.2.2 The resonance region. The resonance escape probability may bewritten
tam + Mto
where X,.' and 4r are cell-averaged removal and absorption cross-sections in the resonance region. Since hydrogen is a resonanceneutron remover but not an absorberP it might be expected thatdraining out coolant would reduce j; this implies that the contri-bution of the resonance region to VC is negative. However, as inthe thermal region, there is a complicating side effect. The SGHMhas a cluster-type fuel element, and the coolant acts as a sourceof resonance neutrons between the pins, as well as a remover. Ascoolant is drained out, this source is reduced and the amount ofresonance absorption will be diminished. (Another way of describingthis phenomenon is to say that as the coolant is drained out themutual shadowing of the fuel pins - the Dancoff-Ginsburg effect -is increased iith a consequent reduction in resonance integral. Yetanother way of expressing this is to say that interference betweenthe pins reduces their effective surface.). Computations presentedlater in this report show that at sufficiently low coolant densi-ties the second effect will outweigh the first. However, it doesseem that for SGUW reactors the contribution of the resonanceregion to Vo is negative over the range of coolant density which isof operational interest.
2.2.3 Fast effect. The main effect of collisions with coolant nuclei isto degrade fast neutrons below the fission threshold of U-238. The
- 3 -

opposing tendency, to retain within the fuel oluster neutrons whichmight otherwise have escaped into the bulk moderator, is small. Thusdraining out coolant must increase the fast effect, and the contributionof the fast region to V0 is always positive.
2.2.4 Presentation of sample numerioal results. Results for the old 61-rodpower reactor are presented in reference 3. Here we use one of thecores whioh is being studied in the Winfrith experimental programme asan illustration. This core has:
Fuel: 2.5 Co U02 , pellet diameter 0.5", canned in 0.036" AlFuel geometry: 37 rods .in 4 concentric ringsCoolant: H20 of various densities at room temperature (20C.)Pressure tube: Al, inside diameter 4.52", thickness 0.128"Calandria tube: Al., inside diameter 5.52", thickness 0.1921?Bulk moderator: D20 of 99. 7 purity at room temperature, on
an equivalent square pitch of 9.50".
Except for the temperature, this core is quite similar to that of the"new" 37-rod power reactor; a parameter list for this reactor is givenin Section 7.
Table I below shows the predictions of the 5-group scheme for thiscore.
Table I
5-group predictions for the 37/0.5/2.5/452/9.5 core
p (gm/oo )( )t P £ _ _ (I0f )
0.2 1.5430 0.7632 1.0352 0.6087 1.32180.4 1.5168 0.7726 1.0340 0.5831 1.30460.6 1.4952 0.7854. 1.0336 0.5753 1.29790.8 1.4755 0.7972 1.0328 0.5712 1.2922
VO = + 1.24Wo
Here (1f)t and (-qf)f are the ratios of the fission yield cross-seotion(i ) to the absorption cross-section in the thermal and fast groups(0 to 0.625 e.V. and 0.625 e.V. to 10 Mev respectively) formed by a2-group condensation of the original 5 groups: this condensation isdescribed in reference 5. p is here defined by
the cross-sections being averaged over the whole of the above-thermalregion. kco is then given by
kf ± ( (-4 O d
- 4 -

Finally, 6E- is defined as the ratio of the fission yield in the topgroup of the 5-group scheme (above the fast fission threshold) to thefission yields in the other 4 groups. Table II shows the predictionsof the two-group scheme for the same core:
Table II
2-group predictions for the 37/0.5/2.5/452/9.5 core
e (g/oo) 5 f5 p k CD -
0.2 1.4820 0.8524 1.0319 1.30360.4 1.4686 0.8585 1.0307 1.29940.6. 1.4567 0.8649 1.0295 1.2970.0.8 1.4457 0.8714 1.0284 1.2956
Vo - + 0.38%
These tables show that, according to both schemes,n 'f and E givepositive contributions to V0, while p gives a negative contribution:this is in agreement with the remarks of the preceding 3 paragraphs.It will also be seen that the 5-group void coefficient is more positivethan the 2-group one. This seems to be always so, although the magni-tude of the difference varies widely. The results in Tables I and IIare shown graphically in figure 1.
In reference 3, an attempt was made to locate the discrepancybetween the two schemes by comparing the variations with coolantdensity of the quantities Fj , . It was provisionally concluded thatthe discrepancy was in the thermal region, and that more sophisticatedmethods of calculation supported the 5-group account of thermal events.Further work by Green (11) suggests that, owing to the very differentinterpretation put on the symbols 7tf, p and £ in the two schemes, thisconclusion is not entirely correct: about half the discrepancy is dueto the differing treatment of resonance capture. Calculations byBriggs (12) using the Monte Carlo programme MOCUP suggest that althoughthe Hicks correlation (13) (which is used in the 5-group scheme) over-estimates p, it reproduces correctly the variation of p with i, overthe range of interest. This supports the view that the 5-group valueof VO for the old power reactor is nearly correct. A similar study isnow being made for the new power reactor.
- 5 -

3. Discussion of some detailed physics effects.
3.0 Arguments concerning the influence of certain detailed physics effectson void coefficient are presented here.
3.1 Thermal spectrum. It would seem at first sight that when coolant isremoved from an already undermoderated. system, the thermal spectrum in thefuel region must become harder. It is shown in reference 3 that this isnot sc in the old 61-rod power reactor. In fact, in this reactor the meanvalue in the fuel of Crgs (I), the Westoott absorption cross-seotion ofU-235, is almost independent Of e. This quantity is chosen as- a criterionof the variation of the thermal spectrum since the thermal utilisation maybe written
{5 5s(d) + so
where 0c is the number of barns of absorber (duly flux-weighted) perU235 atom.
To discover whether the result referred to above is general, thevariation of ,a5 (W) with e has been computed in a typical experimentalcore: the results are given in Table III below.
Table III'
Variation of MCa(W) with e in a 37/0.5/452/9.5" core
p (gm/co) (ras(W)
0.2 651.9 barns0.4 648.20.6 647.00.8 646.81.0 646.7
It will be seen that once again cr, ((r) is very insensitive to coolantdensity, and that the mean spectrum in the fuel actually gets very slightlysofter as coolant is removed. The change in o.5 (W) contributes about+ 0.07% to Vc; this is not significant.
3.2 Thermal fine structure. The flux disadvantage factor in the fuelincreases almost linearly with 1C,, the inverse diffusion length in thefuel. When coolant is removed both the average absorption and theaverage transport cross-sections of the fuel region are reduced and there-fore kV is also reduced. Thus removal of coolant may be expected to reducethe thermal fine structure. This is confirmed by the results given inTable IV for the 37/0.5/2.5/452/9.5 lattice, which we are using as anexample throughout this and the previous section.
- 6 -

Table IV
Fine structure factors according to the 5-group schemefor the 37/0.5/2.5/452/9.5 lattice
e(m/co) GR GRS
0.2 1.4127 1.5461 2.00410.4 1.4852 1.6270 2.03520.6 1.5463 1.6980 2.07620.8 1.5994 1.7607 2.1179
Here G is the ratio of the mean flux in the pressure tube to themean flux in the fuel
GR is the ratio of the mean flux in the calandria tube tothe mean flux in the fuel
GRS is the ratio of the mean flux in the bulk moderator to themean flux in the fuel.
(This conforms to the standard notation for physics calculations ongraphite reactors.)
This sort of behaviour has been found in all the cores examined sofar, and it seems clear that fino structure variations will always makeVc more positive. Part of the discrepancy between the two-and five-groupschemes is now known to lie in their accounts of fine structure. Compari-son with experiment and with more elaborate calculations suggests that the5-group scheme is nearer the truth, but it must be remembered that thecalculation of fine structure in a cluster fuel element is a particularlydifficult matter.
The discussion of hyperfine structure is deferred to sub-seotion 4.5,where the effect of pin size on Vo is examined. It will be clear thathyperfine structure also decreases as p is decreased, and that thisfurther increases the void coefficient.
3.3 The Dancoff-Ginsburg effect. Dresner's first equivalence theorem (14)relates the effective resonance integral of a lumped absorber to that of ahomogeneous distribution of the same absorber. It states that.the effect-ive resonance integral is a function only of
'1-N V (3.1)
where c is the potential scattering per U-238 atomF (15.9 barns in U02)
N 'is the number-density of U-238 atoms in the rod
S, V are the surface area and volume of the rod
- 7 -

Rothenstein (15) has shown that in a regular array of rods (3.4) should begeneralized to
P 4FNV (3.2)
where y is the Dancoff-Ginsburg factor, the reduction in the current ofresonance neutrons incident on the surface of the rod due to interceptionof these neutrons by neighbouring rods. Hicks (13) has used the relation(3.2), and has shown that the functional form
-3.43+ 3-1o(r) (3.3)
(both RI and 0 being expressed in barns) gives an adequate fit to the bestmeasurements of resonance integral. Hicks uses the Bell approximation tothe Dancoff-Ginsburg factor3
+ - S/ Vrnvv (3.4)
where Xr is the macroscopic scattering oross-section of the coolant, and v.,the volume of coolant associated with one fuel pin. (Hicks also hasspecial treatments for the cladding and for the fuel pins on the edge ofthe cluster, which need not concern us here).
Combining (3.2) and (3.4), we find for circular pins that
o- * -+Smo Px (3.5)
where g is the pin radius and Scathe macroscopic scattering crosB-seotionof the coolant at unit density, while
v3 vA0 (3.6)
is the ratio of coolant volume to fuel volume.
Since equation (3.3) implies that the resonance integral increasesmonotonically with T the following conclusions can be drawn at once fromequation (3.5):
(i) The resonance integral is a monotonically increasing function ofcoolant density.
(ii) This change in resonance integral is smaller for large pins.
While the above deduction is based on the use of the Hicks correlation, itis likely that the conclusions are generally true.
- 8 -

The resonance integral is not of direct importance. The significantquantity is the resonance escape probability p, which in the 5-group schemeis roughly given by
-6f + °' IO )
Here U6 i* is the raw group 3 removal cross-section per U-238 atom, given.(for an SGHW) by
where
VDy x ̂ (3.8)
is the ratio of bulk moderator volume to fuel volume. Also, Ga , thegroup 3 absorption cross-section, is given by
o =r - o(ri.36 + 0a). (b0X) s)l
The above formulae oversimplify the physical situations sinoe they ignoreremovals in the cladding, PT and CT, any fine structure in the group 3 fluxtand captures by U-235 in group 3. The first two effects are not veryimportant, but in a typical SGHVI about 2% of all group 3 captures occur inU-235. In ignoring these captures we overestimate p, but do not seriouslyalter the variation of p with p and g.
Figure 2 shows the variation of p with p for a reactor with x= 1.2and y = 6 (these values being quite close to those for the current 37 rodpower reactor), and with both 0.3" and 0.5" pins. A positive slope on thisgraph implies a negative contribution of p to V0 . Therefore the figureshowes that the contribution of p to Vc is negative over the operatingrange of densities, but becomes positive for very low densities. It shouldbe re-iterated that figure 1 'is based on the Hicks correlation (13). Cal-oulations with the Monte Carlo programme MOCUP confirm the trend of p withe for e greater than 0.3 gm/cc. They do not confirm the existence of thedip in the curve at e values of about 0.2 gm/co, though a small dip mightbe concealed by the statistical fluctuations inherent in the Monte Carlomethod.
Figure 1 also shows that the negative contribution of p to Vc in theoperating range of densities is larger for the 0.5" pins than for the 0.3"pins. This point will be taken up again in sub-section 4.5, in which thedependence of V0 on pin size is discussed.
- 9 -

4. Parametric dependence of the void coefficient
In order to achieve the design aim of a near zero V0, it is necessary toknow how V0 varies with the main design parameters of the core (though thereare naturally many other constraints on these parameters). The relevantparameters are:-
Size, number and spacing of the fuel pins
Can thickness
Fuel enrichment
Lattice pitch
Diameter and thickness of pressure tubes and oalandria tubes
We find it convenient to combine some of these quantities, and to t ake asour basic parameters the quantities
VH VH2 andy D2 0
VU02. VU02
Sub-sections 4.1 and 4.2 are devoted to a description of the effect on V0 ofvariations in y and x: these variations are summarised in figures 14 to 23.In 4.3, we show that moderator and coolant temperature have only a minorinfluence on VO, while the effect of varying the enrichment and the pin sizeare discussed in sub-sections 4.4 and 4.5. The effect of pin arrangement andof pressure and oalandria tube thickness are investigated in sub-sections 4.6and 4.7, and the results are summarized in sub-section 4.8.
The present section is the heart of this report. Previous sections havebeen descriptive, but we now present the large number of calculations of voidcoefficient which we have made.
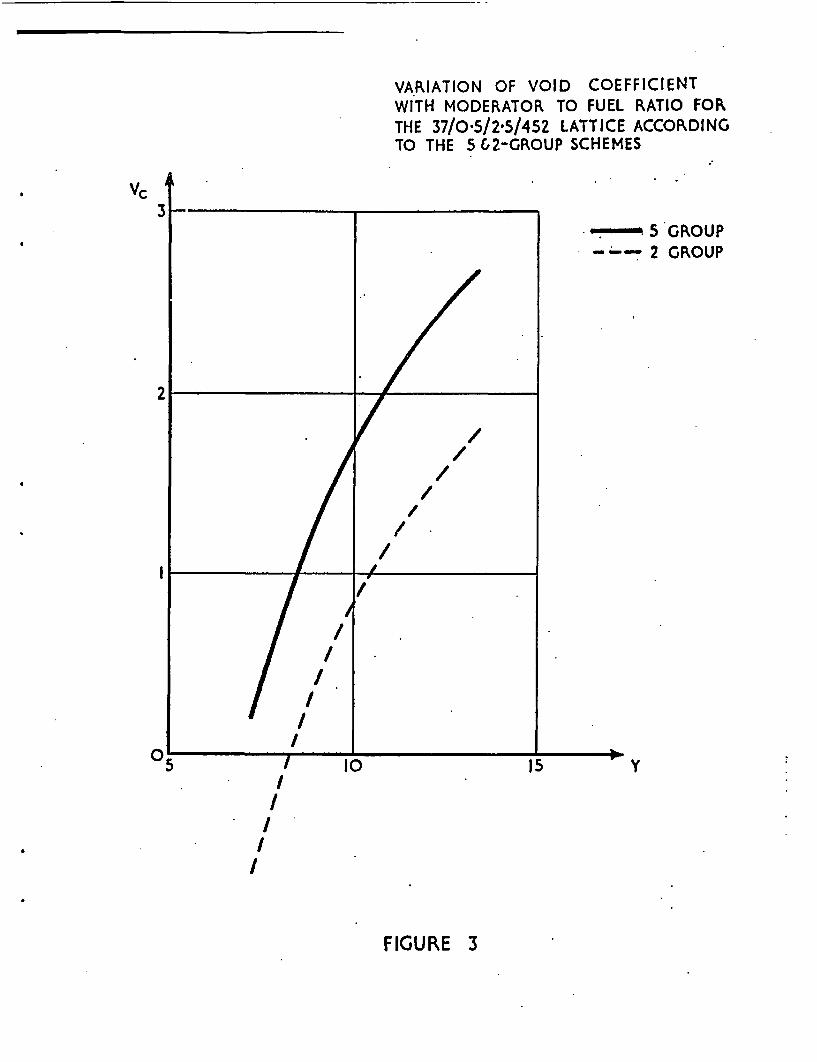
4.1. The effect of varying Y = VDO U/U0 2. Figure 3 shows the variationof V0 with y for the 37/0.5/2.5/452 cores, which we continue to use as anillustration, for both the 5 - and 2 - group schemes. This figure bringsout two rules which have been found to be quite general;
(i) V is a rapidly increasing function of y over the rangeof design interest.
(ii) The 5-group value of VO is larger than the two-group value.
The first rule is of extreme importance to the designer, since change ofpitch is the only parameter variation which has a really dramatic effecton Vc. It can be explained quite simply in physical terms. Because*of the lo.T thermal absorption of the D2 0 bulk moderator, an increase ofpitch has little effect on the fast and thermal processes but it increasesp by increasing the removal cross-seotion for resonance neutrons.
- 10 -

It will be recalled. that the contribution of resonanoe capture to V0 is negative;as the amount of' resonance capture decreases, this contribution will diminish,and VC will therefore increase.
This argument can be put into mathematical form. Table V shows that the.variation of and (rj) 4 with pitch is very much less strong than thatof p.
TABLE V
Breakdown of k. for a 37/0.5/2.5/452 core at square pitohes of 8.84",9.5" and 11.02", according to the 5-group scheme.
Pitch P C____ (q fX. _
8.84" 7.243) 0.4 1.5198 0.5732 0.7417
0.8 1.4798 0.5634. 0.7746
9.5"1 8.9703 0.4 1.5168 0.5830 0.7726
0.8 1.4754. 0.5712 0.7972
11.02" 13.4083 0.4. 1.5109 0.6045 0.8199
0.8 1.4.670 0.5897 0.8332
It is shown in tha Appendix that if the variation of f)4 andd withpitch is ignored, then
-6 . 0 S36 O3410 'O ° 8) -(Sf] 36 (Xp M) + ID -~ . et
This equation shows that if (1)f) and. were truly independent ofpitch, then ZVclyj would always be positive an- that it would diminish as ywas inoreased: more detailed investigation shows that the variation of the v -Swith pitch is not large enough to invalidate these conclusions. This flattenirg-off of the variation of Vc with y indicated by this equation is illustrated infigures 14 to 23, which show that these rules apply to both schemes of caloula-tiob and to all cores.
It also appears that the differenoe in void coefficient between the twoschemes is insensitive to VD20/7UO ratio. This may be seen (for example) inthe old 61 rod power-reaotor at ro a temperature, results for which are givenin Table VI:
- 11 -

TABLE VI
Void coefficient of the old 61 rod poTrer reactor' atvarious pitches, according to both schemes.
Similar results have been found in all other cases studied.
4.2. Variation of void coefficient with x _ VH2Q J 2 . In all cases so farconsidered it has been found that the void coefficient increases with x V=u20/VuoThis can be clearly seen from the oontoiw maps given in Figures 24 to 28;the contours are of constant void coefficient in the x, y plane.
Table VII below shoots the variation of V0 with x for a 37-rod cluster of0.5" 2.5 Co rods in various pressure tubes and at various pitches.
TABLE VII
37/0.5/2.5Co: 5-group
Pressure PitchTube
8.84" 9.5" n11.02"
. V_ % y V0 % y
0.844 452 0.21 7.24 1.24 8.97 2.69 13.411.390 503 0.43 6.56 1.76 8.29 3.73 12.731.635 525 o.60 6.23 2.01 7.96 4.16 12.39
- 12 -

These results are plotted in figure 4. From this figure it will be seen thatVc increases with x, and that We,/D>: is an increasing function of pitch.However, the curves on figure 4 are contours of V0 against x at constant pitch,while the analysis of sub-section 3.3 shows that the fundamental parameter isy rather than the lattice pitch. Now if the pressure and calandria tube radiiare increased while the lattice pitch is held constant, y must be reduced:this trend is clearly shown-in Table VII. Since V is positive (thiswas established in the previous sub-section), this reduction in y will causea decrease in V0 which tends to mask the increase due to increasing x.Figure 5 therefore presents the void coefficient at constant y rather than atconstant pitch (this is done.by graphical interpolation from figure 4 which,although rather inaccurate, suffices to show the trends). It will be seenthat ZVc/Dx is now markedly positive for all values of y. The differencebetween figure 4 and figure 5 can be explained by observing that a given changein calandria tube radius makes a bigger proportional change in y when the pitchis small than when it is big. Figure 6 shows similar behaviour for a 37-roacluster of 0.5" rods enriched to 1.28 Co, confirming that the trends of figures4 and 5 are general.
This trend can also be understood theoretically. It is shown in theAppendix that if the consequences of fine structure and the Danooff-Ginsburgeffect are ignored, then
ol836 crop
P f _ , I 4'P .-O&TlP-f']
o( being a positive constant. The first term of this equation is similar tothe right.-hand side of equation (4.1); the contribution of this first term istherefore positive, while the second is obviously positive (since the constant0 > 0 ). Thus, provided fine structure and the Danooff-Ginsburg effect canbe ignored, ?V4/ZDx is positive. Only computation can show that theseeffects do. not reverse the simple conclusion: this indicates why it has beennecessary to use computer programmes rather than.simple analysis for thepresent investigation.
4.3. Coolant and moderator temperature. It is not to be expected that thevoid coefficient will depend strongly on these temperatures: the applicabilityof the results of this Report to the start-of-life conditions in power reactorsrests on this assumption. All the results quoted with the exception of thosein this section are calculated with both the coolant and bulk moderator at roomtemperature, and it is assumed that relevant deductions can then be drawn forthe corresponding power reactor at hot working conditions. The resultspresented below Show that in one case at least this assumption is well-founded.These results have already been presented in reference 3 but it seems worth-whilere-presenting them here for the sake of completeness.
- 13 -

Computations have been carried out, using both the 5 - and 2 - groupschemes, on the old 61 rod power reactor at four coolant temperatures rangingfrom room temperature to operating conditions, and the results are shown inTable VIII and Pigure 7.
TABLE VIII
Dependence of void coefficient on coolant andmoderator temperatures, according to both schemes
ooolat monra, 5 gp- V0 (%) 2 gp. Vo (%)
to8p 9 _10 81 in_10§Pitch 2~ 99 1Cj? n, 8k" I ., -c~ -j
20 20 -2.22 0.64 2.53 3.79 -4.53 -1.62 0.32 1.66
100 38.7 - 0.82 2.70 3.95 - -1.73 0.24 1.59
180 .57.4 -- 0.90 2.75 4.00 __ -1.82 0.18 1.55
277 80 -1.74 1.07 2.91 4.14 -5.03 -1.92 0.13 1.52
It is apparent that the void coefficient is comparatively insensitive tocoolant and moderator temperatures in the old (61 rod) power reactor. Thesmall variation which does exist is in the opposite direction for the 5-groupand 2-group schemes; the void coefficient for a pitch of about 10" increasesslightly with rising temperature according to the 5-group scheme, and fallsaccording to the 2-group scheme.
It should be mentioned that no allowance is made for the Doppler coefficientof the resonance integral in the SANDPIPER - ARISTOS calculations (althoughsuch an allowance is made in METHUSELAH): a cold resonance integral is usedthroughout. It is plausible on physical grounds that the effect of thisomission on VO will be negligible, though it will alter the "level" of ke.
4.4. The effect of enrichment. It is fairly obvious that increasing theenrichment will reduce the void coefficient, since as the U-235 content of thefuel grows, the competition of the hydrogen in the coolant for thermal neutronsbecomes less important. This argument can be put on a formal basis. Since itis the only parameter which is seriously affected by changing the enrichment,we have
p=o-8
o 4
0-4apacv d (4.3)
- 14 -

This quantity may be symbolically expressed an
C Co
0C ai-a. p e<C(4.4)
where a, b and e are constants. The last term in the denominator representsthe effect of fine and hyperfine structure. If we ignore the variation of finestructure with CO and p, we find
_KL
'DPZCc
6 (Co- A,- bp- eC). =: b6[C N- (2-fb- I)(CO -t-a 4 p 4e-C)'
Therefore, from (4.3) and (4.4), Z~c /3a> is certainly negative ifa condition which is comfortably met in all the lattices considered so tar.The effect of fine structure is complex: it increases with both p and Co, andthese influences act in opposite directions. However, the computations reportedbelow show that the simple theory does give the correct conclusion.
Various results are available to dispJgythis change of void coefficientwith enrichment and those for the 37/0.5/503 lattice are shovin in Table IX .andFigure 8.
TABLE IX
Ohanje of void coefficient with enrichment for37/0.5/503 clusters
5 .group
Pitch 8.84" Pitch 9.5" Pitch 11.02"y = 6.56 y = 8.29 y 12.73
1.28 2.04 3.14 4.77
2.0 1.08 2.34 4.20
2.5 0.43 1.76 3.73
2 group
1.28 0.93 2.00 3.59
2.0 -0.45 0.82 .2.71
2.5 -1.20 0.16 2.18
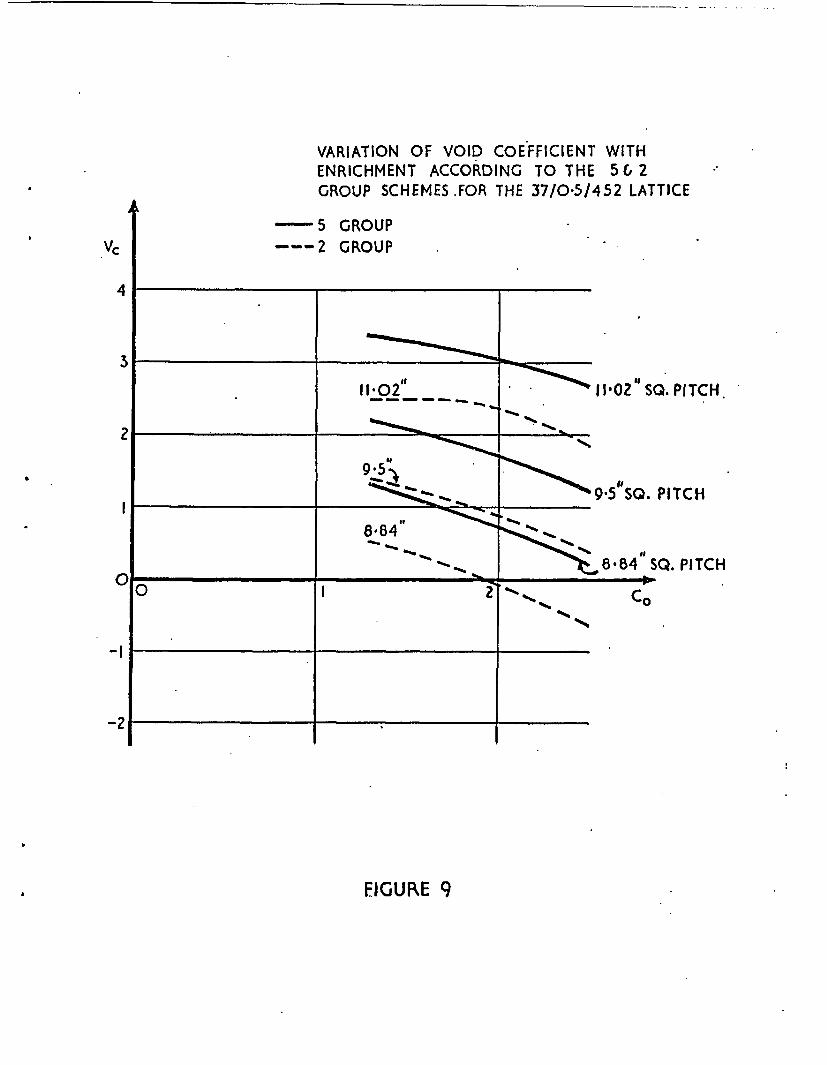
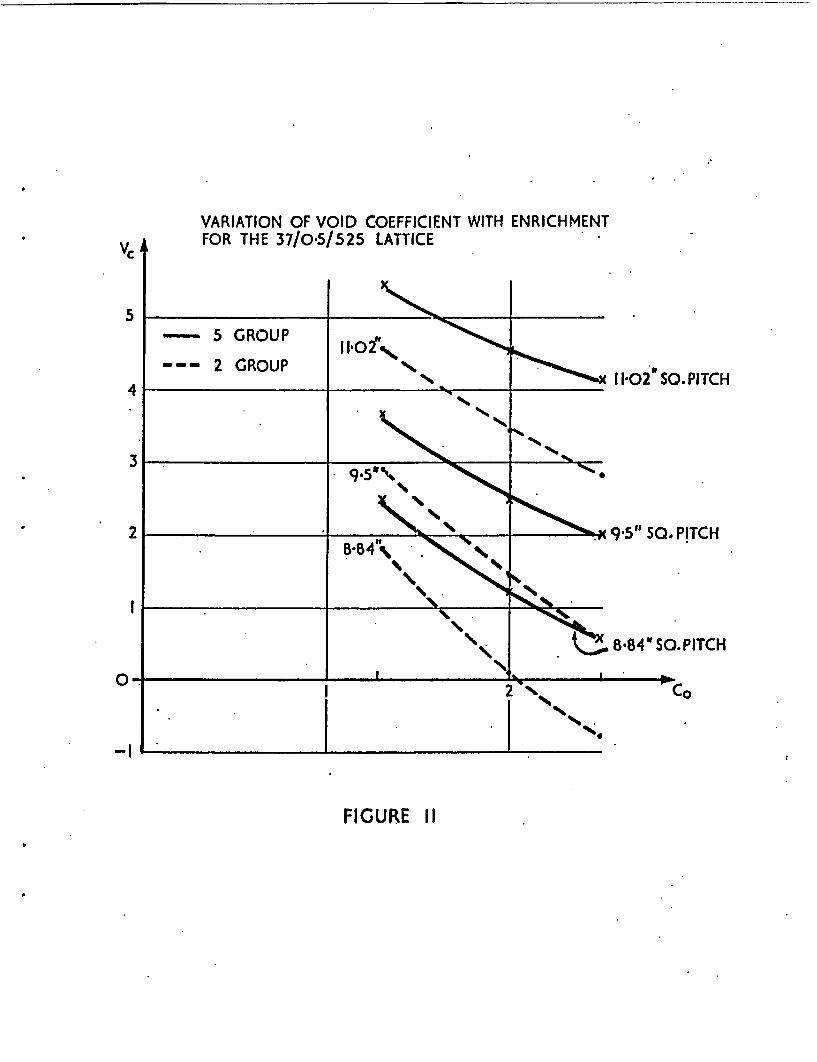
The clusters 37/0.5/452, 90/0.3/525, 37/0.5/525 have also been studied at variousenrichments. Results for .these calculations are given in Table X and are
- 15 -

plotted in Figures 9, 10, 11.
TABLE X
General comparison of 5-group and 2-group predictions of VO
37/0.5/452
90/0.3/525
C
(
(
< d8.84", 9.5"1 11.02"CO
1.28 1.33 2.21 3.39
2.0 0.72 1.70 3.07 5 gp.2.5 0.21 1.24 2.69
1.28 0.51 1.35 2.49
2.0 -0.19 0.89 2.43 2 gp.
2.5 -0.65 0.38 1.80
1.6 1.65 2.80 4.46
2.0 1.12 2.1+6 4.30 5 gp.2.5 0.40 1.71 3.66
1.6 1.35 2.49 4.222.0 0.65 1.95 3.80 2 gp.
2.5 -0.43 0.89 2.92
1.28 2.50 3.67 5.472.0 1.22 2.50 4.53 5 gp.2.5 0 .602.01 4.16 -
1.28 1.82 2.91 4.59
2.0 0.15 1.45 3.45 2 gp.
2.5 -0.78 0.60 2.83
37/0.5/525
It will be seen that the two-group schemevoid coefficient with increasing enrichment.prediotions of the two schemes increases with ibelieved to be due to the differing treatment cmethods of calculation.
also predicts a reduction ofThe difference between theincreasing enrichment; this isof fine structure in the two
A breakdown of the results of a 5-group analysis is given in Table XI, for
- 16 -

a 37/0.5/503 lattice with 9.5" square pitch, whence it can be seen that thedependence of resonance escape on enrichment is very much smaller than thedependence of thermal utilisation, which, as expected, increases stronigly withincreasing enrichment.
TABLE XI
Dependence of the components of kX on enrichment for- a37/0.5/503 cluster at 9.5" pitch, aocordirg to the 5-group scheme
Co . _ . .. = 0.4 p = 0.8 P= 0.4 p = o.8 p= 0.4 P= 0.8
1.28 1.1939 1.1246 0.4124 o.4-46 0.7971 0.8301
2.0 1.3881 1.3227 0.5016 0.4974 0.7861 0.8214
2.5 1.4831 1.4214 0.5575 0.5498 0.7778 0.8149
4.5. The effect of pin size. The investigation of this effect is the mostcomplex of all the studies in this survey. A comparison of the contour mapsfor the 2.5 Co 0.3" and 2.5 Co 0.5" lattices given in figures 27 and 28 showsthat increasing the pin size from 0.3" to 0.5" increases the void coefficient(though it must be remembered that these graphs are drawn on the assumptionthat the detailed arrangement of the pins is not important). In order to checkthis conclusion, a special investigation has been made on three lattices, namely
37/0.5/525/2.0.6Vo .3827/525/2.093/0.3133/525/2.0
in which all parameters have been held constant with the exception of the numberof pins and the pin radius: this large pressure tube has been selected becauseit gives some flexibility in the arrangement of the cluster. The number of pinsand the pin radius have been varied in such a way that the fuel volume is thesame in all 3 lattices, and the pins are arrayed regularly. Thus x and y, andalso the volumes of the cans, the pressure tube and the calandria tube are thesame in an cases.
These results which are presented in detail later in this sub-section, showthat the void coefficient first decreases and then increases with increasing pin-size. This is due to the effect on the void coefficient of the detailed dispositionof the fuel rods. It is to be expected that the net effect on Vc of variationof pin size will depend on the interplay of two opposing consequent effects, namely
- 17 -
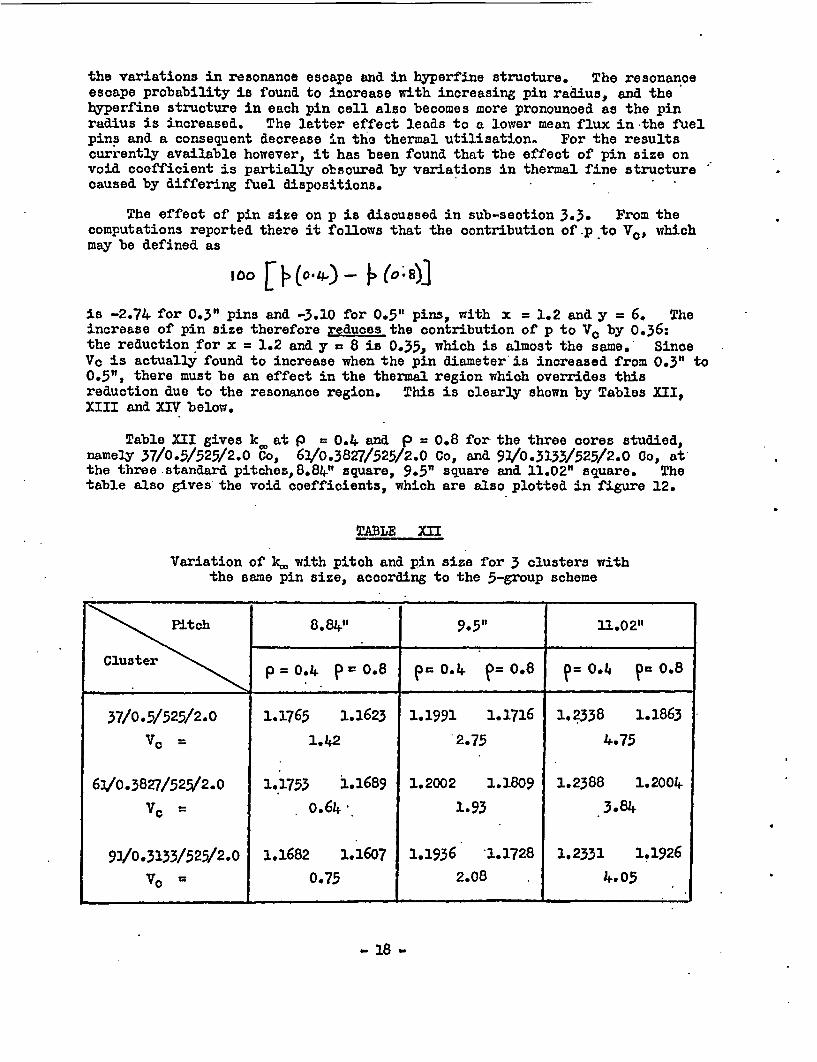
the variations in resonance escape and in hyperfine structure. The resonanceescape probability is found to increase with increasing pin radius, and thehyperfine structure in each pin cell also becomes more pronounced as the pinradius is increased. The latter effect leads to a lower mean flux in -the fuelpins and a consequent decrease in the thermal utilisations For the resultscurrently available however, it has been found that the effect of pin size onvoid coefficient is partially obscured by variations in thermal fine structurecaused by differing fuel dispositions.
The effect of pin size on p is discussed in sub-section 3.3. From thecomputations reported there it follows that the contribution of .p to VO, whichmay be defined as
loo [ F(0s)0 J (o;8)]
is -2.74 for 0.3" pins and -3.10 for 0.5" pins, with x = 1.2 and y = 6. Theincrease of pin size therefore reduces the contribution of p to Vo by 0.36:the reduction for x = 1.2 and y = 8 is 0.35, which is almost the same. SinceV0 is actually found to increase when the pin diameter is increased from 0.3" to0.5", there must be an effect in the thermal region which overrides thisreduction due to the resonance region. This is clearly shown by Tables XII,XIII and XIV below.
Table XII gives ken at j3 = 0.4. and P = 0.8 for the three cores studied,namely 37/0.5/525/2.0 Co, 6J/0.3827/525/2.0 Co, and 93/0.3133/525/2.0 Co, atthe three standard pitches,8.84W square, 9.5" square and 11.02" square. Thetable also gives the void coefficients, which are also plotted in figure 12.
TABLE XII
Variation of k. with pitch and pin size for 3 clusters withthe same pin size, according to the 5-group scheme
- 18 -

It will be seen that at all 3 pitches, Vc has a minimum for pins of about 0.4"diameter. In order to discover whether this behaviour was affected by enrich-ment (as might well be the case, since it is partly due to hyperfine structure)the computations were repeated for the same 3 clusters, namely 37/0.5/525,6/o.3827/525 and 9310.3133/525, at an enrichment of 2.5 Co. The results ofthis second set of computations are also shown on figure 12. It will be seenthat once again V0 is a minimum for 0.1," pins, and that the increasedaenrich-ment has reduced the void coefficient: this is in agreement with the findingsof the previous sub-seotion.
Tables XIII and XIV give values of p, (,flY and (f)6 for these samecases, and also list the differences in these quantities as p is increasedfrom 0.4 to 0.8
TABLE XIII
Variation of p with pitch and pin size for 3 clusters withthe same fuel volume, according to the 5-group soheme
Pitch 8.84" . 9.5" 11.02"
Cluster p = 0.4 p= 0.8 p= 0.4 p0 0.8 p= o. = 0.8_ .
37/0.5/525/2.0 0.7650 0.8154 0.7922 0.8316 0.8356 0.8592
- .0504 - .0394 - .0236
6X/0.3827/525/2.0 0.7574 0.8073 0.7856 0.8245 0.8308 0.8539
- .0499 - .0389 - .0231
9X/0.3133/525/2.0 0.7534 0.8024 0.782i 0.8201 0.8281 0.8501
- 0.490 - .0380 - .0220
From Table XIII, it will be seen that the contribution of p to the voidcoefficient is reduced (or rather, the negative contribution is increased) byincreasing the pin size. This reduction is rather less than that derived fromthe computations leading to figure 1. This is because the quantity calculatedin figure 1 is not quite the same as that listed in Table XIII (the quantityin Table XIII is the probability of escape from the fast group, and thereforeincludes fast capture in U-235 and fast fission). A correction is alsorequired for the fact that. figure 1 is for an infinite cluster, while Table XIII.is for finite clusters.
Table XIV hows the results for (04,{ and : the anomalousvariation of with pin size is clearly apparen.
- 19 -

TABLE XIV
Variation of (fiS) and :na with pitch and pin size for3 clusters with the some fuel vo.um&, according to the 5-group scheme
(Iqf)
(It will also be seen that the effect of () is to make Vc increase withpin size. An inspection of Tables XIII and PLV will convince the reader thatthe variation of Vc with pin size is beyond the reach of simple calculation).The only effect in the thermal region which is obviously dependent on pin sizeis the hyperfine structure. It was remarked at the end of subsection 3.2 thatthe effect of hyperfino structure is to increase the void coefficient.
- 20 -

Since hyperfine structure increases with pin size, the contribution of 6A,to Vc might be expected to increase steadily with pin size. Table XIV showsthat this is not so.
In order to confirm that the results presented in Table XII are notanomalous, the calculations have been repeated for the same fuel geometry, butat an enrichment of 2.5 Co. These calculations are presented in Table XVbelow, and in figure 12.
TABLE XV
Variation of ke, with pitch and pin size for three clustersof 2.5 Co fuel with the same fuel volume, according to the 5-group scheme
It will be seen that the void coefficients for 2.5 Co fuel show exactly thesame trend with pin size as those for 2.0 Co fuel. It is now clear that thebehaviour suggested by Table XII is not an isolated anomaly, but a phenomenonrequiring further study.
An obvious complication is the effect of fine structure across the cellas opposed to hyperfine structure across the pins. Since the effective fuelcross-seotion must decrease as the hyperfine structure factor is increased, wewould further expect the fine structure factor GRS to decrease as the pin sizeis increased. Table XVI shows that this expectation is also wrong: it isflatly contradicted by the results for 0.5" pins.
- 21 -

TABLE XVI
GRS for three clusters with the sameto the 5-group scheme:
Cluster
fuel volume, accordingp = 0.4
GRS
1..18637/0.5/525/2.0/9.5" . a .
62/0.3827/525/2.0/9.5"
9/0.3133/525/2.0/9.5"
1.6767
1.6990
Calculations have therefore been made with the hyperfine structure removed.This was done by switching out the RIPPLE hyperfine structure subroutine in theSANDPIPER III programme. (The necessary modification to the SANDPIPER programmewas made by H. J. Terry). The results of calculations on the 37 and 61 rodclusters are shown in Table XVII.
TABLE XVII
The effect of hyperfine structuretwo clusters with the same fuel volume,
the 5-group scheme
on k. foraccording to
Cluster V. (RIPPLE In) Vo (RIPPLE Out)
37/0.5/525/2/9.5" 2.75 1.70
630.3827/525/2/9.5" 1.93 1.12
37/0.5/525/2/9.5 p = 0.4 p 0.8
RIPPLE In 1.3813 1.3071
RIPPLE Out 1.3943 1.3321
63/0.3827/525/2/9.5 p 0.4 p = 0.8
RIPPLE In
IRIPPLE Out 0
. .
- 22 -

-
As expected, removing the }rperfine structure increases (q)t and reducesboth V0 and the change of Vc with pin size. Vc still increases as the pindiameter is increased from 0.3" to 0.5", in spite of the negative contributionof the resonance region, and it is clear that yet another effect is at 'work.This is confirmed by the comparison of GRS with and without hyperfine structuregiven in Table XVIII (for p 0.4).
TABLE XVIII
Comparison of GRS with and without hyperfine structure for twoclusters with the same fuel volume, according to the 5-group scheme
GRS
RIPPLE INCLUSTER
37/0.5/525/2.0/9.5
GRS
RIPPLE OUT
1.7456
1.6977
1.7186. . ..
6W/O.3827/525/2.0/9.5 1.6767
The simple expectation is that, with RIPPLE switched out, GRS should beindependent of pin size. This simple expectation is based on the assumptionthat the detailed disposition of the pins is not important. Table XVIIIsuggests that this assumption must be wrong, and a limited survey has thereforebeen made of the effect of pin position.
4.6. The effect of Pin position. This has been studied in a 37/0.5/525/2.0 Colattice at three pitches. In the normal lattice of this kind, the pins areregularly arrayed. Two further cores of this kind have been studied, in whichthe pins are first packed as closely as possible round the central' pin ("Close-packed" cluster) and a second in which all except the central fuel pin arepushed as near to the pressure tube as possible ("Edge-packed" cluster). Thesethree types of fuel arrangement are compared in Figure 13, and their voidcoefficients are compared in Table XIX.
TABLE XIX
Comparison of V0 for 3 different arrangementsding to the 5-group scheme
of fuel, accor-
8.84- 9.5" 21.02"
Close-paoked 4.18 5.50 7.53
Norma.42 2.75 4.75
Edge-packed 2.4 3.24 4.30
- 23 -

It will be seen that close-packing produces a rather disastrous increase invoid coefficient, and that the regular arrangement is to be preferred except atlarge lattice pitches.
It is found that kX is strongly affected by fuel position, being as -muchas 8% lower in the close-packed arrangement than in the normal one. The break-down of this variation given in Table XX is very instructive.
TABLE XX
Variation of p andaccording
with fuel arrangement,to he 5-group scheme
* Fuel p (71Aarrangement p 0.4 e = 0.8 p 0. 4 mu 0.8
Close-packed .8030 .8413 1.3490 1.2464.
- .0383 + .1026
Normal ( .7922 .8316 1.3813 1.3071
- 0 .0394 + .0742
Edge-packed g .7950 .8348 1.4189 1.3366
- .0398 + .0823
p is lower in the normal arrangement than in either of the packed ones, sincein the normal arrangement the pin spacing is wider and the Danooff correctionless. The contribution of p to the void coefficient is not much affected byfuel arrangement. increases very strongly as fuel is moved from thecentre of the coolant channel to its edge: the contribution of thermal effectsto Vc is minimised by a regular arrangement of the pins.
These results are also a warning against over-literal use of the contourmaps of Figures 24 to 28 (described in section 4.8 below): it is clear thatthese maps are only valid for regular fuel arrays. It should also be mentionedthat the effects discussed in this section are difficult to calculate, and itshould not necessarily be assumed that the 5-group scheme is predicting themcorreotly.
4.7. The effect of pressure and calandria tube thickness. The positivecontribution of (nj)4 to V0 is due to competition between U-235 and H for.thermal neutrons. The introduction of parasitic absorbers must reduce thiscontribution by reducing the competing effect of the H. (This argument canbe formalised after the manner of sub-section 4.2).

An analysis has been carried out on a 37/0.5/2/525 system at variouspitches and with two calandria tube thicknesses. The calandria tube wasthickened into the air gap rather than the moderator, thus maintaining the valueof y. The results of this analysis are given in Table XXI. The conclusionabove is borne out, namely that the void coefficient decreases with an increasein calandria tube thickness.
TABLE XXI.
Dependence of VO on pitch for a 37/0.5/2.0/525 core with two different calandria
thicknesses, aocording to the 5-group scheme
8.84" 9.5" 11.02"
V (1) 1.22 2.50 4.53
V0 (2) 1,42 2.75 4.75
Vo (1) is the void coefficient value with the thick calandria tube, V0 (2)
that with the thin (standard) one, both calandrias being made of aluminium.
C.T. thickness (1) = 0.319".
C.T. thickness (2) = 0.192"
Although V0 does decrease as the calaniria tube is made thicker, the change istoo smafl for there to be any incentive to use a calandria (and pressure) tubeany thicker than is demanded by engineering considerations.
These results have been further analysed to show the variationand p for the two cores; these values are displayed in Table XXII.
1 cat be seen that, as is expected, increasing the thickness of the calandriatube reduces (4)t substantially with little effect on the other componentsof k.,.
- 25 -

TABLE XXII
Breakdown of kin for a 37/0.5/2.0/525core with two different calandria thick-nesses a6oording to the 5-group scheme
THICK(1)
THI(2)
Pitch (% (_f)____
884" 0.8 1.2818 0.4-925 0.81360.4 1.3509 0.4907 0.7628
....... * .... *..*-.**S * *** ..... ..... *.....-ss*
9.5" 0.8 1.274.7 0.4890 0.8270
0.4 1.3458 0.X905 0.7869
11.02" 0.8 1.2611 0.5037 0.85440.4. 1.3362 0.5104 0.8301
8.84" 0.8 1.3129 0.4.976 0.81540.4 1.3854 . 0.4961 0.7650
955" 0.8 1.3071 0.5028 0.8316
0.4. 1.3813 0.5042 0.7922
01102" .08 1.2956 0.5200 0.85920.4. 1.3729 0.5271 0.8356
The effect of thickening the pressure tube has not been studied in detail,but there is every reason to expect that it will be similar to that of thickeningthe oalandria tube.
4.8. Graphical representation of void coefficient variation. In the previoussections it has been shown that the void coefficient of reactivity increaseswith both y = VD /VU0 2 and x = VH2 Q/VUO2, and that it decreases with enrich-ment. Several other effects have also been discussed. It would be useful ifanl these effects could be simultaneously displayed, and the general behaviourof the void coefficient made evident. The sets of results and graphs givenbelow is an attempt to achieve this, Figures 14 to 23 are a graphical displayof all the results quoted in Tables XXIII to XXVII (which are brought togetherat the end of this sub-section). These figures are plots of the void coefficient
- 26 -

against y for several x values, at fixed enrichment and pin size according tothe 5-group scheme (figures 14 to 18) and the 2-group scheme (figures 19 to 23).The enrichments and pin sizes so far studied in sufficient detail to permit theconstruction of such tables and graphs are 1.28 Co 0.5", 1.6 Co 0.3f" 2 Co 0.5",2.5 Co 0.3", 2.5 Co 0.5".
The subsequent five figures, (figures 24 to 28) are constructed from theseto give contours of constant void coefficient. For example, the 1% voidcoefficient line according to the 5-group scheme for the 1.28 Co 0.5" cores shownin figure 24 is constructed by plotting the values of x and y at -which the threecurves in figure 134. intersect the 1% void coefficient line. In this way theexpected value of void coefficient for any of the experimental assemblies in thestandard pressure and calandria tubes can be read off at a glance. (The fuelslisted at the end of the previous paragraph are the four main types of enrichedoxide which are currently - June 1962 - held in store at Winfirith together withan additional "imaginary" fuel, namely 2.0 Co 0.5", which was included to clarifythe effect of enrichment).
The information which has been detailed in the previous sections is allcontained in these contour maps of figures 24 to 28. For example it isimmediately evident that the void coefficient increases with increasingy = V 2 (/VH 20 ratio, and that this increase is marked. It is also apparent thatthe void coefficient in all cases shows an increase with increasing x = VH 2 c/Vuo2 .
The decrease of void coefficient with increasing enrichment can be seen bycomparing figures'24 and 28 for the 1.28 Co 0.5" and 2.5 Co 0.5" fuels. Thisdecrease is very pronounced. An increase in enrichment of this magnitude canbe seen to cause almost 2% reduction in Vc.
It is evident from all thesefigures that the >-group scheme always gives a more positive void coefficientthan the 2-group scheme, and that the differences between the predictions of thetwo schemes is very variable. A comparison of figures 24 and 28 shows that thedifference. between the two schemes increases with enrichment, while figures 27and 28 show that this difference also increases with pin size.
/Table XXIII .......
- 27 -
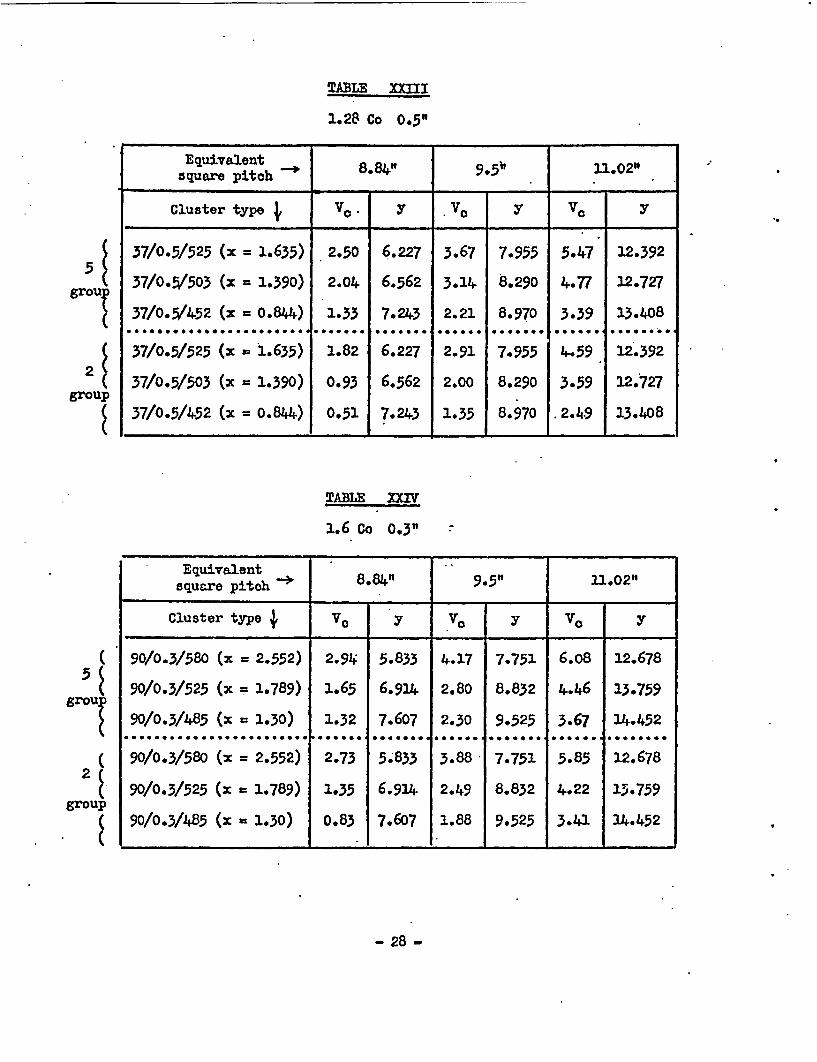
TABLE xXIi
1.28 Co 0.5"
Equivalent 18.84" 9.5 i 1.02"square pitch '88" 9 5
Cluster type VO y VO y V_ Y
5 37/0.5/525 (x = 1.635) 2.50 6.227 3.67 7.955 5.47 12.392
gr 37/0.5/503 (x = 1.390) 2.04 6.562 3.14 8.290 4.77 12.72737/0.5/452 (x 0.844) 1.33 7.243 2.21 8.970 3.39 13.408
37/0.5/525 (x = 1.635) 1.82 6.227 2.91 7.955 4.59 12.392
37/0.5/503 (x = 1.390) 0.93 6.562 2.00 8.290 3.59 12.727group
37/0.5/452 (x = 0.844) 0.51 7.243 1.35 8.970 .2.49 13.408
TABLE XXIV
1.6 co 0.3" -
Equivalentsqucre pitch ' 8.84" 9.5" 11.02"
Cluster type e V0 y VO y VO y
( 90/0.3/580 (x = 2.552) 2.94 5.833 4.17 7.751 6.08 12.678
5 90/0.3/525 (x 1.789) 1.65 6.914 2.80 8.832 4.46 13.759group
90/0.3/485 (x = 1.30) 1.32 7.607 2.30 9.525 3-67 14.452............. t...... ...... .. ....... .. ..... ....... 000.. 00.... .....
C 90/0.3/580 (x = 2.552) 2.73 5.833 3.88 7.751 5.85 12.678
2 90/0.3/525 (x = 1.789) 1.35 6.914 2.49 8.832 4.22 13.759group
90/0.3/485 (x = 1.30) 0.83 7.607 1.88 9.525 3.41 14.452
- 28 -

TABLE XXV
2 Co 0.5"
5t
group
2(.2 (
group
group
Equivalentsquare pitch-> 8.84" 9.5" 11.02"
Cluster type 4 V: y Vc y Y
37/0.5/525 (x = 1.635) 1.22 6.227 2.50 7.955 4.53 12.392
37/0.5/503 (x = 1.390) 1.08 6.562 2.34 8.290 4.20 12.727
37/0.5/452 (x = 0.844) 0.72 7.243 1.70 8.970 3.07 13.408............................... ....... ...... ....... ...... .......
37/0.5/525 (x = 1.635) 0.15 6.227 1.45 7.955 3.4.5 12.392
37/0.5/503 (x = 1.390) _0.45 6.562 0.82 8.290 2.71' 12.727
37/0.5/452 (x = 0.844) -0.19 7.243 0.89 8.970 2.J+3 13.408
TABLE XXVI
2.5 Co 0.3"
Equivalent 81V95 101square pitch + 8.84" 9*5" 11.02"
Cluster type V0 y V0 y V0 y
90/0.3/580 (x = 2.552) 1.25 5.833 2.68 7.751 4.91 12.678
90/0.3/525 (x = 1.789) 0.40 6.914 1.71 8.832 3.66 13.759
90/0.3/485 (x = 1.30) 0.47 7.607 1.53 9.525 3.11' 14.452
90/0.3/580 (x = 2.552) 0.54. 5.833 1.88 7.751. 4.03 12.678,
90/0.3/525 (x = 1.789) -0.4.3 6.914 0.89 8.832 2.92 13.759
90/0.3/485 (x = 1.30) -0.55 7.607 0.67 9.525 2.46 14.|452
- 29 -

TABL. XXNII
2.5 Co 0.5"
gro5up
2r
1ru
*Equivalent U0square pitoh 8.84" 9.5" n.02"Cluster type V y V0 y V 0 Y
37/0.5/525 (x - 1.635) 0.60 6.227 2.01 7.955 4.16 12.392
37/0.5/503 (x = 1.390) 0.43 6.562 1.76 8.290 3.73 12.727
37/0.5/452 (x = 0.844) 0.21 7.243 1.24 8.970 2.69 13.408
37/0.5/525 (x - 1.635) -0.78. 6.227 0.60 7.955 2.83 12.392
37/0.5/503 (x = 1.390) -1.20 6.562 0.16 8.290 2.18 12.727
37/0.5/452 (x = 0.844) -0.72 7.243 0.42 8.970 1.80 13.408
- 30 -
5 Conclusions from this study
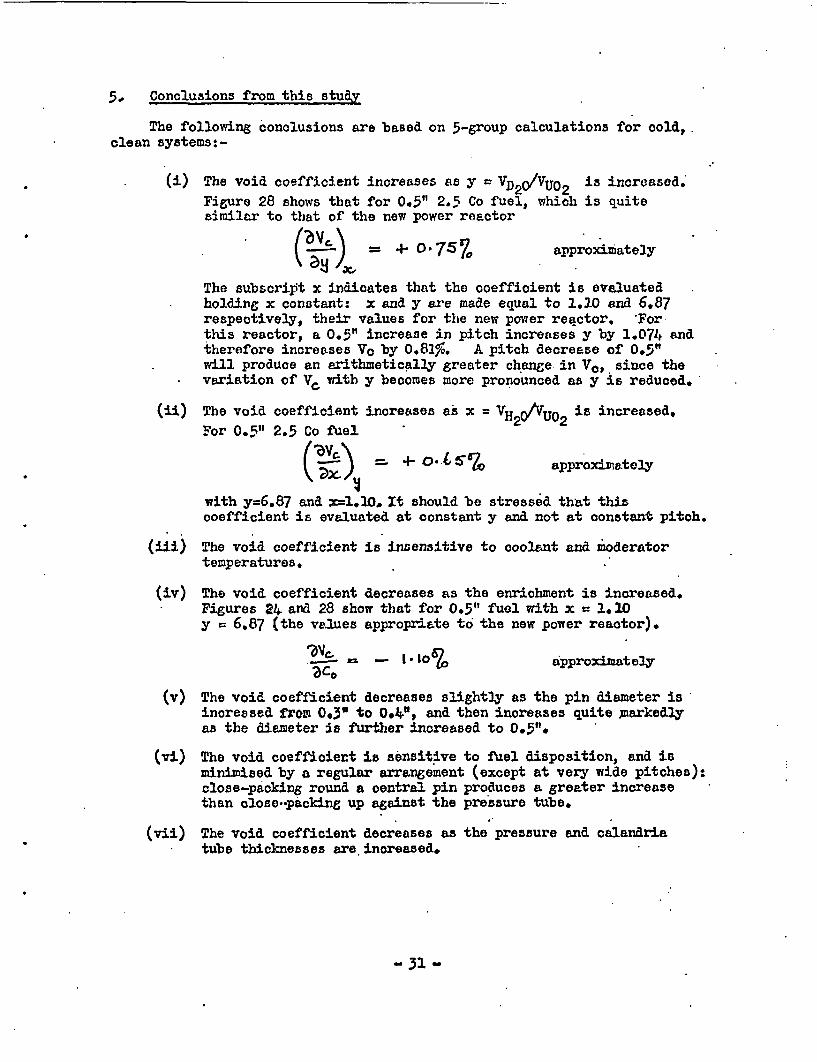
The following conclusions are based on 5-group calculations for cold,.clean systems:-
(i) The void coefficient increases a8 y = VD20VU02 is incregFigure 28 shows that for 0.5" 2.5 Co fuel, which is quitesimilcr to that of the new power reactor
( 3a X = - 0°75 7%7 approximatell
ased.'
t
The subscript x indicates that the coefficient is evaluatedholding x constant: x and y are made equal to 1.10 and 6.87respectively, their values for the new power reactor. 'Forthis reactor, a 0.5" increase in pitch increases y by 1.074 andtherefore increases Vo by 0.81.o. A pitch decrease of 0.5"will produce an arithmetically greater change in VO, since thevariation of VC witb y becomes more pronounced as y is reduced.
(ii) The void
For 0.5"coefficient increases as x =VH20VU02 is increased.2.5 Co fuel
( Tic5= O.' Lt approximetely
D'X
with y=6.87 and r=l.l0. It should be stressed that thiscoefficient is evaluated at constant y and not at constant pitch.
(iii) The void coefficient is insensitive to coolant and moderatortemperatures.
(iv) The void coefficient decreases as the enrichment is increased.Figures 24 and 28 show that for 0.5" fuel with x = ,.10y = 6.87 (the velues appropriate to the new power reactor).
.-- - -I0lzca, approximately
(v) The void coefficient decreases slightly as the pin diameter isincreased from 0.3" to 0.4", and then increases quite markedlyas the diameter is further increased to 0.5".
(vi) The void coeffioier.t is sensitive to fuel disposition, and isminimised by a regular arrangement (except at very wide pitches):close-packing round a central pin produces a greater increasethan close.-packing up against the pressure tube.
(vii) The void coefficient decreases as the pressure and calandriatube thicknesses are increased.
- 31 -
The predictions (i), (ii), (iii), (iv) and (vii) on the effects ofmoderator and coolant volume and temperature, and on the effects of enrichmentand tube thickness, are in qualitative accord with simple theoretical studies.It seems highly likely that they are qualitatively correct and will be confirmedby experiment and by th3 use of more detailed theoretical methods: the limitedinformation so far available (3, 12) is encouraging on this point. (Thenumbers quoted in (i), (ii) and (iv) will no doubt require adjustment).
The predictions (i) to (iv) above are confirmed by the 2-group scheme.This scheme also predicts an increase in Vo as the pin diameter is increasedfrom 0.3" to 0.5": the effect of intermediate pin sizes, of fuel dispositionand of tube thickness has not been studied with this scheme.
The 5-group value of V0 is always greater than the 2-group value. Thedifference is insensitive to x and y, but increases strongly with both enrichmentand pin size.
- 32 -

6. Implications for the design of a power reactor
6.0 Present indications are that a design which is relatively simple toengineer and which makes best use of the fuel will have rather too high avoid coefficient at the start of life. This section has therefore beenwritten to show how the void coefficient may be reduced. However, if areactor was found to have too low a void coefficient at any stage of itsirradiation history, the remarks below also indicate how the voidcoefficient might be increased.
6.1 Pitch reduction is the most powerful mechanism for bringing down VO.This has been known for some time, and the pitch of the new 37-rod powerreactor is already at the minimum value fixed by engineering considerations.It seems (16) that this minimum value is not low enough, and that othermethods of reducing the total moderating power of the cell must beconsidered (the theory of sub-section 3.3 makes it clear that this is theoverriding criterion). One method of doing this is to increase thecalandria tube radius, thus increasing the width of the air gap betweenthe pressure and calandria tubes. Another possibility is the use ofdisplacement tubes in the moderator: these could be flooded if the voidcoefficient became too negative as irradiation proceeded.
6.2 Reduction of water volume can make a small but useful contribution to.the diminution of Vc . However, the calandria tube radius must not bereduced as well, or the resulting increase in bulk moderator volume willnearly cancel the effect of squeezing out light water.
6.3 An increase of enrichment from 2.0 to 2.5 Co will reduce Vc by about0.5ru. Since fuel cost is relatively insensitive to initial enrichment,this method seems worth considering. However, before it could be used acareful examination of the change of V0 with irradiation would be needed.
6.4 If the 5-group scheme is to be believed on this point, the changefrom the 0.43" pins of tho old 61 rod power reactor to the 0.566" pins ofthe new 37 rod reactor has increased the void coefficient by more than 1%(this increase has been more than compensated by other changes in thedesign). A reduction of pin size seems to be.a possible method ofreducing Vc, though it will increase the fuel fabrication charge.
6.5 According to the 5-group scheme it is important to keep the fuelarrangement regular: packing near the pressure tube would be lessdamaging then packing round the central pin.
6.6 Differential enrichment has often been discussed as a possiblemethod of reducing power peaking in the fuel cluster. Studies by TechnicalAssessment and Services Division, Winfrith (16) show that a differentiallyenriched cluster has a higher void coefficient than a uniform cluster ofthe same mean enrichment. This is to be expected in the light of thearguments presented in this Report, since the fuel of highest enrichmentis being placed in the lowest thermal flux, and the mean thermaloross-section of the fuel is reduced by the differential enrichment.From the point of view of this section, the void coefficient could bereduced by differential enrichment, but this would require the most
- 33 -%go

highly enriched fuel to be placed on the outside of the cluster, and wouldaggravate the flux peaking.
7. Implications for the speoifioation of an experimental programme
7.0. As far as void coefficient is oonoerned, the aims of the WaterReactor Physics Division's experimental programme on SGHW are:
(i) To make experiments on cores reasonably similar to thatof the new power reactor.
(ii) To demonstrate that SGHW designs with near-zero coefficientsare possible.
(iii) To test the general correctness of the predictions of the5-group scheme, and in particular to compare them with thoseof the 2-group scheme.
7.1. Since it is a design objective that the void coefficient of thepower reactor should be near zero, the first two aims are very similarand we shall di-ouss them together. The salient parameters of the new37 rod power reactor are (17):
x = VH2 /VU0 2 = 1.105y = p= 6.87
number of fuel rods/oluster 37
fuel diameter = 0.566"
fuel enrichment: not specified, but 2.2 Co is a possible value.
canning: zircaloy 0.15" thick
I.D. of pressure tube = 5.1"
It is not possible to mock this up exactly with the materials available atWinfrith at the time of writing (June, 1962). The largest fuel is 0.5"in diameter, ond this is available at enrichments of 1.28 Co and 2.5 Co,canned in 0.036"1 Al in both cases: the latter enrichment is clearly themore suitable for this simulation. Two pressure tubes are available whichwill accommodate a 37 rod cluster of this fuel. The smaller, with anI.D. of 4.52", gives an x-value of 0,844, which is rather too small; thelarger, with an I.D. of 5.25", gives x = 1.635, which is considerably toolarge. (These values take into account the tie-tubes which, in theexperimental assemblies, surround 3 of the fuel rods). Experiments areobviously required in both sizes of pressure tube, with more emphasis onthe smaller tube which gives the x-value nearer to that of the powerreactor.
- 34 -

7.2. With the lattice plates now available, cores can be built in the sub-critical assemblies SGHW I and SGEw II on the following 3 pitches:
9.5" At - equivalent to 8.84" square
9.5" square
11.84" W r - equivalent to 11.02" square
In the reactor DIUPLE, only the 9.5" square pitch is available. Table XXVIIIshows the y values obtained by building 37 rod clusters of 0.5" pins in 4.52"and 5.25" pressure tubes on these pitches.
TABLE XXVIII
Cluster Pitch 8.84" 9.5" 11.02"
37/0.5/452 7.243 8.970 13.41
37/0.5/525 6.227 7.955 12.39
The table shows that only the two smallest pitches are relevant to a study ofthe new power reactor, and that with the smaller pressure tube even the smallestpitch is a little too large. The 452 and 525 pressure tubes are normally usedwith calandria tubes of internal diameters 5.52" and 6.24" respectively. Thelarge (6.24") calandria will be combined with the small pressure tube on the9.5" triangular pitch to give
x = 0.844, y = 6.227
These values are both lower than those for the power reactor (x: 1.105, y = 6.87)This core Bakes it possible to bracket both the x and y values of the new powerreactor, and it has the added advantage that this enlargement of the air gap is(as noted in 6.1) a possible method of reducing VO in practice.
7.3. It is considered to be very desirable that at least one experiment shouldbe done with values of x and y that are really near to those of the newt powerreactor (1.10 and 6.87 respectively). A survey of all possible combinationsshows that a 43 rod cluster of 0.5" pins in a 5.25" pressure tube on a 9.5" squarepitch gives
x = 1.20, y = 6.85
These are obviously a fair approximation to the power reactor values. Thedrawbacks of this simulation are that arn arrangement of 43 rods in a circulartube is necessarily irre ular, and that it will be necessary to use mixed enrioh-ment (1.28 Co and 2.5 Co) to get a core large enough for the measured buckling to
- 35 -

be really accurate. Nonetheless, it is thought that the experiment is wellworth making.
7.4. In the fine-struoture stack SGHW II, the "coolant" can be heated to 9000.This will make it possible to oonfirmi the theoretical prediction that V isinsensitive to coolant temperature. c
7.5. A full discussion of the techniques which are being used to check thepredictions of the 5-group scheme against experiment, and of the detailedselection of cores for experimental study, will be given elsewhere.. However,a comparison of the 5-group and 2-group schemes can best be made on that corefor which the difference between them is greatest. A comparison of figures 24to 28 shows that this core should be constructed with the 2.5 Co 0.5" fuel.An x-value of about 1.4 would maximise the difference, but cannot be achievedwith the available rressure tubes: of the tubes nor available, the 525 willgive slightly the larger difference. Unfortunately, only 1 tonne of the2.5 Co 0.5" fuel is available, and this is not sufficient to permit the buildingof a critical assembly of reasonable size in DIMPLE: on the other hand theresulting core is too reactive for sub-critioal work at the present stage ofthe experimental programme. As a compromise, a 90/0.3"/2.5Co/525 core has beenchosen as the first loading of DIMPLE, since 2 tonnes of the 2.5 Co 0.3" fuelare available. Although the pin size is rather small, the high enrichmentshould help in distinguishing between the 2 - and 5. - group schemes.
8. Acknowledgments
We are indebted to Mr. D. A. Newmarch for helpful discussion of the effectof the Dancoff-Ginsburg correction on void coefficient, and toliss Bridget Manuell for the able and energetic way in which she has haniled thevery large number. of computer runs required for this study.
- 36 -

REFERENCES
1. 7.D.D.
R. ALLENHICKS andC. LESLIE
A 5-group scheme for PMHW physics caloulations.AEEW R-205. Commercial
2. A. GREEN The S.G.H.W. lattice parameter programme.D.E.G. Iaemo 223(R). (To be published).Commercial (or lower).
3. F.A.D.
R. ALLENGREENC. LESLIE
Theoretical estimates ofthe S.G.H.W. reactor.AEEW M-190. Commercial
the void coefficient of
4. R. A. ALPIAR SANDPIPER III: a programme toconstants for liquid moderatedreactors.AEEW R-92 (In preparation).
calculate 5-grouppressure tube
Unclassified.
5. D.D.H.
C.A.M.
LESLIENEWXARCHBROWN
6. R. A. ALPIAR
7. F. R. ALLEN
8. D. MOXON
ARISTOS. A five-group diffusion programme forphysics calculations on pressure tube reactors.ABEW R-93. Unclassified.
METHUSELAH.AF.EW R-135. (In preparation),. Commercial (or lower).
The effect of design changes on the void coefficientof a 300 MW(E) S.G.H.W. reactor.AEEW M-230. Commercial.
Unpublished.
9. D. MOXON STAGNANT.group FORTRMABEW R-182.
A one-dimenag.onal, steady-state, two-MN programme for steam generating FTRs.
Unclassified.
of the stability margin against funda-power oscillations of the S.G.H.W.R.
Commercial.
10. J.G.J.
FEL,R. BOLTONRANDLES
An estimatemental modeAEEW M-93,
11. A. GREEN Unpublished.
- 37 -

12.
13.
A. J. BRIOGS
D. HICKS
L. DRESNER
W. ROTHENSTEIN
14 .
15.
16.
17.
To be published.
Resonance escape in hydrogenous moderatedsystems.AXEW I-101. Not for publication.
Resonance absorption in nuclear reactors.Pergamon Press, 1960.
Collision probabilities and resonance integralsfor lattices.Nue. Soi. and Eng. L 162 (1960).
To be published.
Unpublished information.
D.
N.
HICES
BRADLEY
- 38 -

APPENDIX
Deduction of some formulae oited in Section 4
In the 5-group-scheme,
- as = (114%t F _, 610@ O' - O) (A.l)
Ignoring the variation of. and with , we have
S% = U) 4 J asThen from the definition of void coeffioient given in equation (2.1)
IDc = W _ I 0 |(A.2)
Now the oh" cited in equation (A.l) is actually the non-oapture probabilityin the whole of the fast group. However the variation of this quantity with
j is vexr similar to that of ta, the escape probability in group 3. From theformulae given in sub-section 3.3o we have
ho; os 8 36 (XP, + S. _ O." as66i'0 SB L (XP -S) -t 0 S* Claois (A.3)
(epithermal capture in U-235 being ignored). From (A.3)
?i3= o*sabo Cr,I b s3Gcxp +S) + ° ' 54 <3,a
whence equation (4.1) follows at once.
The variation of Ve with W_ can be dealt with in the samealthough the variation of (I f0\ with xcannot be neglected.
sort of way,We have
Ky4 X 100 )w & 4-Iaxp:oMB
- '°°, E [(11 f % - (hl} {0{ 9 ) CIL 4-+~ ax I at0.8,,(~P p u
by arguments identical with those used above. Now from equation (3.3)may be written
I - = Oe-+pfLb oe I (A.4)
tv and 0 being constants Cif we -ignore the variation Of , with x whichimplies that we should also ignore the variation of (t1j k r From (A.4.)
faxr - ollo fw. from which equation (4.4 follows.
- 39 -

VARIATION OF 1f ANDp FOR THE37/O-5j2'51452 9-5" LATTICE ACCORDINGTO THE 2 AND 5 GROUP SCHEMES
6
I
.4
.-7 ___ _
(Af)tl-- m 5mm 2
GROUPGROUPII -. l
I.2
1.1
I C
I
I 4- .9 .9 .9
I .*Y I.
3 . . ---
____ ___ ____
. -~~~fI . N
0 )
0 -. __ _ ---
0 0-2 0.4 06 0.8 I*18p q mJcc.
FIGURE I

i L
VARIATION OF P WITH p FOR. AN SGHWWITH x a 1-2, y . 6
088
0.87
0-86
0-85
0-84
083
082
./
:.I I'.ZZ,
/I- I- -
// /
/
. Z_
,.
.05" PINS
03" PINS
° p(gm/cc)
'%X0-7081 * I I I
0 02 04. o06 08
FIGURE 2
VARIATION OF VOID COEFFICIENTWITH MODERATOR TO FUEL RATIO FORTHE 37/05/2-5/452 LATTICE ACCORDINGTO THE 5 62-GROUP SCHEMES
1 . 5 GROUP- -- 2 GROUP
Vc
yI
III
I
FIGURE 3

VARIATION OF VOID
NT TO FUEL VOLUME RATIO FOR
THE 3 7/05/2.5Co CLUSTER IN VARIOUS
PRESSURE TU8ES; AS GIVEN BY THE 5 OUS
SCHEMEG
VC
11.02" S. PITCH
9.5 SQ. PITCH
OL0.7
PITCH
FIGURE 4
.A

VARIATION OFVOID COEFFICIENT WITH .COOLANT TO FUEL VOLUME RATIO FORTHE 37/0-5/2-5C CLUSTER, AS GIVEN BYTHE 5-GROUP SCAEME.
VC*
0 7 10 10 . X
FIGURE 5

vc
VARIATION OF VOID COEFFICIENT WITHCOOLANT TO FUEL VOLUME RATIO FORTHE 37/05/1 28 Co LATTICES AS GIVENBY THE 5-GROUP SCHEME.
- CONSTANT PITCH--- COOLANT y
,x y4 13 41,/ 1102 03 PITCH
,_- t897
,,' '9S5O PITCH
ox
,X' _8-84 0 PITCH
0.7 10 1.5 x
FIGURE b

vc 4VARIATION OF VOID COEFFICIENT WITH COOLANTAND MODERATOR TEMPERATURE ACCORDING TOTHE 5 GROUP AND 2 GROUP PROGRAMMES
5
4
3
2
0
- 3
-2
-3
-4
-5
4 4 SO |PITCH
II 'Ii_ _ _ _ I Ir
._ I____11 2 ----- ' _____________________________ _ __ _ ___ _
O 10 It
9 i1JO'46~-- - - -
59p SCHEME
T COOLANT(Cc)
r- - - ~- - - -- i - - - - -
029P SCHEME
100 200 3004 4
9'IZ - - - . _ - 8'Iz_ _ - _ _ - ,
i
+ - 4-
L ~ - -- -4- - - - - I-
FIGURE 7

VARIATION OF VOID COEFFICIENT WITHENRICHMENT ACCORDING TO THE 5-GROUPSCHEME, FOR THE 37/0-5/503 LATTICE
i
Vc
t
4
4 3L Pa
.'%\1-2llp'ITCH
. -",** 9 -5,
l 4-Ii" 0 PITCH
4" 0 PITCH\8 8.8It I. a- I 2 3 Co
FIGURE 8
VARIATION OF VOID COEFFICIENT WITHENRICHMENT ACCORDING TO THE 56 2GROUP SCHEMES FOR THE 37/0-5/452 LATTICE
- 5 GROUP
VC -- 2 GROUP
4
3
11- 02- -11 I02 SQ.PITCH,
2
I __ __ __9 li_ 95 SO. PITCH
-. 8 84 SQ. PITCH
-_
-2
FIGURE 9

VARIATION OF VOID COEFFICIENT WITH ENRICHMENTACCORDING TO BOTH SCHEMES FOR THE 96/03/525
LATTICEVC
5
4
3
2
0-
- I
,.
FIGURE 10
VARIATION OF VOID COEFFICIENT WITH ENRICHMENTFOR THE 37/0.5/525 LATTICE
I 1i02 So. PITCH
-I
FIGURE 11

VARIATION OF VOID COEFFICIENT WITH PIN SIZEFOR THE 37, 61 AND 91 ROD LATTICES AT 2 C,AND 2 5C0 ACCORDING TO THE 5 GROUP
Yc SCHEME.
... 2C-2 -SCO
4
*-, .. .....
0
0-25 0 3 04 O*5 PIN SIZE(INCHES)
FIGURE 12

ILLUSTRATION OF THE CLOSE- PACKED, NORMALAND EDGE -PACKED FUEL RUGIONS FOR THE37/0.5/525 LATTICE CELL (PINS NOT TO SCALE)
)O OOO
n TO0 0
) o o 0 0 NORMAL
0 0 0 EDGE-PACKED
F IGURE 13

VADIATleNKI eNF Viin rnFFcciric£T uITu y
FOR THE 1-28 Co) O-S DIAMETER FUEL, 1-28 Cot OSVC ACCORDING TO THE 5-GRoUP SCHEME
I 37/b-5/525 'X I.6355 4 _ _
-x- 37/0-51503 X 1390
x- 37/0-5/452 X 0-844
-I
-2
FIGURE 14

A
VCVARIATION OF VOID COEFFICIENT WITH y.FOR THE 1-6 Co0 03 DIAMETER FUEL CASES,ACCORDING TO THE 5-GROUP SCHEME.
16 Co, 0-3'
_e.x_90/031580 Xs 2 5526
5
4
3
2
0
-1
-2
, i 1 1- I l x-qo/0./
, = I = =
525 *34 13789
0 3/485 XC=1 30
4 a - . a - . - i S A a -5 6 7 8 9 10 11 12 13 14 15
FIGURE 15

1C6
5
4
3
VARIATION OF VOID COEFFICIENT WITH y, 2FOR THE 2C0 O-5 DIAMETER FUEL CASES, 2 C0, 0.5ACCORDING TO THE 5-GROUP SCHEME
x-37/1051525 X1-1635_ . >.._- - 371051503 X=1j3q0
_ - 37/0-5/452 XsOB844.
2
I
4 5 6 7 8 9 10 11 12 13 14 IS
FIGURE 16

VC
6
5
4
3
2
0
- I
- 2
VARIATION OF VOID COEFFICIENT WITH I FOR THE 2-5 %0-3M DIAMETER FUEL CASES, ACCORDING TO THE S-GROUP SCHEME
2.5 Co 0'3
x =2'552
.1I789x - 1 30
I4 5 7 9 10 11 12 13 14 Is
FIGURE 17

V VARIATION OF yoID COEFFICTHE 2-5C. 0-5 DIAMETER FLACCORDING TO THE 5-GROL
b
5
4
3
2
0
-24 5 b 7 8 9 10
FIGURE 18
IENT WITH t FORIEL CASES,JP SCHEME

VC
VARIATION OF VOID COEFFICIENT WITH y FOR THE 1-28 CoO*5" DIAMETER FUEL CASES, ACCORDING TO THE 2-GROUP SCHEME
1-28 Co 0.5"
L:
4 _._37/0.5/525
2 - _ 37/0.5/502
0 _ Z _ __
3 Ad
o ==== =3I7=C
X = 1*635
3 x = 1X3 90
).5/452 x -0 844
. nr a - a a * a a * - a -
4 5 6 7 8 9 10 11 12 13 14
FIGURE 19

VARIATION. OF VOID COEFFICIENT WITH 1, FORTHE 1-6 Co 0-3' DIAMETER FUEL CASES, ACCORDING
Vc . TO THE 2 GROUP SCHEME.
6 t I m'9O f3/58O ,G=2'552
4 . ; -__ ._ __9 0/0 -3/525 x' 1789
3 . _____ ______ ____ __%of3/485x=1-30
2 if -% =_X
0 _ _ _ _b_ _ _ _
-2
4 6 7 8 9 11 12 13 14 IS.
FIGURE 20

AVARIATION OF VOID COEFFICIENT WITH y,FOR THE 2Co 0-5'DIAMETER FUEL CASES,ACCORDING TO THE 2-GROUP SCHEME
2 Co 0-5VC
6
5
4
3
2
0
-I
-2
_ _II I I I I . . I I _I4. 4. 4. 1* I t I- I
... x-- 37/os5525I4. 4. 4. 4. 4. _________
37/C I533710 5/45
X= 1-635
C= 1-3902 X= 0-844
lI4 4. 4. 4. -� 9� 4. - + -�- .Y
__ %- 0Y-I._II _1*- ' -' � - I -
4 5 6 7 8 9 10 .11 12 13 . 14 IS. I7
FIGURE 21

x. 1-78935 Xu1.30
4 5 6 7 8 9 to 11 12 13 14 15 y
FIGURE 22

S
v c
-21S b
FIGURE 23

CONTOUR MAP OF VOID COEFFICIENTVARIATION WITH Xv 1FOR THE 1-28C0 ,O-SCASES.
-- 5-- 2
GROUP SCHEMEGROUP SCHEME
2-C
* I-S
I ________________ _______________ ______________ _____ _ __________'__.
o /o IC/ c i2/ 2% 3%L
:Xx Kp
N $1 Nl~NI
Is &1 0 ___________ I -4.-- .4 4 -�.----.- 4 4 4 �-�---- 4. 4
3- I - I - L I �
4 5 6 7 8 9 10 II 12 13
FIGURE 24
a o

I
CONTOUR MAP OF VOIDCOEFFICIENT VARIATION WITHX, y FOR THE 1t6 Co 0-3 CASES
-5-GROUP SCHEMEI --- 2-GROUP SCHEME
'Y3%
2 13 7 3
FIGURE 25

CONTOUR MAP OF VOID COEFFICIENTVARIATION WITH X, Y FOR THE 2CO-S"CASES.
- 5 GROUP SCHEME-- 2 GROUP SCHEME
wy
3 4 5 6 7 8 9 10 I 1 12 13
FIGURE 26
4

- -
COEFFICIENT VARIATION WITHX, y FOR THE 2-5CO 0-3 CASES
3 4 5 6 7 8 9 10 11 12 13 14 y
FIGURE 27

CONTOUR MAP OF VOID COEFFICIENT VARIATIONWITH x, I FOR THE 2 5 Co I O*5" CASES
- 5 GROUP SCHEME2 GROUP SCHEME
08 L - _ l l l ' ' l ___3 4 5 b 7 8 9 10 11 12 y
FIGURE 28
,

DISTRIBUTION
Sir W..lliam Cook Risley
Members of Heavy Water Reaotor Steerinz Committee
Mr.Dr.Mr.Mr.Mr.Mr.Mr.Mr.Mr.Mr.Mr.
R. V. MooreH. KronbergerS. FawcettF. W. FenningC. R. BennettP. M. Boooook (4 copies)N. BradleyT. J. Heal (P.G.)C.-E. IliffeD. S. G. LevisV. H. B. Macklen
Risley
toif
itI,
ii
'9
It
Mr.Mr.Dr.Dr.
D.P.C.J.
V.W.G.E.
FryMuImmeryCampbellR. Holmes
(3 copies) WinfrithI,
'9
It
Mr. E. C. W. Perryman
Mr. J. Harper
(2 oopies)
(2 copies)
Culcheth
Springfields
Dr. J. K. Dawson Harwell
Mr. P. H. W. VWoolff
Mr. D. R. Smith
Dr. A. G. H. Coombs
English Electrio Co.Ltd.
T.N.P.G.
U.P.C.
Members of S.G.H.YI./ Specifications Vloridn Party (other than those namedabove)
Mr.Mr.Mr.Mr.Mr.Dr.Mr.
Mr.Mr.Mr.Mr.
G.
J.R.F.D.R.
C.R.W.
J.
K. DioksonGreenGuildJ. HaslamG. JohnsonLinningR. Matthews
W. BlunfieldJ. CoxS. EastwoodSmith
Risley
it'I
It
It
Winfrithit
of
'I
Mr. A. E. Williams Springfields
HarwellMr. P. M. C. Laoey

Distribution (contd.)
Additional
Risley
Mr. R. ReynoldsMr. D. Billirigton
Culcheth
Mr. J. I4. Hutcheon
' Windscale
Mr. K. SaddingtonDr. A. J. M. Hitchcock
Harviell
Mr. R. F. JacksonDr. P. MurrayDr. F. A. Viok
Springfields
Dr. H. K. Hardy
Capenhurst
Mr. F. I. Hurley
Winfrith
Dr. P. R. AllenDr. J. R. AskewMr. A. J. BriggsMr. F. G. ChapmanDr. C. T. ChudleyMr. D. EnglishYr. J. FellDr. W. N. FoxMr. T. M. FryMr. A. J. GoddardMr. C. P. GrattonMr. C. F. .GriggsDr. D. Hicksir. 1i. N. John
Mr. I. JohnstoneMr. G. H. KinohinDr. G. N. LanceDr. D. C. Leslie (4 copies)Dr. R. V. MacbethMr. P. K. M'PhersonMiss B. ManuenlMr. D. MoxonMr. P.A.B. Murdoch. (2 copies)Mr. D. A. NewmarohMr. R. PotterMr. I. PullMr. J. Randles
Mr.Mr.Dr.Mr.Mr.Mr.Mr.Mr.Mr.Dr.
H.R.R.R.W.
J.G.W.H.
T.F.D.J.H.J.G.1i.J.E.
RichardsonSmithSmithSymesTaylorTerryTyrorWellsWoodsWrigley