ti plus guidebook part1 en
TRANSCRIPT

8/4/2019 Ti Plus Guidebook Part1 En
http://slidepdf.com/reader/full/ti-plus-guidebook-part1-en 1/198
TI-84 PlusTI-84 Plus Silver Edition
© 2004 Texas Instruments IncorporatedWindows and Macintosh are trademarks of their respective owners.
8/4/2019 Ti Plus Guidebook Part1 En
http://slidepdf.com/reader/full/ti-plus-guidebook-part1-en 2/198
ii
Important InformationTexas Instruments makes no warranty, either express or implied,including but not limited to any implied warranties of merchantabilityand fitness for a particular purpose, regarding any programs or book
materials and makes such materials available solely on an "as-is" basis. Inno event shall Texas Instruments be liable to anyone for special,collateral, incidental, or consequential damages in connection with orarising out of the purchase or use of these materials, and the sole andexclusive liability of Texas Instruments, regardless of the form of action,shall not exceed the purchase price of this product. Moreover, TexasInstruments shall not be liable for any claim of any kind whatsoeveragainst the use of these materials by any other party.

8/4/2019 Ti Plus Guidebook Part1 En
http://slidepdf.com/reader/full/ti-plus-guidebook-part1-en 3/198
iii
USA FCC Information Concerning Radio Frequency InterferenceThis equipment has been tested and found to comply with the limits for aClass B digital device, pursuant to Part 15 of the FCC rules. These limits are
designed to provide reasonable protection against harmful interference ina residential installation. This equipment generates, uses, and can radiateradio frequency energy and, if not installed and used in accordance withthe instructions, may cause harmful interference with radiocommunications. However, there is no guarantee that interference will notoccur in a particular installation.
If this equipment does cause harmful interference to radio or televisionreception, which can be determined by turning the equipment off and
on, you can try to correct the interference by one or more of thefollowing measures:
Reorient or relocate the receiving antenna.
• Increase the separation between the equipment and receiver.
• Connect the equipment into an outlet on a circuit different fromthat to which the receiver is connected.
• Consult the dealer or an experienced radio/television technician for
help.Caution: Any changes or modifications to this equipment not expresslyapproved by Texas Instruments may void your authority to operate theequipment.

8/4/2019 Ti Plus Guidebook Part1 En
http://slidepdf.com/reader/full/ti-plus-guidebook-part1-en 4/198
iv
About the TI-84 Plus and TI-84 Plus Silver EditionThe TI-84 Plus Silver Edition is the same as the TI-84 Plus except:
• it has more memory, and thus more spaces for graphing handheldsoftware applications (Apps).
• it has interchangeable faceplates that let you customize theappearance of your TI-84 Plus Silver Edition.
Since all the functions of the TI-84 Plus Silver Edition and the TI-84 Plusare the same, this guidebook can be used for either the TI-84 Plus or theTI-84 Plus Silver Edition.
The CD included with your TI-84 Plus / TI-84 Plus Silver Edition packagealso includes an electronic guidebook, which is a complete reference
manual for the TI-84 Plus / TI-84 Plus Silver Edition. If the CD is notavailable, you can download a copy of the electronic guidebook from theTexas Instruments web page at:
education.ti.com/guides
The TI-84 Plus / TI-84 Plus Silver Edition has some graphing handheldsoftware applications (Apps) preinstalled. For information about theseApps, see the electronic documentation files on the Texas Instrumentweb page at:
education.ti.com/guides
About this book This guidebook gives a quick overview of each topic, along withkeystroke instructions for easy examples. All examples assume that theTI-84 Plus is using default settings. For complete information on anytopic, see the electronic guidebook on the CD that came with your
graphing handheld.

8/4/2019 Ti Plus Guidebook Part1 En
http://slidepdf.com/reader/full/ti-plus-guidebook-part1-en 5/198
Table of Contents
v
1 Getting Started.................................................................. 1TI-84 Plus keys................................................................................. 1
Turning the TI-84 Plus on and off .................................................. 2Home screen ................................................................................... 2y and ƒ keys ........................................................................ 3‘ and y 5 ....................................................................... 4Entering an expression................................................................... 4Interchangeable Faceplates ........................................................... 5Using the Clock............................................................................... 6TI-84 Plus menus ............................................................................. 8Editing and deleting .................................................................... 11Using ¹ and Ì ............................................................................. 13Using parentheses ........................................................................ 14Storing a value.............................................................................. 15Graphing a function..................................................................... 17Changing mode settings .............................................................. 18Setting the graphing window ..................................................... 21Using q ................................................................................... 23Building a table ............................................................................ 23
Using the CATALOG...................................................................... 25Performing simple calculations ................................................... 26Using the equation solver............................................................ 28Entering data into lists ................................................................. 30Plotting data................................................................................. 32Calculating a linear regression .................................................... 35Calculating statistical variables.................................................... 36Using the MATRIX Editor ............................................................. 37Grouping....................................................................................... 39
Ungrouping .................................................................................. 41Error messages .............................................................................. 42Resetting defaults ........................................................................ 43Installing applications .................................................................. 44Running applications ................................................................... 45Quick reference ........................................................................... 46Battery precautions ...................................................................... 46
2 Activities ......................................................................... .47The Quadratic Formula ................................................................ 47Box with Lid .................................................................................. 50Comparing Test Results Using Box Plots...................................... 57Graphing Piecewise Functions ..................................................... 59Graphing Inequalities................................................................... 60

8/4/2019 Ti Plus Guidebook Part1 En
http://slidepdf.com/reader/full/ti-plus-guidebook-part1-en 6/198
vi
Solving a System of Nonlinear Equations.................................... 62Using a Program to Create the Sierpinski Triangle..................... 63Graphing Cobweb Attractors....................................................... 64Using a Program to Guess the Coefficients ................................. 65Graphing the Unit Circle and Trigonometric Curves .................. 66
Finding the Area between Curves ............................................... 67Using Parametric Equations: Ferris Wheel Problem ................... 68Demonstrating the Fundamental Theorem of Calculus............. 71Computing Areas of Regular N-Sided Polygons ......................... 73Computing and Graphing Mortgage Payments ......................... 75
3 Memory and Variable Management .............................. 79Checking Available Memory ........................................................ 79
Deleting Items from Memory....................................................... 81Clearing Entries and List Elements............................................... 82Archiving and UnArchiving Variables.......................................... 83Resetting the TI-84 Plus ................................................................ 87Grouping and Ungrouping Variables .......................................... 90Garbage Collection....................................................................... 93ERR:ARCHIVE FULL Message ........................................................ 97
4 Communication Link....................................................... 99
Getting Started: Sending Variables ............................................. 99TI-84 Plus LINK............................................................................. 100Selecting Items to Send .............................................................. 102Receiving Items ........................................................................... 106Backing Up RAM Memory .......................................................... 107Error Conditions......................................................................... .108
A Appendix A: Tables and Reference Information......... 111
Table of Functions and Instructions........................................... 111Variables ...................................................................................... 154Statistics Formulas....................................................................... 155Financial Formulas ...................................................................... 159
B Appendix B: General Information................................ 163Battery Information.................................................................... 163Important Things You Need to Know About Your TI-84 Plus .. 165In Case of Difficulty .................................................................... 167Error Conditions.......................................................................... 169Accuracy Information ................................................................. 176Texas Instruments (TI) Support and Service............................... 179Texas Instruments (TI) Warranty Information ........................... 180

8/4/2019 Ti Plus Guidebook Part1 En
http://slidepdf.com/reader/full/ti-plus-guidebook-part1-en 7/198
Getting Started 1
1
Getting StartedTI-84 Plus keys
y Provides accessto the function orcharacter shownabove each key.
ƒ Providesaccess to thecharacters shownabove each key.
ΠDisplays amenu that listsApplicationsinstalled on theTI-84 Plus.
É Turns on theTI-84 Plus.
} ~ † | Let youmove the cursor in
four directions.
‘ Clears(erases) the entryline or deletes anentry and answeron the homescreen.
Í Evaluates anexpression,executes aninstruction, orselects a menuitem.
8/4/2019 Ti Plus Guidebook Part1 En
http://slidepdf.com/reader/full/ti-plus-guidebook-part1-en 8/198
2 Getting Started
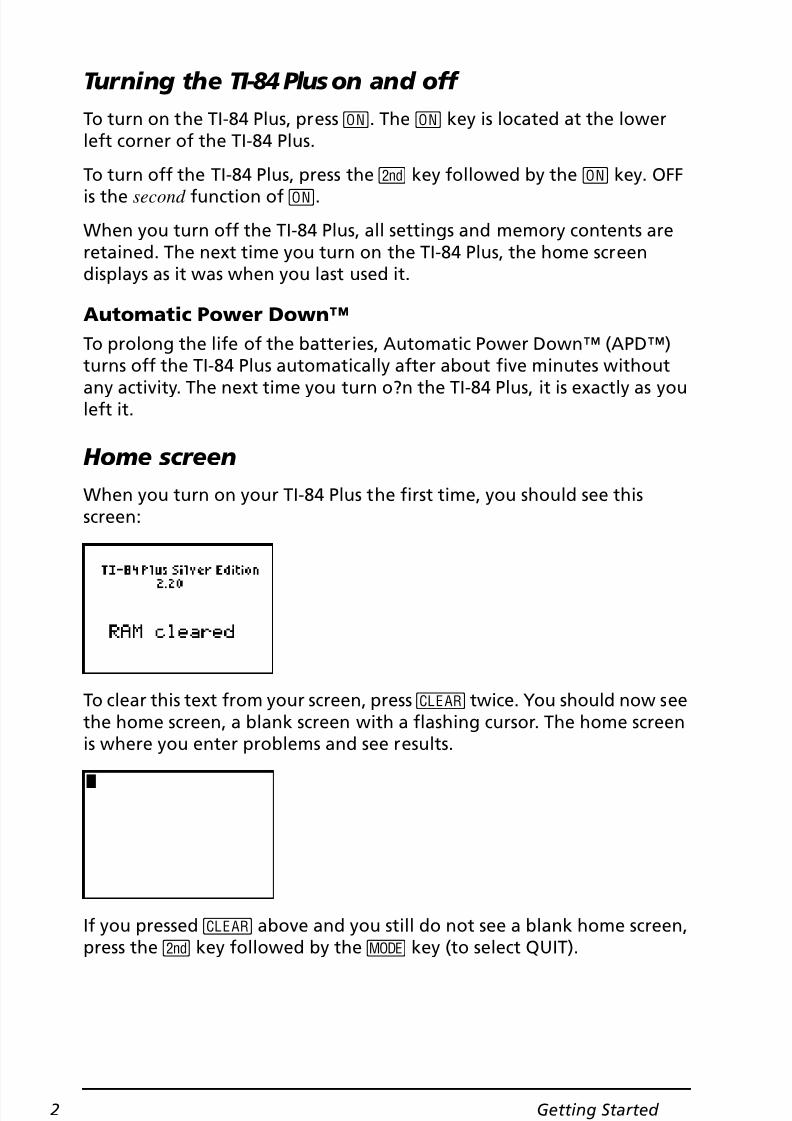
Turning the TI-84 Plus on and off To turn on the TI-84 Plus, press É . The É key is located at the lowerleft corner of the TI-84 Plus.
To turn off the TI-84 Plus, press the y key followed by the É key. OFFis the second function of É .
When you turn off the TI-84 Plus, all settings and memory contents areretained. The next time you turn on the TI-84 Plus, the home screendisplays as it was when you last used it.
Automatic Power Down™To prolong the life of the batteries, Automatic Power Down™ (APD™)turns off the TI-84 Plus automatically after about five minutes withoutany activity. The next time you turn o?n the TI-84 Plus, it is exactly as youleft it.
Home screenWhen you turn on your TI-84 Plus the first time, you should see thisscreen:
To clear this text from your screen, press ‘ twice. You should now seethe home screen, a blank screen with a flashing cursor. The home screenis where you enter problems and see results.
If you pressed ‘ above and you still do not see a blank home screen,
press the y key followed by the z key (to select QUIT).

8/4/2019 Ti Plus Guidebook Part1 En
http://slidepdf.com/reader/full/ti-plus-guidebook-part1-en 9/198
Getting Started 3
Example: Add 2 + 3 on the home screen.
Note: Results are displayed on the next line (the answer line), not on theentry line.
Example: Multiply 5 x 4.
y and ƒ keysMost keys on the TI-84 Plus can perform two or more functions. To use afunction printed on a key, press the key. To use a function printed abovea key, you must first press the y key or the ƒ key.
y keySecond functions are printed above the keys (the same color as the y
key). Some secondary functions enter a function or a symbol on thehome screen (sin L1 or ‡ , for example). Others display menus or editors.
To view the ANGLE menu, for example, look for ANGLE above the Πkey near the top of the TI-84 Plus keyboard. Press the y key (and thenrelease it) and then press Π. In this guidebook the key combination isindicated by y ; , not y Π.
Press Result
2 Ã 3
Í
Press Result
5 ¯ 4 Í
Entry line Answer line

8/4/2019 Ti Plus Guidebook Part1 En
http://slidepdf.com/reader/full/ti-plus-guidebook-part1-en 10/198
4 Getting Started
Note: The flashing cursor changes to Þ when you press the y key.
ƒ keyThe ƒ key lets you enter the alphabetic characters and some specialsymbols. To enter T, for example, press ƒ (and then release it) andthen press ¶ . In the guidebook this key combination is indicated byƒ [T].
If you have several alphabetic characters to enter, press y 7 toavoid having to press the ƒ key multiple times. This locks the alphakey in the On position until you press ƒ a second time to unlock it.
Note: The flashing cursor changes to Ø when you press the ƒ key.
‘ and y 5 ‘ keyThe ‘ key erases the home screen. This key is located just below thefour arrow keys at the upper right corner of the TI-84 Plus keyboard. Ifyou press ‘ during an entry, it clears the entry line. If you press‘ when the cursor is on a blank line, it clears everything on thehome screen.
Although it does not affect the calculation, it is frequently helpful toclear the previous work from the home screen before you begin a newproblem. As you work through this guide, we recommend that you press‘ each time you begin a new Example . This removes the previousexample from the home screen and ensures that the screen you seematches the one shown in the example.
y 5If you accidentally press a menu key, pressing ‘ will usually returnyou to the home screen, but in most cases pressing y 5 to leave themenu and return to the home screen.
Entering an expressionAn expression consists of numbers, variables, operators, functions, andtheir arguments that evaluate to a single answer. 2X + 2 is an expression.
Type the expression, and then press Í to evaluate it. To enter afunction or instruction on the entry line, you can:
• Press its key, if available. For example, press « .
— or —

8/4/2019 Ti Plus Guidebook Part1 En
http://slidepdf.com/reader/full/ti-plus-guidebook-part1-en 11/198
Getting Started 5
• Select it from the CATALOG, if the function appears on theCATALOG. For example, press y N , press † to move down tolog( , and press Í to select log( .
— or —
• Select it from a menu, if available. For example, to find the roundfunction, press , press ~ to select NUM , then select 2:round( .
Example: Enter and evaluate the expression p Q2.
Interchangeable FaceplatesThe TI-84 Plus Silver Edition has interchangeable faceplates that let youcustomize the appearance of your unit. To purchase additionalfaceplates, refer to the TI Online Store at education.ti.com .
Removing a Faceplate
Press Result
y B ¯ 2
Í
1. Lift the tab at the bottomedge of the faceplate awayfrom the TI-84 Plus SilverEdition case.
2. Carefully lift the faceplateaway from the unit until it
releases. Be careful not todamage the faceplate or thekeypad.

8/4/2019 Ti Plus Guidebook Part1 En
http://slidepdf.com/reader/full/ti-plus-guidebook-part1-en 12/198
6 Getting Started
Installing New Faceplates
Using the Clock Use the Clock to set the time and date, select the clock display format,and turn the clock on and off. The clock is turned on by default and isaccessed from the mode screen.
Displaying the Clock Settings
Changing the Clock settings
1. Align the top of the faceplatein the corresponding groovesof the TI-84 Plus Silver Edition
case.2. Gently click the faceplate into
place. Do not force.
1. Press z2. Press the † to move the cursor to
SET CLOCK.
3. Press Í .
1. Press the ~ or | to highlight the dateformat you want, example: M/D/Y. PressÍ .
2. Press † to highlight YEAR. Press ‘ andtype the year, example: 2004.
3. Press † to highlight MONTH. Press ‘ and type the number of the month (a
number from 1–12).

8/4/2019 Ti Plus Guidebook Part1 En
http://slidepdf.com/reader/full/ti-plus-guidebook-part1-en 13/198
Getting Started 7
Error Messages
Turning the Clock OnThere are two options to turn the clock on. One option is through theMODE screen, the other is through the Catalog.
4. Press † to highlight DAY. Press ‘ andtype the date.
5. Press † to highlight TIME. Press ~ or | tohighlight the time format you want. Press
Í .6. Press † to highlight HOUR. Press ‘
and type the hour. A number from 1–12 or0–23.
7. Press † to highlight MINUTE. Press ‘ and type the minutes. A number from 0–59.
8. Press†
to highlight AM/PM. Press~
or|
to highlight the format. Press Í .
9. To Save changes, press † to select SAVE .Press Í .
If you type the wrong date for the month, forexample: June 31, June does not have 31 days,you will receive an error message with twochoices:
• To Quit the Clock application and return tothe Home screen, select 1: Quit. PressÍ .
— or —
• To return to the clock application and
correct the error, select 2: Goto. PressÍ .

8/4/2019 Ti Plus Guidebook Part1 En
http://slidepdf.com/reader/full/ti-plus-guidebook-part1-en 14/198
8 Getting Started
Using the Mode Screen to turn the clock on
Using the Catalog to turn the clock on
Turning the Clock Off
TI-84 Plus menusMany functions and instructions are entered on the home screen byselecting from a menu.
To select an item from the displayed menu:
• Press the number or letter shown at the left of that item.
— or —
• Use the cursor arrow keys, † or } , to highlight the item, and thenpress Í .
Some menus close automatically when you make a selection, but if themenu remains open, press y 5 to exit. Do not press ‘ to exit,since this will sometimes delete your selection.
1. If the Clock is turned off, Press † tohighlight TURN CLOCK ON .
2. Press Í .
1. If the Clock is turned off, Press y N
2. Press † or } to scroll the CATALOG until
the selection cursor points to ClockOn .3. Press Í .
1. Press y N .
2. Press † or } to scroll the CATALOG untilthe selection cursor points to ClockOff .
3. Press Í .
ClockOff will turn off the Clock display.
8/4/2019 Ti Plus Guidebook Part1 En
http://slidepdf.com/reader/full/ti-plus-guidebook-part1-en 15/198
Getting Started 9
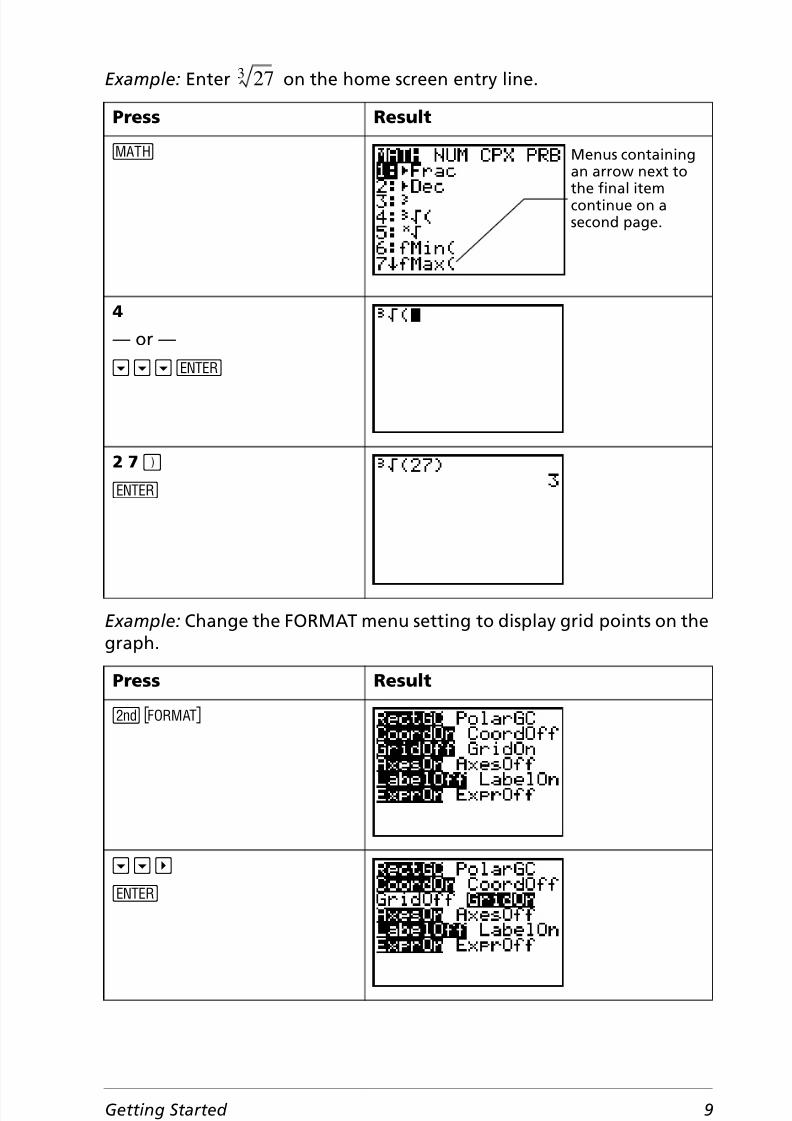
Example: Enter on the home screen entry line.
Example: Change the FORMAT menu setting to display grid points on thegraph.
Press Result
4
— or —† † † Í
2 7 ¤Í
Press Result
y .
† † ~
Í
273
Menus containingan arrow next to
the final itemcontinue on asecond page.
8/4/2019 Ti Plus Guidebook Part1 En
http://slidepdf.com/reader/full/ti-plus-guidebook-part1-en 16/198
10 Getting Started
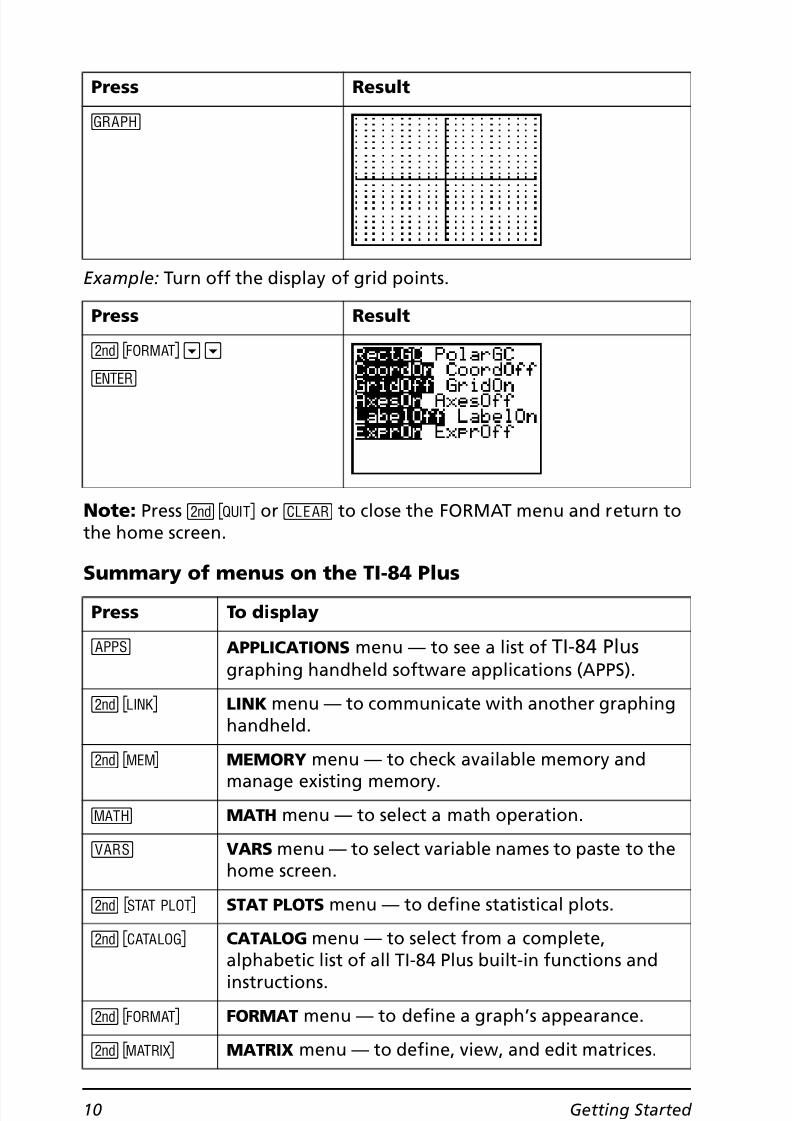
Example: Turn off the display of grid points.
Note: Press y 5 or ‘ to close the FORMAT menu and return tothe home screen.
Summary of menus on the TI-84 Plus
s
Press Result
y . † †
Í
Press To display
Œ APPLICATIONS menu — to see a list of TI-84 Plus graphing handheld software applications (APPS).
y 8 LINK menu — to communicate with another graphinghandheld.
y L MEMORY menu — to check available memory andmanage existing memory.
MATH menu — to select a math operation.
VARS menu — to select variable names to paste to thehome screen.
y , STAT PLOTS menu — to define statistical plots.
y N CATALOG menu — to select from a complete,alphabetic list of all TI-84 Plus built-in functions andinstructions.
y . FORMAT menu — to define a graph’s appearance.
y > MATRIX menu — to define, view, and edit matrices.
Press Result

8/4/2019 Ti Plus Guidebook Part1 En
http://slidepdf.com/reader/full/ti-plus-guidebook-part1-en 17/198
Getting Started 11
Editing and deleting You can change any expression or entry using the backspace | key, thedelete { key, or the insert y 6 key. You can make a change beforeor after you press Í .
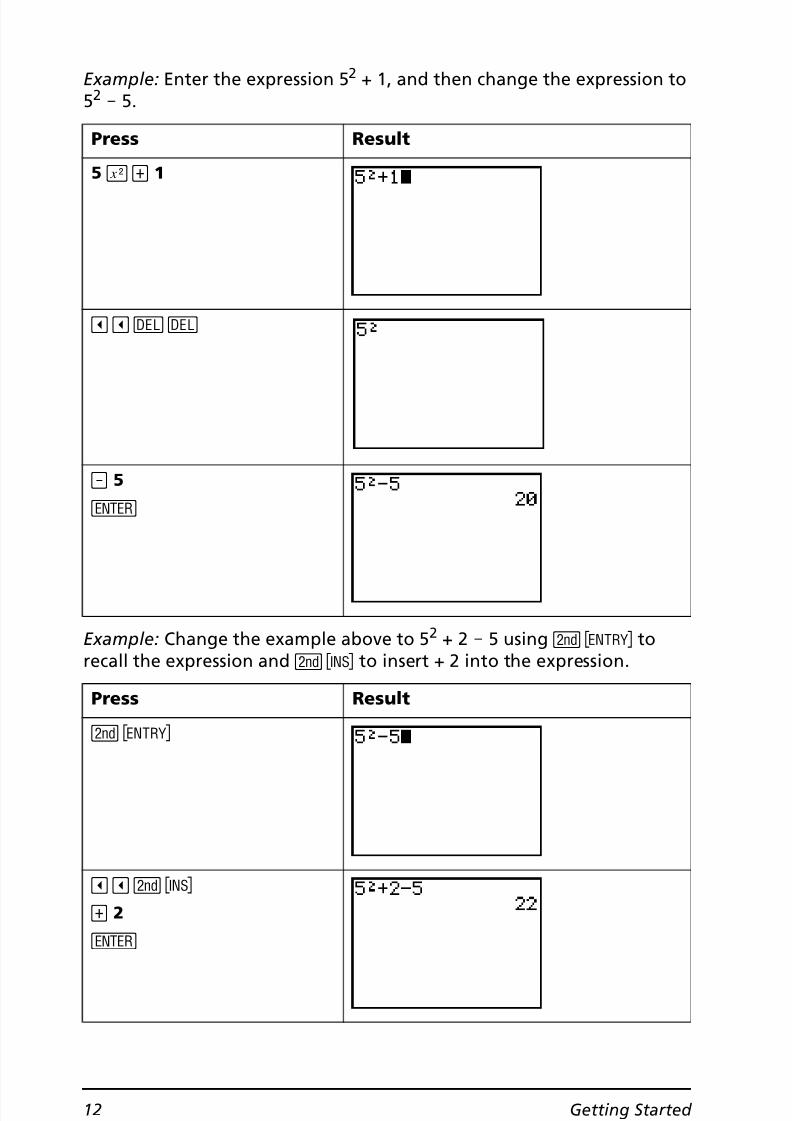
Example: Enter the expression 5 2 + 1, and then change the expression to52 + 5.
y < DRAW menu — to select tools for drawing on graphs.
y = DISTRIBUTIONS menu — to select distributionfunctions to paste to the home screen or editorscreens.
y : TEST menu — to select relational operators (=, ƒ , { , | ,etc.) and Boolean operators (and, or, xor, not) to pasteto the home screen.
Press Result
5 ¡ Ã 1
| 5
Press To display
8/4/2019 Ti Plus Guidebook Part1 En
http://slidepdf.com/reader/full/ti-plus-guidebook-part1-en 18/198
12 Getting Started
Example: Enter the expression 5 2 + 1, and then change the expression to52 N 5.
Example: Change the example above to 5 2 + 2 N 5 using y [ torecall the expression and y 6 to insert + 2 into the expression.
Press Result
5 ¡ Ã 1
| | { {
¹ 5Í
Press Result
y [
| | y 6
à 2
Í
8/4/2019 Ti Plus Guidebook Part1 En
http://slidepdf.com/reader/full/ti-plus-guidebook-part1-en 19/198
Getting Started 13
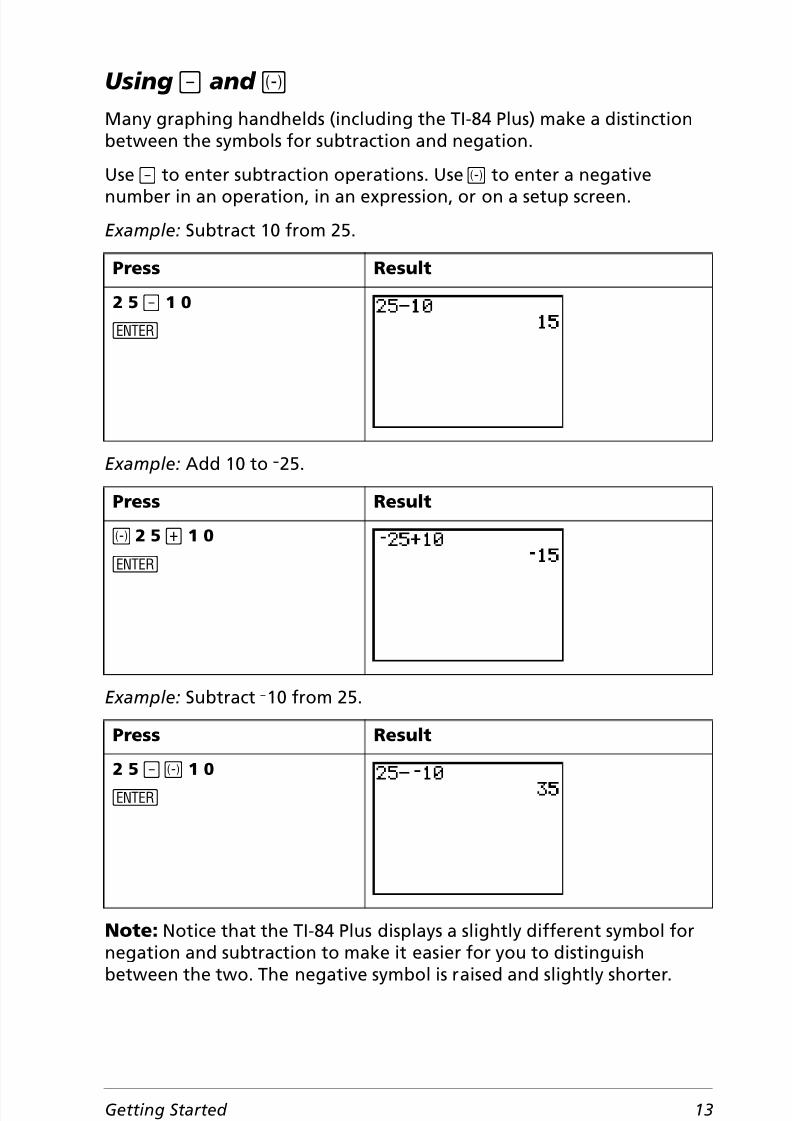
Using ¹ and ÌMany graphing handhelds (including the TI-84 Plus) make a distinctionbetween the symbols for subtraction and negation.
Use ¹ to enter subtraction operations. Use Ì to enter a negativenumber in an operation, in an expression, or on a setup screen.
Example: Subtract 10 from 25.
Example: Add 10 to L25.
Example: Subtract L10 from 25.
Note: Notice that the TI-84 Plus displays a slightly different symbol fornegation and subtraction to make it easier for you to distinguishbetween the two. The negative symbol is raised and slightly shorter.
Press Result
2 5 ¹ 1 0
Í
Press Result
Ì 2 5 Ã 1 0
Í
Press Result
2 5 ¹ Ì 1 0
Í

8/4/2019 Ti Plus Guidebook Part1 En
http://slidepdf.com/reader/full/ti-plus-guidebook-part1-en 20/198
14 Getting Started
Using parenthesesSince all calculations inside parentheses are completed first, it issometimes important to place a portion of an expression insideparentheses.
Example: Multiply 4 …1+2; then multiply 4 …(1+2).
Note: The closing parenthesis ¤ is optional. The operation will becompleted if you omit it. The exception to this rule occurs when there isanother operation following the parenthetical operation. In this case,you must include the closing parenthesis.
Example: Divide 1/2 by 2/3.
Press Result
4 ¯ 1 Ã 2Í
4 ¯ £ 1 à 2 ¤Í
Press Result
£ 1 ¥ 2 ¤ ¥£ 2 ¥ 3 ¤Í

8/4/2019 Ti Plus Guidebook Part1 En
http://slidepdf.com/reader/full/ti-plus-guidebook-part1-en 21/198
Getting Started 15
Example: Calculate 16 ^ .
Example: Calculate ( L3)2.
Note: Try each of these examples without the parentheses and see whathappens!
Storing a valueValues are stored to and recalled from memory using variable names.
Example: Store 25 to variable A and multiply A by 2.
Press Result
1 6 › £ 1 ¥ 2 ¤Í
Press Result
£ Ì 3 ¤ ¡
Í
Press Result2 5 ¿ ƒ [A]
12---

8/4/2019 Ti Plus Guidebook Part1 En
http://slidepdf.com/reader/full/ti-plus-guidebook-part1-en 22/198
16 Getting Started
Example: Find the value of 2X 3 N 5X2 N 7X + 10 when X = L0.5.
You can remove a value stored to a variable using the DELVAR functionor by storing 0 to the variable.
Í
2 ¯ ƒ [A]Í
— or —ƒ [A] ¯ 2Í
Press Result
Ì Ë 5 ¿ „
Í
(stores L.5 to X)
2 „ › 3¹ 5 „ ¡¹ 7 „ Ã 1 0
Í
Press Result
8/4/2019 Ti Plus Guidebook Part1 En
http://slidepdf.com/reader/full/ti-plus-guidebook-part1-en 23/198
Getting Started 17
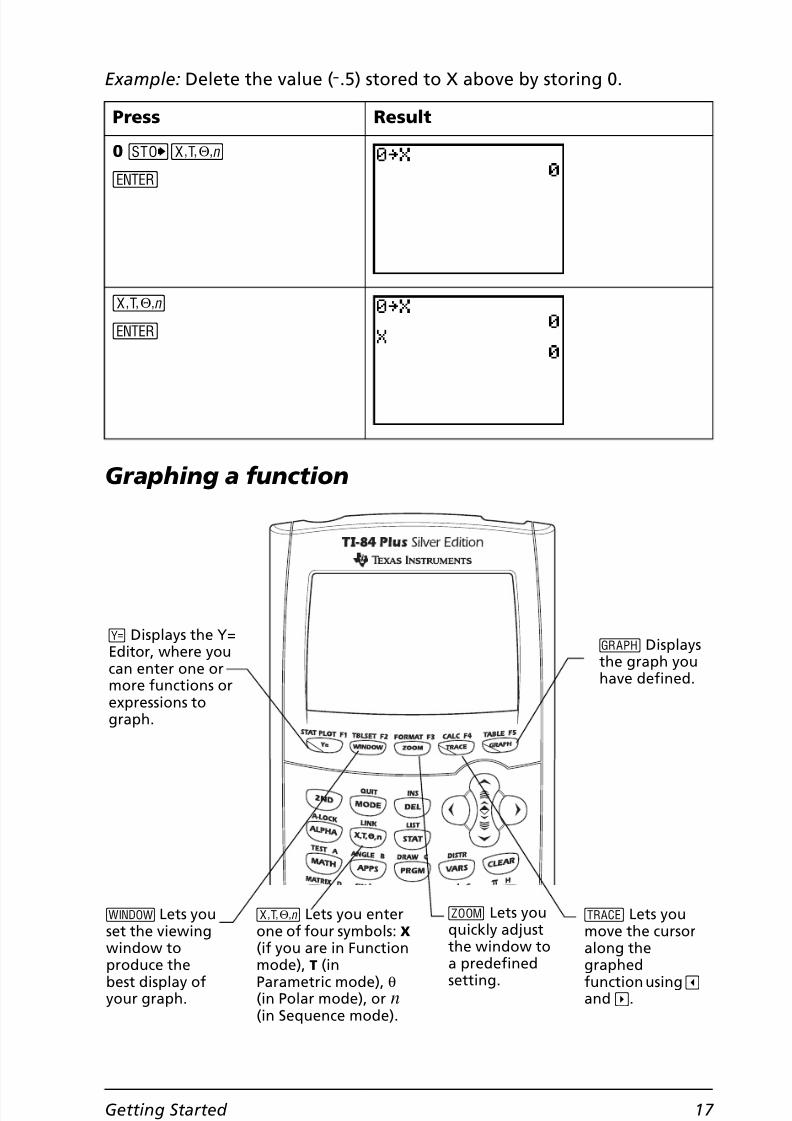
Example: Delete the value ( L.5) stored to X above by storing 0.
Graphing a function
Press Result
0 ¿„
Í
„
Í
o Displays the Y=Editor, where youcan enter one ormore functions orexpressions tograph.
p Lets youset the viewingwindow toproduce thebest display ofyour graph.
„ Lets you enterone of four symbols: X (if you are in Functionmode), T (inParametric mode), q (in Polar mode), or n (in Sequence mode).
q Lets youquickly adjust
the window toa predefinedsetting.
r Lets youmove the cursoralong thegraphedfunction using | and ~ .
s Displaysthe graph youhave defined.
8/4/2019 Ti Plus Guidebook Part1 En
http://slidepdf.com/reader/full/ti-plus-guidebook-part1-en 24/198
18 Getting Started
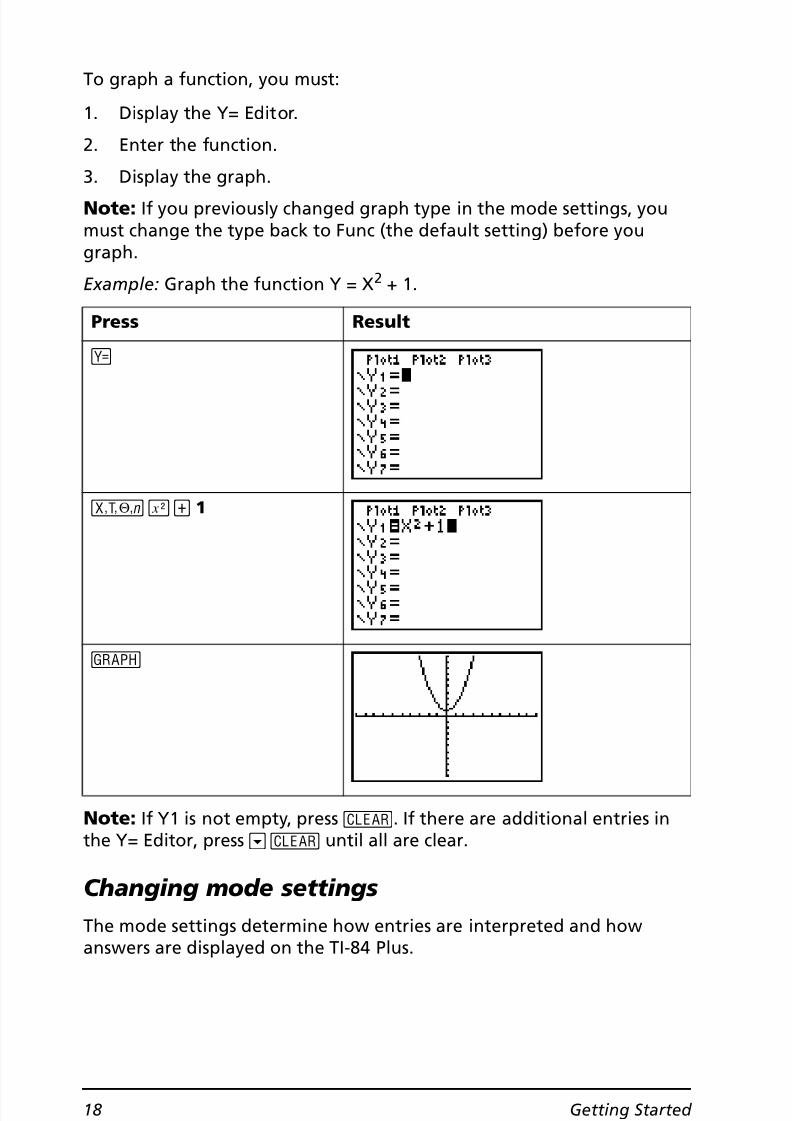
To graph a function, you must:
1. Display the Y= Editor.
2. Enter the function.
3. Display the graph.
Note: If you previously changed graph type in the mode settings, youmust change the type back to Func (the default setting) before yougraph.
Example: Graph the function Y = X 2 + 1.
Note: If Y1 is not empty, press ‘ . If there are additional entries inthe Y= Editor, press † ‘ until all are clear.
Changing mode settingsThe mode settings determine how entries are interpreted and how
answers are displayed on the TI-84 Plus.
Press Result
o
„ ¡ Ã 1
s

8/4/2019 Ti Plus Guidebook Part1 En
http://slidepdf.com/reader/full/ti-plus-guidebook-part1-en 25/198
Getting Started 19
Example: Change the mode setting for decimals from Float to 3 decimalplaces.
Note: You must press Í to change a mode setting. If you highlightthe setting and then exit the mode menu without pressing Í , thesetting will not be changed.
The mode menu includes the following settings:
Press Result
z
† ~ ~ ~ ~
Í
y 5
1 Ë 2 3 4 5 6Í
Setting ChoicesNumericnotation
• Normal: for example, 12345.67• Sci (scientific): for example, 1.234567 â4• Eng (engineering): for example, 12.34567 â3
Decimal • Float : lets the number of decimal places changebased on the result (up to 10 digits)
• 0–9: sets the number of decimal places to a value(0 –9) that you specify
Anglemeasure
• Radian: interprets angle values as radians• Degree: interprets angle values as degrees

8/4/2019 Ti Plus Guidebook Part1 En
http://slidepdf.com/reader/full/ti-plus-guidebook-part1-en 26/198
20 Getting Started
The importance of mode settings
Example: Multiply 2/3 Q2.
Type of graph • Func (functional): plots functions, where Y is afunction of X
• Par (parametric): plots relations, where X and Yare functions of T
• Pol (polar): plots functions, where r is a functionof ô q
• Seq (sequence): plots sequences
Plot type • Connected: draws a line connecting each pointcalculated for the selected functions
• Dot: plots only the calculated points of theselected functions
Sequential orsimultaneousgraphing
• Sequential: draws graphs one at a time• Simul (simultaneous): draws several graphs at the
same time
Real orcomplex mode
• Real: displays real numbers, such as 1, 1/2, ‡ 3• a+b × (rectangular complex): displays as 3+2 ×
• re^q× (polar complex): displays as re^ q×Screen display • Full: displays full screen
• Horiz: displays a horizontal split screen• G-T: displays a vertical split screen (graph &
table)
Press Result
z † ~ Í
Setting Choices

8/4/2019 Ti Plus Guidebook Part1 En
http://slidepdf.com/reader/full/ti-plus-guidebook-part1-en 27/198
Getting Started 21
Your first reaction to this example is that the graphing handheld hasproduced a wrong answer. But you have set it to round to 0 decimalplaces (the nearest whole number), so for this setting the answer iscorrect. If you set rounding (decimals displayed) to 0 and then forget toreset it for later calculations, you may be surprised by some of youranswers! With mode set to the default setting of Float , the result will be:
Setting the graphing window To obtain the best view of the graph, you may need to change theboundaries of the window.
To display the WINDOW Editor, press p .
The Xmin , Xmax , Ymin, and Ymax variables represent the boundaries ofthe viewing window.
2 ¥ 3 ¯ 2 Í
Press Result
2 ¥ 3 ¯ 2Í
Window variables (shown inWINDOW Editor)
Corresponding viewingwindow (shown on Graph
window)
Press Result
Ymin
XminYmax
Xmax
Xscl
Yscl

8/4/2019 Ti Plus Guidebook Part1 En
http://slidepdf.com/reader/full/ti-plus-guidebook-part1-en 28/198
22 Getting Started
Xmin: the minimum value of X to be displayed. Xmax: the maximum value of X to be displayed.Ymin: the minimum value of Y to be displayed.Ymax: the maximum value of Y to be displayed.
Xcsl (X scale): the distance between the tick marks on the X axis.
Yscl (Y scale): the distance between the tick marks on the Y axis. Xres: pixel resolution—not usually changed except by advanced users.
To change the values:
1. Move the cursor to highlight the value you want to change.
2. Do one of the following:
• Type a value or an expression. The old value is erased when youbegin typing.
— or —
• Press ‘ to clear the old value; then type the new one.
3. Press Í , † , or } .
Note: Values are stored as you type them; you do not need to pressÍ . Pressing Í simply moves the cursor to the next windowvariable.
4. After you have made all changes, press y 5 to close theWINDOW Editor (or s to display the graph).
Example: Change the window settings to display a maximum X value of25, a minimum X value of L25, a maximum Y value of 50, and a minimumY value of L50.
Press Result
p
Ì 2 5 † 2 5 † †
Ì 5 0 † 5 0

8/4/2019 Ti Plus Guidebook Part1 En
http://slidepdf.com/reader/full/ti-plus-guidebook-part1-en 29/198
Getting Started 23
Using qThe TI-84 Plus has ten predefined window settings that let you quicklyadjust the graph window to a predetermined level of magnification. To
display this menu, press q .
Building a tableTables are useful tools for comparing values for a function at multiplepoints.
y 5
Selection Result
1: ZBox Lets you draw a box (using the cursor pad) todefine the viewing window.
2: Zoom In After you position the cursor and press Í ,magnifies the graph around the cursor.
3: Zoom Out After you position the cursor and press Í ,displays more of the graph.
4: ZDecimal Sets the change in X and Y to increments of .1when you use r .
5: ZSquare Adjusts the viewing window so that X and Ydimensions are equal.
6: ZStandard Sets the standard (default) window variables.
7: ZTrig Sets the built-in trigonometry window variables.8: ZInteger After you position the cursor and press Í , sets
the change in X and Y to whole numberincrements.
9: ZoomStat Sets the values for currently defined statistical lists.
0: ZoomFit Fits Ymin and Ymax between Xmin and Xmax .
Press Result

8/4/2019 Ti Plus Guidebook Part1 En
http://slidepdf.com/reader/full/ti-plus-guidebook-part1-en 30/198
24 Getting Started
Example: Build a table to evaluate the function Y = X 3 N 2X at eachinteger between L10 and 10.
Press Result
z † † †
Í
(sets function graphingmode)
o
„ 3¹ 2 „
y -
Ì 1 0 Í(sets TblStart; defaultsettings shown for the otherfields are appropriate)
y 0

8/4/2019 Ti Plus Guidebook Part1 En
http://slidepdf.com/reader/full/ti-plus-guidebook-part1-en 31/198
Getting Started 25
Note: Press † repeatedly to see the changes in X and Y.
Clearing the Y= EditorBefore proceeding with the remaining examples in this guidebook, clearthe Y= Editor.
Using the CATALOGThe CATALOG is an alphabetic list of all functions and instructions on theTI-84 Plus. Some of these items are also available on keys and menus.
To select from the CATALOG:
1. Position the cursor where you want to insert the item.
2. Press y N .
3. Press † or } to move the 4 indicator to the function or instruction.(You can move quickly down the list by typing the first letter of theitem you need.)
4. Press Í . Your selection is pasted on the home screen.
Notes:
• Items are listed in alphabetical order. Those that do not start with aletter ( +, ‚ , ‡ , p, and so on) are at the end of the list.
• You can also paste from the CATALOG to an editor, such as the Y=Editor.
Press Result
o
‘

8/4/2019 Ti Plus Guidebook Part1 En
http://slidepdf.com/reader/full/ti-plus-guidebook-part1-en 32/198
26 Getting Started
Example: Enter the rand function on the home screen.
Performing simple calculations
Changing a decimal to a fractionExample: Add 1/2 + 1/4 and change your answer to a fraction.
Press Result
y N [R] †
Í
Press Result
1 ¥ 2 Ã 1 ¥ 4Í
1Í
The Ø indicatesthat Alpha-lock ison.

8/4/2019 Ti Plus Guidebook Part1 En
http://slidepdf.com/reader/full/ti-plus-guidebook-part1-en 33/198
Getting Started 27
Finding the least common multipleExample: Find the least common multiple of 15 and 24.
Finding the square root
Example: Find the square root of 256.
Finding the factorial of numbersExample: Compute the factorial of 5 and 30.
Press Result
~ } }Í
1 5 ¢ 2 4 ¤ Í
Press Result
y C 2 5 6 ¤Í
Press Result
5 ~ ~ ~ 4Í
3 0 ~ ~ ~ 4Í
Scientificnotation

8/4/2019 Ti Plus Guidebook Part1 En
http://slidepdf.com/reader/full/ti-plus-guidebook-part1-en 34/198
28 Getting Started
Solving trigonometric functionsExample: Find the sine of an angle of 72 ¡ .
If you are solving multiple problems using angles, be sure that mode isset to Degree. If you are in Radian mode and do not wish to change themode, you can use y ; Í (as you did in this example) to addthe degree symbol to the calculation and override the Radian modesetting.
Adding Complex NumbersExample: Add (3+5 ×) + (2-3 ×).
Note: The × character is the second function of Ë (the decimal key).
Using the equation solver You can use the TI-84 Plus equation solver to solve for a variable in anequation.
Press Result
˜ 7 2 y ; Í ¤
Í
Press Result
£ 3 à 5 y V ¤Ã £ 2 ¹ 3 y V ¤
Í

8/4/2019 Ti Plus Guidebook Part1 En
http://slidepdf.com/reader/full/ti-plus-guidebook-part1-en 35/198
Getting Started 29
Example: Find the roots for the equation X 2 N 13X N 48 = 0.
If you do not see eqn:0= as shown above, press } (the up arrow), andthen press ‘ to erase the existing equation.
Press Result
}
Í
Press Result
„ ¡ ¹
1 3 „ ¹ 4 8
Í
ƒ \
8/4/2019 Ti Plus Guidebook Part1 En
http://slidepdf.com/reader/full/ti-plus-guidebook-part1-en 36/198
30 Getting Started
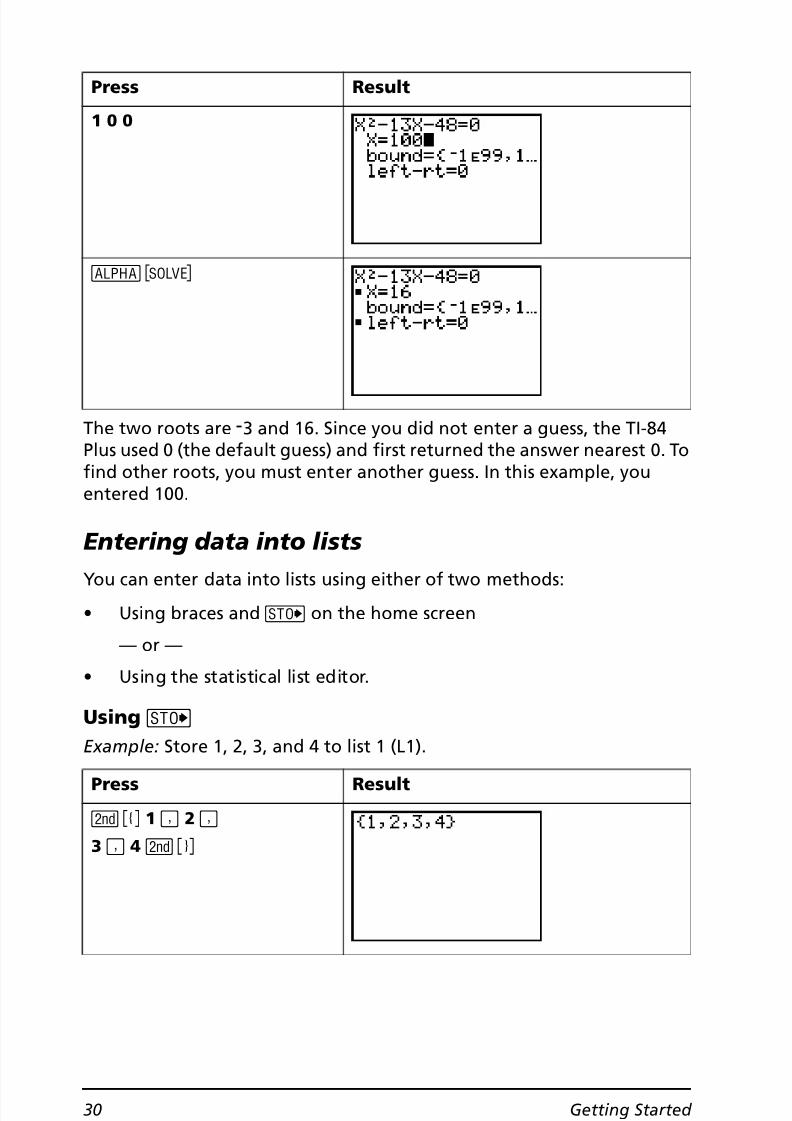
The two roots are M3 and 16. Since you did not enter a guess, the TI-84Plus used 0 (the default guess) and first returned the answer nearest 0. Tofind other roots, you must enter another guess. In this example, youentered 100.
Entering data into listsYou can enter data into lists using either of two methods:
• Using braces and ¿ on the home screen
— or —
• Using the statistical list editor.
Using ¿Example: Store 1, 2, 3, and 4 to list 1 (L1).
1 0 0
ƒ \
Press Result
y E 1 ¢ 2 ¢3 ¢ 4 y F
Press Result

8/4/2019 Ti Plus Guidebook Part1 En
http://slidepdf.com/reader/full/ti-plus-guidebook-part1-en 37/198
Getting Started 31
Using the statistical list editorExample: Store 5, 6, 7, and 8 to list 2 (L2).
¿
y d
Í
Press Result
… Í
~ } ‘ Í
(if L2 already contains data)
5 Í 6 Í7 Í 8 Í
Press Result

8/4/2019 Ti Plus Guidebook Part1 En
http://slidepdf.com/reader/full/ti-plus-guidebook-part1-en 38/198
32 Getting Started
Plotting dataWhen you have statistical data stored in lists, you can display the datayou have collected in a scatter plot, xyLine, histogram, box plot, or
normal probability plot.You will need to:
1. Determine which lists contain your data.
2. Tell the TI-84 Plus which lists of data you want to plot and define theplot.
3. Display the plot.
Determine which lists contain your data
Note: In some cases, you may have several lists stored and you may haveto press ~ several times to find the correct lists.
y 5 y e
Í
(displays the contents of thelist on the home screen)
Press Result
…
Í
Press Result

8/4/2019 Ti Plus Guidebook Part1 En
http://slidepdf.com/reader/full/ti-plus-guidebook-part1-en 39/198
Getting Started 33
Tell the TI-84 Plus which lists you want to plot
Press Result
y ,
4 Í(turns plots off if any plotsare on)
y ,
Í
Í(turns Plot1 on)
† † y 9
Í
(enters L1 as the Xlist)

8/4/2019 Ti Plus Guidebook Part1 En
http://slidepdf.com/reader/full/ti-plus-guidebook-part1-en 40/198
34 Getting Started
Note: This step is optional and is not necessary unless there is a previousentry in the Y= Editor. If there are additional entries in the Y= Editor,press † ‘ until all are clear.
Display the plot
† y 9 †
Í
(enters L2 as the Ylist)
† ~ Í
(selects + as the plottingmark)
o ‘
Press Result
s
q } } Í
(selects ZoomStat)
Press Result
8/4/2019 Ti Plus Guidebook Part1 En
http://slidepdf.com/reader/full/ti-plus-guidebook-part1-en 41/198
Getting Started 35
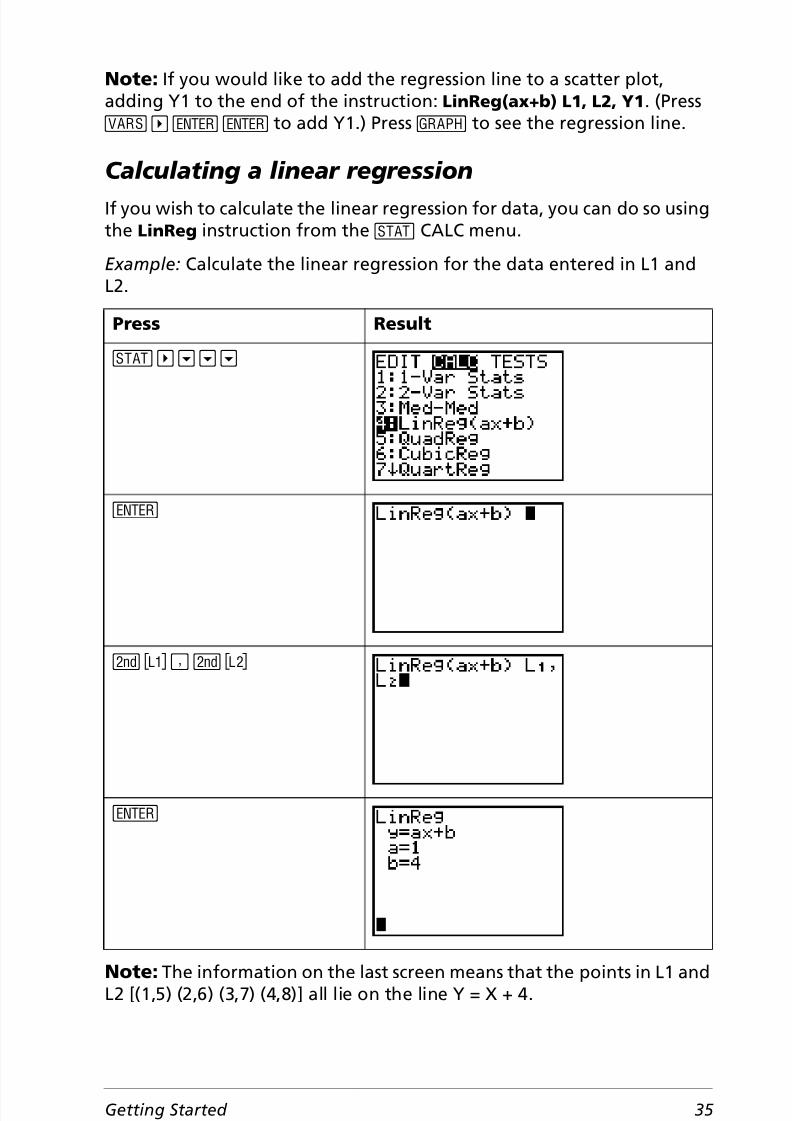
Note: If you would like to add the regression line to a scatter plot,adding Y1 to the end of the instruction: LinReg(ax+b) L1, L2, Y1 . (Press
~ Í Í to add Y1.) Press s to see the regression line.
Calculating a linear regressionIf you wish to calculate the linear regression for data, you can do so usingthe LinReg instruction from the … CALC menu.
Example: Calculate the linear regression for the data entered in L1 andL2.
Note: The information on the last screen means that the points in L1 andL2 [(1,5) (2,6) (3,7) (4,8)] all lie on the line Y = X + 4.
Press Result
… ~ † † †
Í
y d ¢ y e
Í
8/4/2019 Ti Plus Guidebook Part1 En
http://slidepdf.com/reader/full/ti-plus-guidebook-part1-en 42/198
36 Getting Started
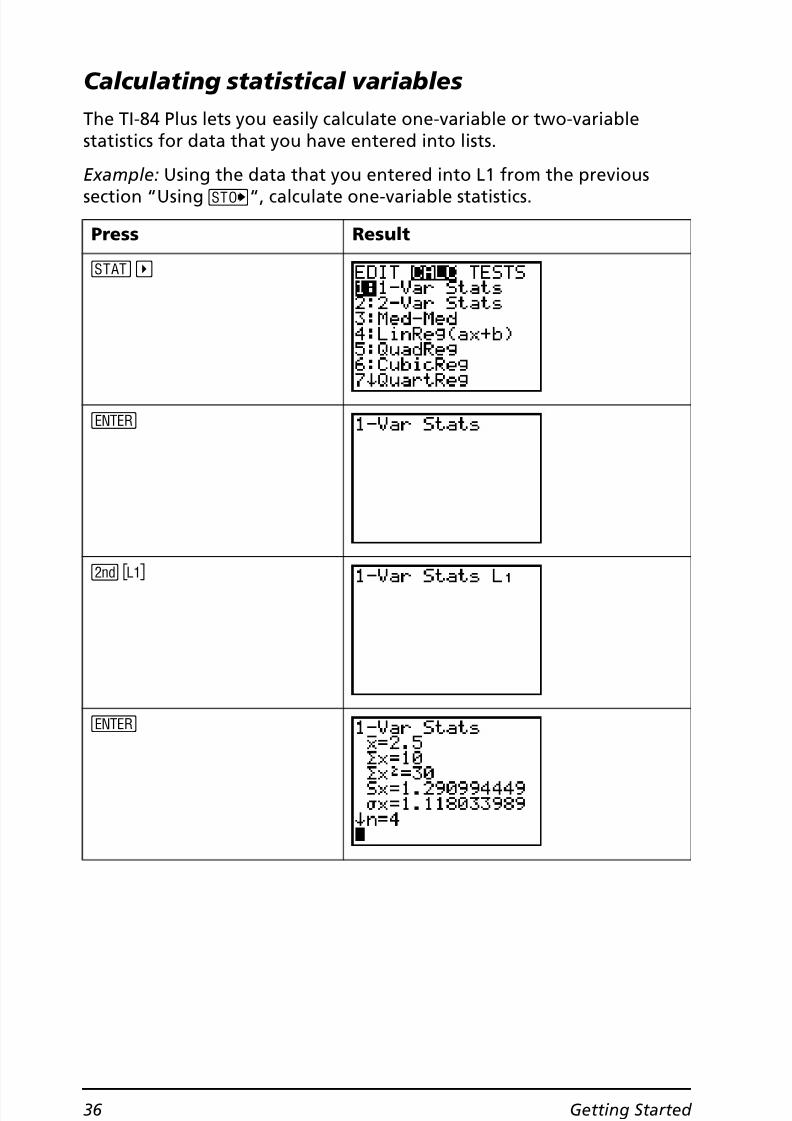
Calculating statistical variablesThe TI-84 Plus lets you easily calculate one-variable or two-variablestatistics for data that you have entered into lists.
Example: Using the data that you entered into L1 from the previoussection “Using ¿ “, calculate one-variable statistics.
Press Result
… ~
Í
y d
Í

8/4/2019 Ti Plus Guidebook Part1 En
http://slidepdf.com/reader/full/ti-plus-guidebook-part1-en 43/198
Getting Started 37
Using the MATRIX Editor
Creating a new matrix
Note: When you press Í , the cursor automatically highlights thenext cell so that you can continue entering or editing values. To enter anew value, you can start typing without pressing Í , but you mustpress Í to edit an existing value.
Using matrices to solve systems of equations
You can solve several equations simultaneously by entering theircoefficients into a matrix and then using the rref (reduced row-echelonform) function. For example, in the equations below, enter 3, 3, and 24(for 3X, 3Y, and 24) in the first row, and 2, 1, 13 (for 2X, 1Y, and 13) in thesecond row.
Press Result
y > |
Í
2 Í 2 Í
1 Í 5 Í2 Í 8 Í

8/4/2019 Ti Plus Guidebook Part1 En
http://slidepdf.com/reader/full/ti-plus-guidebook-part1-en 44/198
38 Getting Started
Example: Solve 3X + 3Y = 24 and 2X + Y = 13
Press Result
y > ~ ~ †
Í
2 Í 3 Í
3 Í 3 Í 2 4 Í2 Í 1 Í 1 3 Í
y 5
y > ~

8/4/2019 Ti Plus Guidebook Part1 En
http://slidepdf.com/reader/full/ti-plus-guidebook-part1-en 45/198
Getting Started 39
You can interpret the resulting matrix as:
[1 0 5] represents 1X + 0Y = 5 or X = 5
[0 1 3] represents 0X + 1Y = 3 or Y = 3
The solution to this system of equations is X = 5, Y = 3.
Grouping Grouping lets you make a copy of two or more variables and store them
in the Flash memory of the TI-84 Plus. This function is similar to “zipping”a computer file and storing it. For example, suppose that you want tosave data you collected for time, temperature, humidity, and barometricpressure because you may need to use the data for another assignment.
} } } } }
Í
y > † Í
Í
Press Result

8/4/2019 Ti Plus Guidebook Part1 En
http://slidepdf.com/reader/full/ti-plus-guidebook-part1-en 46/198
40 Getting Started
Grouping lets you keep these lists together for future use. Instead oftrying to locate the correct lists and remember which ones were collectedtogether, you can simply recall the group. Grouping also saves space onyour graphing handheld by copying variables from RAM to Flashmemory.
Example: Group lists L1, L2, and L3 and name them GROUPA.
Press Result
y L
8
Í
[G] [R] [O] [U] [P] [A]
Í
Caution: You are inalpha mode.

8/4/2019 Ti Plus Guidebook Part1 En
http://slidepdf.com/reader/full/ti-plus-guidebook-part1-en 47/198
Getting Started 41
Ungrouping To use variables that have been grouped, you must ungroup.
Example: Ungroup GROUPA.
4
Í † Í
† Í
~
Í
Press Result
y L
Press Result

8/4/2019 Ti Plus Guidebook Part1 En
http://slidepdf.com/reader/full/ti-plus-guidebook-part1-en 48/198
42 Getting Started
Error messagesOccasionally, when you enter a function or instruction or attempt todisplay a graph, the TI-84 Plus will return an error message.
For more details, see Appendix B
8
~
Í
3(to overwrite all three lists)
Press Result

8/4/2019 Ti Plus Guidebook Part1 En
http://slidepdf.com/reader/full/ti-plus-guidebook-part1-en 49/198
Getting Started 43
Example: Enter the least common multiple function lcm( followed byonly one number.
If you select 1:Quit , you return to the home screen with the cursor on anew entry line. If you select 2:Goto , you return to the original entry line;the cursor is flashing at the location of the error. You can now correct theerror and continue.
You can find a complete list of error conditions with explanations inAppendix B: General Information.
Resetting defaultsIf you are getting unexpected results, or if another person has used yourTI-84 Plus and may have changed the settings, you should considerresetting defaults on the TI-84 Plus.
Press Result
~ } } Í
2 7 ¢
Í
Press Result
y L

8/4/2019 Ti Plus Guidebook Part1 En
http://slidepdf.com/reader/full/ti-plus-guidebook-part1-en 50/198
44 Getting Started
WARNING: If you reset All RAM in step 3 above, you will delete storedvariables, lists, applications, and programs. Be sure you have backed upany essential data before you select this option.
Installing applicationsGraphing handheld software applications (Apps) let you update thefunctionality of your TI-84 Plus by installing Apps. This is similar to the
way that you add new features to your computer by installing newsoftware applications.
You can find applications for the TI-84 Plus at the TI Online Store ateducation.ti.com . Once you have downloaded an application to yourcomputer, you must use TI Connect™ or TI-GRAPH LINK™ software andthe USB computer cable or TI Connectivity Cable USB to install theapplication on your TI-84 Plus.
Instructions for Windows®1. Connect the USB computer cable between your computer and TI-84
Plus. Make sure the TI-84 Plus is on the home screen.
2. Using Windows (or NT) Explorer, locate the application file you wantto transfer to the connected device.
7
2
2
Press Result

8/4/2019 Ti Plus Guidebook Part1 En
http://slidepdf.com/reader/full/ti-plus-guidebook-part1-en 51/198
Getting Started 45
3. Reduce the size of the Explorer window so you can see the TIConnect desktop icon.
4. Click the application file you want to transfer.
5. Drag the application file out of Explorer and drop it on the TI
Connect desktop icon.
Instructions for Macintosh®1. Connect the TI Connectivity Cable USB for Macintosh/Windows
between your computer and TI-84 Plus, and make sure the TI-84 Plusis on the home screen.
2. Launch the TI-GRAPH LINK 2 software and establish a connection toyour TI-84 Plus.
3. Drag the application to the TI-84 Plus window in TI-GRAPH LINK.Follow any on-screen instructions that are given.
Running applicationsOnce you have installed an application on your TI-84 Plus, you must startthe application to use its features.
Example: Start the Catalog Help (CtlgHelp) app on the TI-84 Plus.
Press Result
Œ
† † Í

8/4/2019 Ti Plus Guidebook Part1 En
http://slidepdf.com/reader/full/ti-plus-guidebook-part1-en 52/198
46 Getting Started
Quick reference
Battery precautionsTake these precautions when replacing batteries.
• Do not leave batteries within the reach of children.
• Do not mix new and used batteries. Do not mix brands (or typeswithin brands) of batteries.
• Do not mix rechargeable and non-rechargeable batteries.
• Install batteries according to polarity (+ and N ) diagrams.
• Do not place non-rechargeable batteries in a battery recharger.
• Properly dispose of used batteries immediately.
• Do not incinerate or dismantle batteries.
Press To
y } Darken the screen
y † Lighten the screeny ~ Move the cursor to the end of an expression
y | Move the cursor to the beginning of anexpression
ƒ † Page down to the next screen (on menus)
ƒ } Page up to the next screen (on menus)
y [ Place your last entry on the current entry line onthe home screen
y Z Place Ans (a reference to your last answer) on thecurrent entry line on the home screen, allowingyou to use the answer in the next calculation
{ Delete the character under the cursor
y 6 Insert additional characters at the cursor
† } Move the cursor from line to line
~ | Move the cursor from character to characterwithin a line
‘ Clear the current line. (If the cursor is on a blankline, clears everything on the home screen.)

8/4/2019 Ti Plus Guidebook Part1 En
http://slidepdf.com/reader/full/ti-plus-guidebook-part1-en 53/198
Activities 47
2
ActivitiesThe Quadratic Formula
Entering a CalculationUse the quadratic formula to solve the quadratic equations3x2 + 5x + 2 = 0 and 2x 2 N x + 3 = 0. Begin with the equation3x2 + 5x + 2 = 0.
1. Press 3 ¿ ƒ [A] (above ) tostore the coefficient of the x 2 term.
2. Press ƒ [:] (above Ë ). The colon allowsyou to enter more than one instruction ona line.
3. Press 5 ¿ ƒ [B] (above Œ ) tostore the coefficient of the X term. Pressƒ [:] to enter a new instruction on thesame line. Press 2 ¿ ƒ [C] (above
) to store the constant.
4. Press Í to store the values to thevariables A, B, and C.
The last value you stored is shown on theright side of the display. The cursor moves
to the next line, ready for your next entry.
5. Press £ Ì ƒ [B] Ã y C ƒ [B] ¡¹ 4 ƒ [A] ƒ [C] ¤ ¤ ¥ £ 2 ƒ [A] ¤ to enter the expression for one ofthe solutions for the quadratic formula,
b– b2 4ac–±2a
--------------------------------------

8/4/2019 Ti Plus Guidebook Part1 En
http://slidepdf.com/reader/full/ti-plus-guidebook-part1-en 54/198
48 Activities
Converting to a FractionYou can show the solution as a fraction.
To save keystrokes, you can recall the last expression you entered, andthen edit it for a new calculation.
6. Press Í to find one solution for theequation 3x 2 + 5 x + 2 = 0 .
The answer is shown on the right side ofthe display. The cursor moves to the next
line, ready for you to enter the nextexpression.
1. Press to display the MATH menu.
2. Press 1 to select 1: 4Frac from the MATHmenu.
When you press 1 , Ans 4Frac is displayed onthe home screen. Ans is a variable thatcontains the last calculated answer.
3. Press Í to convert the result to afraction.
4. Press y [ (above Í ) to recall thefraction conversion entry, and then pressy [ again to recall the quadratic-formula expression,
b– b2 4ac–+2a
---------------------------------------

8/4/2019 Ti Plus Guidebook Part1 En
http://slidepdf.com/reader/full/ti-plus-guidebook-part1-en 55/198
Activities 49
Displaying Complex ResultsNow solve the equation 2x 2 N x + 3 = 0. When you set a+b i complexnumber mode, the TI-84 Plus displays complex results.
5. Press } to move the cursor onto the + signin the formula. Press ¹ to edit thequadratic-formula expression to become:
6. Press Í to find the other solution forthe quadratic equation 3x 2 + 5 x + 2 = 0 .
1. Press z † † † † † † (6 times), andthen press ~ to position the cursor overa+b i. Press Í to select a+b i complex-number mode.
2. Press y 5 (above z ) to return to the
home screen, and then press ‘ to clearit.
3. Press 2 ¿ ƒ [A] ƒ [:] Ì 1 ¿ƒ [B] ƒ [:] 3 ¿ ƒ [C] Í .
The coefficient of the x 2 term, thecoefficient of the X term, and the constantfor the new equation are stored to A, B,and C, respectively.
4. Press y [ to recall the storeinstruction, and then press y [ againto recall the quadratic-formula expression,
5. Press Í to find one solution for the
equation 2x 2 N x + 3 = 0.
b– b2 4ac––2a--------------------------------------
b– b24ac––
2a--------------------------------------

8/4/2019 Ti Plus Guidebook Part1 En
http://slidepdf.com/reader/full/ti-plus-guidebook-part1-en 56/198
50 Activities
Note: An alternative for solving equations for real numbers is to use thebuilt-in Equation Solver.
Box with Lid
Defining a FunctionTake a 20 cm × 25 cm. sheet of paper and cut X × X squares from twocorners. Cut X × 12.5 cm rectangles from the other two corners as shownin the diagram below. Fold the paper into a box with a lid. What value ofX would give your box the maximum volume V? Use the table and graphsto determine the solution.
6. Press y [ repeatedly until thisquadratic-formula expression is displayed:
7. Press Í to find the other solution forthe quadratic equation: 2x 2 N x + 3 = 0.
1. Press o to display the Y= editor, which iswhere you define functions for tables andgraphing.
2. Press £ 20 ¹ 2 „ ¤ £ 25 ¥ 2 ¹„ ¤ „ Í to define the volumefunction as Y1 in terms of X.
„ lets you enter X quickly, withouthaving to press ƒ . The highlighted = sign indicates that Y1 is selected.
b– b2 4ac–+2a
---------------------------------------
Begin by defining a function that describes
the volume of the box.From the diagram:2X + A = 202X + 2B = 25V = A…B…X
Substituting:V = (20 N 2X) (25à 2 N X) X
X
A
X B X B
20
25
8/4/2019 Ti Plus Guidebook Part1 En
http://slidepdf.com/reader/full/ti-plus-guidebook-part1-en 57/198
Activities 51
Defining a Table of ValuesThe table feature of the TI-84 Plus displays numeric information about afunction. You can use a table of values from the function you just definedto estimate an answer to the problem.
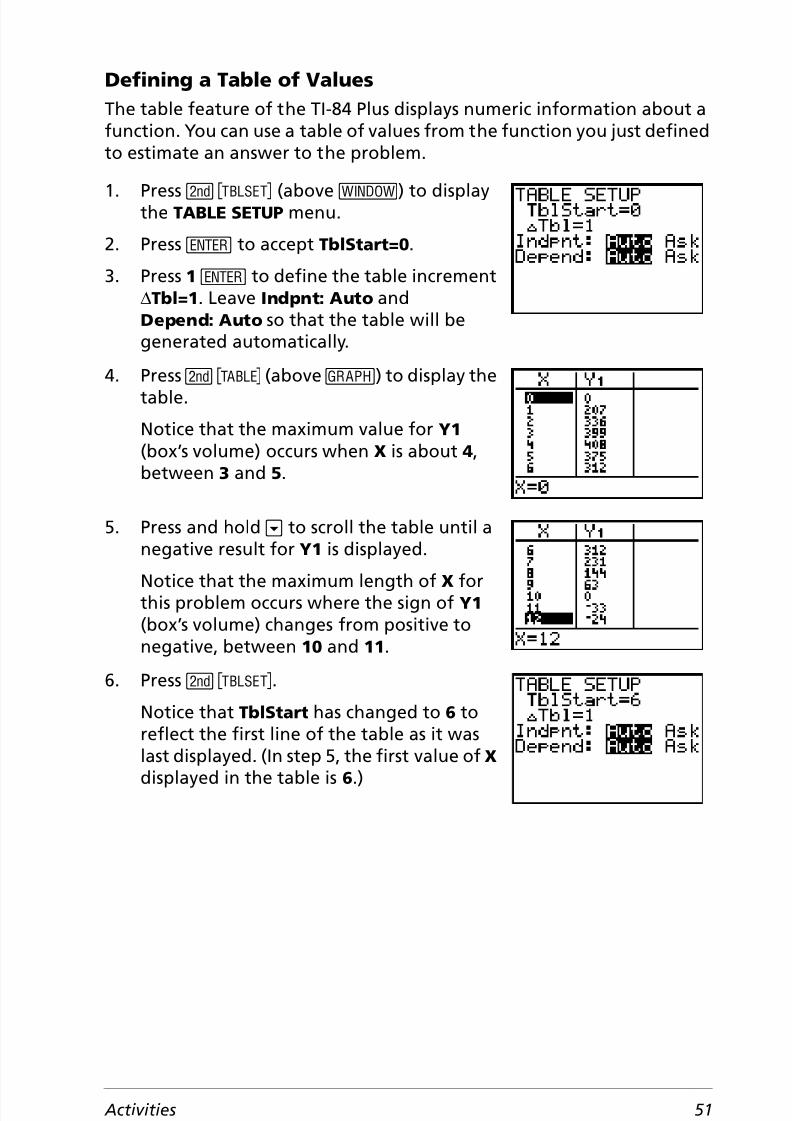
1. Press y - (above p ) to displaythe TABLE SETUP menu.
2. Press Í to accept TblStart=0 .
3. Press 1 Í to define the table increment@Tbl=1 . Leave Indpnt: Auto andDepend: Auto so that the table will begenerated automatically.
4. Press y 0 (above s ) to display thetable.
Notice that the maximum value for Y1 (box’s volume) occurs when X is about 4 ,between 3 and 5 .
5. Press and hold † to scroll the table until anegative result for Y1 is displayed.
Notice that the maximum length of X forthis problem occurs where the sign of Y1 (box’s volume) changes from positive tonegative, between 10 and 11 .
6. Press y - .
Notice that TblStart has changed to 6 toreflect the first line of the table as it was
last displayed. (In step 5, the first value of X displayed in the table is 6 .)

8/4/2019 Ti Plus Guidebook Part1 En
http://slidepdf.com/reader/full/ti-plus-guidebook-part1-en 58/198
52 Activities
Zooming In on the TableYou can adjust the way a table is displayed to get more informationabout a defined function. With smaller values for @Tbl , you can zoom inon the table.
1. Press 3 Í to set TblStart . Press Ë 1 Í to set @Tbl .
This adjusts the table setup to get a moreaccurate estimate of X for maximumvolume Y1 .
2. Press y 0 .
3. Press † and } to scroll the table.Notice that the maximum value for Y1 is410.26 , which occurs at X=3.7 . Therefore,the maximum occurs where 3.6<X<3.8 .
4. Press y - . Press 3 Ë 6 Í to setTblStart . Press Ë 01 Í to set @Tbl .
5. Press y 0 , and then press † and } toscroll the table.
Four equivalent maximum values areshown, 410.26 at X=3.67 , 3.68 , 3.69 , and3.70 .
6. Press † or } to move the cursor to 3.67 .Press ~ to move the cursor into the Y1 column.
The value of Y1 at X=3.67 is displayed onthe bottom line in full precision as410.261226 .

8/4/2019 Ti Plus Guidebook Part1 En
http://slidepdf.com/reader/full/ti-plus-guidebook-part1-en 59/198
Activities 53
Setting the Viewing WindowYou also can use the graphing features of the TI-84 Plus to find themaximum value of a previously defined function. When the graph isactivated, the viewing window defines the displayed portion of the
coordinate plane. The values of the window variables determine the sizeof the viewing window.
7. Press † to display the other maximum.
The value of Y1 at X=3.68 in full precisionis 410.264064 , at X=3.69 is 410.262318 andat X=3.7 is 410.256 .
The maximum volume of the box wouldoccur at 3.68 if you could measure and cutthe paper at .01-centimeter increments.
1. Press p to display the window editor,where you can view and edit the values ofthe window variables.
The standard window variables define theviewing window as shown. Xmin , Xmax ,Ymin , and Ymax define the boundaries ofthe display. Xscl and Yscl define thedistance between tick marks on the X andY axes. Xres controls resolution.
2. Press 0 Í to define Xmin .
3. Press 20 ¥ 2 to define Xmax using anexpression.
4. Press Í . The expression is evaluated,and 10 is stored in Xmax . Press Í toaccept Xscl as 1 .
5. Press 0 Í 500 Í 100 Í 1 Í to define the remaining window variables.

8/4/2019 Ti Plus Guidebook Part1 En
http://slidepdf.com/reader/full/ti-plus-guidebook-part1-en 60/198
54 Activities
Displaying and Tracing the GraphNow that you have defined the function to be graphed and the windowin which to graph it, you can display and explore the graph. You cantrace along a function using the TRACE feature.
1. Press s to graph the selected functionin the viewing window.
The graph of Y1=(20 N2X)(25 à 2NX)X isdisplayed.
2. Press ~ to activate the free-moving graphcursor.
The X and Y coordinate values for theposition of the graph cursor are displayedon the bottom line.
3. Press | , ~ , } , and † to move the free-moving cursor to the apparent maximumof the function.
As you move the cursor, the X and Y coordinate values are updated continually.
4. Press r . The trace cursor is displayed onthe Y1 function.
The function that you are tracing isdisplayed in the top-left corner.
5. Press | and ~ to trace along Y1 , one X dotat a time, evaluating Y1 at each X.
You also can enter your estimate for themaximum value of X.
6. Press 3 Ë 8 . When you press a number keywhile in TRACE, the X= prompt is displayedin the bottom-left corner.

8/4/2019 Ti Plus Guidebook Part1 En
http://slidepdf.com/reader/full/ti-plus-guidebook-part1-en 61/198
Activities 55
Zooming In on the GraphTo help identify maximums, minimums, roots, and intersections offunctions, you can magnify the viewing window at a specific locationusing the ZOOM instructions.
7. Press Í .
The trace cursor jumps to the point on theY1 function evaluated at X=3.8 .
8. Press | and ~ until you are on themaximum Y value.
This is the maximum of Y1(X) for the X pixel values. The actual, precise maximummay lie between pixel values.
1. Press q to display the ZOOM menu.
This menu is a typical TI-84 Plus menu. To
select an item, you can either press thenumber or letter next to the item, or youcan press † until the item number or letteris highlighted, and then press Í .
2. Press 2 to select 2:Zoom In .
The graph is displayed again. The cursorhas changed to indicate that you are usinga ZOOM instruction.
3. With the cursor near the maximum valueof the function, press Í .
The new viewing window is displayed.Both Xmax NXmin and Ymax NYmin havebeen adjusted by factors of 4, the defaultvalues for the zoom factors.

8/4/2019 Ti Plus Guidebook Part1 En
http://slidepdf.com/reader/full/ti-plus-guidebook-part1-en 62/198
56 Activities
Finding the Calculated MaximumYou can use a CALCULATE menu operation to calculate a local maximumof a function.
4. Press p to display the new windowsettings.
1. Press y / (above r ) to display theCALCULATE menu. Press 4 to select4:maximum .The graph is displayed again with aLeft Bound? prompt.
2. Press | to trace along the curve to a pointto the left of the maximum, and then pressÍ .
A 4 at the top of the screen indicates theselected bound.
A Right Bound? prompt is displayed.
3. Press ~ to trace along the curve to a pointto the right of the maximum, and thenpress Í .
A 3 at the top of the screen indicates the
selected bound.A Guess? prompt is displayed.
4. Press | to trace to a point near themaximum, and then press Í .

8/4/2019 Ti Plus Guidebook Part1 En
http://slidepdf.com/reader/full/ti-plus-guidebook-part1-en 63/198
Activities 57
Comparing Test Results Using Box Plots
ProblemAn experiment found a significant difference between boys and girlspertaining to their ability to identify objects held in their left hands, whichare controlled by the right side of their brains, versus their right hands,which are controlled by the left side of their brains. The TI Graphics teamconducted a similar test for adult men and women.
The test involved 30 small objects, which participants were not allowed tosee. First, they held 15 of the objects one by one in their left hands andguessed what they were. Then they held the other 15 objects one by onein their right hands and guessed what they were. Use box plots tocompare visually the correct-guess data from this table.
Or, press 3 Ë 8 , and then press Í toenter a guess for the maximum.
When you press a number key in TRACE,the X= prompt is displayed in the bottom-
left corner.Notice how the values for the calculatedmaximum compare with the maximumsfound with the free-moving cursor, thetrace cursor, and the table.
Note: In steps 2 and 3 above, you canenter values directly for Left Bound andRight Bound, in the same way as describedin step 4.
Correct GuessesWomen
LeftWomen
RightMenLeft
MenRight
8 4 7 12
9 1 8 6
12 8 7 12
11 12 5 1210 11 7 7
8 11 8 11
12 13 11 12

8/4/2019 Ti Plus Guidebook Part1 En
http://slidepdf.com/reader/full/ti-plus-guidebook-part1-en 64/198
58 Activities
Procedure1. Press … 5 to select 5:SetUpEditor . Enter list names WLEFT, WRGHT,
MLEFT, and MRGHT, separated by commas. Press Í . The stat listeditor now contains only these four lists.
2. Press … 1 to select 1:Edit .
3. Enter into WLEFT the number of correct guesses each woman madeusing her left hand ( Women Left ). Press ~ to move to WRGHT andenter the number of correct guesses each woman made using herright hand ( Women Right ).
4. Likewise, enter each man’s correct guesses in MLEFT (Men Left ) andMRGHT (Men Right ).
5. Press y , . Select 1:Plot1 . Turn on plot 1; define it as amodified box plot Õ that uses WLEFT. Move the cursor to the top lineand select Plot2 . Turn on plot 2; define it as a modified box plot thatuses WRGHT.
6. Press o . Turn off all functions.
7. Press p . Set Xscl=1 and Yscl=0 . Press q 9 to select9:ZoomStat . This adjusts the viewing window and displays the boxplots for the women’s results.
8. Press r .
7 12 4 8
9 11 10 12
11 12 14 11
13 9
5 9
Correct Guesses
WomenLeft
WomenRight
MenLeft
MenRight
Women’s left-hand data
Women’s right-hand data

8/4/2019 Ti Plus Guidebook Part1 En
http://slidepdf.com/reader/full/ti-plus-guidebook-part1-en 65/198
Activities 59
Use | and ~ to examine minX , Q1 , Med , Q3 , and maxX for eachplot. Notice the outlier to the women’s right-hand data. What is themedian for the left hand? For the right hand? With which hand werethe women more accurate guessers, according to the box plots?
9. Examine the men’s results. Redefine plot 1 to use MLEFT, redefineplot 2 to use MRGHT. Press r .
Press | and ~ to examine minX , Q1 , Med , Q3 , and maxX for eachplot. What difference do you see between the plots?
10. Compare the left-hand results. Redefine plot 1 to use WLEFT,redefine plot 2 to use MLEFT, and then press r to examine minX ,Q1 , Med , Q3 , and maxX for each plot. Who were the better left-hand guessers, men or women?
11. Compare the right-hand results. Define plot 1 to use WRGHT, define
plot 2 to useMRGHT
, and then pressr
to examineminX
,Q1
,Med , Q3 , and maxX for each plot. Who were the better right-handguessers?
In the original experiment boys did not guess as well with righthands, while girls guessed equally well with either hand. This is notwhat our box plots show for adults. Do you think that this is becauseadults have learned to adapt or because our sample was not largeenough?
Graphing Piecewise Functions
ProblemThe fine for speeding on a road with a speed limit of 45 kilometers perhour (kph) is 50; plus 5 for each kph from 46 to 55 kph; plus 10 for eachkph from 56 to 65 kph; plus 20 for each kph from 66 kph and above.Graph the piecewise function that describes the cost of the ticket.
The fine (Y) as a function of kilometers per hour (X) is:Y = 0Y = 50 + 5 (X N 45)Y = 50 + 5 …10 + 10 (X N 55)Y = 50 + 5 …10 + 10 …10 + 20 (X N 65)
0 < X 4545 < X 5555 < X 6565 < X
Men’s left-hand data
Men’s right-hand data

8/4/2019 Ti Plus Guidebook Part1 En
http://slidepdf.com/reader/full/ti-plus-guidebook-part1-en 66/198
60 Activities
Procedure1. Press z . Select Func and the default settings.
2. Press o . Turn off all functions and stat plots. Enter the Y= functionto describe the fine. Use the TEST menu operations to define the
piecewise function. Set the graph style for Y1 to í (dot).
3. Press p and set Xmin= L2 , Xscl=10 , Ymin= L5 , and Yscl=10 .Ignore Xmax and Ymax ; they are set by @X and @Y in step 4.
4. Press y 5 to return to the home screen. Store 1 to @X, and thenstore 5 to @Y. @X and @Y are on the VARS Window X/Y secondarymenu. @X and @Y specify the horizontal and vertical distancebetween the centers of adjacent pixels. Integer values for @X and @Y produce nice values for tracing.
5. Press r to plot the function. At what speed does the ticket
exceed 250?
Graphing InequalitiesProblemGraph the inequality 0.4x 3 N 3x + 5 < 0.2x + 4. Use the TEST menuoperations to explore the values of X where the inequality is true andwhere it is false.
Procedure
1. Press z . Select Dot , Simul , and the default settings. Setting Dotmode changes all graph style icons to í (dot) in the Y= editor.
2. Press o . Turn off all functions and stat plots. Enter the left side of theinequality as Y4 and the right side as Y5 .

8/4/2019 Ti Plus Guidebook Part1 En
http://slidepdf.com/reader/full/ti-plus-guidebook-part1-en 67/198
Activities 61
3. Enter the statement of the inequality as Y6 . This function evaluates
to 1 if true or 0 if false.
4. Press q 6 to graph the inequality in the standard window.
5. Press r † † to move to Y6 . Then press | and ~ to trace theinequality, observing the value of Y.
6. Press o . Turn off Y4 , Y5 , and Y6 . Enter equations to graph only the
inequality.
7. Press r . Notice that the values of Y7 and Y8 are zero where theinequality is false.

8/4/2019 Ti Plus Guidebook Part1 En
http://slidepdf.com/reader/full/ti-plus-guidebook-part1-en 68/198
62 Activities
Solving a System of Nonlinear Equations
ProblemUsing a graph, solve the equation x 3N2x=2cos(x). Stated another way,solve the system of two equations and two unknowns: y = x 3N2x and y =2cos(x). Use ZOOM factors to control the decimal places displayed on thegraph.
Procedure1. Press z . Select the default mode settings. Press o . Turn off all
functions and stat plots. Enter the functions.
2. Press q 4 to select 4:ZDecimal . The display shows that twosolutions may exist (points where the two functions appear tointersect).
3. Press q ~ 4 to select 4:SetFactors from the ZOOM MEMORY menu. Set XFact=10 and YFact=10 .
4. Press q 2 to select 2:Zoom In . Use | , ~ , } , and † to move thefree-moving cursor onto the apparent intersection of the functionson the right side of the display. As you move the cursor, notice thatthe X and Y values have one decimal place.
5. Press Í to zoom in. Move the cursor over the intersection. As youmove the cursor, notice that now the X and Y values have twodecimal places.
6. Press Í to zoom in again. Move the free-moving cursor onto apoint exactly on the intersection. Notice the number of decimalplaces.
7. Press y / 5 to select 5:intersect . Press Í to select the firstcurve and Í to select the second curve. To guess, move the tracecursor near the intersection. Press Í . What are the coordinates ofthe intersection point?
8. Press q 4 to select 4:ZDecimal to redisplay the original graph.

8/4/2019 Ti Plus Guidebook Part1 En
http://slidepdf.com/reader/full/ti-plus-guidebook-part1-en 69/198
Activities 63
9. Press q . Select 2:Zoom In and repeat steps 4 through 8 to explorethe apparent function intersection on the left side of the display.
Using a Program to Create the Sierpinski Triangle
Setting up the ProgramThis program creates a drawing of a famous fractal, the SierpinskiTriangle, and stores the drawing to a picture. To begin, press ~ ~ 1 . Name the program SIERPINS , and then press Í . The programeditor is displayed.
Program
PROGRAM:SIERPINS:FnOff :ClrDraw:PlotsOff:AxesOff
:0 ! Xmin:1 ! Xmax:0 ! Ymin:1 ! Ymax
Set viewing window.
:rand ! X:rand ! Y
:For(K,1,3000):rand ! N
Beginning of For group.
:If N 1 à 3:Then:.5X ! X:.5Y ! Y:End
If/Then group
:If 1 à 3<N and N 2 à 3:Then:.5(.5+X) ! X:.5(1+Y) ! Y:End
If/Then group.
:If 2 à 3<N:Then
:.5(1+X) ! X:.5Y ! Y:End
If/Then group.
8/4/2019 Ti Plus Guidebook Part1 En
http://slidepdf.com/reader/full/ti-plus-guidebook-part1-en 70/198
64 Activities
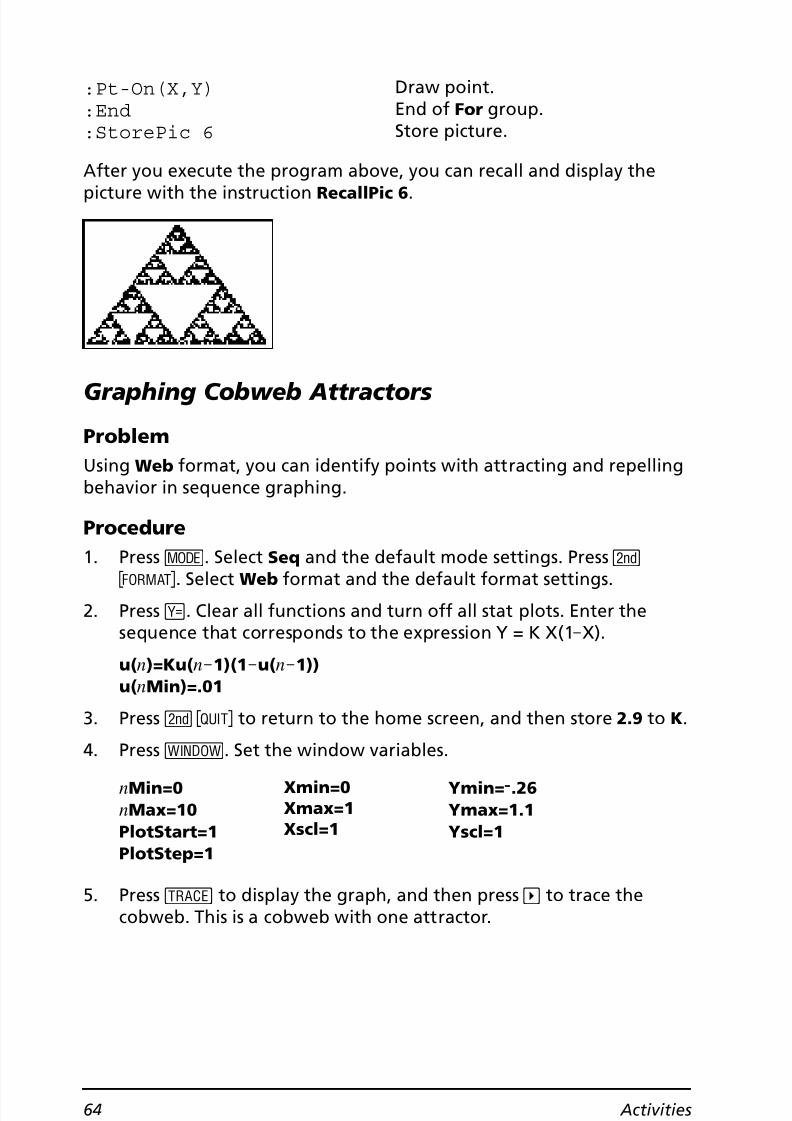
After you execute the program above, you can recall and display thepicture with the instruction RecallPic 6 .
Graphing Cobweb Attractors
ProblemUsing Web format, you can identify points with attracting and repellingbehavior in sequence graphing.
Procedure1. Press z . Select Seq and the default mode settings. Press y
. . Select Web format and the default format settings.
2. Press o . Clear all functions and turn off all stat plots. Enter thesequence that corresponds to the expression Y = K X(1 NX).
u( n)=Ku( nN1)(1 Nu( nN1))u( nMin)=.01
3. Press y 5 to return to the home screen, and then store 2.9 to K.
4. Pressp
. Set the window variables.
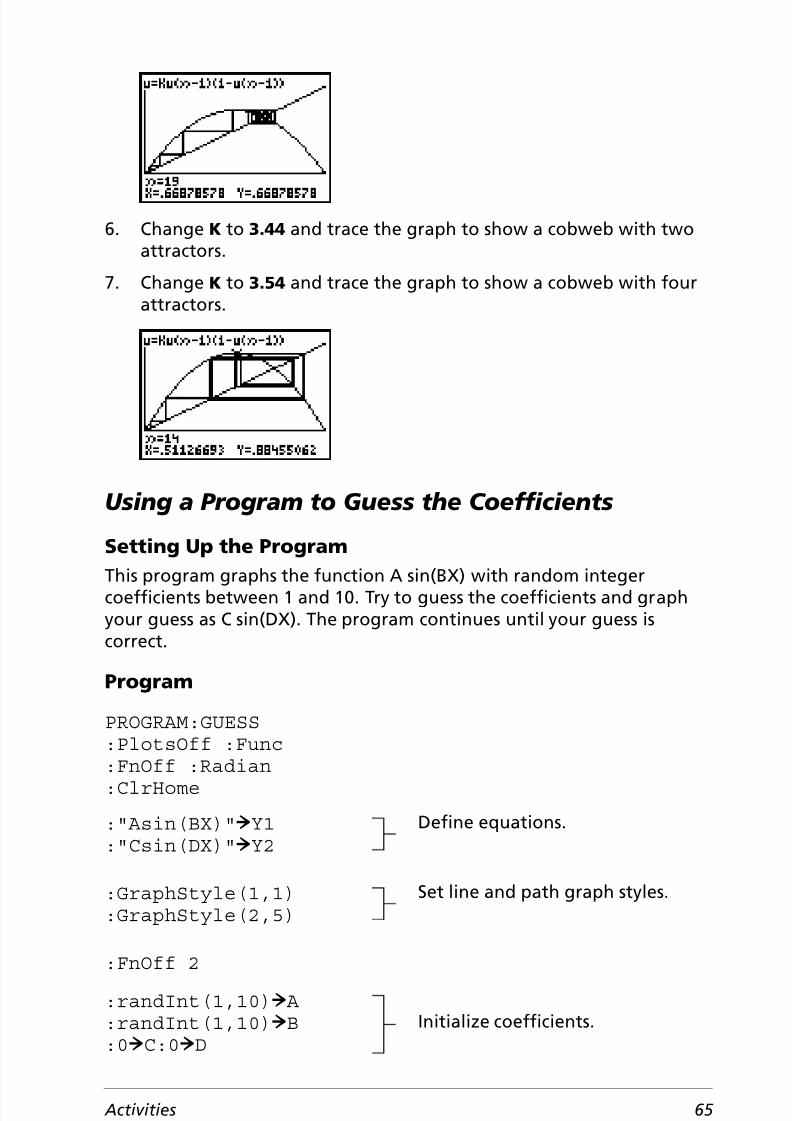
5. Press r to display the graph, and then press ~ to trace thecobweb. This is a cobweb with one attractor.
:Pt-On(X,Y):End:StorePic 6
Draw point.End of For group.Store picture.
nMin=0nMax=10PlotStart=1PlotStep=1
Xmin=0Xmax=1Xscl=1
Ymin= M.26Ymax=1.1Yscl=1
8/4/2019 Ti Plus Guidebook Part1 En
http://slidepdf.com/reader/full/ti-plus-guidebook-part1-en 71/198
Activities 65
6. Change K to 3.44 and trace the graph to show a cobweb with twoattractors.
7. Change K to 3.54 and trace the graph to show a cobweb with fourattractors.
Using a Program to Guess the Coefficients
Setting Up the ProgramThis program graphs the function A sin(BX) with random integercoefficients between 1 and 10. Try to guess the coefficients and graphyour guess as C sin(DX). The program continues until your guess iscorrect.
Program
PROGRAM:GUESS:PlotsOff :Func:FnOff :Radian:ClrHome
:"Asin(BX)" ! Y1:"Csin(DX)" ! Y2
Define equations.
:GraphStyle(1,1):GraphStyle(2,5)
Set line and path graph styles.
:FnOff 2
:randInt(1,10) ! A:randInt(1,10) ! B:0 ! C:0 ! D
Initialize coefficients.

8/4/2019 Ti Plus Guidebook Part1 En
http://slidepdf.com/reader/full/ti-plus-guidebook-part1-en 72/198
66 Activities
Graphing the Unit Circle and Trigonometric Curves
Problem
Using parametric graphing mode, graph the unit circle and the sine curveto show the relationship between them.
Any function that can be plotted in Func mode can be plotted in Par mode by defining the X component as T and the Y component as F(T) .
: L2 p! Xmin:2 p! Xmax: pà 2 ! Xscl: L10 ! Ymin:10 ! Ymax:1 ! Yscl
Set viewing window.
:DispGraph:Pause Display graph.
:FnOn 2:Lbl Z
:Prompt C,D Prompt for guess.
:DispGraph:Pause Display graph.
:If C=A:Text(1,1,"C IS OK"):If C ƒ A:Text(1,1,"C IS
WRONG"):If D=B:Text(1,50,"D IS OK"):If D ƒB:Text(1,50,"D ISWRONG")
Display results.
:DispGraph:Pause Display graph.
:If C=A and D=B:Stop:Goto Z
Quit if guesses are correct.

8/4/2019 Ti Plus Guidebook Part1 En
http://slidepdf.com/reader/full/ti-plus-guidebook-part1-en 73/198
Activities 67
Procedure1. Press z . Select Par , Simul , and the default settings.
2. Press p . Set the viewing window.
3. Press o . Turn off all functions and stat plots. Enter the expressionsto define the unit circle centered on (0,0).
4. Enter the expressions to define the sine curve.
5. Press r . As the graph is plotting, you may press Í to pauseand Í again to resume graphing as you watch the sine function“unwrap” from the unit circle.
Note: You can generalize the unwrapping. Replace sin(T) in Y2T withany other trig function to unwrap that function.
Finding the Area between Curves
ProblemFind the area of the region bounded by:
Tmin=0Tmax=2 pTstep=.1
Xmin= L2Xmax=7.4Xscl= pà 2
Ymin= L3Ymax=3Yscl=1
f(x)g(x)x
===
300x/(x2 + 625)3cos(.1x)75

8/4/2019 Ti Plus Guidebook Part1 En
http://slidepdf.com/reader/full/ti-plus-guidebook-part1-en 74/198
68 Activities
Procedure1. Press z . Select the default mode settings.
2. Press p . Set the viewing window.
3. Press o . Turn off all functions and stat plots. Enter the upper andlower functions.
Y1=300X à (X2+625)Y2=3cos(.1X)
4. Press y / 5 to select 5:Intersect . The graph is displayed. Select afirst curve, second curve, and guess for the intersection toward theleft side of the display. The solution is displayed, and the value of X at the intersection, which is the lower limit of the integral, is storedin Ans and X.
5. Press y 5 to go to the home screen. Press y < 7 and useShade( to see the area graphically.
Shade(Y2,Y1,Ans,75)
6. Press y 5 to return to the home screen. Enter the expression to
evaluate the integral for the shaded region.fnInt(Y1 NY2,X,Ans,75)
The area is 325.839962 .
Using Parametric Equations: Ferris Wheel Problem
Problem
Using two pairs of parametric equations, determine when two objects inmotion are closest to each other in the same plane.
Xmin=0Xmax=100Xscl=10
Ymin= L5Ymax=10Yscl=1
Xres=1

8/4/2019 Ti Plus Guidebook Part1 En
http://slidepdf.com/reader/full/ti-plus-guidebook-part1-en 75/198
Activities 69
A ferris wheel has a diameter (d) of 20 meters and is rotatingcounterclockwise at a rate (s) of one revolution every 12 seconds. Theparametric equations below describe the location of a ferris wheelpassenger at time T, where a is the angle of rotation, (0,0) is the bottomcenter of the ferris wheel, and (10,10) is the passenger’s location at the
rightmost point, when T=0.
A person standing on the ground throws a ball to the ferris wheelpassenger. The thrower’s arm is at the same height as the bottom of theferris wheel, but 25 meters (b) to the right of the ferris wheel’s lowestpoint (25,0). The person throws the ball with velocity (v 0) of 22 meters per
second at an angle ( q) of 66 ¡ from the horizontal. The parametricequations below describe the location of the ball at time T.
Procedure1. Press z . Select Par , Simul , and the default settings. Simul
(simultaneous) mode simulates the two objects in motion over time.
2. Press p . Set the viewing window.
3. Press o . Turn off all functions and stat plots. Enter the expressions todefine the path of the ferris wheel and the path of the ball. Set the
graph style for X2T to ë (path).
Note: Try setting the graph styles to ë X1T and ì X2T, whichsimulates a chair on the ferris wheel and the ball flying through theair when you press s .
X(T) = r cos aY(T) = r + r sin a
where a = 2pTs and r = d à 2
X(T) = b N Tv0 cosqY(T) = Tv0 sinq N (g à 2) T2 where g = 9.8 m/sec 2
Tmin=0Tmax=12Tstep=.1
Xmin= L13Xmax=34Xscl=10
Ymin=0Ymax=31Yscl=10

8/4/2019 Ti Plus Guidebook Part1 En
http://slidepdf.com/reader/full/ti-plus-guidebook-part1-en 76/198
70 Activities
4. Press s to graph the equations. Watch closely as they areplotted. Notice that the ball and the ferris wheel passenger appearto be closest where the paths cross in the top-right quadrant of theferris wheel.
5. Press p . Change the viewing window to concentrate on thisportion of the graph.
6. Press r . After the graph is plotted, press ~ to move near thepoint on the ferris wheel where the paths cross. Notice the values ofX, Y, and T.
7. Press † to move to the path of the ball. Notice the values of X and Y (T is unchanged). Notice where the cursor is located. This is theposition of the ball when the ferris wheel passenger passes theintersection. Did the ball or the passenger reach the intersectionfirst?
You can use r to, in effect, take snapshots in time and explorethe relative behavior of two objects in motion.
Tmin=1Tmax=3Tstep=.03
Xmin=0Xmax=23.5Xscl=10
Ymin=10Ymax=25.5Yscl=10

8/4/2019 Ti Plus Guidebook Part1 En
http://slidepdf.com/reader/full/ti-plus-guidebook-part1-en 77/198
Activities 71
Demonstrating the Fundamental Theorem of Calculus
Problem 1
Using the functions fnInt( and nDeriv( from the MATH menu to graphfunctions defined by integrals and derivatives demonstrates graphicallythat:
and that
Procedure 11. Press z . Select the default settings.
2. Press p . Set the viewing window.
3. Press o . Turn off all functions and stat plots. Enter the numericalintegral of 1 à T from 1 to X and the function ln(X). Set the graph stylefor Y1 to ç (line) and Y2 to ë (path).
4. Press r . Press | , } , ~ , and † to compare the values of Y1 andY2 .
5. Press o . Turn off Y1 and Y2 , and then enter the numerical derivativeof the integral of 1 à X and the function 1 à X. Set the graph style forY3 to ç (line) and Y4 to è (thick).
Xmin=.01Xmax=10Xscl=1
Ymin= L1.5Ymax=2.5Yscl=1
Xres=3
F x( ) t d 1
x
∫ x( ) x 0>,ln= =
Dx 1t --- t d
1
x
∫ 1 x---=
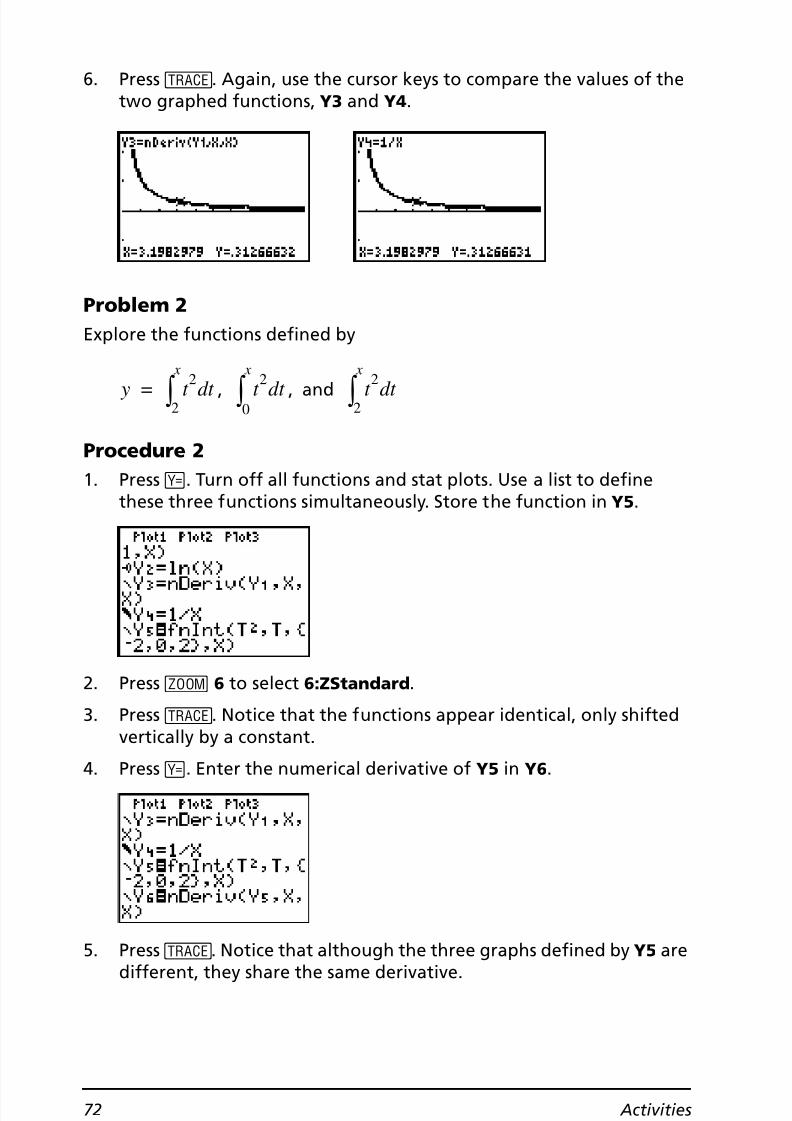
8/4/2019 Ti Plus Guidebook Part1 En
http://slidepdf.com/reader/full/ti-plus-guidebook-part1-en 78/198
72 Activities
6. Press r . Again, use the cursor keys to compare the values of thetwo graphed functions, Y3 and Y4 .
Problem 2Explore the functions defined by
, , and
Procedure 21. Press o . Turn off all functions and stat plots. Use a list to define
these three functions simultaneously. Store the function in Y5 .
2. Press q 6 to select 6:ZStandard .
3. Press r . Notice that the functions appear identical, only shiftedvertically by a constant.
4. Press o . Enter the numerical derivative of Y5 in Y6 .
5. Press r . Notice that although the three graphs defined by Y5 aredifferent, they share the same derivative.
y t 2 t d 2
x
∫ = t 2 t d 0
x
∫ t 2 t d 2
x
∫
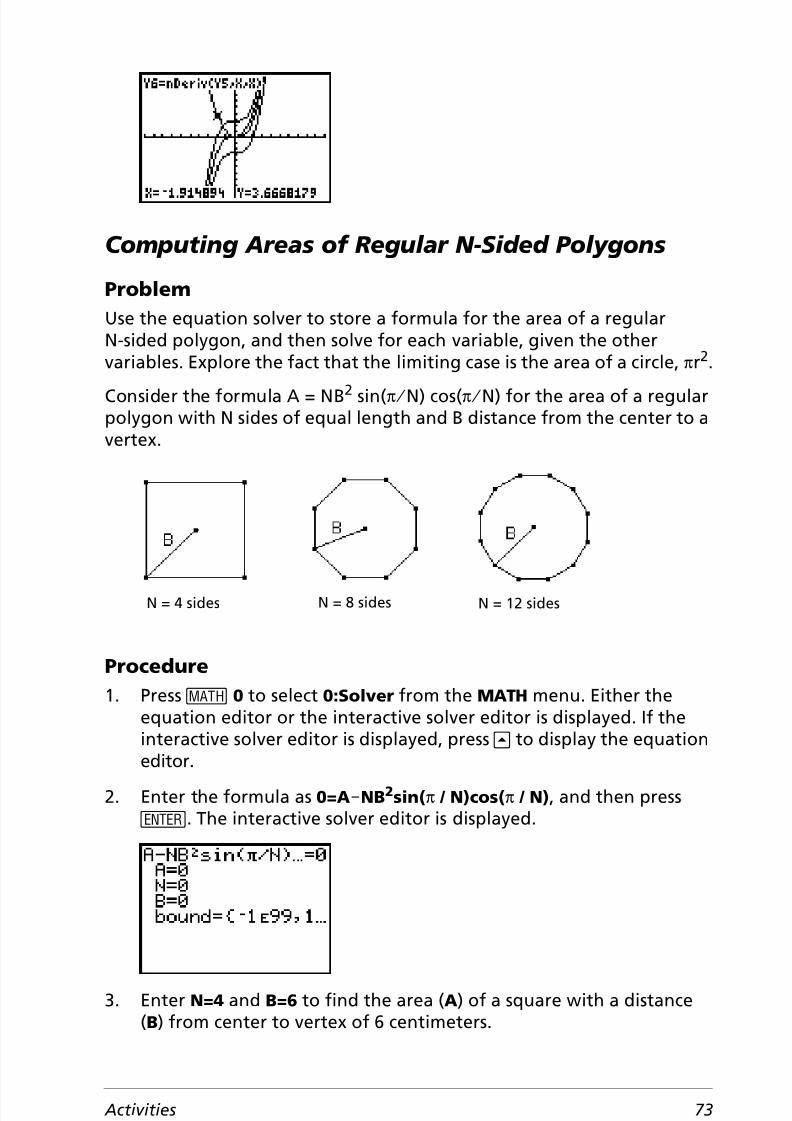
8/4/2019 Ti Plus Guidebook Part1 En
http://slidepdf.com/reader/full/ti-plus-guidebook-part1-en 79/198
Activities 73
Computing Areas of Regular N-Sided Polygons
ProblemUse the equation solver to store a formula for the area of a regularN-sided polygon, and then solve for each variable, given the othervariables. Explore the fact that the limiting case is the area of a circle, pr2.
Consider the formula A = NB 2 sin(pà N) cos(pà N) for the area of a regularpolygon with N sides of equal length and B distance from the center to avertex.
Procedure1. Press 0 to select 0:Solver from the MATH menu. Either the
equation editor or the interactive solver editor is displayed. If theinteractive solver editor is displayed, press } to display the equationeditor.
2. Enter the formula as 0=A NNB2sin( p / N)cos( p / N) , and then pressÍ . The interactive solver editor is displayed.
3. Enter N=4 and B=6 to find the area ( A) of a square with a distance(B) from center to vertex of 6 centimeters.
N = 4 sides N = 8 sides N = 12 sides
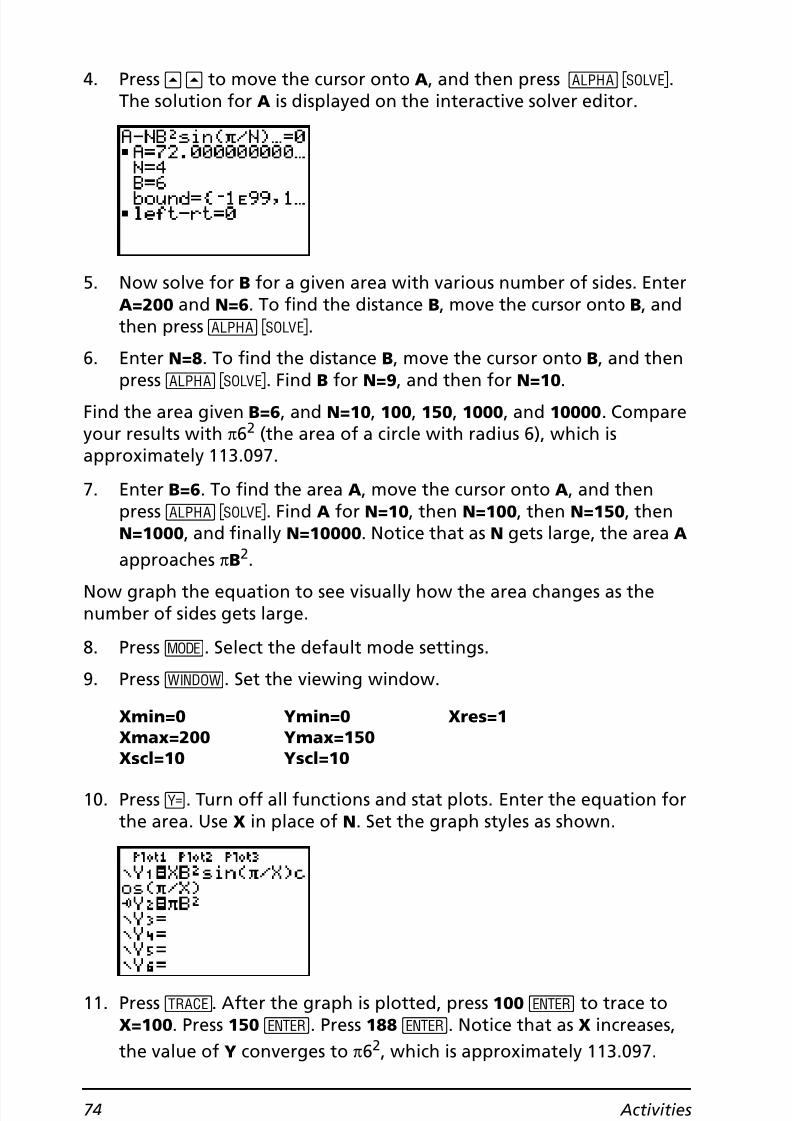
8/4/2019 Ti Plus Guidebook Part1 En
http://slidepdf.com/reader/full/ti-plus-guidebook-part1-en 80/198
74 Activities
4. Press } } to move the cursor onto A, and then press ă \ .The solution for A is displayed on the interactive solver editor.
5. Now solve for B for a given area with various number of sides. EnterA=200 and N=6 . To find the distance B, move the cursor onto B, andthen press ƒ \ .
6. Enter N=8 . To find the distance B, move the cursor onto B, and thenpress ƒ \ . Find B for N=9 , and then for N=10 .
Find the area given B=6 , and N=10 , 100 , 150 , 1000 , and 10000 . Compareyour results with p62 (the area of a circle with radius 6), which isapproximately 113.097.
7. Enter B=6 . To find the area A, move the cursor onto A, and thenpress ƒ \ . Find A for N=10 , then N=100 , then N=150 , thenN=1000 , and finally N=10000 . Notice that as N gets large, the area A
approachesp
B2
.Now graph the equation to see visually how the area changes as thenumber of sides gets large.
8. Press z . Select the default mode settings.
9. Press p . Set the viewing window.
10. Press o . Turn off all functions and stat plots. Enter the equation forthe area. Use X in place of N. Set the graph styles as shown.
11. Press r . After the graph is plotted, press 100 Í to trace toX=100 . Press 150 Í . Press 188 Í . Notice that as X increases,the value of Y converges to p62, which is approximately 113.097.
Xmin=0Xmax=200
Xscl=10
Ymin=0Ymax=150
Yscl=10
Xres=1

8/4/2019 Ti Plus Guidebook Part1 En
http://slidepdf.com/reader/full/ti-plus-guidebook-part1-en 81/198
Activities 75
Y2= pB2 (the area of the circle) is a horizontal asymptote to Y1 . Thearea of an N-sided regular polygon, with r as the distance from thecenter to a vertex, approaches the area of a circle with radius r ( pr2)as N gets large.
Computing and Graphing Mortgage PaymentsProblemYou are a loan officer at a mortgage company, and you recently closedon a 30-year home mortgage at 8 percent interest with monthlypayments of 800. The new home owners want to know how much will beapplied to the interest and how much will be applied to the principalwhen they make the 240th payment 20 years from now.
Procedure1. Press z and set the fixed-decimal mode to 2 decimal places. Set
the other mode settings to the defaults.
2. Press Œ Í Í to display the TVM Solver . Enter these values.
Note: Enter a positive number ( 800 ) to show PMT as a cash inflow.Payment values will be displayed as positive numbers on the graph.Enter 0 for FV, since the future value of a loan is 0 once it is paid infull. Enter PMT: END , since payment is due at the end of a period.
3. Move the cursor onto the PV= prompt, and then press ƒ \ .The present value, or mortgage amount, of the house is displayed atthe PV= prompt.

8/4/2019 Ti Plus Guidebook Part1 En
http://slidepdf.com/reader/full/ti-plus-guidebook-part1-en 82/198
76 Activities
Now compare the graph of the amount of interest with the graph of theamount of principal for each payment.
4. Press z . Set Par and Simul .
5. Press o . Turn off all functions and stat plots. Enter these equationsand set the graph styles as shown.
Note: GPrn( and GInt( are located on the FINANCE menu ( APPS1:FINANCE ).
6. Press p . Set these window variables.
Note: To increase the graph speed, change Tstep to 24 .
7. Press r . After the graph is drawn, press 240 Í to move thetrace cursor to T=240 , which is equivalent to 20 years of payments.
The graph shows that for the 240th payment ( X=240 ), 358.03 of the800 payment is applied to principal ( Y=358.03 ).
Note: The sum of the payments ( Y3T=Y1T+Y2T ) is always 800.
8. Press † to move the cursor onto the function for interest defined byX2T and Y2T. Enter 240 .
Tmin=1Tmax=360Tstep=12
Xmin=0Xmax=360Xscl=10
Ymin=0Ymax=1000Yscl=100

8/4/2019 Ti Plus Guidebook Part1 En
http://slidepdf.com/reader/full/ti-plus-guidebook-part1-en 83/198
Activities 77
The graph shows that for the 240th payment ( X=240 ), 441.97 of the800 payment is interest ( Y=441.97 ).
9. Press y 5 Œ Í 9 to paste 9:bal( to the home screen. Checkthe figures from the graph.
At which monthly payment will the principal allocation surpass theinterest allocation?

8/4/2019 Ti Plus Guidebook Part1 En
http://slidepdf.com/reader/full/ti-plus-guidebook-part1-en 84/198
78 Activities

8/4/2019 Ti Plus Guidebook Part1 En
http://slidepdf.com/reader/full/ti-plus-guidebook-part1-en 85/198
Memory and Variable Management 79
3
Memory and Variable ManagementChecking Available Memory
MEMORY MenuAt any time you can check available memory or manage existing memoryby selecting items from the MEMORY menu. To access this menu, pressy L .
To check memory usage, first press y L and then select2:Mem Mgmt/Del .
MEMORY1: About ... Displays information about the graphing
handheld.2: Mem Mgmt/Del ... Reports memory availability and variable usage.3: Clear Entries Clears ENTRY (last-entry storage).4: ClrAllLists Clears all lists in memory.5: Archive ... Archives a selected variable.6: UnArchive ... UnArchives a selected variable.7: Reset ... Displays the RAM , ARCHIVE , and ALL menus8: Group ... Displays GROUP and UNGROUP menus.
RAM FREE displays the amount of
available RAM.
ARC FREE displays the amount ofavailable Archive.
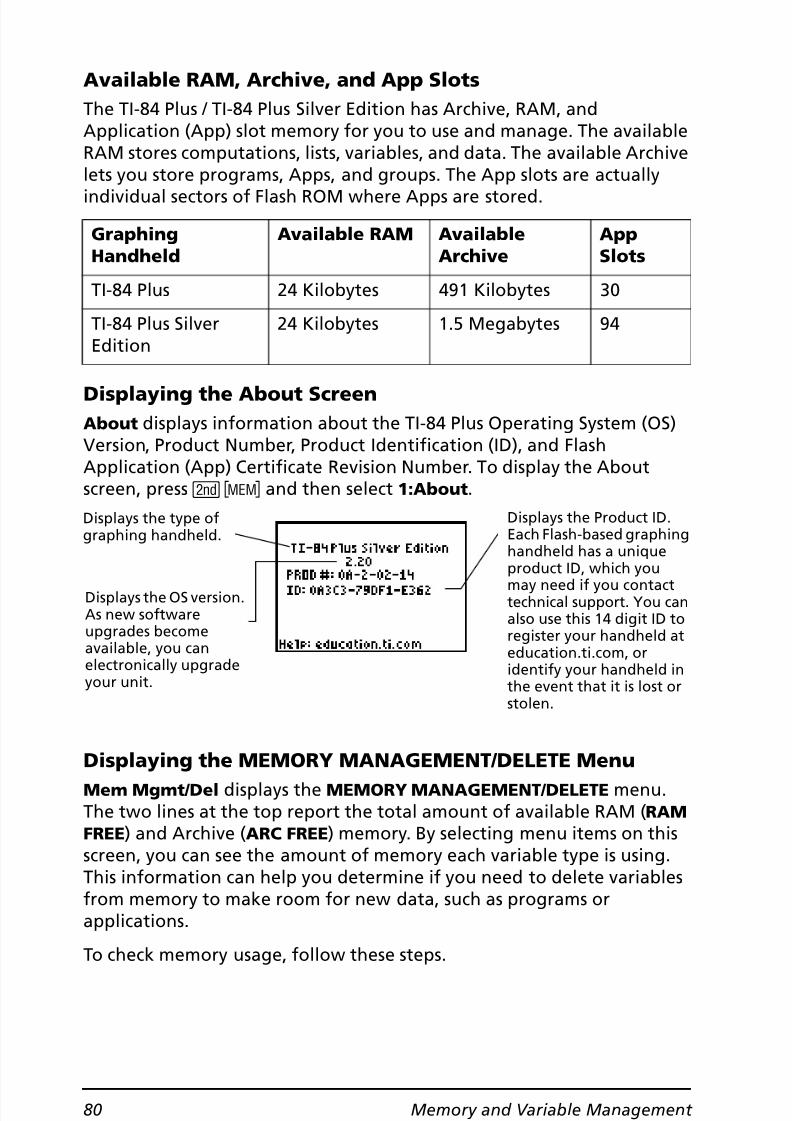
8/4/2019 Ti Plus Guidebook Part1 En
http://slidepdf.com/reader/full/ti-plus-guidebook-part1-en 86/198

8/4/2019 Ti Plus Guidebook Part1 En
http://slidepdf.com/reader/full/ti-plus-guidebook-part1-en 87/198
Memory and Variable Management 81
1. Press y L to display the MEMORY menu.
2. Select 2:Mem Mgmt/Del to display the MEMORY MANAGEMENT/ DELETE menu. The TI-84 Plus expresses memory quantities in bytes.
3. Select variable types from the list to display memory usage.
Notes: Real , List , Y-Vars , and Prgm variable types never reset tozero, even after memory is cleared.
Apps are independent applications which are stored in Flash ROM.AppVars is a variable holder used to store variables created byindependent applications. You cannot edit or change variables inAppVars unless you do so through the application which createdthem.
To leave the MEMORY MANAGEMENT/DELETE menu, press eithery 5 or ‘ . Both options display the home screen.
Deleting Items from Memory
Deleting an ItemTo increase available memory by deleting the contents of any variable(real or complex number, list, matrix, Y= variable, program, Apps,AppVars, picture, graph database, or string), follow these steps.
1. Press y L to display the MEMORY menu.
Note: The # and $ in the top or bottomof the left column indicate that you canscroll up or down to view more variable
types.

8/4/2019 Ti Plus Guidebook Part1 En
http://slidepdf.com/reader/full/ti-plus-guidebook-part1-en 88/198
82 Memory and Variable Management
2. Select 2:Mem Mgmt/Del to display the MEMORY MANAGEMENT/ DELETE menu.
3. Select the type of data you want to delete, or select 1:All for a list ofall variables of all types. A screen is displayed listing each variable ofthe type you selected and the number of bytes each variable is using.
For example, if you select 4:List , the LIST editor screen is displayed.
4. Press } and † to move the selection cursor ( 4) next to the item youwant to delete, and then press { . The variable is deleted frommemory. You can delete individual variables one by one from thisscreen.
Note: If you are deleting programs or Apps, you will receive amessage asking you to confirm this delete action. Select 2:Yes tocontinue.
To leave any variable screen without deleting anything, pressy 5 , which displays the home screen.
You cannot delete some system variables, such as the last-answervariable Ans and the statistical variable RegEQ .
Clearing Entries and List Elements
Clear EntriesClear Entries clears the contents of the ENTRY (last entry) storage area.To clear the ENTRY storage area, follow these steps.
1. Press y L to display the MEMORY menu.
2. Select 3:Clear Entries to paste the instruction to the home screen.
3. Press Í to clear the ENTRY storage area.
To cancel Clear Entries , press ‘ .
Note: If you select 3:Clear Entries from within a program, the ClearEntries instruction is pasted to the program editor, and the Entry (lastentry) is cleared when the program is executed.

8/4/2019 Ti Plus Guidebook Part1 En
http://slidepdf.com/reader/full/ti-plus-guidebook-part1-en 89/198
Memory and Variable Management 83
ClrAllListsClrAllLists sets the dimension of each list in RAM to 0 .
To clear all elements from all lists, follow these steps.
1. Press y L to display the MEMORY menu.
2. Select 4:ClrAllLists to paste the instruction to the home screen.
3. Press Í to set the dimension of each list in memory to 0 .
To cancel ClrAllLists , press ‘ .
ClrAllLists does not delete list names from memory, from the LISTNAMES menu, or from the stat list editor.
Note: If you select 4:ClrAllLists from within a program, the ClrAllLists instruction is pasted to the program editor. The lists are cleared when theprogram is executed.
Archiving and UnArchiving Variables
Archiving and UnArchiving VariablesArchiving lets you store data, programs, or other variables to the userdata archive where they cannot be edited or deleted inadvertently.Archiving also allows you to free up RAM for variables that may requireadditional memory.
Archived variables cannot be edited or executed. They can only be seenand unarchived. For example, if you archive list L1, you will see that L1 exists in memory but if you select it and paste the name L1 to the home
screen, you won’t be able to see its contents or edit it.Note: Not all variables may be archived. Not all archived variables maybe unarchived. For example, system variables including r, t, x, y, and q cannot be archived. Apps and Groups always exist in Flash ROM so thereis no need to archive them. Groups cannot be unarchived. However, youcan ungroup or delete them.
Variable Type NamesArchive?(yes/no)
UnArchive?(yes/no)
Real numbers A, B, ... , Z yes yes
Complexnumbers
A, B, ... , Z yes yes
Matrices [A], [B], [C], ... , [J] yes yes

8/4/2019 Ti Plus Guidebook Part1 En
http://slidepdf.com/reader/full/ti-plus-guidebook-part1-en 90/198
84 Memory and Variable Management
Lists L1, L2, L3, L4, L5, L6,and user-defined
names
yes yes
Programs yes yes
Functions Y1 , Y2 , . . . , Y9 , Y0 no notapplicable
Parametricequations
X1T and Y1T, ... , X6T and Y6T
no notapplicable
Polar functions r1 , r2 , r3 , r4 , r5 , r6 no notapplicable
Sequencefunctions
u , v, w no notapplicable
Stat plots Plot1, Plot2, Plot3 no notapplicable
Graphdatabases
GDB1, GDB2,... yes yes
Graph pictures Pic1 , Pic2 , ... , Pic9 ,Pic0
yes yes
Strings Str1 , Str2 , . . . Str9 ,Str0
yes yes
Tables TblStart , Tb1 , TblInput no notapplicable
Apps Applications see Noteabove
no
AppVars Application variables yes yes
Groups see Noteabove
no
Variables withreserved names
minX , maxX , RegEQ, and others
no notapplicable
System variables Xmin , Xmax , andothers
no notapplicable
Variable Type NamesArchive?(yes/no)
UnArchive?(yes/no)
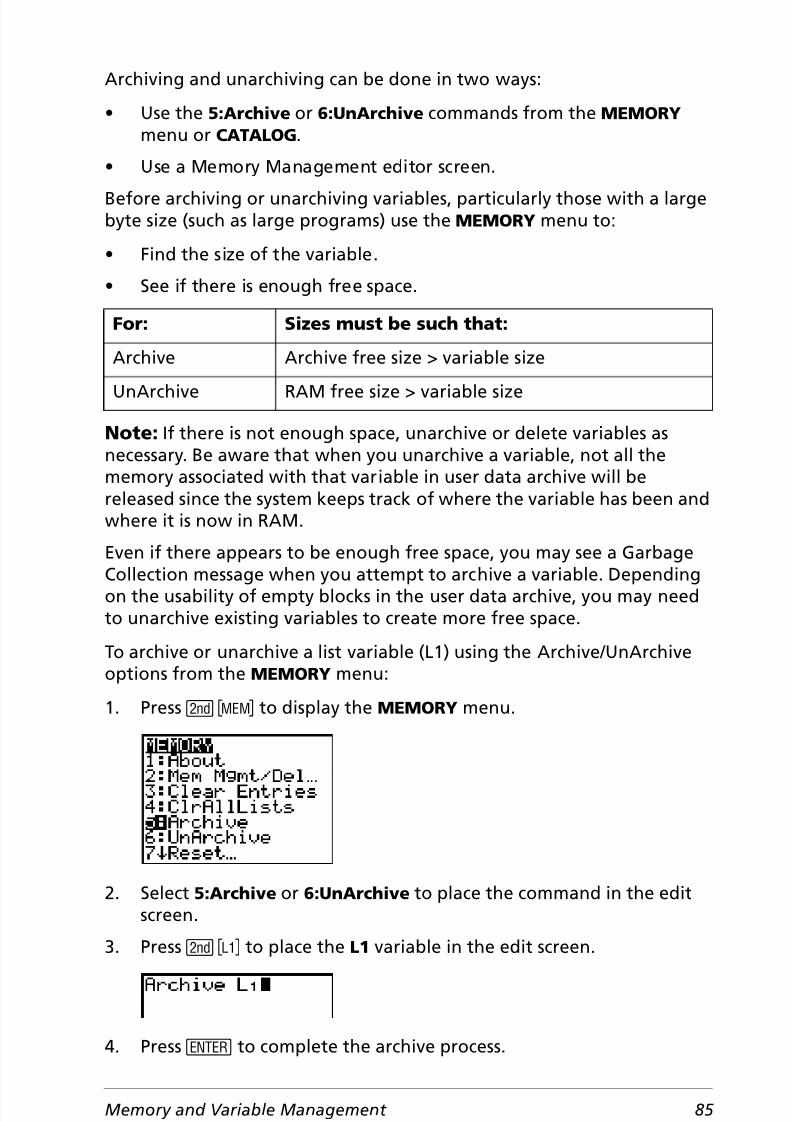
8/4/2019 Ti Plus Guidebook Part1 En
http://slidepdf.com/reader/full/ti-plus-guidebook-part1-en 91/198
Memory and Variable Management 85
Archiving and unarchiving can be done in two ways:
• Use the 5:Archive or 6:UnArchive commands from the MEMORY menu or CATALOG .
• Use a Memory Management editor screen.
Before archiving or unarchiving variables, particularly those with a largebyte size (such as large programs) use the MEMORY menu to:
• Find the size of the variable.
• See if there is enough free space.
Note: If there is not enough space, unarchive or delete variables asnecessary. Be aware that when you unarchive a variable, not all thememory associated with that variable in user data archive will bereleased since the system keeps track of where the variable has been andwhere it is now in RAM.
Even if there appears to be enough free space, you may see a GarbageCollection message when you attempt to archive a variable. Dependingon the usability of empty blocks in the user data archive, you may needto unarchive existing variables to create more free space.
To archive or unarchive a list variable (L1) using the Archive/UnArchiveoptions from the MEMORY menu:
1. Press y L to display the MEMORY menu.
2. Select 5:Archive or 6:UnArchive to place the command in the editscreen.
3. Press y d to place the L1 variable in the edit screen.
4. Press Í to complete the archive process.
For: Sizes must be such that:
Archive Archive free size > variable size
UnArchive RAM free size > variable size

8/4/2019 Ti Plus Guidebook Part1 En
http://slidepdf.com/reader/full/ti-plus-guidebook-part1-en 92/198
86 Memory and Variable Management
Note: An asterisk will be displayed to the left of the Archived variablename to indicate it is archived.
To archive or unarchive a list variable (L1) using a Memory Managementeditor:
1. Press y L to display the MEMORY menu.
2. Select 2:Mem Mgmt/Del to display the MEMORY MANAGEMENT/ DELETE menu.
3. Select 4:List to display the LIST menu.
4. Press Í to archive L1. An asterisk will appear to the left of L1 toindicate it is an archived variable. To unarchive a variable in thisscreen, put the cursor next to the archived variable and press Í .The asterisk will disappear.

8/4/2019 Ti Plus Guidebook Part1 En
http://slidepdf.com/reader/full/ti-plus-guidebook-part1-en 93/198
Memory and Variable Management 87
5. Press y 5 to leave the LIST menu.
Note: You can access an archived variable for the purpose of linking,deleting, or unarchiving it, but you cannot edit it.
Resetting the TI-84 PlusRAM ARCHIVE ALL MenuReset displays the RAM ARCHIVE ALL menu. This menu gives you theoption of resetting all memory (including default settings) or resettingselected portions of memory while preserving other data stored inmemory, such as programs and Y= functions. For instance, you canchoose to reset all of RAM or just restore the default settings. Be awarethat if you choose to reset RAM, all data and programs in RAM will beerased. For archive memory, you can reset variables (Vars), applications(Apps), or both of these. Be aware that if you choose to reset Vars, alldata and programs in archive memory will be erased. If you choose toreset Apps, all applications in archive memory will be erased.
When you reset defaults on the TI-84 Plus, all defaults in RAM arerestored to the factory settings. Stored data and programs are notchanged.
These are some examples of TI-84 Plus defaults that are restored byresetting the defaults.
• Mode settings such as Normal (notation); Func (graphing); Real (numbers); and Full (screen)
• Y= functions off
• Window variable values such as Xmin= L10 , Xmax=10 , Xscl=1 , Yscl=1 ,and Xres=1
• Stat plots off• Format settings such as CoordOn (graphing coordinates on);
AxesOn ; and ExprOn (expression on)
• rand seed value to 0
Displaying the RAM ARCHIVE ALL MenuTo display the RAM ARCHIVE ALL menu on the TI-84 Plus, follow thesesteps.
1. Press y L to display the MEMORY menu.
2. Select 7:Reset to display the RAM ARCHIVE ALL menu.

8/4/2019 Ti Plus Guidebook Part1 En
http://slidepdf.com/reader/full/ti-plus-guidebook-part1-en 94/198
88 Memory and Variable Management
Resetting RAM Memory
Resetting all RAM restores RAM system variables to factory settings anddeletes all nonsystem variables and all programs. Resetting RAM defaultsrestores all system variables to default settings without deleting variablesand programs in RAM. Resetting all RAM or resetting defaults does notaffect variables and applications in user data archive.
Note: Before you reset all RAM memory, consider restoring sufficientavailable memory by deleting only selected data.
To reset allRAM
memory orRAM
defaults on the TI-84 Plus, follow thesesteps.
1. From the RAM ARCHIVE ALL menu, select 1:All RAM to display theRESET RAM menu or 2:Defaults to display the RESET DEFAULTSmenu .
2. If you are resetting RAM, read the message below the RESET RAM menu.
• To cancel the reset and return to the home screen, press Í .
• To erase RAM memory or reset defaults, select 2:Reset .Depending on your choice, the message RAM cleared orDefaults set is displayed on the home screen.
Resetting Archive MemoryWhen resetting archive memory on the TI-84 Plus, you can choose todelete from user data archive all variables, all applications, or bothvariables and applications.
To reset all or part of user data archive memory, follow these steps.1. From the RAM ARCHIVE ALL menu, press ~ to display the ARCHIVE
menu.
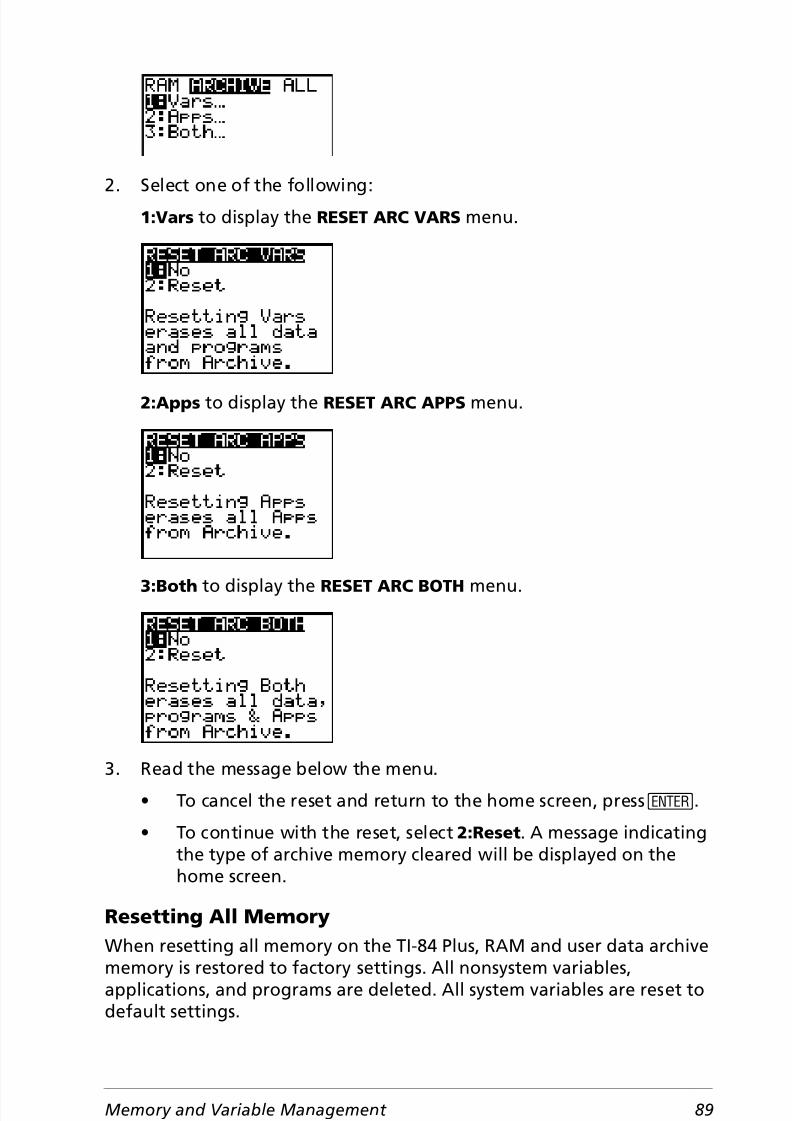
8/4/2019 Ti Plus Guidebook Part1 En
http://slidepdf.com/reader/full/ti-plus-guidebook-part1-en 95/198
Memory and Variable Management 89
2. Select one of the following:1:Vars to display the RESET ARC VARS menu.
2:Apps to display the RESET ARC APPS menu.
3:Both to display the RESET ARC BOTH menu.
3. Read the message below the menu.
• To cancel the reset and return to the home screen, press Í .
• To continue with the reset, select 2:Reset . A message indicatingthe type of archive memory cleared will be displayed on thehome screen.
Resetting All Memory
When resetting all memory on the TI-84 Plus, RAM and user data archivememory is restored to factory settings. All nonsystem variables,applications, and programs are deleted. All system variables are reset todefault settings.

8/4/2019 Ti Plus Guidebook Part1 En
http://slidepdf.com/reader/full/ti-plus-guidebook-part1-en 96/198
90 Memory and Variable Management
Before you reset all memory, consider restoring sufficient availablememory by deleting only selected data.
To reset all memory on the TI-84 Plus, follow these steps.
1. From the RAM ARCHIVE ALL menu, press ~ ~ to display the ALL
menu.
2. Select 1:All Memory to display the RESET MEMORY menu.
3. Read the message below the RESET MEMORY menu.
• To cancel the reset and return to the home screen, press Í .
• To continue with the reset, select 2:Reset . The message
MEM cleared is displayed on the home screen.When you clear memory, the contrast sometimes changes. If the screen isfaded or blank, adjust the contrast by pressing y } or † .
Grouping and Ungrouping Variables
Grouping VariablesGrouping allows you to make a copy of two or more variables residing in
RAM and then store them as a group in user data archive. The variablesin RAM are not erased. The variables must exist in RAM before they canbe grouped. In other words, archived data cannot be included in a group.
To create a group of variables:
1. Press y L to display the MEMORY menu.
2. Select 8:Group to display GROUP UNGROUP menu.

8/4/2019 Ti Plus Guidebook Part1 En
http://slidepdf.com/reader/full/ti-plus-guidebook-part1-en 97/198
Memory and Variable Management 91
3. Press Í to display the GROUP menu.
4. Enter a name for the new group and press Í .
Note: A group name can be one to eight characters long. The firstcharacter must be a letter from A to Z or q. The second througheighth characters can be letters, numbers, or q.
5. Select the type of data you want to group. You can select 1:All+ which shows all variables of all types available and selected. You canalso select 1:All- which shows all variables of all types available butnot selected. A screen is displayed listing each variable of the typeyou selected.
For example, suppose some variables have been created in RAM, andselecting 1:All- displays the following screen.
6. Press } and † to move the selection cursor ( 4) next to the first itemyou want to copy into a group, and then press Í . A small squarewill remain to the left of all variables selected for grouping.

8/4/2019 Ti Plus Guidebook Part1 En
http://slidepdf.com/reader/full/ti-plus-guidebook-part1-en 98/198
92 Memory and Variable Management
Repeat the selection process until all variables for the new group areselected and then press ~ to display the DONE menu.
7. Press Í to complete the grouping process.
Note: You can only group variables in RAM. You cannot group somesystem variables, such as the last-answer variable Ans and the statistical
variableRegEQ
.Ungrouping VariablesUngrouping allows you to make a copy of variables in a group stored inuser data archive and place them ungrouped in RAM .
DuplicateName MenuDuring the ungrouping action, if a duplicate variable name is detected inRAM , the DUPLICATE NAME menu is displayed.
Notes about Menu Items:• When you select 1:Rename , the Name= prompt is displayed, and
alpha-lock is on. Enter a new variable name, and then press Í .Ungrouping resumes.
DuplicateName1: Rename Prompts to rename receiving variable.2: Overwrite Overwrites data in receiving duplicate variable.3: Overwrite All Overwrites data in all receiving duplicate
variables.4: Omit Skips transmission of sending variable.5: Quit Stops transmission at duplicate variable.

8/4/2019 Ti Plus Guidebook Part1 En
http://slidepdf.com/reader/full/ti-plus-guidebook-part1-en 99/198
Memory and Variable Management 93
• When you select 2:Overwrite , the unit overwrites the data of theduplicate variable name found in RAM. Ungrouping resumes.
• When you select 3: Overwrite All , the unit overwrites the data of allduplicate variable names found in RAM. Ungrouping resumes.
• When you select 4:Omit , the unit does not ungroup the variable inconflict with the duplicated variable name found in RAM.Ungrouping resumes with the next item.
• When you select 5:Quit , ungrouping stops, and no further changesare made.
To ungroup a group of variables:
1. Press y L to display the MEMORY menu.
2. Select 8:Group to display the GROUP UNGROUP menu.
3. Press ~ to display the UNGROUP menu.
4. Press } and † to move the selection cursor ( 4) next to the groupvariable you want to ungroup, and then press Í .
The ungroup action is completed.
Note: Ungrouping does not remove the group from user data archive.You must delete the group in user data archive to remove it.
Garbage CollectionGarbage Collection MessageIf you use the user data archive extensively, you may see a GarbageCollect? message. This occurs if you try to archive a variable when thereis not enough free contiguous archive memory.

8/4/2019 Ti Plus Guidebook Part1 En
http://slidepdf.com/reader/full/ti-plus-guidebook-part1-en 100/198
94 Memory and Variable Management
The Garbage Collect? message lets you know an archive will take longerthan usual. It also alerts you that the archive will fail if there is notenough memory. The message can also alert you when a program iscaught in a loop that repetitively fills the user data archive. Select No tocancel the garbage collection process, and then find and correct the
errors in your program.The TI-84 Plus will attempt to rearrange the archived variables to makeadditional room.
Responding to the Garbage Collection Message
If you select 2:Yes , the process message Garbage Collecting... orDefragmenting... will be displayed.
Note: The process message Defragmenting... is displayed whenever an
application marked for deletion is encountered. Garbage collection maytake up to 20 minutes, depending on how much of archive memory hasbeen used to store variables.
After garbage collection, depending on how much additional space isfreed, the variable may or may not be archived. If not, you can unarchivesome variables and try again.
Why Is Garbage Collection Necessary?
The user data archive is divided into sectors. When you first beginarchiving, variables are stored consecutively in sector 1. This continues tothe end of the sector.
An archived variable is stored in a continuous block within a single sector.Unlike an application stored in user data archive, an archived variablecannot cross a sector boundary. If there is not enough space left in thesector, the next variable is stored at the beginning of the next sector.Typically, this leaves an empty block at the end of the previous sector.
• To cancel, select 1:No .
• If you choose 1:No , the message
ERR:ARCHIVE FULL will be displayed.• To continue archiving, select 2:Yes .

8/4/2019 Ti Plus Guidebook Part1 En
http://slidepdf.com/reader/full/ti-plus-guidebook-part1-en 101/198
Memory and Variable Management 95
Each variable that you archive is stored in the first empty block largeenough to hold it.
This process continues to the end of the last sector. Depending on thesize of individual variables, the empty blocks may account for asignificant amount of space. Garbage collection occurs when the variableyou are archiving is larger than any empty block.
How Unarchiving a Variable Affects the Process
When you unarchive a variable, it is copied to RAM but it is not actuallydeleted from user data archive memory. Unarchived variables are“marked for deletion,” meaning they will be deleted during the nextgarbage collection.
If the MEMORY Screen Shows Enough Free SpaceEven if the MEMORY screen shows enough free space to archive avariable or store an application, you may still get a Garbage Collect? message or an ERR: ARCHIVE FULL message.
variable B
variable C
variable A
variable D
Depending on its size,variable D is stored in oneof these locations.
Sector 1
Sector 3
Sector 2
Emptyblock
variable A
variable D
After you unarchivevariables B and C, theycontinue to take upspace.
Sector 1
Sector 2
Sector 3

8/4/2019 Ti Plus Guidebook Part1 En
http://slidepdf.com/reader/full/ti-plus-guidebook-part1-en 102/198
96 Memory and Variable Management
When you unarchive a variable, the Archive free amount increasesimmediately, but the space is not actually available until after the nextgarbage collection.
If the Archive free amount shows enough available space for yourvariable, there probably will be enough space to archive it after garbagecollection (depending on the usability of any empty blocks).
The Garbage Collection ProcessThe garbage collection process:
Note: Power loss during garbage collection may cause all memory (RAMand Archive) to be deleted.
Using the GarbageCollect CommandYou can reduce the number of automatic garbage collections byperiodically optimizing memory. This is done by using theGarbageCollect command.
To use the GarbageCollect command, follow these steps.
1. Press y N to display the CATALOG .
2. Press † or } to scroll the CATALOG until the selection cursor pointsto the GarbageCollect command.
3. Press Í to paste the command to the current screen.4. Press Í to display the Garbage Collect? message.
5. Select 2:Yes to begin garbage collection.
• Deletes unarchived variablesfrom the user data archive.
• Rearranges the remainingvariables into consecutive blocks.
variable A
variable D
Sector 1
Sector 2

8/4/2019 Ti Plus Guidebook Part1 En
http://slidepdf.com/reader/full/ti-plus-guidebook-part1-en 103/198
Memory and Variable Management 97
ERR:ARCHIVE FULL Message
An ERR:ARCHIVE FULL message may be displayed:
• When there is insufficient space to archive a variable within acontinuous block and within a single sector.
• When there is insufficient space to store an application within acontinuous block of memory.
When the message is displayed, it will indicate the largest single space ofmemory available for storing a variable and an application.
To resolve the problem, use the GarbageCollect command to optimizememory. If memory is still insufficient, you must delete variables orapplications to increase space.
Even if the MEMORY screen shows enough freespace to archive a variable or store anapplication, you may still get an ERR: ARCHIVE
FULL message.
8/4/2019 Ti Plus Guidebook Part1 En
http://slidepdf.com/reader/full/ti-plus-guidebook-part1-en 104/198
98 Memory and Variable Management

8/4/2019 Ti Plus Guidebook Part1 En
http://slidepdf.com/reader/full/ti-plus-guidebook-part1-en 105/198
Communication Link 99
4
Communication LinkGetting Started: Sending VariablesGetting Started is a fast-paced introduction. Read the chapter for details.
Create and store a variable and a matrix, and then transfer them toanother TI-84 Plus.
1. On the home screen of the sending unit,press 5 Ë 5 ¿ ƒ Q. Press Í tostore 5.5 to Q.
2. Press y H y H 1 ¢ 2 y I y H 3 ¢ 4 y I y I ¿ y > 1 . PressÍ to store the matrix to [A].
3. On the sending unit, press y L todisplay the MEMORY menu.
4. On the sending unit, press 2 to select2:Mem Mgmt/Del . The MEMORYMANAGEMENT menu is displayed.
5. On the sending unit, press 5 to select5:Matrix . The MATRIX editor screen isdisplayed.
6. On the sending unit, press Í to archive[A]. An asterisk ( ä ) will appear, signifyingthat [A] is now archived.

8/4/2019 Ti Plus Guidebook Part1 En
http://slidepdf.com/reader/full/ti-plus-guidebook-part1-en 106/198
100 Communication Link
TI-84 Plus LINK This chapter describes how to communicate with compatible TI units. TheTI-84 Plus has a USB port to connect and communicate with another TI-84Plus or TI-84 Plus Silver Edition. A USB unit-to-unit cable is included withthe TI-84 Plus.
The TI-84 Plus also has an I/O port using a I/O unit-to-unit cable tocommunicate with:
7. Connect the graphing handhelds with theUSB unit-to-unit cable. Push both ends infirmly.
8. On the receiving unit, press y 8 ~ to
display the RECEIVE menu. Press 1 to select1:Receive . The message Waiting ... isdisplayed and the busy indicator is on.
9. On the sending unit, press y 8 todisplay the SEND menu.
10. Press 2 to select 2:All N. The All N SELECT screen is displayed.
11. Press † until the selection cursor ( 4 ) isnext to [A] MATRX . Press Í .
12. Press † until the selection cursor is next toQ REAL . Press Í . A square dot next to[A] and Q indicates that each is selected tosend.
13. On the sending unit, press ~ to display theTRANSMIT menu.
14. On the sending unit, press 1 to select1:Transmit and begin transmission. Thereceiving unit displays the messageReceiving... .When the items aretransmitted, both units display the name
and type of each transmitted variable.
• TI-83 Plus Silver Edition• TI-83 Plus• TI-83
• TI-82• TI-73• CBL 2™ or a CBR™

8/4/2019 Ti Plus Guidebook Part1 En
http://slidepdf.com/reader/full/ti-plus-guidebook-part1-en 107/198
Communication Link 101
Connecting Two Graphing Handhelds with a USB Unit-to-Unit Cable or an I/O Unit-to-Unit Cable
USB Unit-to-Unit Cable
I/O Unit-to-Unit Cable
TI-84 Plus to a TI-83 Plus using I/O Unit-to-Unit Cable
Linking to the CBL/CBR SystemThe CBL 2™ and the CBR™ are optional accessories that also connect to a
TI-84 Plus with the I/O unit-to-unit cable. With a CBL 2 or CBR and a TI-84Plus, you can collect and analyze real-world data.
The TI-84 Plus USB link port is located at the topright edge of the graphing handheld.
1. Firmly insert either end of the USBunit-to-unit cable into the USB port.
2. Insert the other end of the cable into theother graphing handheld’s USB port.
The TI-84 Plus I/O link port is located at the topleft edge of the graphing handheld.
1. Firmly insert either end of the I/Ounit-to-unit cable into the port.
2. Insert the other end of the cable into theother graphing handheld’s I/O port.
The TI-84 Plus I/O link port is located at the topleft edge of the graphing handheld. The TI-83Plus I/O link port is located at the bottom edgeof the graphing handheld.
1. Firmly insert either end of the I/Ounit-to-unit cable into the port.
2. Insert the other end of the cable into theother graphing handheld’s I/O port.
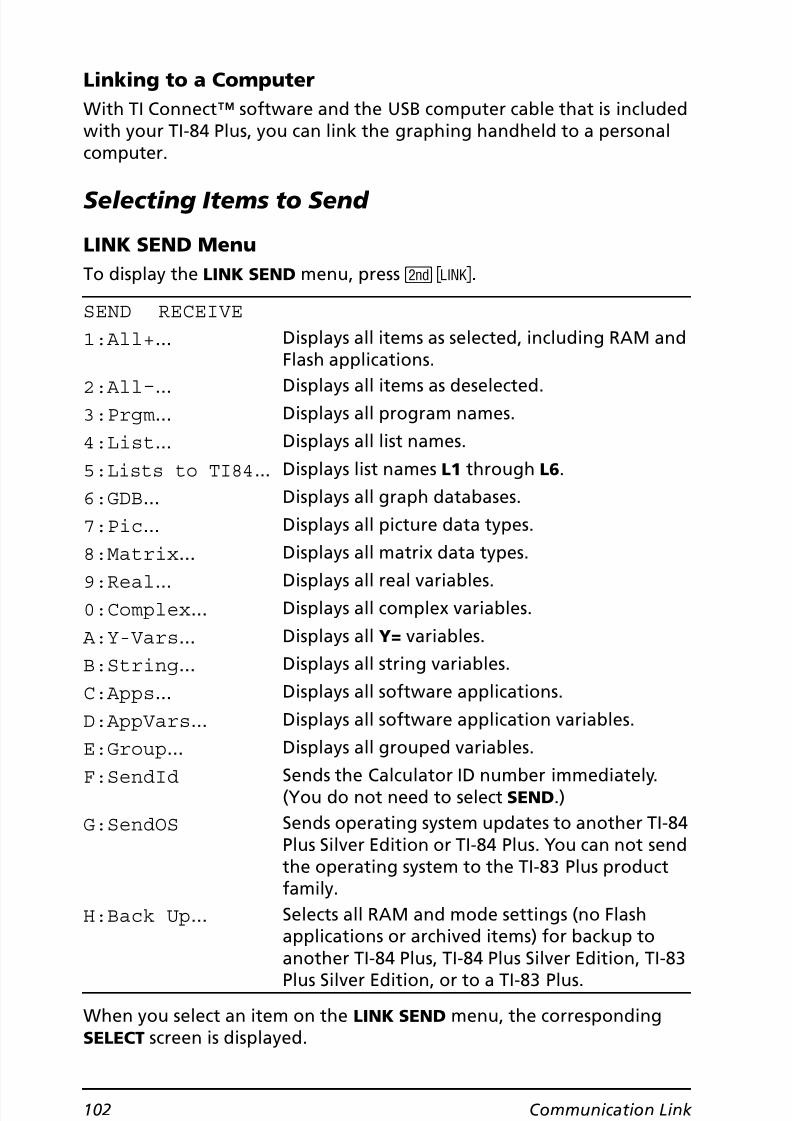
8/4/2019 Ti Plus Guidebook Part1 En
http://slidepdf.com/reader/full/ti-plus-guidebook-part1-en 108/198
102 Communication Link
Linking to a ComputerWith TI Connect™ software and the USB computer cable that is includedwith your TI-84 Plus, you can link the graphing handheld to a personalcomputer.
Selecting Items to Send
LINK SEND MenuTo display the LINK SEND menu, press y 8 .
When you select an item on the LINK SEND menu, the correspondingSELECT screen is displayed.
SEND RECEIVE1:All+ ... Displays all items as selected, including RAM and
Flash applications.2:All N... Displays all items as deselected.3:Prgm ... Displays all program names.4:List ... Displays all list names.5: Lists to TI84 ... Displays list names L1 through L6.6:GDB ... Displays all graph databases.7:Pic ... Displays all picture data types.8:Matrix ... Displays all matrix data types.9:Real ... Displays all real variables.0:Complex ... Displays all complex variables.
A:Y-Vars ... Displays all Y= variables.B:String ... Displays all string variables.C:Apps ... Displays all software applications.D:AppVars ... Displays all software application variables.E:Group ... Displays all grouped variables.F:SendId Sends the Calculator ID number immediately.
(You do not need to select SEND .)G:SendOS Sends operating system updates to another TI-84
Plus Silver Edition or TI-84 Plus. You can not sendthe operating system to the TI-83 Plus productfamily.
H:Back Up ... Selects all RAM and mode settings (no Flashapplications or archived items) for backup toanother TI-84 Plus, TI-84 Plus Silver Edition, TI-83Plus Silver Edition, or to a TI-83 Plus.
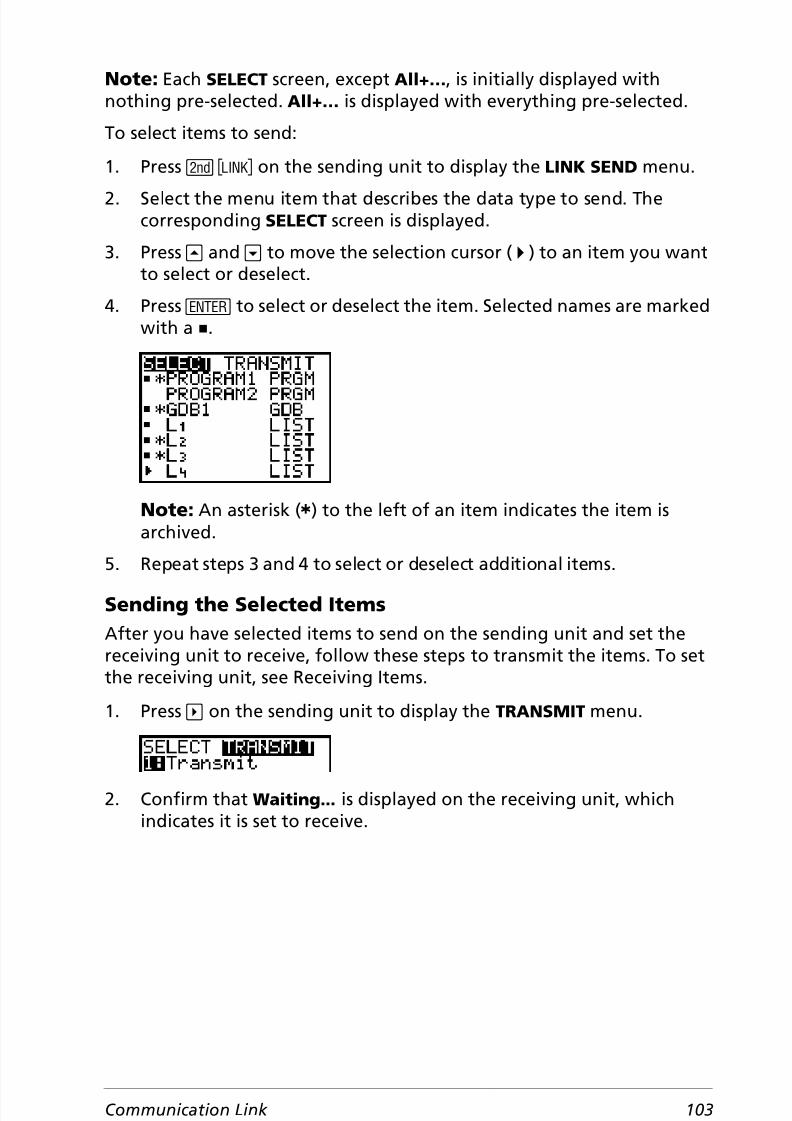
8/4/2019 Ti Plus Guidebook Part1 En
http://slidepdf.com/reader/full/ti-plus-guidebook-part1-en 109/198
Communication Link 103
Note: Each SELECT screen, except All+… , is initially displayed withnothing pre-selected. All+… is displayed with everything pre-selected.
To select items to send:
1. Press y 8 on the sending unit to display the LINK SEND menu.
2. Select the menu item that describes the data type to send. Thecorresponding SELECT screen is displayed.
3. Press } and † to move the selection cursor ( 4 ) to an item you wantto select or deselect.
4. Press Í to select or deselect the item. Selected names are markedwith a 0.
Note: An asterisk ( ä ) to the left of an item indicates the item isarchived.
5. Repeat steps 3 and 4 to select or deselect additional items.Sending the Selected ItemsAfter you have selected items to send on the sending unit and set thereceiving unit to receive, follow these steps to transmit the items. To setthe receiving unit, see Receiving Items.
1. Press ~ on the sending unit to display the TRANSMIT menu.
2. Confirm that Waiting... is displayed on the receiving unit, whichindicates it is set to receive.

8/4/2019 Ti Plus Guidebook Part1 En
http://slidepdf.com/reader/full/ti-plus-guidebook-part1-en 110/198
104 Communication Link
3. Press Í to select 1:Transmit . The name and type of each item aredisplayed line-by-line on the sending unit as the item is queued fortransmission, and then on the receiving unit as each item is accepted.
Note: Items sent from the RAM of the sending unit are transmittedto the RAM of the receiving unit. Items sent from user data archive(flash) of the sending unit are transmitted to user data archive (flash)of the receiving unit.
After all selected items have been transmitted, the message Done isdisplayed on both calculators. Press } and † to scroll through thenames.
Sending to a TI-84 Plus Silver Edition or TI-84 PlusYou can transfer variables (all types), programs, and Flash applications toanother TI-84 Plus Silver Edition or TI-84 Plus. You can also backup theRAM memory of one unit to another.
Note: Keep in mind that the TI-84 Plus has less Flash memory than theTI-84 Plus Silver Edition.
• Variables stored in RAM on the sending TI-84 Plus Silver Edition willbe sent to the RAM of the receiving TI-84 Plus Silver Edition or TI-84Plus.
• Variables and applications stored in the user data archive of thesending TI-84 Plus Silver Edition will be sent to the user data archiveof the receiving TI-84 Plus Silver Edition or TI-84 Plus.
After sending or receiving data, you can repeat the same transmission toadditional TI-84 Plus Silver Edition or TI-84 Plus units—from either thesending unit or the receiving unit—without having to reselect data tosend. The current items remain selected. However, you cannot repeattransmission if you selected All+ or All . .
To send data to an additional TI-84 Plus Silver Edition or a TI-84 Plus:
1. Use a USB unit-to-unit cable to link two units together.2. On the sending unit press y 8 and select a data type and items
to SEND .
3. Press ~ on the sending unit to display the TRANSMIT menu.
8/4/2019 Ti Plus Guidebook Part1 En
http://slidepdf.com/reader/full/ti-plus-guidebook-part1-en 111/198
Communication Link 105
4. On the other unit, press y 8 ~ to display the RECEIVE menu.
5. Press Í on the receiving unit.
6. Press Í on the sending unit. A copy of the selected item(s) is sentto the receiving unit.
7. Disconnect the link cable only from the receiving unit and connect itto another unit.
8. Press y 8 on the sending unit.
9. Select only the data type. For example, if the unit just sent a list,select 4:LIST.
Note: The item(s) you want to send are pre-selected from the lasttransmission. Do not select or deselect any items. If you select ordeselect an item, all selections or deselections from the lasttransmission are cleared.
10. Press ~ on the sending unit to display the TRANSMIT menu.
11. On the new receiving unit, press y 8 ~ to display the RECEIVE menu.
12. Press Í on the receiving unit.
13. Press Í on the sending unit. A copy of the selected item(s) is sentto the receiving unit.
14. Repeat steps 7 through 13 until the items are sent to all additionalunits.
Sending to a TI-83 Plus or TI-83 Plus Silver EditionYou can send all variables from a TI-84 Plus to a TI-83 Plus or TI-83 PlusSilver Edition except Flash applications with new features, or programswith new features in them.
If archived variables on the TI-84 Plus are variable types recognized andused on the TI-83 Plus or TI-83 Plus Silver Edition, you can send thesevariables to the TI-83 Plus or TI-83 Plus Silver Edition. They will beautomatically sent to the RAM of the TI-83 Plus or TI-83 Plus Silver Editionduring the transfer process. It will send to archive if the item is fromarchive.
To send data to a TI-83 Plus or TI-83 Plus Silver Edition:
1. Use an I/O unit-to-unit cable to link the two units together.2. Set the TI-83 Plus or TI-83 Plus Silver Edition to receive.
3. Press y 8 on the sending TI-84 Plus to display the LINK SEND menu.

8/4/2019 Ti Plus Guidebook Part1 En
http://slidepdf.com/reader/full/ti-plus-guidebook-part1-en 112/198
106 Communication Link
4. Select the menu of the items you want to transmit.
5. Press ~ on the sending TI-84 Plus to display the LINK TRANSMIT menu.
6. Confirm that the receiving unit is set to receive.
7. Press Í on the sending TI-84 Plus to select 1:Transmit and begintransmitting.
Receiving Items
LINK RECEIVE MenuTo display the LINK RECEIVE menu, press y 8 ~ .
Receiving UnitWhen you select 1:Receive from the LINK RECEIVE menu on thereceiving unit, the message Waiting... and the busy indicator aredisplayed. The receiving unit is ready to receive transmitted items. To exitthe receive mode without receiving items, press É , and then select
1:Quit from the Error in Xmit menu.When transmission is complete, the unit exits the receive mode. You canselect 1:Receive again to receive more items. The receiving unit thendisplays a list of items received. Press y 5 to exit the receive mode.
DuplicateName MenuDuring transmission, if a variable name is duplicated, theDuplicateName menu is displayed on the receiving unit.
When you select 1:Rename , the Name= prompt is displayed, and alpha-
lock is on. Enter a new variable name, and then press Í . Transmissionresumes.
When you select 2:Overwrite , the sending unit’s data overwrites theexisting data stored on the receiving unit. Transmission resumes.
SEND RECEIVE1:Receive Sets unit to receive data transmission.
DuplicateName1: Rename Prompts to rename receiving variable.2: Overwrite Overwrites data in receiving variable.3: Omit Skips transmission of sending variable.4: Quit Stops transmission at duplicate variable.

8/4/2019 Ti Plus Guidebook Part1 En
http://slidepdf.com/reader/full/ti-plus-guidebook-part1-en 113/198
Communication Link 107
When you select 3:Omit , the sending unit does not send the data in theduplicated variable name. Transmission resumes with the next item.
When you select 4:Quit , transmission stops, and the receiving unit exitsreceive mode.
Receiving from a TI-84 Plus Silver Edition or TI-84 PlusThe TI-84 Plus Silver Edition and the TI-84 Plus are totally compatible.Keep in mind, however that the TI-84 Plus has less Flash memory than aTI-84 Plus Silver Edition.
Receiving from a TI-83 Plus Silver Edition or TI-83 PlusThe TI-84 Plus product family and the TI-83 Plus product family are totallycompatible.
Receiving from a TI-83You can transfer all variables and programs from a TI-83 to a TI-84 Plus ifthey fit in the RAM of the TI-84 Plus. The RAM of the TI-84 Plus is slightlyless than the RAM of the TI-83.
Backing Up RAM Memory
Warning: H:Back Up overwrites the RAM memory and mode settings inthe receiving unit. All information in the RAM memory of the receivingunit is lost.
Note: Archived items on the receiving unit are not overwritten.
You can backup the contents of RAM memory and mode settings (noFlash applications or archived items) to another TI-84 Plus Silver Edition.You can also backup RAM memory and mode settings to a TI-84 Plus.
To perform a RAM memory backup:
1. Use a USB unit-to-unit cable to link two TI-84 Plus units, or a TI-84Plus and a TI-84 Plus Silver Edition together.
2. On the sending unit press y 8 and select H:Back Up . TheMEMORYBACKUP screen displays.
3. On the receiving unit, press y 8 ~ to display the RECEIVE menu.
4. Press Í on the receiving unit.
5. Press Í on the sending unit. A WARNING — Backup messagedisplays on the receiving unit.

8/4/2019 Ti Plus Guidebook Part1 En
http://slidepdf.com/reader/full/ti-plus-guidebook-part1-en 114/198
108 Communication Link
6. Press Í on the receiving unit to continue the backup.— or —Press 2:Quit on the receiving unit to cancel the backup and return tothe LINK SEND menu
Note: If a transmission error is returned during a backup, thereceiving unit is reset.
Memory Backup CompleteWhen the backup is complete, both the sending graphing handheld andreceiving graphing handheld display a confirmation screen.
Error Conditions• A transmission error occurs after one or two seconds if:
• A cable is not attached to the sending unit.
• A cable is not attached to the receiving unit.
Note: If the cable is attached, push it in firmly and try again.
• The receiving unit is not set to receive transmission.• You attempt a backup between a TI-73, TI-82, TI-83, TI-83 Plus, TI-83
Plus Silver Edition
• You attempt a data transfer from a TI-84 Plus to a TI-83 Plus, TI-83Plus Silver Edition, TI-83, TI-82, or TI-73 with variables or features notrecognized by the TI-83 Plus, TI-83 Plus Silver Edition, TI-83, TI-82, orTI-73.
New variable types and features not recognized by the TI-83, TI-83Plus, TI-82, or TI-73 include applications, application variables,grouped variables, new variable types, or programs with newfeatures in them such as Archive , UnArchive , SendID , SendOS ,Asm( , AsmComp( , AsmPrgm , checkTmr( , ClockOff , ClockOn ,dayOfWk( , getDate , getDtFmt , getDtStr( , getTime , getTmFmt ,getTmStr , isClockOn , setDate( , setDtFmt( , setTime( , setTmFmt( ,startTmr , and timeCnv .
• You attempt a data transfer from a TI-84 Plus to a TI-82 with data
other than real lists L1 through L6 or without using menu item 5:Lists to TI82 .
• You attempt a data transfer from a TI-84 Plus to a TI-73 with dataother than real numbers, pics, real lists L1 through L6 or named listswith q as part of the name.

8/4/2019 Ti Plus Guidebook Part1 En
http://slidepdf.com/reader/full/ti-plus-guidebook-part1-en 115/198
Communication Link 109
• Although a transmission error does not occur, these two conditionsmay prevent successful transmission.
• You try to use Get( with a graphing handheld instead of a CBL 2™ orCBR™.
• You try to use GetCalc( with a TI-83 instead of a TI-84 Plus or TI-84Plus Silver Edition.
Insufficient Memory in Receiving Unit• During transmission, if the receiving unit does not have sufficient
memory to receive an item, the Memory Full menu is displayed onthe receiving unit.
• To skip this item for the current transmission, select 1:Omit .
Transmission resumes with the next item.• To cancel the transmission and exit receive mode, select 2:Quit .

8/4/2019 Ti Plus Guidebook Part1 En
http://slidepdf.com/reader/full/ti-plus-guidebook-part1-en 116/198
110 Communication Link
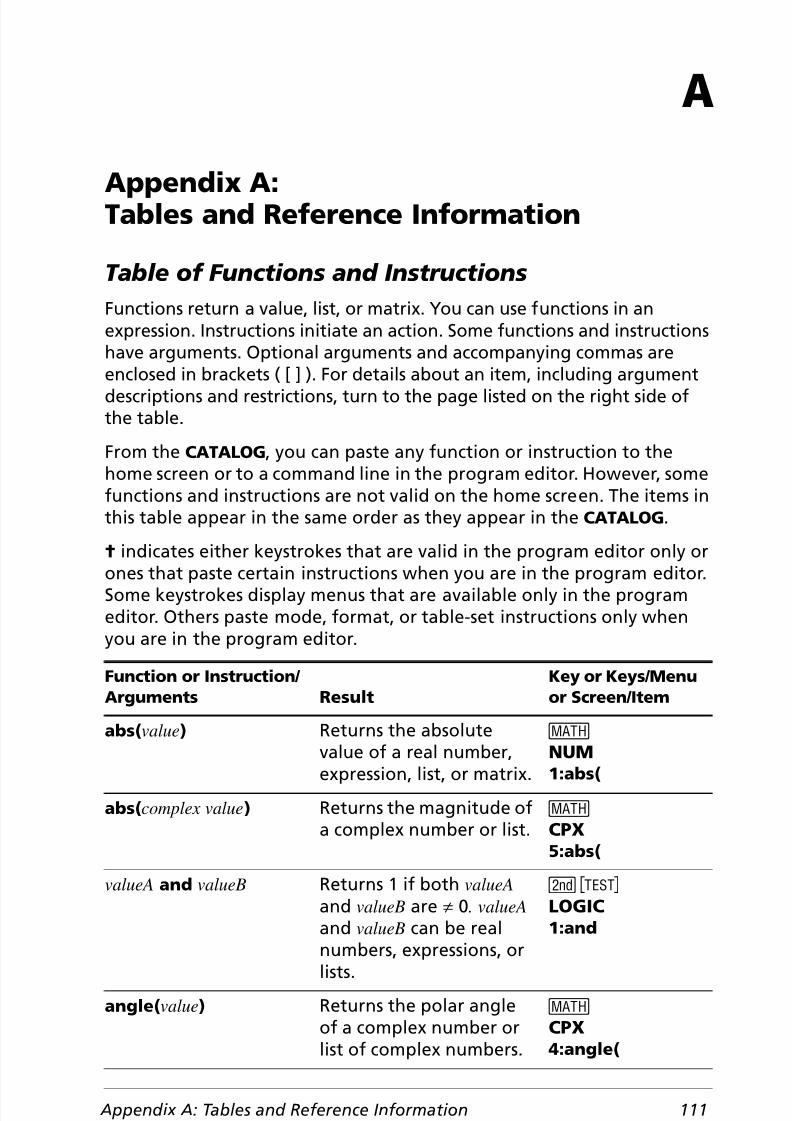
8/4/2019 Ti Plus Guidebook Part1 En
http://slidepdf.com/reader/full/ti-plus-guidebook-part1-en 117/198
Appendix A: Tables and Reference Information 111
A
Appendix A:Tables and Reference Information
Table of Functions and Instructions
Functions return a value, list, or matrix. You can use functions in anexpression. Instructions initiate an action. Some functions and instructionshave arguments. Optional arguments and accompanying commas are
enclosed in brackets ( [ ] ). For details about an item, including argumentdescriptions and restrictions, turn to the page listed on the right side ofthe table.
From the CATALOG , you can paste any function or instruction to thehome screen or to a command line in the program editor. However, somefunctions and instructions are not valid on the home screen. The items inthis table appear in the same order as they appear in the CATALOG .
† indicates either keystrokes that are valid in the program editor only orones that paste certain instructions when you are in the program editor.Some keystrokes display menus that are available only in the programeditor. Others paste mode, format, or table-set instructions only whenyou are in the program editor.
Function or Instruction/ Arguments Result
Key or Keys/Menuor Screen/Item
abs( value ) Returns the absolute
value of a real number,expression, list, or matrix. NUM1:abs(
abs( complex value ) Returns the magnitude ofa complex number or list. CPX
5:abs(
valueA and valueB Returns 1 if both valueA and valueB are ƒ 0. valueA and valueB can be real
numbers, expressions, orlists.
y :LOGIC 1:and
angle( value ) Returns the polar angleof a complex number orlist of complex numbers.
CPX4:angle(

8/4/2019 Ti Plus Guidebook Part1 En
http://slidepdf.com/reader/full/ti-plus-guidebook-part1-en 118/198
112 Appendix A: Tables and Reference Information
ANOVA( list1 ,list2[,list3 ,...,list20 ])
Performs a one-wayanalysis of variance for
comparing the means oftwo to 20 populations.
…TESTS
F:ANOVA(
Ans Returns the last answer. y Z
Archive Moves the specifiedvariables from RAM tothe user data archivememory.
y L5:Archive
Asm( assemblyprgmname ) Executes an assemblylanguage program. y NAsm(
AsmComp( prgmASM1, prgmASM2 )
Compiles an assemblylanguage programwritten in ASCII andstores the hex version.
y NAsmComp(
AsmPrgm Must be used as the firstline of an assemblylanguage program.
y NAsmPrgm
augment( matrixA ,matrixB )
Returns a matrix, which ismatrixB appended tomatrixA as new columns.
y >MATH 7:augment(
augment( listA ,listB ) Returns a list, which islistB concatenated to theend of listA .
y 9OPS 9:augment(
AxesOff Turns off the graph axes. † y . AxesOff
AxesOn Turns on the graph axes. † y . AxesOn
a+b i Sets the mode torectangular complexnumber mode (a+b i).
† za+b i
Function or Instruction/ Arguments Result
Key or Keys/Menuor Screen/Item
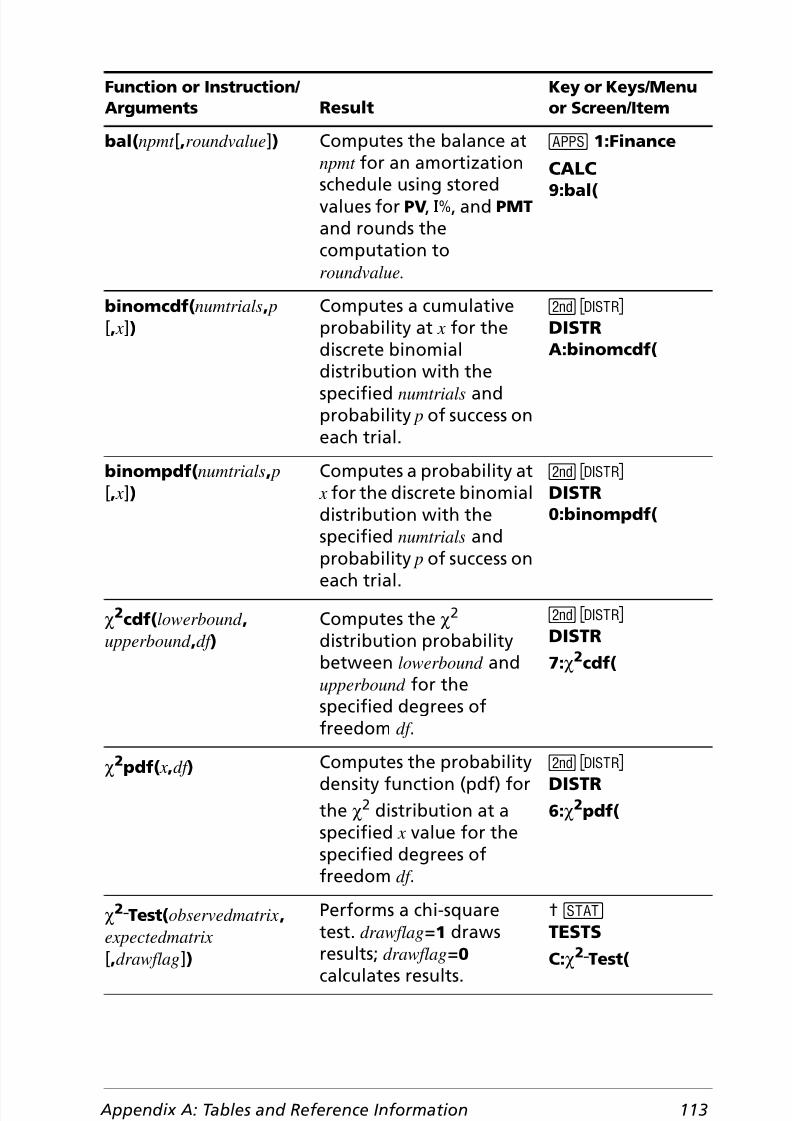
8/4/2019 Ti Plus Guidebook Part1 En
http://slidepdf.com/reader/full/ti-plus-guidebook-part1-en 119/198
Appendix A: Tables and Reference Information 113
bal( npmt [,roundvalue ]) Computes the balance atnpmt for an amortization
schedule using storedvalues for PV, æ , and PMT and rounds thecomputation toroundvalue.
Π1:Finance
CALC9:bal(
binomcdf( numtrials , p[, x])
Computes a cumulativeprobability at x for thediscrete binomial
distribution with thespecified numtrials andprobability p of success oneach trial.
y =DISTRA:binomcdf(
binompdf( numtrials , p[, x])
Computes a probability at x for the discrete binomialdistribution with thespecified numtrials andprobability p of success oneach trial.
y =DISTR0:binompdf(
c2cdf( lowerbound ,upperbound ,df )
Computes the c2
distribution probabilitybetween lowerbound and upperbound for thespecified degrees offreedom df .
y =DISTR7: c2cdf(
c2pdf( x,df ) Computes the probabilitydensity function (pdf) forthe c2 distribution at aspecified x value for thespecified degrees offreedom df .
y =DISTR6: c2pdf(
c2LTest( observedmatrix ,expectedmatrix[,drawflag ])
Performs a chi-squaretest. drawflag =1 drawsresults; drawflag =0 calculates results.
† …TESTSC:c2LTest(
Function or Instruction/ Arguments Result
Key or Keys/Menuor Screen/Item

8/4/2019 Ti Plus Guidebook Part1 En
http://slidepdf.com/reader/full/ti-plus-guidebook-part1-en 120/198
114 Appendix A: Tables and Reference Information
checkTmr( starttime ) Returns the number ofseconds since you used
startTmr to start thetimer. The starttime is thevalue displayed bystartTmr .
y NcheckTmr(
Circle( X ,Y ,radius ) Draws a circle with center( X ,Y ) and radius .
y <DRAW9:Circle(
Clear Entries Clears the contents of theLast Entry storage area.
y LMEMORY 3:Clear Entries
ClockOff Turns off the clock displayin the mode screen.
y NClockOff
ClockOn Turns on the clock displayin the mode screen.
y NClockOn
ClrAllLists Sets to 0 the dimension ofall lists in memory.
y L
MEMORY 4:ClrAllLists
ClrDraw Clears all drawn elementsfrom a graph or drawing.
y <DRAW1:ClrDraw
ClrHome Clears the home screen. †I/O8:ClrHome
ClrList listname1[,listname2 , ...,listname n ]
Sets to 0 the dimension ofone or more listnames .
…EDIT4:ClrList
ClrTable Clears all values from thetable.
†I/O9:ClrTable
conj( value ) Returns the complexconjugate of a complexnumber or list of complexnumbers.
CPX1:conj(
Function or Instruction/ Arguments Result
Key or Keys/Menuor Screen/Item
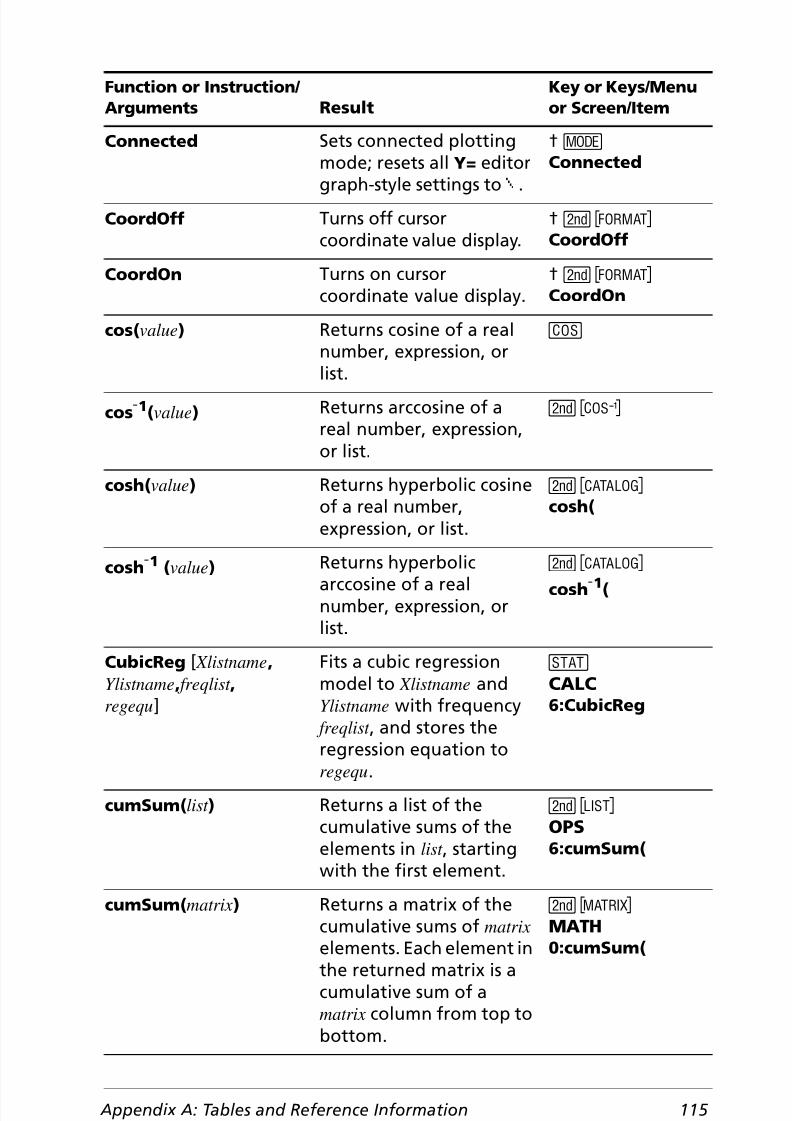
8/4/2019 Ti Plus Guidebook Part1 En
http://slidepdf.com/reader/full/ti-plus-guidebook-part1-en 121/198
Appendix A: Tables and Reference Information 115
Connected Sets connected plottingmode; resets all Y= editor
graph-style settings to ç .
† zConnected
CoordOff Turns off cursorcoordinate value display.
† y .CoordOff
CoordOn Turns on cursorcoordinate value display.
† y .CoordOn
cos( value ) Returns cosine of a realnumber, expression, or
list.
™
cos L1 (value ) Returns arccosine of areal number, expression,or list.
y @
cosh( value ) Returns hyperbolic cosineof a real number,expression, or list.
y N cosh(
cosh L1
(value ) Returns hyperbolicarccosine of a realnumber, expression, orlist.
y Ncosh L1 (
CubicReg [ Xlistname ,Ylistname , freqlist ,regequ ]
Fits a cubic regressionmodel to Xlistname andYlistname with frequency
freqlist , and stores the
regression equation toregequ .
…CALC6:CubicReg
cumSum( list ) Returns a list of thecumulative sums of theelements in list , startingwith the first element.
y 9OPS 6:cumSum(
cumSum( matrix ) Returns a matrix of thecumulative sums of matrix
elements. Each element inthe returned matrix is acumulative sum of amatrix column from top tobottom.
y >MATH
0:cumSum(
Function or Instruction/ Arguments Result
Key or Keys/Menuor Screen/Item
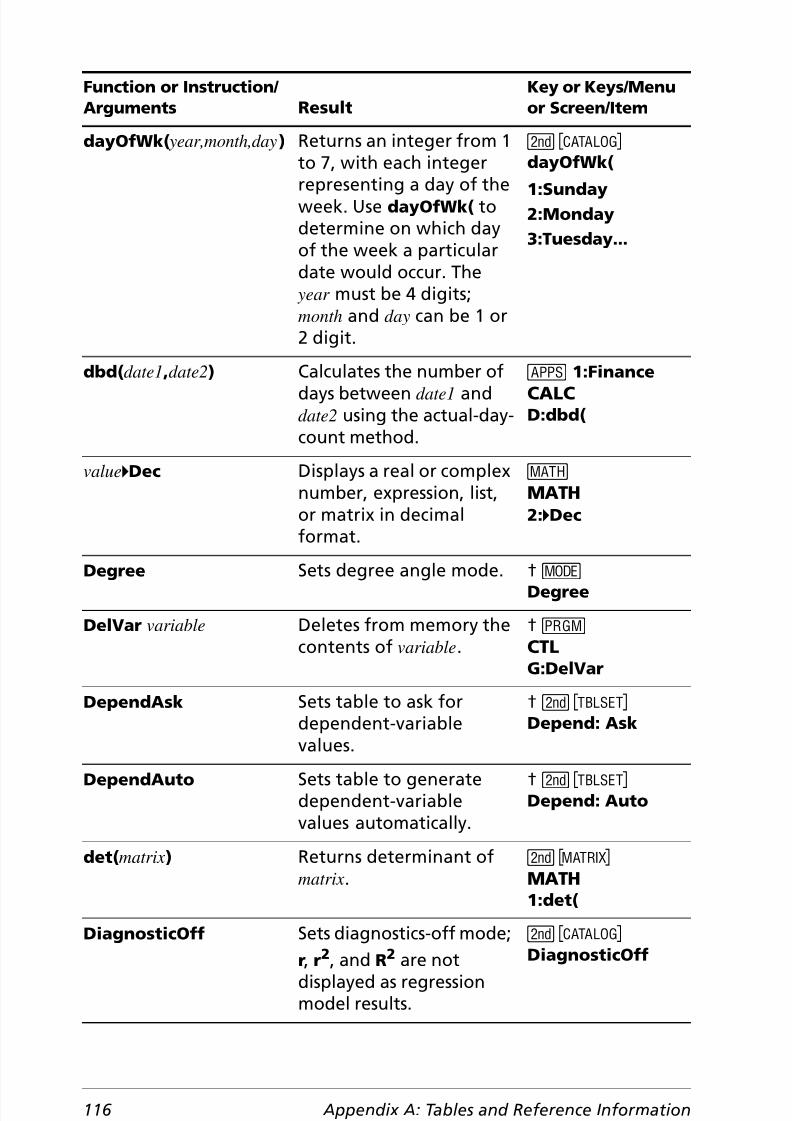
8/4/2019 Ti Plus Guidebook Part1 En
http://slidepdf.com/reader/full/ti-plus-guidebook-part1-en 122/198
116 Appendix A: Tables and Reference Information
dayOfWk( year,month,day ) Returns an integer from 1to 7, with each integer
representing a day of theweek. Use dayOfWk( todetermine on which dayof the week a particulardate would occur. The
year must be 4 digits;month and day can be 1 or2 digit.
y NdayOfWk(
1:Sunday2:Monday3:Tuesday...
dbd( date1 ,date2 ) Calculates the number ofdays between date1 anddate2 using the actual-day-count method.
Π1:FinanceCALCD:dbd(
value 4Dec Displays a real or complexnumber, expression, list,or matrix in decimalformat.
MATH2: 4Dec
Degree Sets degree angle mode. † zDegree
DelVar variable Deletes from memory thecontents of variable .
†CTLG:DelVar
DependAsk Sets table to ask fordependent-variablevalues.
† y -Depend: Ask
DependAuto Sets table to generatedependent-variablevalues automatically.
† y -Depend: Auto
det( matrix ) Returns determinant ofmatrix .
y >MATH1:det(
DiagnosticOff Sets diagnostics-off mode;r, r 2 , and R2 are notdisplayed as regressionmodel results.
y NDiagnosticOff
Function or Instruction/ Arguments Result
Key or Keys/Menuor Screen/Item
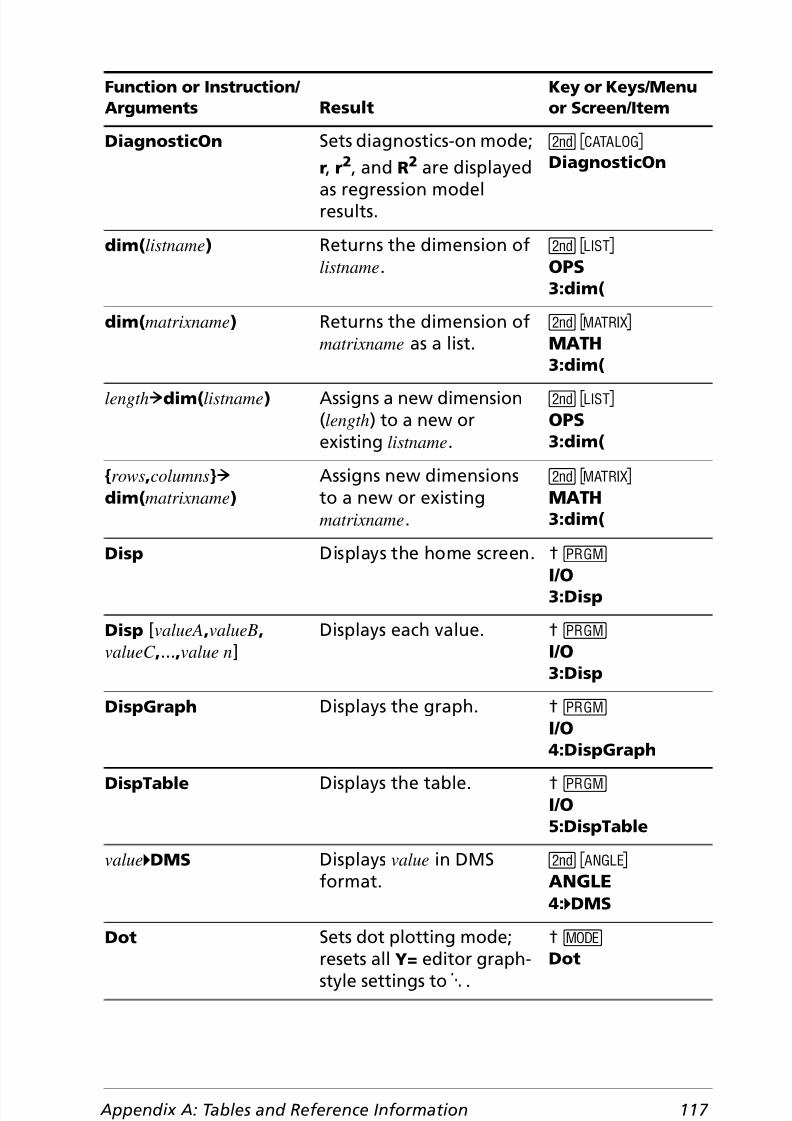
8/4/2019 Ti Plus Guidebook Part1 En
http://slidepdf.com/reader/full/ti-plus-guidebook-part1-en 123/198
Appendix A: Tables and Reference Information 117
DiagnosticOn Sets diagnostics-on mode;r, r 2 , and R2 are displayed
as regression modelresults.
y NDiagnosticOn
dim( listname ) Returns the dimension oflistname .
y 9OPS3:dim(
dim( matrixname ) Returns the dimension ofmatrixname as a list.
y >MATH3:dim(
length ! dim( listname ) Assigns a new dimension(length ) to a new orexisting listname .
y 9OPS3:dim(
{rows ,columns }!dim( matrixname )
Assigns new dimensionsto a new or existingmatrixname .
y >MATH3:dim(
Disp Displays the home screen. †I/O3:Disp
Disp [valueA ,valueB ,valueC ,... ,value n ]
Displays each value. †I/O3:Disp
DispGraph Displays the graph. †I/O
4:DispGraphDispTable Displays the table. †
I/O5:DispTable
value 4DMS Displays value in DMSformat.
y ;ANGLE4: 4DMS
Dot Sets dot plotting mode;resets all Y= editor graph-style settings to í .
† zDot
Function or Instruction/ Arguments Result
Key or Keys/Menuor Screen/Item

8/4/2019 Ti Plus Guidebook Part1 En
http://slidepdf.com/reader/full/ti-plus-guidebook-part1-en 124/198
118 Appendix A: Tables and Reference Information
DrawF expression Draws expression (in termsof X) on the graph.
y <DRAW
6:DrawFDrawInv expression Draws the inverse of
expression by plotting X values on the y-axis and Y values on the x-axis.
y < DRAW8:DrawInv
:DS<( variable ,value ):commandA:commands
Decrements variable by 1;skips commandA if variable< value .
†CTLB:DS<(
e^( power ) Returns e raised to power . y J
e^( list ) Returns a list of e raisedto a list of powers.
y J
Exponent:value âexponent
Returns value times 10 tothe exponent .
y D
Exponent:
list âexponent
Returns list elements times
10 to the exponent .
y D
Exponent:matrix âexponent
Returns matrix elementstimes 10 to the exponent .
y D
4Eff( nominal rate ,compounding periods )
Computes the effectiveinterest rate.
Π1:FinanceCALCC:4Eff(
Else
See If:Then:ElseEnd Identifies end of For( ,
If -Then -Else , Repeat , orWhile loop.
†CTL7:End
Eng Sets engineering displaymode.
† zEng
Equ 4String(Y= var ,Str n) Converts the contents ofa Y= var to a string andstores it in Str n.
y N Equ 4String(
expr( string ) Converts string to anexpression and executesit.
y N expr(
Function or Instruction/ Arguments Result
Key or Keys/Menuor Screen/Item

8/4/2019 Ti Plus Guidebook Part1 En
http://slidepdf.com/reader/full/ti-plus-guidebook-part1-en 125/198
Appendix A: Tables and Reference Information 119
ExpReg [ Xlistname ,Ylistname , freqlist ,regequ ]
Fits an exponentialregression model to
Xlistname and Ylistname with frequency freqlist ,and stores the regressionequation to regequ .
…CALC
0:ExpReg
ExprOff Turns off the expressiondisplay during TRACE.
† y .ExprOff
ExprOn Turns on the expressiondisplay during TRACE.
† y .ExprOn
Ücdf( lowerbound ,upperbound ,numerator df ,denominator df )
Computes the Û distribution probabilitybetween lowerbound andupperbound for thespecified numerator df (degrees of freedom) anddenominator df .
y =DISTR9: Ücdf(
Fill( value ,matrixname ) Stores value to eachelement in matrixname . y >MATH4:Fill(
Fill( value ,listname ) Stores value to eachelement in listname .
y 9OPS4:Fill(
Fix # Sets fixed-decimal modefor # of decimal places.
† z0123456789
(select one)Float Sets floating decimal
mode.† zFloat
fMax( expression ,variable ,lower ,upper [,tolerance ])
Returns the value ofvariable where the localmaximum of expression occurs, between lower andupper , with specifiedtolerance .
MATH7:fMax(
Function or Instruction/ Arguments Result
Key or Keys/Menuor Screen/Item

8/4/2019 Ti Plus Guidebook Part1 En
http://slidepdf.com/reader/full/ti-plus-guidebook-part1-en 126/198
120 Appendix A: Tables and Reference Information
fMin( expression ,variable ,lower ,upper [,tolerance ])
Returns the value ofvariable where the local
minimum of expression occurs, between lower andupper , with specifiedtolerance .
MATH
6:fMin(
fnInt( expression ,variable ,lower ,upper [,tolerance ])
Returns the functionintegral of expression withrespect to variable ,between lower and upper ,
with specified tolerance .
MATH9:fnInt(
FnOff [ function# , function# ,..., function n ]
Deselects all Y= functionsor specified Y= functions. Y-VARS
4:On/Off2:FnOff
FnOn [ function# , function# ,..., function n ]
Selects all Y= functions orspecified Y= functions. Y-VARS
4:On/Off
1:FnOn:For( variable ,begin ,end [,increment ]):commands:End:commands
Executes commands through End ,incrementing variable from begin by increment until variable >end .
†CTL4:For(
fPart( value ) Returns the fractionalpart or parts of a real orcomplex number,expression, list, or matrix.
NUM4:fPart(
Üpdf( x,numerator df ,denominator df )
Computes the Û distribution probabilitybetween lowerbound andupperbound for thespecified numerator df (degrees of freedom) anddenominator df .
y =DISTR8: Üpdf(
Function or Instruction/ Arguments Result
Key or Keys/Menuor Screen/Item

8/4/2019 Ti Plus Guidebook Part1 En
http://slidepdf.com/reader/full/ti-plus-guidebook-part1-en 127/198
Appendix A: Tables and Reference Information 121
value 4Frac Displays a real or complexnumber, expression, list,
or matrix as a fractionsimplified to its simplestterms.
MATH
1: 4Frac
Full Sets full screen mode. † zFull
Func Sets function graphingmode.
† zFunc
GarbageCollect Displays the garbagecollection menu to allowcleanup of unused archivememory.
y N GarbageCollect
gcd( valueA,valueB ) Returns the greatestcommon divisor of valueA and valueB , which can bereal numbers or lists.
NUM9:gcd(
geometcdf( p , x) Computes a cumulativeprobability at x, thenumber of the trial onwhich the first successoccurs, for the discretegeometric distributionwith the specifiedprobability of success p.
y =DISTRE:geometcdf(
geometpdf( p , x) Computes a probability at x, the number of the trialon which the first successoccurs, for the discretegeometric distributionwith the specifiedprobability of success p.
y =DISTRD:geometpdf(
Get( variable ) Gets data from the
CBL 2™ or CBR™ Systemand stores it in variable .
†
I/OA:Get(
Function or Instruction/ Arguments Result
Key or Keys/Menuor Screen/Item

8/4/2019 Ti Plus Guidebook Part1 En
http://slidepdf.com/reader/full/ti-plus-guidebook-part1-en 128/198
122 Appendix A: Tables and Reference Information
GetCalc( variable[ ,portflag ])
Gets contents of variable on another TI-84 Plus and
stores it to variable on thereceiving TI-84 Plus. Bydefault, the TI-84 Plususes the USB port if it isconnected. If the USBcable is not connected, ituses the I/O port.
portflag =0 use USB port ifconnected;
portflag =1 use USB port; portflag =2 use I/O port.
†I/O
0:GetCalc(
getDate Returns a list giving thedate according to thecurrent value of the clock.The list is in{year,month,day} format.
y NgetDate
getDtFmt Returns an integerrepresenting the dateformat that is currentlyset on the device.1 = M/D/Y2 = D/M/Y3 = Y/M/D
y NgetDtFmt
getDtStr( integer ) Returns a string of the
current date in theformat specified byinteger , where:1 = M/D/Y2 = D/M/Y3 = Y/M/D
y N
getDtStr(
getKey Returns the key code forthe current keystroke, or
0 , if no key is pressed.
†I/O
7:getKey
Function or Instruction/ Arguments Result
Key or Keys/Menuor Screen/Item

8/4/2019 Ti Plus Guidebook Part1 En
http://slidepdf.com/reader/full/ti-plus-guidebook-part1-en 129/198
Appendix A: Tables and Reference Information 123
getTime Returns a list giving thetime according to the
current value of the clock.The list is in{hour,minute,second} format. The time isreturned in the 24 hourformat.
y NgetTime
getTmFmt Returns an integerrepresenting the clock
time format that iscurrently set on thedevice.12 = 12 hour format24 = 24 hour format
y NgetTmFmt
getTmStr( integer ) Returns a string of thecurrent clock time in theformat specified by
integer , where:12 = 12 hour format24 = 24 hour format
y NgetTmStr(
Goto label Transfers control to label . †CTL0:Goto
GraphStyle( function# ,graphstyle# )
Sets a graphstyle for function# .
†CTLH:GraphStyle(
GridOff Turns off grid format. † y . GridOff
GridOn Turns on grid format. † y . GridOn
G-T Sets graph-table verticalsplit-screen mode.
† zG-T
Horiz Sets horizontal split-screen mode.
† zHoriz
Function or Instruction/ Arguments Result
Key or Keys/Menuor Screen/Item
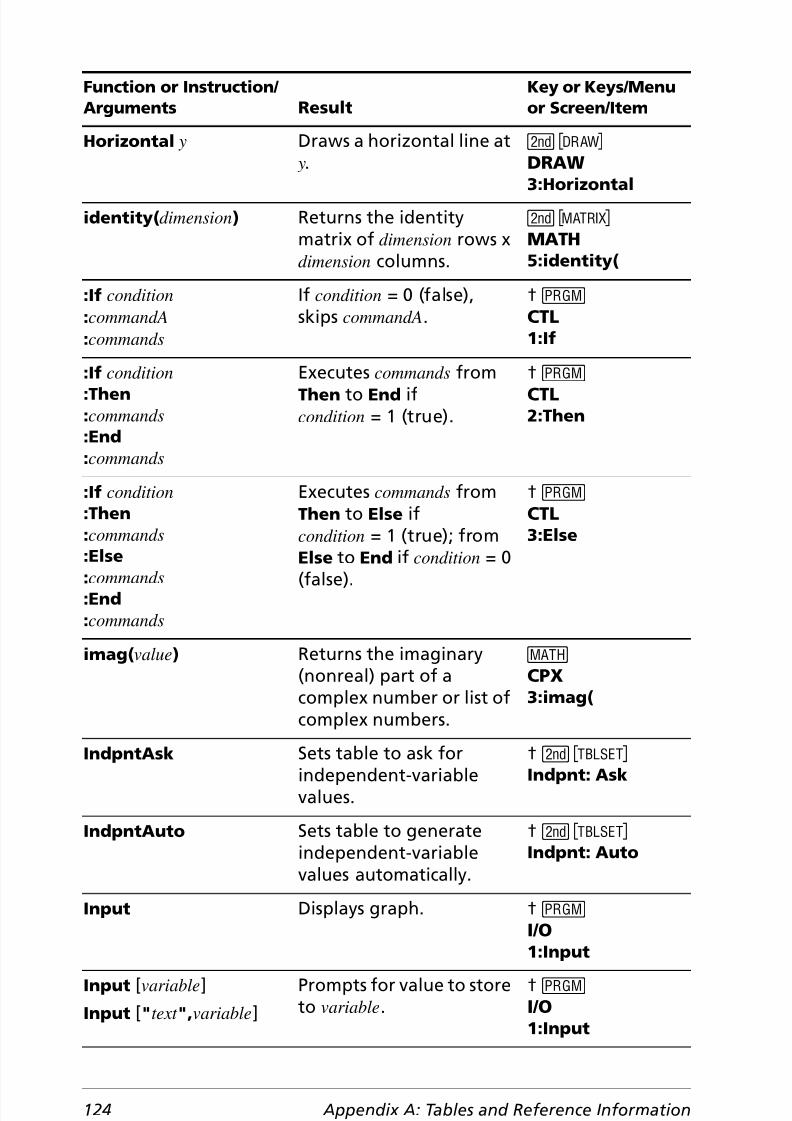
8/4/2019 Ti Plus Guidebook Part1 En
http://slidepdf.com/reader/full/ti-plus-guidebook-part1-en 130/198
124 Appendix A: Tables and Reference Information
Horizontal y Draws a horizontal line at y.
y <DRAW
3:Horizontalidentity( dimension ) Returns the identity
matrix of dimension rows xdimension columns.
y >MATH5:identity(
:If condition:commandA :commands
If condition = 0 (false),skips commandA .
†CTL1:If
:If condition:Then:commands:End:commands
Executes commands fromThen to End ifcondition = 1 (true).
†CTL2:Then
:If condition:Then:commands:Else:commands:End:commands
Executes commands fromThen to Else ifcondition = 1 (true); fromElse to End if condition = 0(false).
†CTL3:Else
imag( value ) Returns the imaginary(nonreal) part of acomplex number or list ofcomplex numbers.
CPX3:imag(
IndpntAsk Sets table to ask forindependent-variablevalues.
† y -Indpnt: Ask
IndpntAuto Sets table to generateindependent-variablevalues automatically.
† y -Indpnt: Auto
Input Displays graph. †I/O1:Input
Input [variable ]Input [" text ", variable ]
Prompts for value to storeto variable .
†I/O1:Input
Function or Instruction/ Arguments Result
Key or Keys/Menuor Screen/Item

8/4/2019 Ti Plus Guidebook Part1 En
http://slidepdf.com/reader/full/ti-plus-guidebook-part1-en 131/198
Appendix A: Tables and Reference Information 125
Input [Str n,variable ] Displays Str n and storesentered value to variable .
†I/O
1:InputinString( string ,substring[,start ])
Returns the characterposition in string of thefirst character of substringbeginning at start .
y N inString(
int( value ) Returns the largestinteger a real orcomplex number,expression, list, or matrix.
NUM5:int(
GInt( pmt1 , pmt2[,roundvalue ])
Computes the sum,rounded to roundvalue , ofthe interest amountbetween pmt1 and pmt2 for an amortizationschedule.
Π1:FinanceCALCA:GInt(
invNorm( area[,m
,s ]
)Computes the inversecumulative normaldistribution function for agiven area under thenormal distribution curvespecified by mand s .
y =DISTR3:invNorm(
iPart( value ) Returns the integer partof a real or complexnumber, expression, list,or matrix.
NUM3:iPart(
irr( CF0 ,CFList [,CFFreq ]) Returns the interest rateat which the net presentvalue of the cash flow isequal to zero.
Π1:FinanceCALC8:irr(
:IS>( variable ,value )
:commandA
:commands
Increments variable by 1;skips commandA if
variable >value .
†CTL
A:IS>(
isClockOn Identifies if clock is ON orOFF. Returns 1 if the clockis ON. Returns 0 if theclock is OFF.
y NisClockOn
Function or Instruction/ Arguments Result
Key or Keys/Menuor Screen/Item

8/4/2019 Ti Plus Guidebook Part1 En
http://slidepdf.com/reader/full/ti-plus-guidebook-part1-en 132/198
126 Appendix A: Tables and Reference Information
Ùlistname Identifies the next one tofive characters as a user-
created list name.
y 9OPS
B:ÙLabelOff Turns off axes labels. † y .
LabelOff
LabelOn Turns on axes labels. † y . LabelOn
Lbl label Creates a label of one ortwo characters.
†CTL
9:Lbllcm( valueA,valueB ) Returns the least common
multiple of valueA andvalueB , which can be realnumbers or lists.
NUM8:lcm(
length( string ) Returns the number ofcharacters in string .
y N length(
Line( X1,Y1, X2,Y2)Draws a line from (
X1,Y1
)to ( X2,Y2).y <DRAW2:Line(
Line( X1,Y1, X2,Y2,0) Erases a line from ( X1,Y1)to ( X2,Y2).
y <DRAW2:Line(
LinReg(a+bx) [ Xlistname ,Ylistname , freqlist ,
regequ ]
Fits a linear regressionmodel to Xlistname and
Ylistname with frequency freqlist , and stores theregression equation toregequ .
…CALC
8:LinReg(a+bx)
LinReg(ax+b) [ Xlistname ,Ylistname , freqlist ,regequ ]
Fits a linear regressionmodel to Xlistname andYlistname with frequency
freqlist , and stores the
regression equation toregequ .
…CALC4:LinReg(ax+b)
Function or Instruction/ Arguments Result
Key or Keys/Menuor Screen/Item

8/4/2019 Ti Plus Guidebook Part1 En
http://slidepdf.com/reader/full/ti-plus-guidebook-part1-en 133/198
Appendix A: Tables and Reference Information 127
LinRegTTest [ Xlistname ,Ylistname , freqlist ,
alternative ,regequ ]
Performs a linearregression and a t -test.
alternative =L1 is <;alternative =0 is ƒ ;alternative =1 is >.
† …TESTS
E:LinRegTTest
@List( list ) Returns a list containingthe differences betweenconsecutive elements inlist .
y 9OPS 7: @List(
List 4 matr( listname1 ,... ,listname n ,matrixname )
Fills matrixname column bycolumn with the elementsfrom each specifiedlistname .
y 9OPS 0:List 4 matr(
ln( value ) Returns the naturallogarithm of a real orcomplex number,expression, or list.
µ
LnReg [ Xlistname ,Ylistname , freqlist ,regequ ]
Fits a logarithmicregression model to Xlistname and Ylistname with frequency freqlist ,and stores the regressionequation to regequ .
…CALC9:LnReg
log( value ) Returns logarithm of areal or complex number,expression, or list.
«
Logistic [ Xlistname ,Ylistname , freqlist ,regequ ]
Fits a logistic regressionmodel to Xlistname andYlistname with frequency
freqlist , and stores theregression equation toregequ .
…CALCB:Logistic
Matr 4list( matrix ,
listnameA ,... ,listname n )
Fills each listname with
elements from eachcolumn in matrix .
y 9
OPS A:Matr 4list(
Matr 4list( matrix ,column# ,listname )
Fills a listname withelements from a specifiedcolumn# in matrix .
y 9OPS A:Matr 4list(
Function or Instruction/ Arguments Result
Key or Keys/Menuor Screen/Item

8/4/2019 Ti Plus Guidebook Part1 En
http://slidepdf.com/reader/full/ti-plus-guidebook-part1-en 134/198
128 Appendix A: Tables and Reference Information
max( valueA ,valueB ) Returns the larger ofvalueA and valueB . NUM
7:max(max( list ) Returns largest real or
complex element in list .y 9MATH2:max(
max( listA ,listB ) Returns a real or complexlist of the larger of eachpair of elements in listA and listB .
y 9MATH2:max(
max( value,list ) Returns a real or complexlist of the larger of value oreach list element.
y 9MATH2:max(
mean( list [, freqlist ]) Returns the mean of list with frequency freqlist .
y 9MATH3:mean(
median( list [, freqlist ]) Returns the median of list
with frequency freqlist .
y 9
MATH4:median(
Med-Med [ Xlistname ,Ylistname , freqlist ,regequ ]
Fits a median-medianmodel to Xlistname andYlistname with frequency
freqlist , and stores theregression equation toregequ .
…CALC3:Med-Med
Menu(" title "," text1 ",label1 [,...," text7 ", label7 ])
Generates a menu of upto seven items duringprogram execution.
†CTLC:Menu(
min( valueA ,valueB ) Returns smaller of valueA and valueB . NUM
6:min(
min( list ) Returns smallest real or
complex element in list .
y 9
MATH1:min(
Function or Instruction/ Arguments Result
Key or Keys/Menuor Screen/Item

8/4/2019 Ti Plus Guidebook Part1 En
http://slidepdf.com/reader/full/ti-plus-guidebook-part1-en 135/198
Appendix A: Tables and Reference Information 129
min( listA ,listB ) Returns real or complexlist of the smaller of each
pair of elements in listA and listB .
y 9MATH
1:min(
min( value,list ) Returns a real or complexlist of the smaller of value or each list element.
y 9MATH1:min(
valueA nCr valueB Returns the number ofcombinations of valueA taken valueB at a time.
PRB3:nCr
value nCr list Returns a list of thecombinations of value taken each element in list at a time.
PRB3:nCr
list nCr value Returns a list of thecombinations of eachelement in list taken value
at a time.
PRB3:nCr
listA nCr listB Returns a list of thecombinations of eachelement in listA takeneach element in listB at atime.
PRB3:nCr
nDeriv( expression ,variable ,value [,H])
Returns approximatenumerical derivative ofexpression with respect tovariable at value , withspecified H.
MATH
8:nDeriv(
4Nom( effective rate ,compounding periods )
Computes the nominalinterest rate.
Π1:FinanceCALCB:4Nom(
Normal Sets normal display mode. † zNormal
Function or Instruction/ Arguments Result
Key or Keys/Menuor Screen/Item

8/4/2019 Ti Plus Guidebook Part1 En
http://slidepdf.com/reader/full/ti-plus-guidebook-part1-en 136/198
130 Appendix A: Tables and Reference Information
normalcdf( lowerbound ,upperbound [,m,s ])
Computes the normaldistribution probability
between lowerbound andupperbound for thespecified mand s .
y =DISTR
2:normalcdf(
normalpdf( x[,m,s ]) Computes the probabilitydensity function for thenormal distribution at aspecified x value for thespecified mand s .
y =DISTR1:normalpdf(
not( value ) Returns 0 if value is ƒ 0.value can be a realnumber, expression, orlist.
y :LOGIC4:not(
valueA nPr valueB Returns the number ofpermutations of valueA taken valueB at a time.
PRB2:nPr
value nPr list Returns a list of thepermutations of value taken each element in list at a time.
PRB2:nPr
list nPr value Returns a list of thepermutations of eachelement in list taken value at a time.
PRB2:nPr
listA nPr listB Returns a list of thepermutations of eachelement in listA takeneach element in listB at atime.
PRB2:nPr
npv( interest rate ,CF0 ,CFList [,CFFreq ])
Computes the sum of thepresent values for cashinflows and outflows.
Π1:FinanceCALC7:npv(
valueA or valueB Returns 1 if valueA orvalueB is ƒ 0. valueA andvalueB can be realnumbers, expressions, orlists.
y :LOGIC2:or
Function or Instruction/ Arguments Result
Key or Keys/Menuor Screen/Item

8/4/2019 Ti Plus Guidebook Part1 En
http://slidepdf.com/reader/full/ti-plus-guidebook-part1-en 137/198
Appendix A: Tables and Reference Information 131
Output( row,column ," text ")
Displays text beginning atspecified row and column .
†I/O
6:Output(Output( row,column ,value )
Displays value beginningat specified row andcolumn .
†I/O 6:Output(
Param Sets parametric graphingmode.
† zPar
Pause Suspends program
execution until you pressÍ .
†
CTL8:Pause
Pause [value ] Displays value ; suspendsprogram execution untilyou press Í .
†CTL8:Pause
Plot # (type , Xlistname ,Ylistname ,mark )
Defines Plot # (1 , 2 , or 3 )of type Scatter or xyLine for Xlistname and Ylistname using mark .
† y ,STAT PLOTS1:Plot1-
2:Plot2-3:Plot3-
Plot # (type , Xlistname , freqlist )
Defines Plot # (1 , 2 , or 3 )of type Histogram orBoxplot for Xlistname withfrequency freqlist .
† y ,STAT PLOTS1:Plot1-2:Plot2-3:Plot3-
Plot # (type , Xlistname , freqlist ,mark )
Defines Plot # (1 , 2 , or 3 )of type ModBoxplot for
Xlistname with frequency freqlist using mark .
† y ,STAT PLOTS1:Plot1-2:Plot2-3:Plot3-
Plot # (type ,datalistname ,data axis ,mark )
Defines Plot # (1 , 2 , or 3 )of type NormProbPlot fordatalistname on data axis using mark . data axis can
be X or Y.
† y ,STAT PLOTS1:Plot1-2:Plot2-
3:Plot3-PlotsOff [1,2,3 ] Deselects all stat plots or
one or more specified statplots ( 1 , 2 , or 3 ).
y ,STAT PLOTS4:PlotsOff
Function or Instruction/ Arguments Result
Key or Keys/Menuor Screen/Item
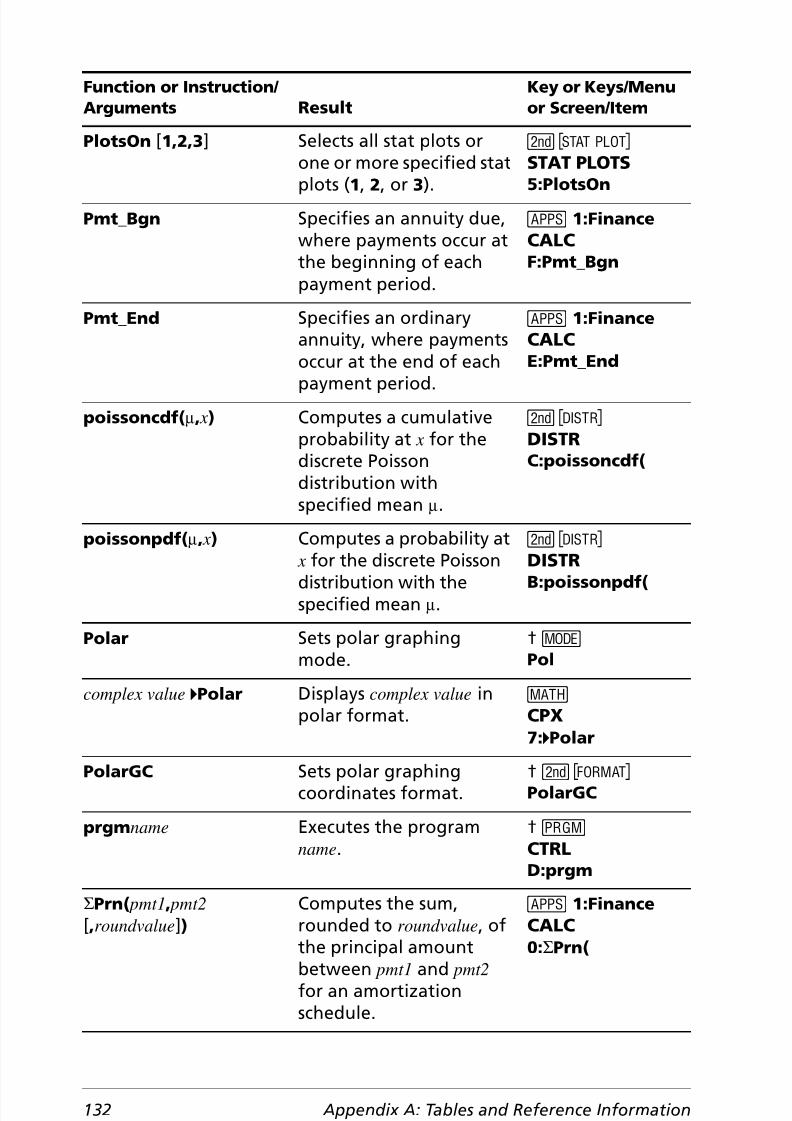
8/4/2019 Ti Plus Guidebook Part1 En
http://slidepdf.com/reader/full/ti-plus-guidebook-part1-en 138/198
132 Appendix A: Tables and Reference Information
PlotsOn [1,2,3 ] Selects all stat plots orone or more specified stat
plots ( 1 , 2 , or 3 ).
y ,STAT PLOTS
5:PlotsOnPmt_Bgn Specifies an annuity due,
where payments occur atthe beginning of eachpayment period.
Π1:FinanceCALCF:Pmt_Bgn
Pmt_End Specifies an ordinaryannuity, where paymentsoccur at the end of eachpayment period.
Π1:FinanceCALCE:Pmt_End
poissoncdf( m, x) Computes a cumulativeprobability at x for thediscrete Poissondistribution withspecified mean m.
y =DISTRC:poissoncdf(
poissonpdf( m, x) Computes a probability at
x for the discrete Poissondistribution with thespecified mean m.
y =
DISTRB:poissonpdf(
Polar Sets polar graphingmode.
† zPol
complex value 4Polar Displays complex value inpolar format. CPX
7: 4Polar
PolarGC Sets polar graphingcoordinates format.
† y . PolarGC
prgm name Executes the programname .
†CTRLD:prgm
GPrn( pmt1 , pmt2[,roundvalue ])
Computes the sum,rounded to roundvalue , of
the principal amountbetween pmt1 and pmt2 for an amortizationschedule.
Π1:FinanceCALC
0: GPrn(
Function or Instruction/ Arguments Result
Key or Keys/Menuor Screen/Item

8/4/2019 Ti Plus Guidebook Part1 En
http://slidepdf.com/reader/full/ti-plus-guidebook-part1-en 139/198
Appendix A: Tables and Reference Information 133
prod( list [,start ,end ]) Returns product of list elements between start
and end .
y 9MATH
6:prod(Prompt variableA[,variableB ,... ,variable n ]
Prompts for value forvariableA , then variableB ,and so on.
†I/O2:Prompt
1-PropZInt( x,n[,confidence level ])
Computes a one-proportion z confidenceinterval.
† …TESTSA:1-PropZInt(
2-PropZInt( x1,n1 , x2 ,n2[,confidence level ]) Computes a two-proportion z confidenceinterval.
† …TESTSB:2-PropZInt(
1-PropZTest( p0 , x,n[,alternative ,drawflag ])
Computes a one-proportion z test.alternative =L1 is <;alternative =0 is ƒ ;alternative =1 is >.
drawflag =1 draws results;drawflag =0 calculatesresults.
† …TESTS5:1-PropZTest(
2-PropZTest( x1,n1 , x2,n2[,alternative ,drawflag ])
Computes a two-proportion z test.alternative =L1 is <;alternative =0 is ƒ ;alternative =1 is >.drawflag =1 draws results;drawflag =0 calculatesresults.
† …TESTS6:2-PropZTest(
Pt-Change( x, y) Reverses a point at ( x, y). y <POINTS3:Pt-Change(
Pt-Off( x, y[,mark ]) Erases a point at ( x, y)using mark .
y <POINTS
2:Pt-Off(Pt-On( x, y[,mark ]) Draws a point at ( x, y)
using mark .y <POINTS1:Pt-On(
Function or Instruction/ Arguments Result
Key or Keys/Menuor Screen/Item

8/4/2019 Ti Plus Guidebook Part1 En
http://slidepdf.com/reader/full/ti-plus-guidebook-part1-en 140/198
134 Appendix A: Tables and Reference Information
PwrReg [ Xlistname ,Ylistname , freqlist ,
regequ ]
Fits a power regressionmodel to Xlistname and
Ylistname with frequency freqlist , and stores theregression equation toregequ .
…CALC
A:PwrReg
Pxl-Change( row ,column ) Reverses pixel at(row ,column ); 0 row 62and 0 column 94.
y < POINTS6:Pxl-Change(
Pxl-Off( row,column ) Erases pixel at(row ,column ); 0 row 62and 0 column 94.
y <POINTS5:Pxl-Off(
Pxl-On( row ,column ) Draws pixel at(row ,column ); 0 row 62and 0 column 94.
y <POINTS4:Pxl-On(
pxl-Test( row ,column ) Returns 1 if pixel ( row,column ) is on, 0 if it is off;
0 row 62 and0 column 94.
y <POINTS
7:pxl-Test(
P4Rx( r ,q) Returns X, given polarcoordinates r and q or alist of polar coordinates.
y ; ANGLE7:P 4Rx(
P4Ry( r ,q) Returns Y, given polarcoordinates r and q or alist of polar coordinates.
y ; ANGLE8:P 4Ry(
QuadReg [ Xlistname ,Ylistname , freqlist ,regequ ]
Fits a quadratic regressionmodel to Xlistname andYlistname with frequency
freqlist , and stores theregression equation toregequ .
…CALC5:QuadReg
QuartReg [ Xlistname ,Ylistname , freqlist ,regequ ]
Fits a quartic regressionmodel to Xlistname andYlistname with frequency
freqlist , and stores theregression equation toregequ .
…CALC7:QuartReg
Function or Instruction/ Arguments Result
Key or Keys/Menuor Screen/Item

8/4/2019 Ti Plus Guidebook Part1 En
http://slidepdf.com/reader/full/ti-plus-guidebook-part1-en 141/198

8/4/2019 Ti Plus Guidebook Part1 En
http://slidepdf.com/reader/full/ti-plus-guidebook-part1-en 142/198
136 Appendix A: Tables and Reference Information
RecallGDB n Restores all settingsstored in the graph
database variable GDB n.
y <STO
4:RecallGDBRecallPic n Displays the graph and
adds the picture stored inPic n.
y < STO2:RecallPic
complex value 4Rect Displays complex value orlist in rectangular format. CPX
6: 4Rect
RectGC Sets rectangular graphingcoordinates format. † y .RectGC
ref( matrix ) Returns the row-echelonform of a matrix .
y > MATH A:ref(
:Repeat condition:commands:End
:commands
Executes commands untilcondition is true.
†CTL6:Repeat
Return Returns to the callingprogram.
†CTLE:Return
round( value [,#decimals ]) Returns a number,expression, list, or matrixrounded to #decimals ( 9).
NUM2:round(
ä row( value ,matrix ,row ) Returns a matrix with row of matrix multiplied byvalue and stored in row .
y > MATH E:ä row(
row+( matrix ,rowA ,rowB ) Returns a matrix with rowA of matrix added to rowB and stored in rowB .
y > MATH D:row+(
ä row+( value ,matrix ,rowA ,rowB )
Returns a matrix withrowA of matrix multipliedby value , added to rowB ,and stored in rowB .
y > MATH F:ä row+(
Function or Instruction/ Arguments Result
Key or Keys/Menuor Screen/Item

8/4/2019 Ti Plus Guidebook Part1 En
http://slidepdf.com/reader/full/ti-plus-guidebook-part1-en 143/198
Appendix A: Tables and Reference Information 137
rowSwap( matrix ,rowA ,rowB )
Returns a matrix withrowA of matrix swapped
with rowB .
y >MATH
C:rowSwap(rref( matrix ) Returns the reduced row-
echelon form of a matrix .y > MATH B:rref(
R4Pr( x, y) Returns R, givenrectangular coordinates x and y or a list ofrectangular coordinates.
y ; ANGLE5:R 4Pr(
R4Pq( x, y) Returns q, givenrectangular coordinates x and y or a list ofrectangular coordinates.
y ; ANGLE6:R 4Pq(
2-Samp ÜTest [listname1 ,listname2 , freqlist1 ,
freqlist2 ,alternative ,drawflag
](Data list input)
Performs a two-sampleÛ test. alternative =L1 is <;alternative =0 is ƒ ;alternative
=1
is>
.drawflag =1 draws results;drawflag =0 calculatesresults.
† …TESTSD:2-Samp ÜTest
2-Samp ÜTest Sx1,n1 ,Sx2,n2[,alternative ,drawflag ](Summary stats input)
Performs a two-sampleÛ test. alternative =L1 is <;alternative =0 is ƒ ;alternative =1 is >.drawflag =1 draws results;drawflag =0 calculatesresults.
† …TESTSD:2-Samp ÜTest
2-SampTInt [listname1 ,listname2 ,
freqlist1 , freqlist2 ,confidence level , pooled ](Data list input)
Computes a two-sample t confidence interval.
pooled =1 pools variances; pooled =0 does not poolvariances.
† …TESTS0:2-SampTInt
2-SampTInt v1,Sx1,n1 ,v2,Sx2,n2[,confidence level , pooled ](Summary stats input)
Computes a two-sample t confidence interval. pooled =1 pools variances; pooled =0 does not poolvariances.
† …TESTS0:2-SampTInt
Function or Instruction/ Arguments Result
Key or Keys/Menuor Screen/Item

8/4/2019 Ti Plus Guidebook Part1 En
http://slidepdf.com/reader/full/ti-plus-guidebook-part1-en 144/198
138 Appendix A: Tables and Reference Information
2-SampTTest [listname1 ,listname2 , freqlist1 ,
freqlist2 ,alternative , pooled ,drawflag ](Data list input)
Computes a two-sample t test. alternative =L1 is <;
alternative =0 is ƒ ;alternative =1 is >. pooled =1 pools variances; pooled =0 does not pool variances.drawflag =1 draws results;drawflag =0 calculatesresults.
† …TESTS
4:2-SampTTest
2-SampTTest v1,Sx1,n1 ,
v2,Sx2,n2[,alternative , pooled ,drawflag ](Summary stats input)
Computes a two-sample t
test. alternative =L1 is <;alternative =0 is ƒ ;alternative =1 is >. pooled =1 pools variances; pooled =0 does not pool variances.drawflag =1 draws results;drawflag =0 calculatesresults.
† …
TESTS4:2-SampTTest
2-SampZInt( s1,s
2
[,listname1 ,listname2 , freqlist1 , freqlist2 ,confidence level ])(Data list input)
Computes a two-sample z confidence interval.
† …TESTS9:2-SampZInt(
2-SampZInt( s 1,s 2,v1,n1 ,v2,n2[,confidence level ])
(Summary stats input)
Computes a two-sample z confidence interval.
† …TESTS9:2-SampZInt(
2-SampZTest( s 1,s 2 [,listname1 ,listname2 ,
freqlist1 , freqlist2 ,alternative ,drawflag ])(Data list input)
Computes a two-sample z test. alternative =L1 is <;alternative =0 is ƒ ;alternative =1 is >.drawflag =1 draws results;drawflag =0 calculatesresults.
† …TESTS3:2-SampZTest(
Function or Instruction/ Arguments Result
Key or Keys/Menuor Screen/Item

8/4/2019 Ti Plus Guidebook Part1 En
http://slidepdf.com/reader/full/ti-plus-guidebook-part1-en 145/198
Appendix A: Tables and Reference Information 139
2-SampZTest( s 1,s 2,v1,n1 ,v2,n2
[,alternative ,drawflag ])(Summary stats input)
Computes a two-sample z test. alternative =L1 is <;
alternative =0 is ƒ ;alternative =1 is >.drawflag =1 draws results;drawflag =0 calculatesresults.
† …TESTS
3:2-SampZTest(
Sci Sets scientific notationdisplay mode.
† zSci
Select( Xlistname ,Ylistname )
Selects one or morespecific data points froma scatter plot or xyLineplot (only), and thenstore•s the selected datapoints to two new lists,
Xlistname and Ylistname .
y 9OPS8:Select(
Send( variable ) Sends contents of variable to the CBL 2™ or CBR™
System.
†I/OB:Send(
seq( expression ,variable ,begin ,end [,increment ])
Returns list created byevaluating expression withregard to variable , frombegin to end by increment.
y 9 OPS5:seq(
Seq Sets sequence graphingmode.
† zSeq
Sequential Sets mode to graphfunctions sequentially.
† zSequential
setDate( year,month,day ) Sets the date using a year,month, day format. The
year must be 4 digits;month and day can be 1 or2 digit.
y NsetDate(
setDtFmt( integer ) Sets the date format.1 = M/D/Y2 = D/M/Y3 = Y/M/D
y NsetDtFmt(
Function or Instruction/ Arguments Result
Key or Keys/Menuor Screen/Item

8/4/2019 Ti Plus Guidebook Part1 En
http://slidepdf.com/reader/full/ti-plus-guidebook-part1-en 146/198
140 Appendix A: Tables and Reference Information
setTime( hour,minute,second )
Sets the time using anhour, minute, second
format. The hour must bein 24 hour format, inwhich 13 = 1 p.m.
y NsetTime(
setTmFmt( integer ) Sets the time format.12 = 12 hour format24 = 24 hour format
y NsetTmFmt(
SetUpEditor Removes all list namesfrom the stat list editor,and then restores listnames L1 through L6 tocolumns 1 through 6 .
…EDIT 5:SetUpEditor
SetUpEditor listname1[,listname2 ,...,listname20 ]
Removes all list namesfrom the stat list editor,then sets it up to displayone or more listnames inthe specified order,starting with column 1 .
…EDIT 5:SetUpEditor
Shade( lowerfunc ,upperfunc [, Xleft , Xright ,
pattern , patres ])
Draws lowerfunc andupperfunc in terms of X onthe current graph anduses pattern and patres toshade the area boundedby lowerfunc , upperfunc ,
Xleft , and Xright .
y < DRAW7:Shade(
Shade c2 (lowerbound ,upperbound ,df )
Draws the densityfunction for the c2 distribution specified bydegrees of freedom df and shades the areabetween lowerbound andupperbound .
y = DRAW3:Shade c2 (
Function or Instruction/ Arguments Result
Key or Keys/Menuor Screen/Item

8/4/2019 Ti Plus Guidebook Part1 En
http://slidepdf.com/reader/full/ti-plus-guidebook-part1-en 147/198
Appendix A: Tables and Reference Information 141
Shade Ü(lowerbound ,upperbound ,
numerator df ,denominator df )
Draws the densityfunction for the Û
distribution specified bynumerator df anddenominator df and shadesthe area betweenlowerbound andupperbound .
y = DRAW
4:Shade Ü(
ShadeNorm( lowerbound ,upperbound [,m,s ])
Draws the normal densityfunction specified by m
and s and shades the areabetween lowerbound andupperbound .
y = DRAW
1:ShadeNorm(
Shade_t( lowerbound ,upperbound ,df )
Draws the densityfunction for the Student-tdistribution specified bydegrees of freedom df,and shades the areabetween lowerbound andupperbound .
y = DRAW2:Shade_t(
Simul Sets mode to graphfunctions simultaneously.
† zSimul
sin( value ) Returns the sine of a realnumber, expression, orlist.
˜
sinL1
(value )Returns the arcsine of areal number, expression,or list.
y ?
sinh( value ) Returns the hyperbolicsine of a real number,expression, or list.
y N sinh(
sinh L1 (value ) Returns the hyperbolicarcsine of a real number,
expression, or list.
y Nsinh L1 (
Function or Instruction/ Arguments Result
Key or Keys/Menuor Screen/Item

8/4/2019 Ti Plus Guidebook Part1 En
http://slidepdf.com/reader/full/ti-plus-guidebook-part1-en 148/198
142 Appendix A: Tables and Reference Information
SinReg [iterations , Xlistname ,Ylistname ,
period ,regequ ]
Attempts iterations timesto fit a sinusoidal
regression model to Xlistname and Ylistname using a period guess, andstores the regressionequation to regequ .
…CALC
C:SinReg
solve( expression ,variable ,guess ,{lower ,upper })
Solves expression forvariable , given an initialguess and lower and upper
bounds within which thesolution is sought.
†MATH0:solve(
SortA( listname ) Sorts elements of listname in ascending order.
y 9 OPS1:SortA(
SortA( keylistname ,dependlist1 [,dependlist2 ,..., dependlist n ])
Sorts elements ofkeylistname in ascendingorder, then sorts eachdependlist as a dependentlist.
y 9 OPS1:SortA(
SortD( listname ) Sorts elements of listname in descending order.
y 9 OPS2:SortD(
SortD( keylistname ,dependlist1 [,dependlist2 ,..., dependlist n ])
Sorts elements ofkeylistname in descendingorder, then sorts eachdependlist as a dependentlist.
y 9 OPS2:SortD(
startTmr Starts the clock timer.Store or note thedisplayed value, and useit as the argument forcheckTmr( ) to check theelapsed time.
y NstartTmr
stdDev( list [, freqlist ]) Returns the standarddeviation of the elementsin list with frequency
freqlist .
y 9 MATH7:stdDev(
Function or Instruction/ Arguments Result
Key or Keys/Menuor Screen/Item
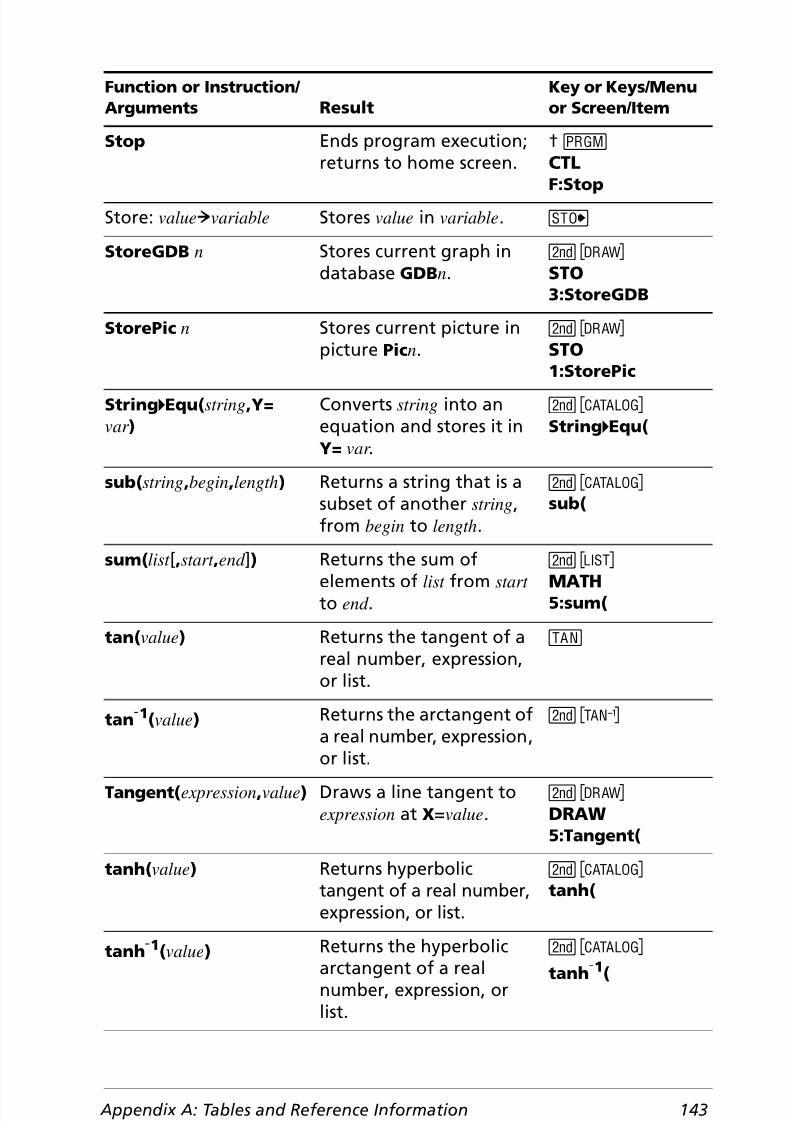
8/4/2019 Ti Plus Guidebook Part1 En
http://slidepdf.com/reader/full/ti-plus-guidebook-part1-en 149/198
Appendix A: Tables and Reference Information 143
Stop Ends program execution;returns to home screen.
†CTL
F:StopStore: value ! variable Stores value in variable . ¿
StoreGDB n Stores current graph indatabase GDB n.
y < STO3:StoreGDB
StorePic n Stores current picture inpicture Pic n.
y <STO
1:StorePicString 4Equ( string ,Y= var )
Converts string into anequation and stores it inY= var .
y N String 4Equ(
sub( string ,begin ,length ) Returns a string that is asubset of another string ,from begin to length .
y N sub(
sum( list [,start ,end
])
Returns the sum ofelements of list from start to end .
y 9 MATH
5:sum(
tan( value ) Returns the tangent of areal number, expression,or list.
š
tan L1(value ) Returns the arctangent ofa real number, expression,
or list.
y A
Tangent( expression ,value ) Draws a line tangent toexpression at X=value .
y < DRAW5:Tangent(
tanh( value ) Returns hyperbolictangent of a real number,expression, or list.
y N tanh(
tanh L1 (value ) Returns the hyperbolicarctangent of a realnumber, expression, orlist.
y N tanh L1 (
Function or Instruction/ Arguments Result
Key or Keys/Menuor Screen/Item

8/4/2019 Ti Plus Guidebook Part1 En
http://slidepdf.com/reader/full/ti-plus-guidebook-part1-en 150/198
144 Appendix A: Tables and Reference Information
tcdf( lowerbound ,upperbound ,df )
Computes the Student- t distribution probability
between lowerbound and upperbound for thespecified degrees offreedom df .
y = DISTR
5:tcdf(
Text( row ,column ,text1 ,text2 ,... ,text n )
Writes text on graphbeginning at pixel(row ,column ), where0 row 57 and
0 column 94.
y < DRAW0:Text(
ThenSee If:Then
Time Sets sequence graphs toplot with respect to time.
† y . Time
timeCnv( seconds ) Converts seconds to unitsof time that can be more
easily understood forevaluation. The list is in{days,hours,minutes,seconds} format.
y NtimeCnv
TInterval [listname , freqlist ,confidence level ](Data list input)
Computes a t confidenceinterval.
† …TESTS8:TInterval
TInterval v,Sx,n
[,confidence level ](Summary stats input)
Computes a t confidence
interval.
† …
TESTS8:TInterval
tpdf( x,df ) Computes the probabilitydensity function (pdf) forthe Student- t distributionat a specified x value withspecified degrees offreedom df .
y =DISTR4:tpdf(
Trace Displays the graph andenters TRACE mode.
r
Function or Instruction/ Arguments Result
Key or Keys/Menuor Screen/Item
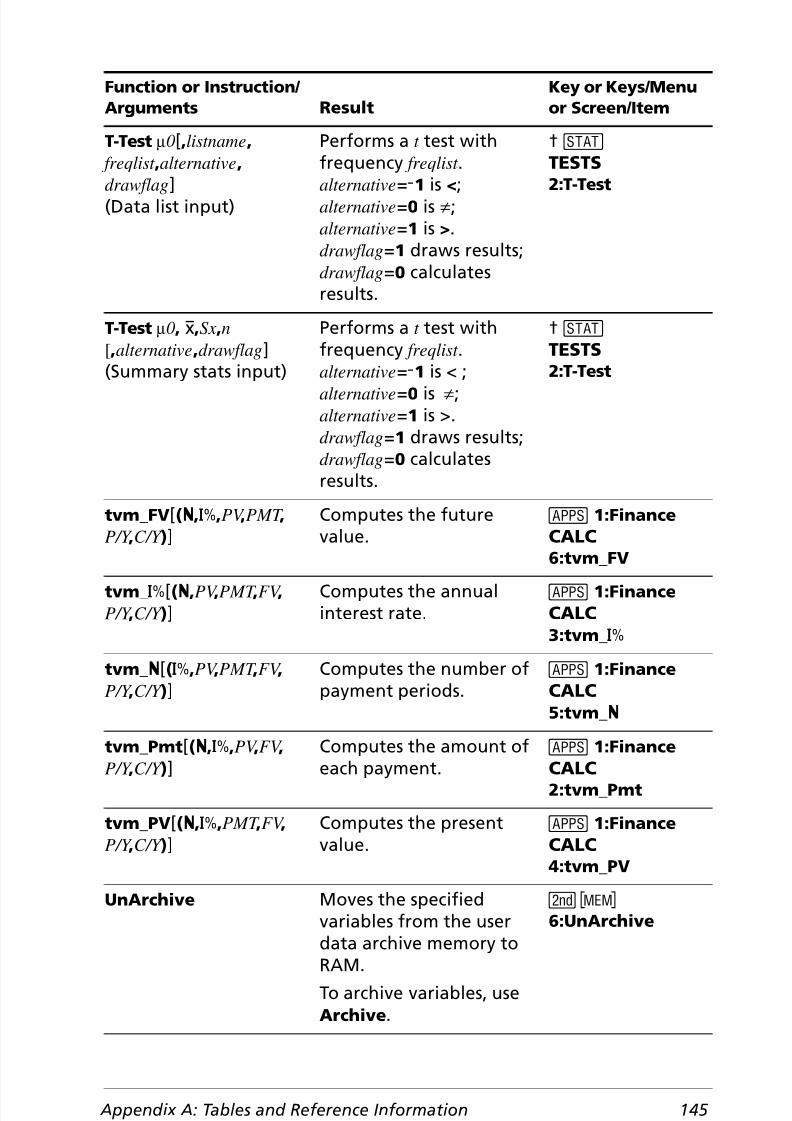
8/4/2019 Ti Plus Guidebook Part1 En
http://slidepdf.com/reader/full/ti-plus-guidebook-part1-en 151/198
Appendix A: Tables and Reference Information 145
T-Test m0[,listname , freqlist ,alternative ,
drawflag ](Data list input)
Performs a t test withfrequency freqlist .
alternative =L1 is <;alternative =0 is ƒ ;alternative =1 is >.drawflag =1 draws results;drawflag =0 calculatesresults.
† …TESTS
2:T-Test
T-Test m0, v,Sx,n[,alternative ,drawflag ]
(Summary stats input)
Performs a t test withfrequency freqlist .
alternative =L1 is < ;alternative =0 is ă;alternative =1 is >.drawflag =1 draws results;drawflag =0 calculatesresults.
† …TESTS
2:T-Test
tvm_FV [(Ú,æ ,PV ,PMT ,P/Y ,C/Y )]
Computes the futurevalue.
Π1:FinanceCALC6:tvm_FV
tvm_ æ [(Ú,PV ,PMT ,FV ,P/Y ,C/Y )]
Computes the annualinterest rate.
Œ 1:FinanceCALC3:tvm_ æ
tvm_ Ú[(æ ,PV ,PMT ,FV ,P/Y ,C/Y )]
Computes the number ofpayment periods.
Œ 1:FinanceCALC5:tvm_ Ú
tvm_Pmt [(Ú,æ ,PV ,FV ,P/Y ,C/Y )]
Computes the amount ofeach payment.
Π1:FinanceCALC2:tvm_Pmt
tvm_PV [(Ú,æ ,PMT ,FV ,P/Y ,C/Y )]
Computes the presentvalue.
Π1:FinanceCALC4:tvm_PV
UnArchive Moves the specifiedvariables from the user
data archive memory toRAM.To archive variables, useArchive .
y L 6:UnArchive
Function or Instruction/ Arguments Result
Key or Keys/Menuor Screen/Item

8/4/2019 Ti Plus Guidebook Part1 En
http://slidepdf.com/reader/full/ti-plus-guidebook-part1-en 152/198
146 Appendix A: Tables and Reference Information
uvAxes Sets sequence graphs toplot u( n) on the x-axis and
v( n) on the y-axis.
† y . uv
uwAxes Sets sequence graphs toplot u( n) on the x-axis andw( n) on the y-axis.
† y . uw
1-Var Stats [ Xlistname , freqlist ]
Performs one-variableanalysis on the data in
Xlistname with frequency freqlist .
…CALC 1:1-Var Stats
2-Var Stats [ Xlistname ,Ylistname , freqlist ]
Performs two-variableanalysis on the data in
Xlistname and Ylistname with frequency freqlist .
…CALC2:2-Var Stats
variance( list [, freqlist ]) Returns the variance ofthe elements in list withfrequency freqlist .
y 9 MATH 8:variance(
Vertical x Draws a vertical line at x. y < DRAW4:Vertical
vwAxes Sets sequence graphs toplot v( n) on the x-axis andw( n) on the y-axis.
† y . vw
Web Sets sequence graphs totrace as webs.
† y .Web
:While condition:commands :End:command
Executes commands whilecondition is true.
†CTL5:While
valueA xor valueB Returns 1 if only valueA orvalueB = 0. valueA andvalueB can be real
numbers, expressions, orlists.
y : LOGIC3:xor
Function or Instruction/ Arguments Result
Key or Keys/Menuor Screen/Item

8/4/2019 Ti Plus Guidebook Part1 En
http://slidepdf.com/reader/full/ti-plus-guidebook-part1-en 153/198
Appendix A: Tables and Reference Information 147
ZBox Displays a graph, lets youdraw a box that defines a
new viewing window,and updates the window.
† qZOOM
1:ZBox
ZDecimal Adjusts the viewingwindow so that @X=0.1 and @Y=0.1 , and displaysthe graph screen with theorigin centered on thescreen.
† qZOOM4:ZDecimal
ZInteger Redefines the viewingwindow using thesedimensions:@X=1 Xscl=10@Y=1 Yscl=10
† qZOOM8:ZInteger
ZInterval s [,listname , freqlist ,confidence level ](Data list input)
Computes a z confidenceinterval.
† …TESTS7:ZInterval
ZInterval s ,v,n[,confidence level ](Summary stats input)
Computes a z confidenceinterval.
† …TESTS7:ZInterval
Zoom In Magnifies the part of thegraph that surrounds thecursor location.
† q ZOOM2:Zoom In
Zoom Out Displays a greater portion
of the graph, centered onthe cursor location.
† q
ZOOM3:Zoom Out
ZoomFit Recalculates Ymin andYmax to include theminimum and maximumY values, between Xmin and Xmax , of theselected functions and
replots the functions.
† qZOOM0:ZoomFit
ZoomRcl Graphs the selectedfunctions in a user-defined viewing window.
† qMEMORY3:ZoomRcl
Function or Instruction/ Arguments Result
Key or Keys/Menuor Screen/Item

8/4/2019 Ti Plus Guidebook Part1 En
http://slidepdf.com/reader/full/ti-plus-guidebook-part1-en 154/198
148 Appendix A: Tables and Reference Information
ZoomStat Redefines the viewingwindow so that all
statistical data points aredisplayed.
† qZOOM
9:ZoomStat
ZoomSto Immediately stores thecurrent viewing window.
† qMEMORY2:ZoomSto
ZPrevious Replots the graph usingthe window variables ofthe graph that wasdisplayed before youexecuted the last ZOOM instruction.
† qMEMORY1:ZPrevious
ZSquare Adjusts the X or Y window settings so thateach pixel represents anequal width and height inthe coordinate system,
and updates the viewingwindow.
† qZOOM5:ZSquare
ZStandard Replots the functionsimmediately, updatingthe window variables tothe default values.
† qZOOM6:ZStandard
Z-Test( m0,s [,listname , freqlist ,alternative ,drawflag ])(Data list input)
Performs a z test withfrequency freqlist .alternative =L1 is <;alternative =0 is ƒ ;alternative =1 is >.drawflag =1 draws results;drawflag =0 calculatesresults.
† …TESTS1:Z-Test(
Z-Test( m0,s ,v,n[,alternative ,drawflag ])(Summary stats input)
Performs a z test.alternative =L1 is <;alternative =0 is ƒ ;alternative =1 is >.drawflag =1 draws results;drawflag =0 calculatesresults.
† …TESTS1:Z-Test(
Function or Instruction/ Arguments Result
Key or Keys/Menuor Screen/Item

8/4/2019 Ti Plus Guidebook Part1 En
http://slidepdf.com/reader/full/ti-plus-guidebook-part1-en 155/198
Appendix A: Tables and Reference Information 149
ZTrig Replots the functionsimmediately, updating
the window variables topreset values for plottingtrig functions.
† qZOOM
7:ZTrig
Factorial: value ! Returns factorial of value .PRB4:!
Factorial: list ! Returns factorial of list elements. PRB
4:!
Degrees notation: value ¡ Interprets value asdegrees; designatesdegrees in DMS format.
y ; ANGLE1: ¡
Radian: angle r Interprets angle as radians. y ; ANGLE3: r
Transpose: matrix T Returns a matrix in whicheach element (row,column) is swapped withthe correspondingelement (column, row) ofmatrix .
y > MATH2: T
xthroot x‡ value Returns xthroot of value .MATH5: x‡
xthroot x‡ list Returns xthroot of list elements. MATH
5: x‡
list x‡ value Returns list roots of value .MATH5: x‡
listAx‡ listB Returns listA roots of listB .MATH5: x‡
Function or Instruction/ Arguments Result
Key or Keys/Menuor Screen/Item

8/4/2019 Ti Plus Guidebook Part1 En
http://slidepdf.com/reader/full/ti-plus-guidebook-part1-en 156/198
150 Appendix A: Tables and Reference Information
Cube: value 3 Returns the cube of a realor complex number,
expression, list, or squarematrix.
MATH
3: 3
Cube root: 3‡ (value ) Returns the cube root of areal or complex number,expression, or list.
MATH4: 3‡
Equal: valueA =valueB Returns 1 ifvalueA = valueB . Returns 0if valueA ƒ valueB . valueA and valueB can be real orcomplex numbers,expressions, lists, ormatrices.
y : TEST1:=
Not equal:valueA ƒvalueB
Returns 1 ifvalueA ƒ valueB . Returns 0if valueA = valueB . valueA and valueB can be real orcomplex numbers,expressions, lists, ormatrices.
y :TEST2: ƒ
Less than:valueA <valueB
Returns 1 ifvalueA < valueB . Returns 0if valueA ‚ valueB . valueA and valueB can be real orcomplex numbers,expressions, or lists.
y : TEST5:<
Greater than:valueA >valueB
Returns 1 ifvalueA > valueB . Returns 0if valueA valueB . valueA and valueB can be real orcomplex numbers,expressions, or lists.
y : TEST3:>
Less than or equal:valueA valueB Returns 1 ifvalueA valueB . Returns 0if valueA > valueB . valueA and valueB can be real orcomplex numbers,expressions, or lists.
y : TEST
6:
Function or Instruction/ Arguments Result
Key or Keys/Menuor Screen/Item

8/4/2019 Ti Plus Guidebook Part1 En
http://slidepdf.com/reader/full/ti-plus-guidebook-part1-en 157/198
Appendix A: Tables and Reference Information 151
Greater than or equal:valueA ‚ valueB
Returns 1 if valueA ‚ valueB . Returns 0 if
valueA < valueB . valueA andvalueB can be real orcomplex numbers,expressions, or lists.
y : TEST
4: ‚
Inverse: value L1 Returns 1 divided by areal or complex numberor expression.
—
Inverse: list L1 Returns 1 divided by list elements.
—
Inverse: matrix L1 Returns matrix inverted. —
Square: value 2 Returns value multipliedby itself. value can be areal or complex numberor expression.
¡
Square: list 2 Returns list elements
squared.¡
Square: matrix 2 Returns matrix multipliedby itself.
¡
Powers: value ̂power Returns value raised to power . value can be a realor complex number orexpression.
›
Powers: list ̂ power Returns list elementsraised to power .
›
Powers: value ^ list Returns value raised to list elements.
›
Powers: matrix ̂power Returns matrix elementsraised to power .
›
Negation: Lvalue Returns the negative of areal or complex number,expression, list, or matrix.
Ì
Function or Instruction/ Arguments Result
Key or Keys/Menuor Screen/Item

8/4/2019 Ti Plus Guidebook Part1 En
http://slidepdf.com/reader/full/ti-plus-guidebook-part1-en 158/198
152 Appendix A: Tables and Reference Information
Power of ten: 10^( value ) Returns 10 raised to thevalue power. value can be a
real or complex numberor expression.
y G
Power of ten: 10^( list ) Returns a list of 10 raisedto the list power.
y G
Square root: ‡ (value ) Returns square root of areal or complex number,expression, or list.
y C
Multiplication:valueA ä valueB Returns valueA timesvalueB . ¯
Multiplication:value ä list
Returns value times eachlist element.
¯
Multiplication:list ä value
Returns each list elementtimes value .
¯
Multiplication:
listAä listB
Returns listA elements
times listB elements.
¯
Multiplication:value ä matrix
Returns value times matrix elements.
¯
Multiplication:matrixA ä matrixB
Returns matrixA timesmatrixB .
¯
Division: valueA à valueB Returns valueA divided byvalueB .
¥
Division: list àvalue Returns list elementsdivided by value.
¥
Division: value à list Returns value divided bylist elements.
¥
Division: listAà listB Returns listA elementsdivided by listB elements.
¥
Addition: valueA +valueB Returns valueA plus valueB . Ã
Addition: list +value Returns list in which value is added to each list element.
Ã
Function or Instruction/ Arguments Result
Key or Keys/Menuor Screen/Item
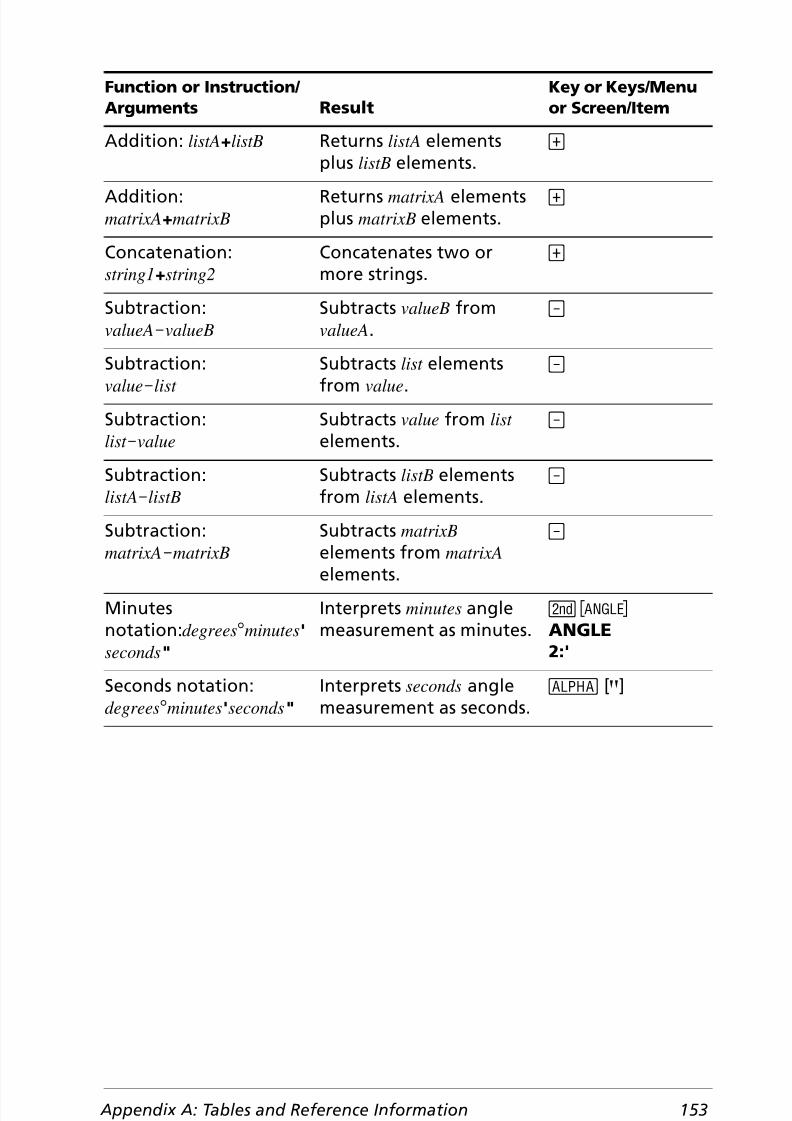
8/4/2019 Ti Plus Guidebook Part1 En
http://slidepdf.com/reader/full/ti-plus-guidebook-part1-en 159/198
Appendix A: Tables and Reference Information 153
Addition: listA+listB Returns listA elementsplus listB elements.
Ã
Addition:matrixA +matrixB
Returns matrixA elementsplus matrixB elements.
Ã
Concatenation:string1 +string2
Concatenates two ormore strings.
Ã
Subtraction:valueA NvalueB
Subtracts valueB fromvalueA .
¹
Subtraction:value Nlist
Subtracts list elementsfrom value .
¹
Subtraction:list Nvalue
Subtracts value from list elements.
¹
Subtraction:listANlistB
Subtracts listB elementsfrom listA elements.
¹
Subtraction:matrixA NmatrixB
Subtracts matrixB elements from matrixA elements.
¹
Minutesnotation: degrees ¡minutes 'seconds "
Interprets minutes anglemeasurement as minutes.
y ; ANGLE2:'
Seconds notation:degrees ¡minutes ' seconds "
Interprets seconds anglemeasurement as seconds.
ƒ [ã]
Function or Instruction/ Arguments Result
Key or Keys/Menuor Screen/Item
8/4/2019 Ti Plus Guidebook Part1 En
http://slidepdf.com/reader/full/ti-plus-guidebook-part1-en 160/198
154 Appendix A: Tables and Reference Information
Variables
User VariablesThe TI-84 Plus uses the variables listed below in various ways. Somevariables are restricted to specific data types.
The variables A through Z and q are defined as real or complex numbers.You may store to them. The TI-84 Plus can update X, Y, R, q, and T duringgraphing, so you may want to avoid using these variables to storenongraphing data.
The variables (list names) L1 through L6 are restricted to lists; you cannotstore another type of data to them.
The variables (matrix names) [A] through [J] are restricted to matrices;you cannot store another type of data to them.
The variables Pic1 through Pic9 and Pic0 are restricted to pictures; youcannot store another type of data to them.
The variables GDB1 through GDB9 and GDB0 are restricted to graphdatabases; you cannot store another type of data to them.
The variables Str1 through Str9 and Str0 are restricted to strings; youcannot store another type of data to them.
Except for system variables, you can store any string of characters,functions, instructions, or variables to the functions Yn, (1 through 9 , and0 ), XnT / YnT (1 through 6 ), rn (1 through 6 ), u( n), v( n), and w( n) directly orthrough the Y= editor. The validity of the string is determined when thefunction is evaluated.
Archive VariablesYou can store data, programs or any variable from RAM to user dataarchive memory where they cannot be edited or deleted inadvertantly.Archiving also allows you to free up RAM for variables that may requireadditional memory. The names of archived variables are preceded by anasterisk “*” indicating they are in user data archive.
System VariablesThe variables below must be real numbers. You may store to them. Sincethe TI-84 Plus can update some of them, as the result of a ZOOM , for
example, you may want to avoid using these variables to storenongraphing data.
• Xmin , Xmax , Xscl , @X, XFact , Tstep , PlotStart , nMin , and otherwindow variables.

8/4/2019 Ti Plus Guidebook Part1 En
http://slidepdf.com/reader/full/ti-plus-guidebook-part1-en 161/198
Appendix A: Tables and Reference Information 155
• ZXmin , ZXmax , ZXscl , ZTstep , ZPlotStart , Zu( nMin) , and otherZOOM variables.
The variables below are reserved for use by the TI-84 Plus. You cannotstore to them.
n , v, Sx , s x , minX , maxX , Gy , Gy 2 , Gxy , a , b , c, RegEQ , x1 , x2 , y1 , z, t , F,c2 , Ç, v1 , Sx1 , n1 , lower , upper , r2 , R2 and other statistical variables.
Statistics Formulas
This section contains statistics formulas for the Logistic and SinReg regressions, ANOVA , 2-Samp ÜTest , and 2-SampTTest .
LogisticThe logistic regression algorithm applies nonlinear recursive least-squarestechniques to optimize the following cost function:
which is the sum of the squares of the residual errors,
This technique attempts to estimate the constants a , b, and c recursivelyto make J as small as possible.
SinReg
The sine regression algorithm applies nonlinear recursive least-squarestechniques to optimize the following cost function:
which is the sum of the squares of the residual errors,
This technique attempts to recursively estimate the constants a , b, c, andd to make J as small as possible.
where: x y N
===
the independent variable listthe dependent variable listthe dimension of the lists
where: x y N
===
the independent variable listthe dependent variable listthe dimension of the lists
J c
1 aebx i–
+----------------------- yi– 2
i 1=
N
∑=
J a sin bx i c+( ) d y i–+[ ]2
i 1=
N
∑=

8/4/2019 Ti Plus Guidebook Part1 En
http://slidepdf.com/reader/full/ti-plus-guidebook-part1-en 162/198

8/4/2019 Ti Plus Guidebook Part1 En
http://slidepdf.com/reader/full/ti-plus-guidebook-part1-en 163/198
Appendix A: Tables and Reference Information 157
2 -Samp ÜTest for the alternative hypothesis .
2 -Samp ÜTest for the alternative hypothesis .
2 -Samp ÜTest for the alternative hypothesis s 1 ƒ s 2. Limits must satisfythe following:
where: [ Lbnd,Ubnd ] = lower and upper limits
The Ü-statistic is used as the bound producing the smallest integral. Theremaining bound is selected to achieve the preceding integral’s equalityrelationship.
2-SampTTestThe following is the definition for the 2-SampTTest . The two-sample t statistic with degrees of freedom df is:
Ü = Û-statistic =
df ( x, , ) = Û pdf ( ) with degrees of freedom df , ,
and p = reported p value
Sx1Sx2--------- 2
n1 1– n2 1– n1 1–
n2 1–
σ 1 σ 2>
p f F
α
∫ x n 1 1 n2 1–,–,( )dx=
σ 1 σ 2<
p f 0
F
∫ x n 1 1 n2 1–,–,( )dx=
p2--- f x n 1 1 n2 1–,–,( ) xd
0
Lbnd
∫ f x n 1 1 n2 1–,–,( ) xd U bnd
∞
∫ = =
t x1 x2–
S----------------=

8/4/2019 Ti Plus Guidebook Part1 En
http://slidepdf.com/reader/full/ti-plus-guidebook-part1-en 164/198
158 Appendix A: Tables and Reference Information
where the computation of S and df are dependent on whether thevariances are pooled. If the variances are not pooled:
otherwise:
and Sxp is the pooled variance.
SSx1
2
n1
----------Sx2
2
n2
----------+=
f
Sx12
n1----------
Sx22
n2----------+
2
1n1 1–--------------
Sx12
n1---------- 2
1n2 1–--------------
Sx22
n2---------- 2
+
--------------------------------------------------------------------------=
Sx pn1 1–( )Sx1
2 n2 1–( )Sx22+
df -------------------------------------------------------------------=
S 1n1----- 1
n2----- Sx p+=
df n 1 n 2 2–+=

8/4/2019 Ti Plus Guidebook Part1 En
http://slidepdf.com/reader/full/ti-plus-guidebook-part1-en 165/198
Appendix A: Tables and Reference Information 159
Financial Formulas
This section contains financial formulas for computing time value ofmoney, amortization, cash flow, interest-rate conversions, and daysbetween dates.
Time Value of Money
where: PMT = 0
The iteration used to compute i:
where: PMT y xC/Y
P/Y I%
ƒ===
==
0C/Y ÷ P/Y (.01 × I% ) ÷ C/Y compounding periods per year
payment periods per yearinterest rate per year
where: x = i
y = P/Y ÷ C/Y
where: k = 0 for end-of-period payments
k = 1 for beginning-of-period payments
i e y x 1+( )ln×( )[ ] 1–=
i –FV PV ÷( ) 1 N ÷( )1–=
0 PV PMT G i1 1 i+( ) N ––
i------------------------------ FV 1 i+( ) N –×+×+=
I % 100 C Y e y x 1+( )ln×( )1–[ ]× ⁄ ×=
G i 1 i k ×+=
N
PMT G i FV i×–×
PMT G i PV i×+×---------------------------------------------- ln
1 i+( )ln----------------------------------------------------------=

8/4/2019 Ti Plus Guidebook Part1 En
http://slidepdf.com/reader/full/ti-plus-guidebook-part1-en 166/198
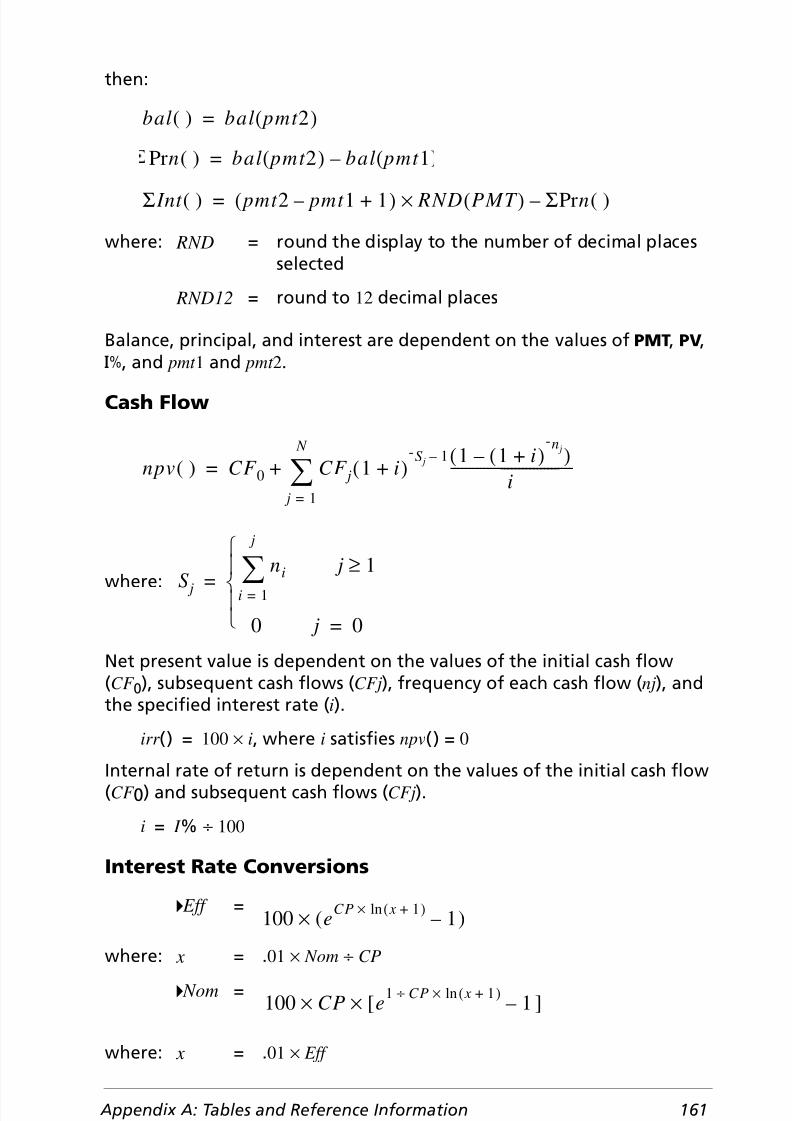
8/4/2019 Ti Plus Guidebook Part1 En
http://slidepdf.com/reader/full/ti-plus-guidebook-part1-en 167/198
Appendix A: Tables and Reference Information 161
then:
Balance, principal, and interest are dependent on the values of PMT, PV,æ , and pmt 1 and pmt 2.
Cash Flow
where:
Net present value is dependent on the values of the initial cash flow(CF 0), subsequent cash flows ( CFj ), frequency of each cash flow ( nj), andthe specified interest rate ( i).
irr () = 100 × i, where i satisfies npv() = 0
Internal rate of return is dependent on the values of the initial cash flow(CF 0) and subsequent cash flows ( CFj ).
i = I % ÷ 100
Interest Rate Conversions
where: RND = round the display to the number of decimal placesselected
RND12 = round to 12 decimal places
4 Eff =
where: x = .01 × Nom ÷ CP
4 Nom =
where: x = .01 × Eff
bal ( ) bal pmt 2( )=
Pr n ( ) bal pmt 2( ) bal pmt 1(–=
Σ Int ( ) pmt 2 pmt 1– 1+( ) RND PMT ( )× Σ Pr n ( )–=
npv ( ) CF 0 CF j 1 i+( )-S j 1– 1 1 i+( )
-n j–( )i
---------------------------------- j 1=
N
∑+=
S jn i
i 1=
j
∑ j 1≥
0 j 0=
=
100 ( eCP x 1+( )ln×1)–×
100 CP [×× e1 CP÷ x 1+( )ln×1 ]–

8/4/2019 Ti Plus Guidebook Part1 En
http://slidepdf.com/reader/full/ti-plus-guidebook-part1-en 168/198
162 Appendix A: Tables and Reference Information
Days between DatesWith the dbd( function, you can enter or compute a date within therange Jan. 1, 1950, through Dec. 31, 2049.
Actual/actual day-count method (assumes actual number of days permonth and actual number of days per year):
dbd ( (days between dates) = Number of Days II - Number of Days I
Eff = effective rate
CP = compounding periods
Nom = nominal rate
Number of Days I = ( Y1-YB) × 365
+ (number of days MB to M 1)
+ DT1
+
Number of Days II = ( Y 2-YB) × 365+ (number of days MB to M 2)
+ DT 2
+
where: M 1 DT 1Y 1
M 2 DT 2Y 2
MB DBYB
=========
month of first dateday of first dateyear of first datemonth of second dateday of second dateyear of second datebase month (January)base day ( 1)base year (first year after leap year)
Y 1 YB–( )4
------------------------
Y 2 YB–( )4
------------------------

8/4/2019 Ti Plus Guidebook Part1 En
http://slidepdf.com/reader/full/ti-plus-guidebook-part1-en 169/198
Appendix B: General Information 163
B
Appendix B:General Information
Battery Information
When to Replace the BatteriesThe TI-84 Plus uses five batteries: four AAA alkaline batteries and oneSR44SW or 303 silver oxide backup battery. The silver oxide batteryprovides auxiliary power to retain memory while you replace the AAAbatteries.
When the battery voltage level drops below a usable level, the TI-84 Plus:
After Message A is first displayed, you can expect the batteries to
function for about one or two weeks, depending on usage. (This one-week to two-week period is based on tests with alkaline batteries; theperformance of other types of batteries may vary.)
If Message B is displayed, you must replace the batteries immediately tosuccessfully download an application.
Replace the silver oxide battery every three or four years.
Effects of Replacing the BatteriesDo not remove both types of batteries (AAA and silver oxide) at thesame time. Do not allow the batteries to lose power completely. If youfollow these guidelines and the steps for replacing batteries, you canreplace either type of battery without losing any information in memory.
Displays this message whenyou turn on the unit.
Displays this message when youattempt to download an application.
Message A Message B
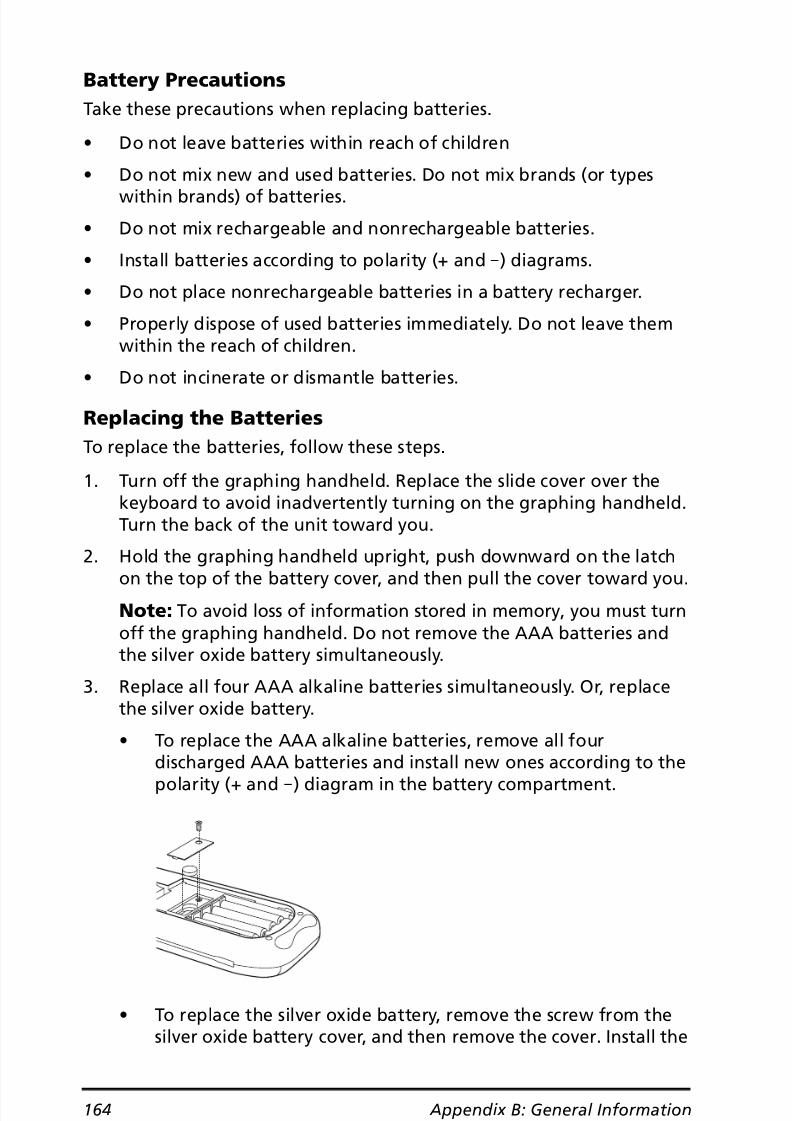
8/4/2019 Ti Plus Guidebook Part1 En
http://slidepdf.com/reader/full/ti-plus-guidebook-part1-en 170/198
164 Appendix B: General Information
Battery PrecautionsTake these precautions when replacing batteries.
• Do not leave batteries within reach of children
• Do not mix new and used batteries. Do not mix brands (or typeswithin brands) of batteries.
• Do not mix rechargeable and nonrechargeable batteries.
• Install batteries according to polarity (+ and N) diagrams.
• Do not place nonrechargeable batteries in a battery recharger.
• Properly dispose of used batteries immediately. Do not leave themwithin the reach of children.
• Do not incinerate or dismantle batteries.
Replacing the BatteriesTo replace the batteries, follow these steps.
1. Turn off the graphing handheld. Replace the slide cover over thekeyboard to avoid inadvertently turning on the graphing handheld.Turn the back of the unit toward you.
2. Hold the graphing handheld upright, push downward on the latchon the top of the battery cover, and then pull the cover toward you.
Note: To avoid loss of information stored in memory, you must turnoff the graphing handheld. Do not remove the AAA batteries andthe silver oxide battery simultaneously.
3. Replace all four AAA alkaline batteries simultaneously. Or, replacethe silver oxide battery.
• To replace the AAA alkaline batteries, remove all fourdischarged AAA batteries and install new ones according to thepolarity (+ and N) diagram in the battery compartment.
• To replace the silver oxide battery, remove the screw from thesilver oxide battery cover, and then remove the cover. Install the
8/4/2019 Ti Plus Guidebook Part1 En
http://slidepdf.com/reader/full/ti-plus-guidebook-part1-en 171/198
Appendix B: General Information 165
new battery, + side up. Replace the cover and secure it with thescrew. Use a SR44SW or 303 (or equivalent) silver oxide battery.
4. Replace the battery compartment cover. Turn the graphing handheldon and adjust the display contrast, if necessary, by pressing y } or† .
Important Things You Need to Know About Your TI-84 Plus
TI-84 Plus ResultsThere may be a number of reasons that your TI-84 Plus is not displayingthe expected results; however, the most common solutions involve order
of operations or mode settings. Your handheld uses an EquationOperating System (EOS) which evaluates the functions in an expression inthe following order:
1. Functions that precede the argument, such as square root, sin(, orlog(
2. Functions that are entered after the argument, such as exponents,factorial, r, ¡ , and conversions
3. Powers and roots, such as 2^5, or 5*square root(32)
4. Permutations (nPr) and combinations (nCr)
5. Multiplication, implied multiplication, and division
6. Addition and subtraction
7. Relational functions, such as > or <
8. Logic operator and
9. Logic operators or and xor
Remember that EOS evaluates from left to right and calculations withinparentheses are evaluated first. You should use parentheses where therules of algebra may not be clear.
If you are using trigonometric functions or performing polar andrectangular conversions, the unexpected results may be caused by anangle mode setting. The Radian and Degree angle mode settings controlhow the TI-84 Plus interprets angle values.
To change the angle mode settings, follow these steps:
1. Press z to display the Mode settings.
2. Select Degree or Radian .
3. Press Í to save the angle mode setting.

8/4/2019 Ti Plus Guidebook Part1 En
http://slidepdf.com/reader/full/ti-plus-guidebook-part1-en 172/198
166 Appendix B: General Information
ERR:DIM MISMATCH ErrorYour TI-84 Plus displays the ERR:DIM MISMATCH error if you are trying toperform an operation that references one or more lists or matrices whosedimensions do not match. For example, multiplying L1*L2, whereL1={1,2,3,4,5} and L2={1,2} produces an ERR:DIM MISMATCH errorbecause the number of elements in L1 and L2 do not match.
ERR:INVALID DIM ErrorThe ERR:INVALID DIM error message may occur if you are trying to grapha function that does not involve the stat plot features. The error can becorrected by turning off the stat plots. To turn the stat plots off, pressy , and then select 4:PlotsOff .
Contrast FeatureIf the contrast setting is too dark (set to 9) or too dim (set to 0) the unitmay appear as if it is malfunctioning or turned off. To adjust the contrast,press and release y , and then press and hold } or † .
TI-84 Plus Identification CodeYour graphing handheld has a unique identification (ID) code that youshould record and keep. You can use this 14 digit ID to register yourhandheld at education.ti.com or identify your handheld in the event thatit is lost or stolen. A valid ID includes numbers 0 through 9 and the lettersA through F.
You can view the handheld’s Operating System, Product Number, ID, andCertificate Revision Number from the About screen. To display the About screen, press y L and then select 1:About .
Your unique product ID code: _____________________________
8/4/2019 Ti Plus Guidebook Part1 En
http://slidepdf.com/reader/full/ti-plus-guidebook-part1-en 173/198
Appendix B: General Information 167
BackupsYour TI-84 Plus is similar to a computer, in that it stores files and Appsthat are important to you. It is always a good idea to back up yourgraphing handheld device files and Apps using the TI Connect™ softwareand a USB computer cable. You can find the specific procedures forbacking up your handheld’s device files and Apps in the TI Connect™Help file.
AppsTI-84 Plus Software Applications (Apps) is software that you can add toyour handheld in the same way you would add software to yourcomputer. Apps let you customize your handheld for peak performancein specific areas of study. You can find apps for the TI-84 Plus at the TI
Online Store at education.ti.com.TI-Cares KnowledgeBaseThe TI-Cares KnowledgeBase provides 24-hour access through the Web tofind answers to frequently asked questions. The TI-Cares KnowledgeBasesearches its repository of known solutions and presents you with thesolutions that are most likely to solve your problem. You can search theTI-Cares KnowledgeBase at education.ti.com/support.
In Case of Difficulty
Handling a DifficultyTo handle a difficulty, follow these steps.
1. If you cannot see anything on the screen, you may need to adjust thegraphing handheld contrast.
To darken the screen, press and release y , and then press and hold} until the display is sufficiently dark.To lighten the screen, press and release y , and then press and hold† until the display is sufficiently light.
2. If an error menu is displayed, follow these steps:
• Note the error type ( ERR:error type ).
• Select 2:GOTO , if it is available. The previous screen is displayedwith the cursor at or near the error location.
• Deteremine the error.
• Correct the expression.
Refer to the Error Conditions table for details about specific errors, ifnecessary.

8/4/2019 Ti Plus Guidebook Part1 En
http://slidepdf.com/reader/full/ti-plus-guidebook-part1-en 174/198
168 Appendix B: General Information
3. If the busy indicator (dotted line) is displayed, a graph or programhas been paused; the TI-84 Plus is waiting for input. Press Í tocontinue or press É to break.
4. If a checkerboard cursor ( # ) is displayed, then either you haveentered the maximum number of characters in a prompt, or memoryis full. If memory is full:
• Press y L 2 to display the MEMORY MANAGEMENT / DELETE menu.
• Select the type of data you want to delete, or select 1:All for alist of all variables of all types. A screen is displayed listing eachvariable of the type you selected and the number of bytes eachvariable is using.
• Press } and † to move the selection cursor ( 4) next to the itemyou want to delete, and then press { .
5. If the graphing handheld does not seem to work at all, be sure thealkaline batteries are fresh and that they are installed properly.
6. If the TI-84 Plus does not function even though you are sure that thebatteries are fresh, you can try manually resetting it.
• Remove all of the AAA batteries from the graphing handheld.
• Press and hold the É key for ten seconds.
• Replace the batteries.
• Turn on the unit.
When you reset your graphing handheld, the contrast sometimeschanges. If the screen is faded or blank, adjust the contrast bypressing y and releasing } or † .
7. If the above solutions do not work you can reset all of the memory.The RAM, user data archive memory, and system variables arerestored to factory settings when you reset all memory. Allnonsystem variables, applications (Apps), and programs are deleted.
• Press y L to display the MEMORY menu.
• Select 7:Reset to display the RAM ARCHIVE ALL menu.
• Press ~ ~ to display the ALL menu.
• Select 1:All Memory to display the RESET MEMORY menu.
• To continue with the reset, select 2:Reset . The messageMem cleared is displayed on the home screen.

8/4/2019 Ti Plus Guidebook Part1 En
http://slidepdf.com/reader/full/ti-plus-guidebook-part1-en 175/198
Appendix B: General Information 169
Error ConditionsWhen the TI-84 Plus detects an error, it returns an error message as amenu title, such as ERR:SYNTAX or ERR:DOMAIN . This table containseach error type, possible causes, and suggestions for correction. The error
types listed in this table are each preceded by ERR: on your graphinghandheld display. For example, you will see ERR:ARCHIVED as a menutitle when your graphing handheld detects an ARCHIVED error type.
Error Type Possible Causes and Suggested Remedies
ARCHIVED You have attempted to use, edit, or delete anarchived variable. For example, the expressiondim(L1) produces an error if L1 is archived.
ARCHIVE FULL You have attempted to archive a variable and thereis not enough space in archive to receive it.
ARGUMENT A function or instruction does not have the correctnumber of arguments. See Appendix A for functionand instruction syntax.Appendix A displays the arguments and punctuationneeded to execute the function or instruction. Forexample, stdDev( list [, freqlist ]) is a function of theTI-84 Plus. The arguments are shown in italics. Thearguments in brackets are optional and you neednot type them. You must also be sure to separatemultiple arguments with a comma (,). For example,stdDev( list [, freqlist ]) might be entered as stdDev(L1)or stdDev(L1,L2) since the frequency list or freqlist isoptional.
BAD ADDRESS You have attempted to send or receive anapplication and an error (e.g. electrical interference)has occurred in the transmission.
BAD GUESS • In a CALC operation, you specified a Guess thatis not between Left Bound and Right Bound .
• For the solve( function or the equation solver,you specified a guess that is not between lower and upper .
• Your guess and several points around it areundefined.Examine a graph of the function. If the equation hasa solution, change the bounds and/or the initialguess.

8/4/2019 Ti Plus Guidebook Part1 En
http://slidepdf.com/reader/full/ti-plus-guidebook-part1-en 176/198
170 Appendix B: General Information
BOUND • In a CALC operation or with Select( , youdefined Left Bound > Right Bound .
• In fMin( , fMax( , solve( , or the equation solver,you entered lower ‚ upper .
BREAK You pressed the É key to break execution of aprogram, to halt a DRAW instruction, or to stopevaluation of an expression.
DATA TYPE You entered a value or variable that is the wrongdata type.
• For a function (including implied multiplication)or an instruction, you entered an argument thatis an invalid data type, such as a complexnumber where a real number is required. SeeAppendix A and the appropriate chapter.
• In an editor, you entered a type that is notallowed, such as a matrix entered as an elementin the stat list editor. See the appropriatechapter.
• You attempted to store an incorrect data type,such as a matrix, to a list.
DIM MISMATCH Your handheld displays the ERR:DIM MISMATCH error if you are trying to perform an operation thatreferences one or more lists or matrices whosedimensions do not match. For example, multiplyingL1*L2, where L1={1,2,3,4,5} and L2={1,2} produces anERR:DIM MISMATCH error because the number of
elements in L1 and L2 do not match.DIVIDE BY 0 • You attempted to divide by zero. This error is
not returned during graphing. The TI-84 Plus allows for undefined values on a graph.
• You attempted a linear regression with a verticalline.
Error Type Possible Causes and Suggested Remedies

8/4/2019 Ti Plus Guidebook Part1 En
http://slidepdf.com/reader/full/ti-plus-guidebook-part1-en 177/198
Appendix B: General Information 171
DOMAIN • You specified an argument to a function orinstruction outside the valid range. This error isnot returned during graphing. The TI-84 Plus
allows for undefined values on a graph. SeeAppendix A.• You attempted a logarithmic or power
regression with a LX or an exponential or powerregression with a LY.
• You attempted to compute GPrn( or GInt( with pmt2 < pmt1 .
DUPLICATE You attempted to create a duplicate group name.Duplicate Name A variable you attempted to transmit cannot be
transmitted because a variable with that namealready exists in the receiving unit.
EXPIRED You have attempted to run an application with alimited trial period which has expired.
Error in Xmit • The TI-84 Plus was unable to transmit an item.
Check to see that the cable is firmly connectedto both units and that the receiving unit is inreceive mode.
• You pressed É to break during transmission.• You attempted to perform a backup from a
TI. 82 to a TI-84 Plus.• You attempted to transfer data (other than L1
through L6) from a TI-84 Plus to a TI .82.
• You attempted to transfer L1 through L6 from aTI-84 Plus to a TI . 82 without using5:Lists to TI82 on the LINK SEND menu.
ID NOT FOUND This error occurs when the SendID command isexecuted but the proper graphing handheld IDcannot be found.
ILLEGAL NEST • You attempted to use an invalid function in anargument to a function, such as seq( withinexpression for seq( .
Error Type Possible Causes and Suggested Remedies

8/4/2019 Ti Plus Guidebook Part1 En
http://slidepdf.com/reader/full/ti-plus-guidebook-part1-en 178/198
172 Appendix B: General Information
INCREMENT • The increment in seq( is 0 or has the wrong sign.This error is not returned during graphing. TheTI-84 Plus allows for undefined values on a
graph.• The increment in a For( loop is 0.
INVALID • You attempted to reference a variable or use afunction where it is not valid. For example, Yn cannot reference Y, Xmin , @X, or TblStart .
• You attempted to reference a variable orfunction that was transferred from the TI . 82 andis not valid for the TI-84 Plus For example, youmay have transferred UnN1 to the TI-84 Plusfrom the TI .82 and then tried to reference it.
• In Seq mode, you attempted to graph a phaseplot without defining both equations of thephase plot.
• In Seq mode, you attempted to graph arecursive sequence without having input the
correct number of initial conditions.• In Seq mode, you attempted to reference terms
other than (nN1) or (nN2) .• You attempted to designate a graph style that is
invalid within the current graph mode.• You attempted to use Select( without having
selected (turned on) at least one xyLine orscatter plot.
INVALID DIM • The ERR:INVALID DIM error message may occurif you are trying to graph a function that doesnot involve the stat plot features. The error canbe corrected by turning off the stat plots. Toturn the stat plots off, press y , andthen select 4:PlotsOff .
• You specified a list dimension as somethingother than an integer between 1 and 999.
• You specified a matrix dimension as somethingother than an integer between 1 and 99.
• You attempted to invert a matrix that is notsquare.
Error Type Possible Causes and Suggested Remedies

8/4/2019 Ti Plus Guidebook Part1 En
http://slidepdf.com/reader/full/ti-plus-guidebook-part1-en 179/198
Appendix B: General Information 173
ITERATIONS • The solve( function or the equation solver hasexceeded the maximum number of permittediterations. Examine a graph of the function. If
the equation has a solution, change the bounds,or the initial guess, or both.• irr( has exceeded the maximum number of
permitted iterations.• When computing æ , the maximum number of
iterations was exceeded.
LABEL The label in the Goto instruction is not defined witha Lbl instruction in the program.
MEMORY Memory is insufficient to perform the instruction orfunction. You must delete items from memorybefore executing the instruction or function.Recursive problems return this error; for example,graphing the equation Y1=Y1 .Branching out of an If / Then , For( , While , or Repeat loop with a Goto also can return this error because
the End statement that terminates the loop is neverreached.
MemoryFull • You are unable to transmit an item because thereceiving unit’s available memory is insufficient.You may skip the item or exit receive mode.
• During a memory backup, the receiving unit’savailable memory is insufficient to receive allitems in the sending unit’s memory. A message
indicates the number of bytes the sending unitmust delete to do the memory backup. Deleteitems and try again.
MODE You attempted to store to a window variable inanother graphing mode or to perform an instructionwhile in the wrong mode; for example, DrawInv in agraphing mode other than Func .
Error Type Possible Causes and Suggested Remedies
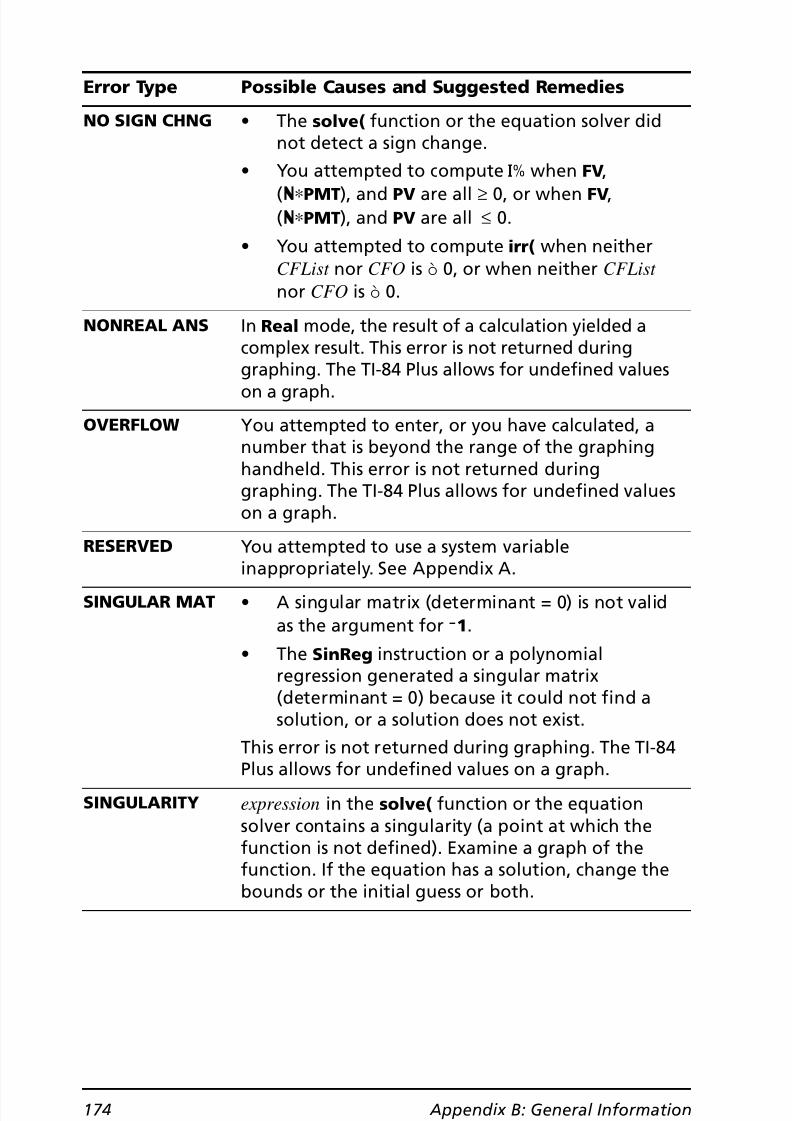
8/4/2019 Ti Plus Guidebook Part1 En
http://slidepdf.com/reader/full/ti-plus-guidebook-part1-en 180/198
174 Appendix B: General Information
NO SIGN CHNG • The solve( function or the equation solver didnot detect a sign change.
• You attempted to compute æ when FV,(Ú…PMT ), and PV are all ‚ 0, or when FV,(Ú…PMT ), and PV are all _ 0.
• You attempted to compute irr( when neitherCFList nor CFO is • 0, or when neither CFList nor CFO is • 0.
NONREAL ANS In Real mode, the result of a calculation yielded acomplex result. This error is not returned during
graphing. The TI-84 Plus allows for undefined valueson a graph.
OVERFLOW You attempted to enter, or you have calculated, anumber that is beyond the range of the graphinghandheld. This error is not returned duringgraphing. The TI-84 Plus allows for undefined valueson a graph.
RESERVED You attempted to use a system variable
inappropriately. See Appendix A.SINGULAR MAT • A singular matrix (determinant = 0) is not valid
as the argument for L1 .• The SinReg instruction or a polynomial
regression generated a singular matrix(determinant = 0) because it could not find asolution, or a solution does not exist.
This error is not returned during graphing. The TI-84Plus allows for undefined values on a graph.
SINGULARITY expression in the solve( function or the equationsolver contains a singularity (a point at which thefunction is not defined). Examine a graph of thefunction. If the equation has a solution, change thebounds or the initial guess or both.
Error Type Possible Causes and Suggested Remedies
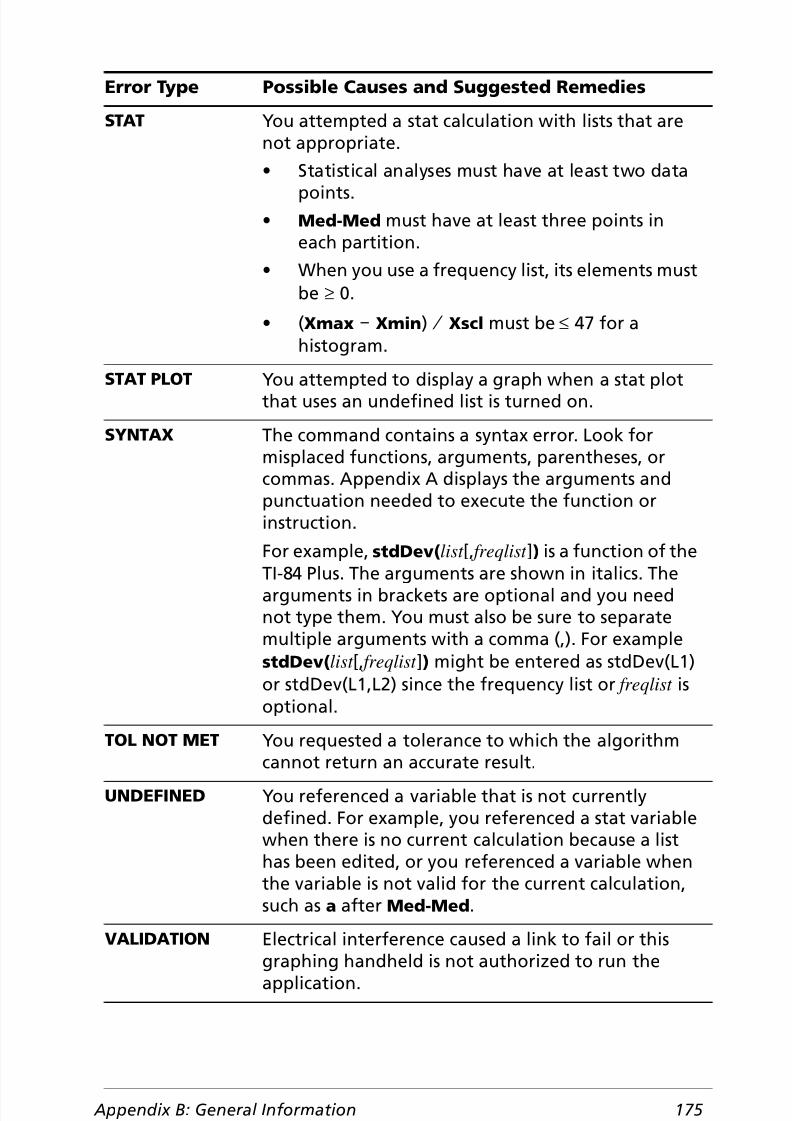
8/4/2019 Ti Plus Guidebook Part1 En
http://slidepdf.com/reader/full/ti-plus-guidebook-part1-en 181/198
Appendix B: General Information 175
STAT You attempted a stat calculation with lists that arenot appropriate.• Statistical analyses must have at least two data
points.• Med-Med must have at least three points in
each partition.• When you use a frequency list, its elements must
be ‚ 0.
• ( Xmax N Xmin ) à Xscl must be ‚ 47 for ahistogram.
STAT PLOT You attempted to display a graph when a stat plotthat uses an undefined list is turned on.
SYNTAX The command contains a syntax error. Look formisplaced functions, arguments, parentheses, orcommas. Appendix A displays the arguments andpunctuation needed to execute the function orinstruction.For example, stdDev( list [, freqlist ]) is a function of theTI-84 Plus. The arguments are shown in italics. Thearguments in brackets are optional and you neednot type them. You must also be sure to separatemultiple arguments with a comma (,). For examplestdDev( list [, freqlist ]) might be entered as stdDev(L1)or stdDev(L1,L2) since the frequency list or freqlist isoptional.
TOL NOT MET You requested a tolerance to which the algorithmcannot return an accurate result.
UNDEFINED You referenced a variable that is not currentlydefined. For example, you referenced a stat variablewhen there is no current calculation because a listhas been edited, or you referenced a variable whenthe variable is not valid for the current calculation,such as a after Med-Med .
VALIDATIONElectrical interference caused a link to fail or thisgraphing handheld is not authorized to run theapplication.
Error Type Possible Causes and Suggested Remedies

8/4/2019 Ti Plus Guidebook Part1 En
http://slidepdf.com/reader/full/ti-plus-guidebook-part1-en 182/198
176 Appendix B: General Information
Accuracy Information
Computational AccuracyTo maximize accuracy, the TI-84 Plus carries more digits internally than itdisplays. Values are stored in memory using up to 14 digits with a two-digit exponent.
• You can store a value in the window variables using up to 10 digits(12 for Xscl , Yscl , Tstep , and qstep ).
• Displayed values are rounded as specified by the mode setting with amaximum of 10 digits and a two-digit exponent.
VARIABLE You have tried to archive a variable that cannot bearchived or you have tried to unarchive anapplication or group.
Examples of variables that cannot be archivedinclude:• Real numbers LRESID, R, T, X, Y , Theta , Statistic
variables under Vars , STATISTICS menu, Yvars ,and the AppIdList .
VERSION You have attempted to receive an incompatiblevariable version from another graphing handheld.
WINDOW RANGE A problem exists with the window variables.• You defined Xmax Xmin or Ymax Ymin .
• You defined qmax qmin and qstep > 0 (or viceversa).
• You attempted to define Tstep=0 .• You defined Tmax Tmin and Tstep > 0 (or vice
versa).
• Window variables are too small or too large tograph correctly. You may have attempted tozoom in or zoom out to a point that exceeds theTI-84 Plus’s numerical range.
ZOOM • A point or a line, instead of a box, is defined inZBox.
• A ZOOM operation returned a math error.
Error Type Possible Causes and Suggested Remedies

8/4/2019 Ti Plus Guidebook Part1 En
http://slidepdf.com/reader/full/ti-plus-guidebook-part1-en 183/198
Appendix B: General Information 177
• RegEQ displays up to 14 digits in Float mode. Using a fixed-decimalsetting other than Float causes RegEQ results to be rounded andstored with the specified number of decimal places.
Xmin is the center of the leftmost pixel, Xmax is the center of the next-to-the-rightmost pixel. (The rightmost pixel is reserved for the busyindicator.) @X is the distance between the centers of two adjacent pixels.
• In Full screen mode, @X is calculated as ( Xmax N Xmin ) à 94. In G-T split-screen mode, @X is calculated as ( Xmax N Xmin ) à 46.
• If you enter a value for @X from the home screen or a program inFull screen mode, Xmax is calculated as Xmin + @X É…94. In G-T split-screen mode, Xmax is calculated as Xmin + @X É…46.
Ymin is the center of the next-to-the-bottom pixel; Ymax is the center ofthe top pixel. @Y is the distance between the centers of two adjacentpixels.
• In Full screen mode, @Y is calculated as ( Ymax N Ymin ) à 62. In Horiz split-screen mode, @Y is calculated as ( Ymax N Ymin ) à 30. In G-T split-screen mode, @Y is calculated as ( Ymax N Ymin ) à 50.
• If you enter a value for @Y from the home screen or a program inFull screen mode, Ymax is calculated as Ymin + @Y É…62. In Horiz split-screen mode, Ymax is calculated as Ymin + @Y …30. In G-T split-screen mode, Ymax is calculated as Ymin + @Y É …50.
Cursor coordinates are displayed as eight-character numbers (which mayinclude a negative sign, decimal point, and exponent) when Float modeis selected. X and Y are updated with a maximum accuracy of eightdigits.
minimum and maximum on the CALCULATE menu are calculated with atolerance of 1 âL5; ‰f(x)dx is calculated at 1 âL3. Therefore, the result
displayed may not be accurate to all eight displayed digits. For mostfunctions, at least five accurate digits exist. For fMin( , fMax( , and fnInt( on the MATH menu and solve( in the CATALOG , the tolerance can bespecified.
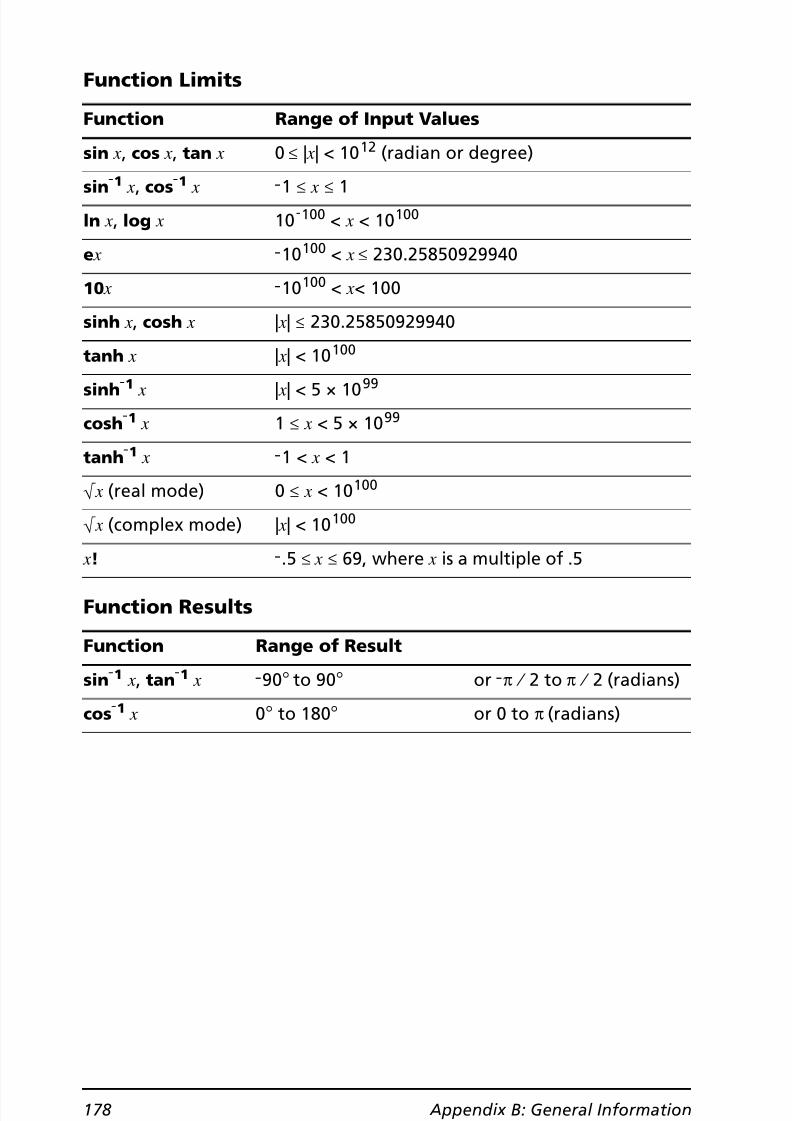
8/4/2019 Ti Plus Guidebook Part1 En
http://slidepdf.com/reader/full/ti-plus-guidebook-part1-en 184/198
178 Appendix B: General Information
Function Limits
Function Results
Function Range of Input Values
sin x, cos x, tan x 0 | x| < 10 12 (radian or degree)
sinL1
x, cosL1
x L1 x 1ln x, log x 10 L100 < x < 10 100
e x L10 100 < x 230.25850929940
10 x L10 100 < x< 100
sinh x, cosh x | x| 230.25850929940
tanh x | x| < 10 100
sinh L1 x | x| < 5 × 10 99
cosh L1 x 1 x < 5 × 10 99
tanh L1 x L1 < x < 1
‡ x (real mode) 0 x < 10 100
‡ x (complex mode) | x| < 10 100
x! L.5 _ x 69, where x is a multiple of .5
Function Range of Result
sin L1 x, tan L1 x L90¡ to 90 ¡ or Lp à2 to p à 2 (radians)
cos L1 x 0¡ to 180 ¡ or 0 to p (radians)

8/4/2019 Ti Plus Guidebook Part1 En
http://slidepdf.com/reader/full/ti-plus-guidebook-part1-en 185/198
Appendix B: General Information 179
Texas Instruments (TI) Support and Service
For General Information
For Technical Support
For Product (hardware) ServiceCustomers in the U.S., Canada, Mexico, Puerto Rico and VirginIslands: Always contact TI Customer Support before returning aproduct for service.
All other customers: Refer to the leaflet enclosed with this product(hardware) or contact your local TI retailer/distributor.
Home Page: education.ti.com
KnowledgeBase andE-mail Inquires: education.ti.com/support
Phone: (800) TI-CARES; (800) 842-2737For U.S., Canada, Mexico, Puerto Rico, andVirgin Islands only
InternationalInformation:
education.ti.com/support (Click theInternational Information link.)
KnowledgeBase andSupport by E-mail: education.ti.com/support
Phone(not toll-free): (972) 917-8324

8/4/2019 Ti Plus Guidebook Part1 En
http://slidepdf.com/reader/full/ti-plus-guidebook-part1-en 186/198
180 Appendix B: General Information
Texas Instruments (TI) Warranty Information
Customers in the U.S. and Canada Only
One-Year Limited Warranty for Commercial Electronic Product
This Texas Instruments (“TI”) electronic product warranty extends only to theoriginal purchaser and user of the product.
Warranty Duration. This TI electronic product is warranted to the original pur-chaser for a period of one (1) year from the original purchase date.
Warranty Coverage. This TI electronic product is warranted against defec-tive materials and construction. THIS WARRANTY IS VOID IF THE PRODUCTHAS BEEN DAMAGED BY ACCIDENT OR UNREASONABLE USE, NEGLECT,IMPROPER SERVICE, OR OTHER CAUSES NOT ARISING OUT OF DEFECTSIN MATERIALS OR CONSTRUCTION.
Warranty Disclaimers. ANY IMPLIED WARRANTIES ARISING OUT OF THISSALE, INCLUDING BUT NOT LIMITED TO THE IMPLIED WARRANTIES OFMERCHANTABILITY AND FITNESS FOR A PARTICULAR PURPOSE, ARELIMITED IN DURATION TO THE ABOVE ONE-YEAR PERIOD. TEXASINSTRUMENTS SHALL NOT BE LIABLE FOR LOSS OF USE OF THE PROD-UCT OR OTHER INCIDENTAL OR CONSEQUENTIAL COSTS, EXPENSES,OR DAMAGES INCURRED BY THE CONSUMER OR ANY OTHER USER.
Some states/provinces do not allow the exclusion or limitation of implied war-ranties or consequential damages, so the above limitations or exclusionsmay not apply to you.
Legal Remedies. This warranty gives you specific legal rights, and you mayalso have other rights that vary from state to state or province to province.
Warranty Performance. During the above one (1) year warranty period, yourdefective product will be either repaired or replaced with a reconditionedmodel of an equivalent quality (at TI’s option) when the product is returned,postage prepaid, to Texas Instruments Service Facility. The warranty of therepaired or replacement unit will continue for the warranty of the original unitor six (6) months, whichever is longer. Other than the postage requirement,no charge will be made for such repair and/or replacement. TI strongly rec-
ommends that you insure the product for value prior to mailing.Software. Software is licensed, not sold. TI and its licensors do not warrantthat the software will be free from errors or meet your specific requirements.All software is provided “AS IS.”
Copyright. The software and any documentation supplied with this productare protected by copyright.
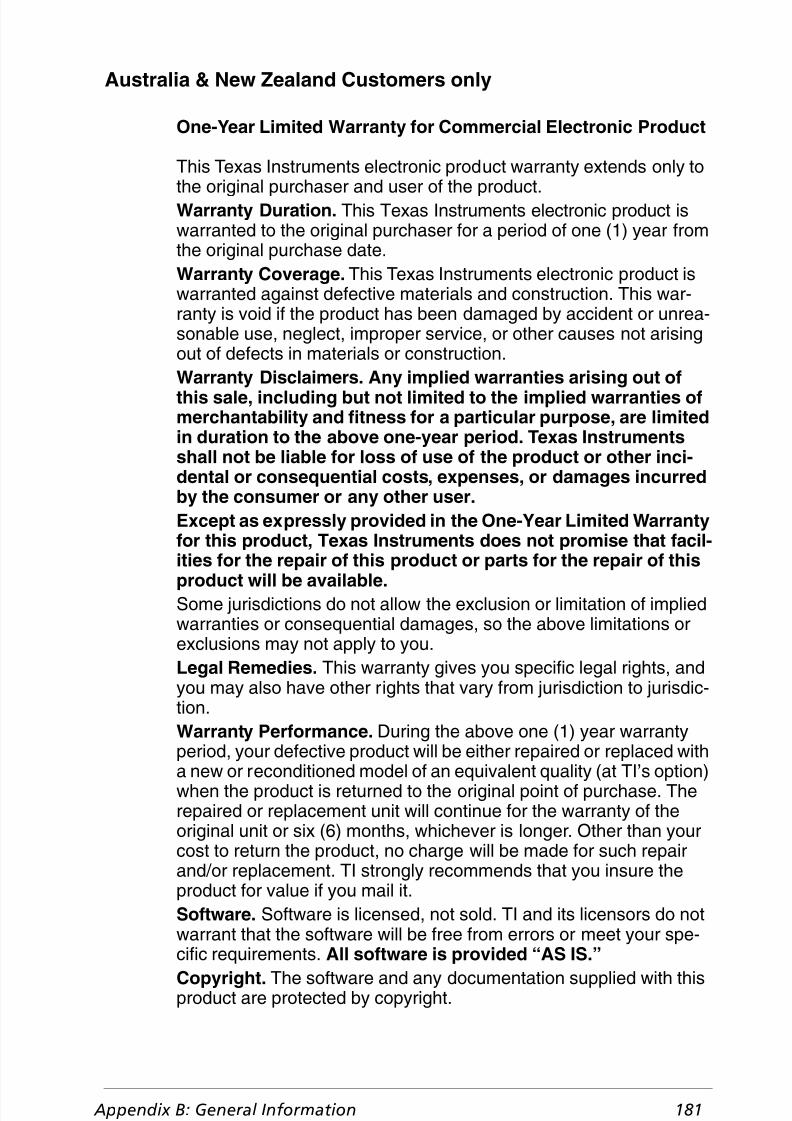
8/4/2019 Ti Plus Guidebook Part1 En
http://slidepdf.com/reader/full/ti-plus-guidebook-part1-en 187/198
Appendix B: General Information 181
Australia & New Zealand Customers only
One-Year Limited Warranty for Commercial Electronic Product
This Texas Instruments electronic product warranty extends only to
the original purchaser and user of the product.Warranty Duration. This Texas Instruments electronic product iswarranted to the original purchaser for a period of one (1) year fromthe original purchase date.Warranty Coverage. This Texas Instruments electronic product iswarranted against defective materials and construction. This war-ranty is void if the product has been damaged by accident or unrea-sonable use, neglect, improper service, or other causes not arisingout of defects in materials or construction.
Warranty Disclaimers. Any implied warranties arising out ofthis sale, including but not limited to the implied warranties ofmerchantability and fitness for a particular purpose, are limitedin duration to the above one-year period. Texas Instrumentsshall not be liable for loss of use of the product or other inci-dental or consequential costs, expenses, or damages incurredby the consumer or any other user.Except as expressly provided in the One-Year Limited Warrantyfor this product, Texas Instruments does not promise that facil-
ities for the repair of this product or parts for the repair of thisproduct will be available.Some jurisdictions do not allow the exclusion or limitation of impliedwarranties or consequential damages, so the above limitations orexclusions may not apply to you.Legal Remedies. This warranty gives you specific legal rights, andyou may also have other rights that vary from jurisdiction to jurisdic-tion.Warranty Performance. During the above one (1) year warranty
period, your defective product will be either repaired or replaced witha new or reconditioned model of an equivalent quality (at TI’s option)when the product is returned to the original point of purchase. Therepaired or replacement unit will continue for the warranty of theoriginal unit or six (6) months, whichever is longer. Other than yourcost to return the product, no charge will be made for such repairand/or replacement. TI strongly recommends that you insure theproduct for value if you mail it.Software. Software is licensed, not sold. TI and its licensors do notwarrant that the software will be free from errors or meet your spe-cific requirements. All software is provided “AS IS.”Copyright. The software and any documentation supplied with thisproduct are protected by copyright.
8/4/2019 Ti Plus Guidebook Part1 En
http://slidepdf.com/reader/full/ti-plus-guidebook-part1-en 188/198
182 Appendix B: General Information
All Other CustomersFor information about the length and terms of the warranty, refer to yourpackage and/or to the warranty statement enclosed with this product, or con-tact your local Texas Instruments retailer/distributor.

8/4/2019 Ti Plus Guidebook Part1 En
http://slidepdf.com/reader/full/ti-plus-guidebook-part1-en 189/198
Index
183
Symbols( - (degrees notation) 149
( - (negation) 151( – (subtraction) 153( ! (factorial) 149( ! Store 143( ! dim( (assign dimension) 117 ( # (not equal to) 150( $ ( (square root) 152( ' (minutes notation) 153( ) Int( (sum of interest) 125
( ) Prn( (sum of principal) 132( * (multiplication) 152( *row( 136 ( *row+( 136 ( + (addition) 152( + (concatenation) 153( / (division) 152( / (inverse) 151( < (less than) 150( = (equal-to relational test)
150( ̂ (power) 151( { (less than or equal to) 150( | (greater than or equal to) 151( ² (square) 151( ³ (cube) 150( ³$ ( (cube root) 150( 4Dec (to decimal conversion) 116 ( 4DMS (to degrees/minutes/seconds)
117
( 4Frac (to fraction) 121( 4Nom( (to nominal interest rate) 129( 4Polar (to polar) 132( 4Rect (to rectangular) 136 ( j (subtraction key) 13( k (negation key) 13( q (Zoom key) 23( t (alphabetic key) 3 , 4( u (Clear key)
4
( v (Store key) 30( y (second modifier key) 3( y 5 key command 4( > (greater than) 150
Numerics10^( (power of ten) 152
1-PropZInt (one-proportion z confidence interval) 133
1-PropZTest (one-proportion z test) 133
1-Var Stats (one-variable statistics) 146
2-PropZInt (two-proportion z confidence interval) 133
2-PropZTest (two-proportion z test) 133
2-Samp FTest (two-sample F-Test) 137
2-SampTInt (two-sample t confidence interval) 137
2-SampTTest (two-sample t test) 138
2-SampZInt (two-sample z confidence interval) 138
2-SampZTest (two-sample z test) 138
2-Var Stats (two-variable statistics) 146
Aa+b i (rectangular complex mode)
112
about 79
abs( (absolute value) 111
accuracy informationcomputational and graphing 176 function limits and results 178
adding complex numbers 28
addition (+) 152
alphabetic characters, entering 4
amortization) Int( (sum of interest) 125
) Prn( (sum of principal) 132
bal( (amortization balance) 113
formula 160and (Boolean operator) 111
angle measure modes 19
angle( 111
ANOVA( (one-way variance analysis) 112 , 156

8/4/2019 Ti Plus Guidebook Part1 En
http://slidepdf.com/reader/full/ti-plus-guidebook-part1-en 190/198
184
Ans (last answer) 81 , 112
applicationsinstalling 44
running 45
Apps 81
AppVars 81
Archive 83 , 112
archive full error 97 , 169
garbage collection 94
memory error 94
archived variables 154
Asm( 112
AsmComp( 112
AsmPrgm( 112
augment( 112
Automatic Power Down™ 2axes, displaying (AxesOn, AxesOff)
112
AxesOff 112
AxesOn 112
Bbacking up calculator memory 104 ,
107 bal( (amortization balance) 113
batteries 163
battery precautions 46
binomcdf( 113
binompdf( 113
block 94
building tables 23
Cχ ²cdf( (chi-square cdf) 113
χ ²pdf( (chi-square pdf) 113
χ ²-Test (chi-square test) 113
calculatinglinear regressions 35
statistical variables 36
cash flowformula 161
irr( (internal rate of return) 125
npv( (net present value) 130
CATALOG, clearing 25
CBL 2™ 101 , 121
CBR™ 101 , 121
changing mode settings 18
check memory 79
checkTmr( (check timer) 114
chi-square cdf ( χ ²cdf( ) 113
chi-square pdf ( χ ²pdf( ) 113
chi-square test ( χ ²(Test) 113
Circle( (draw circle) 114
Clear Entries 79 , 114
clearingall lists (ClrAllLists) 79 , 114
drawing (ClrDraw) 114
entries (Clear Entries) 79 , 114
Home screen 4
home screen (ClrHome) 114
list (ClrList) 114
table (ClrTable) 114
Y= Editor 25
Clock 6
Clock Off 8
Clock On 7
ClockOff, turn clock off 114
ClockOn, turn clock on 114
ClrAllLists (clear all lists) 79 , 114
ClrDraw (clear drawing) 114
ClrHome (clear home screen) 114
ClrList (clear list) 114
ClrTable (clear table) 114
combinations (nCr) 129
compiling an assembly program 112
complexmodes (a+b i, re^ θ i) 20 , 112 , 135
numbers 135
numbers, adding 28
concatenation (+) 153
conj( (conjugate) 114
Connected (plotting mode) 115
connecting two calculators 101 , 105
contact information 179
conversions4Dec (to decimal) 116
4DMS (to degrees/minutes/ seconds) 117
4Frac (to fraction conversion) 121
4Nom (to nominal interest rateconversion) 129
4Polar (to polar conversion) 132
4Rect (to rectangular conversion) 136
decimals to fractions 26

8/4/2019 Ti Plus Guidebook Part1 En
http://slidepdf.com/reader/full/ti-plus-guidebook-part1-en 191/198
185
Equ 4String( (equation-to-stringconversion) 118
List4matr( (list-to-matrixconversion) 127
Matr 4list( (matrix-to-list
conversion) 127
P4Rx(, P4Ry( (polar-to-rectangular conversion) 134
R4Pr(, R4Pθ( (rectangular-to-polarconversion) 137
String 4Equ( (string-to-equationconversion) 143
convert time, timeCnv( ) 144
CoordOff 115
CoordOn 115
cos( (cosine) 115
cos / ( (arccosine) 115
cosh( (hyperbolic cosine) 115
cosh / ( (hyperbolic arccosine) 115
cosine (cos( ) 115
creating new matrices 37
cube (³) 150
cube root (³ $ ( ) 150
cubic regression (CubicReg) 115
CubicReg (cubic regression) 115
cumSum( (cumulative sum) 115
cumulative sum (cumSum( ) 115
customer support and service 179
DdayOfWk( (day of week) 116
days between dates (dbd( ) 116 , 162
dbd( (days between dates) 116 , 162decimal modes 19
decimals to fractions, changing 26
decrement and skip (DS<( ) 118
defragmenting 94
Degree angle mode 19 , 116
degrees notation ( -) 149
delete variable contents (DelVar) 116
deleting expressions 11deleting items from memory 81
DependAsk 116
DependAuto 116
det( (determinant) 116
determinant (det( ) 116
determining data in lists 32
DiagnosticOff 116
DiagnosticOn 117
dim( (dimension) 117
dimensioning a list or matrix 117
Disp (display) 117
DispGraph (display graph) 117
displaying graphing plots 34
Displaying the Clock Settings 6
DispTable (display table) 117
distribution functionsbinomcdf( 113
binompdf( 113
χ ²cdf( 113
χ ²pdf( 113
Fcdf( 144
Fpdf( 144
geometcdf( 121
geometpdf( 121
invNorm( 125
normalcdf( 130
normalpdf( 130
poissoncdf( 132
poissonpdf( 132
distribution shading instructionsShade_t( 141
Shade χ ²( 140
Shade F( 141
ShadeNorm( 141
division (/) 152
division, example 14
∆List( 127
DMS (degrees/minutes/seconds entrynotation) 153
Dot (plotting mode) 117
DrawF (draw a function) 118
DrawInv (draw inverse) 118
DS<( (decrement and skip) 118
DuplicateName menu 106
E
E(exponent) 118e^( (exponential) 118
editing expressions 11
End 118
Eng (engineering notation mode) 118

8/4/2019 Ti Plus Guidebook Part1 En
http://slidepdf.com/reader/full/ti-plus-guidebook-part1-en 192/198
186
enteringalphabetic characters 4
data into lists 30
expressions 4
lists to plot 33
Equ4String( (equation-to-stringconversion) 118
equal-to relational test (=) 150
equation solver 28
error messages 42
errorsmessages 169
examples—applicationsarea between curves 67
areas of regular n-sidedpolygons 73
box plots 57
box with lid 50
defining a 50
defining a table of values 51
setting the viewing window 53
tracing the graph 54
zooming in on the graph 55
zooming in on the table 52
cobweb attractors 64
fundamental theorem ofcalculus 71
guess the coefficients 65
inequalities 60
mortgage payments 75
parametric equations, ferriswheel problem 68
piecewise functions 59
quadratic formulaconverting to a fraction 48
displaying complex results 49
entering a calculation 47
Sierpinski triangle 63
solving a system of nonlinearequations 62
unit circle and trig curves 66
examples—Getting Startedadding complex numbers 28
building tables 24
calculating linear regressions 35
calculating statistical variables 36
changing FORMAT menu 9
changing mode settings 19
decimals to fractions 26
editing and deleting 11 , 12
entering data into lists 30
equation solving 29
error messages 43
finding factorials (!) 27
finding square roots 27
graphing functions 18
grouping lists 40
least common multiples 27
matrix equation solving 38
mode settings 20
rand function 26
running applications 45
sending variables 99
setting graphing window 22
solving trigonometric functions 28
statistical list editor 31
storing values 15 , 16 , 17
subtraction and negation 13
turning off grid points 10
ungrouping variables 41
using parentheses 14
exponential regression (ExpReg) 119
expr( (string-to-expressionconversion) 118
ExpReg (exponential regression) 119
expressionconverting from string (expr( )
118
turning on and off (ExprOn 119
expressionsdeleting 11
editing 11
entering 4
ExprOff (expression off) 119
ExprOn (expression on) 119
FFaceplates 5
factorial (!) 27 , 149
Fill( 119
findingfactorials (!) 27

8/4/2019 Ti Plus Guidebook Part1 En
http://slidepdf.com/reader/full/ti-plus-guidebook-part1-en 193/198
187
least common multiples 27
Fix (fixed-decimal mode) 119
fixed-decimal mode (Fix) 119
Float (floating-decimal mode) 119
floating-decimal mode (Float) 119
fMax( (function maximum) 119
fMin( (function minimum) 120
fnInt( (function integral) 120
FnOff (function off) 120
FnOn (function on) 120
For( 120
formulasamortization 160
ANOVA 156
cash flow 161
days between dates 162
interest rate conversions 161
logistic regression 155
sine regression 155
time value of money 159
two-sample F-Test 156
two-sample t test 157
fPart( (fractional part) 120
Full (full-screen mode) 121
full-screen mode (Full) 121
Func (function graphing mode) 121
function graphingmaximum of (fMax( ) 119
minimum of (fMin( ) 120
modes 121
selecting 120
function integral (fnInt( ) 120
functions and instructions table 111
Ggarbage collecting 93
GarbageCollect 95 , 121
gcd( (greatest common divisor) 121
geometcdf( 121
geometpdf( 121
Get( (get data from CBL 2/CBL or
CBR) 121GetCalc( (get data from a TI-84 Plus)
122
getDate, get current date 122
getDtFmt, get date format 122
getDtStr( (get date string) 122
getKey 122
getTime, get current time 123
getTmFmt, get time format 123
getTmStr( (get time string) 123
Goto 123
graphingmodes 20
graphing functions 17 , 18
graphing window, setting 21
GraphStyle( 123
graph-table split-screen mode (G-T) 123
greater than (>) 150
greater than or equal to ( | ) 151
greatest common divisor (gcd( ) 121
greatest integer (int( ) 125
GridOff 123
GridOn 123
grouping 39 , 90
G-T (graph-table split-screen mode) 123
HHome screen 2Horiz (horizontal split-screen mode)
123
Horizontal (draw line) 124
Iidentity( 124
If instructionsIf 124
If-Then 124
If-Then-Else 124
imag( (imaginary part) 124
imaginary part (imag( ) 124
increment and skip (IS>( ) 125
independent variable 124
IndpntAsk 124
IndpntAuto 124
Input 124
installation instructionsMacintosh® 45
Windows® 44
installing applications 44
Installing New Faceplates 6
Installing new faceplates 6

8/4/2019 Ti Plus Guidebook Part1 En
http://slidepdf.com/reader/full/ti-plus-guidebook-part1-en 194/198
188
inString( (in string) 125
int( (greatest integer) 125
integer part (iPart( ) 125
interest rate conversionsformula 161
internal rate of return (irr( ) 125
inverse ( / ) 151
inverse cumulative normaldistribution (invNorm( ) 125
invNorm( (inverse cumulativenormal distribution) 125
iPart( (integer part) 125
irr( (internal rate of return) 125
isClockOn, is clock on 125
IS>( (increment and skip) 125
Kkey commands, quick reference 46
LLabelOff 126
LabelOn 126
labelsgraph 126
program 126
Lbl (label) 126
lcm( (least common multiple) 126
least common multiple (lcm( ) 126
least common multiples, finding 27
length( of string 126
less than (<) 150
less than or equal to ( { ) 150
Line( (draw line) 126
linear regressions, calculating 35
LINK RECEIVE menu 106
LINK SEND menu 102
linkingreceiving items 106
to a CBL 2™ or CBR™ 101
to a PC or Macintosh 102
to a TI-84 Plus Silver Edition or TI-84 Plus 107
transmitting items 99
two TI-84 Plus units 104
LinReg(a+bx) (linear regression) 126
LinReg(ax+b) (linear regression) 126
LinRegTTest (linear regression t test) 127
List4matr( (lists-to-matrixconversion) 127
lists
deleting from memory 81
ln( 127
LnReg (logarithmic regression) 127
log( 127
Logistic (regression) 127
logistic regression formula 155
Mmarked for deletion 94
Matr 4list( (matrix-to-list conversion) 127
MATRIX Editor 37
max( (maximum) 128
maximum of a function (fMax( ) 119
mean( 128
median( 128
Med-Med (median-median) 128
Mem Mgmt/Del menu 80
memorybacking up 107
checking available 79
clearing all list elements from 83
clearing entries from 82
deleting items from 81
error 95
insufficient during transmission 109
resetting defaults 88resetting memory 88
MEMORY menu 79
Menu( (define menu) 128
menusdefining (Menu( ) 128
TI-84 Plus 10
min( (minimum) 128
minimum of a function (fMin( ) 120
minutes notation (') 153mode menu 19
changing settings 18
mode settingsa+bi (complex rectangular) 112
Connected (plotting) 115

8/4/2019 Ti Plus Guidebook Part1 En
http://slidepdf.com/reader/full/ti-plus-guidebook-part1-en 195/198
189
Degree (angle) 116
Dot (plotting) 117
Eng (notation) 118
Fix (decimal) 119
Float (decimal) 119
Full (screen) 121
Func (graphing) 121
G-T (screen) 123
Horiz (screen) 123
importance 20
Normal (notation) 129
Par/Param (graphing) 131
Pol/Polar (graphing) 132
Radian (angle) 135
re^ θi
(complex polar) 135
Real 135
Sci (notation) 139
Seq (graphing) 139
Sequential (graphing order) 139
Simul (graphing order) 141
multiplication (*) 152
multiplication, example 14
NnCr (number of combinations) 129
nDeriv( (numerical derivative) 129
negation (-) 151
negation key ( k ) 13
normal distribution probability(normalcdf( ) 130
Normal notation mode 129
normalpdf( (probability density
function) 130not equal to ( #) 150
not( (Boolean operator) 130
nPr (permutations) 130
npv( (net present value) 130
numeric notation modes 19
OOmit 92 , 107
one-proportion z confidence interval(1-PropZInt) 133
one-proportion z test (1-PropZTest) 133
one-sample t confidence interval(TInterval) 144
one-variable statistics (1-Var Stats) 146
or (Boolean) operator 130
Output( 131
Overwrite 92 , 106
Overwrite All 92
PP4Rx(, P4Ry( (polar-to-rectangular
conversions) 134
Par/Param (parametric graphingmode) 131
Pause 131
performing simple calculations 26
permutations (nPr) 130plot types modes 20
Plot1( 131
Plot2( 131
Plot3( 131
PlotsOff 131
PlotsOn 132
plottingdata 32
lists 33Pmt_Bgn (payment beginning
variable) 132
Pmt_End (payment end variable) 132
poissoncdf( 132
poissonpdf( 132
Pol/Polar (polar graphing mode) 132
polar graphing
mode (Pol/Polar) 132PolarGC (polar graphing
coordinates) 132
power (^) 151
power of ten (10^( ) 152
precautions, battery 46
prgm (program name) 132
probability density function(normalpdf( ) 130
prod( (product) 133programming
name (prgm) 132
Prompt 133
Pt-Change( 133
Pt-Off( 133

8/4/2019 Ti Plus Guidebook Part1 En
http://slidepdf.com/reader/full/ti-plus-guidebook-part1-en 196/198
190
Pt-On( 133
PwrReg (power regression) 134
Pxl-Change( 134
Pxl-Off( 134
Pxl-On( 134
pxl-Test( 134
QQuadReg (quadratic regression) 134
QuartReg (quartic regression) 134
quick reference key commands 46
Quit 92 , 107
RR(radian notation) 149
R4Pr(, R4P(( (rectangular-to-polarconversions) 137
Radian angle mode 19 , 135
radian notation ( R) 149
RAM ARCHIVE ALL menu 87
rand (random number) 135
randBin( (random binomial) 135
randInt( (random integer) 135
randM( (random matrix) 135
randNorm( (random Normal) 135
re^ θ i (polar complex mode) 135
Real mode 20 , 135
real( (real part) 135
RecallGDB 136
RecallPic 136
RectGC (rectangular graphingcoordinates) 136
ref( (row-echelon form) 136
RegEQ (regression equationvariable) 81
Removing a Faceplate 5
Repeat 136
RESET MEMORY menu 89
resettingall memory 89
archive memory 88
defaults 43 , 88
memory 88
RAM memory 88
Return 136
root ( x$) 149
round( 136
row+( 136
rowSwap( 137
rref( (reduced-row-echelon form) 137
running applications 45
SSci (scientific notation mode) 139
screen display modes 20
second functions 3
second modifier key ( y ) 3
sector 94
Select( 139
Send( (send to CBL 2/CBL or CBR) 139
SendID 102SendSW 102
Seq (sequence graphing mode) 139
seq( (sequence) 139
Sequential (graphing order mode) 139
sequential graphing mode 20
setDate( (set date) 139
setDtFmt( (set date format) 139
setTime( (set time) 140setting graphing windows 21
setTmFmt( (set time format) 140
SetUpEditor 140
Shade( 140
Shade_t( 141
Shade χ ²( 140
Shade F( 141
ShadeNorm( 141
Simul (simultaneous graphing ordermode) 141
simultaneous graphing mode 20
sin( (sine) 141
sin / ( (arcsine) 141
sine (sin( ) 141
sinh( (hyperbolic sine) 141
sinh / ( (hyperbolic arcsine) 141
SinReg (sinusoidal regression) 142
solve( 142solving
equations 28
trigonometric functions 28
SortA( (sort ascending) 142
SortD( (sort descending) 142

8/4/2019 Ti Plus Guidebook Part1 En
http://slidepdf.com/reader/full/ti-plus-guidebook-part1-en 197/198
191
square (²) 151
square root ( $ ( ) 152
startTmr, start timer 142
statistical list editor 31
statistical variables, calculating 36
stdDev( (standard deviation) 142
Stop 143
Store ( ! ) 143
Store key ( v ) 30
StoreGDB 143
StorePic 143
storing values 15 , 16 , 17
String 4Equ( (string-to-equationconversions) 143
stringsconcatenation (+) 153
length (length( ) 126
student- t distributionprobability (tcdf( ) 144
student- t distributionprobability density function
(tpdf( ) 144
sub( (substring) 143
subtraction (–) 153
subtraction and negation, examples 13
subtraction key ( j ) 13
sum( (summation) 143
support and service 179
system variables 154
T
T (transpose matrix) 149tables, building 23
tan( (tangent) 143
tan / ( (arctangent) 143
tangent (tan( ) 143
Tangent( (draw line) 143
tanh( (hyperbolic tangent) 143
tanh / ( (hyperbolic arctangent) 143
tcdf( (student- t distribution
probability) 144Text(
instruction 144
Then 124
TI Connect™ 102
Time axes format 144
time value of money (TVM)formulas 159
tvm_FV (future value) 145
tvm_I% (interest rate) 145
tvm_ N (# payment periods) 145
tvm_Pmt (payment amount) 145
tvm_PV (present value) 145
timeCnv( ), convert time 144
TInterval (one-sample t confidenceinterval) 144
tpdf( (student- t distributionprobability density function) 144
TRACETrace instruction in a program
144
transmittingerror conditions 108
from a TI-83 107
from a TI-83 Plus Silver Edition orTI-83 Plus 107
from a TI-84 Plus Silver Edition orTI-84 Plus 107
stopping 104
to a TI-84 Plus Silver Edition or TI-84 Plus 104
transpose matrix ( T) 149
trigonometric functions, solving 28
T-Test (one-sample t test) 145
turn clock off, ClockOff 114
turn clock on, ClockOn 114
turning TI-84 Plus on and off 2tvm_FV (future value) 145
tvm_I% (interest rate) 145
tvm_ N (# payment periods) 145
tvm_Pmt (payment amount) 145
tvm_PV (present value) 145
two-proportion z confidenceinterval (2-PropZInt) 133
two-proportion z test (2-PropZTest) 133
two-sample F-Test formula 156
two-sample t test formula 157
two-variable statistics (2-Var Stats) 146
UUnArchive 83 , 145
8/4/2019 Ti Plus Guidebook Part1 En
http://slidepdf.com/reader/full/ti-plus-guidebook-part1-en 198/198