tibialis anterior architecture, strength, and gait in individuals with cerebral palsy
TRANSCRIPT

TIBIALIS ANTERIOR ARCHITECTURE, STRENGTH, AND GAIT ININDIVIDUALS WITH CEREBRAL PALSYDANIEL C. BLAND, BS,1 LAURA A. PROSSER, PT, PhD,2 LINDSEY A. BELLINI, MS,2 KATHARINE E. ALTER, MD,2
and DIANE L. DAMIANO, PT, PhD2
1 School of Medicine, Duke University, Durham, North Carolina, USA2 Functional and Applied Biomechanics Section, Rehabilitation Medicine Department, Clinical Center, National Institutes of Health,10 Center Drive, MSC 1604, Bethesda, Maryland 20814, USA
Accepted 8 March 2011
ABSTRACT: Introduction: The relationship of tibialis anterior(TA) muscle architecture, including muscle thickness (MT),cross-sectional area (CSA), pennation angle (PA), and fasciclelength (FL), to strength and ankle function was examined in am-bulatory individuals with CP and unilateral foot drop. Methods:Twenty individuals with CP participated in muscle ultrasoundimaging, unilateral strength testing, and three-dimensional gaitanalysis. Results: Muscle size (MT and CSA) was positivelyrelated to strength, fast gait velocity, and ankle kinematics dur-ing walking. Higher PA was related to a more dorsiflexed ankleposition at initial contact and inversely with fast gait velocity. FLwas related to strength, fast velocity, and step length at a self-selected speed. Conclusions: Muscle architecture partiallyexplains the degree of impairment in strength and ankle func-tion in CP. Treatments to increase TA size and strength mayproduce some gait improvement, but other factors that maycontribute to ankle performance deficits must be considered.
Muscle Nerve 44: 509–517, 2011
Cerebral palsy (CP) refers to a group of perma-nent motor disorders resulting from a non-progres-sive injury to the brain during intrauterine or earlypostnatal development. Activity limitations resultfrom impairments in the development of move-ment and posture, which often include spasticity,dystonia, muscle weakness, a lack of motor control,poor coordination, and decreased range ofmotion.1 CP is the most common neuromusculardisorder among children2 and is the most com-mon cause of physical disability in childhood. Itsprevalence has been increasing in recent decades.3
Although CP has diverse manifestations that affecteach individual differently, by definition allaffected individuals undergo some type of motordysfunction. There is typically more distal thanproximal extremity motor impairment,4 and theankle is the most commonly affected joint in indi-viduals who are ambulatory. Although CP is causedby a non-progressive injury, the nature of the mus-
culoskeletal impairments may worsen with timeand growth due to reinforcement of altered move-ment patterns and reduced physical activity.5
Advances in muscle imaging have led to anincreasing number of studies relating non-invasivemeasurements of muscle architecture to muscleperformance during functional activities in trainedand untrained adults and, more recently, in neuro-logical and other impaired populations. Physiologi-cal cross-sectional area (PCSA) has a well-estab-lished relationship with the maximal forceproduction capability of a muscle, but it requiresmeasurement of the entire muscle so that the totalvolume can be divided by fiber length,6 and ismost accurately and easily captured with magneticresonance imaging (MRI). Muscle volume alone,which is one component of the PCSA, has alsobeen shown to have a strong linear relationshipwith force. It may even be a more accurate predic-tor variable than PCSA in certain subpopulationssuch as the elderly. The anatomical, or largest,cross-sectional area of a muscle from a single staticimage can be captured with any muscle ultrasounddevice (assuming the muscle is not too large to fitwithin the field of view), but the relationship ofthis parameter with maximal force is not as strongas with the PCSA, which is a mean rather thanmaximal value.6
Muscle thickness (MT) is the most easily andreadily obtained ultrasound measure of muscle sizeand has also shown moderately strong relation-ships to maximal torque. In contrast, the length ofthe muscle fibers, or fascicle length (FL), as meas-ured on ultrasound typically has its strongest andmost direct relationship to muscle contractionvelocity.7
Interpretation of pennation angle (PA) differ-ences across groups or in response to interventionsis not as straightforward as for the other parame-ters. A higher PA per unit volume typically relatesto greater torque production, and lower angles areassociated with greater contraction velocity.8 Infact, it has been shown that resistance versus veloc-ity training regimens produce opposite effects onpennation angle.9
Muscle size and length measurements can bemore easily understood at the level of the
Abbreviations: ASIS, anterior–superior iliac spine; CP, cerebral palsy;CSA, cross-sectional area; EMG, electromyography; FAST, ‘‘as fast aspossible’’ walking; FL, fascicle length; GMFCS, Gross Motor FunctionClassification System; ICDf, initial foot contact, dorsiflexion; MRI, magneticresonance imaging; MT, muscle thickness; MVIC, maximum voluntaryisometric contraction; PA, pennation angle; PCSA, physiological cross-sectional area; PSIS, posterior anterior–superior iliac spine; SSW, self-selected walking; TA, tibialis anterior
Correspondence to: D. L. Damiano; e-mail: [email protected]
VC 2011 Wiley Periodicals, Inc.Published online 13 July 2011 in Wiley Online Library(wileyonlinelibrary.com). DOI 10.1002/mus.22098
Key words: cerebral palsy, gait, muscle architecture, strength, tibialisanterior
Tibialis Anterior in CP MUSCLE & NERVE October 2011 509

contractile unit of muscle, the sarcomere. Basically,the number of sarcomeres in parallel relates physi-ologically to strength and anatomically to musclearea, and the number in series relates to velocityand muscle length.10
Considerable individual variation exists in thecomposition of muscle tissues and the neural con-trol of muscle activation in healthy populations.This has a marked effect on the strength of therelationships between muscle architecture andmuscle performance, as shown through inconsis-tent results from the analyses of different sub-groups.11 In cerebral palsy, alterations have beenfound at all levels of the neuromotor system thatintroduce even greater variability and distort theserelationships even more. These include changes inneural activation patterns and efficiency, decreasedfiber diameter, selective atrophy and alterations infiber types, and collagen infiltration in muscle tis-sue, among others.12
In this study we aim to inform the relationshipbetween muscle structure and function in CP byexamining a single muscle in this population thathas a very specific effect on gait function. Com-mon ankle impairments in CP include insufficientdorsiflexion during the swing phase and excessiveplantarflexion during stance (see Fig. 1). Typicalsagittal plane ankle motion during walking involvesswing phase dorsiflexion to clear the toes from theground as the limb advances. Dorsiflexion alsooccurs during the stance phase of gait as the bodymoves forward over the standing limb while theopposite limb advances. Plantarflexion typicallyoccurs at the end of the stance phase when thelimb is pushing off to propel the body forward andupon lowering of the foot after initial contact. Ex-cessive plantarflexion in stance is believed to becaused or exacerbated by excessive or inappropri-ate muscle activity (spasticity, dystonia, or muscleimbalance) of the gastrocnemius and soleusmuscles. Foot drop is a swing-phase problem,which may be due to either persistent equinus ordecreased muscle activation and/or weakness inthe dorsiflexors. A paradigm shift has occurredover time in the treatment of the motor impair-ments in CP and now posits that weakness has afar greater effect on functional disability than spas-ticity, which was long thought to be the primaryculprit.13 Therefore, the focus here is on the roleof dorsiflexor (TA) muscle size and structurethrough the presumed association of muscle sizewith maximal force and how this relates to anklemotion in swing phase and overall gait function asmeasured by self-selected and fast velocity.
The ultrasound measurements in this studywere only performed on the major dorsiflexor ofthe ankle, the tibialis anterior (TA) muscle, which
lifts and inverts the foot. Three other muscles alsocontribute to ankle dorsiflexion: the extensor digi-torum longus, extensor hallicis longus, and pero-neus tertius. The TA is a bipennate muscle, mean-ing that muscle fibers branch out at a specificangle, termed the pennation angle, from a centralintramuscular septum to the epimysium. A recentstudy reported that TA muscle size was significantlysmaller in the more affected extremity of childrenwith asymmetric CP.14 However, the relationshipsbetween TA muscle architecture, strength, andwalking function have not yet been investigated.
Specifically, the goal of this study was to exam-ine the relationship of TA muscle thickness (MT),pennation angle (PA), fascicle length (FL) andcross-sectional area (CSA) to strength and anklefunction during walking in individuals with asym-metric CP. We hypothesized that TA muscle archi-tecture would be related to strength on the moreaffected side and that both would be related to ip-silateral ankle function and temporal spatial gaitparameters with smaller size, PAs, and FLs relatedto poorer functioning. To further show the rela-tionship between TA structure and function, wehypothesized that all muscle architectural measureswould have lower values on the more affected side.Although we did not make comparisons to ahealthy population, comparing parameters acrosssides of those with asymmetrical involvement pro-vides context for helping to understand some ofthese relationships.
METHODS
Participants. Twenty individuals (10 males and 10females; age 13.1 6 3.5 years, range 8.3–19.9 years)with asymmetric CP and a diagnosis of unilateral
FIGURE 1. Representative mean ankle angle data during gait
from a participant who was GMFCS level II (black line). The gray
band represents one standard deviation around the mean for typ-
ical gait. Stance phase is the period during which the limb is in
contact with the ground. The swing phase is the period during
which the limb is not in contact with the ground and is advancing
forward. Gait variables of interest are noted: ICDf, dorsiflexion at
initial contact; DfMxSt, maximum dorsiflexion in stance; DfTO,
dorsiflexion at toe-off; DfMxSw, maximum dorsiflexion in swing.
510 Tibialis Anterior in CP MUSCLE & NERVE October 2011

foot drop participated in this prospective, observa-tional cohort study. All were part of a larger,ongoing intervention trial of a functional electricalstimulation orthotic device to augment ankle dorsi-flexion, and the data for this study were obtainedduring their baseline visits. The majority (17 partic-ipants) had hemiplegia, but 3 had diplegic CPwith one side more affected than the other. Allparticipants demonstrated reduced ankle dorsiflex-ion at initial foot contact and during the swingphase of the gait cycle on clinical observation ofbarefoot walking. Passive range-of-motion datawere available from the Biodex testing set-up pro-cedures for 19 of the 20 participants. Mean passivedorsiflexion with the knee flexed to 60� was 12.4�
(SD ¼ 9.1) with a range of 1�–31�. All participantsfunctioned at Gross Motor Function ClassificationSystem (GMFCS) levels I (n ¼ 14) and II (n ¼6),15 indicating that they could walk independentlywithout the use of assistive devices, but with vary-ing levels of difficulty when performing moreadvanced motor skills or navigating challengingterrain. Electromyographic (EMG) evidence ofstretch responses (spasticity) in the medial gastro-cnemius in response to repeated passive dorsiflex-ion at a constant velocity of 90�/s was seen in 14of the 20 participants, 9 of whom were GMFCSlevel I and 5 of whom were GMFCS level II.
Exclusion criteria were botulinum toxin injec-tion to the gastrocnemius or soleus muscles withinthe 4 months prior to testing or orthopedic sur-gery to the legs in the previous year, because theseinterventions might result in changes to musclearchitecture or gait that had not stabilized. Forexample, changes in muscle volume and lengthhave been observed after gastrocnemius reces-sion.16 The study was approved by the institutionalreview board at the National Institutes of Health(Bethesda, Maryland). Written informed consentwas obtained from participants >18 years of ageand from the parents of minors. Written assentwas obtained from each child <18 years of age.
Data Procurement. Real-time musculoskeletalultrasound imaging and muscle strength testingwere performed to examine muscle architectureand strength of the TA. Both lower extremitieswere scanned with ultrasound, but in the interestof time only the more affected lower extremity wastested for strength. Participants were seated withthe ankle joint aligned with a multi-mode dyna-mometer (Biodex System 3; Biodex Medical Sys-tems, Inc., Shirley, New York) in 80� hip flexion,60� knee flexion, and 0� (neutral) ankle positionmeasured with a goniometer. Range of motion(ROM) for isokinetic and EMG spasticity assess-ment was determined individually by moving the
device manually in each direction until initial re-sistance was felt, then more slowly to an endpointthat was close to the maximum range but still tol-erable to the participant.
For ultrasound imaging (SonixTOUCH; Ultra-sonix Medical Corp., Richmond, British Columbia,Canada), participants were instructed to relax fullyduring the scans. Muscle contractions were easilydetected, and a resting muscle state was verifiedvisually in real time. Ultrasound gel (AquasonicClear; Parker Laboratories, Fairfield, New Jersey)was applied to the skin to provide acoustic cou-pling and to reduce compression or deformationof the muscle. At each visit, one of two ultrasoundoperators took TA images at the thickest region ofthe muscle belly, as determined by visual inspec-tion of real-time ultrasound, and the locationswere marked and recorded as a percentage of thedistance from the fibular head to the medial mal-leolus. A two-dimensional B-mode ultrasound de-vice with a 5–14-MHZ linear-array transducer wasused to record images from which measurementsof TA MT, PA, FL, and CSA could be obtained.Bilateral longitudinal images were taken with theprobe oriented in the sagittal plane perpendicularto the skin for viewing thickness and PA. Bilateralcross-sectional images were taken with the probeoriented in the transverse plane perpendicular tothe skin. Two images were obtained in each view.
Intrasession reliability of ultrasound measuresgenerated from both investigators who collectedultrasound data was assessed with a healthy volun-teer under a different IRB protocol. Intraclass cor-relation coefficients (ICCs) were used to evaluateintrarater reliability for each operator as well asinterrater reliability between the two operators andbetween each operator and an expertultrasonographer.
For force generation (strength) testing, partici-pants performed three maximum voluntary isomet-ric contractions (MVICs) of ankle dorsiflexion onthe more affected side at 0� ankle position whileattempting to hold each contraction approximately5 seconds before relaxing. Only the more affectedside was tested, because the protocol for the largerstudy focused on the side receiving the interven-tion. Ultrasound of the less affected side was addi-tionally collected to provide information for thesymmetry analysis. Strength data were collectedwith a custom-written program (LabVIEW 8;National Instruments, Austin, Texas) at 1000 HZ.Ultrasound video in B-mode was recorded concur-rently during the second and third MVIC trials at24 frames per second.
Three-dimensional lower extremity kinematicdata were collected with a ten-camera motion cap-ture system (Vicon MX; Vicon, Lake Forest,
Tibialis Anterior in CP MUSCLE & NERVE October 2011 511
California). This system tracked the movement of34 reflective markers placed on pelvic and lowerextremity landmarks at a sampling frequency of120 HZ. Markers were strategically placed to createa 6 degrees-of-freedom, seven-segment (pelvis,upper legs, lower legs, and feet) model. Specifi-cally, the pelvis was defined using the anatomicallocations of the left and right anterior–superioriliac spine (ASIS) and the posterior–superior iliacspine (PSIS). Participants walked barefoot over-ground down the middle of the gait laboratory,approximately 8 meters in length, at self-selected(SSW) and fast (FAST) speeds. They wereinstructed to look straight ahead and walk at a‘‘normal, comfortable pace’’ and ‘‘as fast as possi-ble,’’ respectively.
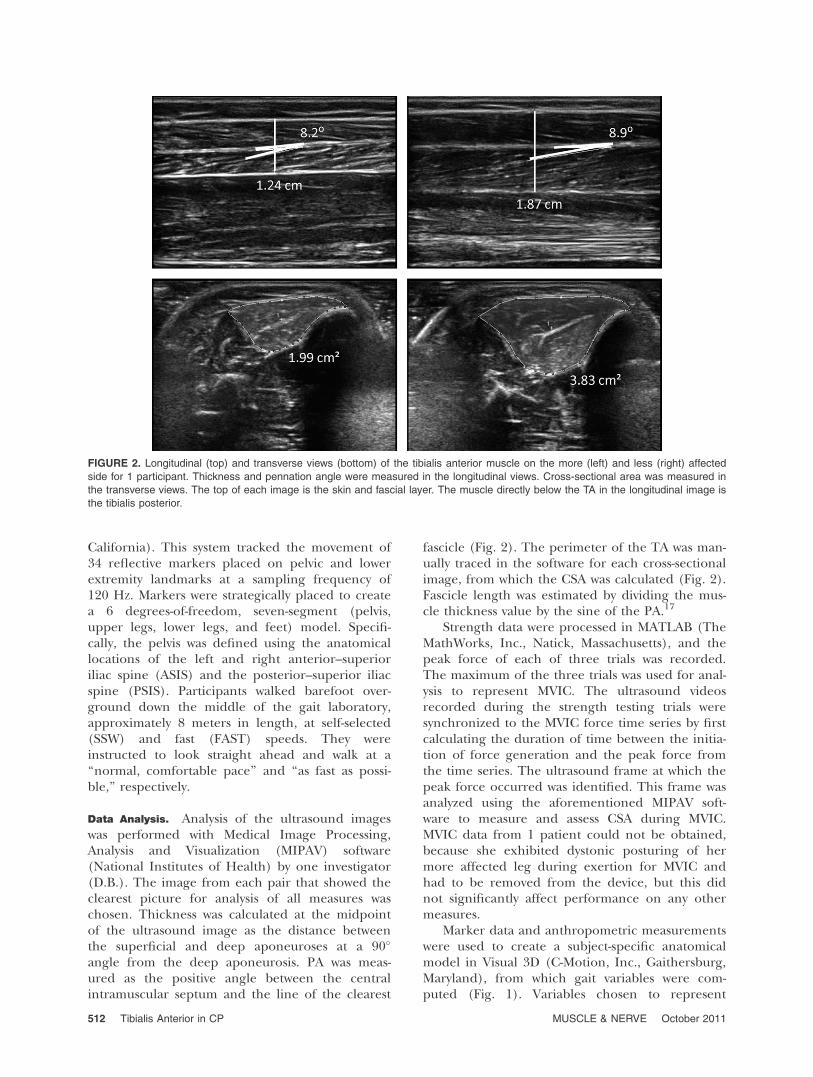
Data Analysis. Analysis of the ultrasound imageswas performed with Medical Image Processing,Analysis and Visualization (MIPAV) software(National Institutes of Health) by one investigator(D.B.). The image from each pair that showed theclearest picture for analysis of all measures waschosen. Thickness was calculated at the midpointof the ultrasound image as the distance betweenthe superficial and deep aponeuroses at a 90�
angle from the deep aponeurosis. PA was meas-ured as the positive angle between the centralintramuscular septum and the line of the clearest
fascicle (Fig. 2). The perimeter of the TA was man-ually traced in the software for each cross-sectionalimage, from which the CSA was calculated (Fig. 2).Fascicle length was estimated by dividing the mus-cle thickness value by the sine of the PA.17
Strength data were processed in MATLAB (TheMathWorks, Inc., Natick, Massachusetts), and thepeak force of each of three trials was recorded.The maximum of the three trials was used for anal-ysis to represent MVIC. The ultrasound videosrecorded during the strength testing trials weresynchronized to the MVIC force time series by firstcalculating the duration of time between the initia-tion of force generation and the peak force fromthe time series. The ultrasound frame at which thepeak force occurred was identified. This frame wasanalyzed using the aforementioned MIPAV soft-ware to measure and assess CSA during MVIC.MVIC data from 1 patient could not be obtained,because she exhibited dystonic posturing of hermore affected leg during exertion for MVIC andhad to be removed from the device, but this didnot significantly affect performance on any othermeasures.
Marker data and anthropometric measurementswere used to create a subject-specific anatomicalmodel in Visual 3D (C-Motion, Inc., Gaithersburg,Maryland), from which gait variables were com-puted (Fig. 1). Variables chosen to represent
FIGURE 2. Longitudinal (top) and transverse views (bottom) of the tibialis anterior muscle on the more (left) and less (right) affected
side for 1 participant. Thickness and pennation angle were measured in the longitudinal views. Cross-sectional area was measured in
the transverse views. The top of each image is the skin and fascial layer. The muscle directly below the TA in the longitudinal image is
the tibialis posterior.
512 Tibialis Anterior in CP MUSCLE & NERVE October 2011

general and ankle-specific function in this studyincluded temporal–spatial parameters, such aswalking speed and step length, and kinematic vari-ables, such as maximum dorsiflexion (angle) instance, maximum and mean dorsiflexion in swing,dorsiflexion at toe-off, ankle joint angular velocityin the direction of dorsiflexion, and dorsiflexionat initial foot contact (ICDf). The average values offive gait cycles were used for our analysis. The min-imum number of trials recommended in the litera-ture for children with CP who are GMFCS level I isfour, and for those in levels II or III, it is six. Giventhe mild involvement of our subjects with most inGMFCS level I and none in level III, we deter-mined that five trials were sufficient for ourpurposes.18
Pearson correlation coefficients were calculatedto examine relationships between muscle architec-ture, muscle strength, and walking function (a-level ¼ 0.05). Strength of the correlations wasdetermined from the guidelines presented by Port-ney and Watkins,19 which state that values in therange of 0.25–0.50 suggest a fair relationship,0.50–0.75 a moderate to good relationship, and�0.75 a good to excellent relationship. MT, CSA,and MVIC20,21 data were normalized by bodyweight for correlation tests to ankle kinematic vari-ables to control for variations in the sizes of thechildren (ages 8–19 years). For the same reason,temporal–spatial data were normalized for the sta-tistical analyses to a dimensionless value accordingto Hof.21 Paired t-tests (two-tailed, a-level ¼ 0.05)were used to analyze differences in ultrasound andgait measures between more and less affected legs.
RESULTS
Assessment of intrasession reliability and validity ofultrasound measures for both investigators whoobtained ultrasound data yielded ICC values of�0.99 and �0.98 for the primary and secondaryoperator, respectively. Interrater reliability betweenthe two scanning investigators was 0.98. Compari-son of each of these investigators with the ultraso-nography expert resulted in ICC values of �0.99for the primary operator and �0.96 for thesecondary.
On the more affected side, the thickest regionof the TA muscle belly was, on average, 31.4%(4.1%) of the distance from the fibular head tothe medial malleolus, whereas the correspondingarea of maximum thickness on the less affectedside was 34.8% (4.7%) of the distance. The moreaffected TA was also shorter than the less affectedTA (P < 0.001); the average length was 31.8 cm(3.1 cm) and 33.0 cm (2.6 cm) on the more andless affected sides, respectively. After controllingfor TA length, there was no longer a statistical dif-
ference in the location of maximum MT betweensides (P ¼ 0.07).
Within the muscle architectural measures, CSAand MT were significantly related to each other (r¼ 0.89, P < 0.001), and CSA at rest was highly cor-related with CSA during MVIC (r ¼ 0.97, P <0.001). Because TA CSA was not significantly dif-ferent at rest and during MVIC (P ¼ 0.61), onlyrelationships between CSA at rest and other meas-ures are reported herein. FL was inversely relatedto pennation angle (�0.81, P < 0.01).
Table 1 shows the correlation coefficients andP-values for the relationships between strength andmuscle architecture and muscle architecture andfunction. Table 2 shows the correlation coefficientsand P-values for the relationships between musclearchitecture and ankle joint kinematics. Only thosecorrelations and P-values not shown in the tableare included in the text. The first hypothesis wassupported as shown by moderate correlationsbetween muscle size and strength on the moreaffected side. MT, CSA, and FL were significantlyrelated to muscle strength, whereas PA was not.Support for the relationship of muscle structure togait function was also found. During self-selectedwalking, larger MT was related to greater maxi-mum dorsiflexion in swing; larger PA was relatedto greater dorsiflexion at initial foot contact; andlarger CSA was related to greater maximum andmean dorsiflexion in swing, and greater dorsiflex-ion at toe-off. When ‘‘walking as fast as possible’’(FAST), larger MT was related to a higher velocityand greater ankle dorsiflexion velocity duringswing; larger CSA was related to a higher velocityand greater maximum and mean dorsiflexion inswing. PA was inversely related to fast walkingspeed; however, it was also inversely related to fas-cicle length, which was directly related to fast gaitspeed. MVIC had similar relationships with
Table 1. Relationships between muscle architecture measuresand maximal muscle strength and walking function.
MVIC Walking speed Step length
SSW MT 0.57* 0.13 0.39PA �0.38 �0.16 �0.36FL 0.51* 0.32 0.46*CSA 0.56* 0.05 0.20
FAST MT 0.67* 0.38PA �0.47* �0.05FL 0.58* 0.23CSA �0.51* 0.25
Values are correlation coefficients (r values).SSW, self-selected walking; FAST, fast walking; MT, muscle thickness;PA, pennation angle; FL, fascicle length; CSA, cross-sectional area;MVIC, maximum voluntary isometric contraction.*Significance at p ¼ 0.05.
Tibialis Anterior in CP MUSCLE & NERVE October 2011 513

kinematic parameters as those with muscle size. Inthe SSW condition, a stronger TA muscle wasrelated to greater maximum (r ¼ 0.56, P ¼ 0.02)and mean dorsiflexion (r ¼ 0.57, P ¼ 0.01) duringswing, and greater dorsiflexion at toe-off (r ¼ 0.48,P ¼ 0.05). During FAST walking, greater musclestrength was related to greater maximum (r ¼0.61, P ¼ 0.01) and mean (r ¼ 0.61, P ¼ 0.01) dor-siflexion in swing, and fast velocity (r ¼ 0.53, P ¼0.02) and step length (r ¼ 0.51, P ¼ 0.03).
The TA muscles on the more affected sideshad lower MT values than those on the lessaffected sides by 25.6%. Similarly, the CSA of themore affected TA was 36.2% smaller than the lessaffected TA. No difference was seen in PA, butnormalized FL was 28% smaller on the moreaffected side. Group means and standard devia-tions for all muscle architecture and self-selectedwalking gait parameters with P-values for the side-to-side comparison are listed in Table 3. Groupmeans and standard deviations for the fast walking
gait parameters with P-values for the side-to-sidecomparison are listed in Table 4. The visual gaitobservation to determine which side was ‘‘worse’’was corroborated by the gait analysis in that manyof the ankle kinematic measures of foot drop dur-ing walking were significantly more impaired onthe more affected side. During self-selected pacewalking, the more affected side demonstrated sig-nificantly less dorsiflexion through the majority ofthe gait cycle (maximum in stance and swing,mean in swing, and at initial foot contact) and a53.6% slower ankle dorsiflexion velocity duringswing. Step length and dorsiflexion at toe-off, onthe other hand, were not significantly differentbetween the more and less affected sides. In theFAST walking condition, similar differences wereobserved. The more affected side demonstratedless dorsiflexion at the same gait cycle events (max-imum in stance and swing, mean in swing, and atinitial foot contact) and a 46.2% slower ankledorsiflexion velocity during swing. Again, no signif-icant differences were found in step length or dor-siflexion at toe-off.
DISCUSSION
All TA muscle measurements were obtained froma single site to represent the whole muscle, but it
Table 2. Relationships between muscle architecture measures and ankle kinematics.
ICDf DfMxSt DfTO DfMxSw DfMn velDf
SSW MT �0.01 �0.02 0.29 0.47* 0.36 0.38PA 0.45* 0.13 �0.07 0.01 0.11 �0.27FL �0.35 0.08 0.15 0.23 0.17 0.35CSA 0.13 0.21 0.52* 0.64* 0.60* 0.24
FAST MT 0.10 �0.30 �0.04 0.40 0.25 0.50*PA 0.14 0.21 �0.27 �0.26 �0.23 �0.13FL 0.05 �0.04 0.29 0.40 0.37 0.28CSA 0.30 0.11 0.27 0.61* 0.54* 0.41
Values are correlation coefficients (r values).SSW, self-selected walking; FAST, fast walking; MT, muscle thickness; PA, pennation angle; FL, fascicle length; CSA, cross-sectional area; DfMxSt, maxdorsiflexion in stance; DfMxSw, max dorsiflexion in swing; DfMn, mean dorsiflexion in swing; DfTO, dorsiflexion at toe-off; velDf, dorsiflexion angular velocity;ICDf, dorsiflexion at initial contact.*Significance at p ¼ 0.05.
Table 3. Side-to-side comparisons of muscle architecture andself-selected gait parameters.
Muscle architecture LA MA P
TA muscle thickness (cm) 2.2 (0.3) 1.6 (0.3) <0.001*TA pennation angle (�) 9.7 (2.1) 10.6 (2.7) 0.131TA cross-sectional area (cm2) 4.6 (1.1) 3.0 (0.7) <0.001*FL (cm) 13.4 (2.4) 9.6 (3.7) <0.001*
SSW
Gait LA MA P
Step length (m) 0.6 (0.1) 0.5 (0.1) 0.57Max. dorsiflexion in stance (�) 15.1 (3.5) 11.3 (4.7) 0.02*Max. dorsiflexion in swing (�) 7.9 (3.1) �0.1 (4.7) <0.001*Mean dorsiflexion in swing (�) 2.0 (2.9) �4.7 (4.4) <0.001*Dorsiflexion at toe-off (�) �6.5 (4.8) �5.6 (5.4) 0.52Dorsiflexion velocity (�/s) 0.9 (0.2) 0.4 (0.2) <0.001*Dorsiflexion at initial contact (�) 0.1 (3.1) �6.8 (3.8) <0.001*
Values expressed as mean (SD). LA, less affected; MA, more affected;TA, tibialis anterior; FL, fascicle length; SSW, self-selected pace walking.*Significant difference between sides (a ¼ 0.05).
Table 4. Side-to-side comparisons of fast gait parameters.
FAST
Gait LA MA P
Step length (m) 0.6 (0.1) 0.6 (0.1) 0.29Max. dorsiflexion in stance (�) 13.9 (3.8) 7.7 (5.1) <0.001*Max. dorsiflexion in swing (�) 8.9 (3.7) �0.3 (5.8) <0.001*Mean dorsiflexion in swing (�) 1.7 (3.9) �5.7 (5.3) <0.001*Dorsiflexion at toe-off (�) �9.3 (6.3) �8.9 (6.6) 0.83Dorsiflexion velocity (�/s) 1.2 (0.3) 0.6 (0.4) <0.001*Dorsiflexion at initial contact (�) 0.6 (3.2) �6.1 (3.6) <0.001*
Values expressed as mean (SD). FAST, fast walking; LA, less affected;MA, more affected.*Difference between sides (a ¼ 0.05).
514 Tibialis Anterior in CP MUSCLE & NERVE October 2011

must be acknowledged that different muscleshapes may exist (i.e., may be more or less taperedacross individuals). The CSA measurement herewas an anatomical one rather than a physiologicalone, which requires measurement of muscle vol-ume. A potential source of variability that weattempted to minimize was imaging the TA at thethickest part of the muscle belly. Obtaining ultra-sound images at a standardized location across allpatients and limbs would likely yield even morevaried results, especially if that standardized pointwere considerably different than the region ofmaximum MT. It has been common practice tomeasure the TA at a standardized location (e.g.,20–25% of the distance from the fibular head tothe medial malleolus), which is more proximalthan the average region of maximum MT in oursample (31.4% and 34.8% of TA length on themore and less affected sides, respectively). In caseswhere the largest CSA location is visible, we recom-mend that size measurements be taken at thatlocation. It is also known that variations in otherarchitectural measures can occur throughout themuscle length.22 The point at which the measure-ments were taken must therefore be noted andconsidered when comparing architecture and sizeacross studies.
The strong relationship between TA MT andresting CSA in our sample of children with CP wasas expected and supports previous work.14,23 Aninverse relationship was found between PA and FL.There was also a strong relationship of MT to CSAduring maximal contraction, which is logical giventhat CSA at rest and during MVIC was statisticallyequivalent and muscle volume remained constant.The work of Narici10 partially explains these find-ings; when contracted, the fibers of a pennate mus-cle pivot about their origin, shortening in lengthand increasing their PA, while maintaining a con-stant distance between the aponeuroses.
MT, CSA, and fascicle length were moderatelycorrelated with TA MVIC. These relationships sug-gest that muscle structure influences function, orvice versa, a concept well-recognized in normalskeletal muscles.24 However, there are inconsisten-cies across studies, and one recent review sug-gested that this relationship is far more complexthan has been previously acknowledged, even inhealthy populations.11 Major factors identified inthe literature that may modify this relationshipinclude age and gender as well as individual differ-ences in genetic make-up, neural recruitment, andmuscle tissue composition.11 Each of these couldact alone or in combination to influence the out-comes of training programs or therapeutic inter-ventions aimed at improving force output inhealthy and patient populations.
The link between muscle size and strength iseven less well documented or understood in disor-ders such as CP. Given the brain and muscle pa-thology that has been identified in CP, there is rea-son to suspect that it may differ from normal aswas seen in the study by Moreau and colleagues.25
In both the CP and control groups, the vastus lat-eralis MT was the best predictor of knee extensionMVIC. That plus age accounted for 91% of the var-iance in strength in the control group but only63% of the variance in the CP group. The additionof GMFCS level in the group with CP increasedthis variance to 82%.
In this study, only 25–35% of the variance inMVIC was explained by either TA MT or CSA. Thisfinding is considerably lower than previouslyreported values in young healthy adults, whichrange from 44% to >75% of the variance.25 How-ever, in the absence of an age-related controlgroup, the effect of age versus pathology cannotbe determined.
Finally, the unique contribution of our study isthe finding of significant correlations of weak tomoderate strength between muscle architectureand ankle function during walking. In general,there are significant positive relationships of TAmuscle size to gait velocity and the amount ofankle dorsiflexion during walking, whereas PA hasfewer relationships with ankle function andappears to be inversely related to gait velocity. It isalso inversely related to FL, which shows a positiverelationship with fast velocity. All the aforemen-tioned findings further suggest that a muscle’sstructure impacts its performance during func-tional movement in CP. Ohata and colleagues20
previously reported a relationship between musclesize and function in the quadriceps and longissi-mus muscles in this population, showing that MTdiffered significantly according to functional level(GMFCS) in patients with CP.
The strengths of the correlations between sizeand function and the lack of relationships withsome gait variables also likely indicates that addi-tional factors other than muscle architecture maycontribute to the ability of the ankle to functionduring walking. For example, studies have quanti-fied a disruption in voluntary neuromuscular acti-vation in children with CP.26 Children with CP alsohave a lack of selective voluntary motor control oran inability to perform isolated joint movementsby activating only specific patterns of musclegroups upon request, and this impairment is moresevere in distal joints such as the ankle.4 Further,the composition of a muscle affects its function.Collagen accumulation has been shown to occurin the muscles of children with CP. It replaces theforce-producing fibers necessary for movement of
Tibialis Anterior in CP MUSCLE & NERVE October 2011 515

the ankle,27 and variations in fiber size and abnor-mal distributions of type I and type II fibers havebeen seen.28 A combination of all of these factorsmay determine the degree of limitation in anklefunction observed in CP as well as the potentialresponse to strength training.
In addition to the correlations, differences inmuscle size, strength, and gait parameters acrosssides further support, albeit less directly, the pro-posed link between muscle structure and function.It is generally assumed that muscles of childrenwith CP are relatively smaller than those of theirpeers, but few studies have tested this hypothesis.29
In hemiplegic CP, the more affected leg has beenfound to have smaller MT and CSA of the ankleplantarflexors30,31 and smaller MT of the rectusfemoris/vastus intermedius group.20 Likewise,Bandholm et al.14 reported that the dorsiflexors ofthe more affected leg in children with hemiplegicCP are significantly smaller than on the lessaffected leg. Thus, our results are consistent withthe existing evidence of smaller muscle size inmore impaired limbs, while showing no significantdifferences in PA. The results of the side-to-sidecomparisons here of FL and PA are similar tothose from a study comparing two groups of sprint-ers. In that study, the faster of the two groups hadconsistently lower but non-significant differencesin pennation angles with significantly greater fasci-cle lengths.32
In individuals with hemiplegic CP, abnormal-ities in sagittal-plane ankle kinematics have beenobserved in the less affected limb as well as themore affected limb, as these individuals attempt toachieve a more symmetric gait pattern.33 However,Cimolin et al.34 reported that the anomalous com-pensation patterns on the less affected side gener-ally affect the more proximal joints, leaving theankle kinematics close to the normative range, andhence different from the more affected side, asseen in our results. The addition of a controlgroup would likely have made the structure-to-functional relationships even more apparent.
Limitations. There are several potential limitationsto this study. An apparent one was that we onlymeasured muscle size in one of four muscles thatdorsiflex the ankle. A similar decision was made inother studies, and we compared this to measuresof strength and performance of the entire musclegroup. In addition, all measures were performedwith participants in a single, neutral (0�) ankleposition despite the fact that the children had dif-ferences in plantarflexion range of motion.Although the TA was assumed to be in a slackenedposition for all children, differences in passivemuscle tension may alter muscle shape and sarco-
mere length, which could affect the length–tensionproperties and force production.35 This is espe-cially important to consider in pennate muscles,which have shorter fiber lengths, as compared withparallel-fiber muscles. For the same absoluteincrease in fiber length under tension, greater rel-ative stretch per sarcomere will result.10 Further-more, a larger sample size may have yielded morepower to detect statistically significant relationshipsbetween the measures investigated.
Another limitation is the primary focus on sag-ittal plane ankle motion without consideration ofmotion in other planes, particularly inversion andeversion. Although we collected three-dimensionalmovement of the ankle joint during walking, wedid not use a detailed foot model here, which isnecessary for accurately quantifying motion of theother joints within the foot such as the subtalarjoint. In the model used here, the foot is consid-ered a rigid segment, and any frontal planemotion occurring at the subtalar joint or elsewherein the foot is recorded instead as ankle rotation.
Another possible limitation was the fact that weonly related barefoot gait data to muscle size, eventhough limb size asymmetry was demonstrated. Wechose to study barefoot walking over other walkingconditions, because fewer variables are introduced(e.g., different shoes or orthotics) between subjectsor sides. However, in children with asymmetricinjuries, leg-length discrepancies in barefoot maysignificantly alter gait parameters. Tibial length asa proxy for leg length was compared between themore and less affected sides and was found to bestatistically different (P < 0.05), with the moreaffected side being, on average, 7.7 mm shorter. Aliterature review conducted by Knutson showedthat, in general, a leg-length inequality of <20 mmis unlikely to require treatment.36 Unfortunately,in our study femur length was not measured, butgiven the small difference in tibial length, it isunlikely that more than a few of our subjects, ifany, exceeded this clinical threshold. Thus, bare-foot assessments are acceptable in this setting.
Sample heterogeneity inherent to the CP popu-lation may also have affected the power of thestudy. The participant who demonstrated dystonicmovement during strength testing, although anextreme case, illustrates the point that individualswith CP may exhibit considerable variability in thetype as well as extent of motor impairments thatmay have differential effects on function.
Clinical Significance. Ultrasound imaging is well-established as a less invasive, more affordable alter-native to techniques like magnetic resonance imag-ing and biopsy, and it is readily adaptable for clini-cal or laboratory use. Its reliability has been
516 Tibialis Anterior in CP MUSCLE & NERVE October 2011

demonstrated in studies, including ours, and it hasbeen recommended by experts for analyzing mus-cle architecture in children with CP in clinical set-tings.29,37 However, the most relevant muscle archi-tecture measure has not been identified. Ohataet al.20 suggested the use of MT to determine func-tion, but CSA has traditionally been used due toits directly proportional relationship to the num-ber of sarcomeres in parallel, and hence to forceproduction, in normal muscles.10 However, CSAfor larger muscles requires a large field of viewthat is not possible on all ultrasound machines.Moreau et al.25 also recommended the use ofvastus lateralis MT as a surrogate measure of volun-tary strength in children with and without CP. Inour work, due to its somewhat stronger correlationthan CSA to MVIC and its similarity to CSA in rela-tion to ankle function during walking, MT may bea more clinically useful measure than CSA, particu-larly given its greater availability and ease of imagecollection and analysis relative to CSA. Futureresearch should focus on deciphering the contri-butions of different factors (i.e., muscle architec-ture, muscle composition, neuromuscular activa-tion, and selective control) to decreased forceproduction and impaired ankle function. Our pri-mary goal is to determine whether physical train-ing programs that may target one or more of thesefactors (i.e., resistance training, functional electri-cal stimulation, or intense motor practice) canimprove or restore lost ankle function during walk-ing in children with cerebral palsy.
The authors thank Chris Stanley, MS, and Cristiane Zampieri-Gal-lagher, PT, PhD, for their assistance with data collection. Thisresearch was supported by the Clinical Research Training Pro-gram, a public–private partnership between the NIH and Pfizer.,Inc. (via a grant to the NIH Foundation from Pfizer, Inc.), and inpart by the Intramural Research Program at the NIH ClinicalCenter.
REFERENCES
1. Rosenbaum P, Paneth N, Leviton A, Goldstein M, Bax M. A report:the definition and classification of cerebral palsy. Dev Med ChildNeurol Suppl 2007;109:8–14.
2. Pakula AT, van Naarden Braun K, Yeargin-Allsopp M. Cerebral palsy:classification and epidemiology. Phys Med Rehabil Clin N Am 2009;20:425–452.
3. Koman LA, Smith BP, Shilt JS. Cerebral palsy. Lancet 2004;363:1619–1631.
4. Fowler EG, Staudt LA, Greenberg MB. Lower-extremity selective volun-tary motor control in patients with spastic cerebral palsy: increased dis-tal motor impairment. DevMed Child Neurol 2010;52:264–269.
5. Damiano DL. Activity, activity, activity: rethinking our physical ther-apy approach to cerebral palsy. Phys Ther 2006;86:1534–1540.
6. Fukunaga T, Miyatani M, Tachi M, Kouzaki M, Kawakami Y, Kane-hisa H. Muscle volume is a major determinant of joint torque inhumans. Acta Physiol Scand 2001;172:249–255.
7. Zajac FE. How musculotendon architecture and joint geometry affectthe capacity of muscles to move and exert force on objects: a reviewwith application to arm and forearm tendon transfer design. J HandSurg Am 1992;17:799–804.
8. Manal K, Roberts DP, Buchanan TS. Can pennation angles be pre-dicted from EMGs for the primary ankle plantar and dorsiflexorsduring isometric contractions? J Biomech 2008;41:2492–2497.
9. Abe T, Kumagai K, Brechue WF. Fascicle length of leg muscles isgreater in sprinters than distance runners. Med Sci Sports Exerc2000;32:1125–1129.
10. Narici M. Human skeletal muscle architecture studied in vivo bynon-invasive imaging techniques: functional significance and applica-tions. J Electromyogr Kinesiol 1999;9:97–103.
11. Jones EJ, Bishop PA, Woods AK, Green JM. Cross-sectional area andmuscular strength: a brief review. Sports Med 2008;38:987–994.
12. Mockford M, Caulton JM. The pathophysiological basis of weak-ness in children with cerebral palsy. Pediatr Phys Ther 2010;22:222–233.
13. Levitt S. Treatment of cerebral palsy and motor delay, 5th ed.Oxford: Wiley-Blackwell; 2010. p 356.
14. Bandholm T, Magnusson P, Jensen BR, Sonne-Holm S. Dorsiflexormuscle-group thickness in children with cerebral palsy: relation tocross-sectional area. NeuroRehabilitation 2009;24:299–306.
15. Palisano R, Rosenbaum P, Walter S, Russell D, Wood E, Galuppi B.Development and reliability of a system to classify gross motor func-tion in children with cerebral palsy. Dev Med Child Neurol 1997;39:214–223.
16. Fry N, Gough M, McNee A, Shortland A. Changes in the volumeand length of the medial gastrocnemius after surgical recession inchildren with spastic diplegic cerebral palsy. J Pediatr Orthoped2007;27:769–774.
17. Shortland AP, Harris CA, Gough M, Robinson RO. Architecture ofthe medial gastrocnemius in children with spastic diplegia. Dev MedChild Neurol 2002;44:158–163.
18. Klejman S, Andrysek J, Dupuis A, Wright V. Test–retest reliability ofdiscrete gait parameters in children with cerebral palsy. Arch PhysMed Rehabil 2010;91:781–787.
19. Portney L, Watkins M, editors. Foundations of clinical research,application to practice. Stamford, CT: Appleton & Lange; 1993.
20. Ohata K, Tsuboyama T, Ichihashi N, Minami S. Measurement ofmuscle thickness as quantitative muscle evaluation for adults withsevere cerebral palsy. Phys Ther 2006;86:1231–1239.
21. Hof A. Scaling gait data to body size. Gait Posture 1996;4:222–223.22. Blazevich A, Gill N, Zhou S. Intra-and intermuscular variation in
human quadriceps femoris architecture assessed in vivo. J Anat 2006;209:289–310.
23. Akagi R, Kanehisa H, Kawakami Y, Fukunaga T. Establishing a newindex of muscle cross-sectional area and its relationship with isomet-ric muscle strength. J Strength Cond Res 2008;22:82–87.
24. Lieber R, Friden J. Functional and clinical significance of skeletalmuscle architecture. Muscle Nerve 2000;23:1647–1666.
25. Moreau NG, Simpson KN, Teefey SA, Damiano DL. Muscle architec-ture predicts maximum strength and is related to activity levels incerebral palsy. Phys Ther 2010;90:1619–1630.
26. Stackhouse SK, Binder-Macleod SA, Lee SC. Voluntary muscle activa-tion, contractile properties, and fatigability in children with andwithout cerebral palsy. Muscle Nerve 2005;31:594–601.
27. Booth CM, Cortina-Borja MJ, Theologis TN. Collagen accumulationin muscles of children with cerebral palsy and correlation with sever-ity of spasticity. Dev Med Child Neurol 2001;43:314–320.
28. Rose J, Haskell WL, Gamble JG, Hamilton RL, Brown DA, Rinsky L.Muscle pathology and clinical measures of disability in children withcerebral palsy. J Orthop Res 1994;12:758–768.
29. Moreau NG, Teefey SA, Damiano DL. In vivo muscle architecture andsize of the rectus femoris and vastus lateralis in children and adoles-cents with cerebral palsy. Dev Med Child Neurol 2009;51:800–806.
30. Elder G, Kirk J, Stewart G, Cook K, Weir D, Marshall A, et al. Con-tributing factors to muscle weakness in children with cerebral palsy.Dev Med Child Neurol 2003;45:542–550.
31. Mohagheghi A, Khan T, Meadows T, Giannikas K, Baltzopoulos V,Maganaris C. Differences in gastrocnemius muscle architecturebetween the paretic and non-paretic legs in children with hemiplegiccerebral palsy. Clin Biomech (Bristol, Avon) 2007;22:718–724.
32. Stafilidis S, Arampatzis A. Muscle–tendon unit mechanical andmorpholog-ical properties and sprint performance. J Sports Sci 2007;25:1035–1046.
33. Allen P, Jenkinson A, Stephens M, O’Brien T. Abnormalities in theuninvolved lower limb in children with spastic hemiplegia: the effectof actual and functional leg-length discrepancy. J Pediatr Orthop2000;20:88–92.
34. Cimolin V, Galli M, Tenore N, Albertini G, Crivellini M. Gait strategyof uninvolved limb in children with spastic hemiplegia. Eura Medico-phys 2007;43:303–310.
35. Lieber R, Murray W, Hentz V, Friden J. Biomechanical properties ofthe brachioradialis muscle: implications for surgical tendon transfer.J Hand Surg 2005;30A:273–282.
36. Knutson GA. Anatomic and functional leg-length inequality: a reviewand recommendation for clinical decision-making. Part I, anatomicleg-length inequality: prevalence, magnitude, effects and clinical sig-nificance. Chiropr Osteopath 2005;13:11.
37. Damiano D. Muscle size matters. Dev Med Child Neurol 2009;51:415–419.
Tibialis Anterior in CP MUSCLE & NERVE October 2011 517