ties that unbind? ethnic identity, social rules and ... · ties that unbind? ethnic identity,...
TRANSCRIPT

Ties that Unbind? Ethnic Identity, Social Rules and Electoral Politics in
Solomon Islands
Terence Wood
A thesis submitted for the degree of Doctor of Philosophy of The
Australian National University
NOTE: This thesis is slightly different from the final version submitted.
In particular I have made some very minor modifications to this
version of the thesis. In particular I have corrected a couple of typos
and amended the acknowledgements list.
March 2014


Candidate’s Declaration
This thesis is my own original work except where cited.
Terence Wood


v
Abstract
This is a study of ethnic identity and electoral politics in Solomon Islands. The study examines
when and why Solomon Islanders vote ethnically in national elections, which ethnic identities
are electorally important, and how ethnic voting is associated with broader features of the
country’s politics. The thesis makes use of regression analysis to show existing theories of
ethnic identity and electoral politics do not fit the Solomon Islands case. It then uses
electorate-level case studies to develop an alternative theory of ethnic voting. This theory is
then tested with further quantitative work.
The argument advanced in the thesis is that ethnic identities only play an important role in
electoral politics in Solomon Islands when the groups associated with them are home to social
rules (informal institutions) which enable effective electoral collective action. Such rules
include: norms of obligation which may make co-ethnic candidates more likely to follow up on
electoral promises; rules which enhance the loyalty of the brokers candidates use in their
attempts to gain votes; and rules which enable key political actors to coordinate support
behind favoured candidates. Importantly, rules have to be present within ethnic groups for
ethnic voting to occur. Clans commonly possess such rules and so are often electorally
important groups. Language groups do not typically possess such rules and so are rarely
electorally important. In the case of churches, the presence of electorally useful social rules
varies between denominations.
Politics in Solomon Islands is strongly clientelist. Where voters are free to choose they typically
vote for the candidate they think most likely to provide individualised or localised help. The
ethnic voting which comes coupled with this does not involve blind loyalties but rather the
calculations of voters and political actors. Social rules associated with ethnic identities play an
important role in structuring these calculations but, except in rare instances where rules are
very strong, they do not perfectly determine behaviour. As a result, other factors have a major
impact on voters’ choices: where they are free to choose, voters will vote for candidates who
are not co-ethnics if given good cause to believe they will help.
On the basis of these observations I argue clientelism, rather than ethnic voting, is the source
of poor political governance in Solomon Islands. I also argue that, rather than ethnic diversity
itself causing political fragmentation in Solomon Islands, the cause actually lies in the absence
of larger entities (social or political movements) possessing anything analogous to the social
rules found in some ethnic groups. Absent such rules, effective electoral collective action is
difficult. And absent large-scale electoral collective action, clientelism appears inevitable.

vi
Table of Contents
Table of Figures ............................................................................................................................. x
Table of Tables ............................................................................................................................. xii
Acknowledgements .................................................................................................................... xiii
Acronyms ................................................................................................................................ xvi
A Note on Spelling ...................................................................................................................... xvii
Chapter 1 – Introduction ............................................................................................................... 1
The Puzzles of Electoral Politics in Solomon Islands ................................................................. 1
Research Questions and How I Have Answered Them ............................................................. 3
Methods .................................................................................................................................... 4
The Argument ............................................................................................................................ 5
The Contribution ....................................................................................................................... 7
Introducing Solomon Islands ..................................................................................................... 7
Chapter Outline ......................................................................................................................... 9
Key Concepts ........................................................................................................................... 13
Social Rules .......................................................................................................................... 14
Ethnic Identity...................................................................................................................... 14
Chapter 2 – Methodology ............................................................................................................ 16
Introduction ............................................................................................................................. 16
Epistemology ........................................................................................................................... 16
The Challenges of Political Research in Solomon Islands ........................................................ 18
The Challenges of Researching Politics................................................................................ 18
The Challenges of Researching in Solomon Islands ............................................................. 20
Research Approach .................................................................................................................. 22
Mixed Methods ................................................................................................................... 22
A Single Country Study ........................................................................................................ 22
Working with Mixed Methods in Solomon Islands .............................................................. 24
Data ..................................................................................................................................... 28
Conclusion ............................................................................................................................... 32
Chapter 3 – State and Society in Solomon Islands ...................................................................... 33
Population, Provinces and Patterns of Settlement ................................................................. 33
Life in Villages and Settlements ............................................................................................... 34
Economic Life ....................................................................................................................... 36
Groups, Social Structures and Social Life ................................................................................ 36
The Family ............................................................................................................................ 36
The Clan ............................................................................................................................... 37

vii
Villages and Communities ................................................................................................... 39
Community and Clan Leadership ........................................................................................ 41
Language Groups ................................................................................................................ 42
Race ..................................................................................................................................... 43
Religion and Churches ......................................................................................................... 43
Secular Civil Society Organisations ..................................................................................... 46
Other Large-scale Collective Action ........................................................................................ 47
Conclusion ............................................................................................................................... 53
Chapter 4 – Solomon Islands Elections and Politics .................................................................... 55
Electoral Rules, Elections and Electorates .............................................................................. 55
Candidate Numbers and Winner Vote Shares .................................................................... 58
Incumbent Turnover Rates ................................................................................................. 60
Differences Between Electorates ........................................................................................ 62
Differences Within Electorates Over Time.......................................................................... 66
Differences Between First Time Winners and Incumbents ................................................ 67
Geographical Dispersion of Candidate Support .................................................................. 69
Changes in Geographical Dispersion of Candidate Support Over Time .............................. 71
Members of Parliament .......................................................................................................... 73
Parliamentary Politics ............................................................................................................. 74
Political Parties .................................................................................................................... 75
Government Formation ...................................................................................................... 78
Conclusion ............................................................................................................................... 80
Chapter 5 – Literature Review, Electoral Politics in Solomon Islands and Papua New Guinea .. 82
Introduction ............................................................................................................................ 82
What Voters Seek.................................................................................................................... 83
Clientelism ........................................................................................................................... 83
Clientelism Contested? ....................................................................................................... 86
Who Do Voters Support? ........................................................................................................ 88
Parties ................................................................................................................................. 88
Ethnicity .............................................................................................................................. 89
Why do People Vote the Way they Do? ................................................................................. 96
The Explanation from Culture ............................................................................................. 96
Rational Choice ................................................................................................................... 98
Conclusion ............................................................................................................................. 102
Chapter 6 – Literature Review, Ethnic Identity and Ethnic Voting ........................................... 104
What is an Ethnic Identity? ................................................................................................... 105

viii
Sticky Traits ........................................................................................................................ 106
Visible Traits ...................................................................................................................... 106
Social Salience ................................................................................................................... 107
Ethnic Identities in Solomon Islands .................................................................................. 107
Ethnic Groups and Ethnic Cleavages ..................................................................................... 108
Evidence from Elsewhere of the Existence of Ethnic Voting ................................................. 109
Inferring the Existence of Ethnic Voting from Cross-Country Studies ............................... 109
Direct Empirical Study ....................................................................................................... 110
Why do Voters Vote for Co-ethnics? ..................................................................................... 111
Rational Voters or Irrational Voters?................................................................................. 111
Why Might it be Rational to Expect a Co-Ethnic to Help? ................................................. 112
Are Ethnic Identities Fixed or Fluid? ...................................................................................... 114
Fixed Identities – Primordialists ........................................................................................ 115
Fluid and Multiple Identities – Constructivists .................................................................. 115
The Relationship Between Different Theories of Ethnic Collective Action ........................... 119
Conclusion ............................................................................................................................. 120
Chapter 7 – Theories of Ethnic Voting and Election Results in Solomon Islands ...................... 121
Singular Fixed Identities and Non-Rational Behaviour .......................................................... 121
Multiple Ethnic Identities and Rational Behaviour ................................................................ 126
Fluid Identities, Rational Voters and National Politics ...................................................... 127
Multiple Identities and Rational Voters in the Constituency ............................................ 132
Conclusion ............................................................................................................................. 154
Chapter 8 – Ethnicity, Brokers and Electioneering in Action ..................................................... 155
Ethnic Ties and Relational Ties .............................................................................................. 155
The Experiences of Voters ..................................................................................................... 156
Freedom to Choose? ......................................................................................................... 156
What Voters Seek .............................................................................................................. 158
How Voters Choose ........................................................................................................... 159
Elections in Action ................................................................................................................. 163
Aoke/Langalanga – Campaigns and Kampain Mastas ....................................................... 164
South Guadalcanal – the Importance of MP Performance ............................................... 173
Small Malaita — the Strengths and Weaknesses of Ethnic Groups .................................. 180
Conclusion ............................................................................................................................. 188
Chapter 9 – A Theory of Ethnic Voting in Solomon Islands ....................................................... 190
Principal Agent Problems and Solomon Islands Electoral Politics ......................................... 191
Voters’ Principal Agent Problems ...................................................................................... 191

ix
The Principal Agent Problems of Candidates and MPs ..................................................... 193
How Ethnic Groups and Identities can Help in Overcoming Principal Agent Problems ....... 194
Ethnic Identity, Social Rules and the Voter-Candidate Relationship ................................ 194
Ethnic Identity, Social Rules and Bonds with Brokers ....................................................... 196
Ethnic Identity and Coordination .......................................................................................... 197
Ethnic Identity and Beyond ................................................................................................... 201
Does this Theory Fit with Election Results Patterns? ........................................................... 203
Group Numbers, the Strength of Rules and Candidate Numbers .................................... 204
Individual Performance, Ethnic Voting and Electoral Outcomes ...................................... 205
The Importance of Social Rules and Why Some Ethnic Groups Become Electorally Salient
While Others Do Not ......................................................................................................... 205
Putting Theory to the Test .................................................................................................... 207
Different Churches and Different Social Rules .................................................................. 207
Conclusion ............................................................................................................................. 215
Chapter 10 – Conclusion ........................................................................................................... 217
Solomon Islanders, Voting and Ethnic Identity ..................................................................... 217
The Extent to Which Solomon Islanders Vote for Co-ethnics ........................................... 217
The Ethnic Identities that are Drawn Upon in Politics ...................................................... 218
Why Solomon Islanders Vote for Co-ethnics when they Vote for Co-ethnics .................. 218
The Determinants of the Differing Electoral Importance of Ethnic Identities .................. 220
The Association Between Ethnic Voting and Electoral and Political Outcomes in Solomon
Islands ............................................................................................................................... 221
Ramifications......................................................................................................................... 223
Further Work ......................................................................................................................... 226
Inwards .............................................................................................................................. 226
Upwards ............................................................................................................................ 227
Outwards ........................................................................................................................... 228
Concluding Thoughts ............................................................................................................ 229
Appendix 1 – Map of Solomon Islands Electorates .................................................................. 231
Appendix 2 – Province Profiles ................................................................................................. 232
Appendix 3 – Electorate Profiles (Averages all General Elections Post-1997) .......................... 233
Appendix 4 – Interview Details ................................................................................................. 235
Appendix 5 – Cross-Cutting Clans and Support Dispersion ...................................................... 237
References .............................................................................................................................. 242

x
Table of Figures
Figure 3.1 – Map of Solomon Islands’ Provinces ......................................................................... 34
Figure 3.2 – Religious Groupings ................................................................................................. 44
Figure 4.1 – Total Votes, Registered Voters, and Estimated Voting Age Population .................. 57
Figure 4.2 – Average Candidates and Effective Number of Candidates, General Elections ........ 59
Figure 4.3 – Mean and Median Winner Vote Share, General Elections ...................................... 59
Figure 4.4 – Histogram of Candidates’ Vote Shares all Candidates, all Elections 1980-2012 ..... 60
Figure 4.5 – Incumbent Turnover as a Percentage of Contesting Incumbents, Solomon Islands General Elections ..................................................................................................... 61
Figure 4.6 – Histogram of Winner Vote Shares: All Post-Independence Elections ..................... 63
Figure 4.7 – Scatter Plot of Candidate Numbers and Winner Vote Shares , 2010 General Election .................................................................................................................... 64
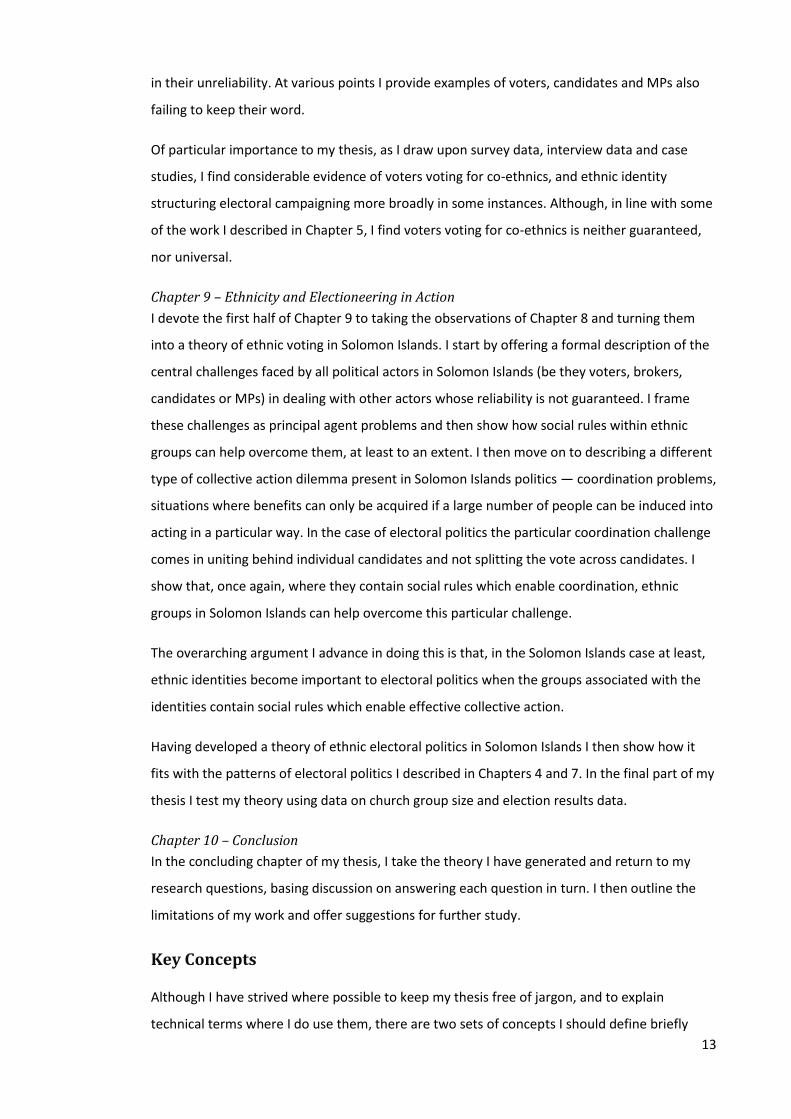
Figure 4.8 – Box Plot of Candidates Per Thousand Estimated Voters, Electorates Grouped by Province ................................................................................................................... 65
Figure 4.9 – Winning Candidate Vote Share 1997 and 2010, all Electorates .............................. 66
Figure 4.10 – Effective Number of Candidates 1997 and 2010, all Electorates .......................... 67
Figure 4.11 – Box Plots, First Time Winners and Incumbent Winners ........................................ 68
Figure 4.12 – Box Plots, First Time Winners and Incumbent MPs (Win or Lose) ........................ 69
Figure 4.13 – Histogram, Percentage of Polling Stations Where Candidates Won More than 15 Per Cent of the Vote (Winning Candidates Only) .................................................... 70
Figure 4.14 – Histogram, Percentage of Polling Stations Where Candidates Won More than 15 Per Cent of the Vote (all Candidates) ...................................................................... 71
Figure 4.15 – Results by Polling Station, 2006 East Kwaio .......................................................... 72
Figure 4.16 – Results by Polling Station, 2010 East Kwaio .......................................................... 72
Figure 4.17 – Solomon Islands Parliaments by MP Tenure ......................................................... 74
Figure 4.18 – 2010 Parties of MPs Immediately Post-Election.................................................... 75
Figure 4.19 – Elections, Changes of Government and Changes of Prime Minister 1980-2011... 80
Figure 7.1 – Effective Number of Candidates 1997 and 2010, all Electorates .......................... 123
Figure 7.2 – Provincial Make Up of February 2012 Government .............................................. 130
Figure 7.3 – Expected Religious Composition of Parliament Based on Church Based Ethnic Competition ........................................................................................................... 131
Figure 7.4 – 2012 Government and Opposition by Church Denomination ............................... 132
Figure 7.5 – Ethnic Group Population Share Against Average Winning Candidate Vote Share 139
Figure 7.6 – Ethnic Group Population Share Against Winning Candidate Vote Share .............. 142
Figure 7.7 – Winning Candidate Vote Share Versus Winning Candidate Language Group Population Share ................................................................................................... 147
Figure 7.8 – Ethnic Group Population Share Against Average Vote Share of all Candidates in Group ..................................................................................................................... 150
Figure 8.1 – Responses to People’s Survey Question about Voter Choice ............................... 161
Figure 8.2 – Aoke/Langalanga Results by Polling Station 2006 ................................................. 166
Figure 8.3 – Aoke/Langalanga Results by Polling Station 2008 ................................................. 166
Figure 8.4 – Aoke/Langalanga Results by Polling Station 2010 ................................................. 167
Figure 8.5 – South Guadalcanal Results by Polling Station 2006 .............................................. 176
Figure 8.6 – South Guadalcanal Results by Polling Station 2010 .............................................. 176

xi
Figure 8.7 – Small Malaita Results by Polling Station 2006 ...................................................... 182
Figure 8.8 – Small Malaita Results by Polling Station 2010 ...................................................... 182
Figure 9.1 – Results by Polling Station North New Georgia Electorate 2010 ........................... 199
Figure 9.2 – Coordination and Principal Agent Problems in Electoral Politics, and Ethnic Groups’ Roles in Overcoming Them ................................................................................... 202
Figure 9.3 – Church Share and Top Candidate Vote Share: Christian Fellowship Church, South Seas Evangelical Church and Church of Melanesia ............................................... 210

xii
Table of Tables
Table 6.1 – Different Understandings of Ethnic Voting ............................................................. 120
Table 7.1 – Regression Results: 1997 Electoral Statistics Versus 2010 Electoral Statistics ....... 125
Table 7.2 – Features of Likely Ethnic Competition, Solomon Islands Electorates ..................... 137
Table 7.3 – Regression Results: Ethnic Group Size Versus Average Winner Vote Share .......... 139
Table 7.4 – Regression Results: Constituency Determined Optimal Ethnic Group Size Versus Average Winner Vote Share .................................................................................. 143
Table 7.5 – Regression Results: Winning Candidate Determined Optimal Ethnic Group Size Versus Average Winner Vote Share ...................................................................... 145
Table 7.6 – Regression Results: Regressions Run Solely on Winner’s Church Share and Solely on Winner’s Language Share ...................................................................................... 146
Table 7.7– Regression Results: Vote Share of all Candidates in Winning Candidate’s Ethnic Group Compared to Candidate Share and Group Population Share .................... 150
Table 7.8 – Regression Results: Vote Share of all Candidates in Winning Candidate’s Language Group Compared to Percentage of Candidates from Group and Group Population Share (all Constituencies with Data) ..................................................................... 151
Table 7.9 – Regression Results: Vote Share of all Candidates in all Language Groups Compared to Percentage of Candidates from Group and Group Population Share ............... 152
Table 8.1 – Major Languages and Churches in Aoke/Langalanga ............................................. 164
Table 8.2 – Election Results, Aoke/Langalanga ......................................................................... 165
Table 8.3 – Major Languages and Churches in South Guadalcanal ........................................... 174
Table 8.4 – Recent Election Results from South Guadalcanal ................................................... 174
Table 8.5 – Major Languages and Churches in Small Malaita ................................................... 181
Table 8.6 – Recent Election Results from Small Malaita ........................................................... 181
Table 9.1 – Individual Regressions for the Three Churches of Interest ..................................... 211
Table 9.2 – Combined Regressions with Controls Added .......................................................... 215
Table 9.3 – Key Interaction Terms, Combined Coefficients ...................................................... 215
Table A4.1 – Interviewees by Type and Gender ........................................................................ 235
Table A4.2 – Interviewees by Electorate ................................................................................... 236
Table A5.1 – Regression Results, Support Dispersion by Population, Population Density and Province ................................................................................................................. 240

xiii
Acknowledgements
There is a long list of people who I owe thanks to for the help they have offered as I have
worked on this research. First and foremost is my wife, Jo Spratt, who accompanied me
through most of my travels in Solomon Islands and who has been a font of friendship and
advice. I am also very grateful to my parents, Beth and John Wood, for their advice and
support.
I am thankful to my supervisory panel — Nicole Haley, Yusaku Horiuchi, Sinclair Dinnen, Ron
May and Jon Fraenkel — for the advice they have provided, and am appreciative of the
research funding provided by my department. I am also deeply indebted to the following
people, who despite not being formally involved in my PhD made time to read chapters and
offer feedback: Björn Dressel, Edward Aspinall, Bill Standish, Jack Corbett, Matthew Allen and
Michael Scott. Chris Chevalier also offered feedback on several of my chapters, but I owe him a
debt of gratitude not only for his feedback, but also for the advice and friendship he has
offered throughout the PhD process. I also want to thank Graham Baines, Rebecca Monson,
Johanna Whitely and Rebecca Spratt for their advice and contacts. I owe thanks to Clive Moore
and Peter Elder for their excellent Solomon Islands news services. I am also grateful to the
non-academic staff in my college — particularly Peta Hill, Joel Nilon, Sue Rider, and James
Holman — for their help, and for putting up with my admin-related pestering.
Good quantitative data are hard to come by in Solomon Islands, and I owe thanks to Boniface
Supa and his colleagues in the Solomon Islands parliament for all their help hunting numbers.
Thank you also to the staff at the Solomon Islands Electoral Commission, particularly Polycarp
Haununu and Freddy Bosoboe, for their assistance with election results, and to Jeremy Miller
for his early help with Electoral Commission contacts. I owe thanks to both Jon Fraenkel and
Ian Frazer for sharing election data and related information with me. Similarly I am grateful to
Ian Scales for sharing his map files. I also want to thank Douglas Kimie and the staff at the
Solomon Islands National Statistics Office, and am also very grateful to Andreas Demmke for
his excellent advice on census data. I am grateful to Mike Levin of the East West Centre for
census advice. I wish to offer thanks to Chris McMurray, RAMSI and the People’s Survey team
for letting me place questions in the survey. With respect to quantitative data, I have a
particular debt of gratitude to Yusaku Horiuchi for his patient and thoughtful advice on
methodology.
Relating to my fieldwork I am thankful to Timothy Ngele for organising my research permit and
to the Minister of Education, the Honourable Dick Ha’amori, for approving it. I also owe thanks
to the premiers of Choiseul, Isabel, Guadalcanal, Malaita and Western Provinces for issuing me

xiv
with provincial research permits, and to the mayor of Honiara City for his letter of permission. I
am similarly indebted to Renee Yap for her assistance in obtaining these permits. I am
profoundly grateful to the Honourable Matthew Wale, the Honourable David Day Pacha, the
Honourable Rick Hou, the Honourable Samuel Manetoali, the Honourable Silas Tausinga, and
the Honourable Douglas Ete for giving me permission to work in their electorates. Their
openness in letting me pry into the sensitive world of election campaigns was laudable and I
am very appreciative of it. I should also thank the members of their campaign and constituency
teams who took the time to talk with me about electioneering and electorate work.
Both Jo and I need to say thanks to Danny Besa’a, Sue Mackie and their family for giving us a
home away from home when we were in Honiara. They were kind hosts and it was a privilege
to be part of their family over the months we stayed there. We are very grateful to our Kiwi
wantoks in Honiara for their friendship and help. In particular we owe thanks to Mark and
Margot, Eoghan and Sarah, Paul and Nicci, Jonathan and Ann, Alexa Funnell, Steve Hamilton,
Melanie Phillips, and Debbie Reschke and Marcus Pelto (the last two we have elevated to the
status of Honorary New Zealanders as a token of our gratitude).
I also want to offer thanks to the following people for their help and advice in Honiara:
Patteson Lusi, Bob and Alice Pollard, Ali Tuhanuku, Bishop Chris Cardone, and the late John
Roughan. I am thankful to Tome Tarasisio, Francis Waletiofala, Lincy Pende and Hickson
George for their advice and/or help arranging contacts for my field visits. I am very grateful to
Bishop Terry Brown, Ashley Wickham, Jonathan Aba, John Uma, and Joseph Foukona for their
ongoing advice and friendship.
I owe a heartfelt thank you to many Solomon Islanders for their help during field visits. Those I
need to thank from my time in Aoke/Langalanga include: Daniel and Babu Faeamani in Auki;
Ben Beato Fidale and the community at Kwailao; Pastor Elson and his wife Lynette as well as
Silas Waletofi in Talakali; Whitlam Saeni and his family, and also Willie Koti, in Ambu. In South
Guadalcanal I am thankful to: Stephen Ngele, Shelly Tavulusu and Chief Benedict Pitu for their
help in Kuma; the communities in Sughu and Malaisu, particularly Glaydis Voa, Pastor Joel
Suilua and his wife, and also Christopher Kiri and Francis Koesaia. In South Guadalcanal I am
also thankful to Pastor John Nongele and the community at Peochakuri. In Small Malaita I am
very grateful to: Christian Moffat Suiga, Teresa and her family, and the rest of the community
in Walande; all of the residents of the Catholic mission in Tarapaina; and the community in
Riverside. In Gao/Bugotu I want to say thanks to: the community of Lepi (and my wife offers
special thanks to chief Agnes Kou and to Annie Dons); the whole community at Popuma and
also John and Lucy Saghede from the adjacent village; and the community of Poro, in particular

xv
chief Alfred Bugoro, Hugo Lemifu, Agnes Tavi and Joseline Bi’o. In West New Georgia I am
thankful to everyone who helped with the visit, and in particular Audwin and Joanna Pina.
Most important of all I want to say thank you to all the Solomon Islanders who took the time
to be interviewed for my research. In order to protect your anonymity I cannot name you here,
but if you spoke to me and taught me, I am very, very grateful.

xvi
Acronyms
CDO Constituency Development Officer
CFC Christian Fellowship Church
COM Church of Melanesia
DSE Development Services Exchange (a Solomon Islands NGO)
ENC Effective Number of Candidates (a measure of political fragmentation explained in Chapter 4)
ENP Effective Number of Parties (a measure of political fragmentation explained in Chapter 4)
MP Member of Parliament
NGO Non-Governmental Organisation
OLS Ordinary Least Squares (regression)
PNG Papua New Guinea
RAMSI The Regional Assistance Mission to Solomon Islands (the peacekeeping mission in the wake of Solomon Islands’ civil conflict)
RCDF/CDF Rural Constituency Development Fund / Constituency Development Fund (funding given to MPs to spend in their electorates)
SBD Solomon Islands Dollar
SICA Solomon Islands Christian Association (an umbrella association for churches)
SIDT Solomon Islands Development Trust (a Solomon Islands NGO)
SSEC South Seas Evangelical Church
WVS Winner Vote Share
The constituency codes used in some of the charts in this thesis are mapped to constituency
names in Appendix 3.

xvii
A Note on Spelling
Spelling is not standardised in Solomon Islands. Throughout this text I have spelt electorate
names as they were recorded in the most recent version of the election data I was given.
Similarly, I have spelt candidate names as they were recorded in the most recent version of
election results data where they were present. I have spelt village names as they were
recorded in the electoral roll, or in election results where the village was also a polling station.
I have used the 1999 census as my guide for the spelling of language names. I have spelt the
name of Solomon Islands’ lingua franca ‘Pijin’ following Jourdan and Maebiru (2002).
Reflecting the country’s official name, throughout the thesis I use the name ‘Solomon Islands’,
rather than ‘the Solomon Islands’.

xviii

1
Chapter 1 – Introduction
The Puzzles of Electoral Politics in Solomon Islands
The Western Melanesian country of Solomon Islands presents a puzzle for political scientists.
Although it holds elections for its national parliament using a single member district plurality
system in which voters have only one vote and electorates elect only one member of
parliament (MP), both candidate numbers and effective numbers of candidates are high and, if
anything, have increased across elections since independence.1 These features of Solomon
Islands electoral politics stand at odds with the predictions of Duverger’s Law, one of the
central axioms of political science — a law which posits that single member district plurality
electoral systems will tend towards two party or two candidate competition over time. A
tendency driven by a process in which voters strategically abandon favourite candidates for
less favoured candidates whom they calculate as being more likely to win (Duverger 1954;
Duverger 1986).2
Although there is still some debate (for example, Dunleavy et al. 2008), Duverger’s Law is
broadly accepted as theoretically sound (Riker 1982; Reilly 2006; Kedar 2012) and there is
considerable cross-country empirical evidence of it in effect (Ordeshook and Shvetsova 1994;
Cox 1997; Neto and Cox 1997; Taagepera 1999; Roberts Clark and Golder 2006; Singer and
Stephenson 2009). That Solomon Islands so clearly defies the Law’s predictions is an anomaly
in need of explaining.
One possible explanation comes in the form of Solomon Islands’ ethnic diversity. As well as
having high numbers of candidates in elections, Solomon Islands is one of the most
linguistically diverse countries on earth. It is also home to a range of different church groups,
and its population is divided amongst numerous clans. There is also some evidence from
existing work on Solomon Islands politics suggesting voters display a propensity to vote for co-
ethnics (Premdas and Steeves 1983; Premdas and Steeves 1994; Corrin-Care 2002). What is
more, a number of cross-country studies suggest more ethnically diverse countries are on
average home to higher numbers of candidates (Reilly 2006; Singer 2012) and ethnic diversity
1 Single member district plurality electoral systems also go by the name ‘first past the post’ and are used
in a range of countries including the United Kingdom as well as for most elections in the United States. ‘Effective number of candidates’ is a calculated term which weights candidate numbers to reflect the relative competitiveness of individual candidates. I define the concept more fully, and provide the formula for its calculation in Chapter 4. In Figure 4.2 I provide detailed information on trends in candidate numbers and effective number of candidate numbers for Solomon Islands. 2 While Duverger’s Law is often applied to numbers of parties in national competition it was first
theorised with respect to candidate numbers at the electorate level and has been applied this way in other recent work (for example, Singer and Stephenson 2009).

2
has been offered as an explanation for candidate proliferation in neighbouring Papua New
Guinea (Reilly 2004; Fukuyama 2007b; Kurer 2007b). Possibly the cause of Solomon Islands’
political fragmentation can be found in ethnic attachments? Ties that unbind — loyalties which
lead to voters voting for candidates from their ethnic group. Something that in turn, given the
country’s ethnic diversity, leads to candidate proliferation and political fragmentation.
This possibility is of practical as well as theoretical interest. Despite being a democracy,
Solomon Islands suffers poor political governance (Craig and Porter 2013b). In 2012 it ranked
in the bottom 25 per cent of all countries globally in World Bank measures of government
effectiveness and regulatory quality (World Bank 2013b), and provision of public goods and
services is poor (Bourke et al. 2006; Dinnen 2008; ANU Enterprise 2011; Allen et al. 2013). Such
government failures raise the question of why Solomon Islanders keep voting for MPs who
manage their state so poorly? Here again an obvious potential answer might be that ethnic
loyalties are trumping assessments of national political performance. If this was the case the
practical ramifications would be worrying: could Solomon Islands, as a profoundly ethnically
diverse society, have any future as a democracy if voting is guided by ethnic identity not
government performance?
However, simple explanations involving ethnic politics as the cause of both Solomon Islands’
governance problems and its defiance of Duverger’s Law turn out not to fit empirical data.
Specifically, election results and key electoral features such as candidate numbers shift too
much over too short a period of time to fit with explanations of ethnic voting which hinge on
irrational attachment to fixed ethnic identities. At the same time, competing explanations from
contemporary political theory in which ethnic identities are multiple, adopted in a more
calculating manner, and politically salient when they enable ethnic groups to access state
resources, also fail to fit the Solomon Islands case. In particular, the most well-articulated of
these theories (those of Chandra 2004; and Posner 2005) posit that ethnic identities will
become electorally important when the groups associated with them are of electorally useful
sizes (large enough to win or at least afford leverage, and not so large as to require resources
to be distributed amongst more people than necessary). When ethnic groups are the right size,
Chandra and Posner argue, voters and political actors will seek to use group identity as a
means to electoral success. However, in Solomon Islands, there is no evidence of size
determining the electoral importance of ethnic identities. Clans are often electorally important
despite almost always being too small to win competition within electorates on their own. On
the other hand, language groups, while often being of sizes useful to electoral competition at
the electoral level, almost never serve as ethnic blocs in Solomon Islands. And church groups,
which are also often of electorally useful sizes, only play an important electoral role at the

3
electorate level in certain instances — instances which do not appear to be driven by group
size. Moreover, while some churches are large enough that they could become electorally
important nationally, national church-based political action does not occur in any sustained
way in Solomon Islands at present. Moreover, other potential ethnic groupings, such as island
or province-based groupings, which are also plausibly large enough to add structure to
national politics in Solomon Islands, fail to do so.
If people are voting ethnically in Solomon Islands they are not doing so in ways that fit with the
predictions of the major theories of ethnic voting which exist in political science.
Research Questions and How I Have Answered Them
In this thesis, I attempt to resolve the puzzles of national electoral politics, ethnic identity and
voter behaviour in Solomon Islands. My research is geared around five key questions.
Questions one and three are focused on the decisions of individual voters, the second and
fourth questions focus on ethnic identities, and the fifth ties voter behaviour and ethnic
identity back to electoral outcomes at the electorate and national level. The questions are:
To what extent do Solomon Islanders vote for co-ethnics?
Amongst the range of ethnic identities potentially salient in Solomon Islands elections,
which are actually drawn upon in electoral politics?
When Solomon Islanders vote for co-ethnics why do they do so?
What causes some ethnic identities to become more salient than others in contributing
to voters’ choices?
How is ethnic voting associated with observed broader patterns of electoral outcomes
and electoral politics in Solomon Islands?
The first question is a simple empirical one. As I discuss in my methodology chapter, it is not a
question which is easily answered exactly, yet it is obviously important to my study. At the very
least I need some sense of the extent to which Solomon Islanders vote for co-ethnics. If they
never do, then a study of ethnic identity and voting is misguided. Meanwhile, a situation
where voters inevitably vote for co-ethnics is different in interesting ways from one in which
voters only vote for co-ethnics in certain instances.
Of these possibilities, the last — in which voting for co-ethnics is present but not inevitable —
turns out to be the case in Solomon Islands. This leads to the third question: when voters vote
for co-ethnics, why do they do this? For obvious reasons, this question is central to

4
understanding ethnic electoral politics in Solomon Islands, and there are a range of possible
answers to it, spanning from ones which have ethnic voting driven by irrational attachments,
to those that see ethnic voting as a rational, calculated choice. Because the form of ethnic
politics which we would expect to see stemming from irrational attachments is different in
important ways from that which we might expect to see stemming from rational calculation,
this question is central to my study.
My second research question stems from the fact that, in Solomon Islands as in other
countries where ethnic politics have been studied, there are a range of ethnic identities which
might plausibly structure electioneering, yet not all do so. As I noted above, and as I detail in
Chapters 7 and 8, in the Solomon Islands case neither provincial identity nor language groups
appear to be of any regular electoral significance, while other identities such as church and
clan are significant in instances, although not the instances we might expect on the basis of
existing theory.
This observation leads to my fourth question: if some ethnic identities are electorally
significant and others are not, then any systematic examination of ethnic electoral politics in
Solomon Islands needs to be able to explain why this is the case.
In my final research question I tie my study of ethnic identity and voter behaviour back to the
electoral outcomes present in Solomon Islands — tying my research back to the puzzle I
started this chapter with.
Methods
In attempting to answer these questions I make use of mixed methods, drawing on both
qualitative and quantitative techniques. This is a relatively novel approach, at least to the
study of Solomon Islands politics and governance, which has to date been primarily the
domain of qualitative work. Yet such an approach has clear advantages for the research
questions I am asking. In particular, constraints to the external validity of qualitative work
mean that, were I to draw on qualitative methods alone, it would be hard for me to generalise
from data to the Solomon Islands case as a whole. In my qualitative work I attempted to
overcome this problem as best as possible by interviewing voters and political actors from
around Solomon Islands. However, in terms of breadth of coverage quantitative work still
possesses advantages over qualitative data. At the same time, particularly in the data poor
environment of Solomon Islands, quantitative data, while offering benefits in terms of external
validity, if drawn on exclusively brings with it the risk of missing the most interesting details of
electoral politics — details which can be best gathered through careful qualitative work.

5
The qualitative data I draw upon in this study come from interviews I conducted in Honiara
with people from across Solomon Islands and also from fieldwork focused on six Solomon
Islands electorates (five which were in rural parts of the country). I draw upon my qualitative
data foremost in Chapters 8 and 9 where I describe and theorise Solomon Islands electoral
politics.
The quantitative data I draw on come both from survey data and in the form of databases
which I compiled while in Solomon Islands. These include a database of the bio-data of
candidates from the last two Solomon Islands general elections, a database of election results
by polling station for the last two general elections (and some by-elections), a database of
election results by electorate for all general elections (and some by-elections) since
independence, and a database of census data by electorate.3 I use these datasets first to show
systematically in Chapter 7 that existing theories of ethnic electoral politics do not fit the
Solomon Islands case, and then in Chapter 9 to test my own alternative theory.
The Argument
The argument I advance in answering my research questions hinges on two types of collective
action dilemmas central to electoral politics in Solomon Islands — principal agent problems
and coordination problems — and on the role ethnic groups play (or fail to play) in overcoming
these dilemmas.
In advancing my argument I contend that, where voters are free to choose, in Solomon Islands
they vote in search of personalised or local public goods. Solomon Islands is, in other words, a
clientelist polity — a political feature it shares with many other developing countries. Indeed,
key features of Solomon Islands clientelism such as the use of brokers — local interlocutors
who help candidates win votes (Stokes et al. 2013) — are very similar to those found
elsewhere.
Amidst the clientelism of Solomon Islands politics, voters, brokers and candidates all find
themselves facing forms of principal agent problems — problems which occur when actors
have to rely on other actors to achieve the outcomes they desire. Voters face principal agent
problems when choosing who to vote for because it is hard for them to tell if the brokers or
candidates promising material benefits are actually likely to deliver these benefits. Similarly,
candidates face principal agent problems because it is difficult for them to know whether the
3 I also have pre-independence election data stretching as far back as 1967, although I do not draw
heavily upon it in my thesis.

6
voters and brokers promising them support will actually vote for them. And brokers face
related challenges in navigating the promises of candidates and voters.
Reflecting these dilemmas, ethnic identity is important to electoral politics in Solomon Islands
in circumstances where ethnic groups are bound by social rules (norms or informal
institutions) that make agents more likely to do principals’ bidding.4 For example, everything
else being equal a voter will be more likely to vote for a co-ethnic candidate if both the voter
and candidate are from an ethnic group (a clan for example) which is bound by norms of
obligation that make the candidate in question more likely to make good on their campaign
promises.
Ethnic groups also become electorally significant in Solomon Islands when they contain within
them social rules that enable members of the groups to overcome electoral coordination
problems. Winning elections requires winning a substantial number of votes, which in turn
requires coordinating the support of influential political actors. Something that itself requires
these actors to come to agreement over who to support. Such coordination is not easy, and
once again this is an area where ethnic identity can help if ethnic groups come bound with
social rules which facilitate electoral cooperation. If, for example, an ethnic group contains
within it strong norms of co-operation it will be easier for political actors within the group to
agree upon and unify support behind a single candidate. And, because group unity enhances
chances of electoral success, where such norms exist, political actors often make use of ethnic
identity as a means of electoral coordination in Solomon Islands.
Importantly, ethnic voting in Solomon Islands is contingent. It is contingent in that it only
occurs regularly within ethnic groups that are bound by social rules which enable effective
electoral collective action — a feature that explains why some ethnic identities are electorally
significant in Solomon Islands while others are not. Ethnic voting is also contingent in that the
loyalties involved are not blind. When they are free to choose, voters will not vote for co-
ethnics if they do not think them likely to help. This feature of ethnic voting in Solomon Islands
is central to the significant variations over time seen in the country’s electoral outcomes.
Because ethnic group loyalty is not blind, other factors, such as candidate performance, impact
on election outcomes and this provides space for election outcomes to change.
In the concluding chapter of this thesis I draw on my explanation of ethnic voting to argue that
the cause of candidate proliferation in Solomon Islands is not ethnic heterogeneity per se. I
argue that, instead, the country’s political fragmentation is actually the product of the absence
4 I define the term ‘social rule’ more fully at the end of this chapter.

7
in Solomon Islands of larger entities — social movements, for example —containing anything
analogous to the electorally useful social rules of some ethnic groups. Similarly, I contend the
problems of political governance in Solomon Islands stem not from blind ethnic voting, but
rather the clientelist nature of the country’s politics. Something which is itself unlikely to be
surmounted until larger, national-level entities emerge enabling more programmatic electoral
collective action.
The Contribution
The explanation of ethnic electoral politics I make in my thesis is clearly different from those
existing theories which have ethnic politics driven by irrationally held group loyalties. In my
explanation of electoral politics the key driver of ethnic voting and electoral collective action,
where it occurs, is reasoned calculation. Solomon Islands voters show little propensity to cling
to ethnic identity for reasons other than consequence.
On the other hand, my theory is similar to those of authors such as Chandra and Posner whose
arguments focus on ethnicity as a means which enables calculating actors to achieve desired,
material ends.5 However, my explanations of Solomon Islands’ electoral politics also differ
from their work in that, rather than group size, I contend it is the presence or absence of
particular social rules which determines whether ethnic groups are electorally important or
not. I also carefully theorise why this is the case, tying ethnic electoral politics to collective
action dilemmas and explaining how ethnic groups in Solomon Islands can, in certain instances,
help overcome these collective action dilemmas.
While the importance of social rules in collective action, and in particular ethnic collective
action, is increasingly well established in social science work more generally (Habyarimana et
al. 2007; Henrich and Henrich 2007; Habyarimana et al. 2009), and while it has been suggested
in passing as a potential factor contributing to ethnic politics (for example, Reilly and Phillpot
2002, p. 926; Reilly 2006, p. 50; Habyarimana et al. 2009, p. 159), my study is the first I am
aware of to provide systematic theorising and evidence of the importance of social rules within
ethnic groups in electoral politics.
Introducing Solomon Islands
The context for my work is the country of Solomon Islands. Near the western edge of the
Pacific, the islands of Solomon Islands stretch out, running in a south easterly direction from
Choiseul and the Shortland Islands in the North West, to the islets of Temotu province (see
5 Chandra’s explanation of electoral politics also describes an element of attachment based voting,
although her formal models of ethnic voting hinge on rational calculations.

8
Figure 3.1 for a map). The archipelago contains six major islands, all with substantial
populations, and 992 smaller islands, of which something in the vicinity of three to four
hundred are inhabited (Kabutaulaka 1998, p. 11; Moore 2004, p. 1; Evans 2006, p. 3; World
Bank 2011). Spread amongst these islands is a population home to speakers of 94 languages
(Solomon Islands National Statistics Office 2000, p. 46). Despite the linguistic diversity, there is
much in common in the social lives of most Solomon Islanders. In particular, throughout the
country clans, churches and villages (or urban settlements) all serve as central organising
features of most people’s social interactions (Allen et al. 2013).
On the basis of extrapolation from the preliminary results of the 2009 census (Solomon Islands
National Statistics Office 2012, p. 1) Solomon Islands has a current population of roughly
570,000.6 In 2012 the country had a purchasing power parity adjusted GDP per capita of
US$3,076, which places it in the bottom third of countries internationally (World Bank 2013a).
National level governance is (as noted above) poor and Solomon Islands is afflicted with many
of the development problems associated with this. Not only is service provision inadequate,
but corruption is a major issue (Aqorau 2008) — one the logging industry in particular has been
able to take advantage of at the expense of local communities and the environment (Frazer
1997; Bennett 2000).7 From 1998 to 2003 development issues coupled with governance
problems led to a period of civil conflict, the so-called ‘Tensions’ (Moore 2004; Dinnen 2008).
Administratively the country is divided into nine provinces plus the municipality of Honiara.
Each province has a provincial government and in most provinces provincial governments
function as poorly as the national government (Cox and Morrison 2004).
The national government is presided over by a parliament of 50 MPs, each elected from single
member constituencies. Solomon Islands’ parliament is unicameral. The country has held
general elections since 1967 and its first post-independence election was held in 1980. Since
then it has held eight general elections. As of the 2010 general election, on the basis of census
data, I estimate the country to have been home to approximately 280,000 voting aged citizens.
In the 2010 general election just under 240,000 votes were cast. In the 2010 general election, a
reasonably typical election, the average Solomon Islands electorate had an effective number of
candidates of 4.90 and the median winning candidate was elected with a 35 per cent vote
share. In 2010 44 per cent of those sitting MPs who defended their seats lost. As a
6 The exact figure for 2009 is given as 515,870 from which I derive the number given in the text by
extrapolating forwards using an estimated population growth rate of 2.44 per cent per annum. 7 Although it is beyond the scope of this thesis, it should also be noted that, in addition to taking
advantage of corruption in Solomon Islands, the logging industry has had a considerable role in perpetuating it.

9
consequence of high incumbent turnover rates, fewer than 20 per cent of MPs in the 2010
parliament had served three or more terms.8
While political parties exist in Solomon Islands they are very loosely bound (Dinnen 2008b). In
terms of national politics, weak political parties bring fluidity and instability as MPs frequently
cross the floor (Steeves 2001; Fraenkel 2005). Parties are also numerous. The 2010 parliament
was, at least in the immediate wake of the general election, ostensibly home to nine political
parties as well as 20 independent MPs. Electorally, weak political parties come coupled with
voting that is almost exclusively based on candidate attributes, not party affiliation (Steeves
2011).
Chapter Outline
As I work to link the social context and electoral outcomes of Solomon Islands together via
ethnic identity and the choices voters make, I structure my thesis around eight substantive
chapters, plus the requisite introduction and conclusion. The remainder of this introductory
chapter contains a chapter outline before closing with a section in which I define two concepts
central to my research.
Chapter 2 – Methodology
In the second chapter of the thesis I outline my research methodology. I start with a brief
discussion of epistemology, situating my work as post-positivist and explaining how this
informs my research approach. I then describe the challenges that come with research on
voter behaviour, and specifically with researching voter behaviour in Solomon Islands.
Amongst other issues I discuss the problem of social desirability bias in survey and interview
research. I also detail the challenges of getting access to and making use of existing datasets,
such as election results. Having done this I make the case for mixed methods research as a
means of understanding the role of ethnicity in the choices voters make. I then describe in
detail the methods and data used in my work. I list the electorates I visited, and describe how I
used process tracing to undertake within-case analysis of electioneering. I also provide details
on the quantitative datasets and explain how I used regression analysis in examining the data
they contain.
Chapter 3 – State and Society in Solomon Islands
In Chapter 3 I provide the reader with a detailed introduction to social and economic life in
Solomon Islands. Drawing on anthropological work as well as other existing literature I
8 Electoral data presented in this section are, unless other sources are provided, based on my own
datasets and calculations. More details on data sources are provided in Chapter 2 and I present election results data in more detail in Chapter 4.

10
describe the lives of Solomon Islanders, paying particular attention to the social structures that
frame them. I discuss the importance of family and communities, and look at leadership
structure. I also provide detailed information on potential ethnic groups. In particular I discuss
clans in Solomon Islands, language groups, different races and church groups. I also look at
other examples of group-based collective action, discussing NGOs and trade unions, before
discussing examples of large-scale collective action. In doing this I provide the reader with a
thorough introduction to the context that shapes electoral politics in Solomon Islands, as well
as the potential building blocks of ethnic politics.
Chapter 4 – Solomon Islands Elections and Politics
In Chapter 4 I continue my background of the Solomon Islands context by discussing the
country’s electoral and parliamentary politics in detail. I describe electoral conduct and
electoral rules before discussing key features of elections, and trends over time. Drawing on
my election results databases and census data I report on voter numbers and voter turnout. I
also provide information for all post-independence elections on winning candidate vote
shares, candidate numbers, effective numbers of candidates and incumbent turnover rates. In
doing this I show that, in most instances, strong trends are absent from key Solomon Islands
electoral statistics, although there is considerable fluctuation between individual elections.
There is also significant variance in election outcomes between different electorates. Some
electorates, for example, are home to numerous candidates, others to few. Within electorates
there is also interesting variation in the geographical dispersion of candidate support. Using
2006 and 2010 polling station data I show that while minor candidates tend to have
concentrated support bases, a significant number of candidates are able to draw upon
geographically dispersed support.
Having described electoral politics I then describe parliamentary politics, discussing the fluidity
of political allegiances in Solomon Islands and the weak political parties the country is home to.
I also discuss how fluid electoral allegiances contribute to political instability and changes of
government.
Chapter 5 – Literature Review, Electoral Politics in Solomon Islands and Papua New Guinea
In Chapter 5 I start my search for explanations of voter behaviour in Solomon Islands by
examining the available academic literature on voter behaviour and electoral politics in
Solomon Islands. Because this literature is fairly scarce I augment it with work from the
neighbouring country of Papua New Guinea (a culturally similar country which shares a
number of key electoral features with Solomon Islands). Also, reflecting the fact there is not a
lot of work focusing in detail on ethnic identity and voting in these countries I structure my
coverage of existing work around three broader questions relating to voter behaviour: ‘What

11
outcomes do voters seek from their vote?’; ‘Who or what sorts of candidates do voters vote
for in attempting to attain these outcomes?’; and ‘Why do voters vote for the candidates they
vote for while seeking the outcomes they seek?’. In covering these questions, I engage with
two areas of debate in the existing literature: whether politics in Solomon Islands and Papua
New Guinea is clientelist in nature; and whether culturally determined expectations or rational
calculation is the major driver of voter behaviour in the two countries.
As I do this I find the existing evidence clearly falls in favour of those who argue politics in
Solomon Islands and Papua New Guinea is clientelist. Or, in other words, that the answer to
the question ‘what do voters seek in exchange for their votes?’, is localised or personalised
benefits. With respect to the second and third questions, I contend that available evidence
favours authors who see rational calculation as determining who Solomon Islanders voters
vote for and why. At the same time, however, I show that there are still puzzles left un-
explained by rational choice analysis. One particular puzzle being high candidate numbers
when, as per Duverger’s Law, there is good reason to believe rational voters will abandon
favoured candidates for likely winners in a way which leads to political consolidation.
Ethnic identity is a potential explanation of candidate proliferation, and in Chapter 5 I describe
examples taken from existing studies of voters from Solomon Islands and Papua New Guinea
displaying a propensity to vote for co-ethnics. However, I also discuss examples of cases where
voters do not seem to vote ethnically, and note that most existing work on voting in Solomon
Islands and Papua New Guinea fails to fully theorise ethnic voting, tie it systematically to
patterns of election results, or explain why it occurs in some instances and not others.
Chapter 6 – Literature Review, Ethnic Identity and Ethnic Voting
Having been afforded much useful description but only partial explanations of ethnic voting in
Solomon Islands (and neighbouring Papua New Guinea) in Chapter 6 I turn to work from
elsewhere in the world which looks at ethnic voting, and which seeks to explain why it occurs. I
look first at evidence of the existence of ethnic voting in other parts of the world. I then
discuss theories of ethnic voting: explanations of why people vote for co-ethnics and of the
nature of the ethnic identities involved. In doing this I outline two clear divisions in the
literature. The first divide being that between those who posit ethnic politics and voting as
being the product of irrational attachments and those who posit the phenomena as caused by
rational calculations (or something approximating them). The second divide I discuss is that
lying between those who argue ethnic identities are multiple and that voters and other
political actors can shift between them, and those who argue ethnic identities are largely
singular and fixed. In doing this I note that, as a generalisation, beliefs of singular unchanging

12
ethnic identities tend to come coupled with theories of irrational ethnic voting, while — in
contemporary work on ethnicity and voting at least — those who hold ethnic identities as
multiple and prone to change also tend to advance models of ethnic voting based on reasoned
choices.
Chapter 7 – Theories of Ethnic Voting and Election Results in Solomon Islands
In Chapter 7 I take the theories of ethnic voting I described in Chapter 6 and see whether their
predictions fit patterns of election results present in Solomon Islands. First, I show that there is
too much variation in election outcomes at the electorate level over short timeframes to fit
with models of ethnic voting based on irrationally held attachments and singular, fixed ethnic
identities. I then show that the predictions of contemporary theories in political science based
on multiple and changeable ethnic identities also fail to fit with empirical observations from
Solomon Islands. In particular, I engage with theories that suggest whether an ethnic identity is
important or not is determined by the sizes of ethnic groups associated with the identity in
question. I show that, although some ethnic groups are potentially large enough to provide
useful starting points for acquiring national level political power, there is no evidence of these
groups actually structuring national politics. I then shift my analysis to electoral-level
competition, looking at the sizes of church and language groups within electorates and
showing there to be no relationship between optimal-sized group population shares and
winning candidate vote shares. I conclude the chapter by looking at two areas where
correlations do exist. I show using 2006 and 2010 election data that there is a weak correlation
between language group size and winning candidate vote share, and that this occurs
regardless of whether the groups involved are ideally sized for electoral competition. I also
show using 2010 data that there is a strong correlation between language group size and the
total combined vote shares of all candidates from within the language group, and that — once
again — this appears to be something which exists independent of group size.
Chapter 8 – Ethnicity and Electioneering in Action
Having found in Chapter 7 that existing theories of ethnic voting and electoral collective action
fail to fit with patterns of Solomon Islands election outcomes I shift to theory-generating work,
starting in Chapter 8 by describing electioneering and electoral politics in detail. First, I draw
upon survey data and interview data to paint a general picture of the choices voters make in
elections in Solomon Islands. I then use process tracing within three electorate cases to
examine the interactions of MPs, candidates and other political actors, and voters in action. As
I do this I find still more evidence of clientelism in electorate level politics in Solomon Islands
— clientelism in which local brokers are central, albeit often unreliable. Brokers are not alone
13
in their unreliability. At various points I provide examples of voters, candidates and MPs also
failing to keep their word.
Of particular importance to my thesis, as I draw upon survey data, interview data and case
studies, I find considerable evidence of voters voting for co-ethnics, and ethnic identity
structuring electoral campaigning more broadly in some instances. Although, in line with some
of the work I described in Chapter 5, I find voters voting for co-ethnics is neither guaranteed,
nor universal.
Chapter 9 – Ethnicity and Electioneering in Action
I devote the first half of Chapter 9 to taking the observations of Chapter 8 and turning them
into a theory of ethnic voting in Solomon Islands. I start by offering a formal description of the
central challenges faced by all political actors in Solomon Islands (be they voters, brokers,
candidates or MPs) in dealing with other actors whose reliability is not guaranteed. I frame
these challenges as principal agent problems and then show how social rules within ethnic
groups can help overcome them, at least to an extent. I then move on to describing a different
type of collective action dilemma present in Solomon Islands politics — coordination problems,
situations where benefits can only be acquired if a large number of people can be induced into
acting in a particular way. In the case of electoral politics the particular coordination challenge
comes in uniting behind individual candidates and not splitting the vote across candidates. I
show that, once again, where they contain social rules which enable coordination, ethnic
groups in Solomon Islands can help overcome this particular challenge.
The overarching argument I advance in doing this is that, in the Solomon Islands case at least,
ethnic identities become important to electoral politics when the groups associated with the
identities contain social rules which enable effective collective action.
Having developed a theory of ethnic electoral politics in Solomon Islands I then show how it
fits with the patterns of electoral politics I described in Chapters 4 and 7. In the final part of my
thesis I test my theory using data on church group size and election results data.
Chapter 10 – Conclusion
In the concluding chapter of my thesis, I take the theory I have generated and return to my
research questions, basing discussion on answering each question in turn. I then outline the
limitations of my work and offer suggestions for further study.
Key Concepts
Although I have strived where possible to keep my thesis free of jargon, and to explain
technical terms where I do use them, there are two sets of concepts I should define briefly

14
now as they are central to understanding my research findings and theorising. The first of
these is to do with social rules, and the second ethnic identity.
Social Rules
In this thesis I use the term ‘social rule’ to refer to rules such as norms, which afford some
constraints on human behaviour but which are not decreed by or upheld by the state. These
are rules which may be enforced by peers or community members, or possibly adhered to by
actors without need of enforcement because adherence is believed to be the right course of
action.
In using the term social rule in this way I am using it in place of the standard term in economics
and political science: ‘informal institution’ (Casson et al. 2010). I have chosen to speak of social
rules rather than informal institutions to avoid the conceptual confusion associated with the
word ‘institution’, which has another more common use in English to do with organisations
(i.e. ‘the institution of the church’) (Ostrom 1999, p. 36).9 Readers of my thesis who are used to
the term ‘informal institutions’ as used in economics and political science can read ‘social
rules’ as I have used it throughout this text as a synonym. Similarly, I have avoided referring to
‘formal institutions’ when talking about rules associated with the state. Rather, I have simply
referred to the specific rules being discussed (‘electoral laws’, for example).
Ethnic Identity
As with social rules, ethnic identity and ethnic groups associated with ethnic identities are
central to my research. Yet the concept of ethnicity is itself hard to define (Reilly 2006) and a
range of competing definitions exist. In defining ethnic identity as part of my work I am not
seeking to resolve these debates or capture ethnicity as an ideal form, but rather to make use
of a definition which will be recognisable to scholars of ethnic electoral politics, and which
affords analytic leverage to my work. In Chapter 6 I provide an extended discussion of the basis
of the definition I use and the authors whose work it is drawn from, and as a result I do not
offer this here, but rather provide a simple outline to enable the reader to understand what I
mean when I use the term prior to Chapter 6’s discussion.
In this thesis I define an ethnic identity as an identity which is based on traits that are sticky,
visible and socially salient. Sticky traits are traits which are not readily changed at will by
individuals (contrast one’s skin colour with the membership of a sports club). Visible traits are
9 There is also considerable overlap between what I call social rules and the term Pijin term ‘Kastom’
(from the English word ‘custom’) as it is often used by anthropologists working in Melanesia. I have chosen to use ‘social rules’ rather than ‘kastom’ as, although the overlap between the two terms is considerable, they are not necessarily one and the same. Also, ‘social rules’ is more a immediately accessible term to those without prior knowledge of Melanesia.

15
traits which are either literally visible or well known (for example, skin colour or religious
identity). Socially salient traits are those that have been afforded meaning by history (contrast,
for example, religious identity in Northern Ireland with eye colour in Northern Ireland).
Within it, in the Solomon Islands context, this definition includes as potentially salient ethnic
identities those associated with race, clan, language, religion and island (or province).
Associated with this definition of ethnic identity is the term ‘ethnic group’. As I have defined it,
an ethnic group is a group derived from an ethnic identity in question. For example, if the
relevant ethnic identity is religion, Buddhists would be an ethnic group, as would Catholics and
Seventh Day Adventists. Similarly, I use the term ‘ethnic cleavage’ to describe any divide
associated with ethnic identity which lies between two groups (for example the divide
between Seventh Day Adventists and Catholics).

16
Chapter 2 – Methodology
Introduction
The following eight chapters of my thesis attempt to explain when and how social rules and
ethnic identities interact to influence voter behaviour in Solomon Islands. Before I start, in this
current chapter I outline my methodology, describing how I gathered and analysed the data I
use — allowing the reader to look under the bonnet of my research enterprise.
In doing this I cover ground ranging from the esoteric to the prosaic. I start by outlining the
epistemic underpinnings of my work before highlighting the practical challenges of political
research, and in particular political research in Solomon Islands. I then provide a detailed
description of the path I have taken to overcoming these challenges, starting with
methodological choices I have made before describing data gathering and analysis.
Epistemology
Whole books have been written on epistemology — theories of what we can know and how
we can know — and debates on the subject show no signs of resolution (Guba and Lincoln
2005). My purpose in this section is not to wade into intellectual conflicts but simply to outline
my own epistemological bent and explain what it means for this thesis. Epistemologies have
ramifications both for research questions and research methods (King and Horrocks 2010).
While, for example, it is easy to imagine post-structuralist, interpretivist and post-positivist
researchers all being able to fruitfully research the electoral politics of Solomon Islands,
researchers of these different epistemic schools have profoundly different beliefs as to what
can be learnt and how it can be learnt. This, in turn, leads to the use of different methods, or
the same methods to different ends, something that makes for research governed by differing
norms of inquiry. So I describe my epistemological stance here in order to indicate to the
reader what to expect in terms of the ambitions propelling, and rules constraining, my work.
My epistemological leanings are broadly post-positivist (in the sense of the term as used in
Guba and Lincoln 2005; and Sumner and Tribe 2008). In practice this means I take the social
world to be real, knowable to a degree, amenable to theory and, importantly, amenable to
causal theory — theory which describes social relations in terms of cause and effect (for
further detail on this and related epistemologies and for examples of the research approaches
they typically entail see: King et al. 1994; George and Bennett 2005; Neuman 2006; Kanbur and

17
Shaffer 2007; Sumner and Tribe 2008).10 However, to a post-positivist, a social world which is
knowable, is not the same as a social world that can be known with certainty or finality:
knowledge is contingent, and theories always prone to being proven untrue by subsequent
evidence (Sumner and Tribe 2008). Yet a post-positivist, in contrast say to a radical post-
modernist, does still believe that understandings of social reality, while never certain, can be
closer to or further from the truth.11 The task of getting closer to the truth is not easy, of
course, or as scientific and linear as was assumed by early positivists. Post-positivists
appreciate that mistakes may be made, and biases present. Good research should, post-
positivists believe, strive to make such flaws easier for others to spot through transparent use
of research methods.
One important area where my own research approach differs from some researchers who
might loosely fall into the same epistemological camp (for example, King et al. 1994) is that I
see an important role for careful inductive work in theory generation. Like other positivists and
post-positivists I seek to test theories with evidence, but a significant component of my
research involves generating new theory from evidence. This is at odds with some variants of
positivism which have theory born either of “creative intuition” (Popper 1968, p. 32 cited in
King, Keohane et al. 1994, p.14) or through the use of deductive logic to build upon existing
theories or accepted facts. Instead, I take the view of George and Bennett (2005, p. 12) that
there is significant worth to careful empirical work focusing on “theory
development…hypothesis formation and the historical explanation of individual cases”.
The practical ramifications of my epistemological leanings are as follows. The research that this
thesis is based on is concerned with uncovering facts, using facts to test existing theories, and
generating new theory — all for the purpose of explaining how the world works. Furthermore,
reflecting my belief in the possibility of understanding cause and effect in the social world, I
10
My use of the term post-positivism comes specifically from Sumner and Tribe (2008, p. 58) and Guba and Lincoln (2005, p. 193). Some of the other authors cited above do not use it. Some, while describing approaches to epistemology similar to that which I have offered, use the related, plausibly encompassing, term ‘positivism’. This I avoid in favour of post-positivism seeking, as do Sumner and Tribe, a means of distinguishing my beliefs of the contingency of knowledge from earlier forms of positivism such as Logical Positivism that appear more optimistic of the ability to attain certainty. King et al. (1994), do not use the term positivism, or for that matter, any term, in describing the epistemology that underpins their text on methods (what they do is self-evidently ‘normal’ as they see it). However, it is clear, both from the views they express on good social science research and from their engagement with interpretivists and post-modernists, that they are positivists of a form. 11
Whether post-modernists, in belief or in practice, actually hold such radically sceptical ontological and epistemological positions is a matter for debate. Yet it is not hard to find examples of at least some thinkers in this school of thought who hold to such views. For an example, as well as for a very interesting debate on these matters, the reader is directed to the comments of Hilary Lawson in the London School of Economics Philosophy panel discussion to be found at the following link: http://www.lse.ac.uk/publicEvents/events/2013/05/20130501t1830vWT.aspx

18
have attempted to make my explanations causal. I am interested, then, in questions such as:
What causes some ethnic identities to become more salient than others in contributing to
voters’ choices? I have tried to answer such questions by describing likely facts on the ground
and using these facts to link causes to effects.
The Challenges of Political Research in Solomon Islands
If ever there was an arena of human interaction where the search for facts on the ground was
fraught, politics is it. By its very nature politics involves the shaping of narratives, the hiding of
some facts and the touting of others. Even relatively simple endeavours such as interpreting
election results and asking voters why they voted the way they did can prove surprisingly
problematic. In the following two subsections I outline several textbook complications
associated with studying electoral politics, complications that are evident in most contexts. I
then highlight some of the particular problems I faced researching electoral politics in Solomon
Islands. In subsequent sections of this chapter, as I detail the methods I have used, I outline
how I used them in ways that have allowed me to overcome these challenges as best as
possible.
The Challenges of Researching Politics
Three major, general methodological challenges confront researchers seeking to understand
why voters vote the way they do, or seeking to answer related questions such as ‘do voters
vote along ethnic lines?’
The Ecological Fallacy
The first of these is the so-called ecological fallacy, an issue that hampers attempts to divine
voter motivations from election results. The fallacy occurs when researchers interpret results
found at higher units of analysis (for example, electorates) as conveying information about
behaviour at lower units of analysis (for example, voters’ choices) (Lavrakas 2008). A Solomon
Islands example of ecological fallacy would be inferring from the strong correlation between
the population share of language groups and the combined constituency-level vote share won
by candidates from language groups (discussed in Chapter 7) that voters choose who to vote
for on the basis of language-based ethnic identity. (In reality as I discuss in Chapters 7 and 8
the most likely explanation is to do with clan networks, which are subsets of language groups.)
The problem of ecological fallacy is not insurmountable: there are statistical techniques for
partially overcoming it when working with results data alone (King 1997; King et al. 2004); or
results data can be combined with other data for better inference (a technique I use). Also,
strong correlations across multiple data points, particularly if control variables are included, at

19
least suggest observed relations are non-spurious. Some researchers have found, for example,
that the number of ethnic groups is correlated with the number of political parties across a
large number of democracies, as I discuss in Chapter 6. And this finding, owing to the presence
of a relationship born of numerous different country contexts and resilient to the inclusion of
controls in regression, appears reasonable evidence of something akin to ethnic voting,
despite the technical possibility of ecological fallacy.
For my research, the main ramification of this issue is that I should not assume that, simply
because Solomon Islands is ethnically diverse and, at the same time, has elections with many
candidates, people are voting along ethnic lines. This is an assumption I avoid. The risk of
ecological fallacy also requires caution in how I interpret election results data, and care in
comparing this data with demographic data, issues which I take due notice of.
Social Desirability Bias and Issues of Interpretation
There would seem to be at least one easy solution to the problems of ecological fallacy from
election results described above: using surveys to ask people why they voted the way they
did. A large random sample ought to provide external validity and survey questions ought to
allow direct insight into voters’ motivations. And, indeed, this is an approach used by social
scientists (most famously by Campbell 1980; and also Lewis-Beck et al. 2008). Yet it is not
without limitations. In particular, the issue of social-desirability bias, which occurs when survey
respondents provide answers they think interviewers wish to hear, or that respondents think
are least likely to cause them subsequent trouble should their responses become common
knowledge. Social desirability bias is now recognised as a major issue in survey work on voter
behaviour, particularly when dealing with sensitive issues such as vote buying (Gonzalez-
Ocantos et al. 2012). Of particular relevance to the subject matter of my own research, in his
work on ethnic politics in Zambia Posner (2005, p. 94) provides good evidence to suggest that
social desirability bias leads respondents to downplay the extent to which ethnic identity
guides their engagement in politics.
In the case of ethnic voting there are further issues with data stemming from respondents’
interpretations of their own decisions. A voter may, for example, vote for a co-ethnic because
they believe the co-ethnic more likely to help and subsequently merely tell a researcher that
they voted for the candidate most likely to help. The response is correct but nevertheless
omits the underlying determinant of the voter’s choice of most interest. Reflecting such
challenges in their overview of methodologies relevant to studying ethnicity and voter
behaviour Lieberman and Singh (2012, p. 262) conclude:

20
Survey questions on ethnicity are problematic for a host of reasons, including varied interpretations of questions, interviewer effects, and normative biases against “ethnic” responses.
Such challenges are likely to be most acutely felt by quantitative researchers using surveys, yet
political research is challenging for qualitative researchers too. The flexibility of interviewing
affords some advantages over survey questionnaires. Even so, as I discuss below, there is no
guarantee such information will not suffer similar forms of bias (Tansey 2007; Rathbun 2009).
The Challenges of Researching in Solomon Islands
For the researcher studying politics, Solomon Islands offers an additional suite of challenges.
For a researcher from New Zealand the first of these is the challenge that comes with working
across cultures. Some of this is simply practical — in parts of the country it would have been
considered inappropriate for me to interview women on their own. Other challenges were
more directly intellectual: as an outsider I ran the risk of overlooking essential elements of
political behaviour simply because I did not know where to look, or how to decode relevant
signs. This challenge was compounded by the fact there has been little detailed, academic
work undertaken on voter behaviour in Solomon Islands. There is, as I discuss in Chapter 5,
some work of use, but not much, and important features of Solomon Islands electoral politics,
such as the brokers who I discuss in Chapter 8, had not previously been detailed in academic
work. This meant that, while I commenced my fieldwork possessing questions born of research
in other countries, I had relatively little pre-existing material geared to the Solomon Islands
electoral context to guide my search.
As an outsider, I also faced challenges establishing trust with those from whom I gathered
data. Politics is a sensitive subject, and as I discuss in my findings, voter coercion occurs in
Solomon Islands; in such an environment a challenge I faced was getting voters to be open
about their experiences.
Other data brought other problems. While I was able to obtain election results at a
constituency level for all general elections and some by-elections, results at the polling station
level, which are more useful for analysis, proved harder to get. In the end I was able to obtain
them for almost all electorates for the two most recent general elections as well as some
recent by-elections, but was unable to pull together polling station results from any older
elections. I discuss how I tidied and validated this data in more detail below but for now should
note that the data I received required considerable tidying before it was amenable to analysis.
In addition to the normal tasks of data entry and coding, spelling is not standardised in
Solomon Islands which means that candidate names, and constituency names, had to be

21
manually matched across time and between datasets.12 For this reason tidying, merging and
validating data proved very time consuming, and time lost to this, while ultimately well spent,
was time I was unable to devote to other aspects of my research.
While election results are useful on their own, their ability to shed light on voter behaviour
ought to be enhanced when combined with information on social and economic features of
different electorates or polling stations.13 Because ward-level data from Solomon Islands’
censuses can be aggregated and mapped to electorates (census wards are perfect subsets of
electorates) censuses are an obvious source of such data. However, drawing on census data
did not prove easy. The 2009 Solomon Islands population census had not been finalised by the
time I undertook fieldwork in 2011 and 2012, meaning the census data I was given were
provisional.14 I was also able to obtain 1999 census results and some limited data from earlier
censuses. Yet doing this took time: suitably disaggregated data relating to variables of interest
such as language were not immediately available and obtaining data required ongoing
interaction with relevant civil servants. Also, although electoral units and census units can be
mapped, owing to the aforementioned absence of standardised spelling in Solomon Islands,
the mapping processes itself was time consuming. A further concern is that, as in many
developing countries, Solomon Islands census data are not completely reliable — the 1999
census took place during civil conflict, and the 2009 census is thought possibly to be inaccurate
in some respects. However, as I discuss below, my own testing suggests the data are reliable
enough to use. Beyond questions of the validity of the data the censuses do provide, there is a
further issue in the form of information that they do not gather. While language (one potential
ethnic cleavage) was recorded in the 1999 census it was not in 2009, and no Solomon Islands
census has ever asked people to identify themselves by clan, meaning there are no
quantitative data available on this variable of interest.15
Finally, while researchers studying ethnic voting in other countries have been able to draw
upon large-N survey data (for example: Saffu 1989; Norris and Mattes 2003; Bratton et al.
12
For example, former prime minister Bartholomew Ulufa'alu’s name was spelt in the following ways in my source data across the different years he stood as a candidate: B. Ulufa'alu, Bartholomew Ulufa'alu, Batholomew Ulufa'alu, Batholonew Ulufa'alu, Batholomew Ulu'ufa'Alu, and Bartholomew Aba'au Ulufa'alu. 13
Notwithstanding possible issues to do with the ecological fallacy discussed above. 14
Final census data were released as I was revising my thesis in late 2013. I could not obtain these data in a form fully amendable to analysis. However, I was able to check with respect to the two main variables used in my analysis. The final population totals for electorates were identical to those in the provisional report, and the proportion of the total population recorded as members of different churches present varied by less than one per cent between the two versions of the census data. 15
The Allan report of 1957 (Allan 1957) has some information on the number of clans within each province. However, data are: incomplete; provided for provinces not electorates; and dated. They also only relate to clan names – no systematic information is given on relative clan sizes.

22
2011), conducting such a survey was beyond my means as a PhD student. The Regional
Assistance Mission to the Solomon Islands (RAMSI) has, of recent years, been conducting large
surveys of randomly-sampled Solomon Islanders and, in addition to questions to do with
perceptions of members of parliament, in 2011, at my asking, they included several questions
directly related to voter behaviour. Unfortunately though, while I have been able to make
some limited use of the aggregate data these questions generated, RAMSI were unable to
provide me the relevant data in a disaggregated form amenable to detailed analysis.16
Adding to these issues were the practicalities of researching in a low income small island state.
While I was aided immensely by the kindness of Solomon Islanders everywhere I travelled,
there were logistical issues. I had to learn Solomon Islands Pijin. I had to obtain national and
provincial level research permits (a task that took several months). Travel in most instances
was by ferry or small fiberglass boats — all weather dependent and sailing to erratic schedules.
Meanwhile, some parts of the country are without cell-phone communications which made
organising rural visits challenging. At the same time archival research such as gathering old
election data and trying to obtain bio-data on MPs was impaired by incomplete collections and
lost material.
Research Approach
Mixed Methods
Possessing the research questions that I had, being of the epistemological inclination that I am,
and confronted with the practical challenges I have detailed, I chose to use a mixed method
approach to my research, combining large-N description and regression analysis with small-n
case study work. I chose this approach because used together the different methods afforded
me the ability to overcome the shortcomings of each individual approach. Data available for
large-N analysis were not available for all variables of interest, and issues such as the risk of
ecological fallacy were present. But by drawing on within-case qualitative data I was able to
strengthen inference, using detail to fill gaps and to connect election outcomes to individuals’
decisions. At the same time I was able to use quantitative data to provide evidence for the
external validity of my case study findings.
A Single Country Study
If there were clear advantages to using mixed methods, there was also a clear disadvantage:
gathering different types of data from different sources took time, and the logistical challenges
16
Also, in some instances the data are likely skewed by social desirability bias as discussed above and in Chapter 8.

23
discussed above added to this. Because neither the time available to me, nor other resources,
were infinite, I chose to base my empirical work solely on Solomon Islands.
In deciding to focus on just one country I sought to navigate an appropriate course through
what George and Bennett (2005, p. 22) call the, “tension between achieving high internal
validity and good historical explanations of particular cases versus making generalisations that
apply to broad populations.”
By focusing on just one country I have placed limits to the extent to which I can make
generalised claims from my findings — claims applicable to the full population of countries
where ethnic politics occurs (Gerring 2004; Poteete 2010). What is true for Solomon Islands
may not necessarily be true elsewhere. Indeed, it may not be true in the countries that were
the basis of the work on voter behaviour I engage with (as discussed in Chapter 6 this is, first
and foremost, the work of Chandra 2004; and Posner 2005). Yet focus on a single country has
meant I have been able to delve in depth and with care into context (Collier et al. 2010). To
have significantly enhanced the cross-country external validity of my work I would have
needed to gather data from many countries, and I could not have done this and focused as
carefully as I have on Solomon Islands.
For my particular study, in addition to the time and resource constraints mentioned above,
there were other good reasons why in-depth examination of one country made sense. First, as
I highlight in my literature review, the existing literature on voter behaviour and electoral
politics in Solomon Islands is scant: if I wanted detail I needed to gather it myself. Second, as
various authors have contended (for example, George and Bennett 2005; Collier et al. 2010;
Poteete 2010), case study work has particular strengths when researchers expect causal
processes to be complicated. That the determinants of voter behaviour in Solomon Islands
were likely not to be simple became obvious to me as I started to analyse election results data
(analysis used in Chapter 7). While quantitative cross-country work has many research
advantages, the need for the simplification of concepts and causal theories that often comes
with converting social phenomena into numbers, means such work brings with it the risk of
oversimplifying these phenomena and the causal processes linking them (Gerring 2004;
George and Bennett 2005; Poteete 2010; Goertz and Mahoney 2012).
None of these justifications for a single case study cures my work of the potential limits to the
extent its findings can be generalised beyond Solomon Islands. Yet they do point to the
potential strengths of, and need for, single-country studies. What is more, while it is but one
case, as I explained in my introductory chapter, the case of the Solomon Islands is an
interesting case. In a range of ways it is a “deviant” case (George and Bennett 2005; Gerring

24
and Seawright 2008; Mahoney 2010): one in which electoral outcomes differ from those that
would be expected on the basis of existing theory. Such deviation makes it a good case for use
in the generation of theory, one which can help identify new variables or theoretical insights
developed on the base of the single country study and subsequently tested elsewhere (George
and Bennett 2005; Yin 2013). In addition, in the concluding chapters of my thesis I engage with
academic work on ethnicity and collective action from other parts of the world and discuss the
extent to which my findings might be applicable elsewhere.
Working with Mixed Methods in Solomon Islands
Between May 2011 and July 2012 I spent 10 months in Solomon Islands. The first two months
were largely devoted to logistical matters, obtaining a research permit, organising field visits,
and the like; the remainder of my time was spent gathering data. In addition to gathering
quantitative data (election results and census data) while in Honiara I also undertook intensive
research in six Solomon Islands electorates. One of these was urban — East Honiara — the
remainder were rural, drawn from different parts of the country. The rural electorates I visited
were: Aoke/Langalanga, South Guadalcanal, Small Malaita, Gao and Bugotu and West New
Georgia. (For a map of Solomon Islands’ electorates see Appendix 1.) I chose these electorates
primarily on the basis of their election results – that is, I selected electorates which presented
a range of different election results, and a reasonable geographic spread over the country.
Basic details on all of Solomon Islands electorates is available in Appendix 3 with the
electorates I focused on highlighted.
I am aware that by selecting constituencies on the basis of election results I have come close to
violating one of the fundamental tenets of political science research: not to select cases on the
basis of values on the dependent variable (Shively 2009). However, my selection was based
upon getting a spread of results on the dependent variable, not simply selecting on the basis of
the presence or absence of a feature of interest, which is the primary source of problems in
this area (Van Evera 1997). Moreover, because I use process tracing within electorates, rather
than cross-electorate comparisons (discussed more below), the issue is reduced (George and
Bennett 2005).
I spent, on average, about three weeks in each of the electorates I visited (although my visit to
West New Georgia was shorter). In each electorate I visited three or four villages usually
staying for about one week in each village.
Using Constituencies as Cases
Possessing data on six different electorates, one approach that I could have taken in analysis
was controlled comparison between the different cases using variance across electoral

25
outcomes and between social attributes of the different electorates to isolate factors of
importance in determining voter behaviour (Van Evera 1997). Because of the range in election
results between Solomon Islands constituencies (as discussed in Chapter 4 some electorates
have as few as one candidate standing, others more than 20) as well as the large variance in
social and demographic features across electorates, this had seemed a possibility when I
started my research. Yet ultimately I concluded it an unlikely means of generating the answers
I sought. First, with only six cases, and numerous potential influences on voter behaviour and
election outcomes in each electorate, strict case comparison would have been rendered
difficult or impossible by the so called degrees of freedom problem, in which it is impossible to
isolate the causes of different outcomes across cases because too many causal variables differ
between them (Hall 2003; Goertz and Mahoney 2012). Second, as I detail in Chapter 4 and
again in my results, much of the variance in election outcomes in Solomon Islands occurs
within electorates across time, rather than between electorates. This variance does not take
the form of strong country-wide trends in election outcomes across time. Rather, it is
predominately fluctuations in results across time within electorates. For example, in the
electorate of Central Guadalcanal six candidates stood in 1980, four in 1993, eight in 1997 and
only two in 2010. This prevalence of variation across time suggested to me that the impact of
structural features on electoral outcomes was likely to be complex and contingent, and
unlikely to be easily captured using simple small-n cross-case comparison.
Process Tracing
Instead, the significant variations over time in election outcomes pointed to another approach
to case study analysis: process tracing. Process tracing is not the only qualitative
methodological approach I drew upon. In particular, in common with almost all political
research on Western Melanesia, I also made use of what Van Evra (1997, p. 70) calls the
“Delphi Method”, immersing myself and interviewing as many participants in the Solomon
Islands electoral process as possible to garner insights from their first hand experiences of
electoral politics. This proved a rich source of material — material which forms much of the
basis of the first half of Chapter 8. Yet, although I draw upon insights gathered in this way,
process tracing was the primary tool I used as I worked to describe and generate theory in
Chapters 8 and 9.
Process tracing — a term often associated with the work of Alexander George and Andrew
Bennett (for example: George and Bennett 2005) — and the related concept of causal process
observations (see: Collier et al. 2010) pertain to an approach to case study analysis in which
outcomes in cases are linked causally to preceding states of affairs through the study of facts
and observations.

26
George and Bennett (2005, pp. 6-7) describe process tracing as an undertaking:
[W]hich attempts to trace the links between possible causes and observed outcomes. In process-tracing, the researcher examines histories, archival documents, interview transcripts, and other sources to see whether the causal process a theory hypothesizes or implies in a case is in fact evident in the sequence and values of the intervening variables in that case...Process-tracing can perform a heuristic function as well, generating new variables or hypotheses on the basis of sequences of events observed inductively in case studies.
And in the words of Collier, Brady et al. (2010, p. 184):
A causal-process observation is an insight or piece of data that provides information about context or mechanism and contributes a different kind of leverage in causal inference. It does not necessarily do so as part of a larger, systematized array of observations. Thus, a causal-process observation might be generated in isolation or in conjunction with many other causal-process observations – or it might also be taken out of a larger dataset…It gives insight into causal mechanisms, insight that is essential to causal assessment and is an indispensable alternative and/or supplement to correlation-based causal inference.
Process tracing involves examining sequences of events, and considering counterfactuals to
determine the fit, or absence of fit, of various possible causal explanations associated with a
case (Van Evera 1997; George and Bennett 2005; Bennett 2010; Collier et al. 2010; Collier
2011).
For example, through interviews (all described in further detail in Chapter 8) I was able to learn
how first-time candidate David Day Pacha leveraged church and kin-based ties to win in South
Guadalcanal constituency in the 2006 general election, and how he was then able to use
judicious distribution of private goods and local public goods in a way that caused his support
base to grow substantially prior to the 2010 election. Doing this involved tracing the processes
at play in Pacha’s electoral rise; and this learning, in turn, afforded me an insight into the
relative roles played by ethnic ties and by other factors in constituency politics.
As with this particular example, and in contrast with some process tracing work, particularly
that focusing on historical phenomena, the processes that I trace are short — sequences of
events that took place over a campaign, or across the period of time between elections. The
processes I look at are also micro, rather than macro, I am not seeking to explain revolutions or
the fates of nations, but rather the experiences of political actors and voters as they navigate
the challenges of electoral politics. Reflecting this, as well as the scarcity of written material
documenting electioneering and electoral campaigns in Solomon Islands, the processes I trace
are those I could track using election results, and explain on the basis of interviews.

27
Although some authors have formulated specific ‘tests’ that can be used as part of the
process-tracing enterprise (Van Evera 1997; Bennett 2010; Collier 2011) this is not the
approach I take. Rather, in common with a number of other users of process tracing (for
example, Brady 2010; Bakke 2013), I process-trace not by subjecting evidence to ‘tests’ but
through the broad, systematic analysis of different sources of evidence and the careful
consideration of alternative explanations.
Large-N Analysis
Working within cases in this way I am able to provide rich and detailed explanations of the
causal processes threaded through Solomon Islands electioneering. Yet were I to base my
research solely on data gathered from a small sub-set of electorates I would run the risk of
introducing bias into my study. Potentially, either by chance, or as a result of some non-
random feature associated with the availability of access to particular constituencies, there
would have been the risk that the electorates I focused on were atypical. The electorates
appeared to be a reasonably representative sample of those in Solomon Islands on the basis of
the election results data, but there remained the possibility that they were different in some
unobserved way.
One way I was able to partially reduce this risk was by interviewing people from as many
different electorates as possible while I was in Honiara to gather a sense of whether my
observations from the constituencies I visited were broadly representative. Ultimately I was
able to interview people from all but one of Solomon Islands’ 50 electorates (more details on
my interviewees is provided below). While my primary reason for doing this was to afford a
form of nationwide representativeness to my interview data, in some cases these interviews
provided important information which allowed me more general insights, and became key
sources. In a similar manner I was also able to make some use of the limited, aggregate RAMSI
People’s Survey data that were made available to me, setting the insights I gathered from
interviews against survey results, drawing upon similarities to gather a better sense of the
external validity of my interview-derived insights.
Most importantly, as a means of adding breadth to the depth of my within-case analysis I also
made use of regression analysis, running regressions on electoral and census data. As I
discussed above, these data are not perfect: in particular, they do not cover every variable of
interest. Yet they were sufficient to allow me to show systematically in Chapter 7 that existing
theories of ethnic voting do not fit the Solomon Islands context, and in Chapter 9 that the
theory I built from my cases has external validity across the country.

28
Data
Qualitative Data
The qualitative data that I drew upon came primarily from 312 interviewees, who I interviewed
while in Solomon Islands (in instances I interviewed more than one person at the same time;
my total number of interviews was approximately 250).17 Interviews were undertaken in the
six focus electorates listed above and in Honiara. Typically, in focus electorates I visited and
stayed in villages spread geographically across the electorate and with some meaningful
spread in election results (i.e. one village that had voted heavily for the current MP, one which
had not, and one which fell between the two). In doing this I sought to capture the
perspectives of a range of people – striving to avoid, for example, only interviewing supporters
of the current member of parliament.
My interviewees fell into seven broad categories: MPs or former MPs; candidates or former
candidates; campaign operatives; village level brokers; community leaders; voters; and other
commentators (a small category including some Honiara-based civil servants and civil society
representatives). I have made all interviewees anonymous except those who were (current or
previous) politicians or candidates, and who explicitly gave me permission, in writing, to use
their names. In Appendix 4 I provide tables that show my interviews broken down by
electorate, gender, and interviewee type.
Following suggested practice for process-tracing type research I primarily sought interviewees
through purposeful, rather than random sampling, seeking those best placed to provide me
with the evidence I was interested in and those more likely to be forthcoming in conversations
(Tansey 2007). Generally, I gathered my interviews through something akin to the snowball
technique, in which I gained suggestions for, and access to, interview subjects through
contacts, through the contacts of contacts and so on (Tansey 2007; Rathbun 2009). This
proved a practical means of getting access to and gaining the trust of interviewees (who were
more likely to say yes to an interview if I was introduced to them by someone they knew). Yet
such an approach alone might have introduced bias, guiding me only into particular subsets of
the groups I wished to interview (King and Horrocks 2010). To minimise this risk I also
independently selected people to interview, purposefully seeking out interviewees (both in
villages and in Honiara) outside the ‘snowball’, whom I did not have contacts for but who
appeared likely sources of information (former candidates for example).
Interviewing was not without challenges. In parts of rural Guadalcanal and Malaita it would
have been culturally inappropriate in most instances for me to interview women on my own.
17
Needless to say, I do not cite all of these interviewees in my thesis.

29
When this was the case my wife accompanied me to interviews. Even then it was hard to
obtain interviews from women in some communities, and they were often much less confident
in interviews than men and less forthcoming with information. Young people (old enough to
vote but younger than I) were also often quite shy. In some cases interviewing people in small
groups helped with shyness, and in other instances I was able to establish trust through
repeated interactions over time.
It was also, as anticipated, hard to obtain interview information free from bias. Social
desirability bias, as discussed above, was an issue in instances. Similarly, it was difficult at
times to obtain information untainted by politicking. MPs and candidates were quick to tar
their opponents with allegations of cheating while at the same time claiming they alone ran
clean campaigns.
Fortunately, the method of semi-structured interviews and qualitative analysis of these
interviews provided means of overcoming, at least in part, these challenges. The free flowing,
generally relaxed environment of an interview meant I was frequently able to build rapport
with reticent interviewees (Rathbun 2009; King and Horrocks 2010). It also afforded flexibility,
allowing me to pursue alternate lines of questioning when my initial queries proved fruitless
(Rathbun 2009). And as I conducted more interviews I learnt the types of questions likely to
draw more helpful responses (King and Horrocks 2010). Qualitative approaches also enabled
me to draw more heavily on those interviews that went well. In some cases I was able to
establish excellent rapport with interviewees and these interviews provided much information
on elections and voter choice. I was also able to corroborate claims through asking multiple
interviewees about the same phenomenon (why candidate X was popular in village Y, for
example) (Rathbun 2009).
The qualitative approach, and my use of it in case studies also enabled me to assess, and to
draw more heavily on, interview information that was less likely to be skewed by self-justifying
politicking. When, for example, a candidate accused another candidate of vote buying I tended
to place limited weight on this evidence. When a candidate admitted to vote buying
themselves I tended to place more faith in the claim, as it was unlikely to be self-serving. Also,
because my study has made use of both quantitative and qualitative data I was able to
triangulate between the two, drawing on quantitative data such as polling station level results
to help verify the claims made by interviewees (Tansey 2007; Poteete 2010; Yin 2013).
Beyond interviews, other qualitative sources I have used are government reports (such as
Electoral Commission reports), newspaper reporting, and useful academic work (such as

30
anthropological studies of parts of Solomon Islands). All of these sources are referenced in the
usual manner.
Quantitative Data
The quantitative data used in my study are: election results; electorate level demographic and
social information; and candidate bio-data.
The election results data take the form of two different databases. The first database is one I
created of results by constituency for all general elections, and some by-elections, that have
taken place since the Solomon Islands gained independence in 1978.18 The database is based in
part on data that were kindly provided to me in electronic form by academic Jon Fraenkel. I
reformatted the data I was initially presented making it more amenable to my analysis,
validated it by checking it to official election results in Honiara (where such results were
available),19 and augmented it with additional by-election data and data for pre-independence
elections, as well as any further information I was able to obtain about candidate party
affiliation, gender and the like. I also obtained constituency maps and traced electorates across
redistricting which occurred in 1993 and 1997 to allow comparisons between current
electorates and their antecedents when required. I standardised the spelling of candidate
names and party names over time. In addition I calculated for each electorate, for each
election, statistics such as the Effective Number of Candidates and the winning candidate’s
vote-share.20
The second database I created is of results by polling station for the 2006 and 2010 general
elections as well as for a number of post-2006 by-elections. These data are particularly useful
as they display the extent to which different candidates drew support from around their
electorates. Some of the 2010 data came via Jon Fraenkel, the rest I obtained largely from the
Solomon Islands Electoral Commission, although they themselves were not in possession of a
complete dataset. I was able to obtain more data from candidates in some instances, although
ultimately was left without 2010 polling station results for one electorate, East Guadalcanal,
and had only incomplete data for East Honiara in 2010. The Electoral Commission provided me
with 2006 general election and that by-election data I was able to obtain. As with 2010 results,
the 2006 dataset was incomplete and I do not have polling station data for three electorates in
18
I now also have data from pre-independence elections as far back as 1967, although I have not drawn on these heavily both because the stakes of the political game were different pre-independence and because I was unable to map district boundaries for the electorates used pre-independence. 19
In validating the data I found very few errors. 20
Effective Number of Candidates is a calculated figure — I discuss its calculation and its meaning in Chapter 4.

31
2006: Central Honiara, Malaita Outer Islands and Nggela.21 Once in possession of polling
station data I mapped polling station numbers to polling station names and polling station
names to village locations.
Election result data, as I explain in Chapter 4, are generally thought to be accurate in the sense
that they are free from large-scale electoral fraud occurring during the counting process. This
is not to say that cheating does not occur: it does, in the form of vote buying and voter
coercion, both topics I discuss in my results. But the relative absence of fraud in the counting
process means that my election data at least reflect the outcomes of on-the-ground
interactions between voters and candidates even if in some instances choice is constrained, or
artificial in the sense that support was purchased. On the other hand, electoral roll data
diverge considerably from my estimates of voter numbers based on census data, and the
electoral roll is generally regarded to be inaccurate (Commonwealth Secretariat 2006;
Commonwealth Secretariat 2010; Paternorte and de Gabriel 2010). For these reasons, where I
have reported on electorate size and statistics such as voter turnout I have used census data to
estimate the number of eligible voters in an area.
The census data that I have drawn upon comes primarily from the 2009 and 1999 censuses,
both of which I was able to obtain in an electronic format. In the case of the 2009 census,
some data are from preliminary reports (although as discussed above they reconcile well with
data from the final report which was released as I revised my thesis), and in some instances
the 1999 census was impeded by conflict occurring at the time it was undertaken. Neither
census is as accurate as would be ideal. However, there are reasons to believe that, while
issues exist, neither is wildly inaccurate. For example when I compare census statistics (such as
population) by electorate between the two censuses the numbers correspond (allowing for
population growth) fairly well, except for those constituencies in North Guadalcanal which
were effected by conflict at the time. This affords some confidence as it is unlikely that
fictional or extremely erroneous data would lead to similar results in two different censuses.
The final dataset that I drew heavily on was a database I created of MP and candidate bio-data.
I built this database using MP bio-data that a colleague and I gathered from the Solomon
Islands parliament, along with candidate bio-data I gathered as I interviewed people from the
various different Solomon Islands constituencies. Solomon Island electorates are small both
geographically and in population, and candidates tend to be high profile individuals (Corbett
and Wood 2013), and it is remarkable how well versed most voters are with regards to key
21
In one further electorate, North New Georgia, no election was held, owing to there being only one candidate standing.

32
candidate attributes such as language group, religion and village of origin — something that
made gathering bio-data easy (albeit time consuming). Ultimately, I was able to get such data
for almost all electorates and for almost all candidates. Where possible I cross validated by
gathering information for each electorate from more than one source.
In some instances I have made limited use of other quantitative data. For example government
composition data used in Chapter 7 and the RAMSI People’s Survey. When I do this data
sources and details are provided.
In Appendix 3 I provide tables that detail key electoral and demographic features for each of
Solomon Islands’ 50 electorates.
Conclusion
In this chapter I have described the research approach that my study is built around. I began by
noting that as a post-positivist I am interested in causal analysis and the testing and generation
of theories. I then explained why I decided to use mixed methods and focus on a single country
for my study. I also detailed how I worked within the country context, using both quantitative
and qualitative data. The results of my analysis come primarily in the latter chapters (7-9) of
my thesis. First though, in the following chapters, I set the stage for my research, commencing
this task by providing the reader contextual information on Solomon Islands society and
politics.

33
Chapter 3 – State and Society in Solomon Islands
This chapter sets the scene for my study. In it I provide background on Solomon Islands’
economy, geography and society. In doing so I pay particular attention to social features that
give form to the collective interactions of Solomon Islanders.
I discuss the family unit and broader descent based groups (clans) as well as villages, race and
language groups.22 I also cover churches, community groups, non-governmental organisations
(NGOs) and trade unions. Some of these groupings — particularly race, churches, language
groups and clans — are of special interest as, on the basis of what has been written elsewhere,
they are identities around which we might expect ethnic politics to form. Even those groupings
such as NGOs and trade unions that are not potential building blocks for ethnic politics per se
play — in some countries at least — important roles in collective political action. Likewise,
villages are not ethnic groups, yet locality can also structure electoral politics. In the final
section of the chapter I expand my focus to look at examples of collective action that have
either taken place around the edges of the groups already examined or which transcended
them.
Through this description I aim to provide the reader with a sense of the social environment in
which Solomon Islanders make choices when they vote.
Population, Provinces and Patterns of Settlement
About 20 per cent of Solomon Islanders live in urban areas, the rest live in rural villages
(Solomon Islands National Statistics Office 2012, p. 6). Honiara, the nation’s capital, is the only
urban area that could plausibly be called a ‘city’, with a population (in 2009) of approximately
80,000 spread across the city itself and surrounding peri-urban settlements (Solomon Islands
National Statistics Office 2012, p. 1). Of the remaining census wards classified as urban only
Auki on Malaita has a population of just over 5,000. Some of the country’s other ‘urban’ areas
are quite substantial (Gizo, Noro and Munda in Western Province each have populations of
approximately 3,000 people) but others, such as Buala, the provincial capital of Isabel are little
more than large villages themselves (Solomon Islands National Statistics Office 2012, p. 6).
22
As discussed later in this chapter I use the term ‘race’ throughout this thesis to refer to the specific ethnic identity which contains within it groups such as Chinese, Melanesian, and Polynesian — I do not use it as a synonym for ethnic group more broadly.

34
Figure 3.1 – Map of Solomon Islands’ Provinces
Administratively the country is divided into 10 units — nine provinces plus the Honiara
municipal council (see Figure 3.1). Demographically there is considerable variation both in
population and population density between the provinces. In geography the provinces also
vary: almost all of the population of Guadalcanal Province live on one large, mountainous
island; while the population of Western Province is spread across numerous islands of
different sizes; and the population of Temotu Province is dotted amongst a handful of small
island groups. Levels of development vary somewhat from province to province although, as
outlined in the introduction, the country as a whole has low levels of human development and
even its wealthiest provinces remain relatively under-developed by Pacific standards.
Just as there are clear differences between provinces, there is also considerable within-
province variation at the electorate level. Malaita, for example, contains both the country’s
least populous electorate (Malaita Outer Islands with a population of 2,345 at the 2009
census) and its fourth largest (Central Kwara’ae, population 17,273 in the 2009 census).
Appendix 2 and Appendix 3 provide summaries of key demographic, geographic and
development statistics for provinces and electorates.
Life in Villages and Settlements
For most Solomon Islanders the state plays only a very limited role in the provision of services.
In most villages electricity, if available at all, comes from privately owned diesel generators
and solar panels. Similarly, water and sanitation facilities tend to be rare and, if provided,
provided through community initiatives (ANU Enterprise 2011, p. 48).

35
While all but the most remote villages have some access to health clinics and schools, the
quality of education is often poor, and clinics are typically only able to provide limited care
(ANU Enterprise 2011, p. 41). Primary schooling is nominally free but schools still levee charges
and raising money for school fees is a significant challenge for many families (ANU Enterprise
2009, p. 31; ANU Enterprise 2010, p. 68). Secondary schooling is not free and requires travel to
one of a small number of national secondary schools.
Roads are rare outside of urban areas (Bourke et al. 2006, p. 7) and in their absence land
transport for most Solomon Islanders involves walking. Maritime travel takes place in small
canoes and fiberglass boats, and over larger distances via ferries. Ferries are often slow and
their timetables irregular, while the cost of diesel means that long or repeated journeys on
motorised fiberglass boats is beyond the means of many Solomon Islanders. Wharves and
other marine transport infrastructure are frequently run-down and on land even major roads
are in poor repair. Because of this travel within Solomon Islands is often arduous and usually
slow (Bourke et al. 2006; ANU Enterprise 2011, p. 47).
The reach of legal infrastructure into the villages is also minimal. Access to courts for those
seeking to clarify issues such as landownership is limited (Allen et al. 2013), and police
assistance in dealing with crime frequently inadequate (Dinnen and Allen 2012; Dinnen and
Haley 2012; Allen et al. 2013).
Access to media and other communication is also poor, although the availability of some forms
of communication is growing. Internet access, albeit access constrained by low bandwidth, is
available in Honiara and — to a more limited extent — in provincial capitals (ANU Enterprise
2010, p. 11). Television is largely confined to Honiara and some provincial capitals, while the
country’s two newspapers are most regularly available in Honiara and, less frequently, in larger
provincial capitals (Wickham 2004; Commonwealth Secretariat 2006). As of the 2009 Census
44 per cent of households owned at least one radio (Secretariat for the Pacific Community
n.d.) and radio broadcasts can be received, if in many instances only intermittently, in much of
the country (Wickham 2004; Commonwealth Secretariat 2006). Mobile phone coverage has
improved markedly, and at the time of the 2009 census 21 per cent of households reported
owning at least one phone, a number which has almost certainly gone up significantly since
(ANU Enterprise 2011, p.102 & p.107).
While poor infrastructure and the absence of services is felt most acutely in rural parts of the
country, residents of Honiara and other urban areas do not always have much better access —
police responses to call-outs can still be slow, and while running water and electricity are
provided (if only intermittently) to formally settled parts of Honiara, most of the informal

36
settlements that are home to many of Honiara’s residents are without these services (Hou and
Kudu 2012, p. 8).
Economic Life
Preliminary results from the 2009 census list the primary occupation of 41 per cent of Solomon
Islands’ economically active population as ‘producing goods for own consumption’ (effectively
subsistence). A further 12 per cent produce agricultural commodities for sale in the semi-
formal economy. Only 26 per cent of working age Solomon Islanders described themselves as
employees, employers, or self-employed (Solomon Islands National Statistics Office 2013, p.
vi).23
While, in rural areas at least, access to the land provides a limited form of ‘safety net’ through
the food it provides, economic life for ordinary Solomon Islanders is not easy. Eighty two per
cent of those surveyed in 2010 described their financial situation as either ‘a little hard’ or
‘very hard’ (ANU Enterprise 2010, p. 69). Rising prices of imported food-stuffs along with
transport costs and school fees are an increasing burden, particularly as many households are
cash poor and those that seek to augment their income are often stymied. Poor infrastructure
makes it hard to transport agricultural produce for sale, and high levels of unemployment
mean that, for most, the chances of getting a job in the formal sector are low. For most
Solomon Islanders economic needs are relatively high, while opportunities for earning to meet
these needs are scarce.
Groups, Social Structures and Social Life
Woven amongst the day-to-day lives of ordinary people, the forms that structure the social
sphere of Solomon Islanders have shown marked resilience. Change has occurred — traditional
ties have been stressed, old institutions weathered, and new entities born — yet many of the
features and norms that currently condition social interactions are the same ones, if in a
partially transformed state, that provided structure to people’s lives when first observed by
anthropologists writing in the early 1900s.
The Family
In Solomon Islands the family is the basic collective social unit, with the concept of ‘family’
extended to incorporate cousins, second cousins and potentially even more distant relatives
23
The proportion of wage and salary earners drops discernibly if Honiara and other large urban areas are excluded from the analysis. It should also be emphasised these numbers refer to primary occupation. Many of those who are primarily engaged in subsistence agriculture will still supply at least some goods into the cash economy.

37
(Moore 2004, p. 27). Kabutaulaka (1998, p. 21) summarises the role of the family in Solomon
Islands life:
Throughout Solomon Islands the most basic and fundamental social group is one’s kin or family unit. Most people identify with the family and immediate relatives in political, economic and social activities. The family is defined as the extended family. It is with the family that gardens are made, wealth is accumulated and feasts are given. And increasingly today, it is from within the family that businesses emerge.
Needless to say, in Solomon Islands, as elsewhere, family does not inevitably mean harmony —
rates of domestic violence are high (Secretariat for the Pacific Community 2009) and there are
examples of brother standing against brother in elections and, in one instance, husband
standing against wife24 — but, despite this, for most, the family unit remains an essential
building block of collective action, bound by mutual care and rules of reciprocity.
The Clan
One level up from the family is the clan.25 Clans are groupings of people linked by assumed
shared ancestral descent, bound by social rules, sharing common leadership of at least some
form, and associated with collective land ownership even if only at sub-group levels (this
definition is adapted from, Keesing and Strathern 1998, p. 190).
Kabutaulaka (1998, p. 23) describes the clan (which he also refers to by the synonym ‘line’ as):
an extension of the kinship group…It is bigger than the immediate kinship group and the population of a clan is usually spread out over a larger geographical area. There is usually a strong political alliance within a line although some activities carried out by an immediate kin group may not necessarily incorporate the entire clan. For example, it is rare to see the establishment of a business venture that includes an entire line although people often have businesses within the family. The line, however, is the basis or the defining group for land ownership.
As is suggested by Kabutaulaka’s talk of ‘political alliance’ social rules play an important role
governing conduct within clans (Scheffler 1963; Scheffler 1985; White 2007; Nanau 2011).
While such rules govern numerous areas of life including marriage and land use, most
24
In 2010 Bernard Ghiro stood against his brother Nestor Ghiro in the Central Makira electorate while the husband and wife contest was between Frank and Catherine Pule in Nggela electorate in 2001. The Pule’s are now divorced and may have already been estranged at the time of the election. In any event Frank Pule was able to win despite the challenge from his wife. Both Bernard (who was the incumbent MP) and Nestor Ghiro lost in 2010. 25
I use the term ‘clan’ here to refer to the social unit that Solomon Islanders call ‘laen’ or ‘traeb’ in Pijin. My use of the term is more or less in line with the use of the term in anthropology although, at least in some instances, anthropology limits the use of the term clan to exogamous social units, whereas marriage outside of the group is not always required by groups I refer to as clans.

38
importantly for this thesis social rules associated with clans typically include strong norms of
reciprocity and obligation (Braithwaite et al. 2010, pp. 71, 99; Nanau 2011, p. 45).
Clan Structure
Throughout Solomon Islands (and Western Melanesia more generally) there is considerable
variation in clan structure. All clans are based on descent, but descent may be traced down
maternal lines, paternal lines, or both (Oliver and Johnson 1989). And the intersection of
descent rules and inheritance rules may see men living in the same communities as their
fathers, or expected to move to the community of their mother’s brothers upon coming of
age, or expected to move to their wife’s community on marriage.
In some instances clans form components of larger aggregates. Sometimes these aggregates
are spatially bound (for example, individual clans brought together under a local house of
chiefs) in others the aggregating form may be geographically cross-cutting. In parts of Solomon
Islands such cross-cutting entities and/or marriage-associated migration afford clan-based ties
and connections across quite large areas. In particular, distinct geographically cross-cutting
clan-related ties can be found throughout most of Central Province (Hogbin 1937; Allan 1957;
Foale and Macintyre 2000), Guadalcanal (Hogbin 1937b; Bennett 1974; Scheffler and Larmour
1987), Makira (Scott 2000; Rural Development Division 2001d), and Isabel (Bogesi 1948; Rural
Development Division 2001c; White 2007).26 Similarly, in Western Province migration and
cognatic descent systems mean that clan-type relational ties are, in effect, geographically
cross-cutting throughout much of the province (Scheffler and Larmour 1987). To a degree this
contrasts with provinces such as Malaita, where cross-cutting ties are, on average, weaker
(Allan 1957; Scheffler and Larmour 1987), although even in Malaita migration means that
geographically cross-cutting ties of a sort exist to an extent in some areas (for example, Burt
1994, p. 322; Burt 1994b, p. 28).
Importantly, clan ties are not the only relational ties possessed by Solomon Islanders, and
other ties — such as those to do with marriage — can, to an extent, reach across clans (Oliver
and Johnson 1989, p. 1149). This means the ties associated with clans are not perfectly binary
in the sense that person A might be expected to have full ties to person B but no ties to person
C. In reality the rules that govern, the traits that identify, and the ties that bind, are gradated.
Person A can have strong ties with person B, somewhat weaker ties with person C, and distant
ties to person D (Keesing 1968; Hviding 2003).
26
While they exist throughout most of the provinces listed there are exceptions: migrants into Central Province for example, and ‘Are ‘are speakers in Eastern Guadalcanal.

39
Similarly, clans themselves are not domains of blind loyalty, and while it is easy enough to
speak of membership and rules in the abstract, in practice there is fuzziness (Hviding 2003;
McDougall 2005) and an element of adaptability (Hviding 1993). Yet, despite blurred
boundaries and the presence of other ties, clans nevertheless play a significant role in
structuring the interactions of most Solomon Islanders (Kabutaulaka 1998; Scott 2007; Nanau
2011).
Clan Size
Owing to variation across the country and the rarity of attempts to quantify social data in
Solomon Islands it is not possible to accurately report individual clan sizes. However, a ballpark
estimate is possible, affording a sense of the order of magnitude of the typical clan. On the
basis of interpretations of the terms used in a range of reports (Bogesi 1948, p. 213; Bennett
1974, p. 17; Bennett 1987, p. 14; Scheffler and Larmour 1987, p. 305; Oliver and Johnson 1989,
p. 1077; Provincial Government Development Unit 1998a, p. 6; Foale and Macintyre 2000, p.
33; Sanga 2005, p. 443) combined with my own observations (I was given reliable data for the
number of clans in the Langalanga language area) and census data (specifically ward
population data from Solomon Islands National Statistics Office 2000) a reasonable estimate
would seem to be that the typical clan ranges in size from 100-400 people, although in some
provinces, particularly Isabel and Rennell and Bellona, clans can be significantly larger.27
Obviously, numbers of people grouped by clan aggregates (such as houses of chiefs and
moieties) are also larger.
Villages and Communities
For most Solomon Islanders the village, or in urban areas the suburb or settlement, is the key
staging point of on-going interaction and collective action.28 On a day-to-day basis people
socialise, do business, and cooperate (or fail to cooperate) first and foremost with their
neighbours.
The results of the 1995 Solomon Islands Village Resource Survey (Solomon Islands National
Statistics Office 1997), and tabulations of 1999 census data undertaken by the Australian
Government Defence Imagery and Geospatial Organisation (DIGO) (2005) suggest there are
between 5,000 and 6,000 villages in Solomon Islands. Calculations based on the DIGO data give
an idea of the range and frequency of village sizes in Solomon Islands. In 1999, 19 villages had
populations of greater than 500, while 132 villages had between 250 and 500 people living in
27
Reports of larger clans in these two provinces need to be treated with some caution. This is because, in some cases at least, in the two provinces in question the closest practical approximation to groups referred to as clans elsewhere are probably smaller sub-groupings of the larger groups formally called ‘clans’. 28
For many urban dwellers, home villages also remain a key point of reference and identity.

40
them, and 616 villages had between 100 and 250 people living in them. The vast majority
(4,924) of Solomon Islands villages had fewer than 100 people living in them. However, these
numbers need to be treated with some caution. When surveying villages it is not always clear
what ought to be counted as a village and what ought to be counted as a hamlet (a small sub-
village cluster of houses). And the counting of hamlets as villages has likely biased village sizes
downwards and village numbers upwards in the figures I have just given.29
As already noted, some of the Solomon Islands provincial capitals, which are classified as urban
in census data are themselves little more than villages (or small groups of villages). However,
the largest urban areas, particularly Auki and Honiara, are quantitatively and qualitatively
different from the rural communities, although the towns themselves are broken into different
suburbs and settlements which, particularly in the case of informal settlements, have some of
the characteristics of villages. Accurate recent data on the size of Honiara’s settlements and
suburbs is hard to obtain, although numbers provided by Stritecky (2001, p. 264) suggest, by
way of an example, that Gilbert camp, a large informal settlement, had a population at the
time of about 1,950 people.
Rural villages can be homogenous with all village members being from the same clan (or
related by marriage) and the same church. Probably more common though, and almost
certainly the case amongst larger villages, are situations where a number of clans live in the
same village. More than one church group in the same village is also quite common in larger
villages. For example, Lapli et al. (2008) give examples of villages in Temotu that comprise only
one clan as well multi-clan villages, including one village home to 11 clans, while the Justice
Delivered Locally field report (2012) describes villages of a range of different compositions in
Malaita. The same report also discusses villages comprised of differing numbers of church
groups.
Urban settlements are usually considerably more diverse than villages, although they often
contain a particular language group at their core. For example, Stritecky (2001, p. 264) notes
that while Gilbert camp had a population that was largely (65 per cent) speakers of the
Kwara’ae language, speakers of at least 47 languages resided within the settlement.30 Similarly,
religious diversity is typically high amongst Solomon Islands urban communities. Residents of
urban settlements often retain strong attachments to rural areas where they were originally
29
Owing to ambiguous wording it is hard to be certain, but it appears the Solomon Islands National Statistics Office (1997, p3) has attempted a calculation of mean village size correcting for this issue. Mean village size on this calculation is 71. A similar calculation in that report which combines smaller sub-villages into larger villages suggests 4,174 villages exist across the country. 30
This was calculated prior to the evacuation of the settlement during the ‘Tensions’ conflict and it is plausible that in its subsequent resettlement its composition may have changed somewhat.

41
from and migration back and forth between rural and urban areas is common (Allen et al.
2013).
Community Governance
Given proximity, and the resulting inevitability of at least some externalities arising from
individuals’ actions, along with the fact that shared residence necessitates on-going
interaction, it would be highly surprising to find Solomon Island villages and urban
communities bereft of mechanisms of governance and rules, and such institutions are present,
to differing extents, in all communities (Allen et al. 2013). Indeed, some of the anthropological
work on Solomon Islands could be read as suggesting that the most important social structure
shaping collective action in parts of the country is the village (for example, Scheffler 1963;
Keesing 1971; Scheffler 1985). In instances where villages are divided amongst a number of
different clans overarching governance structures usually arise to manage interactions (for
examples see: Rural Development Division 2001; Lapli et al. 2008; Justice Delivered Locally
Field Team 2012), although unity of purpose and harmony of governance within villages is far
from guaranteed. For example, the Justice Delivered Locally Malaita Province Field Note (2012)
describes a number of villages struggling with divisions and issues of collective governance,
and it can be safely assumed the same problems are prevalent throughout much of the
country.
Much less has been written about urban community governance in Solomon Islands than has
been written about village governance; however, from available literature it appears that
community groups, family groups and churches often at least partially fill the need for
community governance in urban communities (see, for example: Hou and Kudu 2012, p. 32).
Although, once again, efforts to govern urban communities are not always successful.
Community and Clan Leadership
Leadership models associated with clans and communities vary considerably across the
country. Generally, leadership tends to be hereditary in Polynesian parts of the country (the
province of Rennell and Bellona and some other smaller outlying islands) and earned in
Melanesian parts.31 However, there are exceptions to this. Some Melanesian communities —
for example in southern parts of the ‘Are ‘are language group as well the neighbouring Sa’a
language group in Malaita — are governed by hereditary leaders (Bennett 1987, p. 15; Naitoro
31
It is common in discussions of Solomon Islands leadership to refer to hereditary leaders as chiefs and those holding earned leadership roles as ‘big men’, although some Solomon Islanders use the terms interchangeably.

42
1993, p. 11).32 In other areas multiple leadership roles may co-exist (for example clan leaders
and village leaders) with some roles being hereditary and others selected (Ross 1978). To
further complicate matters some systems have partially hereditary leadership where leaders
are selected from amongst chiefly lines. What is more, some ostensibly hereditary systems
may have ‘checks and balances’ of a sort that allows for individuals deemed unfit for
leadership to be denied the opportunity to inherit it (Scales et al. 2002). Meanwhile, there can
be a degree of heritability even amongst groups with nominally selected leaders owing to
status and material advantages being passed from leaders to their offspring (for examples see:
Scheffler and Larmour 1987; Provincial Government Development Unit 1998b).
The power of leaders varies considerably too, in some places leaders hold considerable sway,
in others their power has been undermined, either as a result of the leaders’ own failings or
through the arrival of new external influences (Rural Development Division 2001b; Scales et al.
2002; Lapli et al. 2008; Justice Delivered Locally Field Team 2012).
Language Groups
Solomon Islands is one of the most linguistically diverse countries on Earth. The 1999 census
lists 94 languages spoken across the archipelago (Solomon Islands National Statistics Office
2000, p. 46).33 The standard measure of ethno-linguistic fragmentation used in development
economics is a fragmentation index, calculated as 1-HH, where HH is the Herfindahl–
Hirschman score of language shares (see: Alesina et al. 2003). Undertaking this calculation on
1999 census data returns a result of 0.97. The same calculation undertaken on the one other
comprehensive source of language data for Solomon Islands, that compiled by Tryon and
Hackman (1983) returns an almost identical score of 0.96. The largest language in 1999,
Kwara’ae, was spoken by a little over eight per cent of the population (calculation based on
Solomon Islands National Statistics Office 2000, p. 21).
Communication across language groups takes place in Pijin, the country’s lingua franca, and
official government communications are in English. As of the 1999 census, 81 per cent of the
Solomon Islands population (aged over 28 months) spoke Pijin (Solomon Islands National
Statistics Office 2000, p. 50) and it seems reasonable to assume that this proportion may have
increased somewhat as, in the 1999 data, ability to speak Pijin was less common amongst the
elderly (Solomon Islands National Statistics Office 2000, p. 51).34
32
Although there are some exceptions, such as in parts of Isabel province, community and clan leaders are almost always male. 33
No equivalent detailed language data were gathered in the 2009 census. 34
1999 data are used because the 2009 census only asked about literacy in Pijin, not whether it was spoken.

43
As a source of ethnic groupings language has some salience in Solomon Islands. During the
Tensions Malaitan militants organised themselves by language group to an extent (Allen 2007,
p. 204), and in urban areas Solomon Islanders often identify by language (Kabutaulaka 1998, p.
25). Throughout the country language tends to delineate the outer bounds of communities of
shared customs and identity. However, it is rare for language groups to have meaningful
leadership or coordination structures that encompass the group as a whole (something akin to
that which does exist in clans and many villages) (Hogbin and Wedgwood 1952, p. 257).35 As
Frazer (1997, p. 44), argues, “Language is only one basis for identity and not always the most
salient. Of far more importance to most people is their local clan or tribe and the community
with which it is associated.”
Race
Solomon Islands is almost as racially homogenous as it is linguistically diverse.36 Census data
from the 2009 Census describe the country as being 95.3 per cent Melanesian, 3.1 per cent
Polynesian, 1.2 per cent Micronesian, 0.1 per cent Chinese, 0.1 per cent European and 0.1 per
cent ‘Other’ (Solomon Islands National Statistics Office 2013, p. 58). There are no governance
structures or anything similar that coordinate the actions of different racial groups. At times
there has been something akin to an inter-racial element to conflicts and disturbances in
Solomon Islands. Rioting in 2006 in Honiara was focused on the Chinatown area of Honiara and
Chinese stores were looted and torched (Moore 2006), and in 1989 violence broke out
between Melanesian Malaitans and Polynesians from Rennell and Bellona province. However,
race has not become an electoral cleavage in any systematic way in Solomon Islands.37
Religion and Churches
Religiosity is high in Solomon Islands and the most common religious groupings are all
Christian denominations. Figure 3.2 below, based on final 2009 census data, shows the
prevalence of various religious groups in Solomon Islands.
Membership of the major Solomon Islands churches is fairly stable with membership of all the
large religious groupings varying by less than 2 percentage points between the 1999 and 2009
censuses (Solomon Islands National Statistics Office 2000, p. 40; Solomon Islands National
Statistics Office 2013, p. 53). Reflecting patterns of colonial era missionary activity, churches
35
Three examples that I am aware of are the To’abaita and Sa’a councils of chiefs and a community organisation amongst Ko’o speakers on Guadalcanal’s weather coast. Isabel’s council of chiefs encompasses a number of language groups. 36
I use the word ‘race’ here to avoid confusion with my use of the term ‘ethnicity’ elsewhere. 37
Arguably, the looting of stores in Chinatown was political, ostensibly sparked by the selection of Snyder Rini (himself a Melanesian but argued to have links to Chinese business interests) as prime minister. However, the politics involved was the politics of government formation, not electoral competition.

44
are not evenly distributed geographically (McDougall 2008) (for example, residents of the
province of Isabel are almost entirely members of the Church of Melanesia); this is a matter I
will return to when discussing electoral outcomes in subsequent chapters.
Figure 3.2 – Religious Groupings
Chart source: 2009 Census (Solomon Islands National Statistics Office 2013, p. 53). No data are available to allow for the ‘other’ category to be disaggregated. In 1999 it comprised mostly other small Pentecostal groups, along with a few Mormons and members of an indigenous grouping, the Moro Movement. Were it possible to obtain disaggregated 2009 data small numbers of Muslims would also be present, reflecting the arrival and slight rise in prevalence of this religion in Solomon Islands in recent years (McDougall 2009).
Of the civil society organisations to be found operating in Solomon Islands, churches are the
only ones with both breadth and depth of reach (Scales et al. 2002; White 2007). Churches are
to be found in almost all communities and, while the major church groups are far from
identical, either in the way they are governed or the way they ‘govern’ the lives of their
faithful, all play roles in structuring collective action in the communities they operate amongst
(see Burt 1994b, p. 235 for a detailed exposition of this in action in a Kwara’ae-speaking part
of Malaita; also Kabutaulaka 1998; Bird 2007; Joseph and Beu 2008). In most villages churches
and church services are central foci of village life, and churches help shape norms of
behaviour. Often churches’ involvement in village life extends beyond things religious and into
the practical domain of village management, where churches play a role both as the providers
of rules and the arbiters of disputes between different groups (Burt 1994b, particularly
Church of Melanesia (Anglican)
31.9%
Roman Catholic 19.6%
South Seas Evangelical Church
17.1%
Seventh Day Adventist
11.7%
United Church (Methodist)
10.1%
Other 2.7%
Christian Fellowship Church
2.6%
Jehovah's Witness 1.8%
Christian Outreach
1.0%
Animist 0.8%
Bahai 0.5%
No Religion 0.1%

45
Chapter 9; Rural Development Division 2001e; Allen et al. 2013). In some instances,
particularly the Christian Fellowship Church (at least before a recent schism), social rules
associated with religion have been very strong, enabling the church to effectively run
communities where it predominates (Talasasa 1979; Paia 1983; McDougall 2008; Hviding
2011). However, the strength of such rules, and their reach into community life, varies
considerably from denomination to denomination and while all churches are home to some
social rules governing conduct, control of the sort the Christian Fellowship Church has had is
rare (McDougall 2008).
Churches are also often involved in the provision of social services in communities. Writing in
2007 Bird (p. 1) provides the following details:
The mainline churches [sic] involvement in education and health service delivery is significant and dates back to the pioneering stage of their missions. In the education sector, both formal and non-formal, churches provide about 27% of educational services, and in the health sector they provide about 13%.
Churches are, as Bird’s data indicate, still only providers of a minority share of services, with
the state being responsible for considerably more, at least on paper. Yet, church involvement
is non-trivial and in some areas the only services to be found are church provided ones.
Church-based organisations are also an important facet of Solomon Islands life. Church
women’s organisations in particular connect women and facilitate interaction among women
from across different communities, islands and provinces (Pollard 2006). In some instances
churches run other organisations such as youth groups (Bird 2007).
Beyond their religious and community work, at times churches in Solomon Islands have
engaged in varying forms of what might be termed activism. Church groups have, for example,
opposed logging operations (Frazer 1997, p. 59; Bennett 2000, p. 219-222). At times such
activism has occurred in the national political sphere. Church groups played an integral role in
peace-building efforts that took place during the Tensions (Douglas 2007; Joseph and Beu
2008), and more recently Bird (2007, p. 8) describes the Solomon Islands Christian Association
(SICA — an umbrella group representing some churches) making public proclamations urging
cooperation between the Sogavare government and RAMSI, and expressing concern about the
re-arming of police. However, such interventions are fairly rare. Joseph and Beu (2008, p. 4)
conclude that: “In general SICA and the churches tend to steer clear of overt political
involvement.”

46
Secular Civil Society Organisations
Between their religious activities, umbrella organisations, and their various youth and
women’s groups, churches populate much of the civil society landscape in Solomon Islands.
Yet other civil society organisations also exist that can be described as secular in the sense that
they are not run by churches, although in many instances their proclamations, mission
statements, and the like, still draw on religious symbols and language.
NGOs
A number of international NGOs operate in Solomon Islands (World Vision, Oxfam, and Save
the Children were all active when I was there) with their work focusing primarily on
community development projects. While a small subset of these international NGOs have
engaged in something akin to activism (see, Kabutaulaka 1998, p. 31 for the example of
Greenpeace involvement in logging-related activism) they do not engage in electoral politics or
political lobbying. Other than possibly providing assistance to voter education campaigns they
do not involve themselves with elections.
Solomon Islands is also home to a number of home-grown NGOs. In addition to church groups
and village committees which, depending on how one defines an ‘NGO’ might possibly warrant
inclusion in this category, there is a range of more obviously NGO-like groups of differing scales
and structure in operation. These include small local community development groups that
hinge on the work of one or two members, larger interest groupings that lack formal structure
such as the Women in Politics ‘committee’ described by Pollard (2003, p. 50), as well as a
number of organisations such as the Solomon Islands Development Trust (SIDT) and the
Development Services Exchange (DSE) that have clear formal structures, paid employees and
which work around the country (Kabutaulaka 1997; Commonwealth Secretariat 2006). Some of
these NGOs engage in various parts of the political process: a range of NGOs were involved in
peace-building during the Tensions; NGOs have participated in non-political voter education
campaigns; the DSE coordinated local election monitors in the 2010 election (Paternorte and
de Gabriel 2010); and the Solomon Islands Development Trust has been a perennial
campaigner speaking out for community needs, tackling logging companies, and campaigning
against corruption (Kabutaulaka 1997; Commonwealth Secretariat 2006, p. 19).
Trade Unions
Another set of organisations present in Solomon Islands, which are usually grouped under the
rubric of ‘Civil Society’ are trade unions. The first trade union was formed in Solomon Islands in
1961 (Bennett 1987, p. 314) and they have played an active role in industrial relations ever
since. Writing in 1998 Kabutaulaka (p. 50) speaks of there being “more than ten major trade
unions” active at that point in time in Solomon Islands. Union membership is highest amongst

47
public servants and other government employees but unions can also be found representing
plantation and forestry workers and some other private sector employees (Kabutaulaka 1998;
Scales et al. 2002). While unions are influential in these particular sectors, because Solomon
Islands is a country where the majority of people are primarily involved in subsistence farming
or as very small scale growers and traders of produce, their reach into broader Solomon
Islands society, particularly in rural areas, is limited (Scales et al. 2002, p. 11).
At a national level Solomon Islands unions have engaged in activism in a number of different
ways. They have campaigned in a way similar to that of NGOs around matters of national
interest — sometimes on matters other than industrial relations. Kabutaulaka (1998, p. 50), for
example, lists unions as being, “outspoken on issues ranging from nuclear testing and waste
disposal to the government’s controversial debit tax...”.
Other Large-scale Collective Action
Pre-Colonial Times
Sustained collective action in pre-colonial times Solomon Islands was generally confined to
villages and descent groups, yet examples of larger-scale interaction and cooperation can be
found in the form of trade, and in allegiances during times of conflict (Ross 1978; Dureau
1998).
Remarkably, when one considers the diversity of pre-colonial Solomon Islands, and the
challenges inherent to exchange and cooperation that exist in the absence of overarching
enforcement mechanisms, trade networks spanned hundreds of kilometres and war parties
may have numbered in the thousands at times (although the exact figures are disputed)
(Dureau 1998; McDougall 2003). However, allegiance and agreement were rarely enduring.
Cooperation took place over quite large scales but does not appear to have ever led to
anything resembling a polity in terms of stability and structure that spanned more than a
number of villages or perhaps a medium-sized island (Bennett 1987).
Although it also brought repression of its own, colonisation brought with it the end of inter-
group raiding and conflict. Over time, it brought Christianity too, something that afforded new
connections and ties between people spanning localities and pre-colonial identities (Joseph
and Beu 2008). Colonial era labour migration brought on-going interaction between different
groups (and saw the birth of Pijin). Colonialism also brought migration: from inland areas to
the coast in instances, and from hamlets to larger villages (Bennett 1974; Scott 2000). The
arrival of a colonial power also meant the arrival of people who denigrated the customs that

48
had afforded meaning and identity to Solomon Islanders, as well as the arrival of people eager
to exploit the land and labour of the new colony (Bennett 1987).
Maasina Rule and the Moro Movement
Amidst this challenge and change two movements arose, both political at least in some senses
and both involving collective action of a scale large enough to be unusual in Solomon Islands.
The movements were Maasina Rule (which was initially a Malaitan phenomenon, although it
subsequently spread to an extent to some other island groups) and the Moro Movement
(based in Guadalcanal). These were not the only two examples of new social movements born
of the colonial era. For example a ‘Society for the Development of Native Races’ engaged in
activism in Guadalcanal in the late 1940s (Fraenkel 2004, p. 31; Allen 2007, p. 108), and the
Chair and Rule Movement associated with Anglican missionary Richard Fallowes agitated for
improved education and wage rises, and in its governance contained a nascent indigenous
parliament of sorts (Bennett 1987, p. 261). However, Maasina Rule and the Moro Movement
were by far the most significant movements in terms of scale and impact.
Maasina Rule was born in 1944 in the ‘Are ‘are language area of Malaita (Akin 2013, p. 164)
and subsequently spread, partially through church networks (particularly the South Seas
Evangelical Mission in the island’s north), until it encompassed much of the island. Keesing
(1982, p. 359) estimates that at the high point of the movement 96 per cent of Malaitans had
joined Maasina Rule. At its height Maasina Rule also attracted significant numbers of
adherents in other parts of Solomon Islands (Bennett 1987) and represented a significant
challenge to colonial power. The changes Maasina Rule sought were economic (something akin
to community development and better rates of pay for workers in the plantation economy),
cultural (the codification and recognition of ‘traditional’ indigenous law), social (the formation
of larger villages), governance related (taxation, the establishment of area chiefs and
governance networks), and political (some form of autonomy or semi-autonomy from colonial
rule) (Keesing 1982; Bennett 1987; Fraenkel 2004; Allen 2007; Akin 2013).
While the cultural symbolism of Maasina Rule, its adaptation of custom and its legacy provide
much to interest anthropologists and historians, Laracy (1983, p. 6; cited by Allen 2007, p. 107)
hits on the feature of Maasina Rule of most interest to political scientists:
Rather, given the multiplicity of languages and the fragmented, kin-based political structure, which characterise Melanesian groups such as the Solomons—and Malaita was the most socially fragmented island of the group—its significance lies in the fact that it happened at all...
A range of reasons have been given for the rise of Maasina Rule. Church networks and a
Christian ideology of a universal human identity that transcended old divides increased the

49
potential for large scale collective action (Burt 1994b), while both the unjustness of colonial
policy (Akin 2013), and encouragement from Fallowes and American Soldiers to organise
against it were motivating factors (Keesing 1982). Keesing also cites pre-war community
development projects in ‘Are ‘are speaking areas as well as pre-war experiments in a degree of
self-rule in the form of native courts as opening Solomon Islanders to the possibility of more
large-scale self-governance. Bennett (1987, p. 292 & 297) points to interactions between
different groups on pre-war plantations as fostering a sense of shared identity as well as a
simple lesson having been learnt by some of those who were catalytic in the movement’s
foundation: “Without greater unity, as the colonial government had so long known, they
[Solomon Islanders] were virtually powerless.”
Once recovery from World War Two had afforded it strength to act, the colonial government
engaged with vigour in attempts to quash Maasina Rule. In part this involved repression:
membership of the movement was actively discouraged and some leaders sent to jail
(Davenport and Çoker 1967, p. 128). In part it involved concession: the colonial administration
continued to develop local councils, something that was partially in line with what Maasina
Rule had been calling for. As Bennett (1987, p. 296) writes:
By the early 1950s the government had regained control, if the collection of the head tax was any index. Men offered in numbers for plantation work, as their money had been spent and cash was needed for the tax—except that now the head tax funded the island councils. In the view of the majority of the Maasina Rule followers the movement was successful; in 1953 it achieved its major aim of running Malaita in the form established by the Malaita Council, along with other regional councils in the protectorate. Continued resistance was unnecessary, a view that was reaffirmed as Malaita became the object of many government projects.
As a consequence of both repression and concession, by the late 1950s Maasina Rule was
largely a spent force, at least in its original form as an active political movement operating
across a large area.38
In 1957 the Moro Movement arose in southern Guadalcanal. With its origins in the visions of
its founder, the Moro Movement combined quasi-developmental aspirations and an element
of anti-government (or at least anti-local council) sentiment with a dose of a return to tradition
ideology and a mystical element that drew upon, or sought to create, local legend (Davenport
and Çoker 1967; Bennett 1987, p. 316; Kabutaulaka 1998, p. 17).39
38
Although, it has been argued (for example Akin 2013) that it still exists in parts of Malaita as an ethos at least — as a set of beliefs associated with resisting and challenging the state. 39
Both the Moro Movement and Maasina Rule were also associated in some localities with millenarian beliefs, although Keesing (1982), writing with respect to Maasina Rule, and Davenport and Çoker (1967)

50
In the years following its founding the Moro Movement spread throughout much of Southern
Guadalcanal, Central Guadalcanal and the island’s northern plains. While the Moro Movement
did not come close to achieving the breadth of support that Maasina Rule obtained at its peak,
it was a significant social movement nevertheless, one which spanned villages, administrative
districts and language groups. Davenport and Çoker (1967, p. 137) provide estimates
suggesting that, by the early 1960s, approximately 18 per cent of the population of
Guadalcanal were movement followers. They point to the significance of this:
[F]or a people whose social structure has always been fragmented into dispersed settlements and villages and whose economic and social orientations have been correspondingly parochial, this [the large-scale collective action of the Moro Movement] is a momentous discovery. (Davenport and Çoker 1967, p. 160)
As with Maasina Rule, the Moro Movement engaged in a range of different forms of collective
action. In villages it often served as an organising focal point for village governance, and the
Movement itself had its own internal governance structure and hierarchy of power (Davenport
and Çoker 1967, p. 149). The Movement was not explicitly anti-colonial in the sense that it
actively sought the end of colonial rule, or even opposition to the paying of taxes to the
colonial government (something that Maasina Rule advocated) yet it contained a strong
element of self-rule, establishing (or trying to establish) parallel systems of government,
including taxation, to order the lives of its members (Davenport and Çoker 1967, p. 161).
Alongside this, members of the Moro Movement also contested Guadalcanal (colonial)
government elections, with some success, although this never translated into a large enough
Moro block in any formal parliament to be become a force (Davenport and Çoker 1967).
While the Moro Movement waned considerably from the late 1960s (in the 1999 census only
599 respondents stated they were movement adherents (Solomon Islands National Statistics
Office 2000, p. 32)) it has remained in a form. It was a source of inspiration for at least some of
the Guadalcanal militants who were involved in the Tensions (Allen 2007, p. 128) and has
played a role in electoral politics, with movement-approved candidates standing and
sometimes winning seats in national elections (see, for example: Allen 2007, p. 157). In 2013
the Solomon Islands government awarded movement members a large cash ‘compensation’
payment in recognition of the Movement’s role as landowners of parts of Guadalcanal that
the nation as a whole benefits from (Solomon Star News 2013).
writing about the Moro Movement contend that such beliefs tended to be most pronounced on the peripheries of the organisations. While the two movements occurred amongst different groups and were centred on different islands, it is thought the presence of Maasina Rule played a role in the instigation of the Moro Movement.

51
The Moro Movement, like Maasina Rule before it, appears to have had its growth in part
enabled by the presence of an ‘other’ to unite against (Colonial Government) as well as having
been enabled by new networks and connections (although in this instance not church-based
networks), and new ideas which had arisen particularly through contact with American soldiers
during and after World War Two. Like Maasina Rule, while it was of a significant scale for a
time, it has not been sustained. Although the Moro Movement, in some form, remains a
presence, on a limited scale in parts of Guadalcanal.
The Western Breakaway Movement
A more recent example of large-scale collective action can be found in the so-called Western
Breakaway Movement that arose in Solomon Islands’ Western Province (which at the time also
included Choiseul Province) around the time of independence in the late 1970s. The
movement was driven by fear of “internal colonialism” (Premdas et al. 1983, p. 166) born of
the fact that the Western Province was a political minority (about 20 per cent of the
population and 24 per cent of the MPs in parliament) and yet also probably the most resource-
rich part of the country (Premdas et al. 1983, p. 165; the political representation calculation
comes from my electoral database). The Movement’s aspirations were not, at least as most
commonly expressed, the desire to become a separate state but rather for greater self-
governance via a federal political system.
In addition to the fear of “internal colonialism” the movement was enabled by a shared sense
of identity amongst Solomon Islanders from Western Province that is in part based on physical
appearance (much darker skin colour). Also, between them, the Methodist church and its
offshoot the Christian Fellowship Church claimed the religious loyalties of many Westerners,
and provided networks as well as a further sense of shared identity. And while numerous
different languages are spoken around Western Province, Roviana rather than Pijin, at least at
the time of the Breakaway Movement, was lingua franca in much of the West (Premdas et al.
1983, p. 167, 169 & 184).
While it united and articulated the aspirations and fears of people from numerous islands and
different language groups, the Western Breakaway Movement was not a mass movement in
the sense that it did not involve mass collective action. Although it probably had popular
support in the province, as an active movement it was primarily one of political elites. As
Premdas et al. (p. 184) note:
The movement’s methods of communicating its demands to the central government were mainly non-violent and legal. They ranged from resolutions and submissions issued from the Western Council to speeches

52
and veiled threats by Western national parliamentarians. Record of only one demonstration in Gizo exists.
The Solomon Islands government responded to the movement via concessions. Compensation
was paid for an anti-Western poem that had been published in a government newspaper,
more generous central government to provincial government transfers were agreed, and
government-owned land was returned to customary owners (Premdas et al. 1983, p. 186 &
190). A Western MP became deputy prime minister and Western MPs occupied prominent
positions in cabinet. Westerners were promoted to senior roles in the civil service and the
office of speaker in parliament was filled by a Westerner (Premdas et al. 1983, p. 187). With
these concessions the force behind the Breakaway Movement abated, although resentment
can still be found amongst some Solomon Islanders from Western Province and Movement
sentiment emerged again during the ‘Tensions’ (the civil conflict discussed below) (Scales
2008, p. 214).
While it was both political and also an example of something that might be said to be an ethnic
movement (based on a shared provincial identity), notably the Breakaway Movement never
translated into anything resembling parliamentary unity amongst MPs from Western Solomon
Islands. There is no Western party and MPs from the Western electorates do not behave as a
cohesive parliamentary unit.
Island-Based Militias During the Tensions
The final examples of relevant, large-scale collective action are the island-based militias that
swept Solomon Islands into a state of conflict (the ‘Tensions’) from late 1998 until the arrival of
international peacekeepers in 2003. These militias first formed amongst men from
Guadalcanal and then, in response, amongst Malaitans. There were several factors behind the
formation of the initial militia groups from Guadalcanal: inequitable development, a weak
state that failed to provide public goods and which had already shown itself to be easy prey to
extortionate demands, resentment of Malaitan settlers, and attempts by some political actors
to tap discontent for their own political benefit (Fraenkel 2004; Moore 2004; Allen 2007). The
rise of the Malaitan militia is more simply explained: a response to the eviction and menacing
of Malaitans by the original militias from Guadalcanal.
On both sides the militias transcended the traditional bodies of collective action in Solomon
Islands, bringing together young men from different areas, clans, churches, and language
groups. And yet, this was not unity of the form seen in Maasina Rule. Some Malaitan groups,
such as Langalanga speakers, were mostly absent from Malaitan militia (Moore 2004, p. 127).
And just as members of different clans, churches and language groups were united within the
militia groups, so too were they united ‘against’ them in the form of the various civil-society-

53
based peace initiatives that sprung up, suggesting that the desire for inter-island conflict was
far from universally shared across the two islands involved.
It is hard to know just how many people were united under the banners of the various militant
groups. Allen (2007, p. 24) states that estimates of the number of militants from Guadalcanal
range from 300 to 200040 (the upper estimate would reflect a mere three per cent of the
population of Guadalcanal at the time) and cites (p. 27) an interview subject who told him that
“1803 men and boys from north and central Malaita…joined the MEF [Malaita Eagle Force, a
militia group].” Even assuming that the total number of Malaitan Militia members was higher,
(including some militants from elsewhere in Malaita and Honiara), in the vicinity of 2,500, this
is still less than three per cent of the population of Malaita. Adding non-combatant supporters
of the various militias would increase numbers somewhat but even so — in contrast to both
Maasina Rule and the Moro Movement in their heydays — those actively involved in the
militant enterprise only ever formed very small proportions of the island populations they
‘represented’.
Ultimately, unity within the militias was limited too. The Guadalcanal groups descended into
internecine conflict, and as the Tensions progressed both Guadalcanal and Malaitan groups
degraded into quasi-criminal enterprises that likely inflicted more harm on their own peoples
than they did on their opponents (Fraenkel 2004; Moore 2004; Allen 2007). The groups
involved could be said to be ethnic in a sense, based on island identities, and the time of the
Tensions in the Solomon Islands did involve large-scale political collective action of a form, but
it was short-lived and the ‘ethnic groups’ involved splintered quickly.
The Tensions have a legacy in the inter-island suspicions and prejudices some Solomon
Islanders continue to feel. Yet there is little appetite for a return to fighting amongst most
Solomon Islanders and the organisations involved have dissolved (Coppel 2012). The period of
conflict did unite a range of people who might not normally cooperate but it was not a
sustained unity and has not given birth to any enduring political movements.
Conclusion
In this chapter I have provided context for my study of voter behaviour in Solomon Islands. I
have described the physical, economic and social environments that voters make their choices
amongst.
40
This lower figure seems implausibly low when one considers the size of some of the skirmishes that took place in the conflict as well as the number of casualties.

54
Isolated by geography and inadequate infrastructure, the economic lives of many Solomon
Islanders, if not desperate, are hard. From food to school fees there are cash needs, and yet,
for most, opportunities for engagement in the cash economy are limited. A well-functioning
state that did a better job of providing public goods and services could assist but, in its on-
going absence, needs — and in particular financial needs — are pressing for many.
Although a poorly functioning state brings hardship, its absence, or near absence, does not
translate into anarchy. A range of entities provide considerable structure to the social
interactions of most Solomon Islanders. Families, clans, and churches, are key institutions,
facilitating collective action, albeit only imperfectly.
Collective action on a larger scale has also occurred in Solomon Islands. Yet, it has not
ultimately been sustained. Major movements have sprung up, but they have also waned after
relatively brief heydays.
In terms of ethnic identities, clans and churches clearly play very meaningful roles in most
Solomon Islanders’ lives. Race, on the other hand, largely does not. The impact of language is
less clear: language is certainly a basis of identity, and language divides often form the outer
boundaries of communities of custom, but language groups themselves only very rarely appear
to be bodies of sustained, unified collective action. The same also appears to be true of
geographic identities: at times such as the Western Breakaway Movement, and Guadalcanal
and Malaitan Militias geographic entities have come close to being the basis of collective
action, but this has not been sustained.

55
Chapter 4 – Solomon Islands Elections and Politics
In this chapter I continue providing background for my study. In the preceding chapter I
provided a general outline of the Solomon Islands context before delving in depth into the key
components of Solomon Islands society that structure people’s interactions and collective
action. These details were important, I argued, because they pertained to aspects of Solomon
Islands life that could play a role in shaping voter behaviour. Moreover, some of the social
groupings I described were of particular interest as potential structures around which ethnic
voting might occur.
In this chapter I start by outlining a further potential influence on voter’s choices: electoral
rules. Having done this, I shift my focus from potential causes of voter behaviour to observed
outcomes. I describe and graph the key statistics, patterns and trends of Solomon Islands
election results. Then I move on to parliamentary politics, detailing the sort of person that
becomes a member of parliament before describing the nature of parliamentary politicking.
To varying degrees the electoral information I provide in this chapter has been discussed
elsewhere, most thoroughly in Fraenkel (2008) but also in other work (Chick 1979; Chick 1983;
Premdas and Steeves 1983; Premdas and Steeves 1994; Steeves 1996; Steeves 2001; Fraenkel
2011; Steeves 2011). However, over the rest of this chapter, when discussing and charting
results patterns, as I am primarily drawing on calculations from my own datasets, I provide
citations only for those assertions not based on my election data. Where my charts and
statistics come from a range of sources I provide sources in the text, where no sources are
provided it can be assumed that the information comes solely from my own results data and
MP bio-data.
Electoral Rules, Elections and Electorates
National elections in Solomon Islands are held using a single member district plurality (‘or first
past the post’) voting system (a system inherited from the United Kingdom, the colonial
power, which ran the country’s first pre-independence elections). The country has 50
electorates, each of which sends only one MP to the national parliament (Steeves 2001, p.
799-800; Moore 2010).41 The candidate who wins the plurality of votes in an electorate
becomes its MP. Elections are usually held every four years and there have been eight general
elections since independence, the first of these held in 1980.42 Intermittent by-elections have
41
Prior to 1993 there were only 38 electorates. This increased to 47 in 1993 and again to 50 in 1997. 42
Mass suffrage elections commenced under colonial rule in Honiara in the early 1960s. The 1967 elections were the first elections that had national universal suffrage (with the exception of one outer island electorate where an electoral college system was used) although the majority of members of the

56
also taken place upon the death or removal, usually via court ruling, of MPs from office during
the electoral term (Steeves 2001).
Given they are held in an environment of low administrative capacity, and across a geography
that poses challenges of its own, recent Solomons elections (particularly those in 2010) have
been generally well run (Commonwealth Secretariat 2010). Observer teams and a system of
open vote counting which permits candidates’ agents to scrutinise the counting process, have
meant election results, at least in recent years, have been mostly free of significant
wrongdoing directly involving the mechanics of the electoral process itself (Commonwealth
Secretariat 2010; East West Centre 2010; Pacific Islands Forum Secretariat 2010).
Elections have also been fairly peaceful affairs. Brawls between the supporters of rival
candidates are not unheard of and occasional incidents such as the burning of ballot boxes
have taken place, yet elections have been free of serious large-scale violence (Commonwealth
Secretariat 2006; Commonwealth Secretariat 2010; Nanau 2011b, p. 508).43
The only major blight on the operation of recent national elections has been the electoral roll,
which contains many more voters than could possibly exist (Commonwealth Secretariat 2006;
Commonwealth Secretariat 2010; Kelly 2010; Paternorte and de Gabriel 2010). The 2010 roll
had 448,149 registered voters, which contrasts with what I estimate the voting age population
to have been in 2010: 281,161 (estimated on the basis of projections from 2009 census data).
Roll inflation is an issue, yet for the most part this appears the product of administrative
problems rather than any systematic attempts at engineering large-scale electoral
malfeasance.44 Although errors in the roll do provide opportunities for cheating, such as
individuals voting under the names of deceased voters, and while these opportunities are
sometimes taken advantage of, roll errors do not appear to be have translated into large-scale
fraud, at least in recent years.45 This is important for my study as the absence of large-scale
Governing Council remained appointees. In the wake of the 1970 national elections the ruling body contained more elected than non-elected MPs for the first time. By 1976 the only non-elected member of the legislative body was the attorney general. All told there were four mass-suffrage national elections pre-independence (Moore 2010). 43
Sanga (2005) describes small scale post-election violence in the East Malaita constituency after the 2001 elections, and Fraenkel (2008) and Allen (2008) note that there was considerable voter intimidation in some electorates during these elections, which took place in the midst of the Tensions. And more subtle voter coercion, as I discuss later, certainly does take place. Yet large-scale election related conflict as occurs in many developing countries, including neighbouring PNG, has not been a feature of Solomon Islands elections. 44
Large-scale being the operative term here; roll fraud for the purpose of electoral wrongdoing does occur on smaller scales but not of sufficient magnitude to explain the bulk of observed roll inflation. 45
None of the 2010 election observation missions reported any signs of large-scale fraud of this sort. And when I compared total votes with estimated registered voters at an electorate level, only a few electorates in the 2010 election saw more votes cast than ought to be possible on the basis of population, and in most of these instances the most likely explanation for the bulk of the overhang was

57
fraud means that election results data can be treated as having the potential to reveal at least
some information about voters’ intentions, which would not be the case if election results
were effectively fictional. Of course, noting that recent elections have run well in a procedural
sense is not the same as saying no cheating occurs. Vote buying and voter coercion are
common — something I return to in later chapters.
Figure 4.1 below charts Solomon Islands elections since independence and shows the number
of registered voters, the total number of votes cast, and the estimated voting age population.
General election years are shown as dashed-vertical lines. Figure 4.1 also offers a sense of
voter turnout. While turnout has been nominally low in recent elections (only 53 per cent of
registered voters in 2010), when calculated as a proportion of the estimated voting age
population, turnout is actually fairly high (85 per cent in 2010).
Figure 4.1 – Total Votes, Registered Voters, and Estimated Voting Age Population
Chart notes: data from election results database, calculations from censuses, and Steeves (2001) for 1984 registered voters.
There is major malapportionment between Solomon Islands’ 50 electorates. The smallest
electorate in estimated voting age population, Malaita Outer Islands, with an estimated voting
age population of 1,310, is less than a tenth the size of East Honiara, which has an estimated
15,846 potential voters.46 The largest electorate which does not contain any of the greater
Honiara urban area is Nggela with an estimated voting age population of 9,350. A table
detailing electorate populations and other key electorate features is included in Appendix 3.
voters who had been resident in Honiara during the census returning to vote in rural electorates where they were registered to vote. Also, when I undertook last digit analysis of candidate vote totals (following Beber & Scacco 2013) digit patterns were not suggestive of fraud. 46
Many Honiara residents return to their rural constituencies to vote in general elections, which means my figure here overstates actual likely voters. However, even if I base comparisons on actual votes cast malapportionment remains significant: 8,229 votes were cast in East Honiara in 2010, compared to only 1,636 in Malaita Outer Islands.
0
250,000
500,000
1980 1990 2000 2010
Votes Cast
Registered Voters
Voting Age Popn (est)

58
Candidate Numbers and Winner Vote Shares
In the typical electorate, elections are enthusiastically contested, with numerous candidates
vying for voter support. The highest number of candidates to have stood in any election was
26 in the 2008 East Honiara by-election (the highest during a general election was 23 in Central
Honiara in 2010). The median electorate (over all elections since independence) has had seven
candidates standing in it.
Figure 4.2 below shows the average number of candidates and average Effective Number of
Candidates (ENC)47 standing in Solomon Islands general elections since independence. Two
facts stand out. First, there was no significant overarching trend in candidate numbers
between 1980 and 2001, although candidate numbers have increased considerably since
2001.48 Secondly, other than a very slight upturn since 2001, the average effective number of
candidates has not increased over time. Divergence between the number of candidates and
the ENC suggests that while candidates have contested elections in increasing numbers since
2001 the number of candidates that have polled well has not risen.
Figure 4.3 shows mean and median winning candidate vote shares in Solomon Islands general
elections since independence. As with ENC in Figure 4.2 there appears to be no strong trends
in winning candidate vote shares. Also apparent in the chart is the fact that the typical winner
in Solomon Islands elections wins on a plurality, rather than a majority, vote share. Wins with
more than 50 per cent of the vote are rare, though not unheard of, in Solomon Islands
elections.
47
Owing to the fact that not all candidates are equally competitive, absolute candidate counts may not accurately reflect the state of competition in any particular electorate. For example an electorate where one candidate obtains 91 per cent of votes cast while the remaining nine candidates obtain only one per cent each is a very different electorate from one where 10 candidates each win 10 per cent of the vote. To account for this political scientists typically report on electoral competition using a calculated figure, the ‘Effective Number of Candidates’ (ENC) (or Effective Number of Parties – ENP) (Cox 1997). The ENC is the reciprocal of the Herfindahl–Hirschman index of candidate vote shares in an electorate, and is calculated as 1 divided by the sum of all the candidate’s squared vote-shares. (Or, in equation form: 1/∑ 𝑣𝑖𝑛
𝑖2 where n = the number of candidates and 𝑣𝑖 = the vote share of the 𝑖th candidate). ENC can be
thought of loosely as a representation of the number of competitive candidates. In my example electorate where one candidate obtains 91 per cent of the vote and the remaining 9 candidates obtain one per cent each the ENC is 1.21, close to one, reflecting the fact that only one candidate was competitive; in the electorate with 10 candidates each obtaining 10 per cent of the vote the ENC is 10, a reflection of the fact that all 10 were equally close to winning. 48
Further analysis shows that candidate numbers increased nationwide. The extent varied by province, with Honiara, Makira and Temotu seeing the most dramatic rises, but every province saw increases in average candidate numbers. However, within provinces not all electorates have seen increased candidate numbers.

59
Figure 4.2 – Average Candidates and Effective Number of Candidates, General Elections
Figure 4.3 – Mean and Median Winner Vote Share, General Elections
Although Solomon Islanders are enthusiastic competitors in elections, success itself, either in
the form of winning, or even merely winning a significant slice of electoral support, is hard to
come by. Figure 4.4 shows a histogram based on the vote share of all candidates who stood in
elections from 1980 until 2011. The X axis shows groupings of vote shares, the Y axis shows the
number of candidates falling into that grouping. For example, the first bar on the left of the
histogram shows that over 800 candidates have stood and won fewer than five per cent of the
votes in their electorate. The steady fall in the height of the bars from left to right reflects the
0
4
8
12
1980 1984 1989 1993 1997 2001 2006 2010
ENC
Candidates
0%
25%
50%
75%
100%
1980 1984 1989 1993 1997 2001 2006 2010
Mean Winner Vote Share
Median Winner Vote Share

60
fact that most candidates in Solomon Islands elections win low vote shares. The plurality have
won under five per cent of the votes cast in their electorate; the majority less than 10 per cent.
Figure 4.4 – Histogram of Candidates’ Vote Shares all Candidates, all Elections 1980-2012
Incumbent Turnover Rates
Tenure for those few candidates lucky enough to win is often short. Since the first post-
independence election, on average nearly half (47 per cent) of those incumbent MPs who have
defended their seats have lost them.49 Figure 4.5 shows the percentage of incumbent MPs who
contested and lost in general elections.
49
On average, across all general elections since independence 91.4 per cent of MPs have defended their seats. Although comprehensive data do not exist explaining instances where MPs have not defended seats, instances I am aware of suggest voluntary retirement is far from the only cause. A number of MPs have died in office, and several have gone to prison while in office. And while death and imprisonment ought to trigger by-elections, when a general election is close the seat in question has often simply been held vacant until the general election. One cause of incumbent non-defence present in some other countries does not occur in Solomon Islands — owing to the weakness of political parties in Solomon Islands (discussed more below) there is nothing akin to a party pre-selection process in Solomon Islands electorates. If an incumbent wishes to stand, and is alive and not prevented from doing so by problems with the law, they are able to.
0
200
400
600
800
Num
ber
of
Candid
ate
s
0 10 20 30 40 50 60 70 80 90 100
Vote Share (per cent)

61
Figure 4.5 – Incumbent Turnover as a Percentage of Contesting Incumbents, Solomon Islands General Elections
Chart notes: the numerator in the calculation reflected in this chart is the number of incumbent MPs who contested and lost in each general election; the denominator is the number of incumbent MPs who contested.
As can be seen in Figure 4.5 there is variation between years but, once again, absence of
anything that could be described as a clear trend. Turnover rates were at their highest in the
first post-independence election in 1980, but they were nearly as high again much more
recently in 2001. The lowest levels of incumbent turnover occurred in 1993, an election which
saw the introduction of a dedicated constituency development fund (paid for with Taiwanese
aid) provided to sitting MPs, which they could spend, effectively at their own discretion, within
their electorates (Fraenkel 2011, p. 312).50 Ostensibly this was meant to be a tool to assist
development at the local level, yet it clearly has considerable use as a tool of patronage and,
from that, is a potential source of electoral advantage. The number of electorates also rose
from 38 to 47 in 1993, which meant that many sitting MPs found themselves defending
smaller electorates. These two factors are the most likely causes of low turnover rates in 1993,
with subsequent years seeing a return to equilibrium of sorts as aspiring challengers realised
that smaller electorates meant fewer votes required to win, while at the same time voters
worked out that largess in the form of constituency funds was not something solely the
domain of the sitting MP and would likely flow, and possibly flow more, were that MP to be
defeated.
Despite what would appear to be clear advantages stemming from office, government
ministers do not appear on average to have dramatically higher election survival rates than
50
Something akin to these funds pre-dated 1993; however, previous funds were smaller and appeared to be less amenable to patronage spending.
0%
25%
50%
75%
100%
1980 1984 1989 1993 1997 2001 2006 2010

62
MPs outside of government or on the government backbenches. In theory ministerial
portfolios ought to significantly enhance their holders’ chances of re-election, providing profile
and increased ability to secure voter support through patronage (Fraenkel 2004, p. 38;
Fraenkel 2008b, p. 50). And yet, in the three elections for which data are available, ministerial
survival rates were not substantially better than those of other MPs. In the 2006 national
elections, 56 per cent of government ministers won re-election (Fraenkel 2008, p. 74) a
survival rate that may be higher than the rate of 52 per cent for parliament as a whole but not
by much.51 Similarly, Premdas and Steeves (1983, p. 84) state that half of all cabinet members
retained their seats in the 1980 general election. This is a higher survival rate than those of
MPs as a whole in that election (only 38 per cent were re-elected) but is still not so large a
difference as to suggest that being a government minister completely transforms MPs’
electoral prospects. In the 1993 elections only one government minister was not re-elected
(Premdas and Steeves 1994, p. 54), a very high survival rate (93 per cent), yet the 1993
elections were kind to all MPs (81 per cent were re-elected) meaning the difference between
ministers and MPs was, once again, only one of degree. What is more, because the same
political skills — guile and the ability to strategically form alliances — that aid in the rise from
MP to minister are of likely use in electioneering too, the raw differences in re-election rates
between ministers and MPs may overstate the true advantage associated with holding a
government portfolio, conflating it with advantages born of individual capacity.
The most likely explanation as to why being a minister does not increase odds of electoral
survival more, is that any advantage which does come from the ability to dispense patronage
while in charge of a government ministry is offset by negative publicity stemming from being
associated with frequent government scandals, combined with ministers having less time
available to devote to constituency matters (Premdas and Steeves 1983; Fraenkel 2008).
Differences Between Electorates
Thus far the electoral statistics I have summarised have mostly taken the form of national
averages or aggregates, yet buried within these country-level composites is considerable
variation between electorates, as well as variation over time within individual electorates.
Figure 4.6 is a histogram of winning candidate vote shares from all post-independence
elections.
51
Fraenkel (2008, p51) provides an overall MP survival rate of only 46 per cent. However, on the basis of the table he provides on p. 73, this appears to be an error in which survival and turnover rates have been transposed.

63
Figure 4.6 – Histogram of Winner Vote Shares: All Post-Independence Elections
The lowest winning candidate vote share was that of Ben Foukona in Lau/Mbaelelea in 1984,
who won with only 10.7 per cent of the vote. The highest winner vote share, setting aside the
few instances where candidates have effectively won 100 per cent because they stood in
uncontested elections, was that of Victor Ngele who won 87 per cent of the vote in South
Guadalcanal in 1993. In between these extremes, as the histogram illustrates, individual
election wins have occurred across a very wide range of vote shares.
Focusing on the 2010 general election, Figure 4.7 is a scatterplot showing the number of
candidates that stood and the percentage vote share of the winning candidate for each
electorate. The red line on the chart is the fitted OLS line of best fit. The two or three letter
electorate codes used in this and subsequent charts are mapped to electorate names in
Appendix 3.
Two aspects of the chart bear noting: first, there is a strong negative correlation between the
number of candidates that stand in constituencies and winning candidate vote shares; and,
second, there is a lot of variation between constituencies, both in terms of number of
candidates and the share of votes won by winning candidates. Although, for clarity’s sake this
020
40
60
80
Num
ber
of
MP
s
0 10 20 30 40 50 60 70 80 90 100
Winner Vote Share (per cent)

64
scatter plot only shows results from the 2010 election, and while there is some change from
election to election, all post-independence elections have had similar variation.52
Figure 4.7 – Scatter Plot of Candidate Numbers and Winner Vote Shares , 2010 General Election
Chart notes: when I regress 2010 winner vote share against candidate numbers by electorate the Adjusted R-Squared is 0.442; and the regression coefficient for candidates is -2.351 and is significant at the 1 per cent level.
Clearly, this degree of variation affords some potential analytic leverage to the researcher
seeking to understand voter behaviour in Solomon Islands; between-constituency variation is
something I return to later. Yet the variation does not fall neatly across sub-national divisions
in any way suggestive of obvious explanations. In particular, while it is not uncommon in
Solomon Islands to hear talk of different provinces as having different political cultures,
variance in candidate numbers or winning candidates’ vote shares is not predominantly the
product of between-province differences. It is true that, in terms of raw candidate numbers,
the provinces of Malaita and Honiara have had more candidates standing in their electorates
on average. But they also have electorates that are, on average, more populous.
Figure 4.8 shows a box plot, broken down by province, comprising data for each electorate
from each general election since independence, where the Y axis is number of candidates per
1000 voters (voters being the voting age population estimated from census data). Each box
and its accompanying vertical lines (‘whiskers’) illustrates, for each province, the extent of
52
Interestingly, while there is still considerable variation in winner vote shares in pre-independence elections there is much less variation in candidate numbers between electorates.
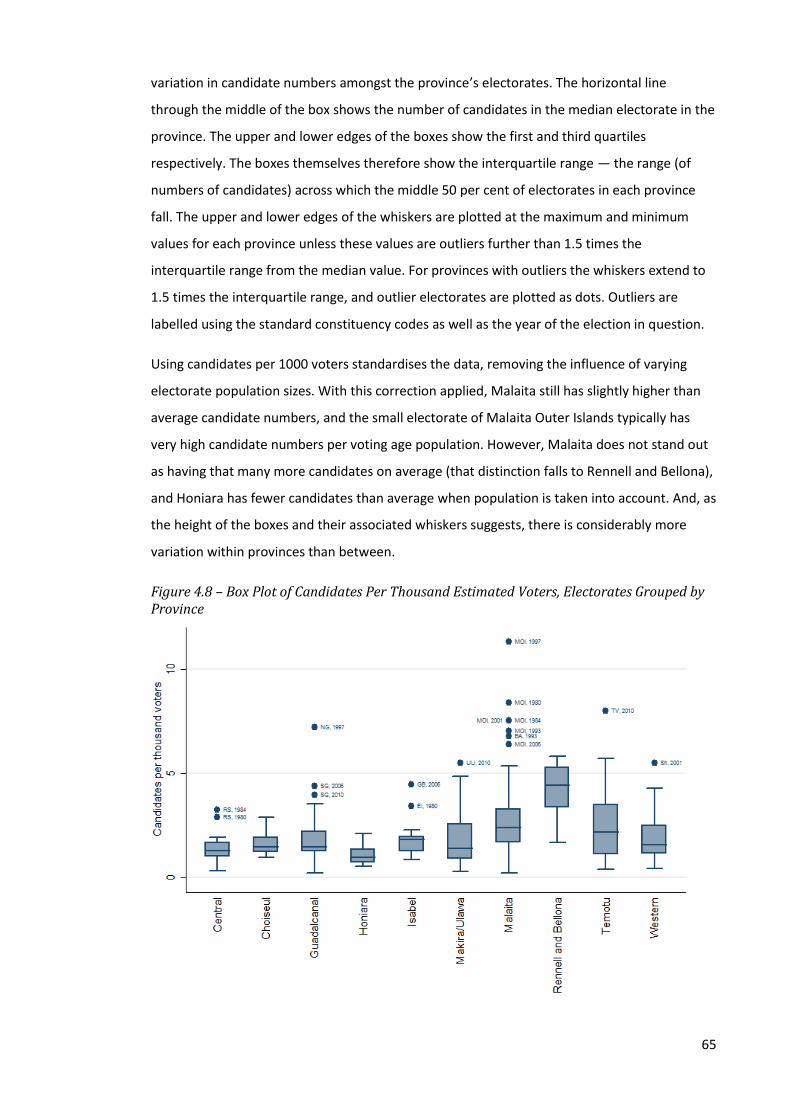
65
variation in candidate numbers amongst the province’s electorates. The horizontal line
through the middle of the box shows the number of candidates in the median electorate in the
province. The upper and lower edges of the boxes show the first and third quartiles
respectively. The boxes themselves therefore show the interquartile range — the range (of
numbers of candidates) across which the middle 50 per cent of electorates in each province
fall. The upper and lower edges of the whiskers are plotted at the maximum and minimum
values for each province unless these values are outliers further than 1.5 times the
interquartile range from the median value. For provinces with outliers the whiskers extend to
1.5 times the interquartile range, and outlier electorates are plotted as dots. Outliers are
labelled using the standard constituency codes as well as the year of the election in question.
Using candidates per 1000 voters standardises the data, removing the influence of varying
electorate population sizes. With this correction applied, Malaita still has slightly higher than
average candidate numbers, and the small electorate of Malaita Outer Islands typically has
very high candidate numbers per voting age population. However, Malaita does not stand out
as having that many more candidates on average (that distinction falls to Rennell and Bellona),
and Honiara has fewer candidates than average when population is taken into account. And, as
the height of the boxes and their associated whiskers suggests, there is considerably more
variation within provinces than between.
Figure 4.8 – Box Plot of Candidates Per Thousand Estimated Voters, Electorates Grouped by Province

66
Differences Within Electorates Over Time
There is also substantial variation in candidate numbers, effective numbers of candidates
(ENC), and winning candidate vote shares within electorates over time.
Figure 4.9 is a scatterplot of winning candidate vote share in the 1997 general election plotted
against winning candidates’ vote shares in the 2010 general election and Figure 4.10 is a
scatterplot of ENC for the same two elections.53 The dashed grey line shown on both charts
plots a one to one relationship. Electorates close to the line had similar winner vote shares (or
ENCs) in both elections. The red line in each chart is the OLS line of best fit plotting the
relationship between the 1997 and 2010 results.
Figure 4.9 – Winning Candidate Vote Share 1997 and 2010, all Electorates
53
Major redistricting in 1993 makes it difficult to compare most pre-1993 electorates with their post 1993 equivalents.

67
Figure 4.10 – Effective Number of Candidates 1997 and 2010, all Electorates
The fact that electorates are not clustered around the dashed-grey line in either chart reflects
the high degree of variation in the two statistics between the two elections. A simple bivariate
regression run by electorate on winning vote shares for 1997 and 2010 returns an Adjusted R-
squared of 0.011, reflecting a very weak relationship (in other words considerable change)
between the two years. The same regression run on ENC for 1997 and 2010 returns an
Adjusted R-squared of 0.105, a somewhat stronger relationship but still weak.54
Both in the case of winning candidate vote share and ENC the scatter plots and regression
results illustrate a simple point: in most Solomon Islands constituencies election results have
changed markedly in little over a decade.
Differences Between First Time Winners and Incumbents
At least some of the variation in winning candidate vote shares stems from whether the
winners in question are winning for the first time or whether they are incumbent MPs
successfully defending their seat. Figure 4.11 below is a box plot, based on data from all post-
independence general elections, comparing winner vote shares between first time winners
and winning incumbent MPs.
54
More extensive regression tests and results are provided in Chapter 7.

68
Figure 4.11 – Box Plots, First Time Winners and Incumbent Winners
Winning incumbents appear, on average, to have discernibly higher vote shares than first time
winners. This is confirmed by the results of a simple two sample t-test.55 The difference in
mean vote share between first time winners and incumbent winners is 7.8 percentage points
and is statistically significant at the 1 per cent level.
At first glance this difference suggests a substantial incumbent advantage in elections,
something that would not seem surprising given that, as discussed above, MPs in Solomon
Islands have considerable constituency development funding at their disposal. However,
restricting the comparison to first time winners and incumbent winners only is to tell just part
of the story when it comes to the fate of incumbent MPs. As I discussed above, on average
approximately half of all MPs lose their seats in each general election. Figure 4.12 compares
the vote shares of first time winners and all incumbent MPs (whether they won or lost the
election in question).
55
The t-test was run using the ‘unequal’ option in Stata to allow for the differing standard deviations of the two groups.
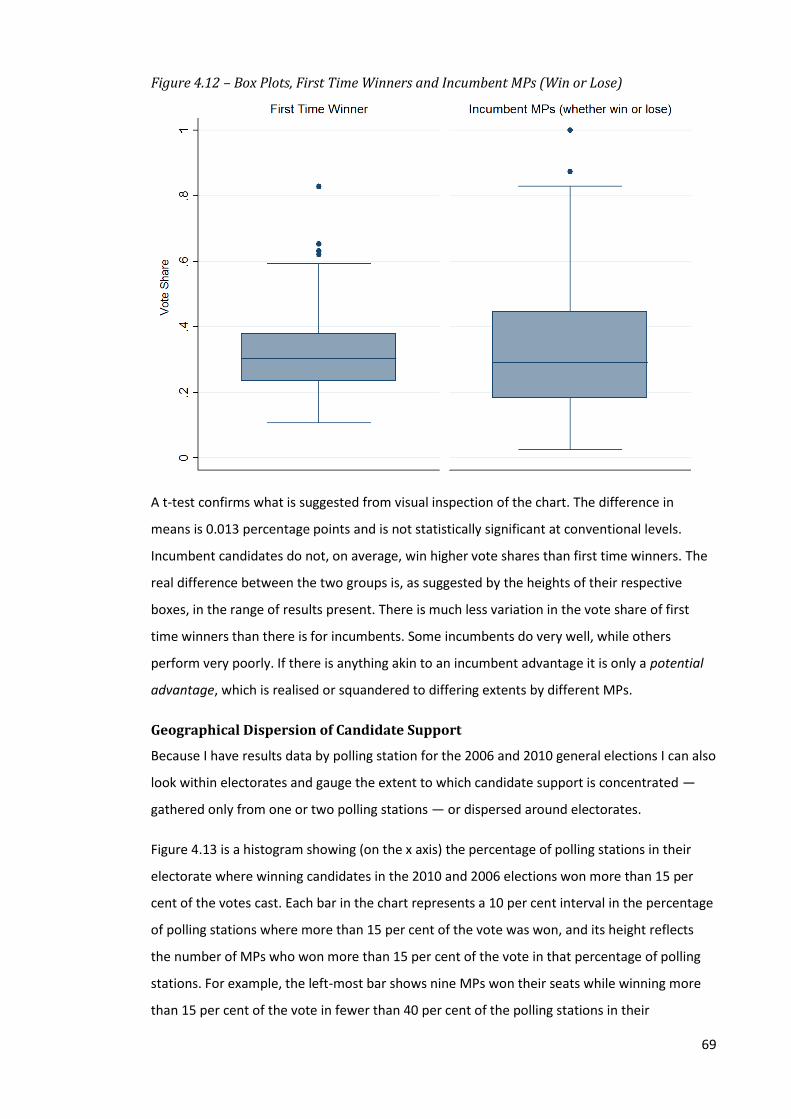
69
Figure 4.12 – Box Plots, First Time Winners and Incumbent MPs (Win or Lose)
A t-test confirms what is suggested from visual inspection of the chart. The difference in
means is 0.013 percentage points and is not statistically significant at conventional levels.
Incumbent candidates do not, on average, win higher vote shares than first time winners. The
real difference between the two groups is, as suggested by the heights of their respective
boxes, in the range of results present. There is much less variation in the vote share of first
time winners than there is for incumbents. Some incumbents do very well, while others
perform very poorly. If there is anything akin to an incumbent advantage it is only a potential
advantage, which is realised or squandered to differing extents by different MPs.
Geographical Dispersion of Candidate Support
Because I have results data by polling station for the 2006 and 2010 general elections I can also
look within electorates and gauge the extent to which candidate support is concentrated —
gathered only from one or two polling stations — or dispersed around electorates.
Figure 4.13 is a histogram showing (on the x axis) the percentage of polling stations in their
electorate where winning candidates in the 2010 and 2006 elections won more than 15 per
cent of the votes cast. Each bar in the chart represents a 10 per cent interval in the percentage
of polling stations where more than 15 per cent of the vote was won, and its height reflects
the number of MPs who won more than 15 per cent of the vote in that percentage of polling
stations. For example, the left-most bar shows nine MPs won their seats while winning more
than 15 per cent of the vote in fewer than 40 per cent of the polling stations in their

70
electorate. Similarly the right most bar of the chart shows 23 MPs won their seats by winning
more than 15 per cent of the votes in more than 90 per cent of the polling stations of their
constituency.
Figure 4.13 – Histogram, Percentage of Polling Stations Where Candidates Won More than 15 Per Cent of the Vote (Winning Candidates Only)
Chart notes: one MP (Milner Tozaka in 2006 who won more than 15 per cent of the vote in only 29 percent of the polling stations in his electorate) is excluded from this histogram in order to induce Stata into assigning histogram bars across even 10 per cent intervals.
The fact that the plurality of MPs won greater than 15 per cent of the vote across their entire
(or close to their entire) electorates is notable: even though MPs in Solomon Islands are
elected with reasonably low vote shares, in most instances their wins are not simply the case
of winning the support of their village, or a similarly localised area; most (although certainly
not all) win through being able to garner a significant degree of support across much of their
electorate. There is variation, some MPs win on the basis of more localised support, and this
variation is something I return to in Chapters 8 and 9 and in Appendix 5, yet the most
important point for now is that the typical winner in the last two general elections in Solomon
Islands won with a geographically spread support base.
The picture is different, however, when — in Figure 4.14 — I produce the same histogram for
all candidates, not just winners. Here, the plurality win more than 15 per cent of votes cast in
less than 10 per cent of the polling stations in their electorates.
05
10
15
20
25
Num
ber
of
Win
nin
g C
andid
ate
s
30 40 50 60 70 80 90 100Percentage of Polling Stations where Candidate Won >15% of Votes Cast

71
Figure 4.14 – Histogram, Percentage of Polling Stations Where Candidates Won More than 15 Per Cent of the Vote (all Candidates)
However, even this is not a simple case of completely localised support: 39 percent of all
candidates were still able to win greater than 15 per cent of the vote in more than 20 per cent
of the polling stations in their electorates. Also, it should be remembered that, as suggested by
Figure 4.4 the vast majority (68 per cent, for all elections since independence) of all candidates
in Solomon Islands elections won less than 15 per cent of the total vote in their electorates. By
virtue of their small overall support, such candidates will often appear in the left most bar of
Figure 4.14 even when their support is somewhat dispersed. Indeed, when considered relative
to their overall vote share candidate vote dispersion is higher: in the 2006 and 2010 elections
more than 60 per cent of all candidates won greater than their total vote share in more than a
quarter of all polling stations.
Changes in Geographical Dispersion of Candidate Support Over Time
Although the scope for systematic analysis is limited because I only have election results by
polling station for two general elections and a few by-elections, available data suggest that,
when candidates stand in more than one election, it is not uncommon to see some change in
the geographical dispersion of their support over time. This is particularly the case for
incumbent MPs — most are also able to expand their support across wider areas. Illustrating
this, Figure 4.15 shows results by polling station for the East Kwaio electorate in 2006 and
Figure 4.16 shows the same results for 2010. Each bar in the charts is a polling station. And
polling stations are arranged to reflect, as best possible, geographical proximity. Each
0
100
200
300
400
Num
ber
of
Candid
ate
s (
win
ners
and n
on-w
inners
)
0 25 50 10075Percentage of Polling Stations where Candidate Won >15% of Votes Cast

72
candidate’s vote share in each polling station is represented by a block. Stanley Sofu, the
candidate of interest, is shaded blue; the other candidates’ vote blocks are in shades of grey. In
2006 Stanley Sofu won for the first time. In 2010 he stood successfully as the incumbent.
Figure 4.15 – Results by Polling Station, 2006 East Kwaio
Chart note: In this and all subsequent polling station charts, vertical names are names of polling stations. The names written horizontally underneath them are names of wards, which do not serve a function in national elections but do suggest geographical groupings.
Figure 4.16 – Results by Polling Station, 2010 East Kwaio
In both elections Sofu did well in his base, yet in 2010 he was also able to dramatically expand
his support in polling stations such as Atoifi, and in polling stations such as Gounabusu,
Fanuariri and Nankinimae where he went from winning almost no votes to being the candidate
0
100
200
300
400
500
600
700
Nam
ola
elae
Fata
olo
Ogo
u
Ob
anae
ru
Lage
fasu
Ato
ifi
Na'
au
Ilan
un
u
Kaf
uru
mu
Ala
lau
Aila
i
Go
un
abu
su
Fan
uar
iri
Osi
anib
ata
Nan
kin
imae
Bal
afai
Bin
a
Osi
ka
Mal
akek
eta
GULALOFOU WANEAGU/TAELANASINA
Nelson Isika
Rejected Votes
Henry Faas.
Delson Safa'a
Alfred Sasako
Billy Abae
Senda Fifi
Stanley Sofu
0
100
200
300
400
500
600
700
Nam
ola
elae
Fata
olo
Ogo
u
Ob
anae
ru
Lage
fasu
Ato
ifi
Na'
au
Ilan
un
u
Kaf
uru
mu
Ala
lau
Aila
i
Taif
ala
Go
un
abu
su
Fan
uar
iri
Osi
anib
ata
Nan
kin
imae
Bal
afai
Bin
a
Osi
ka
Mal
akek
eta
GULALOFOU WANEAGU/TAELANASINA
Solomon Mori.
Rejected Votes
Herrick Dennie
Alfred Sasako
Stanley Sofu

73
who captured the plurality or majority of votes. In the four years since he first won he was able
to expand the geographical dispersion of his support considerably.
Stanley Sofu is a particularly striking case, but available data suggest that on average
incumbency brings with it substantially increased dispersion of support. Good evidence of this
can be found in the results of a paired t-test run using data for those 21 MPs who defended
their seats as incumbents for the first time in 2010.56 Using the same measure of support
dispersion I used in the histogram above (the percentage of polling stations where the
candidate won more than 15 per cent of the vote) and comparing dispersion between MPs’
first wins and their 2010 defence, a paired t-test shows the mean change in dispersion was a
17.05 percentage point increase in the number of polling stations where the MPs won greater
than 15 per cent (a difference which is statistically significant at the 1 per cent level).57
Members of Parliament
One aspect of electoral politics that is common to almost all electorates and which has
remained unchanged over elections is the difference between the backgrounds of members of
parliament and their constituents. Whereas only a minority of Solomon Islanders (26 per cent,
in the 2009 census data used in the previous chapter) described themselves as employers or
employees, all of the MPs in the 2010 parliament for whom myself and a colleague were able
to obtain source data (49 out of 50) had worked in the formal economy prior to joining politics.
Business backgrounds or employment in the civil service were most common pre-
parliamentary careers amongst MPs. Less frequent but still relatively common were MPs who
had worked as teachers or school principals and former provincial parliament MPs.
Significantly there were no subsistence farmers or people who made a living from selling
produce at local markets serving as MPs. Even in 1980, while the makeup of parliament was
different (civil servants formed a much higher share; private sector workers a much lower
share), all or almost all members of parliament had worked in the formal economy prior to
entering parliament (Corbett and Wood 2013, p. 12).
Similarly, according to the 2009 census only 23.3 per cent of Solomon Islanders aged over 12
years had had some secondary education (Solomon Islands National Statistics Office 2012, p.
2). Yet, of those MPs in the 2010 parliament for whom we were able to obtain information (46
56
Two of these MPs, Matthew Wale and Walter Folotalu, won first in by-elections in 2008, the rest won first in 2006. 57
In Appendix 5 I use a more sophisticated measure of support dispersion (an index of segregation) in tests of the impact of cross-cutting clan-related ties on dispersion. When I re-run the paired t-test conducted here using this measure I obtain a similar result – a statistically significant increase in support dispersion.
74
out of 50) 91.3 per cent had received some secondary education. Forty five per cent of MPs in
the 2010 parliament had undertaken tertiary study, compared to only 4.4 per cent of Solomon
Islanders aged over 12 (Corbett and Wood 2013, p. 10).
While MPs tend to come into their roles with the benefit of higher than average levels of
education and experience either as civil servants or working in the private sector, owing to the
high incumbent turnover rates, the number of MPs who have political experience born of long
stays in parliament is quite low. Figure 4.17 shows the composition of post-independence
Solomon Islands parliaments broken down by the proportion of serving MPs by parliamentary
experience.
Figure 4.17 – Solomon Islands Parliaments by MP Tenure
On average across all parliaments since independence, almost half (49 per cent) of MPs have
been first term MPs and over three quarters (76 per cent) have been either first or second
term MPs. In 2010, 84 per cent of MPs were either serving their first or second term in
parliament.
Parliamentary Politics
Paralleling the flux and change of the elections that select its members, the nature of politics
within the national parliament of the Solomon Islands is also fluid. ‘Unbound’, as one
commentator (Steeves 1996; Steeves 2011) has it from ideological or similar ties, members of
the Solomon Island parliament change roles and shift allegiances frequently, and governments
are regularly removed from power between elections (Steeves 1996; Steeves 2001; Fraenkel
2005; Dinnen 2008; Fraenkel 2008; Steeves 2011).
0%
10%
20%
30%
40%
50%
60%
70%
80%
90%
100%
1980 1984 1989 1993 1997 2001 2006 2010
Pe
rce
nta
ge o
f M
Ps
5+
4
3
2
1
Terms

75
Formally, Solomon Islands is a unicameral Westminster parliamentary democracy. The prime
minister is elected from parliament through a secret ballot of MPs. Through the governor
general, the prime minister appoints cabinet members, who serve as government ministers,
and who preside over government departments. There are currently 24 ministerial positions in
the Solomon Islands parliament (Corrin 2009, p. 214).
While in its form the Solomon Island parliament will be familiar to observers of Westminster-
style parliamentary democracies elsewhere in the Commonwealth, its actual functioning
differs considerably from that of countries such as the United Kingdom, Australia and New
Zealand.
Political Parties
Political parties exist in Solomon Islands — Figure 4.18 provides a breakdown of the Solomon
Islands Parliament by Party immediately after the 2010 election — yet their structure and
function are not those of political parties in most OECD democracies.
Figure 4.18 – 2010 Parties of MPs Immediately Post-Election
Chart notes: ‘Independent’ refers to those MPs who are independents — not formally attached to any party; party groupings are based on newspaper reports and so may not be completely accurate; a number of MPs have changed parties since these data were gathered.
As Figure 4.18 shows political parties are numerous in Solomon Islands. In the wake of the
2010 election there were ostensibly nine in parliament (plus 20 independent MPs). On the
Independent 40%
SI Democratic Party 24%
SI Party for Rural Advancement
8%
Our Party 8%
Direct Development Party
6%
Independent Democratic Party
4%
Reform and Democratic Party SI
4%
Rural and Urban Political Party
2%
Liberal Party 2%
Peoples Congress Party 2%

76
basis of candidate party affiliation as reported in Solomon Islands newspapers at least 14
parties stood candidates in the 2010 election.
Because different political parties win differing vote shares (and so can be argued to be of
differing electoral importance) it is customary in political science work to report on the
Effective Number of Parties (ENP) contesting elections. This is a figure calculated in the same
manner as the Effective Number of Candidates which I presented in Figure 4.2, but which is
based on the share of total votes cast at the national level won by the combined candidates of
each political party. Calculations of ENP for Solomon Islands are complicated by the high
numbers of independent candidates standing in elections. If I treat independents as individual
parties, the ENP score becomes very high. Whereas if I treat them all as one party (an
assumption that is clearly false) ENP becomes artificially low. For these reasons I have chosen
to calculate the ENP nationally for Solomon Islands excluding all independent candidates from
my calculations. This reduces the accuracy of my estimates somewhat, and understates
fragmentation. Yet even approximations are sufficient to illustrate the key point: nationally,
the effective number of parties in Solomon Islands is also high. Excluding independents and on
the basis of party allegiance reported in newspapers in the immediate wake of the 2010
elections, the effective number of parties nationally across Solomon Islands was 5.75.
The Basis of Parties
Political parties in Solomon Islands are not bound by ideological beliefs — there are no clear
left wing parties or right wing parties, and party manifestos, where they exist, vary little in any
meaningful sense between parties (Dinnen 2008). Parties are also not church-based, nor are
they grouped by geography, nor ethnic in any other way (Fraenkel 2008, p. 68). There is no
Catholic party, no Malaitan party, no Polynesian party, no Kwara’ae speaker party.58 Similarly,
NGOs have never made any attempt to become formally involved in the political process via
the establishment of political parties or anything similar.59
Trade unions on the other hand, for a time, had their own political party: the Solomon Islands
Labour Party, led by Joses Tuhanuku. However, as perhaps might have been expected in a
58
In reporting on the results of the 1980 elections Premdas & Steeves (1983, p91) note that the Solomon Islands United Party won most of the electorates, and most of its electorates, in Malaita province, earning for itself the label ‘the Malaita Party’ (somewhat unfairly as 44 per cent of the seats that MPs associated with it won were not in Malaita). In any case this sort of provincial party focus has been rare and was not apparent in the 2010 election. 59
Unlike some other countries there are no legal impediments to church or NGO involvement in party politics. Such organisations could start their own political parties should they be so inclined.

77
country with very low levels of employment in the formal economy, the party was never able
to win more than a handful of seats and currently has no MPs in parliament.60
Unlike in some countries, the private sector in Solomon Islands is not afforded a voice in
parliament in the form of a pro-business party. However, parts of the private sector,
particularly extractive industries, do have considerable political influence, using money to
purchase the support of MPs, who in-turn often try and use the same money to win voter
support (Frazer 1997; Kabutaulaka 1997; Bennett 2000; Moore 2006; Dinnen 2008; Steeves
2011). In some instances MPs themselves are former or current executives of extractive
industry businesses (Bennett 2000, p. 340).
Voters and Parties, and Party Fluidity
Importantly, voters in Solomon Islands elections, with very rare exceptions, do not vote along
party lines. As we shall see, voters choose to vote the way they do for a range of reasons, but
candidate party affiliation is not one of them (Chick 1983, p. 64; Kingmele and Paroi 2000, p.
253; Pollard 2006, p. 170; Kabutaulaka 2008, p. 104; Kabutaulaka 2008b, p. 105; ANU
Enterprise 2011, p. 135; Steeves 2011). I cover this in more detail in Chapters 8 and 9, but I
raise it here because it has one important ramification for parliamentary politics: owing to the
fact that they were not elected for their party political affiliations, MPs can change parties
without fear of being punished by voters.
Without bonds of belief or ethnic identity, political parties are fluid rather than fixed features
on the Solomon Islands political landscape (Steeves 2011). Since independence numerous
small political parties have formed, often in the lead-up to elections, only to vanish without a
trace, either failing to get any MPs elected to parliament or being abandoned by their newly
elected ‘members’ (Pollard 2006, p. 169; Alasia 2008; Fraenkel 2008, p. 79; Ratuva 2008, p. 29;
Kabutaulaka 2008b, p. 105). Even larger parties tend to have only skeletal party infrastructures
and are typically, readily abandoned by MPs in instances when they feel their ambitions will be
better served by other alliances. In 1990 Prime Minister Solomon Mamaloni abandoned his
own party, effectively ejecting it from government (Fraenkel 2008, p. 63); and Kabutaulaka
(2008b, p. 103) provides two examples of leaders of the parliamentary opposition defecting to
join the government, noting of one of the instances that: “[t]he Opposition Leader’s defection
did not raise many eyebrows…Solomon Islanders are familiar with tactics like this.” The largest
party in the current Solomon Islands parliament, the Solomon Islands Democratic Party, has its
MPs split across the government and opposition. As Figure 4.18 above suggests, a substantial
60
Chick (1983) describes an earlier permutation of a union-based party, ‘the Nationalists Party’ which was active in the late 1970s.

78
number of MPs are not formally members of any party. Indeed, in the 2010 elections roughly
70 per cent of candidates ran as independents.
Although name changes make tracing party fortunes difficult, it would appear that, of those
parties listed by Steeves (2001, p. 804) as comprising the 1997 parliament, only one, the
Liberal Party, remained in parliament as of 2010. And its hold was tenuous — just two MPs.
The Significance of Parties
For all this fluidity, it would be a mistake to assume that political parties play no role in the
Solomon Islands political process. Better established parties, or at least the political figures at
their core, sometimes serve as conduits, channelling funding from businesses and wealthy
individuals, to promising candidates in the lead-up to elections, and to affiliated MPs when in
power. Importantly, parties often serve as building blocks during negotiations around the
formation of government (see, for example, Allen 2008, p. 43; also, Kabutaulaka 2008b, p.
105). The parliamentary leader of a political party with a number of MPs in parliament, if he
can hold their loyalty, earns for himself additional leverage in coalition negotiations, increasing
the chance that he may be awarded a powerful ministry (Kabutaulaka 2008b, p. 105).61
Although in instances some parties have at times contained MPs who shared political visions of
sorts, the primary bonds holding parties together are personal, strategic or financial rather
than ideological (Fraenkel 2005b).
While parties do play some role in structuring parliamentary politics, they form a very flimsy
base to build structure upon. Only once has an individual party won a nominal majority of
seats in a Solomon Islands national election, which means that governing coalitions of several
parties plus independent MPs are the norm (Steeves 2001). And this, along with the very weak
bonds within parties, is the source of much instability.
Government Formation
In the wake of elections (or other changes of government) MPs vote to choose the prime
minister through a secret ballot, often of several rounds (Dinnen 2008). The winner is not
automatically the parliamentary leader of the largest party in parliament. Rather, success in
becoming prime minister requires the careful negotiation of a semi-clandestine process of
wheeling and dealing involving different political camps residing in different Honiara hotels
attempting to obtain the support of unaffiliated MPs (Alasia 2008; Allen 2008; Kabutaulaka
2008; Steeves 2011). Victory in these negotiations means government for the successful camp
61
The gendered language is used advisedly: only two women have won seats in the Solomon Islands parliament since independence. I could use the term ‘his or her’ but, given the possibility that parliamentary politics might be quite different were women more frequently involved, doing so seems inaccurate.

79
and the role of prime minister for its chosen candidate. For those individual MPs on the
winning side, being in government means a likely ministerial portfolio (Dinnen 2008). There are
24 government departments (spread across 10 ministries) and each department has a minister
as its helm (Corrin 2009, p. 214). There are also two state-owned enterprises with appointed
political leadership. Twenty four ministries plus two state-owned enterprises equals twenty
six, a number which — un-coincidentally — is the same as the number of MPs required for a
parliamentary majority.
For the successful coalition and its prime minister there is no guarantee success will be long-
lived. From the moment government is formed the parliamentary opposition attempts to
procure the loyalty of wavering members of the government, often with promises of better
ministerial portfolios or money, should the floor be crossed (see, for example, Fraenkel 2008,
p. 69). Governments are toppled with the prime minister resigning in the face of no-confidence
motions they know they cannot win, and in recent years parliament has been prorogued for
long periods of time as the government of the day strives to prevent no-confidence motions
from being tabled.
Removal of a government does not necessitate national elections be held, rather when it
occurs the respective political camps and prospective groupings return to the various Honiara
hotels from which negotiations and deal brokering commence afresh, a process which
continues until MPs gather in parliament to vote for a new prime minister via the usual secret
ballot. Figure 4.19 below shows those changes of government and/or prime minister in
Solomon Islands since independence. Red lines indicate national elections and the names of
prime ministers located over the red lines are those who rose to power through the coalition
building process immediately post-election. Prime ministers whose names appear in between
elections rose to power in the wake of a no-confidence motion or when the previous prime
minister resigned in advance of a no-confidence motion they could not have won. Changes in
prime minister almost inevitably bring with them changes in some of the ministers responsible
for various Solomon Islands ministries; however, they do not entail all members of the
governing group being replaced in entirety by those MPs that had been in opposition. MPs
who are adept in the negotiation process will often successfully hop from departing
government to replacing government, remaining ministers, even if not necessarily in charge of
the same ministry they held previously.

80
Figure 4.19 – Elections, Changes of Government and Changes of Prime Minister 1980-2011
Chart notes: data come from Jon Fraenkel’s government change dataset, combined with media reports of more recent changes.
Conclusion
In this chapter and the chapter preceding it I have provided the context of my study of voter
behaviour and ethnic identity in Solomon Islands. In the previous chapter I described the
geography and economy of Solomon Islands. I also looked in depth into social structures that
provide form to Solomon Islanders’ collective interactions. In this chapter I have examined the
most important aspects of the country’s electoral and parliamentary politics. I outlined
electoral rules, and detailed key electoral statistics including candidate numbers and winning
candidate vote shares. I have highlighted variance between constituencies and variance over

81
time. I have looked at MP turnover rates and then discussed some attributes of those people
who do get elected to the Solomon Islands Parliament. I have also outlined the nature of
politics within parliament.
One useful way of thinking about the subject of this chapter and the one before it is in terms of
causes and effects. The economic situation and needs of voters, along with social structures
such as clans and churches are all potential ‘causes’, influences on the choices voters make.
Meanwhile, the electoral outcomes I described, and their flow-on impacts on political
outcomes, are all effects of these choices.
The task set for the rest of my thesis is to link potential causes to the described effects, and to
establish which of the potential causes actually do play a role in shaping the voting decisions of
Solomon Islanders. And then also explaining how these processes are commensurate with the
described election results patterns, and politics more generally, of Solomon Islands.

82
Chapter 5 – Literature Review, Electoral Politics in Solomon
Islands and Papua New Guinea
Introduction
In this chapter I begin the task of linking Solomon Islands’ social context with the electoral
outcomes present in the country, and in explaining the roles played by ethnic ties and voter
behaviour in these links. I do so in the conventional manner: by reviewing the existing
literature, starting with that already written on voting in Solomon Islands. However, in this I
am hampered by the fact the existing body of comprehensive empirical work is small. Quite a
lot of work exists which touches on elections in passing, and I draw upon this fruitfully, and
there is a smaller body of study that focuses on electoral politics, yet there is little which
focuses in a sustained way on the role ethnic identity plays in shaping voter behaviour. As a
result I broaden my search. In the next chapter, Chapter 6, this takes the form of an
examination of the insights of political scientists working on issues related to ethnic identity
and voter behaviour outside of the Pacific. But before I do that my first port of call, in this
current chapter, is work on electoral politics written on the neighbouring state of Papua New
Guinea, which I include alongside existing work on Solomon Islands.62 Papua New Guinea
possesses not only a similar social context but also politics similar to Solomon Islands, and for
this reason provides potential insights.
Even expanding my review to cover Papua New Guinea I still found relatively little work
actively engaged with my specific research questions. Because of this, rather than devote this
chapter exclusively to what has already been written on ethnic identity and voter choices, I use
my excursion into the existing literature to paint a broader picture of voter behaviour. In doing
so I structure this chapter around three questions: ‘What outcomes do voters seek from their
vote?’; ‘Who or what sorts of candidates do voters vote for in attempting to attain these
outcomes?’; and ‘Why do voters vote for the candidates they vote for while seeking the
outcomes they seek?’.63 As I cover these questions, I also engage with two areas of debate in
the existing literature: whether politics in Solomon Islands and Papua New Guinea is clientelist
in nature; and whether culturally determined expectations are a major driver of voter
behaviour in the two countries.
62
Two authors who have written extensively on Papua New Guinea, Reilly and Ketan, are covered both in this chapter and the next. They are included in the next chapter because their work fits well with aspects of the broader international literature I cover in it. 63
These questions all, of course, presume voters are actually free to choose. Coerced voting is an issue in Solomon Islands and is something I discuss in my results chapters.

83
What Voters Seek
Clientelism
Solomon Islands
A basic distinction is made by political scientists between polities where political power is
primarily contested and exercised programmatically, geared around policy preferences and the
provision of public goods, and those where political power is clientelist — where politicians
focus on providing local public goods or private goods to their supporters, and where
supporters assess the merits of politicians with respect to the provision of these goods
(Wantchekon 2003; Stokes 2009; Vicente and Wantchekon 2009; Hicken 2011).64 The
distinction, it should be noted, is not purely binary, some programmatic politicking may occur
in predominantly clientelist systems, while polities that have mostly programmatic politics are
often still home to some clientelism or something akin to it (for example pork barrel spending
in marginal electorates).65
In the case of Solomon Islands most of the relevant literature suggests, if in some cases only
indirectly, that a form of clientelism is present, describing voters who appear to vote in search
of local or personal benefits, and politicians who target available resources first and foremost
to supporters.
Some of this evidence comes in the form of quantitative cross-country comparative work. For
example, in concluding their country ranking exercise on the prevalence of clientelism in the
Pacific, Duncan and Hassall (2011) state that:
On the basis of the rankings in the bottom three for each indicator, Kiribati, the FSM [Federated States of Micronesia], and Solomon Islands exhibit the strongest clientelist tendencies...
This is suggestive, although owing to the necessities of cross-country data gathering, the
indicators used by Duncan and Hassall are only loose proxies — governance outcomes that the
authors believe to be related to clientelism — and for this reason not definitive. Yet, their work
is complemented by other descriptive studies based on more direct observations of political
behaviour.
64
Within this definition some authors offer further definitional distinctions. For example, Stokes (2009) distinguishes between: clientelism, all particularistic benefits given to supporters, whether from state resources or candidates’ private resources; patronage, clientelism solely involving state resources; and pork barrel spending, state spending targeted at everyone in an area for the purpose of winning votes, but which benefits all residents, not just those who voted for the candidate. 65
Also worth noting is that neither programmatic nor clientelist polities need to be democracies. Clientelism, in particular, exists in autocracies, albeit with very different types of patron-client relations. However as Solomon Islands has been democratic throughout its post-independence history, I discuss clientelism here solely in terms of voter-candidate exchanges and expectations.

84
Morgan and McLeod (2006, p. 417) for example, in their essay on the challenges facing the
regional peace keeping mission to Solomon Islands write:
For the most part, Solomon Islands voters are simply disinterested in overarching policies; they want immediate returns for their support, in the form of money, materials and employment opportunities...For most Solomon Islands MPs, the challenge of satisfying the immediate demands of constituents…is greater than the need to develop long-term goals such as providing frameworks to encourage growth, stability and a better living environment. It is for these reasons that Solomon Islands politics, like those elsewhere in Melanesia, are commonly more about patronage than participation.
Kabutaulaka (2008b, p. 109), in outlining causes of weak political parties in Solomon Islands,
contends that:
Politicians are motivated predominantly by local issues and the enhancement of cliental relationships that might have little to do with parties and party policies. Much of what influences national politics…in the Solomon Islands are often local and parochial issues…
In a similar vein Roughan (2004, p. 4) writing about corruption and transparency in Solomon
Islands notes:
Electoral choices are made almost exclusively on grounds of the individual contestant, with an emphasis on perceptions of performance in development of the local area of the constituency. Such perceptions are very often inseparable from past or promised material gain from the candidate, so electoral behaviour is strongly influenced by local, family or individual gain, rather than suitability for national leadership skills or potential for representation on national issues.
Descriptions of Solomon Islands politics suggestive of clientelism can also be found in a range
of other academic work (for example, Kingmele and Paroi 2000; Morgan and McLeod 2006;
Pollard 2006; Cox 2009; Dinnen 2009; Hameiri 2009; Kelly 2010).
Further evidence comes in the form of statements made by politicians and aspiring politicians.
Reporting on sentiments expressed by Solomon Islands political actors during a conference on
political stability Hayward-Jones (2008, p. 15) writes that:
Members of parliament were under pressure to deliver cargo [consumable goods] to their constituents in order to be elected and to stand a reasonable chance of being re-elected…Candidates who did not have adequate financial resources to meet voter expectations were often beaten by those who did.
Rick Hou, the current Finance Minister of Solomon Islands, and member of parliament for the
constituency of Small Malaita, has written (2012, p.1):

85
MPs come under considerable pressure to deliver services within their constituencies. This can mean that more time and resources is spent responding to those needs ahead of the national interest…
And former government minister the late Fred Fono (2007, p. 129) describes voter preferences
for private rather than public goods:
People’s perceptions and attitudes are such that social projects such as schools, clinics, and water supplies also benefit people who voted for different candidates during the general elections. Hence, they don’t want the RCDF [constituency development funds which MPs spend in their electorates] to be used for such projects…
Afu Billy, who came second in the 2001 elections in the East Malaita electorate, in writing of
her election campaign notes (2002, p. 59) that, “[r]ight from the start, I began receiving long
shopping lists of what everybody wanted.”
Politicians could simply be making claims of this sort as a way of absolving themselves of
responsibility for the poor quality of their decisions while in power. Yet the limited data
available on the actual spending patterns suggests the actions of politicians are in accord with
their claims. Pollard (2006, p. 175), for example, provides a spending breakdown of MP-
controlled constituency development funds for the West ‘Are ‘are electorate in 2003, and
while some of the spending allocations are ambiguous, most of what the money appears to
have been spent on is private goods or local public goods. Media reporting of MP behaviour is
also suggestive, with numerous reports of MPs allocating resources to private goods or local
public goods (for example: Qwaina 2011; Osifelo 2012b; Sasako 2012; Ta’asi 2012; Dawea
2013). It is true that much of the money spent in these instances, along with the money
reported on by Pollard, is constituency development money, and so is funding that we should
not expect to go to national level public goods. Yet constituency funding could be, but rarely is,
spent on larger constituency-level projects benefitting whole electorates or significant
proportions of their population. Not only do Solomon Islands politicians talk of particularistic
requests from voters, they also appear to spend resources available to them in a manner that
fits such demands.
More evidence of clientelism can be found in the form of responses to a large-N66 survey of
Solomon Islanders (ANU Enterprise 2009, p. 133; ANU Enterprise 2011, p. 131), which suggests
few Solomon Islanders view the main work of their member of parliament as ‘governing the
66
n= 5035 in 2009 and n= 4972 in 2011. The survey has been funded by the regional assistance mission and spans a large range of issues, with only a few questions associated with politics. As discussed in Chapter 2 I was able to have several questions on electoral politics inserted in the survey in 2011. I draw upon these more heavily in Chapter 8.

86
country’ and that few vote on the basis of national issues (ANU Enterprise 2011, p. 135; Wood
2013).
Papua New Guinea
Evidence of clientelism in electoral politics can also be found in academic work on
neighbouring Papua New Guinea. While early studies of elections in Papua New Guinea (for
example, Premdas and Steeves 1978) found hints of politics, or political aspirations at least,
which could possibly be seen as programmatic, the vast majority of academic work on
elections in the country has described clientelistic political competition.
Okole (2001, p. 224), for example, contends:
Most PNG politicians run for office in order to provide particularistic benefits to their constituents…only a few have any notion of broader national issues…partisan affiliation, which often changes, is a means of participating in the government and thus obtaining resources for one’s constituents and often for oneself.
Similarly, Ketan (2007, p. 1) states:
Politicians rely on localized support bases to win elections and thus tend to devote much of the resources at their disposal to their strongholds, to the exclusion of the wider electorate.
And Kurer (2007, p. 40) provides game-theoretic analysis of PNG electoral politics arguing:
[T]he behavioural assumptions of political clientelism, where voters and politicians are engaging in particularistic rent-seeking, describe the behaviour of PNG voters and politicians well and explain at least some of the characteristics of PNG politics…
A number of detailed electorate level studies of PNG elections also provide excellent
descriptive evidence of clientelist politics (for example, Macqueen 1989; Filer 1996; Dorney
1997; Stewart and Strathern 1998; Standish 2007) and existing large-N survey evidence of
voter attitudes, while not necessarily directly addressing the question of clientelism, also tends
to provide results that commensurate with the presence of clientelism (Saffu 1989; Hasnain et
al. 2011).
Clientelism Contested?
On the basis of available evidence, it seems fair to state that the majority of voters in both
Solomon Islands and Papua New Guinea vote seeking the provision of local public goods or
private goods, and that politicians and aspiring politicians strive, with differing degrees of
success, to provide them.

87
Yet there is academic work which argues the voter-candidate relationship in Solomon Islands is
not correctly described as clientelistic (and some work which extends this argument to
Western Melanesia more generally). Dissent here hinges on two features of Melanesian
politics: first, fluidity of allegiances, which see MPs in parliament frequently shifting from
political coalition to political coalition and — of more significance to my study — which also
sees voters often shifting their electoral support; and, second, stemming from this fluidity,
lesser asymmetries of power than are to be found in some clientelist systems. MPs who can
change parties cannot, it is argued, be clients of political patrons, and voters who can easily
vote for someone else in future elections cannot fairly be described as clients of MPs.
Fraenkel (2011, p. 319), for example, in arguing MP-controlled constituency development
funds are not the product of voter preferences for patronage rather than policy, states:
Increasing resort to electoral patronage in PNG and Solomon Islands during the 1990s and 2000s was not indicative of the construction of classic patron–client systems, such as those found in Southern Europe or parts of Africa…Voter allegiances remained too fickle, conditional, and transient to be usefully called clientelist, while ministers retained too much authority, autonomy, and independence to be sensibly described as the “clients” of prime ministers.
While Steeves (1996, p. 132) writes that in the Solomon Islands case, “[t]he patron-client
model is not salient either, as allegiances shift too rapidly to sustain a fully integrated network
of dependency.”
As an empirical fact it is certainly true that political alliances in Papua New Guinea and
Solomon Islands are frequently only temporary and that voters often shift their allegiances
between elections. Clientelism of the ‘machine politics’ mould is rare or absent. What is less
clear though is whether this alone renders ‘clientelism’ an inappropriate term for describing
the politics of Western Melanesia. I cannot find any suggestion that politics needs to be stable
to be clientelist in my reading of textbook definitions of clientelism (for example, Stokes 2009)
and there are other examples of polities described as clientelist or patronage-based where MP
turnover is high and political allegiances presumably, therefore, fluid (see, for example,
Fraenkel et al. 2007, p. 4). Rather, the essential feature of clientelism common to most modern
definitions is simply voters casting their votes in search of particularistic benefits, rather than
national policy or national level public goods (for example, Kitschelt and Wilkinson 2007;
Stokes 2009; Hicken 2011).
However, more important than arguing who has clientelism correctly defined, and certainly
more useful at this point of my own study, is to note that both Steeves and Fraenkel correctly
identify, in fluidity and short-lived allegiances, key features of Solomon Islands electoral

88
politics. Also while Steeves and Fraenkel contest the use of the term clientelism, nothing in
their work suggests that voters do not cast their votes in search of private goods or local public
goods, the point I am most interested in at present.
In other words, on the basis of the available literature on Solomon Islands and Papua New
Guinea, it still appears fair to say the answer to the question ‘what do voters seek when they
cast their vote?’ is ‘private or localised benefits’.67
Who Do Voters Support?
With the available literature appearing to have provided an answer to the question ‘what do
voters seek when casting their ballots?’ I can move on to my next question: ‘who or what sorts
of candidates do voters vote for in attempting to attain these outcomes?’
Parties
Solomon Islands
At least in some democracies the answer to the question above would simply be, ‘the
candidate representing the party the voter supports’. However, as noted in the previous
chapter, voters in Solomon Islands are not generally thought to vote along party lines. Parties
play a role of sorts in political manoeuvrings within parliament but party allegiance does not
appear, normally, to win votes, at least through the direct process of voter allegiance (Steeves
2011). This has been the case throughout Solomon Islands’ electoral history. Describing the
situation around the time of independence, Chick (1983, p. 64) writes:
Nor have secular parties emerged to transcend parochial loyalties. Over the years there have been a number of factional groupings within the assembly, but none has acquired a popular following in the country, or even attempted to establish a distinctive image for itself....While there may have been a certain logic in the various alignments and realignments which took place, this was seldom apparent to any but the politicians immediately involved, few of whom bothered to explain their actions to the public.
This description has remained more or less correct, through early post-independence elections
(Premdas and Steeves 1983; Ulufa’alu 1983), the 1990s (Tuhanuku 1995) and into the
contemporary period (Alasia 2008; Fraenkel 2008; Kabutaulaka 2008; Kabutaulaka 2008b;
Paternorte and de Gabriel 2010; Steeves 2011). There have been some partial exceptions. Billy
(2002), for example, states she benefitted to some degree from positive voter perceptions of
the political grouping she was aligned with. Similarly, Mannesah Sogavare put in a concerted
67
It should be noted here that in both PNG and Solomon Islands clientelism is coupled with the closely associated phenomenon of vote buying. This is something I discuss further in my own research results. Importantly, in the case of vote buying voters are, of course, still voting in search of local or personal benefit.

89
campaign effort on behalf of candidates affiliated with his OUR party in 2010 (Paternorte and
de Gabriel 2010) possibly wining them some votes, although OUR party candidates did not
perform particularly well in 2010 (Steeves 2011). Importantly, however, such cases are
exceptions rather than the norm. Typical candidates do not campaign in a way that suggests
they benefit from party association: they make no use of party logos in their campaign
paraphernalia and do not actively distribute material such as party manifestos
(Commonwealth Secretariat 2006). Moreover, Solomon Island voters themselves do not claim
to place much weight on parties when voting. When asked as part of the RAMSI People’s
Survey in 2011 why they voted for the candidate they voted for, only 1.4 per cent of
respondents replied that they voted on the basis of party or policies (ANU Enterprise 2011, p.
135).68
Papua New Guinea
In Papua New Guinea parties are a more significant feature of the electoral landscape than
they are in Solomon Islands: party leaders sometimes campaign on behalf of candidates and
networks of party sympathisers sometimes provide candidates with local advocates (Filer
1996). In instances parties also provide resources to candidates (Premdas and Steeves 1978;
Reilly 1999; Ketan 2004) and party labels are used by at least some candidates on election
posters. Yet, parties are not normally separated by clear ideological or policy differences, and
voters do not appear to routinely vote for candidates on the basis of party affiliations
(Premdas and Steeves 1978; Saffu 1989; May 1997; Reilly 1999; Reilly 2001; Ketan 2004;
Standish 2007). It is possible that parties played a greater role (if still not overwhelming) in
voter choice in earlier elections but if this was once the case it is no longer so (Standish 2007).
Ethnicity
Solomon Islands
If the available literature is helpfully clear in eliminating party as a significant direct
determinant of voter support for candidates in Solomon Islands elections it is less clear in its
explanations of how voters do actually choose who to cast their votes for. Ethnic voting,
primarily in the form of clan voting, although also in the shape of church voting, is the most
frequent explanation and is described by most articles that make mention of voting, but only
in a small number of works does it receive any extended treatment.
68
Because this is a literature review I limit myself to citing the figure given in the publication. However, In Chapter 8, I more thoroughly interrogate the data behind the figure and in doing so come up with my own calculation of 2.25 per cent. An increase, albeit a very modest one.

90
Corrin-Care (2002, p. 208) is an example of an author who suggests ethnic voting is common in
Solomon Islands, writing that , "[v]oting in accordance with tribal allegiances, rather than for
the best candidate, is an enduring practice."
Premdas and Steeves, the two scholars to have undertaken the most in-depth study of
electoral politics in Solomon Islands, also suggest (1983, p. 90) ethnic voting is prevalent, in
this instance combined with ‘localism’ (voters voting for candidates who live nearby):
The campaigns were highly personal. The candidate was likely to be assisted by his immediate family and wantoks. Consequently, the most significant determinant of voter preference tended to be wantokism and localism. Indeed, most votes for a candidate were derived from the polling booth closest to his village and from wantoks in other areas. To defeat an adversary, a good strategist preserved his locality from being divided by other rival resident candidates while perhaps placing rival candidates in the village or locality of his main opponents.69
In subsequent work (Premdas and Steeves 1994, p. 52) they add religion to the list, writing:
The Solomon Islands reality is that voters’ choices are heavily influenced by the ethnic identity and religious affiliation of contesting candidates. If a candidate is a wantok, that is, from one’s group or village, and a member of one’s church congregation or parish, then one tends to respond decisively in that candidate’s favour.
Importantly, two of the groups they refer to — clans and communities — are relatively small.
Communities obviously so, but also, as I pointed out in Chapter 3, clans tend to be small too.
Usually too small for any one clan to provide an electoral majority in a constituency on its own
and certainly too small to be the basis of multi-electorate political blocs.70 Churches, on the
other hand are larger and could, on the basis of numbers, serve to structure national politics,
yet while a number of authors have pointed to people voting along church lines, this has not,
as I noted in the previous chapter, taken the form of national parties based around different
denominations. Although, for example, the Catholics in an electorate might be more likely to
vote for a fellow Catholic candidate from their electorate (Kabutaulaka 1998, p. 48; Pollard
2006, p. 178), there are not, as I emphasised in the previous chapter, Catholic parties which
aggregate the support of Catholic voters into national political movements (Chick 1979, p. 22).
69
The term ‘wantoks’ here is used to mean those to whom the candidate has relational ties (including clan ties). Similarly, ‘wantokism’ describes the propensity to work first with those whom one shares relational ties with. 70
Larger entities such as the cross-cutting moieties on Guadalcanal are plausibly large enough in some instances to afford electoral majorities within constituencies, and possibly even be the foundation for small cross-constituency allegiances. However, as discussed in my results chapters they do not seem to regularly play this role in a sustained manner.

91
The small size of electorally salient ethnic groups suggests a need for inter-ethnic cooperation,
an issue pointed to by Steeves (1996, p. 119):
Politicians who are elected to the National Parliament are those who can successfully build inter clan support or divide the ethnic base of their leading competitors by promoting rival candidates.
And also Kabutaulaka (1998, p. 22):
Political alliances are forged around family kin before being extended into the wider kinship group. In elections the foundation for political support is the kin group. A candidate gets the backing of close kin members before he or she moves to gain support from the rest of the constituency.
At the same time, as hinted by Steeves’ quote above, within-group loyalty is not guaranteed
either. Chick (1983, p. 67) offers more detail on this, including a tantalising snippet of
discussion on what is required to strengthen ethnic loyalties:
While a candidate’s kinsmen and co-religionists have a natural predisposition to back him, their support cannot be taken for granted. A rival may lay claim to the allegiance of identical groups...There is nothing like a really good feast to win over local dignitaries or arouse the enthusiasm of distant cousin.
In her detailed study of the sociology of the people of the West ‘Are ‘are constituency Pollard
(2006, p. 171) also offers interesting pointers as to the roles of ethnicity in campaigning. Like
most authors she describes ethnic, clan and church based voting, but like Chick she suggests
candidates cannot take the support of co-ethnics for granted and that for voters other
attributes also matter. Like Steeves (1996), she also hints at the role of allegiances (2006, p.
171).
Similar topics arise in Billy’s (2002) description of her campaign efforts in the 2001 election in
East Malaita constituency. She had local support, and the support of her kin group. However,
her main opposition was a “very close in-law” (Billy 2002, p. 59). If the relevant ethnic group is
clan, a close in-law need not necessarily, technically, be a co-ethnic yet the fact that
competition was between such close relatives does speak to the difficulties of building a loyal
support base in Solomon Island elections, even amongst those that the candidate is
relationally tied to.
Taken together these are useful insights. Insights which suggest that ethnic voting occurs, but
they paint only a very partial picture of the phenomenon in Solomon Islands.

92
Papua New Guinea
Papua New Guinea provides additional useful academic work. Commenting on election results
there numerous authors describe candidates drawing on core support bases that are localised
like those described in Solomon Islands and which suggests community and/or clan support as
an initial building block in the quest for electoral success (for example, May 1982; Hegarty
1983; Saffu 1989; Yasi 1996; Ketan 2007; Standish 2007).
Fukuyama, offers a description of voter behaviour in PNG which closely resembles Solomon
Islands. And while the term ‘wantok’ is not technically a synonym for ‘clan’,71 Fukuyama uses it
as such, meaning the following quote can be read as describing voters’ propensity to support
those of the same clan. Something which Fukuyama offers to explain Papua New Guinea’s
divergence from the predictions of Duverger’s Law.72
Like other Westminster systems, PNG had a single-member constituency, first-past-the-post electoral system, which according to Duverger’s law is supposed to produce a two-party political system. But because of the primacy of wantok loyalties, broader coalitions fail to emerge, and candidates are elected with as little as 10 per cent of the district’s votes. (Fukuyama 2007b, p. 6)
Fukuyama is not alone in suggesting voters in Papua New Guinea vote ethnically in the sense
that they have a propensity to vote for those from their clan or with whom they share similar
relational ties. Clans (sometimes the word ‘tribe’ is also used, appearing to describe the same
type of entity) are described as playing at least a partial role in shaping voters’ choices by a
long list of authors who have studied elections in any detail in Papua New Guinea (for example,
Harding 1965; Colebatch et al. 1971; Premdas and Steeves 1978; Warry 1987; Burton 1989;
Standish 1989; Filer 1996; Ketan 1996; Yasi 1996; Anere 1997; Reilly 2001; Gibbs et al. 2004;
Ketan 2004; Reilly 2006; Kurer 2007; Standish 2007; Allen and Hasnain 2010). Although less
commonly described, local church-based voting similar to that said to occur in Solomon
Islands, also appears to be present in instances (for example, Warry 1987; Yasi 1996; Osi 2013).
71
Specifically, as used people in Solomon Islands and PNG, the word ‘wantok’ does not serve the function of a noun used to refer to a collective entity in the same way that the word ‘clan’ is used in English (and ‘laen’ is used in Solomon Islands Pijin). While we might refer to the ‘Green River Clan’ in English a Solomon Islander would not use the term ‘wantok’ to talk of the ‘Green River Wantok’. Instead the term ‘wantok’ is used to refer to association by relational links (ostensibly through language but more often through shared descent groups such as clans). So a Solomon Islander or someone from PNG would most often use the term to call someone ‘my wantok’ (a person who is related to me) or a group of people ‘my wantoks’ (my relatives/members of the same clan) denoting a relational tie. 72
For example in (Fukuyama 2008, p. 18) “The wantok is simply the local version of what anthropologists call a segmentary lineage or descent group, which was at one point virtually universal in all human societies.” And (Fukuyama 2008, p. 21): “It is therefore perfectly legitimate for Solomon Islanders to see the wantok positively as a source of social capital…At the same time, there are certain problems that the wantok is completely unable to solve. When a wantok goes up against a Malaysian logging company, the logging company wins: it is too easy to bribe a chief into giving away land that is not really his, and the kin group cannot organise to enforce collective decisions on land use.”

93
However, it would be mistaken to suggest that ethnic voting was ubiquitous or that ethnic
loyalties in the form of clan or church affiliations were all that determined voters’ choices in
Papua New Guinea. Indeed a closer look into the literature reveals qualifications and
contradictions.
A number of authors suggest that, in many instances, even if clan or similar relational ties
provide candidates with a core of supporters, as in Solomons, owing to the relative smallness
of clan groups, successful candidates need to garner support from outside their group too
(Burton 1989; Standish 1989; Filer 1996; Standish 2007).
Writing of the 1992 election in the Imbbongu Open electorate Yasi (1996, p. 276) suggests clan
or kin based ties and localised support were important, coupled with church ties, but that the
ability to buy votes, presumably of unrelated voters, also mattered:
Three broad overall implications can be derived from the results of the elections in the Imbbongu Electorate in 1992. First, clearly the candidate who won and those who came close to winning had the backing of large communities and also of organizations such as a party of a church group. Second, people did not vote on party basis. They continue to vote primarily for the candidate with whom they are associated traditionally. This implies that ‘wantokism’ and kinship are still strong in the minds of the constituents. But the support of secondary associations is required to gain support beyond the primordial group. Third, the ability to buy votes also made a difference.
Only this combination of ties appears to have been sufficient to give the victor a winning vote
share. Indeed, as raised in the work of Pollard (2006) and Billy (2002) discussed above in the
Solomon Islands section, in Papua New Guinea electoral success appears to often require the
establishment of, or utilisation of, pre-existing links between relatively small groups to cobble
together an electoral majority. Burton (1989), for example, describes how allegiances are built
up, beyond core support bases, by drawing on traditional relational ties. Similarly, Filer (1996)
details how the successful candidate in the 1987 and 1992 elections in the Nuku Open
electorate won, despite being from a small ethnic group, through reputation, judicious use of
material goods to cultivate the support of influential people in communities, and a network
ostensibly tied to him through the Pangu political party, although the allegiances involved
appear to have been more to do with personal loyalty than shared party ideology. In a similar
vein, in a series of detailed studies drawing upon polling station level election results, May
(1989; 1997; 2006) shows that while minor candidates in the Angoram electorate in East Sepik
province tend only to be able to win localised (presumably clan or community based) support,
the secret to electoral success in the constituency has been winning votes from a wide area
and to win support from outside the candidate’s clan group.

94
Much of the existing work on elections in Papua New Guinea also suggests that although clan-
based electoral support is a real phenomenon, the support of candidates’ co-ethnics is not
guaranteed. There are many examples of clans and communities failing to unite, standing a
number of candidates usually to the detriment of electoral success (for example, Burton 1989;
Filer 1996; Ketan 1996; Haley 1997) as well as evidence, even where groups are largely united,
of some voters at least who are willing to vote outside their clan (for example, Warry 1987).
Ketan (2004) encapsulates the complexity by stating first that (p. 246):
Kin-groups are undoubtedly important in elections. Clan and tribal loyalty…are of prime importance in directing voters during elections and remain the principal resource available to skilled manipulators. It is quite normal for election candidates to claim clan-wide support as well as significant proportions of other clans and sections from within and outside their own tribe.
Before adding (p. 249):
A second factor which complicates this process is the fact that those from within a candidate’s primary kin-group are, as individuals, primarily free agents who may choose to support an opposing candidate simply because of relations which they consider more pragmatic in their own personal networks. If they stand to gain more from supporting someone outside their own kin-group, as opposed to their own candidate, they will vote that way.
Adding to the complexity, Allen and Hasnain (2010, p. 11) contend that different regions of
Papua New Guinea experience clan voting to varying extents, with clan voting being much
more prevalent in the highlands than it is in coastal PNG. The same distinction is also made by
Saffu (1996) and is interesting, particularly as the argument that clan voting is more prevalent
in the Highlands where clans are larger (and therefore more likely to be a successful building
block in electioneering) fits well with Posner (2005) and Chandra’s (Chandra 2004) theories,
discussed in the next chapter, of the role played by relative group size in determining the
electoral salience of different ethnic cleavages. However, other evidence suggests the
distinction highlighted here is at best one of differences of degree, not category. There are
examples of clan-based voting in lowland parts of the country (for example, Premdas and
Steeves 1978; Anere 1997) and examples of support being won across different clan groups in
highland electorates (for example, Burton 1989).
At this point it seems safe to conclude that ethnic voting, in the form of clan and sometimes
church based voting, while not the sole determinant of voter choice, is present in Papua New
Guinea, albeit to differing degrees in different regions. Yet one final, apparently contradictory,
research finding needs to be discussed. This is the finding of political scientist Yaw Saffu’s

95
survey based work on voter behaviour. Saffu has been responsible for some of the most
detailed work on elections in Papua New Guinea and in 1982 and 1987 he conducted a survey
of voters (N=1127 in 1987) from around the country, asking among other questions, why they
decided to vote for the candidate that they voted for (Saffu 1989). The results of his survey
stand in contrast to the findings listed above, most of which see a significant (although not all-
encompassing) role for ethnicity in determining voter choices. Although it is hard to be certain
owing to the way Saffu’s results tables are laid out, it appears that in 1982 only 12 per cent of
respondents ranked what Saffu called candidates’ ‘primordial’ attributes (a category that
includes ethnic ties) as a major determinant of their choice.73 And in 1987 nine per cent did so
(all figures from page 18). This leads Saffu to conclude (p. 30), “monocausal explanations of the
vote in PNG are definitely wrong, and none more so than those that put forward kinship or
linguistic factors.”
Saffu’s findings are puzzling when one considers that ethnic voting has been identified by so
many other authors writing about elections in Papua New Guinea. However, the explanation
likely lies instead in the issue of social desirability bias — survey respondents’ propensity to
give answers that they believe interviewers believe are right (Gonzalez-Ocantos et al. 2012). As
discussed in detail in my methodology chapter this has been identified as a major issue in
survey-based studies of ethnic voting, with respondents typically significantly understating the
extent to which they vote ethnically (Posner 2005; Lieberman and Singh 2012).
This being the case it would seem that a fair summation of the evidence presented thus far in
this chapter is that in both Solomon Islands and Papua New Guinea ethnicity in the form of
clan and church plays an important role in the decisions that voters make. Yet there is much
more going on and it would be incorrect to assume that the relationship between ethnicity and
voting is a simple one. While people often vote for co-ethnics, there are clearly instances when
they do not, and while ethnic groups such as clans do in instances function as ‘vote banks’,
blocs of support that candidates can count on, this is not inevitable. There are many instances
of clans, for example, suffering rifts that see them standing several candidates. Also,
throughout much of Solomon Islands and Papua New Guinea, a candidate’s clan alone is not
enough to win them an election, support has to be gathered from other groups, either in the
form of alliances or by winning the loyalties of individual voters.
73
This number is very similar to that provided in the 2011 RAMSI Solomon Islands People’s Survey (which I discussed above — ANU Enterprise 2011, p. 135). Because no sustained analysis of this finding is offered in the text of the People’s Survey, and because the People’s Survey responses are, in my opinion, more meaningful on careful adjustment, I do not make further reference to them here. However, I present the results of the relevant People’s Survey question in detail in Chapter 8.

96
All of which means I arrive at this point in the chapter, and my literature survey, having gained
from existing work some clarity — voters vote in search of local or personalised support — and
some additional insight, which while not providing neat answers is still elucidating: in their
search for localised or personalised benefits voters do often vote ethnically, for candidates
from their clans and sometimes their church groups, yet they do not always do this.
Why do People Vote the Way they Do?
The next question I pose to the literature is ‘why is this the case?’ Why do voters vote in search
of local or personal benefit? And why, when they do this, do they — often but not always —
vote ethnically?
The literature offers a range of explanations for the voter behaviour observed in Western
Melanesia. For reasons of analytical clarity I have grouped the explanations into two camps:
cultural expectations and rational choice. I do this because it highlights what I think are clear
differences in the types of explanations offered. And highlighting these differences helps me
explain carefully what explanations offer and where their weaknesses lie. Of course, as is often
the case with taxonomies, my categorisation here imposes an artificial neatness on realty.
There are a number of authors who offer, sometimes in the same work, both cultural
explanations and rational choice type explanations (for example, Sillitoe 1983; de Renzio and
Kavanamur 1999; Ketan 2004; Fukuyama 2007; Dalsgaard 2009) or who contend that both
types of explanation are compatible (Okole 2002). And, as we shall see in my own subsequent
analysis, depending on how culture is incorporated, the two do not have to be mutually
exclusive. But for now, in the interests of clarity I make the distinction.
I should also note here that I do not discuss in this section one other alternative explanation of
voter behaviour offered occasionally in some work on Papua New Guinea: that voters vote for
co-ethnics out of a feeling of irrational pride (for example, Orlegge 1997; Ketan 2004). Rather,
for reasons of space and flow, in the following chapter I incorporate PNG examples into my
extended discussion of this type of voter behaviour as it occurs in the political science
literature more generally.
The Explanation from Culture
It is easy to see why culture appears a likely explanation of the choices of Solomon Island
voters and its Western Melanesian neighbours. Easy, because the social norms and shared
beliefs of Western Melanesians appear profoundly different from those that comprise the
cultures of the Western democracies from which their election results differ so markedly. And
a number of authors can be found offering cultural explanations of Western Melanesian

97
politics. These explanations tend for the most part to proceed as follows. Culture influences
elections through voters viewing politicians as a form of traditional leader, a kind of big man or
chief, and thereby having expectations of them that are similar to those they might have
historically possessed of those who traditionally led them. Just as big men were expected to
deliver wealth and goods to their followers, so too are contemporary political leaders, and
voters appraise them in this way. A leader who delivers the goods will be deemed good, and
worthy of electoral support. A leader who does not, even if they perform great legislative
services to the country as a whole, will not. The fact that the goods once delivered by
traditional leaders were local, and continued expectations of this sort, explains the clientelism
of Western Melanesian politics. Likewise, the fact that traditional community leaders are
usually co-ethnics explains the occurrence of ethnic voting.
Writing of Solomon Islands Kabutaulaka (1997, p. 139) for example states that:
As described above, the kinds of expectations voters have on politicians today are the same types of expectations people have on a traditional ‘big-man’. Most politicians in turn react to people’s expectations as a ‘big-man’ would — distributing wealth and participating financially in nearly every community affair.
Kabutaulaka (1998, p. 28-29) also explains the self-perpetuating nature of such behaviour:
Voters have the same expectations of politicians today as the community had of the traditional Big-Man and most politicians react to these expectations as the village Big-Man would have — distributing wealth to members of the group and participating financially in nearly every community affair. This response tends to confirm voters in their misconception that this is the proper task of a politician, the modem version of the traditional Big-Man. Unfortunately, it makes the politician vulnerable to bribery and other forms of corruption. Most of the present Solomon Islands parliamentarians are perceived by the voters as Big-Man [sic] — the traditional Big-Man in a modern political system.
Similarly, Allen (2011, p. 267), in describing the influence of logging money on Solomon Islands
politics, contends:
Ultimately, therefore, it is the socially and culturally grounded expectations of their kinsmen that compel Members of Parliament (MPs), government officials, and local ‘big-men’ to access and distribute resources: and the logging industry has afforded significant opportunity for such patronage.
Writing of Papua New Guinea, Harris (2007, p. 23-24) offers a similar explanation:
In most respects it is clear that what has happened is a transferal of the traditional big man system of gaining followers into the modern political system. This is a strategy that is well understood by both leaders and followers, and as long as the traditional redistributive system works

98
effectively the system will continue to be popular. Campaigning is based on those traditional redistributive relationships, with the leader providing resources to traditional supporters…In return the supporters provide votes at the election.
As does Fukuyama (2007b, p. 6):
Traditional PNG society is characterized by “big man” politics, in which status is derived from one’s ability to distribute resources to people in one’s village. This practice has simply been transposed to a national level, where legislators seek to distribute national resources to their wantok or descent group.
Additional explanations of this kind can be found in a number of studies spanning from some
of the earliest work on Papua New Guinea (Harding 1965) to some of the most recent (Ketan
2004; Dalsgaard 2009). Yet such cultural accounts are also contested. Typically, although not
exclusively, by authors who propose alternate explanations that hinge upon rational-choice
type models of politics and political economy.
Rational Choice
Haque (2012), for example, writing about Solomons, takes aim at those who blame culture for
problems of governance, including political governance, arguing that culture is not a necessary
cause — something required to explain the problems of political governance seen in Solomon
Islands. Instead, Haque argues, the problems of governance can be viewed as products of
broadly rational responses on behalf of individual actors to the material incentives they face,
responses anyone would make regardless of their culture.74 In the case of voting, Haque’s
argument is that people vote in search of local benefits because their needs are immediate,
while at the same time the state is weak, generally has little impact on their lives, and is
constrained in its scope for change by conditionalities placed on spending by aid donors. What
is more, to Haque, voters, even if they desire change, find themselves caught in a collective
action dilemma:
A rational voter would only ever consider foregoing direct benefit in the hope of broader improvement if they believed that a good proportion of other voters would make the same trade-off. Giving up personal benefit to support better policy is even less appealing if that vote would be wasted on a losing candidate in a first-past-the-post system. (Haque 2012, p. 5)
74
Importantly, rational choice approaches such as those of Haque do not assume that voters are perfectly rational or that they are always rational. Rather they contend that voter behaviour is close enough to rational, enough of the time, for models based on these assumptions to have reasonable explanatory power.

99
Under these circumstances, according to Haque, there is no need to appeal to culture to
explain the way people vote in Solomon Islands elections. Instead voters vote in search of local
benefits because:
In this context, it would take not just a very strong sense of national identity, but also an unusual preoccupation with long-term interests, a rarely overpowering altruism, and a similar faith in the altruism of others for any individual to base their voting behaviour on a candidate’s national policy positions, rather than on the likelihood of a particular candidate providing direct benefits to the local community. (Haque 2012, p. 5)
Haque is correct to claim that appeals to culture are not obviously necessary to explain
features such as the clientelist politics of Solomon Islands, and other authors such as Reilly
(1997) and Kurer (2007) similarly reject (at least in part) culture driven explanations for the
outcomes of politics in Papua New Guinea.75 Moreover, Haque’s alternative explanation
derived from rational choice type arguments is, as presented, a logically consistent and well-
argued alternative. Yet for all this, he provides almost no evidence that the explanation he
offers is the correct one. It is theoretically plausible but empirically unproven. It could be true,
but he does not show that it is.
There are, however, further grounds for believing that explanations appealing to culture, of
the sort offered above, are misplaced. The first is that many of the observed features of
Solomon Islands electoral politics can be found elsewhere, including in parts of the globe with
vastly different cultural traditions. Clientelism, in particular, is prevalent throughout much of
the world, particularly in countries where income poverty is high (Stokes 2009, p. 668). Clearly,
it can exist without requiring a recent history of big-man style political leadership.
Furthermore, as Kurer notes (2007, p. 45) of culture-based explanations of voter behaviour in
Papua New Guinea:
[T]he account is not entirely convincing. People do distinguish social contexts and are therefore unlikely to have transferred the experience of gift-exchange of the village wholesale into expectations of how national politics operates.
Indeed, while responses to various rounds of the People’s Survey (ANU Enterprise 2009; ANU
Enterprise 2010; ANU Enterprise 2011) suggest that Solomon Islanders often believe the main
job of their MP is to help his or her supporters or to assist the constituency, rather than govern
the nation as a whole, people also demonstrate an understanding of the types of public goods
75
Also, Kurer in particular, offers well-argued rational choice based explanations for Papua New Guinea, very similar to those made by Haque.

100
and services their government could be providing, and lament that it is not, suggesting their
understanding of politics is not entirely anchored in the past.
What is more, as Cox (2009, p. 268-9) points out much of the behaviour of politicians in
Solomon Islands appears decidedly untraditional:
While some aspects of ‘big man politics’ capture the instability of Solomon Islands politics, there are other aspects of political behaviour which are less easily explained by reference to traditional precedents. For example, can the extensive, persistent, and devious corruption in the forestry industry really be explained by reference to kastom (Solomon Islands Pijin for ‘tradition’)? Does a politician offer a reward for shooting RAMSI officers because of something inherently Melanesian? Is it ‘cultural’ that the key figures allegedly instigating a political riot are rewarded with ministerial positions?
To Cox’s list a range of further examples could be added. Would the voters of West
Guadalcanal constituency really have elected the ethnic Chinese businessman Thomas Chan in
1997, and his son Laurie in 2001 and 2006 if they were really mired in tradition? Perhaps the
Chans bestowed gifts to constituents in a manner akin to that expected of traditional big men
but even then it seems unlikely that this would — if voter behaviour was trapped amidst the
traditions of the past — have been enough to overcome the fact that the Chans spoke a
completely different language from their constituents, were of a different ethnic group and
culture, and lived outside the electorate. Indeed, many of the members of the Solomon Islands
parliament, while often having being born in their constituency, have spent most of their lives
outside of it. David Day Pacha, the member of parliament for South Guadalcanal has lived in
Honiara (the opposite side of the island) since he was a child (Interview David Day Pacha),
while MPs such as Rick Hou (the MP for Small Malaita) have also lived outside of their
constituency most of their lives. And most members of parliament, during their tenure as MPs,
live not in their communities, or even their constituencies, but in Honiara. This contrasts with
the traditional living arrangements of big men and chiefs in Solomon Islands: within the
villages they led.
Likewise, it would seem reasonable to expect that if voters really thought of members of
parliament as leaders akin to big men or chiefs, actual village big men and chiefs would be
regularly elected to parliament. Yet this appears rare. There is an element of elevation to the
pre-parliamentary lives of Solomon Island MPs in that they have much higher levels of
education than their constituents, and often an elevated profile gained through employment
in the cash economy, but available MP data suggests that only in rare instances have they also
been traditional community leaders (Corbett and Wood 2013).

101
Also, the roles of traditional leaders in Solomon Islands (as well as in Papua New Guinea)
extend far beyond simple acquisition of resources for followers: they adjudicate in local land
disputes, for example. If voters thought of politicians as the modern equivalent of traditional
leaders, and if this drove their assessments of them, it would seem reasonable to expect that
politicians, as well as busying themselves bestowing patronage, would also engage with other
constituency matters, such as resolving land claims. However, this is not described at all in the
literature and does not appear common.
In short, the electoral choices of Solomon Islands voters show an adaptability that does not
seem commensurate with explanations of voter behaviour which explain their choices as
culturally constrained and caught in expectations born of tradition.76 However, noting this is
not the same as claiming that culture plays no role, and in subsequent chapters I will suggest
that if culture is thought of as including norms of reciprocity and obligation, and patterns of
cooperation, then there are elements of culture shaping patterns of voting in Solomon Islands.
Indeed, pure rational choice type arguments, such as those of Haque, struggle on their own to
explain the election results observed in Solomon Islands and Papua New Guinea. It is not clear,
for example, why the decisions of rational voters are of their own accord an explanation for
the absence of strong political parties in Solomon Islands and Papua New Guinea. Clientelist
voter behaviour is coupled with strong political parties in other parts of the globe (Kurer
2007b) and the formation and support of parties is arguably a rationally effective strategy for
attaining increased political power and from this resources. What is more, there are other
features of Solomon Islands election results — results from certain constituencies, the poor
performance of women candidates — that are hard to explain simply by looking at voters’
material incentives, the state of the country’s formal institutions of governance, and its level of
economic development.
Importantly, simple rational choice arguments do not, on their own, do a good job of
explaining why so many candidates contest elections in Solomon Islands. Solomon Islands
elections are held under a Single Member District Plurality voting system and political theory
— as I explained in the introduction — gives strong cause to believe that the choices made by
rational voters under these electoral rules will tend, over time, towards two party or two
candidate electoral competition, yet this has not been the case in Solomon Islands.77 It is
possible to provide explanations for why this might not occur; for example, by arguing that the
absence of a left-right divide (or similar cleavage) leads to voters having non-transitory
76
The same is also true of voters in Papua New Guinea. 77
Nor was it the case in PNG when it had the same electoral system.

102
preferences (an argument which is, in effect, offered in slightly differing ways by: Morgan
2005; Okole 2005; and Fraenkel 2005b).78 Yet, this explanation does not sit that well with other
international evidence — low candidate numbers can be found in other countries that lack
ideological cleavages (Cox 1997; Neto and Cox 1997). What is more, at least within electorates,
in a clientelist polity, a left-right divide is not necessary for voters to be able to form transitory
preferences. Instead, all they require is sufficient information to determine the relative
propensities of various candidates to offer assistance if elected.
A more promising explanation for candidate proliferation, which is commensurate with
rational choice models (but which could also work through other mechanisms) stems from
Solomon Islands’ ethnic diversity. As we have seen voters do vote along ethnic lines in some
instances in Solomon Islands, and writing about neighbouring Papua New Guinea several
authors (including Fukuyama (2007b), who I cited above, and also Reilly (2004) and Kurer
(Kurer 2007b)) have offered ethnic diversity and ethnic voting as an explanation for the
absence of political consolidation. Yet these explanations are largely offered in passing, do not
explain in detail why ethnic voting only apparently occurs in some circumstances, and do not
explain how as an intermittent phenomenon, ethnic voting would still serve to prevent
convergence towards two party competition. They also fail to explain why certain ethnic
cleavages become more salient than others (clan, for example, in some instances, church in
others). Indeed, it is hard to explain every aspect of voter behaviour in Solomon Islands
without at least some recourse to cultural context — something I return to in my analysis.
Conclusion
For now though I can conclude this chapter — my review of existing work related to voter
behaviour in Solomon Islands and Papua New Guinea — by summarising what the literature
has and has not given. From the material covered it is clear what does not play a major role in
determining voters’ behaviour in Solomon Islands (and Papua New Guinea): ideological
attachment to political parties; and policy preferences at the national level. Instead, voting in
both countries is characterised by clientelism — voters voting for candidates in search of
personal or localised benefits. This clientelism appears to be relatively well explained through
a loosely rational choice model of voting. Or, at least, such a model offers a more convincing
explanation than the most frequently posited alternative, explanation based on culturally
generated expectations. Yet, the rational choice model of clientelism fails to explain other
aspects of election results seen in Solomon Islands. Most importantly if fails to explain
78
Non-transitory preferences in this case meaning voters are not able to develop ranks of candidate preferences and so therefore are not able to abandon a favoured candidate for a next best candidate who is more likely to win because they cannot determine who is next best.

103
candidate proliferation. A possible explanation for this could be ethnic voting and ethnic
divides which prevent political consolidation. And research on elections in Solomon Islands and
Papua New Guinea does often (but not always) point to voters voting ethnically. However,
detailed explanations of why voters in Solomon Islands (and Papua New Guinea) vote
ethnically when they vote ethnically, and why they do not when they vote non-ethnically are
scarce. As a result, in the following chapter I extend my literature search to cover work on
voter behaviour from elsewhere in the world.

104
Chapter 6 – Literature Review, Ethnic Identity and Ethnic
Voting
In the previous chapter I commenced the search for answers to my research questions. I did
this by reviewing the existing literature on electoral politics in Solomon Islands, augmenting it
with selected works from Papua New Guinea.
From the review it became clear that voting in Solomon Islands, and in Papua New Guinea, is
characterised by a fluid form of clientelism — voters voting seeking private goods and localised
public goods, rather than voting on the basis of national issues. Yet why voters vote for the
candidates they vote for when seeking localised benefits was less well explained by the
literature. Explanations involving the (relatively) rational responses of voters to the political
and social environments they vote within, as advanced by at least one author writing on
Solomon Islands and several writing about Papua New Guinea, appeared satisfactory to a
point, but crucially they offered little by way of explanation of a central feature of Solomon
Islands elections — candidate proliferation. This is a significant failing because, as I discussed in
the introduction, numerous candidates in Solomon Islands elections stands at odds with the
predictions of Duverger’s Law. Predictions which flow logically from the electoral rules
Solomon Islands has and assumptions of rational political actors. Because of this, any
explanation of voter behaviour based predominantly on reasoning voters, if it is to be
convincing, needs to account for high candidate numbers.
One possible explanation for high numbers of candidates in Solomon Islands is the country’s
ethnic diversity. If there are many ethnic groups, and if people only vote for co-ethnics, then
we should expect many candidates. Such an explanation could fit with rational choice models
of the country’s clientelism and explanations of this sort have been offered in work on politics
in Western Melanesia. Yet they are rarely offered in depth. And, while there is evidence from
Papua New Guinea and Solomon Islands that voters vote for co-ethnics in some instances,
there also appear to be circumstances where they do not. The existing literature on the two
countries offers few insights into why ethnic voting is an intermittent phenomenon or how, as
an intermittent phenomenon, it might still act to cause high candidate numbers.
Having only been able to unearth explanations of voting in Solomon Islands that are
incomplete, I now turn to another likely source of insight into voter behaviour: political science
research undertaken in other parts of the world. In particular, having identified voters voting
for co-ethnics as something that occurs in Solomon Islands, and having identified ethnic
diversity as a potential cause of candidate proliferation, I focus on work from other parts of the
world that looks at the intersection of ethnic identity and voter behaviour.

105
One plausible objection to doing this is Melanesian exceptionalism — that is, the argument
countries such as Solomon Islands and its neighbours are so culturally and contextually unique
as to render worthless insights imported from elsewhere. Brigg (2009) for example, offers
objections of this kind to Francis Fukuyama’s (2008) attempts to describe Solomon Islands’
social structures making reference to Africa (for discussion of earlier anthropological debates
about the aplicability of ‘African’ models in Melanesia see Keesing 1987). Yet, in the case of
electoral politics it would seem unproductive to dismiss a priori what has been learnt
elsewhere, not the least because many of the observable traits of electoral politics in Solomon
Islands are very similar to those found in other parts of the world. Voters voting in search of
private goods or localised public goods, for example, is common in many countries with low
levels of economic development as well as some wealthier states (Wantchekon 2003; Stokes
2009; Hicken 2011; Stokes et al. 2013). Likewise, vote buying of the sort that occurs on in
Solomon Islands can be found in South East Asia, Africa, and Latin America (Conroy-Krutz 2012;
Gonzalez-Ocantos et al. 2012; Fraenkel and Aspinall 2013). Similarly, weak political parties and
party fluidity, while rarely as acute as in Solomon Islands, are features of at least some other
countries (Dalton and Klingemann 2009). And high levels of incumbent turnover can be found
in a number of other developing countries (for example, Samuels 2000; Uppal 2009; Fraenkel
and Aspinall 2013; Weghorst and Lindberg 2013).
Such commonalities suggest there may well be insights to be gathered from looking elsewhere,
and in the rest of this chapter I cover such relevant work. I start by expanding and explaining
the definition of ethnic voting I offered in the introduction, linking it to the work of other
political scientists. I then cover both indirect and direct evidence of ethnic voting occurring in
other parts of the world. Having done this I move to look at work on the actual mechanics of
ethnic voting: work which has sought to explain when and why people vote for co-ethnics. I
finish by looking at debates in political science on the fluidity of ethnic identities.
What is an Ethnic Identity?
As I noted in my introductory chapter although terms such as ethnicity and ethnic cleavages
are common currency in political science, they lack universally agreed definitions. This hardly
renders ethnicity unique amongst the concepts social scientists use and, as is the case with
many of the conceptual frames we use to structure our work, it is unlikely there is a perfect
definition of ethnicity waiting to be found — one which is free from controversy and which
neatly encompasses every group we might wish to label an ethnic group (Reilly 2006). And so,
in this thesis I have aimed not for definitional perfection but rather a definition which works

106
well enough. One that will be recognisable to other researchers, particularly researchers
studying ethnic electoral politics, and which affords the analytic clarity necessary for my study.
Sticky Traits
Clearly not all groups are ethnic groups (few would consider members of the Public Service
Union an ethnic group) nor are all identities ethnic identities (I might identify as a surfer but
few would consider this my ethnic identity). In seeking to differentiate ethnic groups and
identities from other types, Chandra (2006) argues ethnic identities are based upon traits that
are both sticky and visible. Sticky in that they are not easily changed, and visible in that they
afford ease of identification.
That traits must be sticky is clearly an important element of ethnic identity, one which
differentiates race, for example, from membership of a trade union. Arguably such a
requirement of stickiness might, under some circumstances, be said to exclude religion from a
potential suite of ethnic identities as people can change religions. However, in most parts of
the world where religion is a significant social cleavage (India and Ireland for example) change
is rare. And in Solomon Islands, while people do change church, the fact, covered in Chapter 3,
that the population shares of most churches did not change substantially between the 1999
and 2009 censuses, suggests change is rare there too.
Visible Traits
That traits must be well-known (‘visible’) if they are to politically important is self-evident. It is
hard to see how an identity based around hidden traits could structure mass politics. In many
instances ‘visibility’ literally does mean visible (for example, African Americans and Whites in
the United States are differentiated by clearly visible traits). However, ethnic groups are not
always literally visually distinct — appearance alone will not distinguish an Irish Catholic from a
Protestant. And in Solomon Islands while appearance affords some differentiation between
people from Western and Eastern parts of the country, it is not sufficient to allow a Malaitan
to identify someone from Guadalcanal on sight, or the members of different Malaitan clans to
assess each other’s identity at first glance. Yet, such groups are still in practice easily
distinguishable. A few words of conversation would be sufficient to enable a Malaitan to know
they were speaking to someone from Guadalcanal. And in rural parts of Solomon Islands
people typically know (or can easily find out) the village, church and clan identities of other
people within their electorates. Indeed, as I discussed in Chapter 2, the rural Solomon Islanders
I interviewed could usually provide me with this sort of information for most or all of the
candidates in their electorate in recent elections.

107
Social Salience
That ethnic identities must have some social salience is also intuitive. While it might be
possible for a particularly talented politician to conjure forth a new identity or ethnic divide, it
will almost certainly be easier for political actors to work with identities which already form an
active part of people’s understanding of themselves and their social environment.
Posner (2005), one of the main theorists of the importance of socially constructed ethnic
identities in electoral politics, discusses how history, and in the case of post-colonial states,
colonial history, plays an important role in affording particular identities social salience. In the
case of Solomon Islands it is easy to see how the colonial epoch served to shape at least some
of the identity options people currently possess, and which I detailed in Chapter 3. The island
identities that played a role in the Tensions formed in part through differential patterns of
economic development in the colonial era (Fry 2000). And churches, and their associated
identities, arose as part of changes associated with colonial rule. Similarly, writing of his home,
the ‘Are ‘are language area of Malaita, Naitoro (1993, p. 7) explains how dialectic and cultural
divisions became more distinct as a result of having being associated with the administrative
units by the colonial administration. Meanwhile, Akin (2013, p. 4) in discussing the British
colonial project in Solomon Islands, describes how the colonial administration drew on African
experiences and chose to actively make use of Solomon Islands’ customs and social structures
in its governing of the country. He subsequently explains how such customs and structures
were manipulated and modified by this process. (Also see Premdas 1989 for a sustained
discussion of how the colonial era shaped ethnic identities in neighbouring Papua New
Guinea.) Of course, not all identity options available to Solomon Islanders owe all of their
prominence to colonial rule; language and clan identities were important prior to colonialism,
even if they were subsequently modified by it. Most important, however, is simply that the
identities in question are meaningful features in structuring people’s lives, which is clearly the
case in Solomon Islands with languages and clans, as well as with colonial era imports such as
church groups.
Ethnic Identities in Solomon Islands
Based on the definition I have given, included as ethnic identities in Solomon Islands are: race-
based identities, clan-based identities, language-based identities, religious identities, and
island identities (at least as a potential ethnic identity).79 Each fits the criteria above. Each, as I
have explained is based on traits that are sticky, visible (well-known) and socially salient. What
79
Race, as used in Chapter 3, fits the definition. However, owing to Solomon Islands’ high degree of racial homogeneity, it appears only to play a role in ethnic politics in very rare instances. Because of this, for the most part, I do not cover it in subsequent discussion.

108
is more, my application of the term ‘ethnic’ to at least three of these identities is not novel; a
range of authors have applied the label ‘ethnic’ to these identities in other work. Linguistic
diversity is included in most standard measures of ethnic fragmentation (see, for example,
Alesina et al. 2003). And a number of authors make use of clan (or the closely related concept
of tribe) as an ethnic identity. Tribes are central, for example, in Posner’s (2005) work on
ethnic voting in Zambia; and Reilly has used clan as an ethnic identity in his work (for example,
Reilly 2000; Reilly 2006). Similarly, in his article on multi-ethnic democracy in the Encyclopedia
of Democracy, Lijphart (1995, p. 853) emphasises that religious groupings are typically
considered ethnic groupings for the purposes of political analysis, and Posner (2005) and Reilly
(2001) both use religious groups as examples of ethnic groups. Island-based ethnic identities
are less readily found in other work; yet the identity fits well enough with the definition I have
offered.
Clearly, the identities I have categorised as ethnic identities in Solomon Islands are
overlapping, meaning individual Solomon Islanders may possess multiple identities (a Kwara’ae
speaking Catholic of a certain clan from Malaita, for example). This is not unusual, and has
been addressed in literature elsewhere on ethnic politics. It is something I return to later in
this chapter.
Ethnic Groups and Ethnic Cleavages
Within ethnic identities we find ethnic groups. An ethnic group is a group of people who form
a well-recognised subset of the population on the basis of the ethnic identity in question. For
example, if the ethnic identity in question was religion, ‘Catholics’ would be a potential ethnic
group, as would ‘Seventh Day Adventists’. If the ethnic identity in question was clan, the
various clans found in a constituency would be ethnic groups. If the ethnic identity in question
was language then, to use the example of the Aoke/Langalanga electorate I draw upon in
Chapter 8, ethnic groups would include Kwara’ae speakers and Langalanga speakers. If the
ethnic identity I draw upon is island, then in the Solomons case groups would include
Malaitans, people from Guadalcanal and so forth.
An associated definition is that of ethnic cleavage: a divide between two or more groups who
differentiate themselves on the basis of ethnicity. The ethnic cleavages in my examples above
would be the divide between Catholics and Seventh Day Adventists, the divides between the
different clans, the divide between Kwara’ae and Langalanga speakers, the divide between
people from Malaita and people from Guadalcanal.

109
Evidence from Elsewhere of the Existence of Ethnic Voting
Theories positing that the diversity and nature of ethnic groups in a society will affect its
politics stretch at least as far back as John Stewart Mill (Reilly 2001), and have an impressive
recent pedigree through work such as that of Lijphart (1977; 1979; 1995), Horowitz (1985),
Reilly (2001; 2006) and others. There is also considerable recent empirical evidence from a
range of contexts to suggest that ethnic identities, in some instances at least, play a role in
determining the choices voters make.
Inferring the Existence of Ethnic Voting from Cross-Country Studies
One source of such evidence is cross-country quantitative work studying the determinants of
candidate or party numbers. Of specific interest amongst such studies is work which has
sought to establish whether ethnic heterogeneity is associated with higher numbers of
candidates or parties. Such evidence, inferring as it does from one level of analysis (the
country) to the behaviour of actors at another level (voters) is imperfect, for reasons I
discussed in Chapter 2. Nevertheless, it is a useful start. If I was to survey a body of studies and
repeatedly encounter results suggesting a relationship between ethnic diversity and high
numbers of candidates, this would be suggestive at least of voters tending to vote for co-
ethnics.
And, indeed, the finding that ethnic diversity is associated with higher numbers of candidates
or parties is common across much of the literature. Almost all recent studies find this, although
there is disagreement in one area of interest. This occurs between studies which find ethnic
diversity is only associated with high numbers of parties or candidates in electoral systems
with higher district magnitudes80 (for example: Ordeshook and Shvetsova 1994; Cox 1997;
Neto and Cox 1997; Taagepera 1999; Singer and Stephenson 2009) and studies which find
ethnic diversity associated with more parties or candidates regardless of electoral system (for
example, Reilly 2006; Dickson and Scheve 2010; Singer 2012).81 Clearly, as Solomon Islands’
single member district plurality electoral system is of low district magnitude, the Solomons
case fits more comfortably with the latter group of studies. The most important point to note,
however, is that both groups of studies have findings suggestive of the presence of ethnic
voting, at least in certain electoral environments.
80
The term district magnitude refers to the number of candidates elected from each electoral district. Single Member District Plurality electoral systems have very low district magnitudes. Proportional representation type systems as well as some preferential voting systems have higher district magnitudes. 81
In some instances these studies only find ethnic diversity having an impact regardless of electoral systems when ethnic diversity is very high.

110
Direct Empirical Study
The suggestive findings of these cross-country studies can be considerably enhanced by
looking at within-country evidence which tries to obtain information on the presence of ethnic
voting through more direct means.
Much of the work of this nature has been undertaken in Africa, although detailed studies from
other parts of the world are also starting to emerge (for example, Chandra 2004; Reilly 2004;
Kristín Birnir 2007; Padro i Miquel and Yao 2012). Methodologically, most of the studies tend
to draw either on survey data (for example asking people why they voted for the candidate
they voted for, or asking them who they propose to vote for in the next election and
subsequently comparing the candidate’s ethnicity with the voter’s) or on election data (for
example comparing the proportion of a constituency’s population that are of a particular
ethnic group, with that vote share of the party thought to represent that group in this
constituency.) As discussed in Chapter 2 neither approach is free of shortcomings.
Respondents may not always reply accurately to survey questions, particularly those probing
sensitive topics (Carlson 2011; Gonzalez-Ocantos et al. 2012; Lieberman and Singh 2012). And
comparisons based on aggregate data such as number of votes cast for a certain candidate and
number of speakers of a certain language in a constituency may not always yield correct
inferences of individual behaviour (Chandra 2004). However, as best they are able, researchers
have attempted to overcome these issues, and their results accumulate into a rich body of
literature.
Although there is still disagreement (contrast, for example, Fridy (2007), and Lindberg and
Morrison (2008), both writing about Ghana), the evidence emerging from most recent work
suggests people do vote ethnically in the countries studied, but not inevitably. Whether people
vote ethnically appears to be dependent on a range of factors, the first being the individual
voter, with some voters voting along ethnic lines and others not (Bratton and Kimenyi 2008). It
also appears to depend on the circumstances voters find themselves in, with voters more
willing to vote across ethnic lines when living in areas dominated by other ethnic groups
(Ichino and Nathan 2013). Ethnic voting appears in instances to also depend on quality of
governance with at least some voters’ willingness to vote across ethnic lines dependent on
perceptions of how well the current ruling party is or is not performing (Posner and Simon
2002; Bossuroy 2007; Bratton et al. 2011). It also appears to depend on location, with some
areas being home to more ethnic voting than others (Norris and Mattes 2003). And this in turn
depends at least in part on the ethnic make-up of electorates, with ethnic competition more
likely to occur in areas where it makes electoral sense in terms of the size of competing groups

111
(Norris and Mattes 2003; Chandra 2004; Posner 2004), or where ethnic groups are clustered
together geographically rather than dispersed across electorates (Mozaffar et al. 2003).
To be clear, despite these qualifications, most of these studies, much like the work I detailed in
the previous chapter, find some evidence of ethnic voting. But at the same time, almost all of
them find evidence of other factors influencing the choices many voters make. Ethnic voting
appears to be present in a considerable range of countries, but in most cases it also appears to
be contingent.
Why do Voters Vote for Co-ethnics?
In addition to offering evidence of the existence of ethnic voting (albeit contingent ethnic
voting) both theoretical and empirical work from other countries also offers insights related to
a key question of my own study: when people vote for co-ethnics, why do they vote for them?
Rational Voters or Irrational Voters?
Amidst work in political science which seeks to answer this question there is a clear divide, one
which in a sense parallels the divide in explanations of clientelism in Solomon Islands and
Papua New Guinea, which I discussed in the previous chapter. Here, the divide lies between
those who believe ethnic electoral politics (and collective action more generally) is primarily
the product of the rational choices of individuals and those who believe it is primarily a
product of instinctive or irrational impulses driving individuals (Bates 1983; Fearon and Laitin
1996; Chandra 2004).82 In the case of voting, a proponent of rational choice type arguments
might argue voters tend to vote for co-ethnics because they know that should a co-ethnic be
elected, they (the voter) will be more likely to receive material assistance from that person
than they would be from someone from another ethnic group (Chandra 2004; Posner 2005) or
that there is some other aspect of shared ethnic identity which makes it advantageous for
reasoning actors to work along ethnic lines. On the other hand, a proponent of an instinct or
impulse view of voting might argue voters vote for co-ethnics because of non-reasoned
emotive ties, a view sometimes (for example, Chandra 2004, p. 223) attributed to Horowitz
(1985). Carlson (2011, p. 3) describes this form of explanation of voting as, “the longest-
standing hypotheses on ethnic voting”, under which voters are thought to, “prefer coethnics
out of ethnic pride, or for what Chandra [2004] calls the “psychic benefits” of having someone
like them in office.”
82
Rational ethnic collective action (including voting in some instances) is often referred to as instrumentalist/instrumentalism. While irrational attachments and actions are often referred to as primordialist. To avoid confusion with my use of the term ‘primordialism’ later in this chapter, and to remain consistent with my use of the term ‘rational choice’ from Chapter 5 I avoid these labels here.

112
Ferree (2006, p. 804) explains this approach as functioning in the following way:
Voters derive psychic benefits from supporting ethnic parties because the very act of casting a vote for an ethnic party is an affirmation of identity. Thus, voting is not an act of choice, based on a rational weighing of alternatives, but an expression of allegiance to a group. Voters do not use their vote to further self-interest. Indeed, they may actually vote in ways that work against their interests.
A good example of this kind of explanation can be found in Ketan’s (2004) work on Papua New
Guinea in which he contends (pp. 17-18):
A fundamental reason for such competition lies in the Hagen conviction that a person’s local group’s ‘name must not go down’....as expressed through localized support for politicians even after they may have been dismissed from office or jailed for misconduct. It is mainly because of the particular concept of ‘the name’ and pride in [the] group’s reputation that many corrupt and incompetent politicians are re-elected, that massive resources are gambled (and lost) in elections, and that violence is regularly preferred over more peaceful avenues for resolving conflict...Most members of a group tend to agree that their clan or tribal ‘name’ is far more important than themselves, even where prominent individuals clearly stand to benefit personally from making such commitment.
Similar explanations of voter behaviour can also be found in other work on Papua New Guinea
such as that of Orlegge (1997).
As with a number of other intellectual divides, few on either side of the rational versus
irrational ethnic voting fault line would claim that their view explains the actions of all voters
all the time. Bates (1983, p. 166), for example, one of the earliest and most persuasive
advocates of rational choice explanations for ethnic collective action, concedes that:
It is important to realize that both principles are at work. And it may well be the case that while instrumentalist [reasoned] behavior is important in explaining the formation of ethnic groups, consummatory [non-reasoned] behavior is important in explaining their persistence.
Similarly, my reading of Horowitz (1985) is not that he is arguing voting is never rational. And
alongside irrational explanations such as that shown above, Ketan (2004) also offers
explanations elsewhere in his book which appear rational choice in a sense. The difference
between the camps is one of respective importance: rational choice theorists believe that
ethnic voting is rational most of the time, while those who theorise irrational motivations hold
them to predominate.
Why Might it be Rational to Expect a Co-Ethnic to Help?
Theories of irrational voting are easily enough explained through group-based pride — the
emotional benefit one gets from seeing a co-ethnic elected (or from simply knowing you acted

113
to support them) overriding any material calculation — or possibly an irrational fear of other
groups and their candidates. Rational choice explanations require additional explanation,
however. What leads to rational actors preferring to vote for someone from their ethnic
group?
Amongst those who posit rational choice type explanations of ethnic voting much recent work
has tended to explain the phenomenon through theories of ethnic patronage which see voters
voting for co-ethnics because they believe them more likely than other groups to deliver
private goods or localised public goods should they win election (Fearon 1999; Chandra 2004;
Posner 2005). The logic here is that, in polities where patronage and clientelism dominate,
politicians tend away from providing public goods and developing policy that might help all
members of society (Stokes 2009). And in these circumstances voters are left to try and
determine which political actors are likely to help them directly should they win. In turn,
politicians in power need to ascertain who their likely electoral supporters are in order to
reward their support with largess (Chandra 2004). There are a number of, sometimes closely
related, mechanisms, which could serve to link ethnic voting and patronage politics.
Voters might believe co-ethnics are more likely to help should they attain power simply
because most of the social assistance they have received outside of elections comes from co-
ethnics (Carlson 2011). There is good evidence from ethnically divided societies showing
cooperation and assistance being more frequent within ethnic groups than across them
(Habyarimana et al. 2009), and it would be reasonable to expect voters to assume the same
types of people to have helped them in other aspects of life will also assist politically.
Another explanation is that ethnicity matters indirectly (rather than directly through voter
calculation) through the fact that ethnic groups contain within them denser associational
networks (families, extended families, neighbours, people habituated to cooperation) than
exist across ethnic groups. Rather than ethnic identity per se it is these networks that are
crucial in clientelist politics, linking clients and patrons, nurturing expectations of assistance,
and enabling electoral cooperation and in instances coercion (Keefer 2010).
A third explanation, also indirect, is that cooperation (including electoral cooperation) is easier
within ethnic groups because such groups often share means of communication (language)
and culture, and that such shared traits make effective electoral collective action easier —
something that indirectly leads to ethnic voting (for a brief explanation in the context of
electoral politics see, Reilly 2006, p. 49; for an in-depth explanation in a non-electoral context
see, Habyarimana et al. 2009).

114
The three explanations above can all be found in papers and books on electoral politics;
however, they tend to be advanced in passing — covered only briefly. Much more fully
theorised is Kanchan Chandra’s (2004) explanation of ethnic voting based on the visibility of
ethnic traits. Chandra argues ethnic parties succeed because the visibility of ethnic traits, by
allowing voters to quickly determine the ethnic makeup of political parties, makes it easy, in an
environment of patronage voting, for voters to identify parties that are most likely to assist
them. Likewise, sticky and visible ethnic traits make it easy for politicians to identify those
likely to have supported them at the ballot box and so can more effectively target patronage
goods to supporters. Taken together these tendencies are self-reinforcing and provide reason
for political actors to assist co-ethnics and for voters to assume they are most likely to be
assisted by political actors from their ethnic group, and to easily identify those parties most
strongly associated with their group.
Daniel Posner (2005) offers a similar explanation. In it, once again in a clientelist polity, ethnic
identities are more reliable guides than other sources of information (promises, policy
platforms) with respect to candidates’ or parties’ propensity to dispense largess. However, in
Posner’s case, rather than visibility, it is social salience that makes ethnic identity so — it is
because ethnic identities have been rendered salient elsewhere in people’s lives by historical
processes that they are useful tools in anticipating the propensity to deliver goods if elected.
Once again, in the political arena, the process is self-perpetuating: voters who expect
ethnically targeted patronage will prompt politicians to privilege co-ethnics, and politicians
who do so will bolster voters’ expectations of future ethnic patronage.
Are Ethnic Identities Fixed or Fluid?
Having covered the prevalence of ethnic voting and also different explanations of why people
vote for co-ethnics I now need to turn my attention to another aspect of ethnic identity
relevant to my study of voting in Solomon Islands. This is to do with the number of ethnic
identities people possess and also with the malleability of ethnic identities, in particular if they
are permanent or close to permanent, or fluid and liable to change over relatively short
timeframes. Here relevant work can be grouped into two camps: primordialists and
constructivists (Chandra 2001; Chandra 2012).83 The distinction is important because it has
ramifications for the types of election results patterns we should expect to see in Solomon
83
In using these two terms I am borrowing from Chandra (2001, 2012). The meanings of the two terms vary with their usage across different areas of study. However, as I am studying electoral politics and voter behaviour, and as Chandra has undertaken some of the most comprehensive work in this area, I follow her usage.

115
Islands (and in the following chapter I draw upon election results as a means of inferring
information about voter choices).
Fixed Identities – Primordialists
So-called Primordialists argue ethnic identities are singular and fixed, or something which
evolves only very slowly (Chandra 2001). Drawing upon the work of Geertz (1973), Chandra
(2001, p. 7-8) argues that the primordialist approach is typified by:
[T]wo defining propositions…1) individuals have a single ethnic identity and 2) this identity is fixed in the present and future. The initial origins of this “fixed” identity are uncertain. For some primordialists, it is biologically determined. Others allow that it may initially have been constructed through human intervention. For Geertz, today’s “given” identity may have been “assumed” at some point in the past. For others, it may be the result of “ancient hatreds” born of conflicts centuries ago. The key distinguishing aspect of the primordialist view is that an individual’s ethnic identity becomes immutable once acquired, no matter where it comes from. The implication is that the ethnic groups to which individuals belong, and the ethnic demography made up by some collection of ethnic groups, can be unambiguously identified and taken as fixed in the long term.
Although it is often assumed in popular writing, relatively few contemporary scholars explicitly
advance or defend primordialist approaches (Chandra 2012). However, qualified examples can
be found in the work of Horowitz (1985) and more explicitly in Van Evra (2001). Moreover,
something akin to primordialism is often effectively assumed in cross-country statistical work
on the relationship between ethnicity and electoral outcomes (Chandra 2001), including much
of the work on candidate numbers I cited above, as well as in econometric work relating ethnic
diversity to development outcomes (for example, Easterly and Levine 1997; Alesina et al.
1999).
Fluid and Multiple Identities – Constructivists
A Range of Identities
In contrast to primordialists, constructivists argue that ethnic identities are, to varying degrees,
fluid, often multiple, and prone to being manipulated into prominence by political actors or
elevated by circumstance or history (Chandra 2012).
This may appear to be at odds with my earlier discussion, drawn in part from the work of
Chandra (herself a constructivist), in which I suggested the traits that give birth to ethnic
identities had to be ‘sticky’ — traits that we cannot adopt or discard at will. However,
constructivists base arguments for the relative fluidity of ethnic identity not on the fluidity of
the traits involved themselves, but on the fact we all possess a number of traits which could
contribute to us adopting, or being viewed through the lens of, various ethnic identities.

116
Fluidity comes because, at any given point of time, only a subset of these traits are drawn
upon in the construction of ethnic identities. Fluidity also stems from the fact that in different
circumstances the same traits may lead to the ascription of different ethnic identities (Chandra
2012). For example, in New Zealand my skin colour, accent and general appearance mark me
as Pakeha (of European descent). But living in Australia they place me in the category of ‘New
Zealander’. And were I with an Australian in rural Malaita we would probably find both of
ourselves called Arakwao (white foreigners). To give another example, third generation
immigrants to Australia from Vietnam might consider themselves Australian and may be
considered Australians by their neighbours for many years, until an aspiring politician focuses
on their difference and subsequently causes them to be viewed as immigrants or Vietnamese.
A closely related form of constructivism, explicitly associated with electoral politics, and
reflected in my definition of ethnic identity above, is advanced by Posner (2005) who argues
traits (to continue using Chandra’s terms) are accumulated into what he calls ‘identity options’
through long-run political and sociological processes, and that most people possess a suit of
identity options, all potentially able to be drawn upon in activities such as electoral politics.84
For example, in Zambia where Posner’s work was based, tribe and language group are two
different identity options that almost all Zambians possess (more than one tribe shares the
same language). Posner contends tribe and language arose as primary identity options, in part,
through the history of British colonial occupation of Zambia; as a colonial power the British
used both identities as tools of governance, and as a consequence both became important
social features. As a result, in modern Zambia political actors have these two identity options
to choose from when engaging in electoral politics (Posner 2005).
Fluid identities and Electoral Politics
Construction from sticky traits and social salience (often born of history) both offer good (and
not mutually exclusive) explanations of the existence of certain ethnic identities as potential
options around which ethnic politics might be structured. What remains to be explained is why
certain identities rise to the fore from amongst the options in any given instance of electoral
politics. Both Posner (2004; 2005; 2007) and Chandra (2004) examine this theoretically and
empirically offering similar explanations.
Both authors link ethnic voting to patronage-type politics: voters voting for parties they
associate with co-ethnics, or for co-ethnic candidates, because they believe them more likely
84
In this book (Posner 2005) Posner links his work both to instrumentalism and constructivism. He places himself as an instrumentalist in that he believes ethnic identities are used in politics (more or less) rationally as means to ends. He places himself as a constructivist (see for example p. 11) in that he holds, like Chandra, that ethnic identities are fluid and multiple.

117
to provide them with particularistic assistance should they acquire political power. And while
the two authors offer slightly different explanations of how certain ethnic identities become
available options for ethnic competition, both are in broad agreement on the mechanism that
sees certain ethnic identities become important in specific electoral contests: arithmetic.
Co-ethnics may be more likely to dispense largess, yet they can only do this if they actually
attain the political power necessary to get access to state resources. And whether they can do
this or not hinges, in both Chandra and Posner’s work, on the size of the ethnic groups
afforded by different ethnic identities.
Because Chandra’s work focuses on state governments in India, where power is afforded not
just by winning a majority in parliament but also by being a large enough minority in
parliament to have negotiating leverage, the right sized ethnic group for electoral competition
is — in her analysis — any group larger than the gap between the first and second place
parties in an electorate (‘larger’ also includes groups large enough to win on their own). When
this occurs the probability of the ethnic group in question becoming politically salient is,
Chandra shows, significantly increased.85
Posner’s work is similar except that, reflecting the stakes in elections in Zambia, his electoral
competitions are all or nothing: an ethnic group has to be large enough to win the election
before political actors will try and use the related ethnic identity electorally. Posner’s work also
differs from Chandra’s in that, because the central focus of her study is on a group which is a
minority, the main issue of size is whether it is large enough to have leverage. Posner’s work,
on the other hand, also deals with the possibility that a group may be too large: if everyone in
the electorate is from the same language group it makes no sense for language to become the
ethnic identity structuring ethnic politics (assuming in this example the objective is simply to
win the electorate, rather than to win many electorates nation-wide). Better, Posner contends,
if an alternate identity is available which affords a smaller group which is still large enough to
defeat any alternative group, to try an activate this alternate identity. Small, yet still big
enough to win, is optimal in Posner’s model because it involves distributing patronage spoils
amongst fewer people.
Following this logic, if an electorate was divided such that it had two languages and two church
groups, and if the language groups were very unevenly balanced in size (90 per cent and 10 per
cent of the population) while the churches were evenly matched (approximately 50 per cent of
85
Chandra’s discussion goes beyond this offering detailed explanation on how voters assess the ‘head-count’ of co-ethnics in prominent positions in a party, and how parties afford the opportunity to different ethnic groups to rise within their ranks. However, as in the Solomons case it is candidates not parties that is the central foci of electoral competition I do not cover this material here.
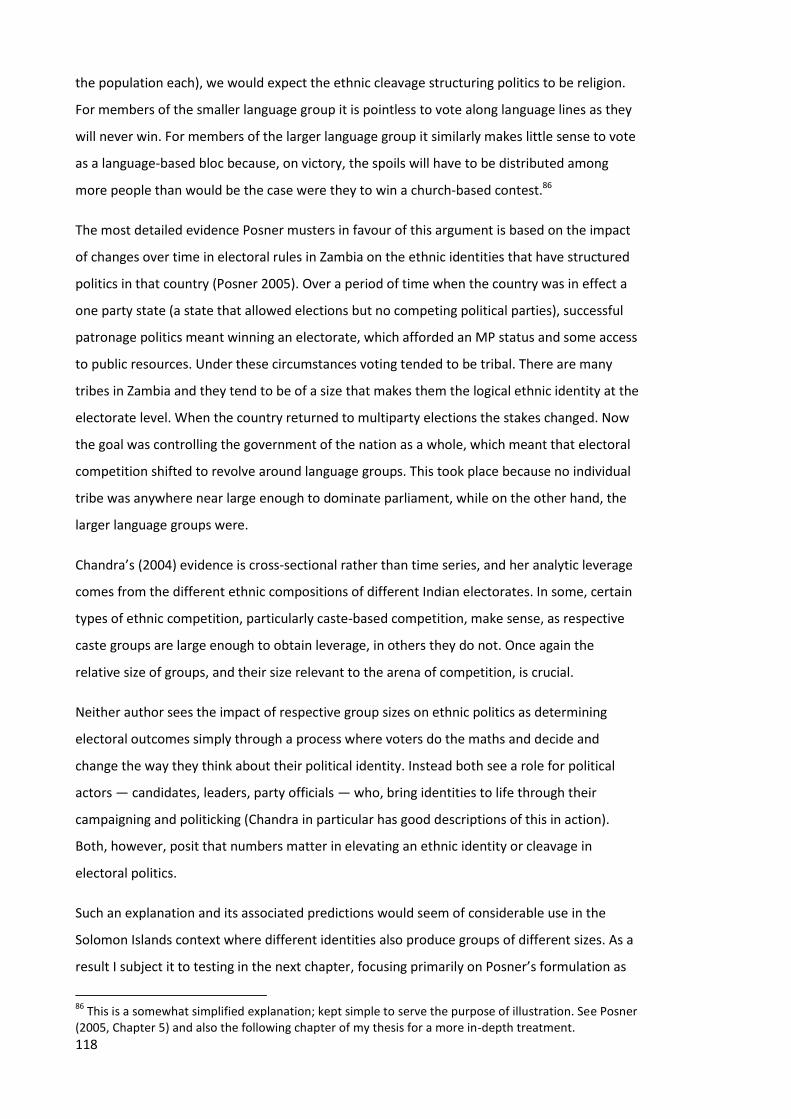
118
the population each), we would expect the ethnic cleavage structuring politics to be religion.
For members of the smaller language group it is pointless to vote along language lines as they
will never win. For members of the larger language group it similarly makes little sense to vote
as a language-based bloc because, on victory, the spoils will have to be distributed among
more people than would be the case were they to win a church-based contest.86
The most detailed evidence Posner musters in favour of this argument is based on the impact
of changes over time in electoral rules in Zambia on the ethnic identities that have structured
politics in that country (Posner 2005). Over a period of time when the country was in effect a
one party state (a state that allowed elections but no competing political parties), successful
patronage politics meant winning an electorate, which afforded an MP status and some access
to public resources. Under these circumstances voting tended to be tribal. There are many
tribes in Zambia and they tend to be of a size that makes them the logical ethnic identity at the
electorate level. When the country returned to multiparty elections the stakes changed. Now
the goal was controlling the government of the nation as a whole, which meant that electoral
competition shifted to revolve around language groups. This took place because no individual
tribe was anywhere near large enough to dominate parliament, while on the other hand, the
larger language groups were.
Chandra’s (2004) evidence is cross-sectional rather than time series, and her analytic leverage
comes from the different ethnic compositions of different Indian electorates. In some, certain
types of ethnic competition, particularly caste-based competition, make sense, as respective
caste groups are large enough to obtain leverage, in others they do not. Once again the
relative size of groups, and their size relevant to the arena of competition, is crucial.
Neither author sees the impact of respective group sizes on ethnic politics as determining
electoral outcomes simply through a process where voters do the maths and decide and
change the way they think about their political identity. Instead both see a role for political
actors — candidates, leaders, party officials — who, bring identities to life through their
campaigning and politicking (Chandra in particular has good descriptions of this in action).
Both, however, posit that numbers matter in elevating an ethnic identity or cleavage in
electoral politics.
Such an explanation and its associated predictions would seem of considerable use in the
Solomon Islands context where different identities also produce groups of different sizes. As a
result I subject it to testing in the next chapter, focusing primarily on Posner’s formulation as
86
This is a somewhat simplified explanation; kept simple to serve the purpose of illustration. See Posner (2005, Chapter 5) and also the following chapter of my thesis for a more in-depth treatment.

119
the electoral contests of most interest to me are winner take all, rendering Chandra’s leverage
calculations inapplicable for the most part (although I do touch on them in a brief analysis of
ethnicity at the national level).
The Relationship Between Different Theories of Ethnic Collective
Action
In the preceding pages I have described two ‘fault lines’ which cut across theorising on
ethnicity and electoral politics. The first of these was the divide between those who posit
ethnicity impacting on electoral choices through reasoned, calculating processes and those
who view it as having an impact based on emotion or other non-reasoned psychology. The
second divide was between primordialists who argued ethnic identities were singular and fixed
(or only changing over the long-run) and constructivists who argued they tended to be multiple
and prone to short-term fluidity (in the sense that different identities can gain or lose electoral
importance over relatively short timeframes). These divisions are related yet they are not one
and the same.87 Theoretically, at least, it would be possible to be a rational choice primordialist
(this, I would argue, is effectively the position of Alesina et al. 1999), and Chandra (2012) is an
example of a constructivist who allows that voter behaviour is, in some instances, not driven
by reasoned choice.
However, in recent work in the political science of electoral politics at least, primordialism
tends to be coupled with beliefs around irrationally-held identity and most contemporary
constructivists see a significant role for reasoned evaluation. In particular the size-driven
constructivism of Chandra and Posner, requiring as it does calculations of different group sizes,
has a strong element of reasoned choice to it, as suggested by the word ‘calculation’.
Table 6.1 below is a typology of the different approaches I have described here — rational
versus irrational on one axis; and primordial verses constructivist on the other and the models
of electoral politics that they posit. Reflecting the fact that they are uncommon combinations
the top right and bottom left cells of the table are shaded light grey.
In my analysis in the rest of this thesis, reflecting the tendency for primordialism to be coupled
with non-reasoned choices, and reflecting the tendency for constructivism to come coupled
with explanations of voter choices that focus on reasoned behaviour, I focus primarily on these
couplings (in particular I use them to configure my next chapter). However, to the extent data
87
Confusingly, amongst different authors terms such as ‘primordial’ are used to describe different schools of thought across both divisions (primordialism sometimes referring to those who think ethnicity is non reasoned and sometimes to those who think ethnic identities are singular and fixed).
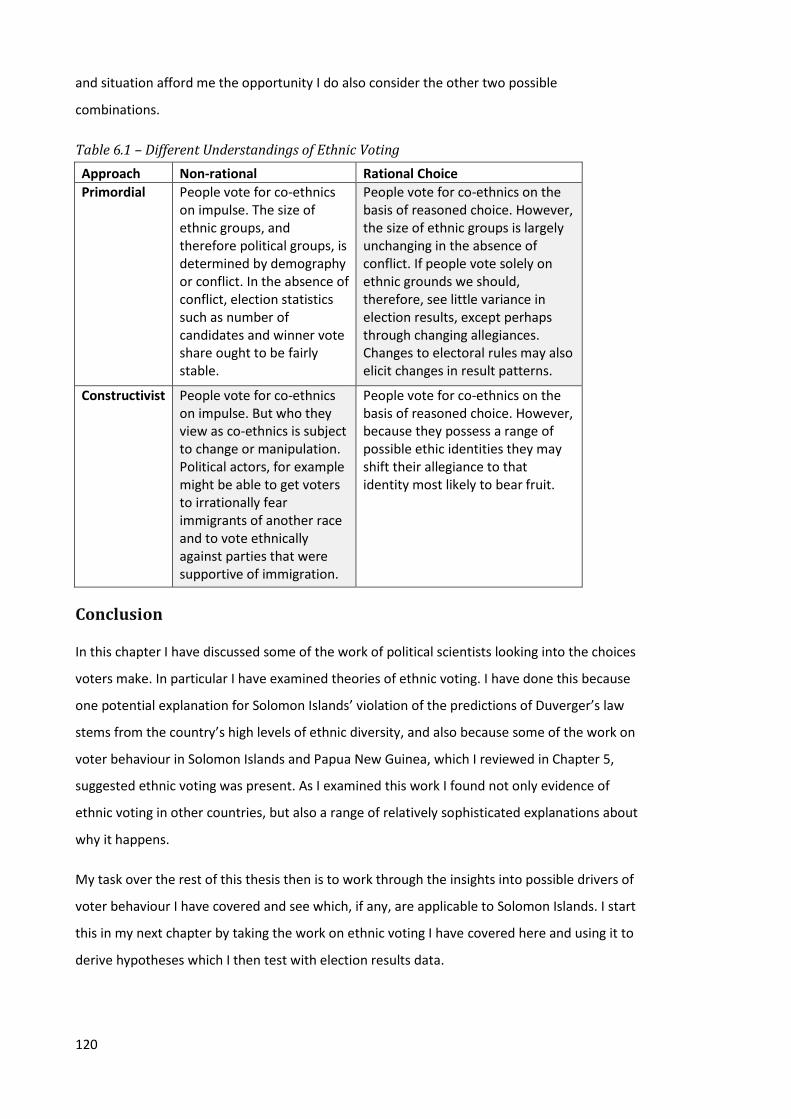
120
and situation afford me the opportunity I do also consider the other two possible
combinations.
Table 6.1 – Different Understandings of Ethnic Voting
Approach Non-rational Rational Choice
Primordial People vote for co-ethnics on impulse. The size of ethnic groups, and therefore political groups, is determined by demography or conflict. In the absence of conflict, election statistics such as number of candidates and winner vote share ought to be fairly stable.
People vote for co-ethnics on the basis of reasoned choice. However, the size of ethnic groups is largely unchanging in the absence of conflict. If people vote solely on ethnic grounds we should, therefore, see little variance in election results, except perhaps through changing allegiances. Changes to electoral rules may also elicit changes in result patterns.
Constructivist People vote for co-ethnics on impulse. But who they view as co-ethnics is subject to change or manipulation. Political actors, for example might be able to get voters to irrationally fear immigrants of another race and to vote ethnically against parties that were supportive of immigration.
People vote for co-ethnics on the basis of reasoned choice. However, because they possess a range of possible ethic identities they may shift their allegiance to that identity most likely to bear fruit.
Conclusion
In this chapter I have discussed some of the work of political scientists looking into the choices
voters make. In particular I have examined theories of ethnic voting. I have done this because
one potential explanation for Solomon Islands’ violation of the predictions of Duverger’s law
stems from the country’s high levels of ethnic diversity, and also because some of the work on
voter behaviour in Solomon Islands and Papua New Guinea, which I reviewed in Chapter 5,
suggested ethnic voting was present. As I examined this work I found not only evidence of
ethnic voting in other countries, but also a range of relatively sophisticated explanations about
why it happens.
My task over the rest of this thesis then is to work through the insights into possible drivers of
voter behaviour I have covered and see which, if any, are applicable to Solomon Islands. I start
this in my next chapter by taking the work on ethnic voting I have covered here and using it to
derive hypotheses which I then test with election results data.

121
Chapter 7 – Theories of Ethnic Voting and Election Results in
Solomon Islands
In the latter part of the previous chapter I identified two broad groupings of thought regarding
ethnic voting. In one, ethnic identities were single, fixed (or changed so slowly as to be as good
as fixed for electoral analysis) and typically thought of as being the product of irrational
sentiment. In the other, ethnic identities were multiple, fluid and generally thought to have
their strongest political impacts through the actions of approximately rational decision
makers.88
Both groupings offer plausible explanations of how ethnic diversity might contribute to the
political fragmentation seen in Solomon Islands. Both also come coupled with a range of
predictions for the form election results patterns ought to take in Solomon Islands. In this
chapter I describe these predictions before putting them to the test. I will show that the
predictions of neither approach fit well with the Solomons data. A fact that leads to the theory
generating inquiry I undertake in Chapters 8 and 9.
Singular Fixed Identities and Non-Rational Behaviour
At first glance — given the ethnic diversity of Solomon Islands and the high level of political
fragmentation that persists in the country, resistant of the pull towards political consolidation
anticipated from a single member district plurality voting system — explanations of voter
behaviour that posit single, fixed ethnic identities driven by non-rational psychological
processes, appear very plausible. Given Solomon Islands’ high levels of ethnic diversity, single
ethnic identities, particularly if based on language group or clans, which are numerous, would
be commensurate with high candidate numbers. Moreover, predictions of political
consolidation under Duverger’s Law hinge, amongst other assumptions, on voters rationally
foregoing ideal candidates who have no chance of winning and voting instead for candidates
they prefer somewhat, who actually have a reasonable chance of victory. And if voters’
motivations are, first and foremost, driven by something akin to ethnic pride (or the strong
dislike of other ethnic groups) ethnic voting of this sort would provide a clear counter to
88
To reiterate the point made in the previous chapter these pairs are not inevitable: one could hold that ethnic identities are singular, fixed and determinant of politics through reasoned actions associated with their presence. Similarly, one could argue that the impact of ethnicity on voter behaviour occurs through non-reasoned thought and action, but that, at the same time, ethnic identities are fluid. Yet, in contemporary work on political science such combinations of approaches are quite rare. For this reason, I focus more heavily here on the two more-common combinations. However, in this chapter and at the end of Chapter 8, I also discuss how the two less-common combinations also fail to fit the Solomon Islands context.

122
political consolidation. If all other groups are disliked or at least a source of indifference, none
will fill the role of second best, and the voter will have no cause to vote outside of their group.
Indeed, some authors have written on voter behaviour in Solomon Islands and parts of
neighbouring Papua New Guinea in a way that suggests sentiments of this sort may be
present. Recall, for example, in the last chapter I cited Ketan (2004, p. 18) stating that:
Most members of a group tend to agree that their clan or tribal ‘name’ is far more important than themselves, even where prominent individuals clearly stand to benefit personally from making such commitment.
However, systematic analysis of Solomon Islands election results produces evidence at odds
with what we would expect on the basis of models of fixed ethnic identity and irrational
decision making.
If ethnic groups are fairly stable in size, if ethnic identity is fixed, and if voters’ loyalties are
based on unreasoned impulses such as ethnic pride then, in addition to bringing high numbers
of candidates, ethnic diversity ought also to be coupled with a degree of stability in key
features of election results, such as the number of candidates, the effective number of
candidates and winning candidate vote share. Some small degree of change might be
expected, as little in electoral politics is ever perfectly determined, and systematic change in
the nature of the electorate, such as population change if it came with changes in the size or
number of ethnic groups, could lead to shifts in election results. But, once such demographic
changes have been controlled for, if ethnic identities are singular, if they are fixed, if people’s
attachment to them is instinctive rather than calculated, and if the effect is significant enough
to overcome the pull of electoral consolidation, then stability of electoral features ought to be
expected. In the words of one theorist, “absent some dramatic change in group
demography…the result of the election is likely to hold for the next election and for every
election thereafter” (Horowitz 1985, cited in Chandra 2004, p. 287).
Yet readers who casts their minds back to Chapter 4 and Figures 4.9 and 4.10 will recall
election results in Solomon Islands are anything but stable. Figure 4.10 is replicated below as
Figure 7.1. The X axis shows the effective number of candidates (ENC) for 1997, the Y Axis
shows it for 2010. The dashed grey plots a one-to-one relationship. An Ordinary Least Squares
(OLS) line of best fit has also been added in red.
If the ENC of constituencies is the same or has changed little between the two elections we
should expect to see the points on the chart, representing each individual constituency,
clustered closely around the dashed one-to-one line.

123
Figure 7.1 – Effective Number of Candidates 1997 and 2010, all Electorates
Chart notes: constituency codes can be found in Appendix 3.
As is clear from the chart there is a relationship: electorates that had higher ENCs in 1997 tend
to have higher ENCs in 2010. But at the same time the relationship is weak — there is a lot of
variation around both the line plotting a one-to-one relationship and the OLS line of best fit.
Effective numbers of candidates, as well as winning candidate vote share (shown in Figure 4.9,
in Chapter 4) have all changed considerably over the space of just four elections. So much
change, over such a short period of time, is very hard to explain on the basis of ethnic voting
hinging on stable, singular ethnic identities.89
To formally test the plausibility of explanations of electoral diversity in Solomon Islands based
on single, fixed ethnic identities I undertook regression analysis comparing the 1997 and 2010
elections,90 investigating change in three different election statistics: the number of candidates
in each constituency; the effective number of candidates in each constituency; and winner
vote share. In each case, the independent, variable is the statistic in question from the 1997
89
One plausible explanation which has been suggested to me is that fluctuation could have been caused by dramatically fluctuating voter turnout, coupled with those people who did vote voting for co-ethnics in a stable manner. However, there is no evidence of turnout fluctuations of the sort necessary to produce the results I show here. Rather, as Figure 4.1 suggests, turnout appears reasonably stable. 90
This pair of elections is chosen because redistricting occurred prior to the 1997 and 1993 elections, which led to marked changes in the size of some electorates, something that significantly complicates comparisons between contemporary elections and those prior to 1997.

124
election and the dependent variable is the same statistic from the 2010 election. The units of
analysis are electorates. The logic of the test is that if voting was ethnic in the sense identified
above key features of election results will remain stable at least to some degree, and therefore
results statistics from 1997 ought to be strongly correlated with their corresponding statistic
from 2010.
However, plausibly, theories of ethnic voting that posit irrational action and single, fixed
identities could still fit with variation in election results if variation was born of changes in
population or in the ethnic make-up of constituencies. To account for this I have included the
following control variables in the regressions: change in population between the estimated
1997 population of the electorate and the estimated 2009 population of the electorate;91 and
change in the effective number of churches.92 These control variables are not completely
adequate. Ideally I would also control for changes in language share, but these data were not
collected in the 2009 census, and also for changes in clan composition, yet data of this sort
have never been collected. However, the control variables I am able to include are, I would
contend, sufficient on their own to at least rule out large demographic shifts as the source of
variation in results. What is more, in my review of anthropological work on clans and language
groups in Solomon Islands (the review which contributed to Chapter 3) I encountered nothing
in the literature to suggest clan or language composition of electorates changes significantly
over timeframes as short as 13 years.
The results of my regression analysis are presented below in Table 7.1. For each of the
independent variables of interest the regression contains a column showing the results of a
simple bivariate regression and a column showing the results from a regression with the
control variables included. The first row of the first column lists the independent variable, from
1997, in each of the three tests. Subsequent rows list the control variables (where included),
the adjusted R-squared and the number of observations.
91
For the 2010 election the estimated voting age population was calculated by extrapolating forwards from 2009 census data. For the 1997 election the estimated voting age population was calculated by extrapolating forwards from 1986 census, this census being preferable owing to civil conflict related disruptions that affected the 1999 census in some areas. 92
Effective number of churches being the reciprocal of the Herfindahl–Hirschman index of church population shares in an electorate, calculated as 1 divided by the sum of all the churches’ squared percentage shares of the electorate’s population. This is the equivalent calculation to that performed to derive the effective number of candidates from candidate vote share data. In calculating this figure I was hampered by a larger number of churches being grouped in the ‘other’ category in original 2009 census data than was the case in 1999. To overcome this I grouped the same churches together under ‘other’ in my 1999 data as well, to allow me to compare like with like. I also tested the impact this had on the effective number of church scores for each electorate in 1999. In practice, because the churches grouped in the ‘other’ category were almost always small there were only very minor differences in the calculated figures.

125
Table 7.1 – Regression Results: 1997 Electoral Statistics Versus 2010 Electoral Statistics
Candidates
2010 Candidates
2010 ENC 2010 ENC 2010
Winner Vote Share
2010
Winner Vote Share
2010
1997 (Cand/ENC/WVS)
0.437** 0.435** 0.343** 0.355** 0.156 0.158 (0.165) (0.175) (0.132) (0.140) (0.125) (0.133)
Church -2.446 -1.101 0.040 (2.269) (1.279) (0.084)
Population 0.000 0.000 0.000 (0.000) (0.000) (0.000)
Constant 6.883***
(1.330) 3.130***
(0.766) 0.322***
(0.069)
Adjusted R2 0.110 0.110 0.104 0.087 0.011 -0.025
n 50 50 50 50 50 50
Standard errors in parentheses; ***significant at the 1% level; ** significant at 5% level; * significant at 10% level.
In the case of candidate numbers and the effective number of candidates, there is a
statistically significant relationship between the 1997 figure and the 2010 figure. That is, there
is some association between the number of candidates and ENC in individual electorates
between 1997 and 2010. However it is weak, and adding demographic controls does not
change this. Additionally, the adjusted R-squared values for all the regression equations are
low. Were candidate numbers or effective numbers of candidates similar between the two
elections, or if any variation which occurred could be explained by changes in electorates’
ethnic makeup, we would expect the adjusted R-squared values to be much closer to one than
they actually are.93
To be clear, my purpose in reporting these findings is not to suggest there is no explanation for
the variation in election results statistics. Quite possibly other regression equations that
included other explanatory variables would reveal more information about the determinants
of election outcomes. Likewise, I am not asserting that ethnic identity has no role to play in the
choices that voters make when they vote in Solomon Islands. Rather, by highlighting the
scatter plots I presented in Chapter 4, I have pointed to evidence which suggests that one
particular explanation of ethnic voting — that involving single, fixed identities, which influence
voter choice through non-reasoned thinking — is at odds with variation in election outcomes
and for this reason does not fit the Solomon Islands case. The regressions I have shown above
were undertaken to eliminate the possibility that the single, fixed identity explanation was
correct and that the observed variability of results was simply the product of population
change or changes in the ethnic makeup of Solomon Islands constituencies. Their results
suggest it was not.
93
Another simple means of testing whether demographic changes are driving changes in electoral statistics is to run three regressions with change in the three respective electoral statistics as the dependent variable, and change in church composition and population as the independent variables. When I ran these regressions changes in church and population were not statistically significant predictors of changes in any of the three election results statistics that I have been discussing.

126
Are there any other explanations which might see ethnic voting on the basis of single fixed
ethnic identities fit with key features of election results observed in Solomon Islands? One
possibility is that voters vote in ethnic blocs, on the basis of singular identities, but that
elections are fought by coalitions of ethnic groups which unite behind a single candidate, and
that electoral success depends on building multi-ethnic coalitions. Yet there are problems with
this explanation too. In particular, as discussed in Chapter 5, existing qualitative research
appears to suggest that voters in Solomon Islands and Papua New Guinea cannot be relied
upon to vote as ethnic blocs (something I describe further in Chapter 8 on the basis of my own
qualitative work). Moreover, people voting ethnically for reasons such as ethnic pride are
unlikely to feel emotionally rewarded upon the victory of someone from another ethnic group,
who they have only supported through a temporary alliance.
Another possible explanation is that voters possess single fixed identities but that their
motives are not irrational (associated with pride or other similar emotions). While explanations
of ethnic voting that posit single, fixed ethnic identities are, as I discussed in the previous
chapter, often coupled with the view that ethnicity guides voter behaviour through non-
reasoned impulse this need not be the case. It is possible voters might vote ethnically, on the
basis of only one identity, but also rationally, because they believe co-ethnics are likely to
provide benefits if elected to office. Such voters might continue to vote ethnically unless better
alternatives are present but also be sufficiently calculating to enter into multi-ethnic coalitions
when these are likely to deliver electoral benefits. The problem with this explanation is that
ethnic diversity no longer forms a simple, solid barrier to the two candidate electoral races
anticipated under Duverger’s Law. For ethnic diversity to counter the pull of Duverger’s Law
and to lead directly to political fragmentation amongst rational voters, ethnic divides need to
be hard to transcend, a barrier to the candidate-reducing strategic decisions we would expect
to see rational actors engage in. Yet in the model of ethnic voting I have just described divides
are no longer hard to transcend — indeed their being transcended is central to its explanation
of fluctuating candidate numbers. But if groups are willing to (rationally) transcend such
divides and make common cause on a regular basis why do we not see a falling effective
numbers of candidates?
Multiple Ethnic Identities and Rational Behaviour
Unlike those who hold to primordial theories of ethnic voting, constructivists contend that
voters typically possess a range of potentially salient ethnic identity options, with the most
important identity in any instance being determined by context. Given that my review of
literature on voting in Solomon Islands and Papua New Guinea covered works suggesting a

127
variety of different ethnic identities (clan, church and language) playing a role in voter
behaviour, constructivist approaches appear a promising contextual fit.
As I discussed in the previous chapter, in recent political science work on elections,
explanations of multiple identities and some identity fluidity are typically coupled with models
of rational voters. Although it is not described in any detail in work on electoral politics it is
also possible to couple models of voting based on multiple and fluid ethnic identities with non-
reasoned electoral behaviour. I return to this possibility at the end of in Chapter 8.94
Two of the most important constructivist works on electoral behaviour written in the last
decade (Chandra 2004; Posner 2005) also provide sophisticated explanations of why voters
vote ethnically, when voters vote ethnically, and why particular ethnic identities become more
or less prominent in different contexts. This work brings with it predictions of the patterns of
election results we should expect if contemporary constructivist explanations of voter
behaviour fit with the Solomon Islands context.
Because Chandra’s method, hinging around ethnic groups being large enough to achieve
leverage in state legislatures, does not directly translate to the winner take all environment of
electorate contests in Solomons, I primarily engage with predictions derived from the work of
Posner over the course of this chapter, although I do also engage in passing with Chandra’s
work when looking at national level competition. Importantly, even though I cannot engage
with Chandra’s specific approach to determining when an ethnic identity is electorally relevant
in the same way I can with Posner, the size-based logic underpinning her theory is the same,
meaning the electorate-level tests I run still speak to her theory.
Fluid Identities, Rational Voters and National Politics
In his influential 2005 book on ethnic politics in Zambia, Posner advances the argument that
the ethnic identity most likely to become salient amongst electoral actors possessing a suite of
potential ethnic identity options is the identity which makes arithmetic electoral sense — that
which is the basis for the smallest possible winning bloc of voters within an electorate or of
MPs nationally. To Posner, ethnic identity options themselves are the product of historical
forces which have rendered them prominent, but when there is more than one such option,
electoral arithmetic determines which option rises to the political fore.95 In the 2005 book
94
Chandra (2004) specifically allows for this possibility although, in effect, her empirical work is based on a model of reasoned choices. 95
Recall from the previous chapter that this differs from Chandra’s explanation, which hinges on the visibility of traits which pulls ethnic identities to the fore. Either explanation fits my work as Church, Language, Province/Island and Clan are all socially salient in Solomon Islands, and they are all also ‘visible’ in the sense that Solomon Islanders’ ethnic identities are well-known to their compatriots (i.e. a Solomon Islands voter could very easily find out a candidate’s language group or church). And to

128
Posner makes use of changes in Zambia’s electoral rules over time, and the way these changes
were coupled with changes in the ethnic identity options most central to electoral politics, to
provide evidence for his theory. In particular, Posner found that in years when Zambian
elections were held under a legally mandated single-party system tribal identities structured
electoral politics. This occurred because the legal prohibition of multiple parties meant that all
that was at stake electorally was power within electorates — and within electorates tribes
were large enough to win if they united behind candidates. When Zambia rescinded rules
prohibiting multiple political parties, the electoral stakes changed. Now the most valuable
prize was national: to have a party win enough seats to dominate national government. This,
in turn brought a change in the most electorally salient ethnic identity option in Zambia. Tribes
ceased to be the primary unit of electoral competition being replaced by language groups. The
reason for this change was, effectively, size. No one tribe was large enough on its own to form
a significant national electoral grouping. Language groups, on the other hand, were, and
became the basis of national political movements.
There are no laws in Solomon Islands prohibiting political parties and parties are, as discussed
in Chapter 4, plentiful. Nor are there any formal features of Solomon Islands electoral rules, or
the Solomon Islands government, preventing the nation as a whole from being the most
important arena of electoral competition. On paper at least there is nothing to suggest that
any ethnic group (or small coalition of groups) able to capture power in the Solomon Islands
parliament would benefit any less from this than would a Zambian ethnic group that did the
same. Similarly, even in the instances of groups not large enough to capture a plurality in
parliament but still big enough to have a reasonable share of MPs, there is still much to be
gained by being able from the leverage in coalition negotiations if the group in question can
act as a bloc. Indeed this is a point Chandra (2004) makes in her analysis of Indian politics:
there is much to be gained by an ethnic group with a block of seats in parliament.
However, in Solomon Islands, ethnic blocs and ethnic electoral coalitions are absent at the
national level.
For some potential ethnic identities this can easily be explained as a function of their size.
Clans are too small to be the basis of multi-electorate ethnic coalitions. Likewise, language
groups, while larger, are also too small to be realistic building blocks of national electoral
power. In the 1999 census the largest language group, speakers of Kwara’ae, were only slightly
more than nine per cent of the total population. Moreover, because they are geographically
reiterate: even though Chandra and Posner differ in their beliefs of where ethnic identities come from they have the same group size-based explanation of why some available identities rise to electoral prominence.
129
concentrated, Kwara’ae speakers form potential majorities in too few electorates to make the
identity a basis for the acquisition of power, or even leverage, in a 50 seat parliament.
However, on the basis of relative group size and potential MP numbers, two other potential
ethnic identities do appear plausible bases for electoral competition.
The first of these, province/island group, seems plausible for a range of reasons. In particular,
as covered in Chapter 3, provincial identity was, ostensibly at least, central to the civil conflict
which occurred in Solomon Islands, and has been associated with secessionist tendencies in
Western Province. The sheer number of candidates standing within electorates is of its own
accord enough to dispel the possibility that there exist any ethno-political movements based
on provincial identity strong enough to exert within-electorate hegemony.96 Yet it could be
that nationally provinces still have some importance as building blocks of political power. No
province is large enough to form the basis of a parliamentary majority of its own, but if
provincial identities were strong enough to foster political cooperation amongst MPs, this
would afford considerable leverage in coalition formation. However, there is no qualitative
evidence in the form of party names or slogans, or in prominent political narratives to suggest
provincial identity plays a sustained and significant role in any form of political cohesion.
Indeed, it has been suggested (Kabutaulaka 1998) that the predominant role of provincial
identity in government formation is the opposite: governments attempting to balance their
composition across provinces.
Unfortunately, historical data detailing the geographical composition of Solomon Islands
governments are unavailable. However, staff at the Solomon Islands parliament provided me
with a list of cabinet and backbench members of Prime Minister Gordon Darcy Lilo’s
government as of 29 February 2012. The provincial breakdown of the government is shown
below in Figure 7.2. As data, the February 2012 data are not perfect. In particular, owing to the
adroit manoeuvring of Lilo, the government of 33 MPs is substantially larger than is normally
the case (only 26 MPs are required to pass legislation), and some MPs, such as Job Dudley
Tausinga of Western Province, who were part of the government at February 2012, had
previously been opposition stalwarts. Nevertheless, as Figure 7.2 shows, the government is not
comprised of simple, province based, ethnic blocks. Rather, all of the larger provinces are
represented in both government and opposition.
96
Very speculatively the Moro movement in parts of central and eastern Guadalcanal could be argued to play this role based as it is, in part, on mystical identities tied to the island of Guadalcanal, yet even in the few electorates where it is a significant presence the movement does not appear, on the basis of candidate numbers alone, to have been successful in exerting any form of electoral dominance.

130
Figure 7.2 – Provincial Make Up of February 2012 Government
Chart notes: based on data provided by Solomon Islands parliament staff. Y-axis is number of MPs.
Guadalcanal province is over-represented in opposition but not by much: one MP shifting from
opposition to government would lead to balance. Similarly there are no Makiran MPs in
opposition, but the province is home to only four MPs, so the ‘grouping’ may be product of
chance alone — there is no documentary evidence of Makiran MPs regularly working as a bloc
in recent previous parliaments. Western Province is over-represented in government and,
given the prime minister is from Western Province, this might be evidence of a provincial
political bloc. Yet it is more likely a product of chance. There is no evidence from recent years
of Western Province MPs working as a cohesive parliamentary unit, and prior to Job Dudley
Tausinga’s move into government, which occurred not long before these data were gathered,
the imbalance was less.97
Another possible form of national ethnicity-based political blocs in Solomon Islands is one
based on religious identity.
Figure 3.2 in Chapter 3 shows, relative church shares of the Solomon Islands’ total population.
Figure 7.3 below reflects the distribution of churches in a more electorally relevant way. Here,
the pie chart shows the percentage of seats in parliament each church group would hold if it
won every electorate where it was the largest denomination.
97
There was something akin to political coordination amongst Western MPs, as part of the ‘breakaway movement’ immediately pre-independence (Premdas, Steeves et al. 1983) but this did not endure long into the independence era.
0
10
20
30
Government Opposition
Rennell and Bellona
Central
Isabel
Choiseul
Temotu
Honiara
Makira/Ulawa
Guadalcanal
Western
Malaita

131
Figure 7.3 – Expected Religious Composition of Parliament Based on Church Based Ethnic Competition
Chart notes: based on 2009 census data
The largest church, the (Anglican) Church of Melanesia, were it able to cohere as an ethnic
political identity, would be large enough to gain a parliamentary majority with just one
coalition partner, while other larger churches would also be big enough to cohere in
opposition with relatively few inter-faith allegiances required. Even if outright majorities are
not possible, the potential for leverage, theorised as important in Chandra’s work is clearly
significant. Inter-faith cooperation would be necessary, but the groups required to work
together would not be nearly as numerous as those needed to pull together provincial
coalitions. Churches are central to Solomon Islands life and have been important historically,
and so might reasonably be expected to be a potential ethnic identity.
Yet national level church-based electoral competition is not present in Solomon Islands. As I
discussed in Chapter 4 there is no qualitative evidence of the existence of contemporary
church-based political parties, nor is there any evidence of national church-based political
movements.
Figure 7.4 below uses the 2012 government composition data which I drew upon above and
combines it with MP bio-data gathered from the Solomon Islands parliamentary library to
provide a breakdown of the government and opposition by church denomination.
Church of Melanesia
40%
Roman Catholic 22%
United Church 14%
South Seas Evangelical Church
12%
Seventh Day Adventist
8%
Christian Fellowship Church
4%

132
Figure 7.4 – 2012 Government and Opposition by Church Denomination
Chart notes: based on data provided by Solomon Islands parliament staff. Y-axis is number of MPs
All of the major denominations are split across government and opposition. There is clearly no
strong church-based political coordination present at the national level.
Multiple Identities and Rational Voters in the Constituency
However, the fact ethnic political competition is absent at the national level in Solomon Islands
does not necessarily mean theories of ethnic politics such as those of Chandra and Posner are
necessarily inapplicable. The absence of ethnic identity based competition nationally is
puzzling but there is at least one explanation: that the state is so weak in Solomons, and its
reach in to rural parts of the country so tenuous that, unlike in Zambia (possibly) and India
(certainly), there is little to be gained by any group in winning control of it that cannot be
gained with greater ease simply by winning an electorate seat. The state is certainly weak in
Solomon Islands. Moreover, constituency development funding provided to MPs by various
government departments for work in the MPs’ electorates is high, more than SBD$3,500,000
per annum according to information provided by the Solomon Islands Government.98 Under
these circumstances, absent strong incentives to organise ethnically at the national level,
ethnic politics may simply play out within electorates.
98
SBD$3,500,000 is equal, at the time of writing, to AU$537,000 or US$488,000. A substantial figure when one considers that populations of Solomon Islands electorates are low.
0
10
20
30
Government Opposition
Kingdom Harvest
Rhema
CFC
United Church(and related)Christian OutreachChurchCatholic
SSEC
Anglican
SDA

133
The nature of the state is not the only possible explanation for the absence of ethnic electoral
politics of the sort anticipated by Posner at the national level in Solomon Islands and I discuss
this issue further in my conclusion. However, for now the weak state in Solomons and the
nature of what is at stake in electoral competition provides one sufficiently plausible
explanation to prevent us from having to conclude the theories of Chandra and Posner do not
fit. Possibly the problem is simply that the most meaningful arena of electoral competition is
within constituencies. It is to this level of analysis I now turn, focusing solely on Posner’s work
because, as I noted above, his methods fit more neatly than Chandra’s with electorate contests
where there are no formal avenues for leverage.99
If Posner’s explanation of ethnic voting holds at the electorate level in Solomon Islands, the
ethnic identity option we would expect to see rising to the fore in any one constituency would
be the identity which made sense in terms of the size of its largest group relative to other
groups. The ethnic identities involved also need to be meaningful and apparent, which is true
for both of the identities I analyse in detail below: church and language group. I exclude clans
from the analysis owing to a lack of data and this is an acknowledged limitation. However, it
should be noted that, as discussed in Chapter 3, in most constituencies clans are small, too
small, if relative group size is all that matters, for clan identity to be an optimal identity option
for electoral competition. In some instances larger aggregations of clans, such as houses of
chiefs, or moieties might be of sufficient size. However, I undertook fieldwork in constituencies
where such groupings were present and found little evidence that they filled the role of ethnic
identity as a result of simple size-based calculations as might be anticipated under the
constructivist explanations I have been discussing.100
For an example of how the relative sizes of ethnic groups might determine which ethnic
identity option becomes most important in any one Solomons electorate consider the case of
Gao and Bugotu constituency in Isabel province. It is dominated (93 per cent in preliminary
2009 census data) by members of the Church of Melanesia, something which, on Posner’s
explanation, renders religious identity an inefficient source of ethnic competition when the
electorate is all that is at stake. This is because the dominant church is too large to be an
optimal source of electoral patronage: the benefits of office would have to be spread amongst
99
Informal avenues for leverage exist, however, in the form of between group alliances similar to those discussed above (i.e. ethnic Group A at 10 per cent of the population might promise it’s support to ethnic Group B, which is 40 per cent of the population), acquiring leverage for itself. This is a possibility but not one that is testable using results data. However, in Chapter 8 my detailed descriptions of electoral contests suggest it does not take place in the simple manner I have just described, although brokers do try and garner leverage of a sort through promises of votes to candidates. However, this does not appear to regularly occur on a strictly ethnic basis as my descriptions in Chapter 8 show. 100
This is not the same as saying they play no role whatsoever; I discuss these groups and the institutions associated with them further in subsequent chapters.

134
too wide a group of clients. At the same time the minority church (or churches) is far too small
to be an electoral force. Language on the other hand, would be a more plausible source of
ethnic competition. On the basis of 1999 census data 44 per cent of the constituency speaks
Bughotu as their first language, 28 per cent speak Cheke Holo, and 14 per cent speak Gao.101
As a potential ethnic group Bughotu speakers are close to the optimal size for electoral
competition. Moreover, should Cheke Holo and Gao speakers be able to work together, the
other two groups could combine to make language-based contests very close. Language
groups are smaller than the church, but bigger than clans (on which there are no accurate data
for the constituency, but which I know from my own time in the area to be numerous enough
in practice as to mean that no one clan comprises anywhere near as much as 44 per cent of
the population). As such, on the basis of size alone, language appears the most likely ethnic
identity option structuring electoral politics in Gao and Bugotu.
To be clear, under such explanations, ethnic groups do not need to be perfectly balanced in
size. Because ethnic voting is unlikely to be exclusive, small imbalances in size need not
preclude particular identity options as bases for electoral competition, but larger differences
such as those between churches in Gao and Bugotu clearly do.
In his work on ethnic voting in Zambia (2005, Chapter 5), Posner builds on the insights given
above to construct a model predicting which ethnic identity option will structure ethnic voting
in a contest where two or more identity options are available to voters and political actors. In
particular, he theorises the identity option that becomes the focal point will depend on the
decision of a ‘pivot’ group — a group of voters who possess, amongst possible identity options,
a combination which will see a candidate of their group win regardless of the identity option
that becomes the axis of ethnic competition. Confronted with a situation where they know
that, regardless of the identity option which structures politics, they will be in the winning
group, the pivot group will choose to focus politics on the ethnicity option which places them
in the smallest willing group (smaller, while still large enough to win, being best because it will
mean more resources per capita).
The electorate of Aoke/Langalanga in Malaita illustrates this well. In the Aoke/Langalanga case
the pivot group would be Langalanga speaking Catholics.102 At 53.5 per cent of the electorate’s
population, Langalanga speakers are the largest language group. At 37.6 per cent of the
population Catholics are the largest religious group. Therefore, should ethnic politics revolve
101
With the remainder speaking either Pijin as their first language or languages from other parts of Solomon Islands. 102
In theory, based on numbers alone there could be no Langalanga speaking Catholics. The 37.5 per cent of the population who are Catholic could all be drawn from other Language groups. However, from my fieldwork in the area, I know this not to be the case.

135
around religion, Langalanga speaking Catholics will be in the largest group. At the same time
should ethnic politics be based on language they will also be in the largest group. Under these
circumstances, in Posner’s model, they will choose the smaller of the two groups to identify
with, in this instance ‘Catholic’. They will do this because — as the smaller winning group — it
ought afford them more resources (while remaining a winning group because no other group
will be large enough to beat it without their inclusion).
Unfortunately, it is not possible to calculate the size of pivot groups and the identity option to
which they will pivot without data on individuals’ identities (or at least cross-tabulated data on
the size of combined identity groups — i.e. how many Langalanga speaking Catholics there are)
and such data are not available for Solomon Islands. However, owing to the large imbalances
in groups’ sizes usually present for one of the two ethnicity options in most Solomon Islands
electorates (many are quite similar to the Gao and Bugotu example above) even without these
data it is possible to estimate with a reasonable degree of certainty which ethnic identity
option ought predominate in most Solomon Islands electorates. Also, as I discuss further
below, where certainty is less assured, I can double check by running regressions substituting
the less favoured ethnic identity option for the most likely.
I have estimated the ethnic identity option likely to structure electoral competition through
the following method. I have counted as plausible those identity options where the largest
group is less than 55 per cent of the population.103 Doing so, while not requiring perfect
equality of size between groups, eliminates identity options such as religion in Gao and Bugotu
which are clearly too prevalent in an electorate to provide a minimum winning coalition.
Where both identity options met this criteria I have included both in the table, placing as first
the option which provided the smallest winning group, as long as that group was larger than
the second largest group in the other option. The rationale for this choice was that, as per
Posner, everything else being equal a smaller winning group is preferable. However, once a
particular identity option’s winning group has become smaller than the second largest group in
the competing identity option it is likely there will be a pivot group which will tilt to the other
identity option — if they do not they risk losing out. For example, in Aoke/Langalanga
electorate both language and church are potential ethnicity options, as their largest groups
(Langalanga speakers and Catholics) are less than 55 per cent of the population. Of the two I
have allocated Church as the preferred identity option as the largest church group (Catholics at
37.6 per cent of the population) are smaller than the largest language group (Langalanga
103
Possibly 55 per cent is too low a cut off. I tried an alternate cut off point of 60 per cent; however, this did not substantively change any of the following results. Indeed there was only one electorate where this extra range provided it with an optimal identity option, and two where it provided a second best option.

136
speakers at 53.5 per cent of the population) while at the same time being bigger than the
second largest language group (Kwara’ae speakers at 15.87 per cent of the population).
Such a means of selection, while the best available to me, is not ideal and to account for this
(as noted above and discussed further below), in the regressions that follow, I run robustness
tests including second best identity options where they exist. (So, for example, because
Langalanga speakers is a plausible group in Aoke/Langalanga it is included in the second-best-
option robustness tests.) In 10 electorates population imbalances between both language and
church groups were such that it appeared extremely unlikely that either identity option would
structure electoral competition. Accordingly, these 10 electorates are not included in the
following analysis. Also, for the three Honiara electorates and the constituency of
Gizo/Kolombangara, language data were unreliable owing both to large groups of people who
spoke the non-ethnicity associated language of Pijin as their first language, or large groupings
of people in the ‘other’ category in census data. In each of these I have used church data
alone.
In Table 7.2 below I have provided information for each electorate on identity options and the
largest group within each option. If only one identity option is a plausible axis of electoral
competition I provide information on that option alone. However, as noted above, because my
method of estimating the most likely ethnicity option structuring competition is imperfect
where both identity options could be possible axes of competition I provide information on
both (with the most likely being given first). For example, for the Aoke/Langalanga
constituency, the table can be read as showing that both Church and Language could be the
basis of ethnic competition, with church being more likely. The largest Church group is
Catholic, its share of the population is 37.6 per cent. The largest language group is Langalanga,
its share of the population is 53.5 per cent. The fact that there are relatively few electorates
with data in the column containing information on the second best identity option reflects the
fact that the typical electorate in Solomon Islands is more like Gao and Bugotu than
Aoke/Langalanga. That is, for most electorates one ethnic identity option was clearly better
suited to group-size-based ethnic competition.

137
Table 7.2 – Features of Likely Ethnic Competition, Solomon Islands Electorates
Electorate
Plausible Identity Options
Identity Option 1. Largest Group
Popn. Share
(%)
Identity Option 2. Largest Group
Popn.Share
(%)
Aoke/Langalanga Church/Lang Cath. 37.6 Langalanga 53.5
Baegu/Asifola Lang/Church Baeggu 52.5 COM 46.3
Central Guadalcanal Church SSEC 30.1
Central Honiara Church* COM 33.8
Central Kwara’ae Church SSEC 43.4
Central Makira Lang/Church Bauro 44.7 COM 50.7
East ‘Are ‘are Church Cath. 44.1
East Central Guadalcanal Lang/Church Lengo 40.5 Cath. 30.5
East Choiseul Lang Genga 52.3
East Guadalcanal Lang Birao 36.6
East Honiara Church* COM 25.1
East Kwaio Church SSEC 47.8
East Makira Church/Lang Cath. 36.5 Kahua 45.5
East Malaita Church SSEC 54.1
Fataleka Church COM 42.7
Gao/Bugotu Lang Bughotu 43.6
Gizo/Kolombangara Church* SDA 39.9
Hograno/Kia/Havulei Lang Cheke holo 48.1
Lau/Mbaelelea Lang/Church Baelelea 52.0 Cath. 24.2
Malaita Outer Islands None
Maringe/Kokota None
Marovo Church SDA 52.8
Nggela None
North East Guadalcanal Church SDA 31.1
North Guadalcanal Church COM 45.2
North Malaita Church SSEC 31.3
North New Georgia None
North Vella Lavella None
North West Choiseul Church/Lang UC 53.1 Varisi 54.1
North West Guadalcanal Church/Lang Cath. 40.9 Ndi 20.7
Ranongga/Simbo Lang Lungga 34.3
Rennell/Bellona Church SDA 49.0
Russells/Savo Lang Savo 23.0
Shortland None
Small Malaita Church/Lang COM 41.3 Sa’a 49.2
South Choiseul Lang/Church Babatana 38.1 UC 51.4
South Guadalcanal Church/Lang SSEC 46.8 Koo 47.6
South New Georgia/Rendova Lang/Church Roviana 38.9 CFC 46.0
South Vella Lavella None
Temotu Nende Lang Namba. 42.6
Temotu Pele None
Temotu Vatud Lang Tikopia 42.9
Ulawa/Ugi None
West ‘Are ‘are Church Cath. 52.9
West Guadalcanal None
West Honiara Church* COM 34.5
West Kwaio Lang/Church Kwaio 46.7 Cath. 48.8
West Kwara’ae Church COM 49.0
West Makira Church COM 54.1
West New Georgia/Vona Vona Church/Lang UC 37.4 Roviana 44.2
Table notes: language groups from 1999 census, churches from 2009 census. Lang = Language. COM = Church of Melanesia, SDA = Seventh Day Adventist, Cath. = Catholic, SSEC = South Seas Evangelical Church, CFC = Christian Fellowship Church, UC = United Church * = language data not used.

138
Constituency Determined Ethnicity Options and Average Winner Vote Shares
Adopting a size-based constructivist logic for Solomon Islands, we would expect a reasonable
correlation between group sizes associated with the optimal identity option for constituencies
and associated electoral statistics. In particular if ethnic groups formed and united behind the
most likely identity option in an electorate, we should expect to see a correlation across
electorates between the size of the largest group in the favoured identity option and the vote
share of the winning candidate.
Figure 7.5 below shows a scatter plot on which the population share of the largest group in the
most likely identity option is plotted against the average winning candidate vote share for the
four general elections held between 1997 to 2010 (with 1997 taken as a starting point because
redistricting means electorates in earlier elections had different ethnic compositions). Each
point on the chart is a constituency. This average is calculated regardless of the actual ethnic
identity of the winning candidate in the constituency. The key assumption here being that, at
least on average over a number of elections, if ethnic politics is mechanical as suggested by the
theory I have been describing, the winner will almost certainly be from the optimal-sized
ethnic group. (Below I run subsequent tests which do not hinge on this assumption.) The
dashed grey line in the figure plots the one-to-one relationship, where average winning
candidate vote share is equal to their ethnic group’s population share. The red line is the OLS
line of best fit.
A quick glance at the figure is sufficient to suggest that the population share of the largest
group in the most likely ethnicity option is not related to averaged winning candidate vote
shares.104 I test this formally by regressing the share of the largest group in the most likely
ethnicity option against average winning candidate vote share. The results of this regression
are presented below in Table 7.3.
As robustness tests I ran the same regressions substituting the second identity option for the
first in those electorates whether either option seemed plausible. Once again the relationship
was very weak and not statistically significant.105
104
Indeed, if anything the relationship is negative. Although as can be seen in the regression results below this is not a statistically significant relationship. 105
For all of the regressions discussed on this page I also ran further robustness tests excluding outliers and also tests using robust standard errors. In no instances did my results change.

139
Figure 7.5 – Ethnic Group Population Share Against Average Winning Candidate Vote Share
Chart notes: data as in Table 7.2. Language groups from 1999 census, churches from 2009 census. See Appendix 3 for constituency codes.
Table 7.3 – Regression Results: Ethnic Group Size Versus Average Winner Vote Share
Average Winning Candidate Vote Share
Population share of largest group in most likely identity option
-0.158 (0.178)
Constant 0.424***
(0.077)
Adjusted R2 -0.006
n 40
Standard errors in parentheses; * significant at 10% level; ** significant at 5% level; ***significant at 1% level.
The results table reflects the scatter plot. There is no association between group size and
winning candidate vote share.
One possible explanation for the absence of results is that, for some unexplained reason, one
of the two identity options (language or church) plays no role in structuring ethnic politics even
when size suggests it should. To test for this I re-ran my regressions using first only language
data as the independent variable and then only church data. Once again the relationship was
negligible.
Another possible explanation is that only one of the ethnicity options played a role, but that it
only played a role when it was of a size likely to render ethnic politics effective. Yet, when I ran
separate tests using church then language as independent variables, limiting my study only to
constituencies where the largest group was greater than 20 per cent of the population but less

140
than 55 per cent, I still failed to find any correlation between group size and winning candidate
vote share (as averaged across all general elections since 1997).106
To be clear, I ran these regressions not expecting strong correlations. Even if ethnic voting of
the sort explained above was taking place it might not be the only factor influencing voter
choices, and voters’ calculations of optimal groups might be approximate at best, and these
factors might weaken correlations. Yet, not only did I not find a strong correlation, I failed –
repeatedly – to find any correlation at all.
Constituency and Winner Determined Ethnicity Options and Actual Winning Candidate Group Shares
There is, however, one possible limitation in the tests I have described this far: I have
regressed the average winner vote shares against the population share of the group in the
constituency assumed most likely to dominate ethnic competition in the constituency on the
basis of the relative sizes of groups in the electorate’s ethnicity options. However, such a test
assumes that the largest group in the most likely ethnic identity option actually manages to
win. And given that, as stated above, nothing in electoral politics is ever perfectly determined,
this would seem a hazardous assumption. The largest group may be riven by unobserved
conflict, or possibly have the misfortune of standing a particularly unimpressive candidate.
Such impediments could quite plausibly prevent it from winning, in which case even if voters
were voting along ethnic lines, we would not expect winning candidates’ vote shares to match
the size of the largest group in the constituency. Instead, we would expect the winner’s vote
share to match the size of the group they are from. Hopefully, by running my regressions, as I
did above, using averaged data from four elections (1997, 2001, 2006 and 2010) I minimise this
risk; however, it makes sense to account for it further by running tests where the dependent
variable is the winning candidate’s vote share, and the independent variable is the size of the
actual ethnic group the winning candidates are associated with.
Unfortunately, the data-poor world of Solomon Islands makes running such tests hard and I
only have good data on winning candidate church and language identity for the 2010 and 2006
general elections. Nevertheless, if ethnic competition is being determined by group size we
ought still expect to see some relationship in these data.
There are two possible ways of running tests using information on the ethnic identities of
winning candidates, each hinging on slightly different assumptions about how relative group
size shapes the nature of ethnic electoral competition.
106
The range of 20 to 55 per cent is chosen to reflect the rule used in calculating the optimal group size and also the range of group sizes found in Table 7.2. I re-ran regressions using alternate ranges (for example 30 per cent to 60 per cent). This did not produce findings that were substantively different.

141
In the first, the assumption is that the ethnic identity option that structures competition in an
electorate has nothing to do with the candidate themselves but is determined solely by the
relative group sizes in the constituency. So, for example, if relative group sizes in a
constituency render church the most likely ethnic identity option to structure electoral
competition then we should compare the size of the winning candidate’s church group with
their vote share and we should do this regardless of whether church is actually the optimal-
sized group for the winning candidate themselves or not. The assumption here is that the axis
of ethnic electoral competition is shaped by constituency demographics, is relatively fixed, and
cannot be easily shifted by individual candidates. If relative group sizes have meant the
constituency has always been divided electorally along church lines, no individual candidate
can shift the axis of competition to language just because that might be a better grouping for
them. Rather, if they are going to win they will have to work on uniting their church and
hoping that candidates from larger churches under-perform.
In the second, the assumption is that the optimal ethnic identity option structuring
competition in an electorate is that which best suits the winning candidate — the option
which, if it becomes the axis of competition, affords the candidate the best chance of winning
based on the relative group sizes within it. In this case the assumption is candidates have
considerable agency in shaping how voters view themselves in terms of competing ethnic
identity options, and that the winning candidate will have won at least in part by virtue of the
fact they persuaded people to think of themselves as of the identity option that best suited the
candidate’s electoral needs. For example, if relative group sizes mean that language was the
ethnic identity option which afforded the winning candidate in question the best sized group
we would expect to see electoral competition structured around language, and we would
expect the winner’s vote share to loosely match the size of their language group.
Reflecting these two possible ways of running tests I ran one set of tests with each electorate’s
ethnicity option determined by the electorate and one with it determined by the winning
candidate.
To illustrate the difference between the two approaches consider the example of a case where
the winning candidate was from a language group that was only 20 per cent of the electorate’s
population but who was from a church group which was 45 per cent of the population, who is
running in an electorate where population sizes of different groups suggest language is the
optimal axis of ethnic electoral competition (say, for example, because the largest language
group is 40 per cent of the electorate’s population, and the second largest church group is 30
per cent of the population). In the first set of tests the independent variable for this candidate

142
would be the population share of their language group (recall the assumption in this set of
tests is the candidate themselves cannot shift the axis of ethnic competition). In the second set
of tests the independent variable would be the population share of the candidate’s church
group (the assumption now being the candidate is be able to structure competition so that it
becomes church based).
As with my previous tests, for both approaches to testing it would be unreasonable to require
a very strong correlation between the size of winning candidates’ groups and their winning
vote shares as evidence of group size based electoral competition. However, on the other
hand, if relative group sizes are playing a role, it seems reasonable to expect at least some
relationship.
Constituency Determined Ethnicity Options and Actual Winning Candidate Group Shares
Figure 7.6 and Table 7.4 below present the results of my first set of tests. In this the dependent
variable is the vote share of the winning candidate in each constituency. The independent
variable is the population share of the winning candidate’s group within the most likely
identity option as determined solely by the size of groups within the constituency. The dashed
grey line in the figure plots the one-to-one relationship between group size and vote share; the
red line is the OLS line of best fit.
Figure 7.6 – Ethnic Group Population Share Against Winning Candidate Vote Share
Chart notes: winner vote share from 2010 and 2006 elections. Language groups from 1999 census, churches from 2009 census. See Appendix 3 for constituency codes.

143
Table 7.4 – Regression Results: Constituency Determined Optimal Ethnic Group Size Versus Average Winner Vote Share
Winning Candidate Vote Share (natural log)
Population share of winning candidate’s group in most likely identity option as
determined by constituency
0.222 (0.281)
Constant -1.213*** (0.116)
R2 0.008
n 75
Robust standard errors clustered at electorate level in parentheses; *** significant at 1% level; ** significant at 5% level; * significant at 10% level; n=75 rather than 100 because it was run excluding the 10 constituencies where there was no obvious best ethnic identity option as well as excluding 5 electorates from 2006 where I was unable to determine the winning candidate’s ethnic group or the population share of their ethnic group.
Because data come from two years, I ran the regression with robust standard errors clustered
at the electorate level. 107 As the regression results show, the relationship is weakly positive.
However, it is not statistically significant nor does variation in the independent variable explain
much of the variation in the dependent variable. Once again there seems no association. This
was also true when I re-ran the regression excluding the obvious outlier (East Malaita 2010).108
Results were also effectively the same when I repeated the regression using the second-best
identity option for those electorates where there are two.
Winner Determined Ethnicity Options and Actual Winning Candidate Group Shares
In my second set of tests based on the ethnic identity of the winning candidate in 2010 and
2006 the identity option which produces the data used as the independent variable was
determined by the winning candidate – that is, it was the identity option which best suited
that candidate who won. If religion was the ethnicity option which provided the winning
candidate in the best sized ethnic group then I regressed the size of their church group against
their vote share. If it was language I used the size of their language group as the independent
variable.
In determining the likely best identity option for each winning candidate I applied the following
logic:
1. Following the principle that candidates and voters will strive for the minimal winning
coalition, if the candidate was in the largest group in both the religion and language
option I assigned them the option in which their group was smaller. However, I only
107
In the regression winner vote share is given as a natural log to produce normally distributed residuals. 108
I obtained very similar results down-weighting outliers more systematically running regressions using Stata’s iterative least squared procedure as per Hamilton (2009, p. 256) and Treiman (2009, p. 237). Results were also very similar when I ran the regressions without robust standard errors.
144
chose this option if their group was bigger than the second largest group in the
alternative option, reasoning that smaller winning coalitions were desirable until the
point where they meant the candidate’s group might be defeated by another group.
For example, if a hypothetical winning candidate was in the largest church in their
electorate (co-religionists being 60 per cent of the electorate) and in the largest
language group (fellow speakers being 35 per cent of the electorate) I would have
assigned them language as long as the second largest church was smaller than 35 per
cent of the electorate’s population.
2. If the candidate was in the largest group in one option but not the other I assigned
them the option in which they were in the largest group. For example, if the
candidate’s church was 45 per cent of the population in a constituency and larger than
any other church, and if their language group was also 45 per cent of the constituency
but was smaller than the largest language group in the constituency I assigned their
optimal identity option as church.
3. If they were not in the largest group in either option I assigned them the option that
put them in the larger group of the two available to them. For example, if their
language group were 15 per cent of the population and their church group 10 per cent
I assigned them to their language group.
In allocating identity options this way I allocated identity options to constituencies based on
what was better for the candidate, even when this meant a group that was very large or very
small. I did this because it seemed reasonable to assume that, if ethnic voting was present,
should a candidate have won, they were able to have tapped into the votes of co-ethnics even
if their group’s size was not optimal. As a robustness test I re-ran my regressions limited to
only those constituencies where the winning candidate’s group was neither very large nor very
small (greater than 20 per cent and less than 55 per cent); the results of this test are also
included in Table 7.5 below.109
To repeat the point made earlier in the chapter: this is not an ideal method for assigning
optimal group size. Preferably, I would have data that afforded me information on the share of
each language group who were members of each church. Yet, lacking such data I would
contend that my approach ought to provide a reasonable estimate of the best identity option
for each candidate.
109
As in other regressions changing these cut off values (for example to 30 per cent and 60 per cent) does not change the findings.

145
Table 7.5 below presents the results of this test. Column two shows the test run with the full
sample of constituencies (excluding a small number for which I lacked data on winning
candidate ethnicity). Column three restricts the regression to those constituencies where the
candidate’s group in their best identity option has a population share of greater than 20 per
cent of the population and less than 55 per cent. Because data come from two years, I have
run all the regressions with robust standard errors clustered at the electorate level.
In neither regression is there any evidence of an association between the size of the
candidate’s ethnic group in the identity option that best suits them and their vote share.110
Table 7.5 – Regression Results: Winning Candidate Determined Optimal Ethnic Group Size Versus Average Winner Vote Share
Winning Candidate Vote
Share (natural log)
Winning Candidate Vote Share (natural log)
Limited Group Sizes
Population share winning candidate’s group in most
likely identity option as determined by candidate
0.188 (0.226)
0.597 (0.599)
Constant -1.223***
(0.121) 1.409*** (0.267)
R2 0.011 0.024
n 91 55
Robust standard errors clustered at the electorate level in parentheses; *** significant at 1% level; ** significant at 5% level; * significant at 10% level. The dependent variable is taken as a natural log to account for skew. In the first regression n=91 rather than 100 owing to constituencies where I was missing data on the MP’s ethnic identity, as well as one electorate where there was no election in 2006.
Church and Language Alone
One final possibility, raised above when I was using average winning candidate vote share, is
that the problem is that one of the ethnic identity options under study is, for some reason, not
electorally salient, while the other is. To account for this possibility in my final set of tests using
2006 and 2010 winner vote shares I regressed, in two separate sets of regressions, winning
candidate church group population against winning candidate vote share, and also winning
candidate language group population against winning candidate vote share. Both for church
and language I ran the regressions for the full set of candidates I had data for, I then re-ran
them restricting the regressions solely to candidates whose groups were greater than 20 per
cent of their electorate’s population but less than 55 per cent.111 Because they are based on
two years’ data all regressions have been run using robust standard errors clustered at the
electorate level. The results of these regressions are presented in Table 7.6 below.
110
This is also true when I re-ran regressions without robust standard errors and excluding outliers as per previous regressions in this chapter. 111
As with previous regressions exchanging these cut off points for other plausible points did not produce significantly different results.

146
Here at last there is a result. The population share of the winning candidate’s church is not a
statistically significant predictor of winning candidate vote share regardless of whether the full
sample of electorates is used or whether the sample is restricted only to those electorates
where the winning candidate’s church falls within the optimal size range. The size of the
winning candidate’s language group, on the other hand, is correlated with the vote shares of
winning candidates across the two elections.112
Table 7.6 – Regression Results: Regressions Run Solely on Winner’s Church Share and Solely on Winner’s Language Share
Winning Candidate Vote Share (natural log)
Winning Candidate Vote Share (natural log) Limited Group Sizes
Winning Candidate Vote Share (natural log)
Winning Candidate Vote Share (natural log) Limited Group Sizes
Population share winner’s church
0.128 -0.028
(0.144) (0.594)
Population share winner’s language
0.336** 0.066
(0.126) (0.583)
Constant -1.180*** -1.107*** -1.298*** -1.218***
(0.072) (0.257) (0.075) (0.235)
R2 0.009 0.000 0.069 0.000
n 93 46 87 35
Robust standard errors clustered at electorate level in parentheses; *** significant at 1% level; ** significant at 5% level; * significant at 10% level. The dependent variable is taken as a natural log to account for skew.
However, even here, the results are hard to reconcile to theories which predict that size will
determine whether ethnic identities become electorally significant. As can be seen in the
fourth column of the table, the relationship between winner’s language group population
share and winning candidate vote share ceases to be statistically significant (or even remotely
close to statistically significant) when the sample is restricted to language groups which ought
to be of close to electorally optimal sizes. Possibly this is simply because the n for this
regression is low, but even so it is hard to reconcile the complete absence of a result in the
restricted sample (at the same time as there is a relationship amongst the larger sample of
electorates) with theories positing group size as important.
What is more, as Figure 7.7 below shows, even in the larger sample the relationship between
language group size and winner vote share is a long way from being one-to-one. The Y axis on
the chart is winner vote share (rather than the natural log of winner vote share) to offer ease
of visual representation. The red line is the OLS line of best fit. The dashed grey line plots the
one-to-one relationship between population share and vote share. If winning candidates were
coming close to winning on the basis of having united their language groups, the OLS line and
112
As with previous regressions in this chapter the results presented are robust to the exclusion of outliers and to running regressions with robust standard errors.

147
the one-to-one line would track closely. However, they are not at all close. Winners from larger
language groups tend to win larger vote shares but victory with a vote share that is close to the
population share of a candidate’s language group is not common.
Figure 7.7 – Winning Candidate Vote Share Versus Winning Candidate Language Group Population Share
Ethnic Group Sizes and Total Vote Share of All Candidates
Despite the fact that I have undertaken numerous variants of tests comparing winning
candidate vote shares and ethnic group sizes, none of my findings thus far has provided strong
support for theories that posit that the ethnic identity most likely to structure political
contestation is determined by relative group sizes and by affording minimal winning coalitions.
The results of the tests have only been significantly different from zero in one instance. In all
other tests the association between population share variables and winner vote share is very
weak — weaker than might be explained by data quality or the fact that even in ethnic
electoral contests some voters might vote non-ethnically making it mistaken to expect strong
correlations.
The final tests I run in this chapter are borrowed from Posner himself. Much of the testing
undertaken in Posner (2005) cannot be replicated here, in some instances due to missing data,
but primarily because Posner’s tests are geared around inter-temporal comparisons which
take advantage of changing electoral rules in the Zambian case, something that, as electoral
rules have not changed in Solomon Islands, I cannot replicate. For this reason, instead of

148
seeking to emulate Posner’s tests I have instead tested for patterns that ought to be present in
the Solomon Islands data if group-size based constructivist theories offered a reasonable
explanation of ethnic electoral politics in Solomon Islands. However, Posner does undertake
one test, somewhat different from those I have undertaken thus far in this chapter, which I can
emulate in part.
On pages 220 and 221 Posner (2005) discusses the results of bivariate regressions in which the
independent variable is the share of the dominant tribe in the constituency and the dependent
variable is the share of votes won by all candidates from the tribe in that constituency. He runs
two regressions: one for election results from single-party elections and one for multiparty
elections. His key finding is that, across Zambian constituencies, the size of the dominant tribe
in the constituency is correlated with the share of votes won by all of the candidates standing
who are of that tribal group. This differs from my tests above in which I look solely at the vote
share of the winning candidate. Posner’s central finding is that the dominant tribe’s share of
the population and the combined vote shares of candidates from the tribe are more strongly
correlated in single-party elections than in multi-party elections, evidence he takes to show
that tribal voting was more prevalent in single-party elections reflecting the stakes of those
elections.
While the variance between single-party and multiparty elections which Posner finds is useful,
his approach does not appear optimal for testing his own theory in a context where there is no
variation in electoral rules over time. In particular, voters in a pivot group (for example, Bugotu
speaking members of the Church of Melanesia) can only reasonably be expected to choose the
identity option that places them in the smallest winning coalition (Bugotu speakers in this
example) if they can be confident all or almost all of the members of their group will unite
around one strong candidate. If this cannot be assumed, the arithmetic underlying the choice
no longer makes sense as the ‘winning coalition’ may not be likely to win anything at all. It is
for this reason I have used winning candidate vote shares as the dependent variable in my
regressions above — if ethnic voters cannot rely on at least some coordination within their
group facilitating something akin to unity behind promising candidates it seems implausible to
expect them to vote ethnically when size suggests this is an ideal option, or to choose amongst
potential ethnic identities on the basis of size.
Despite this, I have chosen below to report on regressions similar to those undertaken by
Posner, in which the independent variable is the population share of the optimal ethnic group
and the dependent variable is the combined vote share of all of the candidates from that
group. Although, as we shall see, I am very cautious in my interpretation of the results.

149
While I was able to obtain data on winning candidate ethnic identities for both 2006 and 2010
elections I was only able to obtain an adequate body of data on non-winning candidate ethnic
identities (church group and language group) for the 2010 elections. Even for 2010, while I was
able to obtain data on at least some candidates for all constituencies bar one, in some
constituencies there were gaps in my data — candidates on whom I could not obtain
information. Usually this was for minor candidates who only obtained small vote shares, and
so has had minimal impact on the comparisons undertaken below. However, in those few
instances where I lacked data for candidates whose combined vote share was greater than 10
per cent of all votes cast I excluded these constituencies from my analysis.
Unlike the charts presented thus far, Figure 7.8 below reveals a striking pattern. In this I have
plotted on the X axis the population share of the winner candidate’s ethnic group in each
constituency from the identity option (church or language) determined by constituency
characteristics to be the more likely ethnicity option shaping electoral competition.113 On the Y
axis I have plotted the combined vote share of those candidates from that group. As group size
increases so does the combined vote share of all the group’s candidates.
However, there is an obvious problem with inferring the existence of ethnic voting from this
chart. Even in the absence of voting along ethnic lines, if the number of candidates from each
group is proportionate to the group’s size, and if candidates obtain approximately equal vote
shares, we would expect to see the total vote share of all candidates from a larger ethnic
group to be large, simply because there were more candidates standing from the group.114
Accordingly, to control for this, I have added percentage of candidates from the ethnic group
into the regression equations that I report on in the rest of this chapter. The results of the first
regression are presented below in Table 7.7.
The results confirm what was visually apparent in the scatter plot with the very high adjusted
R-squared reflecting the strong association between group size and group vote share. What is
more, while candidate share is clearly playing a role, the coefficient for population share is also
statistically significant and of significant magnitude. Group size is associated with combined
vote share even after controlling for candidate share.
113
An alternative would have been, as above, to choose the option that appeared to best suit the winning candidate. My reasoning for letting constituency rather than winning candidate be the guide was that this test involves the combined vote shares of all candidates from the winner’s group in a constituency, not just the winner. As a robustness test I did, however, test on the basis of winning candidate determined optimal groups and obtained results very similar to those from the tests run in which the optimal ethnic identity option was chosen on the basis of the constituency’s make up. 114
An extreme example makes this clear: in a constituency where 100 per cent of the population were from ethnic group X, candidates from ethnic group X would together win 100 per cent of the vote, for the simple reason that they would constitute 100 per cent of all the candidates standing.

150
Figure 7.8 – Ethnic Group Population Share Against Average Vote Share of all Candidates in Group
Chart notes: vote shares from 2010 election. Language groups from 1999 census, churches from 2009 census. See Appendix 3 for constituency codes. The red line is the OLS line of best fit.
Table 7.7– Regression Results: Vote Share of all Candidates in Winning Candidate’s Ethnic Group Compared to Candidate Share and Group Population Share
Combined vote share of all candidates in group
Population share of winner’s group
0.606*** (0.203)
Percentage of candidates from winner’s group
0.486*** (0.126)
Constant 0.202***
(0.058)
Adjusted R2 0.696
n 29
Standard errors in parentheses; * significant at 10% level, ** significant at 5% level, *** significant at 1% level. For this regression n=29 because it is restricted to 2010 data and only to those electorates where I had data on a sufficient number of candidates.
In a chapter in which has thus far been dominated by the absence of relationships this is a
striking finding. However, further analysis complicates the picture somewhat. Recall that the
theory being tested here, based on the work of constructivists such as Posner, is that the
ethnic group predicted to determine candidate vote share is the group from the available
ethnicity options (in this case language and church) which affords the most optimal group size
to one of its groups. (To return to the Gao and Bugotu example for illustration, here the group

151
was language, which afforded Bugotu speakers a minimal winning coalition. In the case of
Aoke/Langalanga, on the other hand, judged purely on relative sizes, the most likely group is
church.) Reflecting this I have used as the independent variable in my regressions the
population share of the group (language or church) that seemed most likely to be structuring
ethnic electoral competition in each electorate on the basis of relative group sizes.
However, when I re-run the regressions on language alone, using the population share of
speakers of the largest language group as my key independent variable, regardless of whether
language was the ethnic identity option more likely to generate the optimal winning coalition,
and including electorates where language would seem far too large or too small to produce a
winning coalition, the relationship remains, as shown in Table 7.8 below.
Table 7.8 – Regression Results: Vote Share of all Candidates in Winning Candidate’s Language Group Compared to Percentage of Candidates from Group and Group Population Share (all Constituencies with Data)
Combined vote share of all candidates in winner’s
language group
Population share of winner’s language group
0.264** (0.100)
Percentage of candidates from winner’s language group
0.509*** (0.083)
Constant 0.293***
(0.034)
Adjusted R2 0.856
n 40
Standard errors in parentheses; * significant at 10% level, ** significant at 5% level, *** significant at 1% level.
What is more, the association between language share and winner vote share remains, albeit
only on the borderline of statistical significance (p-value =0.107, note that the sample size is
now small), even when I run the analysis using only those constituencies where I would not
anticipate language group to be the identity option structuring competition on the basis of
relative group sizes. Both facts which suggest — along with my previous finding for language
shown in Table 7.6 — that, while ethnic group size is associated with the combined vote shares
of candidates from that group, whether one identity option is salient or not is not simply a
product of relative group sizes. Rather, language group size appears to be associated with
combined candidate vote share across all constituencies for which I have reliable data,
including those where language groups are too large or too small to be ideal building blocks of
ethnic electioneering if group size plays a role as posited by constructivists such as Posner and
Chandra.
Similarly, when I regress combined language-group candidate vote share against population
share for all language groups that I have data for, not just the groups of those candidates that

152
won, I find a strong relationship (Table 7.9), a relationship that holds even for language groups
that are far from optimal size for structuring elections (the second column in Table 7.9 shows
the same regression run on only those language groups forming less than 30 per cent of their
electorate’s).
Table 7.9 – Regression Results: Vote Share of all Candidates in all Language Groups Compared to Percentage of Candidates from Group and Group Population Share
Combined vote share of all candidates in language group
Combined vote share of all candidates (only when language group <30%)
Population share of language group
0.445***
(0.122)
1.530***
(0.421)
Percentage of candidates from language group
0.623***
(0.103)
0.014 (0.205)
Constant 0.021
(0.031) 0.030 (0.045)
Adjusted R2 0.795 0.348
n 81 39
Standard errors in parentheses; * significant at 10% level, ** significant at 5% level, *** significant at 1% level.
Although marginally less pronounced, similar results can also be found for churches.
What does all this mean? Recall that:
1. Population share of language or church groups does not appear to be associated with
winning candidates’ vote share in any manner which sees salience determined by
group size. This was true when I looked at averages from across elections letting the
constituency’s make-up determine what seemed to be the most likely ethnic identity
option structuring politics. It was also true when I focused on the 2010 and 2006
election results and let the ethnic identity of the winning candidate determine the
ethnic identity option most likely to structure politics. It was also true when I re-ran
my regressions focusing solely on church-based identities and again focusing solely on
language-based identities. Only when I ran regressions for language alone, and
included constituencies where I would not have expected language to structure
competition on the basis of size, did I find a statistically significant relationship
between winner vote share and language group population share. Even here the
relationship was far from the one-to-one relationship that would be found if language
groups function as electoral blocs.
2. The population share of language and church groups does, however, appear to be
associated with the total vote share of all candidates from those groups, even
controlling for the fact that groups with greater population shares also have larger
shares of the total number of candidates.

153
3. This association holds even where the size of the ethnic groups involved is too small
for them to be optimal units of electoral competition in a size sense.
While ethnic identity is clearly a determinant of something – most strikingly combined
candidate vote shares, to a lesser extent winner vote share in the case of language — this fact
does not support explanations of ethnic voting which contend it will occur when the relative
sizes of relevant ethnic groups renders them likely units of competition. Group size playing an
arithmetic role in determining the importance of ethnic identities requires groups to possess
the ability to unite and rally behind favoured candidates when their size renders such unity an
efficient act. This might not need to be absolute, but it does need to be pronounced.
Otherwise, being in the right sized group offers no advantage. It is no help to a voter to know
that their ethnic group is 40 per cent of the electorate’s population if they also know the
group’s votes are fractured amongst numerous candidates.
Rather, my results suggest ethnic groups (be they language groups or church groups) provide
something akin to the outer bounds of electoral cooperation. It is harder (although clearly not
impossible) for candidates to win support from outside the language or church groups than it
is from within. Yet, at the same time, groups such as language or church groups, in most
instances at least, appear to struggle to coordinate collective electoral action internally.
One obvious possible explanation for this is that clans (rather than churches or language
groups) are the ethnic groups around which electoral politics revolve in Solomon Islands.115 A
weakness of my analysis thus far is that I lack data to apply the tools of large-N analysis to
establish if clan size is correlated with election results. Clans are smaller than language groups
and often smaller than church groups. Also, although the relationship is more complicated
with churches, clans fit tidily underneath language groups as subsets. One language group will
typically be home to a number of clans and clans typically do not cross-cut language groups.
Possibly voters are voting ethnically, along clan lines, and electorates which could fail to
cohere into groups at the language level, could still encompass clan-sized electoral blocs. This
would explain the relatively weak (in a substantive sense) relationship between language
115
A similar explanation would be one that posited villages playing the same role as clans: villages are subsets of language groups and if most candidates win their villages but not much else, this (rather than clans or anything to do with language per se) could explain the correlation between language group shares and total language group vote shares. As I show in Chapter 8, villages are certainly very important arenas of electoral competition. However, such a village to candidate to vote share hypothesis does not fit the Solomon Islands case. First, as I showed in Chapter 3, official data report there being between 5,000 and 6,000 villages in Solomon Islands. Yet in 2010 only just over 500 candidates stood. Even if one allows that a significant number of villages in the official figure were actually only hamlets there are (see Footnote 7 in Chapter 3) still more than 4,000 villages — many more villages than candidates. Secondly, as I showed in Chapter 4 many candidates, and most major candidates, win support across geographically dispersed areas (i.e. more than one village).

154
group size and winner vote share, and would also fit with the more striking association
between group size and combined candidate vote share. There is, as we shall see in the next
chapter, an element of truth in this explanation. Yet even this explanation brings puzzles. The
first is that clans, as I discussed earlier in this chapter, like any other demographic feature do
not change size rapidly, yet as I showed, election results change significantly across elections. If
clan voting is occurring it is not doing so in the simple sense of one clan, one candidate. The
second puzzle, if it is indeed clans structuring election results, would be: why this was the case,
when in most instances clans are too small to be optimal units of ethnic competition?
Conclusion
This chapter has found Solomon Islands to be an awkward fit for theories of ethnic voting. The
country is certainly ethnically diverse, and this diversity is broadly commensurate with the
electoral fragmentation present in the country, which suggests voters voting for co-ethnics
might be an explanation for the patterns of electoral politics observed there. Yet careful
analysis of demographic and electoral data suggests the country is at odds with the two main
groupings of explanations of ethnic voting I described in the previous chapter.
The first grouping, involving non-reasoned choice and singular unchanging identities, struggles
to explain why election results in Solomon Islands electorates change so rapidly across time.
The second grouping, involving reasoned choices and multiple and fluid voter identities, on the
other hand, do not seem to be able to explain why larger ethnic groups fail to cohere into
electoral units either nationally or within constituencies.
Even if I start to decouple the various constituent parts of the groupings I still struggle to find
satisfactory fits with Solomon Island electoral outcomes. In particular, positing rational voters
and singular identities still does not fit with fluidity in electoral outcomes, at least not in a way
that easily explains high effective numbers of candidates in Solomon Islands.
The country case remains a puzzle — one I devote the remainder of this thesis to explaining.

155
Chapter 8 – Ethnicity, Brokers and Electioneering in Action
In the preceding chapter I put theory to the test. I compared anticipated results derived from
two major theories of ethnic voting with actual Solomon Islands election outcomes. In both
cases actual outcomes differed from expected ones. Yet it would be premature to conclude
ethnic identity and ethnic ties have no influence on voter behaviour in Solomon Islands. There
is still much evidence suggesting that in some sense they do — evidence from other work on
Melanesian politics and also in the form of the strong association, shown in the previous
chapter, between the size of ethnic groups and the total vote share of all candidates in those
groups. It is hard to see how so strong an association could exist in a country where ethnicity
played no role in electoral politics. There is also the unresolved puzzle of why Duverger’s Law
remains so stubbornly defied in Solomon Islands.
This chapter continues my examination. In it I construct a picture of what actually happens as
candidates vie for support, and as voters decide who to support. I start by describing key
elements of voter behaviour: whether voters are free to choose; what voters seek when they
vote; and why voters prioritise some candidates over others. I then show electioneering in
action, using process tracing to analyse the electoral fates of a number of candidates and MPs
in the constituencies of Aoke/Langalanga, South Guadalcanal and Small Malaita. In each
constituency case I discuss key aspects of the processes I describe. I look at the relative
importance of who the candidate is, and how they perform in campaigning or as an MP. I also
discuss the significance of brokers (interlocutors who help the candidates win votes) as well as
the challenges they pose to candidates. I do all this keeping a watchful eye out for the role
played, and not played, by ethnic identity in structuring competition and contributing to the
choices made by voters.
Ethnic Ties and Relational Ties
Before I start with these descriptions though I need to forewarn the reader that both the
coders of the People’s Survey and my interview respondents often spoke of voting for family
as well as, or instead of, specifically discussing voting for someone from their clan. In part this
is because in Solomon Islands, where ‘family’ means extended family (in a very wide sense),
the two terms are loosely akin to synonyms. They are not, however, exactly equivalent —
family ties (often as a result of marriage) can also cut across clan groups.
This presents a potential problem in that, while clan as defined in Chapter 3 fits well with my
definition of ethnic group, it seems a definitional stretch to claim all familial relationships as
ethnic ties (even if family identity is based on sticky and visible traits). However, while this

156
would be a definitional problem for me were I going to argue that voting in Solomon Islands
was driven by features unique to ethnic identity, this is not the explanation I ultimately offer.
Instead, as I build theory in the next chapter I focus on the role of ties and social rules in
facilitating cooperation. Such ties are equally applicable to discussions of families and clans
(not to mention villages, church groups and among friends). As I discuss in Chapter 9 the
importance of a tie stems not from whether it is truly ethnic but whether and how it works.
For now though the most important ramification is that, reflecting the data, I shift my
terminology slightly to use the broader category of ‘relational’ instead of ‘ethnic’ when
discussing the role of familial and clan-based ties.
The Experiences of Voters
Freedom to Choose?
It is only possible to meaningfully discuss the choices voters make, and whether voters choose
to vote for co-ethnics, if voters are actually free to decide who to vote for.
Reflecting the general findings of other election observation teams from recent elections the
Commonwealth Observer Group mission to the 2010 elections concluded that, despite a
number of procedural problems, “[v]oters were able to express their will freely”
(Commonwealth Secretariat 2010, p. 21). Yet my own interviews revealed a more complicated
picture. For example, when I asked a man and woman whom I interviewed together in Malaita
why they voted for the candidate they voted for, the male interviewee said, “[t]his election I
voted for the candidate who they told me to vote for.” When asked why he replied:
Sometimes the campaign manager [the candidate’s broker in the village] says to you ‘if you vote for the other candidate then I will have to kick you off the land you where you have your garden’. (Interview Mal1).
Such coercion typically appeared small scale, occurring within families or within communities.
In another village a woman I interviewed described her electoral ‘choice’ in the following way:
“Somebody came and told me who to vote for...my cousin brothers forced me” (Interview
Mal3).116,117
Where it occurred voter coercion often seemed tacit and associated with social norms. For
example, the MP for Rennell and Bellona, Seth Gukuna, explained that people voted for
relatives because not doing so would, “cause a big family problem, arguments and rows”
116
The relational term ‘cousin brother’ in Solomon Islands Pijin typically refers to a person’s first cousins. 117
Voter coercion also appeared, on the basis of my interviews at least, to be gendered: many more women told me they were not free to choose than did men.

157
(Interview Seth Gukuna). More violent coercion does occur (for a good example see, Sanga
2005, p. 443), yet it is rare.
Coercion, of course, would seem to require candidates being able to determine whether
individuals actually voted for them or not.118 This ought to be impossible as Solomon Islands
supposedly operates a secret ballot (something that does seem to occur at most polling
stations). In practice candidate knowledge of who did and did not vote for them often
appeared to be afforded (albeit imperfectly) by local village campaign managers who could
ascertain with a reasonable degree of certainty who people voted for through village gossip.
Beyond candidates actually knowing, coercion also appeared to be facilitated by the fact that
many voters believed candidates could access ballot information through flaws in the electoral
system. This belief is actively propagated by candidates and is probably (but not certainly)
false. However, because all that is required to enable coercion is voters believing candidates
can find out, even though it is likely erroneous the belief alone appears to be sufficient in many
instances to achieve the desired effect.
While talk of coercion was common it was also clear that many voters were still free to choose.
In West New Georgia constituency, for example, when I asked an interviewee why Gloria
Sibisobere (a candidate in 2010) did well in the interviewee’s polling station she attributed it to
women voters. When I then asked about their freedom to choose, she replied voting was:
“Our [women’s] own choice. We choose ourselves. For some women I don’t know, but for us
[women in her community] we choose” (Interview Wes1) .
Without good large-N data it is impossible to tell with certainly what proportion of the
population are free to choose. Although the 2011 People’s Survey conducted by RAMSI asked
voters why they voted for the candidate that they voted for (ANU Enterprise 2011, p. 135), and
while 4.9 per cent of respondents said they voted for the candidate that they voted for
because they were told to, owing to issues of social desirability bias this is almost certainly an
underestimate.119 Yet while coercion is likely to be a significant issue in Solomon Islands, there
are still sufficient electoral choices being made to allow meaningful discussion of voter choice.
Even if the People’s Survey was understating coercion by a factor of 10, it would still be the
118
This is also true of vote buying and clientelism more generally — it is hard to target resources to supporters if the MP does not actually know with reasonable certainty who they are. 119
This is the figure reported in the People’s Survey itself. When respondents were asked the question of why they voted for the candidate they voted for they were allowed three replies (although not all respondents made use of all three). The figure provided in the People’s Survey appears to be the number of respondents who stated they voted as told in any of their three responses divided by the total number of respondents who provided any answer to that question. Later in this chapter I use a different method for calculating voter responses. The percentage responding that they were coerced using the later method was higher but still less than 10 per cent.
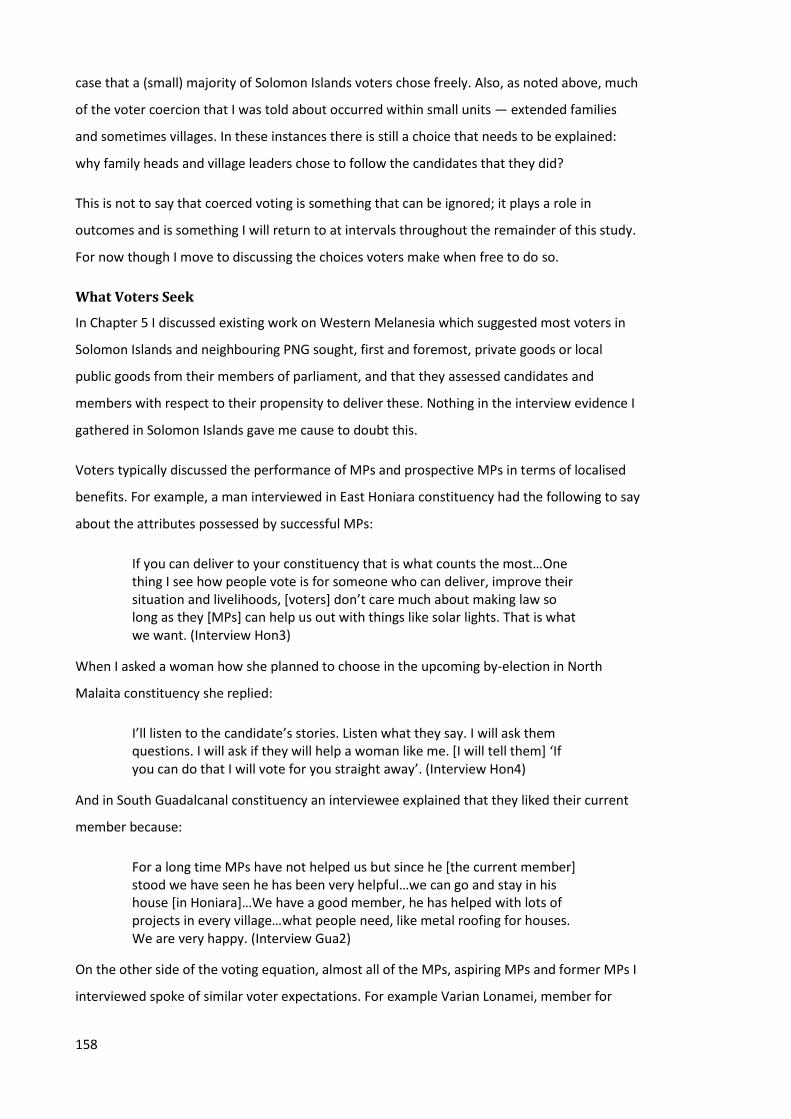
158
case that a (small) majority of Solomon Islands voters chose freely. Also, as noted above, much
of the voter coercion that I was told about occurred within small units — extended families
and sometimes villages. In these instances there is still a choice that needs to be explained:
why family heads and village leaders chose to follow the candidates that they did?
This is not to say that coerced voting is something that can be ignored; it plays a role in
outcomes and is something I will return to at intervals throughout the remainder of this study.
For now though I move to discussing the choices voters make when free to do so.
What Voters Seek
In Chapter 5 I discussed existing work on Western Melanesia which suggested most voters in
Solomon Islands and neighbouring PNG sought, first and foremost, private goods or local
public goods from their members of parliament, and that they assessed candidates and
members with respect to their propensity to deliver these. Nothing in the interview evidence I
gathered in Solomon Islands gave me cause to doubt this.
Voters typically discussed the performance of MPs and prospective MPs in terms of localised
benefits. For example, a man interviewed in East Honiara constituency had the following to say
about the attributes possessed by successful MPs:
If you can deliver to your constituency that is what counts the most…One thing I see how people vote is for someone who can deliver, improve their situation and livelihoods, [voters] don’t care much about making law so long as they [MPs] can help us out with things like solar lights. That is what we want. (Interview Hon3)
When I asked a woman how she planned to choose in the upcoming by-election in North
Malaita constituency she replied:
I’ll listen to the candidate’s stories. Listen what they say. I will ask them questions. I will ask if they will help a woman like me. [I will tell them] ‘If you can do that I will vote for you straight away’. (Interview Hon4)
And in South Guadalcanal constituency an interviewee explained that they liked their current
member because:
For a long time MPs have not helped us but since he [the current member] stood we have seen he has been very helpful…we can go and stay in his house [in Honiara]…We have a good member, he has helped with lots of projects in every village…what people need, like metal roofing for houses. We are very happy. (Interview Gua2)
On the other side of the voting equation, almost all of the MPs, aspiring MPs and former MPs I
interviewed spoke of similar voter expectations. For example Varian Lonamei, member for

159
Maringe Kokota constituency, when asked what voters assessed his performance on, stated
that:
[T]hey look at what they benefit from. They don’t see if you have contributed to the national economy or contributed to national affairs. They will tend to say, ‘oh you are a good member if you provide that for me’. (Interview Varian Lonamei)
And Frank Bollen Pule, a former MP from Nggela replied to the same question that:
Their interest mainly lies in the assistance that you render to them. Individual assistance is what they want. They are happy to see you assist with churches and other communal projects, but they still rather you assist them with individual projects. Maybe in the form of canteens [small stores] or pigs…and outboard motors. (Interview Frank Bollen Pule)
Likewise, Silas Tausinga, MP for West New Georgia, replied that:
They don’t judge you much on the national level, how you perform at the national level. It goes more on the level of what you do for the constituency, and particularly what you do for the village and for them on a personal level, in terms of they receive some help from you or [inaudible] or if they receive any money generating projects from you. (Interview Silas Tausinga)
Occasionally I received responses from politicians that qualified the preference for the local to
a degree. For example, in the urban (and somewhat atypical) electorate of East Honiara MP
Douglas Ete answered the question of what level of support voters sought by saying that:
It depends…For the Burns Creek area, what you do for them. For my relatives here, what you do for them. For the people of Naha, the working class [people in formal employment]…what you do for the country. (Interview Douglas Ete)
Yet while it might be overstatement to say that all Solomon Islands vote in search of local
benefits, the available evidence suggests most do.
How Voters Choose
With voters primarily seeking localised benefits, the next question to be asked is, ‘how do they
decide who is most likely to help?’
Survey Data
Survey data available to me — in the form of responses to the question asked in the 2011
People’s Survey, ‘why did you choose the candidate you voted for?’ — suffer limitations. First,
as discussed above and at length in Chapter 2, social desirability bias makes it likely certain
types of responses will be underreported. This is likely the case with vote buying (Gonzalez-
Ocantos et al. 2012) and voting along clan lines (Posner 2005), and seems likely for coerced

160
voting too. Also, in the 2011 People’s Survey, respondents were offered three replies to this
particular question. This presents a dilemma: presumably factors mentioned in second and
third responses were less important to voters, but how much so? In addition, the question was
asked in an open-ended manner (with responses subsequently coded by Solomon Islanders
contracted by the surveyor). Confronted with an open-ended question a large number of
respondents provided replies that were too general to be meaningful. For example, 23.63 per
cent of respondents offered as their first response responses that were coded as, “a good
person/I like him or her/I trust him or her?” This may well be true, but it deprives us of the
crucial information as to why they feel this way. Do they like the candidate or think they are a
good person because they have helped in the past? Do they trust them because they are from
the same clan? Or do they have other reasons for their sentiments?
To overcome these challenges as best as possible I took data provided to me by the authors of
the People’s Survey, aggregated by response and reply, and removed general responses such
as ‘voted for candidate because they were a good person’ and ‘candidate made good
promises’ from the data, restricting my data subset to only those responses that were specific
about candidate attributes.120 I also focused solely on respondents’ first reply, dropping
subsequent replies on the basis that the first response offered is likely to have captured the
most significant determinant of voters’ choices.121 The results are shown below in Figure 8.1.
This is far from optimal. Far better to have known exactly why voters liked or trusted certain
candidates, or why they found their promises appealing, and to be confident social desirability
bias has not skewed the data. For these reasons it would be mistaken to read too much into
the exact proportions I have calculated. Nevertheless Figure 8.1 affords some sense of the
most common reasons voters have for voting for the candidates they vote for in Solomon
Islands elections.
The most prevalent responses fall across two broad categories: those involving relational,
identity-based ties, typically to do with clan or family, locality and church; and those involving
candidate attributes and deeds.122
120
A full list of responses including those I removed can be found on p. 135 of the 2011 People’s Survey. 121
When I do not do this and sum responses across all three replies I obtain very similar results, although candidates’ education is much more frequently offered as a second or third reply, causing it to rise significantly in rank. And, while the degree of gain is less, church is also afforded a higher rank if all three replies are included. 122
The authors of the report use the word tribe instead of clan but, as used in the report, the terms can be treated as synonyms.

161
Figure 8.1 – Responses to People’s Survey Question about Voter Choice
Chart notes: n=1445 (this equals the total number of respondents who made any of the above responses in their first reply). Source data provided by the authors of the 2011 People’s Survey.
Another limitation of survey data is that they afford little insight into why people vote for
candidates they share relational ties with, or for candidates who have done good deeds. Here,
however, my interview data can help. Reassuringly, my interviewees provided descriptions of
electioneering and voter choices similar to those found in the survey responses. This suggests
my interview data are broadly representative and provides the opportunity to use the data to
add depth.
Significantly, as interviewees discussed voting, they revealed considerable overlap between
the two categories of response I highlighted in the survey data (identity based ties and
candidate deeds), and also a shared logic in the way they were thought about. Interviewees
suggested that candidates who helped in the past were typically voted for because they were
thought likely to help again. And a similar explanation was given for clan voting and voting for
relatives: people voted for candidates who they had relational ties with because they thought
them more likely to help if elected.
He/she has done good work in my community,
30.74%
From my family / tribe, 14.82%
He/she has helped me /my family, 11.41%
He or she gave me money or gifts, 9.90%
I was told to vote for him or her, 8.67%
From my village / community / know him
well, 7.24%
Well educated, 6.28%
My church /church of family / good church
man, 5.74%
I like that political party / policies, 2.25%
I thought he or she would win, 1.37%
Good vision for the country, 1.30%
Has money, good businessman / owns a
business, 0.27%

162
Relational Ties and Anticipated Assistance
The response of an interviewee from Central Guadalcanal constituency — a former candidate
who also worked on the campaign team of the runner up in the 2010 election — when asked
why voters voted for candidates with whom they shared relational ties illustrates this well:
[I]n this country one thing that is very big is nepotism. So voters go for clan, or voters go for friends, or voters go for those who they know, or voters go, ‘this man has always helped me, I’ll pay him back and vote for him because he always gives me something’. (Interview Gua3)
Similarly, when I asked a former candidate from Makira why voters went for candidates who
had helped them previously he said:
It talks about your character. It shows you are a kind person. And if you were voted in you would be in a position of assisting them. As we were saying they really go for things on a personal level. (Interview Hon10)
In Small Malaita constituency a community leader offered a similar reply, adding church to the
list:
Some people vote for relatives. Some people vote for their candidate for religion: SDA [Seventh Day Adventist] or SSEC [South Seas Evangelical Church]. That’s how I see it. In Solomon Islands elections people follow, they don’t look for the right man, they look for relatives or friends if you’re good for me, then I’m good for you. (Interview Mal6)
And when I asked why people vote this way:
Voters look for their wantoks [people whom they share relational ties with] or their friends [inaudible] their thinking is, ‘relatives it’s easy to ask them for a little bit of assistance’. (Interview Mal6)
In Aoke/Langalanga a community leader demonstrated the same logic in explaining why
people in his community did not vote for a particular candidate. When asked why no one voted
for a particular candidate who had no ties to them he replied: “He is Anglican, we are Catholic.
He is Kwara’ae, we are Langalanga. He lives too far away. Certainly if he wins he will forget
about us” (Interview Mal7).
An important aspect of relational voting which emerged from my interviews was that, at least
in the case of non-coerced voting, voting along relational lines was strongly conditional on
assistance. Voters might be more likely to vote for someone from their clan but only if they
had proven helpful in the past. For example an interviewee in Aoke/Langalanga constituency
said that:
In clans the thing we look for most [when thinking about voting] is whether that relative is a kind person, because that one he’ll give you more [when he’s a MP]…I’ve heard some people within this community when their

163
relative has stood as a candidate say ‘we won’t vote for this man because he hasn’t helped us’. (Interview Mal5)
The Consequences of Ignoring Relational Ties
While many voters appeared to vote the way they do in search of benefits from prospective
MPs, in some instances their choices are made not in the hope of improvement but rather with
the intention of staving off negative consequences.
For example, echoing Seth Gukuna’s description above of voter coercion within relational
groups in Rennell and Bellona, an interviewee in Malaita described their decision to vote for a
candidate in the following way:
I did this because the candidate was a relative…It’s usual practice here. If a relative stands, a close one, people vote for him…if someone’s close [related] to you, you have to vote for them. If you don’t it will cause problems or a row. (Interview Mal2).
In some instances votes for relatives were not cast through fear of violent retribution but for
fear of withheld assistance. Now the same relational ties and norms of reciprocity that render
candidates from voters’ clans more likely to assist if elected become important in a different
way. Candidates in Solomon Islands elections tend to be wealthier individuals (Corbett and
Wood 2013) who are often, regardless of election results, people whose help ordinary
Solomon Islanders seek when in need. In Solomon Islands norms of familial or clan-based
reciprocity often require wealthier members of relational groups to provide assistance to other
relatives (Allen et al. 2013). Yet if a voter defects from their own normative obligations the
candidate may feel absolved of the obligation to assist in the future. And through this the
voter risks losing regardless of the election outcome itself. After explaining how candidates
learnt who voted for them, a candidate from Gao Bugotu constituency explained people’s
propensity to vote for relatives in this way:
People are afraid: if I do not vote for him, he will know I did not vote for him. And he will not give me money. He will not assist me. That is the fear people have. So they vote because he is a relative. Sometimes they vote because if he finds out he will be cross, and he won’t give assistance. (Interview Isa3)
Elections in Action
Taken together, the above insights provide building blocks for understanding voter behaviour
and electoral politics, and for understanding the role ethnic and other relational ties play. Yet a
full picture requires more — it needs description of the various components in action. In the
following section I provide this, working through examples of candidates and constituencies.

164
Aoke/Langalanga – Campaigns and Kampain Mastas
The constituency of Aoke/Langalanga sits on the western side of Malaita. It comprises Auki,
the provincial capital, with a population of 5,105 in 2009 (Solomon Islands National Statistics
Office 2012, p. 6), and the rural ward of Langalanga — a thin strip of land on mainland Malaita
plus the islands of Langalanga lagoon.
Aoke/Langalanga is Solomon Islands’ fourth smallest electorate in land area, though the Auki
urban area means it is only the 13th smallest electorate in population. (For a table of
electorate characteristics for all electorates see Appendix 3).
Table 8.1 below shows the three largest language groups and church denominations in the
constituency. The relatively high proportion of the population that gave Pijin as their first
language stems from migration into Aoke. Excluding urban migrants, there are something in
the vicinity of 20 to 30 clans in the constituency. Movement over time, stemming from
population pressures and other issues, means the clans are typically located in several villages,
although they are not strongly geographically cross-cutting in the way that clans are in
Guadalcanal (Interview Mal7).
Table 8.1 – Major Languages and Churches in Aoke/Langalanga
Language Population
Share (%) Church Population
Share (%)
Langalanga 53.53 Roman Catholic 37.56
Kwara’ae 15.87 South Seas Evangelical Church 31.05
Pijin 10.53 Church of Melanesia 10.86
Table notes: language groups from 1999 census, churches from 2009 census.
The electorate’s sitting MP, Matthew Wale, won office for the first time in the 2008 by-
election following Batholomew Ulufa’alu’s death and successfully defended his seat in 2010.
Table 8.2 below shows full election results for the last three elections in the electorate, and
provides details on the winning candidate in all elections back to the constituency’s formation
in 1993.
If ever there was an instance where a candidate might expect to win on the basis of their
national performance, Matthew Wale in Aoke/Langalanga was it. Prior to standing Wale was a
civil society activist (Fraenkel 2008) and played a significant role in peace-building efforts
during the Tensions (Moore 2004). As an MP Wale has been very active in national
governance, is a former Minister of Education, is the parliamentary leader of Solomon Islands
Democratic Party (Solomon Star News 2011), and has taken a strong and generally well-
regarded anti-corruption stance in parliament. Furthermore, in 2001, Aoke/Langalanga did in a
sense vote nationally, rallying behind Batholomew Ulufa’alu, who had been removed as prime

165
minister in a coup, re-electing him as their MP with 65.95 per cent of the vote (Moore 2005;
also Interview Mal5).
Table 8.2 – Election Results, Aoke/Langalanga
Year Candidate Votes Vote Share (%)
2010 Mathew Cooper Wale 1,681 36.71
Billy A. Manu 1,512 33.02
Tony Wale 1,000 21.84
Richard Ulufa’alu 186 4.06
Rejected Votes 74 1.62
Judy Kwatena Fionala Barty 63 1.38
Frank Bosi 63 1.38
2008 Mathew Cooper Wale 1,608 29.87
Billy A. Manu 1,022 18.99
David Faradatolo 937 17.41
Hellen Osi Huniehu 672 12.48
Billy Gizo Saenamua 454 8.43
Peter Clyde Mamisau 311 5.78
Abraham Willie Waleualo 214 3.98
Meshach Maebiru Maetoloa 63 1.17
Robert Wales Feraltelia 51 0.95
Rejected Votes 40 0.74
Robert Henry Alufurai 11 0.20
2006 Batholomew Ulufa’alu 1,523 34.90
Mathew Cooper Wale 1,032 23.65
Rachel Fera 555 12.72
Arthold Matanani 315 7.22
Peter Baru 280 6.42
Abraham Baeanisia 161 3.69
Peter Obadae Koti 138 3.16
Benjimen Fagasi 111 2.54
Sudani Walemae 61 1.40
Rejected Votes 59 1.35
Alfred Polard Ludae 36 0.82
Chris Karau 32 0.73
John Paul Dio 31 0.71
Philip Jack Aru 30 0.69
2001 Batholomew Ulufa’alu 3,081 65.95
1997 Batholomew Ulufa’alu 1,341 41.59
1993 Francis Joseph Saemala 1,139 50.42
Yet in Aoke/Langalanga I did not find national performance based voting. Rather, I came across
forms of electioneering and voter decision making effectively identical to those elsewhere in
Solomon Islands. And, although Wale himself thought his constituents placed some value on
national performance (Interview Matthew Wale), it was clear from interviews throughout the
constituency that the lion’s share of his electoral support, and of the electoral support of all
candidates, was earned on the basis of relational ties, campaigning and local performance. Not
once did I hear Wale appraised by voters on his role in national politics. His supporters touted
what he had done locally and his detractors bemoaned the fact that he had done little.
Figures 8.2, 8.3 and 8.4 below show polling station results for the 2006 national election, the
2008 by-election and the 2010 national election. In the charts I have highlighted in colour first

166
and second place getters as well as other candidates of interest. Everyone else is shown in
greyscale. Polling stations are arranged approximately north to south (left to right across the X
axis).
Figure 8.2 – Aoke/Langalanga Results by Polling Station 2006
Figure 8.3 – Aoke/Langalanga Results by Polling Station 2008
0
100
200
300
400
500
600
Alo
ta'a
Au
ki C
ou
rt H
ou
se
Agr
icu
ltu
re 1
Mal
aria
Lab
(K
wai
bal
a)
Wo
rks
Off
ice
(Kw
aib
ala)
Du
kwas
i
Am
bu
1
Am
bu
2
Oib
ola
Dao
lusu
Tala
kali
Lala
na
On
e (1
)
Lala
na
Two
(2
)
Bu
su
Rad
esif
ola
mae
Ab
alo
lo
AUKI LANGA LANGA
Philip Aru
John Dio
Chris Karau
Alfred Ludae
Sudani Walemae
Rejected Votes
Benjimen Fagasi
Peter Koti
Abraham Bae.
Peter Baru
Arthold Matanani
Rachel Fera
Mathew Wale
B. Ulufa'alu
0
100
200
300
400
500
600
Alo
ta'a
Au
ki C
ou
rt H
ou
se
Agr
icu
ltu
re 1
Mal
aria
Lab
(K
wai
bal
a)
Wo
rks
Off
ice
(Kw
aib
ala)
Du
kwas
i
Agi
cult
ure
2
Am
bu
1
Am
bu
2
Oib
ola
Dao
lusu
Tala
kali
Lala
na
On
e (1
)
Lala
na
Two
(2
)
Bu
su
Rad
esif
ola
mae
Ab
alo
lo
AUKI LANGA LANGA
Robert Alufurai
Rejected Votes
Robert Feraltelia
MeshachMaetoloaAbrahamWaleualoPeter Mamisau
Billy Saenamua
Hellen Huniehu
David Faradatolo
Billy A. Manu
Mathew Wale

167
Figure 8.4 – Aoke/Langalanga Results by Polling Station 2010
Chart notes: the total votes cast in several polling stations change significantly across elections. In some instances, such as the rise of Alota’a in 2008 this appears to have been a result of certain villages being reallocated from one polling station to another and possibly the presence of a popular local candidate increasing turnout.
Relational Ties in Aoke/Langalanga
As elsewhere in Solomon Islands clan and similar relational ties are important in
Aoke/Langalanga. Both Ulufa’alu and Tony Wale (highlighted pale green in 2010), for example,
were from villages towards the southern end of Langalanga lagoon and, reflecting this, their
support was highest in polling from near this area, where their relational ties were most dense
(Interview Mal7; Interview Matthew Wale).123,124 Meanwhile Matthew Wale did best in the
coastal Ambu polling station, his home village. Yet he also benefitted from having relational
connections in other parts of the electorate too, such as maternal ties in the large village of
Lilisiana, the largest village in the Alota’a polling station (Interview Matthew Wale).
However, simple arithmetic suggests relational ties cannot alone be determining election
results, or even that they could be directly determining a significant share of results. As noted
above, excluding immigrants to Auki, there are between 20 and 30 clans in the constituency. A
situation in which, even allowing for candidates being able to leverage several relational ties
(for example, winning the votes of relatives of their mothers), group-based ties alone could not
nearly be enough to directly win an election. And while larger groupings such as language
123
Tony Wale is not related to Matthew Wale. Their shared surname is common throughout the constituency and literally means ‘man’ in the Langalanga language. 124
In addition to his clan connections in southern Langalanga Ulufa’alu also benefitted from some ties closer to Auki.
0
100
200
300
400
500
600
Alo
ta'a
Au
ki C
ou
rt H
ou
se
Agr
icu
ltu
re 1
Mal
aria
Lab
(K
wai
bal
a)
Wo
rks
Off
ice
(Kw
aib
ala)
Du
kwas
i
Agi
cult
ure
2
Am
bu
1
Am
bu
2
Oib
ola
Dao
lusu
Tala
kali
Lala
na
On
e (1
)
Lala
na
Two
(2
)
Bu
su
Rad
esif
ola
mae
Ab
alo
lo
AUKI LANGA LANGA
Frank Bosi
Judy Barty
Rejected Votes
Rich. Ulufa'alu
Tony Wale
Billy A. Manu
Mathew Wale

168
would, in the case of the Langalanga language at least, be better suited in terms of size to
forming electoral coalitions, in Aoke/Langalanga, as in the rest of the country, they do not
normally function as electoral blocs: there were five Langalanga candidates in 2010.
Candidate Deeds in Aoke/Langalanga
Deeds, as would be expected on the basis of the survey data presented above, added to
relational ties. Billy Manu, a Kwara’ae speaker, albeit one with strong Langalanga connections,
gained support through helping — over an extended period of time — people with resources
such as water tanks, and Tony Wale benefitted from a reputation established while working
for an aid donor. Tony Wale also won some votes in Lilisiana by paying the village’s water bill.
Similarly Matthew Wale’s constituency development fund spending won him some votes
(although in his situation was more complex as we shall see) (Interview Mal7).
Brokers and Betrayers in Aoke/Langalanga
Relational ties to voters, along with deeds, were important; however, there was an additional,
crucial element to electioneering, not previously described in work on elections in Solomon
Islands and only briefly mentioned in work on Papua New Guinea, which I encountered in
Aoke/Langalanga, and which I discovered repeated throughout the country: the use of local
village vote brokers to win support. In Aoke/Langalanga brokers were referred to with the Pijin
terms agent, kampain masta and kampain manaja.125
The importance of village brokers was emphasised by candidates everywhere and they were
clearly important in Aoke/Langalanga. As a senior figure in Matthew Wale’s campaign team
put it of their 2010 campaign strategy, “we believed that with more managers, there would be
more supporters” (Interview Mal8).
A sense of the significance of brokers can be gathered from a polling station in southern
Langalanga where a local leader defected from Matthew Wale’s camp prior to the 2010
election to join Billy Manu after falling out with Wale. Wale and Manu’s combined share of the
votes cast at the polling station remained almost identical across both elections (41.3 per cent
in 2008; 41.4 per cent in 2010). Yet Wale’s polling station vote share fell by 14 percentage
points, while Manu’s rose by 14 percentage points. While it is impossible, without
sophisticated voter surveys or similar tools, to state definitively that this shift was as a result of
125
While the use of local brokers has not been discussed in significant detail in the Western Melanesian context it is, of course, something that is well described in international work on clientelist politics, (Stokes, Dunning et al. 2013) a point I return to at the end of this chapter. While a range of different terms are used in relevant work I use the term ‘broker’ from Stokes and Dunning et al. as theirs is the most substantive treatment of the phenomenon from recent years and, as such, it seems likely their terminology will become the norm in Political Science work. Interestingly, Corbett (forthcoming) describes brokers, or something very similar (he calls them ‘local gatekeepers’) in action in a variety of countries around the Pacific.

169
Wale losing the broker, it seems likely — particularly as I conducted interviews around the
polling station and heard no other obvious explanation for the change.126
In Aoke/Langalanga, as elsewhere in the constituency, brokers performed two central tasks:
they provided information about support levels, and what voters sought; and, more directly,
they won candidates votes.
On the first of these tasks, Matthew Wale’s team showed me polling data, tables of how many
votes they expected to win in each village derived from information from agents, with a senior
member of their campaign team stating that:
During those weeks of campaigning we usually get information and we always update. All of the campaign managers [tell us] ‘this community we have so much support here’, percentage like this, this one like this…If we are to win we already know we will win. (Interview Mal8)
This information turned out to be reasonably accurate in most, but not all, villages. On the role
of agents in providing information more generally Wale stated that:
They [brokers] pick up, they suck up information; they pass it on to me. [So that] when I go to a village I know who is where on what issues and what will make somebody come out of their shell, and I am able to respond to that more meaningfully, if it is something I am able to respond to. (Interview Matthew Wale)
The informational advantage offered by brokers is obvious: owing to their familiarity with
networks and village discussions brokers are in a better position than outsiders to assess
support and what villagers seek.
Broker vote winning, in turn, occurred through three mechanisms: brokers in some instances
serve as conduits of money and other goods used to attain voters’ support; brokers in other
instances were able to coerce voters into supporting favoured candidates, winning support
through fear of retribution or fear of withheld assistance; and in other cases brokers won votes
through persuasion, by convincing voters that the candidate was worth supporting.
Reliable evidence of brokers gaining votes by delivering inducements was hard to come by. It
was easy to find interviewees eager to allege their opponents guilty of vote buying, yet too
much credence cannot be placed in such claims, as they may simply be attempts to tarnish the
reputation of opponents. More plausible were instances when brokers and campaign team
members spoke of their own vote buying. In Aoke/Langalanga I interviewed one senior
126
Wale had not, for example, neglected the villages in question. In the village I stayed at he had re-roofed the local church. And while this southern area of the lagoon was base for a strong new candidate in the form of Tony Wale, the combined vote share of Matthew Wale and Billy Manu did not change.

170
campaign organiser who tacitly conceded vote buying on behalf of his team stating simply
that, “all the camps do it” (Interview Mal9). And one broker I interviewed explained to me why
dispensing money made his job as a broker easier. In the eyes of voters, “[y]ou become more
influential if you give a little bit of money” (Interview Mal10).
As with vote buying, coercion involving the fear of retribution from brokers was something
that was hard to get direct evidence of, yet it occurred. The quote provided earlier in this
chapter, describing threats of eviction from gardens was from Malaita (although I cannot
reveal the electorate for fear of revealing the interviewees’ identity) and in Aoke/Langalanga I
was told by one campaign team member of voter coercion by an opponent in some villages.
While such allegations are not on their own strong evidence, when I interviewed people in the
area in question I heard confirming stories (Interviews Mal9 and Mal11).
Convincing voters is an obvious role for brokers. In elections where voters seek personal
benefits, where candidates may not be well known to voters (a particularly acute problem for
new candidates and in villages further away from candidates’ home villages), where news
media penetration is not high, and where many voters live almost all their lives in one place, a
local representative possesses advantages. As one of Billy Manu’s brokers explained:
In the case of the candidate not living in the village it helps for the agent to spread the word on his behalf. If the candidate comes and gives a talk he is looked at more like a stranger or something. So it’s better that he goes through somebody in the village. (Interview Mal7)
While a broker for Tony Wale described his role as:
Having to bring people together here. I have to talk to them. And strengthen their desire to vote for Tony…Describe the candidate’s character and talk about the candidate. When you do this you will convince people. In the campaign when you’re a campaign manager for a candidate you must describe their character, tell people they are good, that they can help us. (Interview Mal12)
As might be expected not all villagers are equal in their ability to coerce or persuade, and Billy
Manu’s broker described the characteristics candidates sought in brokers in southern
Langalanga:
The candidate will try and select who in the village is a respected person, a community leader or something like that, a chief. It all depends on the people [potential brokers] themselves though…Sometimes even though you are a village leader people don’t listen to you. (Interview Mal7)
In urban, multi-cultural Auki the situation was similar. Candidates worked through brokers
there too. Peter Baru, the member of Matthew Wale’s team in charge of campaigning in Auki

171
explained they tried for brokers from each of the language groups present in the town. Then,
using the example of the To’abaita language group he explained that:
First and foremost we have to make sure this man we choose for To’abaita people is respected by these people. For example, a church leader within that area for those people. (Interview Peter Baru)
These were qualities I was to hear repeated, with minor variations, throughout
Aoke/Langalanga and around the country. A good broker needed to hold influence, one way or
another, over a significant number of voters. This did not always mean candidates using formal
village leaders (chiefs or big men) or church leaders. In some instances formal leaders do not
hold much sway over voters. In other cases, where formal leaders were already spoken for by
particular campaigns, other candidates would have to resort to people such as youth group
leaders or heads of large families.
Time and time again candidates emphasised the importance of brokers. Yet, in
Aoke/Langalanga and around the rest of the country, finding and keeping good brokers was
not easy. The story of Arthold Matanani, a candidate in 2006, illustrates this well. Matanani
was a Kwara’ae speaker from the inland village of Dukwasi, and a well-regarded employee of
the Church of Melanesia. With the reputation his work afforded him he was a credible
candidate and won almost 66 per cent of the votes in Dukwasi. Yet elsewhere he polled poorly.
Although he finished fourth, he received barely one fifth of the votes won by Ulufa’alu.
Discussing this he told me:
All my campaign managers or workers they did not only work for me. They also worked for other candidates trying to get [inaudible]. So they come and they tell very good stories: “in this village I’ve already got these people”. And provide a list for you. But they are not very trustworthy. As you pay them they will go out and try and get money from other candidates…According to all the reports I received I thought I was going great, I was doing great. But then the actual thing was how honest the campaign workers were…They were, all of them were, trying to milk as much money to help their families and all that. (Interview Arthold Matanani)127
Broker disloyalty it became clear, both in Aoke/Langalanga and elsewhere, was something that
plagued almost all candidates. An interviewee from Billy Manu’s campaign team told me they
had three brokers defect in his part of the constituency (Interview Mal7) and when I asked
Matthew Wale about brokers defecting he said it, “happens a lot, and you never can tell”.
127
While Matanani mentions money here, in the interests of fairness it is important to stress he is not specifically talking about vote buying. Money given to brokers can simply be an allowance or pay for their work for the campaign — not necessarily money to disburse to voters.
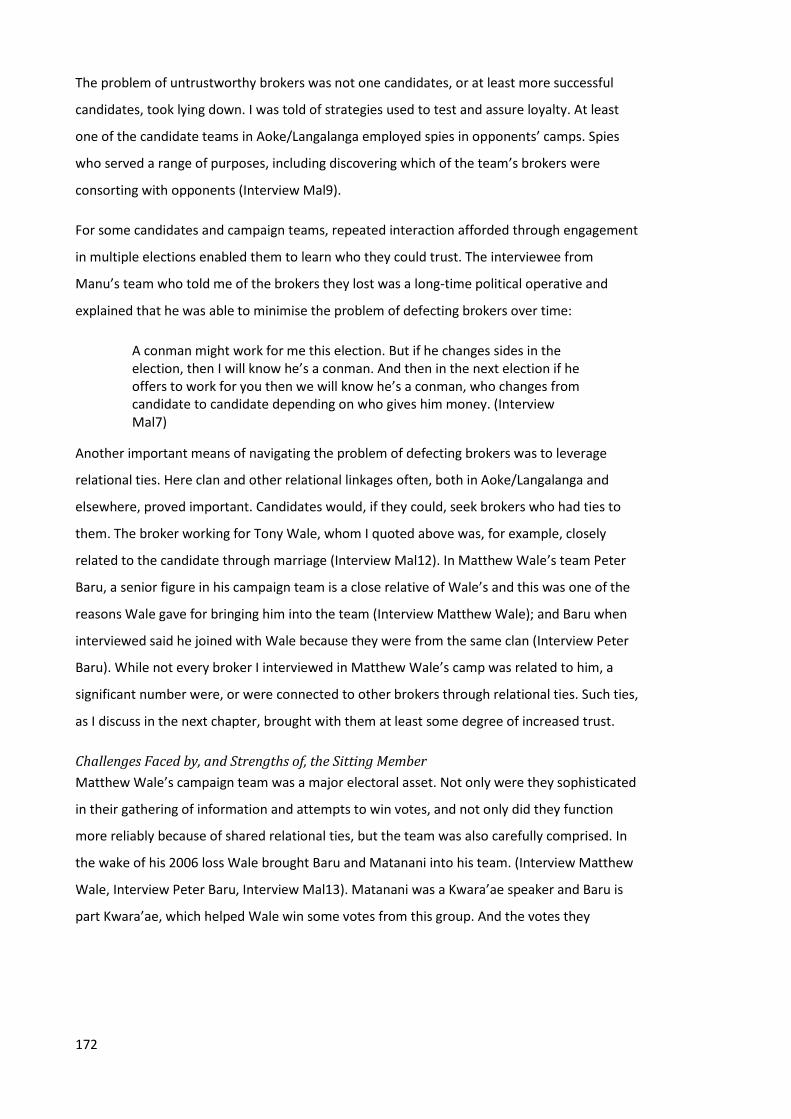
172
The problem of untrustworthy brokers was not one candidates, or at least more successful
candidates, took lying down. I was told of strategies used to test and assure loyalty. At least
one of the candidate teams in Aoke/Langalanga employed spies in opponents’ camps. Spies
who served a range of purposes, including discovering which of the team’s brokers were
consorting with opponents (Interview Mal9).
For some candidates and campaign teams, repeated interaction afforded through engagement
in multiple elections enabled them to learn who they could trust. The interviewee from
Manu’s team who told me of the brokers they lost was a long-time political operative and
explained that he was able to minimise the problem of defecting brokers over time:
A conman might work for me this election. But if he changes sides in the election, then I will know he’s a conman. And then in the next election if he offers to work for you then we will know he’s a conman, who changes from candidate to candidate depending on who gives him money. (Interview Mal7)
Another important means of navigating the problem of defecting brokers was to leverage
relational ties. Here clan and other relational linkages often, both in Aoke/Langalanga and
elsewhere, proved important. Candidates would, if they could, seek brokers who had ties to
them. The broker working for Tony Wale, whom I quoted above was, for example, closely
related to the candidate through marriage (Interview Mal12). In Matthew Wale’s team Peter
Baru, a senior figure in his campaign team is a close relative of Wale’s and this was one of the
reasons Wale gave for bringing him into the team (Interview Matthew Wale); and Baru when
interviewed said he joined with Wale because they were from the same clan (Interview Peter
Baru). While not every broker I interviewed in Matthew Wale’s camp was related to him, a
significant number were, or were connected to other brokers through relational ties. Such ties,
as I discuss in the next chapter, brought with them at least some degree of increased trust.
Challenges Faced by, and Strengths of, the Sitting Member
Matthew Wale’s campaign team was a major electoral asset. Not only were they sophisticated
in their gathering of information and attempts to win votes, and not only did they function
more reliably because of shared relational ties, but the team was also carefully comprised. In
the wake of his 2006 loss Wale brought Baru and Matanani into his team. (Interview Matthew
Wale, Interview Peter Baru, Interview Mal13). Matanani was a Kwara’ae speaker and Baru is
part Kwara’ae, which helped Wale win some votes from this group. And the votes they

173
brought with them were a source, although not the only source, of Wale’s increase between
2006 and 2008 (Interview Matthew Wale).128
On the other side of the ledger, Wale’s most visible electoral impediment was the challenges
he faced in working as an electorate MP. Wale was an active national politician; consequently
he spent little time in his electorate, relying instead on his Constituency Development Officer
(CDO), an employee responsible for managing government funds for the electorate and,
initially at least, on community representatives (often drawn from his brokers) to dispense
projects and support to voters.129 Yet this approach was fraught: interviewees both from inside
and outside Wale’s camp thought he needed to take a more hands-on approach and ensure
constituents saw tangible benefits from constituency funds (Interview Mal7; Interview Mal14;
Interview Mal26). Doing this from a distance clearly was not easy, and his absence left Wale
vulnerable to the actions of unreliable interlocutors. Two interviewees (one an opponent and
one a supporter of Wale) alleged there were problems with Wale’s CDO (Interviews Mal7 and
Mal26) although Wale stated he trusted him. A further undisputed and significant problem
was the challenge of dispensing goods at the village level, as appointed agents often
appropriated or mismanaged funding (Interview Mal8).
South Guadalcanal – the Importance of MP Performance
Despite these challenges, which were to prove far from unique to Aoke/Langalanga, Matthew
Wale increased his vote share by 6.8 percentage points during his time as member between
2008 and 2010. This was a significant gain, particularly in a country where roughly 50 per cent
of MPs lose their seats each election, yet some MPs did better still. In South Guadalcanal David
Day Pacha more than doubled his vote share between 2006 and 2010.
South Guadalcanal lies at the centre of Guadalcanal’s southern Weather Coast. The electorate
sits on the same island as Honiara, yet geography in the form of a steep dividing range and a
lack of natural harbours, renders it remote. There are no roads within the electorate and the
most common mode of transport across the constituency — for local farmers and (most)
campaign teams alike — is by foot.
South Guadalcanal is slightly larger than average in land area (19 electorates are larger) but
much smaller than average in population (only 10 electorates are smaller). Although there are
128
While Wale’s votes increased considerably in 2008 in Ambu 1 polling station (which serviced a largely Kwara’ae village were Baru was a powerful local leader) he won only roughly the same number of votes in Dukwasi, suggesting that Matanani was less useful to him. However, it should be noted that in 2008 he faced a very strong Kwara’ae speaking candidate in Manu, meaning that simply holding his own in Dukwasi counted as a good result. 129
CDOs are employees of the central government; however, their recruitment is, in effect, controlled by MPs, who invariably place allies or relatives in the role.

174
a few inland villages, most of its population lives along a thin strip of coastal land. Table 8.3
below shows common languages and denominations in the electorate. Table 8.4 shows recent
electoral history.
Table 8.3 – Major Languages and Churches in South Guadalcanal
Language Population
Share (%) Church Population
Share (%)
Koo 47.56 South Seas Evangelical Church 46.77
Talise 40.97 Roman Catholic 23.15
Moli 8.84 Church of Melanesia 17.50
Table notes: language groups from 1999 census, churches from 2009 census. The three languages spoken are similar enough to be largely mutually intelligible.
Table 8.4 – Recent Election Results from South Guadalcanal
Year Candidate Votes Vote
Share (%)
2010 David Day Pacha 1,941 49.85
Cornelius Vonseu 662 17.00
Andrew Donua Muaki 643 16.51
Francis Peter Para 190 4.88
Jack Israel Bana 153 3.93
Martin Tsuki 66 1.69
Marx Lua Tova 64 1.64
Charles Aiwosuga Cheka’a 58 1.49
Karnol Kalea Sala 44 1.13
Victor Totu 22 0.56
Rejected Votes 18 0.46
Allastair Teava 16 0.41
Joshua Karichi 9 0.23
Betty Lirma Gigisi 5 0.13
Ron Lawson Meke 3 0.08
2006 David Day Pacha 656 21.24
Sethuel Kelly 626 20.27
Michael Voli 336 10.88
Joshua Karichi 304 9.84
Victor Totu 252 8.16
Charles Aiwosuga Cheka’a 219 7.09
Rollen Seleso 155 5.02
Shadrack Sese 150 4.86
Ron Lawson Meke 133 4.31
Karnol Kalea Sala 110 3.56
Francis Peter Para 74 2.40
Terry Vekea 51 1.65
Isaac Leslie Tagu 22 0.71
Rejected Votes 0 0.00
2003 Victor Totu 728 30.11
2001 Augustine Geve 2,083 63.16
1997 Victor Samuel Ngele 1,054 45.43
1993 Victor Samuel Ngele 1,528 87.41
Table notes: pre-1993 South Guadalcanal existed as an electorate albeit with slightly different borders. Older elections are excluded from the table owing to limited relevance and to save space.
South Guadalcanal was home to fighting during the Tensions and conflict brought electoral
turbulence. In 1993 Victor Ngele won his second term as MP for South Guadalcanal. In 1989 he
had won (his first victory) with 39.1 per cent of the vote. In 1993 he followed this with a
landslide victory, winning the highest vote share of any candidate to have contested an

175
election in Solomon Islands.130 Across the constituency the same explanation was offered for
his win: Ngele had helped. Ngele took his constituency development funding (which was
increased dramatically to all MPs in the lead-up to the 1993 election) and he delivered. In the
words of a community leader:
He brought a tractor for Talise ward. Chainsaws…He paid for rice. The whole constituency. Then he allocated the RCDF money to villages. He helped churches and communities. He did very good. (Interview Gua4)131
Ngele lost in 2001 during the Tensions to Father Augustine Geve, a candidate favoured by
militants present in the electorate at the time. The militants subsequently murdered Geve and
Victor Totu won a by-election 2003. Although the conflict was over by the time of the 2003
election, the militants remained a force in the electorate and one interviewee, himself a
former candidate, alleged that Totu won because he had the militants’ backing (Interview
Gua5), which is plausible although I have no way of verifying the claim.
By 2006 Totu’s electoral fortunes had reversed and he lost with less than 10 per cent of the
vote. If there was uncertainty about why he won the reason for Totu’s loss was clear: he had
not been effective in delivering help. In the words of a community leader who had supported
Totu but who changed to Pacha:
We asked him [Totu] for projects but he didn’t give them. When some people died he did not help as is customary. He didn’t help with schooling. (Interview Gua6)
Figures 8.5 and 8.6 below show results by polling station for the 2006 and 2010 elections.
Polling stations are arranged to reflect their location within the constituency. The left-most
station on the chart is the western-most in the electorate, the station furthest to the right the
eastern-most.
Pacha’s victory in 2006 was narrow. He won a little over 21 per cent of the vote and beat the
second place candidate by just 30 votes. His support was limited to the western side of the
constituency and he won the majority vote share only in his home polling station, capturing a
plurality in just one other. Yet by 2010 his electoral fortunes had shifted significantly; not only
did his total vote share increase considerably but his support base spread, at least across the
electorate’s west.
130
This is excluding MPs who have won uncontested elections (an effective vote share of 100 per cent). 131
Ngele himself was from the centre of the electorate and the fact that I heard tales of his good deeds not only in the electorate’s centre, but also in the east (the source of the quote above) and west suggests that the praise offered to him was more than just boosting a local candidate or a candidate who was a relative of the interviewees.

176
Figure 8.5 – South Guadalcanal Results by Polling Station 2006
Figure 8.6 – South Guadalcanal Results by Polling Station 2010
Relational Ties and Brokers in South Guadalcanal
Electorally, South Guadalcanal had much in common with the rest of the country. Relational
ties were important in directly contributing to voter support. As one former candidate said:
Tribal [voting] is quite important. Because if you are a member [of parliament] and you are of my tribe then I would feel that you are just part of me so that I can ask you for any help…We can talk to each other more easily than with members of other tribes. (Interview Gua5)
0
100
200
300
400
500
600Ta
ri
Nga
lito
Ko
lina
Ch
apu
ria
Ch
amu
ti
Ku
ma/
Mal
agh
eti
Rae
avu
Ku
ma
Ala
solo
Ve
ram
ogh
o
Nga
litu
tula
lina
Lalo
ato
Mal
aisu
DUIDUI VATUKULAU TALISE
Isaac Tagu
Terry Vekea
Francis Para
Rejected Votes
Karnol Sala
Ron Meke
Shadrack Sese
Rollen Seleso
Charles Cheka'a
Victor Totu
Joshua Karichi
Michael Voli
Sethuel Kelly
David Day Pacha
0
100
200
300
400
500
600
Tari
Nga
lito
Ko
lina
Vis
o
Ch
apu
ria
Ch
amu
ti
Hal
iatu
Ku
ma/
Mal
agh
eti
Rae
avu
Ku
ma
Ala
solo
Ve
ram
ogh
o
Nga
litu
tula
lina
Lalo
ato
Mal
aisu
DUIDUI VATUKULAU TALISE
Ron Meke
Betty Gigisi
Joshua Karichi
Allastair Teava
Rejected Votes
Victor Totu
Karnol Sala
Charles Cheka'a
Marx Tova
Martin Tsuki
Jack Bana
Francis Para
Andrew Muaki
Cornelius Vonseu
David Day Pacha

177
Yet once again, relational ties were also not the sole determinant of voter choices. The change
in Pacha’s support between 2006 and 2010 stands at odds with this: either a significant
number of his relatives did not vote for him in 2006 or a significant number of non-relatives
did 2010.
In South Guadalcanal candidates also used brokers and as elsewhere they sought influential
people to fill this role. Broker loyalty was an issue in South Guadalcanal too. When I described
the problems of disloyal brokers to a member of David Day Pacha’s campaign team he said:
It is the same. We went and at Kuma we found out that one man who said he was an agent of the Honourable [David Day Pacha] [but] when we talked with them afterwards… we learnt he campaigned for another candidate. The same problem you heard about in Aoke it happens here too. (Interview Gua7)
Similarly, a community leader who played a central role in the 2010 campaign of the candidate
who ran third in 2010 (a candidate from the opposite end of the electorate from Pacha), when
asked whether their team had suffered defecting agents, confirmed that, “this is a problem for
us. We use a Pijin word, konman. Plenty of people turn out to be conmen” (Interview Gua4).
Relational and other personal ties were also used to structure campaigns, and David Day
Pacha’s first election win provided an interesting example of relational ties in action. Pacha
was born in the village of Peochakuri but lived almost all of his life in Honiara where he worked
successfully in the private sector and within church-based associations (Corbett and Wood
2013). This work afforded him some profile in the constituency in 2006, but he still could not
have won on his own. Instead he obtained the support of leaders from around Peochakuri,
where his relational ties were strongest. When asked if leaders’ support was important he
replied:
Oh yes. Very, very important to have their support. They are on the ground. They are the ones on the ground. These people are very influential people. (Interview David Day Pacha)
One of the central members of Pacha’s campaign team was a relative and senior community
leader within Peochakuri village. He described the beginnings of Pacha’s campaign in 2005.
First with core supporters the community leader canvassed other local leaders to see if they
would be amenable to supporting Pacha, and upon hearing they would, relayed this
information to Pacha who made his decision to stand. Once this occurred the central members
of the campaign team contacted leaders again to garner their support as brokers. He explained
this and its importance in the following way:

178
We choose chiefs, big men, leaders. They can tell people: “we will vote for this man”… In 2006 the chief system worked. We [the interviewee and other leaders] talked with people, then they did what we told them, [voting for] whoever we chose. (Interview Gua6)132
When I subsequently asked him where he was able to garner community leader support he
added that church leaders from the South Seas Evangelical Church had also been important
(Pacha too emphasised the importance of church networks) and that between the two types
of leaders they obtained some leader-based support in the villages of: Inakona, Tasmania,
Peochakuri, Viso, Haleatu, Kololo and in Duidui. In 2006 the first three of these villages voted in
the Chapuria polling station, while villagers from Viso voted in Chapuria or Colina polling
station. Villagers from Duidui voted in Colina polling station. And villagers from Haleatu and
Kololo voted in Chamuti polling station. Combined, these three polling stations were the
source of 73 per cent of Pacha’s votes in 2006.133
As Table 8.4 and Figure 8.5 shows, this was enough for Pacha to win, although his win was far
from overwhelming. Pacha was not the sole candidate from the West; the western ward of
Duidui was home to other relatively strong candidates, such as second place getter Sethuel
Kelly. And in central and eastern parts of the electorate Pacha won hardly any votes at all.
2010 and the Importance of Deeds in South Guadalcanal
In 2010 Pacha won again, and this time his victory was resounding. As described above, his
vote share more than doubled and his support base spread: he won comfortable majorities in
the two polling stations where he had performed best in 2006 and he won the plurality of
votes in all the polling stations across the west of the electorate. Heading east, his polling
station vote share declined though he still won reasonable minority shares across most polling
stations. Only at the far eastern end of the constituency did voters continue to spurn him.
The explanation for this pattern of results became quickly apparent to me as I travelled along
South Guadalcanal. In the west Pacha was popular because he delivered. In the east he was
unpopular because he had not. In between his performance was mixed, and this was reflected
in his support. In Peochakuri houses were fitted with solar panels, communities had outboard
motor boats, and people had money to run small stores. Everyone — Pacha, voters,
132
This passage is translated from Pijin. In English it could possibly be read as suggestive of coerced voting. Yet, although it is likely that voting in South Guadalcanal, as in the rest of the country, involves, as discussed above, an element of coercion for some voters, the broader conversation with this interviewee suggested his explanation here was not an admission of coercion but rather him simply telling me that voters followed leaders’ advice. 133
This story was also confirmed to me as I travelled through villages surrounding Peochakuri and spoke to leaders.

179
community leaders — told me this all stemmed from Pacha. And voters, both in Peochakuri
and surrounding villages, factored his largesse into their appraisal of him.
For example when I asked a man from near Peochakuri village about voting in 2006 and 2010
he said:
The first time he [David Day Pacha] stood I did not vote for him. But then he took his CDF [RCDF — government constituency funding] and when I saw that over the four years he worked [as an MP] he had done lots of the things I expected other MPs to do, but which they never did. So I say “oh this man, I like him. I like his work. He is honest. He has integrity.” (Interview Gua8)
And when I asked a group of interviewees about their electoral decisions one woman said:
Some of the previous MPs never gave us anything. This time, David Day is quite good at helping us. So we voted for him because we like a man who helps us. [And when asked what their member had done] He has helped lots of people giving projects, solar panels, canteens. Any project we want! He has helped widows and when people died he gave rice. (Interview Gua9)
Comments from those who had campaigned for Pacha also reflected this. In a village nearby I
interviewed a community leader who said of campaigning for Pacha:
2006 it was quite hard because we did not know him well. Come 2010 it was easy. Because we had seen what he had done for us — helping us, helping in rural areas. (Interview Gua10)
Another community leader from near the polling station at Viso had a similar tale:
When he stood in 2006, it was a bit hard as some people did not know David Day. Some people, like us, already knew him, because we are related. But when we went round telling other people to vote for him they asked “if he becomes member will he really do what you are saying or won’t he?”…When he won, once we voted for him, then they saw some things David Day did. It opened their eyes. (Interview Gua11)
In the centre of the electorate evidence of spending was less but still visible: in the village of
Kuma I was shown a school that Pacha had spent money on (not coincidentally one of the
most influential brokers in this polling station was the school’s principal).
At the eastern end of the constituency, on the other hand, there was no evidence of any
similar goods, or funding, and instead of praise there was complaint. A woman there summed
up the situation in the following way:
Our parliamentary member, while he has been in parliament, has done nothing to help us. Because he saw that we did not put any ballot papers in his box [did not vote for him] he has left us out…We have not seen anything that he has done for us. (Interview Gua12)

180
Of course such complaints could simply be politicking from a disgruntled opponent. Yet, in
accordance with the claim, while in the eastern end of the electorate I saw no evidence
whatsoever of any projects or goods of the sort that were so abundant to the west. Pacha
himself effectively confirmed the veracity of the complaints when I interviewed him, stating
that in his first term he had focused spending in the west. He explained this as a strategic
choice:
Politically speaking you have to strengthen your power base. In any building, the foundation is very, very important. If you are constructing a building the foundation is of paramount importance for the building that is going to stand on top of it. I am carefully, architecturally, engineering the base at the moment. (Interview David Day Pacha)134
Pacha, it seemed, succeeded in delivering the goods where he wanted to because he played an
active role in managing what was allocated and to whom. He was accessible to his supporters
who were able to stay at his house in Honiara, and could approach him with requests (this was
something I heard from voters and Pacha himself). And, importantly, he had final say on
spending decisions (Interview David Day Pacha). This approach appeared, on the basis of
evidence from the constituency, to be good for instilling gratitude amongst recipients of
largesse, for enabling him to make strategic spending decisions, and for making sure spending
was delivered as intended.
Small Malaita — the Strengths and Weaknesses of Ethnic Groups
Separated from the south-eastern end of the island of Malaita by a narrow passage, the
electorate of Small Malaita is close to the median in land area (26th largest) but is larger than
average in population (ranked 13th). Road transport is possible in and near the large village of
Afio; otherwise travel is by boat or on foot.135
Table 8.5 shows the three largest languages and churches; Table 8.6 shows the constituency’s
recent electoral history. In the Sa’a and ‘Are ‘are speaking parts of the electorate communities
and clans have hereditary leadership. In the Lau language areas leadership roles are to a larger
extent earned. Clans are not strongly cross-cutting in the way they are in South Guadalcanal,
although there is a cross-cutting institution in the form of a council of chiefs that sits across
(most) Sa’a speaking communities, and further local chiefly councils that sit under it (Justice
Delivered Locally Field Team 2012, p. 50).
134
He did also claim that he would spread his largesse in coming years across the constituency. This remains to be seen. The main point for now though is that in his first term his support was focused on the west, and to a lesser extent the centre, of the electorate. 135
Both Small Malaita and South Guadalcanal contain the ghosts of colonial era roads, their decayed remnants now only useful as walking tracks.

181
Table 8.5 – Major Languages and Churches in Small Malaita
Language Population
Share (%) Church
Population Share (%)
Sa’a 49.20 Church of Melanesia 41.25
‘Are ‘are 35.75 Roman Catholic 34.44
Lau 9.39 South Seas Evangelical Church 18.79
Table notes: language groups from 1999 census, churches from 2009 census. The Sa’a and ‘Are ‘are languages are close to mutually intelligible. The Lau language is completely different.
Table 8.6 – Recent Election Results from Small Malaita
Year Candidate Votes
Vote Share
(%)
2010 Rick Houenipwela 1,677 24.58
William Nii Haomae 1,606 23.54
Edwin Awaioli 825 12.09
Rudolf Henry Dora 725 10.63
Patrick Wate 567 8.31
Christopher Wate 415 6.08
Alex Bartlett 303 4.44
Elizah Owa 283 4.15
Matthew Fakaia 173 2.54
Rejected Votes 77 1.13
Willie Fa’asu 47 0.69
Lyndon Wateitohi 37 0.54
James Henry Star Dora 31 0.45
Leslie Anthony Saru 30 0.44
Clement Honiola 13 0.19
Joseph Wane** 13 [544] 0.19
2006 William Nii Haomae 1,179 19.85
Matthew Fakaia 1,016 17.10
Wallen Hite 722 12.15
Elizah Owa 687 11.57
Peter Nikae 647 10.89
Timothy Laesanau 464 7.81
John Pipi Susupuri 375 6.31
James Honimae 267 4.49
Rose Paohu 245 4.12
James Hoilopo 158 2.66
Walter Hikumane 130 2.19
Rejected Votes 50 0.84
2001 Alex Bartlett 1,941 29.48
1997 William Nii Haomae 730 17.92
1993 William Nii Haomae 1,266 37.16
Table notes: **in the first instance results are from the official record as per the Parliamentary Gazettes. Yet there is an error in this source: polling station data from the electoral commission, as well as interviews conducted in the area, make it clear Wane won 544 votes, not 13.
2010 saw first time candidate Rick Houenipwela (his surname is usually shortened to Hou
which is how I refer to him hereafter) win on his first attempt, defeating the sitting MP William
Haomae, a candidate who first won in 1993. Hou, like Mathew Wale, was the sort of candidate
who might have expected to win support on the basis of his work for the country, were that
possible. He was Central Bank governor during the Tensions, and is widely admired as having
been a key voice of restraint during the conflict (Moore 2004, p. 58). And, yet while Hou’s

182
profile and reputation helped garner the support of village and clan leaders in his part of the
electorate, there is no evidence these attributes won him significant electorate-wide
support.136 Figures 8.7 and 8.8 show 2006 and 2010 results by polling station.137
Figure 8.7 – Small Malaita Results by Polling Station 2006
Figure 8.8 – Small Malaita Results by Polling Station 2010
136
In eliciting local support he also appeared to have been aided by the fact that, while he was not a community leader himself, he was from a chiefly lineage which appeared from interviews to have afforded him additional status. 137
Owing to the circular nature of the island constituency it is not possible to arrange polling stations in a way that neatly reflects distance apart in the same way it was possible for Small Malaita and South Guadalcanal. Thus, the polling stations of Ote and Ro’one are actually quite close to Riverside, where Hou is from, despite appearing to be as far away as possible on the chart.
0
100
200
300
400
500
600
Sa'a
Olo
su'u
Ote
Ro
'on
e
Fan
alei
Kal
on
a
Bu
lu
Wal
and
e 1
Wal
and
e 2
Heu
po
tasi
Hen
ue
Ko
mu
o'o
ra
Mal
akao
Sara
was
i
Heu
kasi
a
Hep
ea
O'A
u
Hau
nas
i
Wai
aha
Kar
u'u
Tara
mat
a
Riv
ersi
de
Afi
o
Ou
'Ou
mat
awia
New
Pla
ce
Ro
kera
Inem
arau
ri
ABA/ASIMEURI LAROISU'U ASIMAE
Rejected Votes
Walter Hikumane
James Hoilopo
Rose Paohu
James Honimae
John Susupuri
Timothy Laesanau
Peter Nikae
Elizah Owa
Wallen Hite
Matthew Fakaia
William Haomae
0
100
200
300
400
500
600
Sa'a
Olo
su'u
Ote
Ro
'on
e
Fan
alei
Kal
on
a
Lele
nga
sau
Bu
lu
Wal
and
e 1
Wal
and
e 2
Heu
po
tasi
Hen
ue
Ko
mu
o'o
ra
Mal
akao
Sara
was
i
Heu
kasi
a
Hep
ea
O'A
u
Hau
nas
i
Wai
aha
Kar
u'u
Tara
mat
a
Riv
ersi
de
Afi
o
Ou
'Ou
mat
awia
New
Pla
ce
Ro
kera
Inem
arau
ri
ABA/ASIMEURI LAROISU'U ASIMAE
Clement Honiola
Leslie Saru
James Dora
Lyndon Wateitohi
Willie Fa'asu
Rejected Votes
Matthew Fakaia
Elizah Owa
Alex Bartlett
Christopher Wate
Joseph Wane
Patrick Wate
Rudolf Dora
Edwin Awaioli
William Haomae
Rick Houenipwela
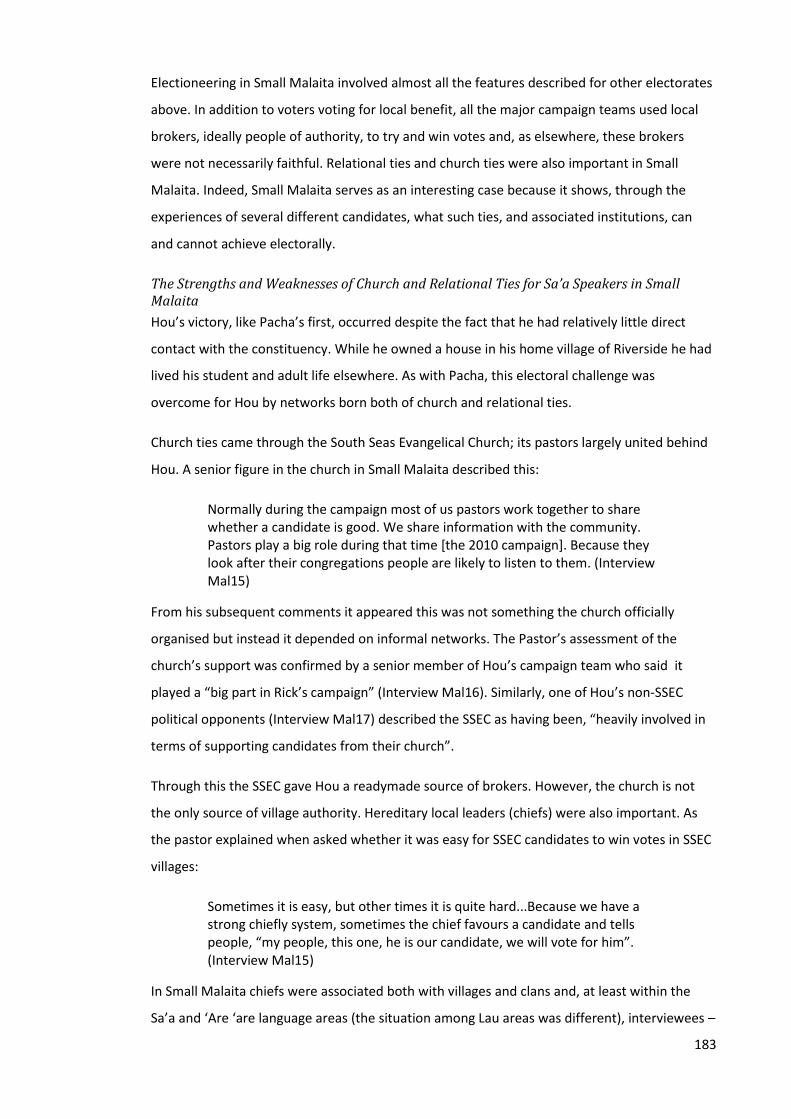
183
Electioneering in Small Malaita involved almost all the features described for other electorates
above. In addition to voters voting for local benefit, all the major campaign teams used local
brokers, ideally people of authority, to try and win votes and, as elsewhere, these brokers
were not necessarily faithful. Relational ties and church ties were also important in Small
Malaita. Indeed, Small Malaita serves as an interesting case because it shows, through the
experiences of several different candidates, what such ties, and associated institutions, can
and cannot achieve electorally.
The Strengths and Weaknesses of Church and Relational Ties for Sa’a Speakers in Small Malaita
Hou’s victory, like Pacha’s first, occurred despite the fact that he had relatively little direct
contact with the constituency. While he owned a house in his home village of Riverside he had
lived his student and adult life elsewhere. As with Pacha, this electoral challenge was
overcome for Hou by networks born both of church and relational ties.
Church ties came through the South Seas Evangelical Church; its pastors largely united behind
Hou. A senior figure in the church in Small Malaita described this:
Normally during the campaign most of us pastors work together to share whether a candidate is good. We share information with the community. Pastors play a big role during that time [the 2010 campaign]. Because they look after their congregations people are likely to listen to them. (Interview Mal15)
From his subsequent comments it appeared this was not something the church officially
organised but instead it depended on informal networks. The Pastor’s assessment of the
church’s support was confirmed by a senior member of Hou’s campaign team who said it
played a “big part in Rick’s campaign” (Interview Mal16). Similarly, one of Hou’s non-SSEC
political opponents (Interview Mal17) described the SSEC as having been, “heavily involved in
terms of supporting candidates from their church”.
Through this the SSEC gave Hou a readymade source of brokers. However, the church is not
the only source of village authority. Hereditary local leaders (chiefs) were also important. As
the pastor explained when asked whether it was easy for SSEC candidates to win votes in SSEC
villages:
Sometimes it is easy, but other times it is quite hard...Because we have a strong chiefly system, sometimes the chief favours a candidate and tells people, “my people, this one, he is our candidate, we will vote for him”. (Interview Mal15)
In Small Malaita chiefs were associated both with villages and clans and, at least within the
Sa’a and ‘Are ‘are language areas (the situation among Lau areas was different), interviewees –

184
be they voters, candidates, or community leaders — emphasised the importance of chiefly
influence.138 Particularly in the Sa’a speaking areas in the centre and south-east of the island
clans aggregated up into larger entities, called Kanus (Canoes) by Small Malaitans, which are
governed by houses of chiefs. An important source of electoral support for Hou was the
backing of houses of chiefs in the central and south-eastern part of the electorate. A senior
member of Hou’s campaign team described this support as stemming from a meeting of
approximately 30 chiefs, who decided Hou would be a good candidate (Interview Mal16).
Asked whether this alliance of chiefs held together through the campaign the interviewee said,
“we lost a few guys but the majority stayed intact.” And when asked whether this chiefly
support helped in Hou’s campaign his answer was simple: “very much”.139
Yet there were limits to what such support could accomplish. Neither church nor chiefly
coordination enabled Hou to run without competition from within. Although the system of
houses of chiefs is supposed to offer some governance across the Sa’a speaking parts of the
constituency, ten Sa’a speaking candidates stood in 2010. And two other candidates came
from villages close to Hou’s home village — from parts of the electorate where his chiefly
support base was strongest. Similarly, three other candidates from the SSEC church stood.
Church and chiefly coordination helped Hou, but could not ensure group unity. What is more,
Hou’s win was an example of relatively successful coordination compared to that occurring in
other parts of the electorate in 2010, and compared to that what happened in Hou’s own
village in 2006.
In 2006, Timothy Laesanau, also from the village of Riverside, stood. On paper he looked a
strong candidate, being the acting paramount chief of the same network of chiefs which
provided support to Hou, yet his electoral challenge was hampered by the fact that John Pipi
Susupuri, also stood. Not only was Susupuri also from Riverside but he also served as a
secretary of the chiefly network which Laesanau presided over. Both men were also members
of the SSEC church (Interviews Mal18 and Timothy Laesanau). Yet neither of these institutions
could prevail upon either candidate to stand down and by dividing their support base they
doomed themselves to failure.
138
While influence was almost universally described it was also said by some interviewees to vary to an extent from chief to chief, and was thought possibly to be waning overall. 139
These accounts were confirmed by other interviewees in the electorate, including interviews with chiefs.

185
The Coordination Failures of the Lau Candidates in Small Malaita
A similar problem plagued the large Lau speaking village of Walande in the electorate’s north-
east.140 Here the villagers are all members of the Church of Melanesia, a church they share
with Sa’a speakers down much of the south-eastern side of the island.
Although Lau speakers are a relatively small minority in the electorate, the sole Lau speaking
candidate in 2006 election, Matthew Fakaia, came close to winning.141 Something he did by
gaining the votes of almost all the Lau speakers (who voted at the Walande and Fanalei polling
stations and, in the case of one small community, in Bulu) as well as a few other voters to
whom he had ties through marriage in Ote polling station (Interview Mal20). In 2010 Fakaia
stood again, but this time he was joined by three other Lau speaking candidates, all from
Walande and all coreligionists. Although one of these candidates, Joseph Wane, polled better
than the rest, the presence of four of them effectively guaranteed all would lose.142 Although,
all four candidates spoke the same language, were from the same church and were from the
same village, electoral coordination, in the form of unity behind one candidate, proved
impossible.
The Lau Candidates’ Problems Winning Non-Lau Speakers’ Support in Small Malaita
Coordination within the same village was not the only problem facing the Walande candidates.
They suffered an additional challenge in trying to win support from non-Lau speakers. Such
support would offer Lau speaking candidates a significant electoral boost if they could win it,
yet it was hard to come by. When I asked a former candidate from Walande whether it was
hard to win votes from other language groups his response was to say “exactly”. He went on to
lament people who took money during campaign while promising of electoral support that did
not eventuate, stating that: “the behaviour of Sa’a speakers, it is very hard to win their true
support…Today they will tell you one thing, tomorrow another” (Interview Mal21).
Part of this problem came in the form of ties: while clans spanned the two largest Lau villages
in the electorate, and while similar ties linked all the Lau villages, there were no equivalent
140
The historical home of Lau speakers is in Malaita’s northwest; the villagers in Walande and surrounding Lau communities are the descendants of migrants. In the case of the Walande villagers one community leader told me the migration probably occurred in the 1920s. 141
Fakaia’s cause was helped by very high turnout in Walande 1 polling station in 2006, something that one interviewee alleged was the result of ballot fraud. This could be plausible as there seem not to have been any electoral observers at the polling station; however, I have no means of verifying the allegation. 142
As noted in the results table there is a discrepancy between the official results presented in Table 8.6 and the detailed polling station data provided to me by the electoral commission, presented in Figure 8.8, with the latter of the two sources being correct.

186
relational bonds straddling the language divide.143 In the words of a senior community figure
from Walande who had worked on several campaigns, when asked about ties to people in non-
Lau speaking villages, “we know them by name, but we do not have strong ties” (Interview
Mal20).
Few ties means fewer supporters drawn to candidates by direct bonds; it also spelt trouble
with brokers. As one of the candidates who stood in Walande in 2010 explained when I asked
him if it was hard to find reliable brokers and other members of his campaign team from
outside the Lau speaking area he replied:
Very much so. I was only able to include one or two [non-Lau] members in the campaign team…And even then as you realised from the results it doesn’t show, it didn’t help much. (Interview Mal22)
Similarly Joseph Wane, the Lau speaking candidate who polled highest in 2010, said, when
asked about brokers in non-Lau speaking villages: “[y]es, we had agents in Sa’a, agents at
Oloha.” And when asked whether agents were important he replied, “yes that’s right”—
although interestingly, unlike the previous interviewee he claimed getting brokers was easy.
Yet, outside the Lau language areas, they did him little good. In Sa’a polling station he won no
votes, while in Inemauri polling station, the polling station that contains Oloha village, he won
four. In total 91 per cent of his votes came from polling stations with large numbers of Lau
speakers, and a further seven per cent of his votes came from other nearby polling stations.
When I asked about this he told a familiar story:
Yeah, in the end, these people…people come to get the most out of you, you know? They go back to the other candidate to get the most out of them. So at the end of the day, when you expect that you collect a little bit from your agents sometimes it’s just nothing. That’s when — this is a common term we use in the Solomons — that’s when we experience a lot of conmen…That’s what you see reflected in the results. (Interview Joseph Wane)
Yet for all this he recognised brokers were important:
It’s quite hard, but then again, you cannot let go of them too, even if you know they are not telling the truth, but you have to hold onto somebody there, whether he’s an honest man or not, you have to hold onto somebody in the community. (Interview Joseph Wane)
Loosing brokers was certainly not a problem unique to Lau candidates: Hou’s team struggled
with agents too. This included losing a couple of members of their core alliance of chiefs and
church members (Interview Mal16). However, their problems with brokers appeared most
143
There were some marriage based ties crossing the language divide (such as those which helped Matthew Fakaia as discussed) and while these were thought to be increasing, they were still few in number.

187
acute in the predominantly ‘Are ‘are speaking north of the electorate (Haomae’s base). In part
this stemmed from the fact that this was the area where Haomae had delivered the most
tangible benefits, but there was another problem in recruiting reliable agents, as was
explained to me by one of the senior members of the Hou campaign team:
One problem we found difficult was that we had no one to connect with there. Because of relationships, blood. We had no relatives, no relations to go with. (Interview Mal23)
Troubles with brokers were a problem that plagued candidates around Solomon Islands, and
elsewhere, as in Small Malaita, for most candidates they were a problem that became worse
as ties became fewer.
Why the Church Could Not Help Lau Candidates in Small Malaita
Church was one potential tie that, on the surface at least, appeared a potential source of
electoral assistance for Small Malaita’s Lau speakers. The Church of Melanesia is the
constituency’s largest church. Should the electoral significance of ethnic groups be determined
by size alone, at 41 per cent of the population, it is clearly a potentially electorally important
group. In addition, the Church of Melanesia is based for the most part within Ward 22, drawing
members from a contiguous geographical area in the electorate’s South West. It is a church
that would appear to have had the potential to unite a significant Sa’a speaking part of the
electorate with the Lau speaking villages. Yet nothing of the sort occurred. No Church of
Melanesia candidate has won election in Small Malaita since at least 1984 (and probably
before then; I only have information on the church of the winning candidate back as far as
1989). In 2010 some seven candidates from the church stood, and there is no evidence that
church ties helped any of these candidates win a substantial number of votes. Sa’a, where
Wane won zero votes, was a predominantly Church of Melanesia village. Similarly, James
Henry Star Dora, the non-Lau speaking Church of Melanesia candidate who won the most
votes in the Lau dominated polling stations, won only one vote across the four polling stations
in question. There was no evidence of electoral coordination across Church of Melanesia
communities, and no evidence that this shared ethnic identity helped Lau candidates
whatsoever. When I asked a senior Church of Melanesia bishop from Small Malaita about
church voting he offered a reply that suggested he and his church fellows knew the
demographic and electoral facts on the ground: “there are quite a few of us Anglicans [Church
of Melanesia adherents] and if we united behind one candidate we would always win, but we
do not do it.” And when I asked whether the church tried, he said that coordination had been
considered but was thought infeasible because, “everyone has different views; if we suggested
someone it would not really work” (Interview Mal24).

188
Ethnic and relational ties clearly played a role in electoral politics in Small Malaita, and social
rules associated with such ties were also important. Yet not all groups were equal in this
regard and even those that had the power to structure electoral outcomes to an extent were
never so strong as to guarantee dominance or electoral loyalty.
Conclusion
In this chapter I continued my examination of voter behaviour in Solomon Islands and, in
particular, ethnic voting. There is evidence, both in survey and interview data of ethnic voting
along clan lines (and also something closely akin to it: voting following relational ties), as well
as ethnic voting along church lines. Yet, as might be expected on the basis of the findings I
presented in Chapter 7, such voting is not simple. Loyalties are contingent and interact with
other factors as voters, where they are free to choose, attempt to ascertain the candidates
most likely to provide assistance.
In the second half of this chapter I examined this complexity in action, describing the electoral
politics of three constituencies. I highlighted the importance of local brokers and showed how
MPs’ performance played a role in their electoral success. I illustrated how utilisation groups
based on church or relational ties played an important role in election outcomes. However, I
also showed how the importance of such groups varied, and that there were limitations to
what even relatively strong groups could achieve.
While I have dwelt upon experiences gathered from just three electorates, the phenomena I
described are not atypical. Although space constraints prevent me from drawing directly on
the material here, I interviewed people from all but one of Solomon Islands’ 50 electorates
and, while the stories I heard had local twists at times, similar key features were raised by
interviewees from around the country. Brokers are used everywhere, and appear equally
unreliable everywhere. Likewise, relational ties and, to varying extents, churches were
emphasised as important everywhere. Similarly, David Day Pacha and Victor Ngele were not
the only Solomon Islands MPs able to substantially increase their vote shares by ‘delivering the
goods’. While such electoral gains were never guaranteed, they did occur, including for Samuel
Manetoali, the MP for Gao Bugotu, another electorate where I undertook fieldwork. And the
reasons for Manetoali’s rise were also clearly performance related.144 There was variation of
course — for example, in 2010 in urban East Honiara, trade unions provided Douglas Ete, the
victorious candidate, with an additional support base, which he combined with relational and
144
One interesting differences between the two is that while Manetoali made use of relational networks in his first win, he also benefitted from moving to the Isabel provincial capital of Buala (located outside but near the edge of Gao Bugotu) where he earned a reputation for helping people through his work as a lawyer for the provincial government and through charitable acts.

189
church support. But the function served by ties and performance was similar around the
country.
In Chapter 9, the final substantive chapter of my thesis, I take my descriptions and data to
build a theory of voting in Solomon Islands. Before I do this, however, two points are worth
noting.
The first point speaks to the final of the possible combinations of voter behaviour and ethnic
identity I outlined in Table 6.1 — a combination in which non-reasoned impulses drive voter
choices and are coupled with multiple and fluid identities. Identities which might, perhaps, be
ignited and manipulated by particularly skilled political actors. This combination is not well
described in political science work on voter behaviour, yet it might plausibly have fit the
Solomons context. Irrational impulse could explain why size does not appear to drive the
relative electoral salience of different identities; and fluid malleable attachments might explain
dramatic variations in Solomon Islands electoral statistics over time. However, on the basis of
what I have described in Chapter 8 there is no evidence to suggest this form of politicking is
commonplace in Solomon Islands. Instead, while there are no doubt many deviations from
perfect rationality, the descriptions of voters’ choices and electoral politicking I gathered,
spoke of a broadly rational process. Voters sought material assistance, and tried to work out
who was most likely to provide it. Other political actors worked strategically in this context.
The second point is that while existing theories of ethnic identity and voter behaviour do not
appear to fit the Solomon Islands context, much else from the study of electoral politics does.
Not only is voter coercion common in many developing countries (Gerber et al. 2013), but so is
vote buying (Vicente and Wantchekon 2009; Gonzalez-Ocantos et al. 2012). And, coupled with
these practices, attempts by candidates to determine who did and did not vote for them are
also described elsewhere (Gerber et al. 2013). Similarly, clientelism is common in many low
income countries (Stokes 2009, p. 299; Hicken 2011, p. 668). Brokers also appear to be of near
universal importance in clientelist democracies (Hicken 2011; Baldwin 2013; Stokes et al.
2013). And problems with broker loyalty, as well as concerted candidate attempts to overcome
these problems are also common (Finan and Schechter 2012; Stokes et al. 2013).
That Solomon Islands shares so much of its electoral politics with other countries is further
evidence Solomon Islands (or broader Melanesian) exceptionalism of the sort I described at
the outset of Chapter 6 is misplaced. The cultural and social context of my study is not so
unique as to require its own type of explanation. I ought to be able to explain the political
outcomes observed in Solomon Islands using the tools and theories of political science. This is
the task I set myself to in Chapter 9.

190
Chapter 9 – A Theory of Ethnic Voting in Solomon Islands
In Chapter 7 I provided evidence suggesting existing theories of ethnic voting do not fit well
with the election outcomes observed in Solomon Islands. In Chapter 8 I commenced my search
for an alternative theory that does fit by weaving together survey data, interview data and
case studies to describe the mechanics of Solomon Islands electoral politics and the choices
voters make. In this chapter, the final substantive chapter of my thesis, I take the descriptive
work of Chapter 8 and use it to generate and test a theory of ethnic voting in Solomon Islands.
I build theory using two central electoral dilemmas confronting Solomon Island voters and
political actors — principal agent problems and coordination problems — and by explaining
the role ethnic groups play, at least some of the time, in helping overcome these challenges.
Making references to examples from fieldwork I show that voters, brokers, candidates and
MPs all face situations where as ‘principals’ they need the assistance of other actors (‘agents’)
to obtain the outcomes they seek. I discuss how this occurs under circumstances where the
agents in question are often unreliable. I then show that, to an extent, the social rules
operating within some ethnic groups help overcome such principal agent problems.145
I also show that chances of electoral success are enhanced by coordination amongst actors
(influential local leaders agreeing to coordinate support behind one candidate, for example)
and that, once again, this is not easy. I then explain how social rules within ethnic groups can
again, when they have sufficient purchase, aid in overcoming coordination problems.
The overarching argument I advance in doing this is that the impact of ethnic identity on
electoral politics in Solomon Islands comes in the form of social rules which lie within ethnic
groups. Stemming from this I argue that whether an ethnic identity is electorally salient or not
is determined, not by relative group size, or irrational attachment to identity, but by the
presence or absence of electorally effective social rules within groups.
Having built theory, in the final part of this chapter I return to my quantitative data. First
discussing how my theory fits with the patterns of election outcomes I described earlier in the
thesis, and then putting theory to the test using results data and demographic data on
churches.
145
Recall from the introduction I am using the term ‘social rule’ as a synonym for the term ‘informal institution’ used in economics and political science.

191
Principal Agent Problems and Solomon Islands Electoral Politics
My starting point in theorising is the concept of the principal agent dilemma — problems
which occur in situations where one party ‘the principal’ must call upon the services of another
‘the agent’ to bring about desired outcomes in an environment of imperfect information and
constrained enforcement mechanisms. Under such circumstances if agents’ interests differ
from those of the principals, principals find themselves unable to rely on the agent to deliver
as desired (for a formal description see: Bowles 2009, p. 250). A simple example of a principal
agent problem is the challenge faced by a customer (the principal) buying airline tickets from a
travel agent (the agent). The customer seeks the cheapest tickets, yet the same objective may
not be shared by the travel agent (who if they are on a commission will receive a larger fee if
they sell more expensive tickets). At least before the rise of the internet, the customer in this
situation lacked the information necessary to be able to tell whether the travel agent really is
offering the best priced tickets, and the travel agent is unlikely to deliver these if an alternative
exists that is more profitable to them.146
Principal agent problems are common and affect many aspects of human interaction (see
Seabright 2004, p. 259; and Bowles 2009, p. 252 for examples), and the concept has previously
been used in discussions of programmatic and clientelist electoral politics (Kitschelt and
Wilkinson 2007). In Solomon Islands, voters, brokers, candidates and MPs all find themselves
confronting principal-agent type problems as they make electoral choices.
Voters’ Principal Agent Problems
The principal agent problem that confronts voters anywhere democratic elections are run is
whether the candidate or party in question will act as they have promised should they win.
Electoral promises are not certain to be kept and voters will normally possess only imperfect
information with respect to a candidate or party’s propensity to keep such promises. For a
voter in a clientelist polity like Solomon Islands the key uncertainty is not to do with policy
promises but rather whether, should they win, the candidate in question will deliver promised
private goods or local public goods.
In more stable democracies and/or those with strong party systems, problems are mitigated
somewhat. It is easier to predict the actions of a long-serving member of parliament. Similarly,
history provides voters with some idea of the policies a particular party, or a candidate 146
I have made a number of simplifying assumptions for ease of illustration. One is that the travel agent is not operating under circumstances of perfect competition. Another is that the transaction is a one-off occurrence — if the travel agent anticipates the customer is likely to return again in the future (technically a multi-shot game) the incentives guiding their actions may be different. Also, in the example both actors are assumed to be rational and self-interested, and the travel agent is not constrained by professional or other social norms of conduct.

192
representing a party, will follow should they attain power. In the Solomons case, however,
parties are — as I discussed in Chapter 4 — so fluid and weak as to be meaningless tools for
anticipating performance and, as a result, any assessment needs to be made on a candidate by
candidate basis. Yet candidate level assessments based on previous performance are difficult.
Candidate churn is high — 70.1 per cent of the candidates who have stood in Solomon Islands
elections since independence only stood once, and in the 2010 election 61.4 percent of
candidates were standing for the first time.147
Deciding whether to vote for an incumbent MP (or other MP who has served before) ought to
be an easier decision than selecting who to vote for in the absence of an incumbent, as voters
can make use of the MP’s track record in predicting future actions. Yet, the choice is more
complicated than it appears because the actual question confronting voters is a relative one:
not whether the MP will deliver or not, but whether the MP will deliver more in the next term
than the best available alternative candidate.
Moreover, only a small subset of candidates have a track record in power: just 14.9 per cent of
the candidates standing in 2010 had ever been a national level MP previously (45 incumbents
and 31 former MPs striving to make a comeback).148
In my interviews complaints about MPs not keeping promises were commonplace — I heard
them from interviewees around the country. During campaigns promises were plentiful, but
voters clearly could not put much stock in them. As one interviewee from Malaita put it:
When they come and campaign they promise us lots of good things. We do not trust that...Candidates, they are like conmen. Lots of them come around and con us. (Interview Mal25)
In such circumstances the local interlocutors (brokers) I described in Chapter 8 can potentially
help. If the voter can trust the broker and if the broker has genuine, reliable insight into the
behaviour of the candidate, this can provide voters with a better sense of who to vote for.
And, indeed, brokers did serve this role (amongst others) in the electorates I visited. Yet the
uncertainties involved are significant. It turns out that voters cannot always trust brokers (a
common complaint was of brokers who appropriated resources supposed to flow from MPs to
147
This is slightly higher than in other recent general elections: in 2006 57.6 per cent of candidate were first-time candidates; in 2001 58.2 per cent of candidates were first-time candidates. 148
Another possible tool of assessment is performance as a member of a provincial government parliament. In early post-independence a significant proportion of MPs (between a quarter and a third) had previously served in provincial government. However, the proportion of MPs who have served previously in provincial governments has trended down. In the 2010 parliament only eight per cent of MPs had served in provincial government before entering parliament (see Corbett and Wood 2013, pp 327-328 for a more detailed discussion).

193
voters). Similarly, brokers cannot always trust candidates. As one of the brokers I interviewed
in Aoke/Langalanga put it:
[Candidates] make promises to us, to the people who work for him…sweet promises about what they will give. [And then laughing ruefully] Sometimes they cannot fulfil these promises. (Interview Mal12)
The Principal Agent Problems of Candidates and MPs
Just as uncertainty bedevils voters choosing who to vote for, a parallel set of dilemmas
confronts candidates and MPs as they try to win elections. For those candidates who seek to
directly buy votes, or who target resources to a community or group in a less explicit attempt
to win subsequent support, the problem is whether the voters in question will actually vote as
they promised they would at the time the decision to allocate resources was made.
Candidates working with brokers also face a clear principal agent problem: will the brokers
deliver the votes they are promising? The travails of Arthold Matanani described in Chapter 8
illustrate this well. He needed brokers to win votes but he had no way of knowing whether
they would deliver on their promises. And in his case the information asymmetry was
ruthlessly exploited: brokers took his money and failed to deliver votes. Matanani was far from
alone in this. Almost every candidate I interviewed, even the relatively successful ones, stated
they had problems with defecting brokers. Candidates who stand a number of times may — as
described by the campaign worker from Billy Manu’s team in Aoke/Langalanga in Chapter 8
(Interview Mal7) — slowly work out which brokers they can trust, but as I showed above, few
candidates are afforded this luxury for the simple reason that most only stand once.
Those candidates who end up as MPs face further problems in working out who to trust to
deliver goods to voters in return for support. As I noted above, political loyalty in Solomon
Islands is rarely blind, which means any MP hoping to be re-elected needs to deliver to a
significant number of their constituents (although not necessarily everyone they made
promises to). Yet MPs, who typically spend most of their time in Honiara, and whose
constituencies are usually poorly served by transport infrastructure, do little of this
themselves. Rather, they use their Constituency Development Officer and other agents in
constituencies. Interlocutors whose reliability is — as was illustrated by the challenges I
described Aoke/Langalanga MP Matthew Wale facing in Chapter 8 — far from guaranteed.
More generally the high incumbent turnover rate, which occurs despite large MP-managed
constituency development funds, suggests in most Solomon Islands electorates successfully
managing patronage flows is not easy.

194
Potentially, candidates and MPs who believe promises have been broken can seek retribution.
When principals (candidates in this instance) can exert sanctions of these sorts, the principal
agent problem is said to be eased through compliance enforcement mechanisms (Bowles
2009). Yet, in the Solomon Islands electoral context, such enforcement mechanisms are
constrained — at best imperfect. Violent retribution does occur (it is more common in parts of
Papua New Guinea), but it is hard for candidates to effect on a significant scale in most
instances. A candidate may be able to directly coerce voters in their own village with threats of
violence, yet they rarely possess strength to inflict such threats on people in other
communities. Brokers, as I illustrated in the previous chapter, can help candidates overcome
some of the problems of enforcement. Brokers are (where possible) locally influential or
powerful individuals who are in instances able to coerce individuals in their communities.
However, the potential assistance brokers might offer in enforcement is reduced by the same
problem that impedes candidates more generally in their use of them: brokers cannot be
trusted themselves.
How Ethnic Groups and Identities can Help in Overcoming Principal
Agent Problems
Be they voters, brokers, candidates or MPs, political actors in Solomon Islands will benefit if
they can find tools to induce an element of predictability amongst the uncertainty that gives
rise to the principal agent problems they face. Here ethnic identity can help. Not through blind,
unreasoned loyalties, but as a means to an ends: a means of aiding principals in identifying
more reliable agents. If candidates have reason to believe co-ethnics are more reliable brokers
they will use them if they can. If candidates have reason to believe co-ethnics are more likely
to vote for them they will place additional effort into winning their votes. And if voters have
reason to believe co-ethnics are more likely to help than other candidates they have a reason
to vote ethnically.
Ethnic Identity, Social Rules and the Voter-Candidate Relationship
In Solomon Islands, as I outlined in Chapter 3, ethnic groups such as clans and (to varying
degrees) entities such as churches are home to a range of social rules which play a role in
directing the actions of individuals. Solomon Islands is far from unique in this. There is
considerable evidence from psychology (Henrich and Henrich 2007), political science
(Habyarimana et al. 2009) and behavioural economics (Bowles and Gintis 2011) showing
humans to have a strong propensity to follow socially mandated rules, at least to a point, and
that this trait is important in facilitating collective action.

195
One such set of social rules identified in literature from elsewhere and present amongst
groups in Solomon Islands are rules of obligation and reciprocity. There are four key means, all
illustrated in Chapter 8, through which social rules of obligation and reciprocity can aid in
overcoming the principal agent problems between candidates and voters.
The first is simply that a co-ethnic candidate, if bound by such rules, will be more likely to help
than someone who is not, should they win. Norms of mutual assistance amongst those sharing
relational ties are strong in Solomon Islands and at least some of the time similar norms exist
within church groups. Co-ethnics who share such ties are more likely to help if asked, and
asking them for assistance is viewed as socially appropriate. This is true across spheres of
interaction, and of particular interest to my study is something voters factor into their
assessment when deciding who to vote for. As an interviewee from Malaita put it of people
voting for candidates to whom they shared relational ties: “their thinking is, ‘relatives, it’s easy
to ask them for a little bit of assistance’” (Interview Mal6).
The second mechanism involves an indirect effect, mediated by experience. As was
demonstrated by interview quotes in Chapter 8, voters sometimes try to overcome principal
agent problems by drawing on experience and voting for people who have proven to be
helpful in the past. While such voting is the result of actions, not identity, it may still lead to an
increased propensity to vote for co-ethnics. This is because rules of assistance and reciprocity
within groups often mean that co-ethnic candidates are more likely than candidates from
other ethnic groups to have been the individuals who helped the voters in question in the past
and, as a result, are more likely to win their votes.
The third mechanism mirrors the first, with social rules now acting to the advantage of
candidates. In this instance voters do not vote for co-ethnics because they think them more
likely to help but rather because social rules oblige them (the voter) to. In this instance if the
voter does not vote for the co-ethnic candidate they will be viewed as having transgressed the
norm in question — something which may lead to punishment. In the words of another
Malaitan interviewee who I cited in Chapter 8: “you have to vote for them. If you don’t it will
cause problems or a row” (Interview Mal2). For candidates this is useful both because it
provides them with a base of support but also with knowledge of who is likely to have
supported them.
The fourth effect is similar to the third but less direct: if rules of obligation and reciprocity
within ethnic groups mean voters are more likely to rely on co-ethnics than others for
assistance, voters will stand to lose more through offending co-ethnic candidates they fail to

196
vote for than they stand to lose from offending non co-ethnic candidates. As the person from
Isabel who I cited in chapter 8 put it:
People are afraid: if I do not vote for him, he will know I did not vote for him. And he will not give me money. He will not assist me. That is the fear people have. So they vote because he is a relative. Sometimes they vote because if he finds out he will be cross, and he won’t give assistance. (Interview Isa3)
Two points emerge from this. Firstly, where it is based on anticipated assistance stemming
from social rules, voting for co-ethnics is conditional. In circumstances where voters are not
voting through fear of consequence, voters will not vote for candidates unless they anticipate
help. And where candidates have proven themselves to be unhelpful in the past, they will not
earn themselves the votes of co-ethnics simply because of hypothetical bonds of reciprocity.
Recall the interviewee from Aoke/Langalanga who I quoted in Chapter 8 as saying:
In clans the thing we look for most [when thinking about voting] is whether that relative is a kind person, because that one he’ll give you more [when he’s a MP]…I’ve heard some people within this community when their relative has stood as a candidate say ‘we won’t vote for this man because he hasn’t helped us’. (Interview Mal5)
In most instances social rules within ethnic groups in Solomon Islands are a factor in voters’
calculations of candidates’ propensity to assist but they are not the only factor. Loyalty is not
blind and the past behaviour of candidates will also be taken into account.
Secondly, not all ethnic identities come coupled with equally strong rules of obligation and
reciprocity, which means that not all ethnic groups are equal electorally in aiding voters in
overcoming principal agent problems. Language groups in Solomon Islands are, for example,
not normally bound by such social rules, although — as discussed in Chapters 3 and 7 — the
clans that lie within them are. As a consequence language groups do not tend to function as
electoral blocs while clans are more often significant in electioneering.
Ethnic Identity, Social Rules and Bonds with Brokers
In her 2004 book Chandra considers the possibility kinship networks such as clans might form
the basis of ethnic electoral cooperation, but dismisses it, stating (p. 72):
The utility of kinship networks in explaining the politics of ethnic favouritism is likely to be limited. Kinship networks, constituted by individuals related to each other by blood, are too small to facilitate patronage transactions in modern democracies.
Although electorate populations are less in Solomon Islands than in many democracies, the
same issue is still present. As in the Aoke/Langalanga electorate I discussed in Chapter 8 where
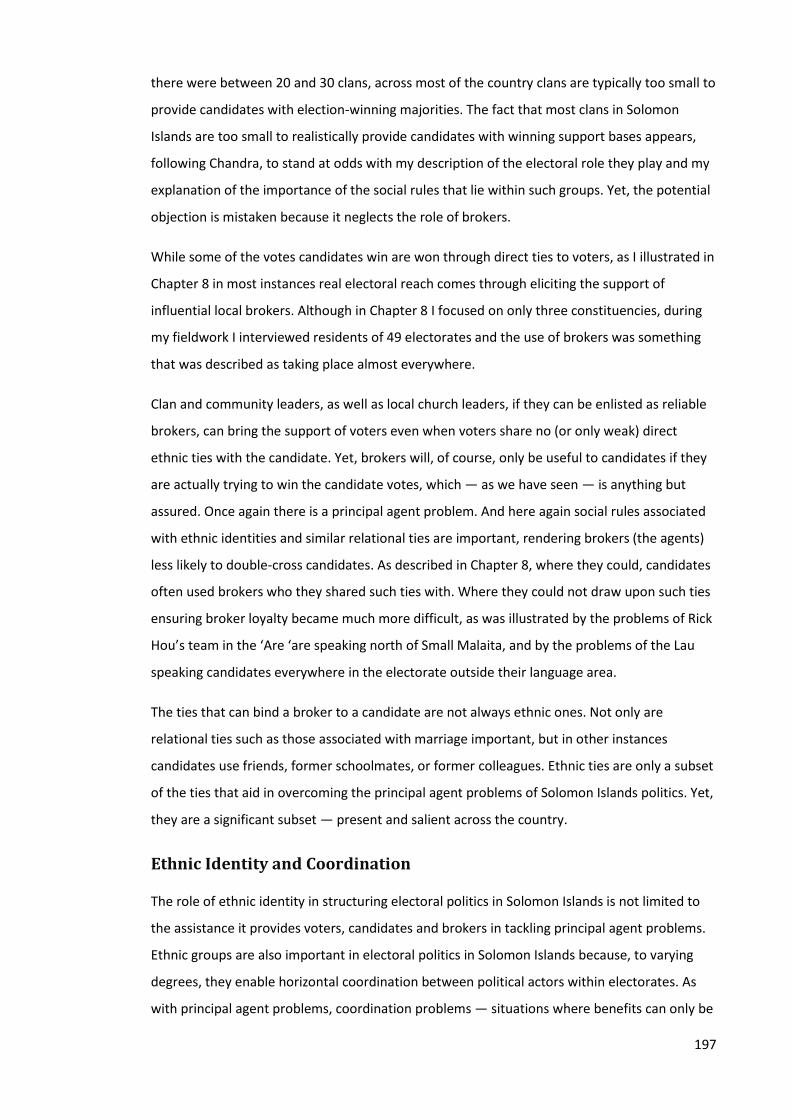
197
there were between 20 and 30 clans, across most of the country clans are typically too small to
provide candidates with election-winning majorities. The fact that most clans in Solomon
Islands are too small to realistically provide candidates with winning support bases appears,
following Chandra, to stand at odds with my description of the electoral role they play and my
explanation of the importance of the social rules that lie within such groups. Yet, the potential
objection is mistaken because it neglects the role of brokers.
While some of the votes candidates win are won through direct ties to voters, as I illustrated in
Chapter 8 in most instances real electoral reach comes through eliciting the support of
influential local brokers. Although in Chapter 8 I focused on only three constituencies, during
my fieldwork I interviewed residents of 49 electorates and the use of brokers was something
that was described as taking place almost everywhere.
Clan and community leaders, as well as local church leaders, if they can be enlisted as reliable
brokers, can bring the support of voters even when voters share no (or only weak) direct
ethnic ties with the candidate. Yet, brokers will, of course, only be useful to candidates if they
are actually trying to win the candidate votes, which — as we have seen — is anything but
assured. Once again there is a principal agent problem. And here again social rules associated
with ethnic identities and similar relational ties are important, rendering brokers (the agents)
less likely to double-cross candidates. As described in Chapter 8, where they could, candidates
often used brokers who they shared such ties with. Where they could not draw upon such ties
ensuring broker loyalty became much more difficult, as was illustrated by the problems of Rick
Hou’s team in the ‘Are ‘are speaking north of Small Malaita, and by the problems of the Lau
speaking candidates everywhere in the electorate outside their language area.
The ties that can bind a broker to a candidate are not always ethnic ones. Not only are
relational ties such as those associated with marriage important, but in other instances
candidates use friends, former schoolmates, or former colleagues. Ethnic ties are only a subset
of the ties that aid in overcoming the principal agent problems of Solomon Islands politics. Yet,
they are a significant subset — present and salient across the country.
Ethnic Identity and Coordination
The role of ethnic identity in structuring electoral politics in Solomon Islands is not limited to
the assistance it provides voters, candidates and brokers in tackling principal agent problems.
Ethnic groups are also important in electoral politics in Solomon Islands because, to varying
degrees, they enable horizontal coordination between political actors within electorates. As
with principal agent problems, coordination problems — situations where benefits can only be

198
realised when multiple actors can be induced to act in a particular way — are well described in
social science work (Bowles 2009, p. 25), and it is easy to see their applicability in electoral
politics where success requires coordinated action and winning the support of large numbers
of people (Cox 1997). It is also easy to see their potential applicability to ethnic politics. An
ethnic group is more likely to be electorally competitive if it can coordinate its support behind
one candidate.
A good example of coordination, and coordination failures, at work in Solomon Islands
electoral politics comes from the ethnic electioneering in the Small Malaita electorate I
described in Chapter 8. There, in the 2010 election, South Seas Evangelical church pastors
were able to come to agreement amongst themselves to back Rick Hou. Something similar also
occurred amongst the network of chiefs from Hou’s Sa’a speaking part of the constituency. As I
discussed, neither church nor chiefly network were so strong as to prevent other candidates
from within their relevant groups from standing. However, they could still facilitate
coordination, allowing influential actors to agree on who to support and to work together in
campaigning. These coordination successes were partial but nevertheless important in Hou’s
victory and were in stark contrast with the coordination failure and numerous candidates from
the Church of Melanesia on the other side of the electorate.
An even more striking example of ethnic electoral coordination can be found in the Christian
Fellowship Church, which has significant numbers of adherents (greater than 20 per cent of the
population) in three electorates in Solomon Islands’ Western Province as well as smaller shares
in several other Western Province electorates. The Christian Fellowship Church is an offshoot
of the United (Methodist) Church and was formed under the leadership of a charismatic local
leader, Silas Eto (Bennett 1987, pp. 299–301). Although a schism is now in the process of
changing matters, until recently the church had very strong internal discipline (Paia 1983; Allen
et al. 2013, p. 63). Quite how the church has been able to elicit this is debated. At least one
study (Hviding 2011) suggests cooperation is voluntary, and that the church has earned it
through the wisdom of its leaders. Set against this are the claims of others who argue
cooperation, including electoral cooperation, is compelled rather than voluntary (see, for
example: Talasasa 1979, pp. 55-56). It is not my place to adjudicate on this — although reports
of violence associated with the recent church split (Osifelo 2012a) add credence to allegations
of coercion. For my work, more important than exactly how the church is able to exert such
strong control over its adherents is simply that it has been able to do so.
Figure 9.1 shows polling station results for 2010 in North New Georgia electorate (members of
the Christian Fellowship Church comprise 59.11 per cent of the electorate’s population). The

199
winner Job Dudley Tausinga was a senior member of the church (the son of its founder) and
has won every election he has contested in the electorate (he first stood in 1984). In 1993 and
2006 he won unopposed. In 2010 Tausinga won 73.9 per cent of the votes cast.
Figure 9.1 – Results by Polling Station North New Georgia Electorate 2010
Tausinga’s only significant opponent in 2010 was Dewin Alick, a Seventh Day Adventist (the
Adventists are the only other church present in any numbers in the electorate).149 By the
standards of losing candidates in Solomon Islands elections Alick did not do particularly poorly,
winning many of the votes in polling stations serving Seventh Day Adventist villages, yet he still
fell far short of a winning vote share. In addition to winning a number of Seventh Day
Adventist votes, Tausinga won almost every vote cast in Christian Fellowship Church villages.
(Of the polling stations shown in the chart above, Jericho, Paradise and Keru were located in
CFC villages, Mase and Njella polling stations were in SDA villages, and Ramata and Kolobagea
polling stations served both SDA and CFC villages.150) Tausinga was the only Christian
Fellowship Church candidate standing in 2010 and in the seven elections he has won in North
New Georgia he has never faced opposition in the form of other candidates from his church.
149
His other opponent, Nuatali Tongarutu was a Honiara-based lawyer who had relatives in North New Georgia but who was not actually from the electorate herself, and who received less than two per cent of all votes cast. One explanation I heard as to why Alick and Tongarutu stood was that the church schism had already started to become apparent prior to the 2010 election and that they stood anticipating a divided church. However, in the lead-up to the election church divisions were healed (albeit only temporarily) leading to resumed electoral unity. 150
This assessment is based on interview Hon11, an interview with a political actor (who asked to remain anonymous) from North New Georgia as well as ward-level census data on churches.
0
100
200
300
400
500
600
Keru Kolobaghea Njella Ramata Jericho Mase Paradise
KOLOMBAGHEA KUSAGHE
Rejected Votes
Nuatali Tongarutu
Dewin Alick
Job Dudley Tausinga

200
The difference between his clear blocks of support and the more fragmented polling station
results seen in most electorates is striking. The pattern of Tausinga’s support looks like it has
come from an ethnic bloc, yet his situation is unusual — the product of what was until recently
an atypically cohesive church, one where norms of cooperation (or coercive norms) were
sufficiently strong to elicit unity. This contrasts with the South Seas Evangelical church, which
in the Small Malaita example was able to achieve a considerable degree of electoral
coordination, and have its pastors endorse Hou, but which was unable either to prevent two
other candidates from the church from standing, or to obtain near perfectly unified voter
support of the sort the Christian Fellowship Church gained for Tausinga. The South Seas
Evangelical Church in turn contrasts with the experience of the Church of Melanesia in Small
Malaita which did not appear able to undertake any effective electoral coordination at all.
Contra the explanations of Posner and Chandra, the differing electoral importance of these
churches is not a product of size. At 60 per cent of North New Georgia’s population, the
Christian Fellowship Church would appear too large to be an ideal unit of electoral
coordination based on a pure size-based reckoning, and of the two churches discussed in Small
Malaita, the Church of Melanesia would, on the basis of size, appear to be the better unit of
electoral cooperation.
Rather than relative size, the differing degrees of electoral salience of the three churches
stems from the social rules which exist to differing degrees amongst them. Within the Christian
Fellowship Church they afford unity, within the South Seas Evangelical Church they provided
for a degree of cooperation, within the Church of Melanesia they were not able to facilitate
any significant electoral collective action whatsoever.
Churches are not the only ethnic groups within which social rules facilitate a degree of
cooperation in Solomon Islands electoral politics. Coordination of support for Rick Hou through
the Sa’a speaking chiefly network is another example and, as I showed in Chapter 8, David Day
Pacha also drew heavily upon clan and similar relational ties in coordinating his 2006
campaign. A further, somewhat different, example of clan based rules of cooperation at play in
electoral decisions comes from the answer I was given when I asked a candidate from East
Makira why he stood in Central Makira constituency rather than in his home electorate. One of
the reasons he offered stemmed from a norm of ethnic cooperation:
Two or three of the other candidates in East Makira were members of my extended tribe, and I felt that it was not right for me to contest against them in the same constituency, because the extended family would be put in an awkward position were I to stand against them. (Interview Hon10)

201
Similarly when I interviewed Stephen Ngele, a candidate in the 2003 by-election in South
Guadalcanal, and the brother of former MP Victor Ngele, he explained to me that his family
felt wronged when a close relative stood, violating a norm of conduct, and defeated Victor in
the 2001 election:
He was voted out, my brother, for Father Geve, our cousin, and in our tradition, two cousin brothers standing is not acceptable. (Interview Stephen Ngele)
Such examples suggest social rules within clans and similar groups often enable an element of
electoral coordination akin to that provided by some churches. In the two clan-based examples
above the social rules present at least provided a tendency towards the ethnic groups in
question uniting behind a favoured candidate. This, it should be stressed, was only a tendency.
The norm was felt but it did not prevent Geve from standing, and while the candidate I
interviewed from East Makira chose not to stand there, at least one, and possibly two, other
members of his ethnic group clearly were not restrained by the same compunction.151 The role
played by the clans in question was closer to that of the South Seas Evangelical Church in Small
Malaita than the Christian Fellowship Church in North New Georgia.
In many instances, social rules associated with ethnic groups help structure electoral
coordination in Solomon Islands, but it is rarer for them to perfectly determine it.
Nevertheless, in elections some coordination is still better than none, and enabling
coordination is another role ethnic identity plays in Solomon Islands electoral politics.
Ethnic Identity and Beyond
Figure 9.2 below illustrates the model I have developed in theorising the relationship between
ethnic identity and voting in Solomon Islands. In it social rules within ethnic groups afford a
degree of both horizontal cooperation, which can enable coordination problems to be
overcome, and vertical trust, which may enable principal agent problems to be addressed.
Both because they provide a partial means of overcoming the principal agent problems of
Solomon Islands politics and because they can enhance within-group electoral coordination,
social rules associated with ethnic identity play an important role in electoral politics in
Solomon Islands. However, except in rare cases such as that of the Christian Fellowship Church
where social rules are particularly strong, ethnic identity plays only a contributing role in
structuring electoral politics. In other instances the calculations of voters and brokers are only
partially determined by social rules associated with ethnic groups, and the actions and non-
151
I provided similar examples including brother standing against brother and husband standing against wife in Footnote 24 in Chapter 3.

202
ethnic attributes of individual candidates and MPs are important. Victor Ngele and David Day
Pacha achieved resounding wins after their first terms as representatives for South
Guadalcanal not because their churches or clans suddenly grew but because they succeeded in
delivering benefits to a significant number of their constituents. Meanwhile, Victor Totu lost
heavily at the end of his first term as MP for South Guadalcanal because he failed to deliver in
the same way.
Figure 9.2 – Coordination and Principal Agent Problems in Electoral Politics, and Ethnic Groups’ Roles in Overcoming Them
More systematically, the importance of MP performance, and its contribution to varying
results can be seen in Figure 4.12 in Chapter 4. The inter-quartile range of the vote shares of
first time winning candidates is much lower than the inter-quartile range of incumbent
Coordination problems lead to numerous candidates and fragmented support
Social rules in ethnic groups... ...aid coordination behind favoured candidates
...a
iden
forc
emen
t, o
r m
ake
act
ors
mo
re
like
ly to
ho
no
ur
com
mit
men
tsSo
cia
l ru
les
wit
hin
eth
nic
gro
up
s ...
Pri
nci
pa
la
gen
t pro
ble
ms:
ca
nd
ida
tes
can
no
t tru
st v
ote
rs; v
ote
rs c
an
no
t tr
ust
ca
nd
ida
tes
Pri
nci
pa
lage
nt p
rob
lem
s: b
roke
rs &
ca
nd
ida
tes
can
no
t tru
st e
ach
oth
er t
o
ho
no
ur
com
mit
men
ts
Pri
nci
pa
lage
nt p
rob
lem
s: b
roke
rs &
vo
ters
ca
nn
ot
tru
st e
ach
oth
er t
o h
on
ou
r co
mm
itm
ents
Soci
al r
ule
s w
ith
in e
thn
ic
gro
up
s...
...m
ake
act
ors
mo
re
like
ly to
ho
no
ur
com
mit
men
ts
Soci
al r
ule
s w
ith
in e
thn
ic
gro
up
s...
...m
ake
act
ors
mo
re
like
ly to
ho
no
ur
com
mit
men
ts

203
candidates. Most first time winners, absent the opportunity to prove themselves as effective
delivers of political patronage, win with low vote shares, often gaining support primarily from
co-ethnics as David Day Pacha did in 2006. Incumbent MPs on the other hand have a much
wider range of vote shares — some succeed in proving themselves as dispensers of resources
and their vote shares rise, while others do not and see vote shares fall as a result. In Figures
4.15 and 4.16 I also illustrated, and then demonstrated more systematically with a paired t-
test, that incumbent MPs are better able to win more geographically dispersed support. This
finding is in line with what we ought expect in a situation where voters’ choices tend to be
more heavily based on ethnic ties for first time MPs but which are subsequently also
influenced quite heavily by performance for incumbents. In charge of all the resources made
available to MPs in Solomon Islands, the average MP ought, even if they are not particularly
adept, at least prove their merits to some voters outside their ethnic groups, causing the
geographical dispersion of their supporters to spread, and this is what we see in the results of
the paired t-test.
To reiterate: in Solomon Islands voters voting for co-ethnics and more general electoral
cooperation within ethnic groups occurs as one means to an ends, the ends being access to
resources. Where ethnic identity can help in securing access to resources it is drawn upon, but
it is not the only factor contributing to electoral outcomes in Solomon Islands. Because ethnic
loyalties are not blind, and because voters are willing to vote for candidates who are not co-
ethnics if they can prove their worth, there is considerable scope for attributes such as MP
performance to help shape election results.
Does this Theory Fit with Election Results Patterns?
In my introductory chapter, as well as Chapters 4 and 7 I described the key features of
Solomon Islands electoral outcomes while at the same time demonstrating these features did
not fit well with existing theories of voting and ethnic politics. In defiance of the predictions of
Duverger’s Law, the observed and effective numbers of candidates are on average high in
elections in Solomon Islands. And while voters do often vote for co-ethnics, fluctuations across
time in electoral statistics such as candidate numbers and winning candidate vote shares are
too great to fit easily with primordial explanations of ethnic politics. At the same time,
contemporary constructivist theories of ethnicity and voter behaviour also fail to explain
Solomon Islands election results: in particular, as I showed in Chapter 7, the size of ethnic
groups appears to play no obvious role in determining the electoral importance of ethnic
identities.

204
The theory of ethnic voting I have advanced in this chapter is, on the other hand,
commensurate with the electoral outcomes we see in Solomon Islands. It fits both with the
higher-level patterns of electoral politics I described in Chapter 4 and also with the findings of
regression analyses I reported on in Chapter 7.
Group Numbers, the Strength of Rules and Candidate Numbers
Clans and similar relational groupings are home to social rules which are useful in overcoming
principal agent problems and coordination problems, and so are important elements of
electoral collective action in Solomon Islands. Yet as groups they are typically small and
numerous. Churches are somewhat larger on average but it is a rare church that is home to
social rules strong enough to perfectly coordinate electoral competition. Similarly, clans also
struggle in achieving perfect electoral unity.
Large numbers of ethnic groups combined with only imperfectly functioning social rules is a
key factor contributing to high average candidate numbers and to high effective numbers of
candidates. The weakly bound social environment of Solomon Islands make it hard for
coordination of the sort that has large numbers of people uniting behind one candidate. It also
makes it hard to compel individuals not to stand as candidates and as a result candidate
numbers are high on average.
The small size of groups such as clans also leads to a situation where candidates, in order to
garner sufficient votes to win, typically need to gather support from brokers, some who they
may share ethnic or similar relational ties with, but many with whom such ties are absent. The
uncertainties associated with this also contribute to candidate proliferation, as candidates —
such as Matanani in Aoke/Langalanga — stand having being deceived by brokers into thinking
they have a chance of winning. In an environment of such imperfect information it is hard for
candidates to accurately assess their electoral chances.
At the same time, for many of the candidates that stand in Solomon Islands elections, even
those never destined to win, there will typically be a group of at least some voters who share
strong relational ties to them, and who will vote for them even if the chances of victory are
small. Something they will do either because the payoffs of victory are anticipated to be
particularly high, even if the probability of victory is low, or because they fear the
consequences of being thought not to have voted for a candidate who they were obliged to
support. Such groups of supporters contribute to the high effective number of candidates seen
in Solomon Islands.

205
Individual Performance, Ethnic Voting and Electoral Outcomes
It is no coincidence Job Dudley Tausinga is the longest serving MP in the current Solomon
Islands parliament having won seven consecutive elections in North New Georgia. As the
beneficiary of an ethnic group that has been bound by very strong social rules, electoral
success has come easily for him. Yet Tausinga, and the Christian Fellowship Church, are outliers
in the ethnic politics of Solomon Islands; almost all other candidates, while benefitting from
ethnic ties to an extent, do not benefit from social rules that are as strong as those within
Tausinga’s church. As a result — like Matthew Wale in Aoke/Langalanga — they face
considerable challenges in their quest for re-election.
The fact that social rules are often only strong enough to weakly bind, combined with the
instrumental nature of ethnic electoral politics in Solomon Islands, also contributes to the
variability of election results I described in Chapter 4, and discussed further above. Because
ethnic loyalties are not blind, and because ethnic ties are rarely strong enough to perfectly
bind, there is much scope for individuals’ attributes to determine the outcomes of elections.
Candidate attributes and capabilities matter, and vary considerably between candidates. The
wide range of performance amongst MPs plays a major role in contributing to the significant
fluctuations in key election statistics over time. MPs, such as David Day Pacha in South
Guadalcanal, who master the challenges of patronage Solomon Islands style are able to
significantly boost vote shares. At the same time, mastery of the challenges of patronage
politics in Solomon Islands is not easy. Many MPs fail at it, struggling to manage local
interlocutors and to dispense resources effectively, something that contributes to lower vote
shares and high incumbent turnover rates. For ethnic politics to come coupled with stability
the social rules within ethnic groups need to be strong and the groups involved need to be
large. Where they are not, as is the case in most instances in Solomon Islands, the scope for
fluctuations in electoral outcomes is much increased.
The Importance of Social Rules and Why Some Ethnic Groups Become Electorally
Salient While Others Do Not
In the regressions I reported on in Tables 7.3, 7.4 and 7.5 in Chapter 7, where I regressed the
population share of those groups most likely to structure electoral politics on the basis of size
against winning candidate vote shares, I failed to find any relationship between ethnic group
size and the relative importance of ethnic identities within electorates. This was the case not
because ethnic groups play no role in electoral politics in Solomon Islands but because, as I
have discussed above, not all ethnic groups are equal: some contain social rules within them
which enable a degree of electoral collective action, others do not. And whether social rules
are present or not is a far more important determinant of electoral significance in the Solomon

206
Islands case than group size. With this fact borne in mind the regression results from Chapter 7
begin to make more sense. The independent variables in my regressions were either church
group or language-group population share, with the group used chosen on the basis of its size
alone, and I failed to find results in these group-size based regressions for two reasons. First, as
shown in my cases from Chapter 8, and as I discuss further below, not all churches are bound
by strong enough social rules to facilitate effective electoral collective action. Second, language
groups, as entities in Solomon Islands, are very rarely bound by these sorts of social rules. And
because some churches and almost all language groups are not bound by such rules there is
nothing to enable them to routinely become units of electoral collective action whenever they
are of an optimal size. This fact explains the absence of any association in the group-size based
regressions.
Clans, on the other hand, are often bound by social rules of the sort useful to electoral politics.
Because I do not have data on the size of clans in Solomon Islands I was not able to directly
test their electoral importance in Chapter 7. However, while I did not obtain any results in
those regression I ran in Chapter 7 in which group size determined the ethnic identity I used, I
did find a weak relationship between language group population share and winning candidate
vote share (in Table 7.6). Because the relationship was weak, it was not evidence of language
groups functioning as electoral blocs. However, the weak relationship that I found, while
certainly not definitive evidence, fits well enough with a scenario in which clans, as sub-groups
of languages, play an electorally significant role, of the sort I have described them as playing in
this chapter and in Chapter 8.
Similarly, in Chapter 7 I also found a strong relationship between language group size and the
total votes attained by all candidates from within language groups (shown in Tables 7.7, 7.8
and 7.9). This finding also fits with clans, as subsets of language groups, being electorally
important. Adding to the evidence from Chapter 7, in Appendix 5 I provide further evidence of
the electoral importance of clans by showing that candidates tend, on average, to win more
geographically dispersed voter support in provinces where clans are cross cutting (situations
where the same clans are found across larger geographical areas) than in provinces where they
are not. While, absent actual quantitative data on clan numbers and group size, it is not
possible to provide definitive large-N evidence to accompany the case study and interview
evidence I have provided on the electoral importance of clans, the evidence which is available
fits with the role I have ascribed to them. A role which hinges on clans possessing electorally
useful social rules.

207
Clans possess such social rules and are often electorally important ethnic groups. Language
groups on the other hand usually do not, and as a result language groups are not electorally
important ethnic groups in Solomon Islands. Meanwhile, churches — as the respective fates of
the Christian Fellowship Church, the South Seas Evangelical Church and the Church of
Melanesia have shown — sometimes possess electorally useful rules and sometimes do not.
Putting Theory to the Test
While I am able to demonstrate my theory fits with election results patterns as well as the
regression results of Chapter 7, and while the theory I have provided also meshes well with the
survey and case data I offered in Chapter 8, additional tests are still desirable.
In particular, my core claim that ethnic groups become electorally important in Solomon
Islands when they are bound by social rules which enable more effective collective action
would become more convincing were I able to test it directly, rather than simply explain after
the fact how it fits with previous results.
Different Churches and Different Social Rules
One clear test of my theory can be had through examining the relative electoral fortunes of
different church groups. Churches are, as I discussed in Chapter 8, and earlier in this chapter
with the example of the Christian Fellowship Church, electorally important ethnic groups in
instances where they are home to social rules that enable electoral coordination. Yet not all
churches are home to such rules in equal degrees, and variation in this affords the potential for
testing.
Specifically, in my case examples in Chapter 8 and in my theorising above I detailed the
differing degree to which three different churches — the South Seas Evangelical Church, the
Church of Melanesia, and the Christian Fellowship Church — possessed electorally-useful
social rules. In the case and theoretical work I described the Church of Melanesia as lacking
social rules of the sort useful in electoral competition. The South Seas Evangelical Church had
stronger rules, although they were far from perfectly binding. The Christian Fellowship Church,
on the other hand, was home to very strong social rules, which enabled it to function
effectively as an electoral bloc.
Although I do not have quantitative data to directly measure social rules in action, on the basis
of observations of the three churches, the theory I have advanced offers a clear prediction
which I can test using census data, candidate bio-data and election results.

208
Specifically, because they contain social rules conducive to electoral collective action to
differing degrees, the three churches will differ in the extent to which they can unite church
members behind favoured candidates in electoral contests at the constituency level. On the
basis of my qualitative data I expect the Christian Fellowship Church to be best at uniting
support behind favoured candidates, with the South Seas Evangelical Church also doing well,
albeit not as well. On the other hand I do not expect the Church of Melanesia to be at all
effective at promoting electoral coordination (recall its complete inability to do this in Small
Malaita).
The unit of analysis for the test is electorates. The dependent variable of interest is the vote
share of the highest polling candidate in each electorate from each church. The rationale for
choosing the highest polling candidate is that if the church in question has engaged
successfully in electoral collective action this is the candidate most likely to have benefitted
from it.152 The independent variable of interest is the population share of the church in
question. In instances where churches possess social rules which enable them to effectively
engage in electoral collective action we should anticipate population share and the vote share
of the top candidate to be similar. Certainly, in a world where church is not the only
determinant of voter choice, a perfect correlation across electorates is too much to ask but at
least some relationship across electorates ought to be apparent if the church in question is
managing to successfully engage in electoral collective action, mustering its adherents to the
support of a favoured candidate.
In the case of the three churches in question, the expectation, if my theory is correct, is that
there will be a strong correlation between population share and top candidate vote share for
the Christian Fellowship Church, a weaker correlation for the South Seas Evangelical Church,
and no correlation between population share and vote share for Church of Melanesia
candidates.
The data I draw upon come from 2006 and 2010 general election results and the 2009 census.
For these two elections I also have information of the church denomination of almost all major
candidates, and the census provides me with electorate-level data on the population share of
church groups.
152
It would be inappropriate to include all candidates from each church in the regression because, except for the unique case of the Christian Fellowship Church, churches in Solomon Islands do not have the ability to compel people not to stand, meaning that what I am seeking to test is their ability to unite support behind a favoured candidate rather than a relationship between church share and the support of all candidates from the church.

209
Testing a Simple Model
Figure 9.3 below shows scatter plots, with fitted OLS regression lines for the three churches.
Each point on the chart is an electorate. The dashed light grey line represents a one to one
relationship, the relationship we would see if church population shares and vote shares
matched. Importantly, unlike the other two churches discussed, the Church of Melanesia is
close to being the sole church (one hundred per cent population share) in a number of
constituencies. In these constituencies it would seem unfair in a country where very few
candidates win large majorities (and at odds with the predictions of Posner and Chandra) to
expect church share to equal vote share. For this reason I have excluded from the charts any
electorates where the church in question formed more than 60 per cent of the population (a
restriction that only impacts on the Church of Melanesia and ensures I am comparing like with
like). However, in the regressions that follow, I test relationships both including and excluding
electorates where the church of Melanesia comprises more than 60 per cent of the
population.
Figure 9.3 shows clear differences. With the Christian Fellowship Church there is a strong
relationship between church share and vote share, and the OLS line is very close to the line
plotting the one to one relationship.153 For the South Seas Evangelical Church a relationship
also appears to exist, although there is considerably more variation around the OLS line and it
does not track as closely with the line plotting the one to one relationship. For the Church of
Melanesia there does not appear to be a relationship at all (indeed if anything it appears to be
slightly negative although this trend is the product of an outlier — East Malaita).
In Table 9.1 below I present the results of simple bivariate regressions, run for each church of
interest, regressing population share and vote share. For the Church of Melanesia I ran
regressions both for the full population of constituencies where it had candidates, and also re-
ran them limiting the analysis to electorates where the church comprises less than 60 per cent
of the population (a change that only impacts on the results for the church of Melanesia as
there are no electorates where the two other churches comprise more than 60 per cent of the
population).
153
The one clear aberration from the trend comes is from Aoke/Langalanga where the candidate Tony Wale, a former Catholic, is a convert to the Christian Fellowship Church, having joined the church upon marrying an adherent. There are very few Christian Fellowship Church members in Aoke/Langalanga but Wale, as discussed in Chapter 8, was able to do well on the basis of his previous work in the electorate and clan ties. Arguably I should exclude Wale from my analysis. If I do those the regression coefficient for the church becomes 1.008 and is significant at the 1 per cent level. However, in my scatter charts and regression results below I have included Aoke/Langalanga so as to avoid the perception I have excluded cases to increase the fit of my model.

210
Figure 9.3 – Church Share and Top Candidate Vote Share: Christian Fellowship Church, South Seas Evangelical Church and Church of Melanesia

211
Table 9.1 – Individual Regressions for the Three Churches of Interest
Top candidate vote share
Christian Fellowship Church Popn. Share
0.862 **
(0.282)
Constant 0.041
(0.063)
R2 0.718
n 9
Top candidate
vote share
South Seas Evangelical Church Popn. Share
0.651 ***
(0.166)
Constant 0.029
(0.038)
R2 0.305
n 44
Top candidate vote share (all electorates)
Top candidate vote share (only electorates where population share <60%)
Church of Melanesia Popn. Share
0.148 -0.036 (0.242) (0.096)
Constant 0.142** 0.193*
(0.062) (0.098)
R2 0.070 0.001
n 52 32
Robust standard errors clustered at the electorate level in parentheses; ***significant at the 1% level; ** significant at 5% level; * significant at 10% level.
Because I am working off two years’ data all regressions were run using robust standard errors
clustered at the electorate level.154
The results reflect the visual patterns present in the charts. With the Christian Fellowship
Church there is a strong relationship between church population share and the vote share of
the top candidate. The regression coefficient is close to one and the R-Squared high. The
result for the South Seas Evangelical Church is also clear: the regression coefficient and R-
squared are high, albeit not as high as for the Christian Fellowship Church. The results are
much weaker for the Church of Melanesia. Interestingly, in the case of the Church of
Melanesia, contrary to what we might have expected based on the assumption that population
154
Because the charts suggest outliers may be skewing results, as a robustness test I ran regressions using the iteratively weighted least squares option suggested by Hamilton (2009, p. 256) and Treiman (2009, p. 237) as a means of systematically mitigating the influence of outliers. The only substantial change on doing this was that a weak positive relationship between population share and vote share emerged for the Church of Melanesia when the regression was run across all electorates. However, the relationship was still much weaker than for the other two churches. I also re-ran the regressions without robust standard errors clustered at the electorate level — results were effectively the same. Because the numbers of constituencies are quite low I also ran regressions with bootstrapped standard errors. The results were very similar. For a small number of electorates there were candidates whose denomination I did not know who received more votes than those of the top candidate from one or all of the churches of interest. As a robustness test I re-ran the regressions excluding these electorates. Results were effectively the same, with the only difference being the regression coefficient increased somewhat for the South Seas Evangelical Church, and that in some instances, owing to a very small n, the statistical significance of findings for the Christian Fellowship Church became less.

212
size mattered, while a relationship does not exist when the regression is run only on
electorates where the church makes up less than 60 per cent of the population, it appears to
exist, at least weakly, when run across all electorates where the church has candidates.155
However, the regression coefficient is still substantially lower for the Church of Melanesia than
the other two churches, suggesting much weaker electoral coordination. Similarly, the R-
squared for the Church of Melanesia regressions is low, little of the variation in vote shares is
explained by variation in the Church of Melanesia’s population. The top Church of Melanesia
candidates do seem perhaps to do better in electorates where the church has a larger
population, but the average candidate falls a long way short of commanding anything near the
votes of all their co-religionists.
Testing a Full Model
Of course the findings presented in Table 9.1 could be spurious. As is always the case when
inferring from data at one unit of analysis (in this case the constituency) to a different unit of
analysis (in this case the voter) there is the risk of ecological fallacy. The risk is reduced by the
fact that the relationship for the Christian Fellowship church and South Seas Evangelical
Church is strong and holds across the electorates where the two churches are present.
However, there is still the chance the correlation is spurious: possibly, for example, candidates
are voting along language lines, and there is a correlation between language group size and
church group size. Nothing in the anthropological literature on Solomon Islands suggests this is
likely, but controlling for confounding factors is nevertheless prudent.
Accordingly, in Table 9.2 below I present the results of multiple regressions run in which
control variables are added for incumbency, population share of the candidate’s language
group and estimated voting age population of the electorate (as its natural log owing to
skewed data). These are the three other electorate features which might plausibly be
correlated with top candidate vote share. Because my model now has a number of control
variables and because the number of electorates which the individual churches are present in
is quite low, to allow for more efficient regression analysis, rather than run separate
regressions for all churches, I ran my regression using combined data. I established the effects
of the churches of interest using dummy variables for each candidate’s church affiliation and
then an interaction term for each church which interacts its dummy and the church’s
population share. The reference category (the omitted church group) is ‘Other’ an amalgam of
the Catholic Church, United Church, Seventh Day Adventists and a number of small
155
The reported regression coefficient is very close to significance at the 10 per cent level.

213
churches.156 As suggested by the coefficients for the variable for church population share in
Table 9.2 there is a positive relationship (albeit a small relationship in terms of magnitude)
between vote share and church population share within the ‘Other’ category, and the
coefficients in the models shown in Table 9.2 need to be interpreted bearing this in mind.
Reflecting this, for the three key variables of interest (the interaction terms for the three
churches) in Table 9.3 I report combined coefficients (a linear combination of individual
coefficients and the coefficient for the variable ‘Church Popn Share’) to allow easier
interpretation of magnitude. The table also reports on the results of F-tests, which show
whether the combined coefficients for each of the churches of interest are statistically
significantly different from zero.157 Because, in preliminary tests, residuals showed some
heteroskedasticity and skew all tests were run using Stata’s robust standard errors option to
provide Huber/White estimators of variance (Hamilton 2009, p. 271). Because two years’ data
are used I also clustered standard errors at the electorate level.158
Tables 9.2 and 9.3 both report on the results of four different regressions. Models one and two
(the left-most columns in the tables) were run for all electorates; models three and four were
run only with electorates where the Church of Melanesia was less than 60 per cent of the
population (acting on the assumption that it is fairest to compare like with like). Models one
and three were run excluding the dummy variable for candidate incumbency. I did this owing
to potential endogeneity. While being an incumbent may increase vote share, being from a
church able to unite behind a candidate will increase the chances of the candidate being the
incumbent where church population share is high, which may lead to underestimation of the
relationship between population share and vote share.
The results are similar to those in the simple regressions presented in Table 9.1. The most
substantial change is that the regression coefficient for the Church of Melanesia is now no
longer close to being statistically significant, nor is it of particularly substantial magnitude in
156
Although it is beyond the scope of this study to analyse the other churches, of the major churches included in the ‘Other’ category, there appears to be a relationship between church population share and vote share for the Seventh Day Adventist Church, while the relationship is not present for the United Church or the Catholic Church (although it becomes present in instances when the regressions are limited to electorates where the churches have population shares of less than 60 per cent). 157
Combined coefficients were generated using Stata’s lincom command. The coefficient of the variable Church Popn Share was combined with the interactive term for each church as, in the presence of the interactive terms for the three churches of interest, it takes on the value of the omitted category. 158
Results were very similar, it should be noted, when I ran regressions without using clustered robust standard errors. I also ran regressions using an iterative least squared model (to ensure results were not driven by outliers) with very similar results. I also ran regressions excluding instances where candidates whose denomination I did not know polled higher than the top candidates in the three churches of interest: once again results were similar. When I ran regressions iteratively adding my control variables one at a time to the variables of interest results changed very little. Regression results were also very similar when I added a dummy variable for the election year into the regression equation.

214
any of the models. On the other hand, as in the simple bivariate regressions, the coefficients
for the interactive terms for the South Seas Evangelical Church are positive, statistically
significant, and of substantive magnitude across all the models. Similarly the coefficients for
the Christian Fellowship Church are of substantive magnitude in all models and are statistically
significant in the first and third models. The only un-anticipated finding is that the coefficient
for the Christian Fellowship Church is only marginally larger than that of the South Seas
Evangelical Church in the two models with incumbent dummy variables. The coefficient for the
Christian Fellowship Church is also not statistically significantly different from the coefficient
for the reference category in these two models, although in both instances it is very close to
being statistically significant at the 10 per cent level, and as Table 9.3 shows it is statistically
significantly different from zero.
The probable explanation for the smaller coefficient for the Christian Fellowship Church in the
models with an incumbent dummy included is, as I discussed above, endogeneity between
incumbency and vote share. Where it has the population share to give it a chance, the
Christian Fellowship Church has been particularly effective in turning its candidates into MPs
meaning there is a strong correlation between incumbency and population share with the
direction of causality running from church population share to incumbency.
These results provide clear evidence in support of my theory. Social rules are strong within the
Christian Fellowship Church and this is reflected in a strong (both substantive and statistically
significant) relationship between the church’s population share and church candidates’ vote
shares across electorates. Social rules are weaker in the South Seas Evangelical Church but still
sufficient to enable a significant degree of electoral coordination as can be seen in the
regression results. Meanwhile, I described the Church of Melanesia as an ethnic group largely
lacking rules of the sort which might enable effective electoral collective action, and this too
fits with the results of the regressions, where we see no relationship between Church of
Melanesia population shares and candidate vote shares.

215
Table 9.2 – Combined Regressions with Controls Added
All electorates no incumbent
dummy
All electorates incumbent
dummy
Limited electorates no
incumbent dummy
Limited electorates incumbent
dummy
Church Popn Share 0.237*** 0.133** 0.237*** 0.127*
(0.069) (0.065) (0.069) (0.064)
Language Popn Share 0.103** 0.093** 0.104** 0.094**
(0.044) (0.035) (0.045) (0.036)
Electorate Population (natural Log)
0.035 0.029 0.037 0.034*
(0.022) (0.019) (0.024) (0.019)
Christian Fellowship Church Dummy
-0.087 -0.071 -0.087 -0.071
(0.065) (0.062) (0.065) (0.062)
Church of Melanesia Dummy
0.021 -0.001 0.077 0.028
(0.071) (0.058) (0.102) (0.079)
South Seas Evangelical Church Dummy
-0.113** -0.130*** -0.114** -0.133***
(0.050) (0.038) (0.050) (0.038)
Christian Fellowship Church & Popn Share Interacted
0.656** 0.438 0.657** 0.430
(0.245) (0.268) (0.246) (0.273)
Church of Melanesia & Popn Share Interacted
-0.096 -0.032 -0.299 -0.124
(0.124) (0.108) (0.253) (0.191)
South Seas Evan Church & Popn Share Interacted
0.406** 0.407*** 0.407** 0.409***
(0.169) (0.148) (0.169) (0.148)
Incumbent Dummy 0.154*** 0.162***
(0.022) (0.023)
Constant -0.207 -0.160 -0.223 -0.200
(0.196) (0.171) (0.211) (0.175)
R2 0.209 0.377 0.208 0.382
n 216 216 198 198
Robust standard errors clustered at electorate level in parentheses; ***significant at 1%; ** significant at 5%; * significant at 10%.
Table 9.3 – Key Interaction Terms, Combined Coefficients
All Electorates No Incumbent
Dummy
All Electorates Incumbent
Dummy
Limited Electorates
No Incumbent Dummy
Limited Electorates Incumbent
Dummy
Christian Fellowship Church 0.893*** 0.570** 0.895*** 0.557**
(0.237) (0.265) (0.238) (0.268)
Church of Melanesia 0.141 0.101 -0.061 -0.003
(0.105) (0.095) (0.241) (0.185)
South Seas Evangelical Church 0.643*** 0.540*** 0.644*** 0.536***
(0.156) (0.139) (0.156) (0.140)
Robust standard errors in parentheses; ***significant at 1%; ** significant 5%; * significant at 10%.
Conclusion
Over this chapter I have developed a theory of ethnic voting in Solomon Islands. I have done so
drawing upon the case evidence I provided in the previous chapter and relating it to principal
agent problems and coordination problems. Having developed theory I then explained how the
theory fits with the broader patterns of electoral politics present in Solomon Islands. In the
final section of the chapter I also put my theory to the test, finding its predictions fit observed
outcomes when I regressed church group population data against candidate vote shares.

216
The central argument I made in detailing my theory was that ethnic identity is electorally
important in Solomon Islands when social rules within ethnic groups enable actors to (at least
partially) overcome the collective action problems inherent to electoral politics in the country.
This explanation of ethnic politics clearly differs from those (discussed in Chapter 6) which
posit ethnicity influencing electoral politics through non-reasoned attachments to ethnic
identities. In my explanation, ethnic identity’s impact comes through the interaction of the
reasoned calculations of voters, brokers and candidates, and the social rules within ethnic
groups.
My explanation is closer to those of Posner (2005), Chandra (2004) and Carlson (2011) (also
covered in Chapter 6) who explain the impact of ethnic identity as occurring via anticipated
assistance and anticipated support. However, there is still a clear difference between my
explanation and theirs. Unlike Posner, who argues ethnic identities impact on expectations of
assistance through their historical importance, Chandra who has ethnic identities playing a
heuristic role through the visibility of the traits that they are based on, and Carlson who has
ethnic identity as important owing to past experiences of assistance, my explanation hinges on
the presence of social rules within ethnic groups. There is overlap — in my explanation, as in
Chandra’s, ethnic identity is playing a heuristic role, and like Carlson I find past experiences of
assistance as important — however, social rules are largely absent from their explanations,
while being central to mine.
My explanation is closer still to that of Keefer (2010), who — as I explained in Chapter 6 — has
ethnic identity as electorally important owing to networks within ethnic groups, yet my
explanation differs from Keefer’s too, in that, rather than networks, I focus on social rules.
Ethnic networks are certainly important in Solomon Islands but only when they are bound by
rules which help overcome principal agent problems and coordination problems. The Church
of Melanesia is as much of a network as the South Seas Evangelical Church and the Christian
Fellowship Church. However, because it is not home to social rules which enable effective
electoral collective action, it is largely unable to unite group members in pursuit of electoral
success.
In the following chapter, the Conclusion, I tie my findings and theory back to my research
questions, detail the limitations of my research, and discuss the ramifications of my theory for
the study of ethnic politics beyond Solomon Islands.

217
Chapter 10 – Conclusion
Over the course of this thesis I have described the key features of voter behaviour and
electoral politics in Solomon Islands. As I have done this, I have shown that although Solomon
Islanders do display a propensity to vote for co-ethnics in instances, existing theories of ethnic
voting do not fit well with the country’s election results patterns. As a consequence, in the
previous chapter I outlined a different theory of ethnic voting. A theory which hinged on social
rules within ethnic groups, and which had these rules explaining why, and partially
determining when, Solomon Islanders voted along ethnic lines.
In this chapter, the concluding chapter of my thesis, I take the theory of ethnic voting I have
advanced and return with it to my key research questions — questions outlined in the
introduction — addressing each question in turn. I then discuss the ramifications of my
research and propose areas for future study.
Solomon Islanders, Voting and Ethnic Identity
The questions I posed for my research at the beginning of this thesis were:
To what extent do Solomon Islanders vote for co-ethnics?
Amongst the range of ethnic identities potentially salient in Solomon Islands elections,
which are actually drawn upon in electoral politics?
When Solomon Islanders vote for co-ethnics why do they do so?
What causes some ethnic identities to become more salient than others in contributing
to voters’ choices?
How is ethnic voting associated with observed broader patterns of electoral outcomes
and electoral politics in Solomon Islands?
Although I have not made specific reference to these questions in my intervening work, it has
provided answers to them, answers which I now work through as a means of summarising my
research and its findings.
The Extent to Which Solomon Islanders Vote for Co-ethnics
Although, owing to social desirability bias and other methodological issues, it is not possible to
use survey data to provide an exact estimate of the extent to which Solomon Islanders vote
ethnically, on the basis of available evidence it appears safe to state that Solomon Islanders
often vote for candidates whom they share ethnic ties with. Yet voting for co-ethnics is far

218
from universal. Amongst the aggregated survey data provided to me by the undertakers of the
RAMSI People’s Survey there was certainly evidence of voting either along clan (or familial)
lines, as well as evidence of church-based voting. However — even allowing for social
desirability bias causing under reporting of ethnic voting — the range of additional responses
present suggests other factors are also at play. Similarly, while my interview and case data
provided good examples of voting along ethnic lines, other interviews, as well as election
outcomes, provided clear examples of voting that was not directly related to ethnic identity.
David Day Pacha, for example, managed to more than double his vote share in South
Guadalcanal between 2006 and 2010. Either he had a lot of co-ethnics who did not vote for
him in 2006, or a significant number of people who did not share an ethnic identity with him
voted for him in 2010.
The Ethnic Identities that are Drawn Upon in Politics
Of the range of ethnic identities that might plausibly structure electoral politics in Solomon
Islands only two appear to regularly do so: these are the identities based around clan and
church. Other possibly significant identities such as province and language group have not
regularly played a direct role in electioneering or in guiding the choices of voters.
Clans (as well as groups of people linked by similar ties such as those associated with marriage)
appear to be important in electoral politics throughout Solomon Islands. Churches, on the
other hand, are not inevitably electorally significant, and their impact varies from church to
church. The Church of Melanesia, for example, appears typically not to play a major electoral
role, while the Christian Fellowship Church is an example of a church that has been of clear
electoral importance in constituencies where it comprises a significant share of the population.
Why Solomon Islanders Vote for Co-ethnics when they Vote for Co-ethnics
When Solomon Islanders do vote for co-ethnics (or for similar categories of people such as
those they share relational ties with) they tend to do so motivated by one of two key factors.
Either they vote for co-ethnic candidates because they see co-ethnics as more likely to deliver
benefits should they be elected, or they vote for co-ethnics because they fear the
consequences of not voting for them. As I have discussed, the primary cause Solomon Island
voters have for believing there might be benefits stemming from voting for co-ethnics, or
consequences stemming from not voting for them, comes from the social rules which lie within
ethnic groups.
Specifically, within-group norms of obligation towards people from the same clan, or who
share relational ties, and in some instances within church groups, make it easier for voters to
ask co-ethnic MPs for assistance. And amidst the strongly clientelist politics of Solomon

219
Islands, the likelihood of personalised assistance is a key factor voters take into account when
deciding who to vote for. Naturally enough, candidates are aware of voters’ preferences for
personalised assistance, and inevitably promise such help during campaigning. Yet, for voters
— who find themselves confronting a principal agent problem in their search for assistance —
such talk is cheap. Voters typically need more than words to be convinced. And here social
rules can help by giving voters a sense of the likely actions of candidates should they be
elected.
At the same time, not all Solomon Islands voters are fully free to choose who to vote for.
Voting in a context where one way or another it is often possible for candidates to glean who
voted for them, a significant number of Solomon Islanders vote from fear of consequences.
Once again ethnic ties play a role in calculations of consequence. Specifically, the same norms
of obligation that see MPs obliged (to a degree) to help co-ethnics also often see voters
obliged to vote for members of their ethnic group, and fearing negative consequences if they
do not. Such consequences can be directly negative (voters run off the land they use for
gardens, for example) or less so (such as the cessation of assistance from a wealthy co-ethnic
who had helped in the past).
Social rules within ethnic groups, particularly rules of obligation and assistance, which either
compel voters to support co-ethnics or which aid them in overcoming principal agent
problems, are not the only means though which ethnic identity can become electorally
important in Solomon Islands.
Voters are also often persuaded, or coerced, into voting for a candidate by village-level
representatives — brokers. Brokers are used by almost all major candidates in Solomon Islands
elections and were described to me as being essential for electoral success. However, in
working with brokers candidates face a principal agent problem of their own. Brokers might be
effective means of garnering support, but only if they are actually honouring their promises to
the candidate. Here again social rules help, this time aiding candidates, who are better able to
trust co-ethnic brokers, or brokers sharing equivalent ties, owing to the behavioural impact of
the rules. The same phenomenon also helps brokers, to an extent, in working out which
candidates are more likely to keep their promises.
The social rules that sit amongst some ethnic groups are also electorally important in Solomon
Islands because they help some groups overcome coordination problems. Enabling groups to
at least partially coordinate support behind favoured candidates and to work together to
promote favoured candidates was, another important function for social rules, as the

220
campaigns of the successful candidates in my Small Malaita and South Guadalcanal cases
illustrated.
The choices made in these processes are largely reasoned choices. Not necessarily perfectly
reasoned choices — no doubt voters in Solomon Islands make all the mistakes behavioural
economists have found humans making in other aspects of life — but nevertheless choices
which fit much more closely to models of voter behaviour based on calculation than they do
with models focused on irrational pride or group attachment. However, while my model of
ethnic voting has more in common with work of contemporary theorists such as Chandra
(2004) and Posner (2005) whose models of ethnic voting hinge foremost on rational choices,
my explanation of ethnic voting in the Solomon Islands case differs from theirs in an important
way.159 In Chandra’s explanation ethnic identities form a potential basis of electoral politics
because ethnic traits are visible and so therefore offer an easy heuristic for voters trying to
identify parties or candidates likely to help them. In Posner’s explanation ethnic identities form
a potential basis of electoral politics because they have been afforded social significance by
history. In my explanation, on the other hand, ethnic identities shape the choices of voters
through the social rules which sit within (some) ethnic groups. This may seem a slight
difference, but it has important ramifications in determining which ethnic identities are
electorally salient in Solomon Islands, and which are not.
The Determinants of the Differing Electoral Importance of Ethnic Identities
In Solomon Islands it is the strength or weakness of social rules useful for electoral collective
action that plays the most important role in determining the extent to which different ethnic
identities and groups are electorally important. Clans and similar relational groupings are
bound, at least to an extent, by social rules, and as a result they are often an important
building block of electoral competition. Similarly, some churches — most strikingly the
Christian Fellowship Church — are home to similar rules and, as a consequence, have been
electorally important. On the other hand, other churches such as the Church of Melanesia do
not appear to possess strong norms of cooperation which translate well into the electoral
arena, and so do not structure electoral competition in any regular manner.
Similarly, language groups as entities themselves tend not to be bound by rules which
systematically aid in electoral coordination. There are some instances of something
approximating the language-group level of coordination occurring to an extent amongst
entities such as leadership networks, like those community leaders from within the Koo
159
To reiterate the point from an earlier chapter: Chandra specifically allows for voters voting at least in part out of pride and similar emotional attachments; however, the model of ethnic voting she formally advances is still a model of rational actors, and hinges foremost on reasoned calculation.

221
language group who worked for David Day Pacha in South Guadalcanal, and the Sa’a speaking
community leaders who worked for Rick Hou in Small Malaita. However, such networks are
not automatically present in language groups in Solomon Islands. There are no systematic data
on their presence around the country but my own interviews, as well as other secondary
literature, suggest they are present and functioning only in a minority of language groups.
However, language groups are typically supersets of the clans within them. And, as the final
regression results from Chapter 7 suggest (along with case examples such as the problems
faced by candidates in Small Malaita in winning support outside their language areas),
language groups do often approximate as outer bounds, beyond which winning support
becomes harder because relational ties are fewer. Yet because, as entities themselves,
language groups are not routinely in possession of social rules that enable to them to function
as anything approximating an electoral bloc, they typically fail to do so, even when they are of
electorally advantageous sizes.
This is another key difference between my explanation of ethnic politics and those offered by
theorists such as Chandra and Posner who argue ethnic identities rendered potentially
significant through history or visible traits become actively electorally important when the
groups they contain within them are of an electorally efficient size. In Solomon Islands group
size does not play any obvious role in raising the electoral significance of different ethnic
identities. This is why in Chapter 7 I failed to find any evidence of group-size determined
electoral competition.
The Association Between Ethnic Voting and Electoral and Political Outcomes in
Solomon Islands
My explanation of ethnic voting in Solomon Islands as being a product of the social rules that
lie within some of the country’s ethnic groups not only fits with the regression results
discussed in Chapters 7 and 9 but also the broader patterns of election outcomes seen in the
country. Most Solomon Islanders have more than one ethnic identity (commonly possessing
both church and clan-based identity) as well as typically possessing other ties, such as broader
relational ties, which while not perhaps strictly ‘ethnic’ come coupled with similar social rules.
Multiple ties, combined with the contingent nature of ethnic voting (it occurs either through
fear of consequences or hope of reward, but not blind loyalty) contribute to the variation in
election outcomes which can be seen over short periods of time in Solomon Islands. So too
does the complexity of campaigning, and for MPs the challenges of dispensing largess through
a system of interlocutors (brokers) whose reliability is often questionable.
222
For the capable candidate, or savvy MP, ethnic ties offer a degree of purchase amidst this
environment. However, except where ties are particularly strong, as they have been within the
Christian Fellowship Church, or as they often are amongst close kin, they do not perfectly
determine behaviour. There is still much uncertainty, and room for MPs and candidates’ own
individual attributes and actions to contribute to election outcomes — something which plays
a major role in shifting election outcomes. Similarly the challenges MPs face in working in such
a loosely bound environment contributes to the high incumbent turnover rates observed in
Solomon Islands.
Conditional ethnic voting stemming from voters’ calculations of likely outcomes influenced by
the social rules of ethnic groups also offers an explanation for the association between
Solomon Islands’ high ethnic diversity, and high average candidate numbers (and effective
numbers of candidates) within electorates. However, the explanation is not the obvious one in
which the existence of many different ethnic groups produces many different ethnic cleavages,
which serve as electoral divides that cannot be crossed, and which therefore prevent electoral
consolidation of the sort predicted by Duverger’s Law. As I have shown, when given cause to
do so — cause to believe they will receive assistance — Solomon Islanders who are free to
choose will vote for people who they do not share ethnic ties with. In Chapter 8 I discussed the
example of David Day Pacha who was able to win support from voters who he did not share
strong ethnic ties with by demonstrating he could help. There are many other examples. In the
electorate of West Honiara the current MP is an ethnic Vietnamese businessman, who won by
dispensing money and assistance to his constituents, who in turn showed no obvious qualms in
voting for a man they shared no ethnic ties with. Evidence suggests Solomon Island voters
appear happy enough to vote across ethnic divides when it is advantageous to them, which
suggests it is not divides per se that are cause of high numbers of candidates. Rather, on the
basis of the theory of ethnic voting I have advanced, I contend that in the Solomon Islands case
high candidate numbers come not from the presence of many ethnic divides but rather from
the absence of groups that are big enough, and also home to sufficiently strong social rules, to
facilitate ongoing large-scale electoral coordination of the sort that would bring candidate
numbers down. As I have discussed, clans have rules to enable electoral coordination to an
extent but they are small and numerous. Similarly, at the electorate level, the Christian
Fellowship Church has rules which have very effectively enabled electoral collective action but
it is unusual in the strength of its rules, and present in large numbers in only a few electorates.
The South Seas Evangelical Church is larger, and home to social rules which help facilitate
coordination, but the electoral power of these rules is less strong. Meanwhile, the country’s
largest church, the Church of Melanesia is unable to engage in constituency level electoral

223
coordination, a problem that also plagues language groups, which are large enough that if they
could electorally coordinate this would substantially bring down candidate numbers within
electorates.
Similarly, just as the rarity of ethnic groups which are large enough and bound by rules
sufficient to overcome collective action problems contributes to high numbers of candidates
(and high effective numbers of candidates) within electorates, the absence of anything
equivalent at the national level contributes to Solomon Islands’ political instability. As I
discussed in Chapter 7, provincial or church-based identities could potentially provide the raw
material for more cohesive national politics (although not necessarily healthier in any other
way). Yet, because there is nothing equivalent to the social rules observed within some groups
in electorate-level competition operating within these groups at a national level, they do not
bring such cohesion. As a consequence, at a national level Solomon Islands politics suffers
through the fluidity of allegiance and associated political instability I described in Chapter 4. As
I discuss further below, the collective entities involved need not be ethnic groups (indeed
other groupings might likely bring better development outcomes), but it is hard to see how
Solomon Islands might be afforded more stable national politics absent some sort of larger
scale collective action arising and changing the nature of the choices confronting national
political actors.
Ramifications
In concluding her book on ethnic politics in India Kanchan Chandra writes (p. 291) that:
While this book suggests that we may have reason to be less pessimistic about the politics of ethnic head counts…it also highlights a more fundamental source of disquiet. The origins of the politics of ethnic head counts, I have tried to show, lie in the politics of patronage. Elections in a patronage-democracy are in essence covert auctions in which basic services, which should in principle be available to every citizen, are sold instead to the highest bidder.
Although Chandra’s explanation of ethnic voting in India differs from the theory I have offered
for Solomon Islands, my assessment of the causes and consequences of the electoral politics
experienced by Solomon Islands is very similar.
That ethnic voting in Solomon Islands is not a product of blind loyalties or atavistic forces born
of culture, but rather voters striving to improve their own material welfare along with that of
their families and their communities, is surely good news. A commonly offered defence of
democratic politics is that, for all its imperfections, it allows voters to assess, and to reward or
punish leaders, on the basis of their material wellbeing (Norris 2004). This, in turn, causes

224
politicians to show at least some concern for voters’ welfare — something that incentivises
MPs towards better governing their nation. Far better, following arguments of this sort, to
have voters voting in a reasoned way on the basis of material assessments than to have them
voting following pride or ancient hatreds.
Yet in Solomon Islands, as in many other clientelist developing countries, voters’ concern for
their own wellbeing does not translate into improved governance at the national level. Rather,
it leads to contestation — Chandra’s auction — for localised or personalised benefits. Instead
of incentivising MPs towards better governing their country, this is something that encourages
them to play the game of politics in a way that best provides them with resources for
patronage (Brusco et al. 2004; Allen and Hasnain 2010; Haque 2012).
Noting this is not the same as blaming voters for the state of political governance in clientelist
polities such as Solomon Islands, or as suggesting they are happy with the current state of
affairs (Brusco et al. 2004). Rather, voters in Solomon Islands vote the way they do owing to a
particular collective action dilemma associated with national political change. Even though
voters may want to live in a better governed state where public goods and services are well
provided, unless they can rely on a significant share of their compatriots voting in search of
this shared objective, individual voters are better off voting instead for localised benefits. This
is the case because systematic reform of governance in Solomon Islands requires a majority of
MPs behind it (or at least a substantial minority share). One reforming MP in a parliament of
50 can achieve little, and unless voters have cause to believe that large numbers of fellow
voters around the country are voting for national reform, they are left stuck in a situation
where their vote, which only contributes in its small way to the outcome of the election in one
electorate, cannot contribute at all to national-level change (Cox 1997).
Voters in countries such as Australia and New Zealand are spared this dilemma by the
existence of programmatic, national political parties — parties which enable voters to vote in
common cause with others from around their country, knowing that should the party win, it
can translate shared policy preferences into a legislative agenda. This was not always the case
— most of today’s wealthier countries have clientelist political pasts (Craig and Porter 2013;
Fukuyama 2013) — and a key political question for Solomon Islands clearly is if or how it can
move to a programmatic politics of its own.
Stronger political parties would likely be a necessary component of such a transition but on
their own they will not be sufficient to cause programmatic politics (that parties would be
sufficient is something which sometimes appears to be assumed in discussion of political

225
reform within Solomon Islands). It is possible, as the patronage politics of India which Chandra
describes illustrates, to couple strong political parties with clientelism.
Rather, it would seem that the transition to programmatic politics, where it has occurred, has
occurred either due to the threat of foreign invasion (something neither likely nor desirable in
the Solomon Islands case) or as a result of the rise of concerted collective action amongst
reforming coalitions (Fukuyama 2013). Fukuyama (2013, p. 13) describes this second cause in
operation in the United Kingdom and United States:
Political pressure for reform came out of a middle-class coalition, as new social groups created by the process of industrialization led a prolonged political struggle against the entrenched proponents of patronage and clientelism.
Very similar arguments have also been advanced for Northern European democracies,
although often with Fukuyama’s middle class replaced by a working class organised through
political parties associated with groups such as trade unions (see, for example, discussion in
Norris 2004, p. 100). Likewise, in his work on South East Asia Slater (2008, p. 254) argues
“robust mass mobilization” has been an essential ingredient in the creation of some of the
region’s developmental democratic states.
Robust mass mobilisation has yet to become a significant feature of Solomon Islands politics.
Yet, given that the collective action challenges of national politics exist every bit as much in
Solomon Islands as they do in other countries, it is hard to see how significant political change
could occur without the rise of some sort of broad-based reforming movement.
In addition to offering the potential to transcend political collective action problems and shift
towards more programmatic governance, coalition-based politics would also likely bring with it
political stability: parties bound of common cause are less likely to fracture, and candidates
elected through attachments to political movements are less likely to engage in opportunistic
floor-crossing in the way Solomon Islands MPs currently do.
While such change appears the most likely route to healthier politics in Solomon Islands, my
study of ethnic electoral politics in Solomon Islands provides some cause for pessimism on this
front. Following from my arguments above, this pessimism is not, however, born of evidence
which suggests that ethnic ties or ethnic divides themselves are insurmountable impediments
to larger-scale political collective action in Solomon Islands. As I discussed above, Solomon
Islanders’ ethnic electoral loyalties actually appear both pragmatic and weakly bound: where
voters can be convinced voting for someone who is not a co-ethnic is advantageous, they will

226
do so. Instead, pessimism stems from the fact that large-scale political collective action
appears difficult in Solomon Islands.
Indeed, in Solomon Islands, collective action of any sort is a challenge. As anthropologist
Deborah McDougal writes of an island group in the country’s Western Province:
Europeans, Australians, and Americans working in the Solomons tend to equate villages with communities and there is a deeply-rooted scholarly tendency to oppose individualistic modern Westerners to communalist traditional Melanesians...However, Ranonggans themselves think that community is very difficult to achieve. Bringing individuals together for collective projects is the explicit goal of much rhetoric and action — without such work it is thought that people just ‘follow their own thoughts’. (McDougall 2003, p. 64)
However, the same can also be said of collective action everywhere. And despite the
challenges of collective action, large-scale political reforming movements have had successes
across a wide range of countries. Moreover, the achievements of Maasina Rule, and to a lesser
extent the Moro Movement in late colonial times, show political collective action in Solomon
Islands can occur, and in Maasina Rule’s case it was able to occur on a significant scale (Akin
2013). Similarly, a locally grown peace movement was able to organise action amongst large
groups of people under particularly trying circumstances during the conflict years of the
Tensions (Moore 2004). And recent years have seen the rise of locally formed and motivated
NGOs such as Forum Solomon Islands International, groups which are devoted to political
reform, and capable of attracting both political and popular attention (Afuga 2013). Such
examples suggest political change ought not be impossible in Solomon Islands, although the
collective action involved will almost certainly prove difficult.
Further Work
My study has, I hope, provided a careful and thorough account of voting, and particularly
ethnic voting, in Solomon Islands — an account which has also brought with it some
theoretical insight. Yet, as I bring my study to a close I am still able to point to much other
work which needs to be done. This work can be undertaken in three directions: inwards, into
the mechanics of electioneering and ethnic groups in Solomon Islands; upwards, into the
mechanics of the national politics; and outwards, to study in other countries.
Inwards
While I have been able to offer a clear picture of the key features of electioneering and voter
behaviour in Solomon Islands, there is still more to be learnt. One particular contribution to
the understanding of ethnic politics could be ethnographic or historical work with church

227
groups trying to explain why some developed social rules that have proven electorally useful
while others have not. While I was able to describe the differing electoral impacts of groups
such as the Christian Fellowship Church, the South Seas Evangelical Church and the Church of
Melanesia, I am not able to explain why some evolved electorally advantageous social rules
while others did not. All managed to evolve at least some rules for their theological practice
and other aspects of their collective interaction; but only some have had these rules translate
into electoral collective action. Why this is the case is a question that would be particularly
interesting to have answered.
Beyond ethnic politics there is much of practical use to be learnt regarding election mechanics
in Solomon Islands. For instance, the means candidates have for finding out who voted for
them need to be better understood. There is also more to be learnt on vote-buying, including
who is targeted and the extent to which it is an effective method of winning votes. In the
closely related subject of clientelism there is considerable room for further study. As I have
noted, key features of clientelist politics found elsewhere, such as brokers (Stokes et al. 2013),
also exist in Solomon Islands. In the Solomon Islands case brokers in particular were an integral
part of electioneering. In my study I focused primarily on the role of ethnic, or similar
relational, ties in overcoming principal agent problems associated with brokers, but there is
much else of interest to be studied: the extent, for example, to which they win votes through
coercing rather than convincing; and the strategies, beyond ethnic ties, which candidates use
to try and maintain loyalty. (I know of at least one campaign team who used spies to keep
track of their brokers, for example.)
Upwards
At a national level there is also considerably more to be learnt of the art of parliamentary
coalition building in Solomon Islands, and the ways in which business interests use the process
to obtain political influence. The processes involved have been vividly described in passing (for
example, Moore 2006; Fraenkel 2008c) and useful theorising is starting to occur (in particular,
Craig and Porter 2013; Craig and Porter 2013b). As this is an area of practical interest owing to
its impact on the quality of governance experienced in Solomon Islands, more work here
would be very useful.
With regards to ethnic politics, one particular puzzle remains to be explained at the national
level. This being why churches currently fail to serve as more of a unit of cohesion in national

228
level politics.160 As I have shown, some churches play an electoral role at the constituency
level, and while the one church which is particularly good at it (the Christian Fellowship
Church) is too small for this to be a relevant question in its case (it has only ever had two or
three MPs in parliament), other churches, such as the South Seas Evangelical Church, both play
a role locally and are large enough to be plausible building blocks of parliamentary power. Yet
there is no obvious evidence of them doing this. As I noted in Chapter 3, churches generally
stay away from national politics in Solomon Islands, and as I showed in Chapter 4 parliament
does not seem to contain any church-based blocs in it. There are examples from other
countries of churches playing important roles in party development and national politics, and
the same feature which makes some churches important at the electorate level, social rules,
also exist amongst churches’ national bodies. Hence the puzzle.
This puzzle is not without possible explanations. In particular, it seems that for most churches
in Solomon Islands, the social rules and social networks that can be used in electioneering are
tightest at the local level, where day to day interactions are also greatest, and much more
weakly linked between the local and the national. This could well explain why local level
electoral coordination is possible, while at the same time it is impossible for national bodies to
impose political decisions on local groups. This is a possible explanation, but it is only
speculation, and the question deserves more thorough investigation.
Outwards
Looking outwards, the obvious question is the extent to which my findings from Solomon
Islands have relevance elsewhere. Given so much is shared between the electoral politics of
Solomon Islands and that experienced in other developing countries it would be surprising to
find social rules only of importance in Solomon Islands electioneering and not elsewhere. Yet
the question — to what extent do social rules explain ethnic electoral politics in other
countries? — still needs to be answered.
Another closely related question is why my study has brought differing explanations of ethnic
electoral politics from ones conducted in neighbouring countries and also further afield. One
interesting contrast is between my findings and work from Highland Papua New Guinea, in
particular Standish (2002; 2007) and Ketan (2004), describing electioneering and voter
behaviour which, at least at times, does not seem reasoned or materialistic at all. The
interesting question which emerges from this point of difference is why in instances voting is 160 It has been suggested to me that the Church of Melanesia may have played a role in aiding in allegiance formation in coalition building around the time of independence, but this is clearly no longer the case.

229
driven by different cognitive processes, at least in parts of Papua New Guinea (particularly the
Highlands) from those which seem to predominate in Solomon Islands. Possibly, long histories
of conflict in parts of Highland Papua New Guinea might explain this? Answers would certainly
be useful to understanding if and why different types of ethnic politics occur in different
contexts, and could be offered by careful comparative work.
Further afield, much of the work which I have found unable to explain the Solomon Islands
case still stands as convincing for the contexts from which it has been drawn. In particular, the
work of Chandra (2004) and Posner (2005) is comprehensive and affords careful explanations
of the country contexts it is based on (India and Zambia, respectively). The empirical evidence
both authors provide of the importance of ethnic group size is strong, which begs the question:
why does group size drive the electoral importance of ethnic identities in India and Zambia,
and not Solomon Islands? One likely explanation could be that social rules are already
ubiquitous amongst the ethnic groups Chandra and Posner studied, and that this rendered the
existence of such rules beside the point. In the Indian and Zambian case the social rules in
question might not even be strictly the product of ethnic groups but rather other entities
which ethnic identity has become interwoven amongst. In India, for example, political parties
are a more significant presence and have been around longer than in Solomon Islands. Possibly
they have brought the networks and rules that subsequently allowed ethnic identity to play a
role whenever group size is right. Likewise, it appears the colonial era gifted Zambia much
stronger systems of chiefly rule and associated chiefly networks than it did to Solomon Islands
(Posner 2005; Baldwin 2013). And possibly the existence of a strong system of chiefs means
that at both the tribe and language level social rules are already sufficient to enable electoral
collective action, enabling questions of size to become relevant. Once again, careful
comparison between countries ought to provide answers to these questions, along with
further insights.
Concluding Thoughts
In Chapter 5 I discussed debate between those who argue the choices voters make in Solomon
Islands, and also neighbouring Papua New Guinea, are the product of culture — expectations
derived directly from the country’s traditional systems of local level governance — and those
who have argued they are the product of something much more universal: rational choices.
While, as I did this, I contended the available evidence favoured rational-choice type
explanations, I also pointed out that there were aspects of electoral politics in Western
Melanesia which still did not easily fit with simple rational choice models.

230
In addition to a theory of ethnicity and voter behaviour, my work in this thesis has offered
some middle ground in this debate. In the Solomons case at least, there are many rational
choices being made. But they are choices which are conditioned by a central aspect of the
country’s culture: the social rules which lie within groups. Such rules are far from unique to
Solomon Islands — all cultures have them and they play crucial roles in shaping social
interactions and collective action everywhere (Habyarimana et al. 2009; Bowles and Gintis
2011). However, the rules and the groups they sit within vary across country contexts.
I have shown in this thesis that in the Solomon Islands case social rules play an important role
in voter behaviour and in contributing to election outcomes. Yet while elections are important
there is still much more for political science to learn in Western Melanesia, and to bring from
its work elsewhere to the study of Western Melanesia.
Hopefully, future work on all areas of collective action in Solomon Islands and its Western
Melanesian neighbours will be undertaken looking both carefully outwards, learning from
work on social rules and collective action undertaken in other parts of the world, and carefully
inwards, attempting to blend the insights of political science with local context.

231
Appendix 1 – Map of Solomon Islands ElectoratesA
pp
en
dix
1 – M
ap
of S
olo
mo
n Isla
nd
s Ele
ctora
tes

232
Appendix 2 – Province Profiles
Province/ Council
Land area
(km2)
Total popn.
Primary Education
(% of over-12 popn.)
House-holds
with tin roof (%) Urban areas
Per cent urban
Central Province 654 26,051 60.3 27.7 Tulagi 4.8
Choiseul 3,340 26,372 73.4 37.2 Taro 3.1
Guadalcanal 5,497 93,613 55.1 28.8 Honiara 16.5
Honiara 25 64,609 40.4 77.8 Honiara 100.0
Isabel 4,293 26,158 50.8 27.6 Buala 3.7
Makira-Ulawa 3,357 40,419 60.2 13.6 Kirakira 5.1
Malaita 4,364 137,596 55.0 32.1 Auki 3.7
Rennell-Bellona 701 3,041 68.2 94.6 - 0.0
Temotu 895 21,362 56.2 10.2 Lata 9.3
Western Province 5,599 76,649 69.9 49.0 Gizo, Munda, Noro 12.7
Country 28,724 515,870 56.7 6.5 19.8
Table sources: (Solomon Islands National Statistics Office 2013, pp. vi, vii, 196; except for land area which was calculated by ANU CAP Cartography)
161. ‘Households with a tin roof’ used here as a proxy of
asset-based wealth. Tin roofs are a reasonable proxy as they are private goods at the household level and are, owing to practical benefits, something most Solomon Islanders strive to attain.
161
A range of different figures are given by different authors for the land area of Solomon Islands. The calculated figure used here, while slightly different from some other estimates falls within the usual range.

233
Appendix 3 – Electorate Profiles (Averages all General
Elections Post-1997)
Electorate Electorate Code Province
Average Candidates
Average ENC
Average Winner Vote
Share (%) Incumbent
Success (%)
Voting Popn
(2010)
Nggela Ngl Central 10.75 6.21 26.1 50 9,350
Russells/Savo RS Central 5.25 2.94 52.7 75 4,781
East Choiseul EC Choiseul 4.25 2.55 55.4 75 3,250
North West Choiseul NWC Choiseul 6.75 4.34 35.2 50 6,163
South Choiseul SC Choiseul 7.5 4.79 35.8 67 4,549
Central Guadalcanal CG Guadalcanal 6 3.82 41.8 67 8,580
East Central Guadalcanal ECG Guadalcanal 8 5.24 30.9 50 5,690
East Guadalcanal EG Guadalcanal 7.25 4.01 40.3 50 5,104
North East Guadalcanal NEG Guadalcanal 7.25 4.07 39.7 67 5,738
North Guadalcanal NG Guadalcanal 10.5 6.94 24.8 67 5,387
North West Guadalcanal NWG Guadalcanal 10.25 5 33.1 33 12,094
South Guadalcanal SG Guadalcanal 9.75 4.04 44.9 50 3,529
West Guadalcanal WG Guadalcanal 8.5 5.12 30.2 50 4,979
Central Honiara CH Honiara 16 9.04 20.9 0 14,710
East Honiara EH Honiara 12.5 6.39 27.9 0 15,846
West Honiara WH Honiara 10 4.49 39.6 0 10,411
Gao/Bugotu GB Isabel 8.25 4.11 41.7 33 3,714
Hograno/Kia/Havulei HKH Isabel 7 4.11 40.1 50 5,419
Maringe/Kokota MK Isabel 8.75 4.72 31.3 25 5,443
Central Makira CMk Makira/Ulawa 11 5.84 28.3 25 5,507
East Makira EMk Makira/Ulawa 9 5.5 37.4 100 6,987
Ulawa/Ugi UU Makira/Ulawa 8.75 4.67 37.2 100 2,545
West Makira WMk Makira/Ulawa 10.25 5.8 40.1 25 6,275
Aoke/Langalanga AL Malaita 8.25 3.39 44.8 75 3,837
Baegu/Asifola BA Malaita 8.75 5.46 30.6 50 2,673
Central Kwara’ae CKe Malaita 7 3.14 47.9 67 9,004
East ‘Are ‘are EA Malaita 8.25 5.19 25.0 33 3,829
East Kwaio EKo Malaita 6.25 3.46 48.8 50 4,822
East Malaita EMl Malaita 9.25 5.11 39.0 75 3,890
Fataleka Fa Malaita 12.5 6.09 28.2 25 3,700
Lau/Mbaelelea LM Malaita 12 6.32 26.2 50 7,324
Malaita Outer Islands MOI Malaita 9 5.94 28.2 25 1,310
North Malaita NM Malaita 8.5 3.96 43.1 25 6,728
Small Malaita SM Malaita 11.75 7.24 23.0 33 6,876
West ‘Are ‘are WA Malaita 9.5 5.95 28.6 33 3,717
West Kwaio WKo Malaita 10.25 5.46 29.0 50 5,187
West Kwara’ae WKe Malaita 16 9.69 17.0 33 7,069
Rennell/Bellona RB Ren & Bel 6.75 4.07 40.0 25 1,683
Temotu Nende TN Temotu 6.25 3.85 42.4 50 6,533
Temotu Pele TP Temotu 7.5 3.52 46.8 75 2,866
Temotu Vatud TV Temotu 10.5 6.69 23.1 33 2,251
Gizo/Kolombangara GK Western 9.5 4.81 35.2 75 7,585
Marovo Ma Western 8 4.44 34.1 100 6,792
North New Georgia NNG Western 2.25 1.61 81.2 100 2,228
North Vella Lavella NVL Western 6 3.54 39.7 50 2,490
Ranongga/Simbo RaS Western 5.25 3.25 41.9 75 4,390
Shortland Sh Western 7.75 4.6 34.3 50 1,944
South Vella Lavella SVL Western 5.5 3.71 37.4 25 4,076
West New Georgia/Vona Vona
WNG Western 9 5.5 28.3 50 7,555
South New Georgia/Rendova/Tetepari
SNG Western 5.75 3.25 41.6 50 4,754

234
Table notes: all data from the author’s Solomon Islands election database. The six electorates I
conducted fieldwork in are highlighted. Candidates, ENC (Effective Number of Candidates), and
Winner Vote Share are means for each electorate, averaged across general elections since
1997. The column ‘Incumbent Success’ shows, for the four general elections since 1997, the
percentage of elections in which the incumbent MP has successfully defended their seat. The
denominator in this calculation is not necessarily four, it is the number of elections in which
the sitting MP contested their seat. Voting age population has been estimated as of the 2010
general election based on 2009 census data.

235
Appendix 4 – Interview Details
Unless my interviewees were confident English speakers I undertook interviews in Solomon
Islands Pijin. Literate interviewees read and signed informed consent forms. For those who
could not read, I read them informed consent information and interviews were only conducted
if this was followed by unambiguous consent to proceed. I recorded all my interviews with a
voice recorder except in rare instances when interviewees requested that I did not or when
technology failed. I also took detailed interview notes. The interview material I make use of in
Chapters 8 and 9 is drawn from the recordings or, in very rare instances when I was unable to
record, from interview notes.
Interviews ranged from very short (less than 10 minutes) to long (close to two hours). Subject
matter ranged from basic details on electorates all the way through to the intricacies of
campaigning.
My interviewees fell into seven broad categories: MPs or former MPs; candidates or former
candidates; candidate campaign team members; village level brokers; community leaders;
voters; and other commentators (a small category including some Honiara based civil servants
and civil society representatives). Reflecting both the higher prevalence of men serving in
political roles and involved as community power brokers, and cultural challenges associated
with speaking to women in some areas, I interviewed more men than women. However, I still
interviewed sufficient women to get a good sense of any differences in perspectives on voter
choice and electioneering. Table A4.1 below shows interviewees broken down by type and
gender. Table A4.2 shows interviewees by constituency.
Table A4.1 – Interviewees by Type and Gender
Interviewee Type Male Female Total
Voter 98 74 172
Community Leader 34 5 39
Broker 28 6 34
Candidate 21 5 26
MP/former MP 24 0 24
Campaign Team 13 1 14
Other 3 0 3
Total 221 91 312

236
Table A4.2 – Interviewees by Electorate
Electorate Number of
Interviewees
Gao Bugotu 56
South Guadalcanal 55
Small Malaita 50
Aoki/Langalanga 38
East Honiara 18
West New Georgia 18
Other Electorates 77
237
Appendix 5 – Cross-Cutting Clans and Support Dispersion
Without data on the number of clans and their relative sizes it is hard to directly, quantitatively
test the proposition that clans are often electorally important ethnic groups in Solomon
Islands. However, one possible means of testing is offered by the fact that clans are
geographically dispersed groups (cross-cutting) in some Solomon Islands provinces while in
other parts of the country they tend to be geographically bound. If clans really are electorally
important, this difference in the way they are distributed ought to be associated with differing
patterns of candidate support.
As outlined in Chapter 3, the geographical spread of clans differs across Solomon Islands’
different provinces. In some — particularly Isabel, Makira and Guadalcanal — formalised rules
of migration with marriage render clans strongly geographically cross-cutting (that is the same
clan will be found in numerous villages across a relatively large area and more than one clan
will live in the same village). Historically, Central Province has also had similar cross-cutting
clans (Allan 1957, p. 64). In other provinces, particularly Malaita, the typical clan is more
strongly spatially constrained (Allan 1957, p. 64). In Western Province, cognatic ties, rules on
migration with marriage (in parts of the province), and a history of colonial era migration, have
led to people having relational ties throughout most electorates.162 In other provinces patterns
are harder to establish. On the basis of the Allan Report (Allan 1957, p. 66) it seems that much
of Temotu Province had some sort of cross-cutting ties in the past, although these tended only
to be within, rather than between, the small islands that make up its electorates and so were
not in effect cross-cutting across whole constituencies. Also Allan (in 1957) noted that in parts
of Temotu province such ties were already breaking down. Choiseul lacks strong formal cross-
cutting ties of the nature of those on Guadalcanal; however, interviews with political actors
from Choiseul suggested a situation similar to that of Western Province with much migration
and additional matrilineal ties providing cross-cutting support bases (Interviews Hon12, Hon13
and Mannaseh Sogavare). Clans in Rennell and Bellona are not cross-cutting; however the one
constituency that comprises the small Polynesian outlier province is home to only two clans,
one which dominates the entire province except for the eastern end of Bellona Island
(Provincial Government Development Unit 1998a, p. 6).
Importantly, these geographical distinctions are not completely clear cut: even in Malaita
marriage ties and migration mean people often have at least some ties around constituencies.
162
One interviewee, a former candidate from West New Georgia constituency in Western Province, illustrated this well when asked where in the constituency he had relational ties. His reply was: “right throughout. I have relatives in Madou, Dunde, Varasito, Raromana, on the big Island, Kohingo, Noro, right throughout.” (Interview Ashley Wickham)

238
However, it seems reasonable to assume that if clans are electorally important we would see
some difference in the extent to which candidate support is dispersed across electorates, with
candidates on average winning more dispersed support in Central Province, Isabel, Makira,
Guadalcanal Rennell and Bellona, and Western Province than they do in Malaita.
To test this, in the regression I present below, I have taken election results by polling station to
calculate a measure of support dispersion, and grouped electorates by province, using dummy
variables for each province to capture the effect of province on support dispersion.
In addition to my dummy variables for provinces I have added several other control variables
to the regressions. Everything else being equal it also seems reasonable to anticipate that
candidate support would be more concentrated in more populous constituencies as, for
candidates whose resources are finite, it will be harder to establish a wide base of support
where numbers of voters are higher. Conversely, we might reasonably expect support
dispersion to be higher in electorates which are more densely populated. Denser population
ought bring more regular interaction of the sort that builds reputation and fosters trust. For
these reasons, both population and population density are important controls to include in the
regression, as they vary significantly across electorates. (The most populous constituency, East
Honiara, has a population more than 10 times as large as the least, Malaita Outer Islands. And
the most densely populated constituency, Central Honiara, is over 800 times more densely
populated than the least, Hograno/Kia/Havulei).
A final control added to my test is a dummy variable reflecting whether a candidate is an
incumbent or not; based on observations in Chapter 4 it seems reasonable to expect that
incumbent candidates will have more dispersed support.
Table A5.1 below shows the results of a regression run testing these propositions. The
measure used to capture dispersion of candidate support across polling stations (the
dependent variable) is the Index of Residential Segregation, a standard measure of
geographical concentration and dispersion used in Human Geography (Ogden 2000, p. 380).
The value of the index ranges between zero (which would be the score of a candidate who had
perfectly equally distributed support) and one (the score of a candidate who won all of their
votes in one polling station only).163 The data used to calculate this figure are 2010 and 2006
election results by polling station. The unit of analysis in the regression is individual candidates
163
The index of residential segregation is calculated as follows: 𝐼𝑆𝑥𝑛 =0.5∑ |𝑥𝑖−𝑡𝑖|
𝑘𝑖
1−(𝑥/𝑡)
Where: i = the ith polling station; k = the total number of polling stations; xi= the percentage of candidate x’s total votes that they won in polling station i; ti=total votes cast in polling station i as a percentage of total votes cast across the constituency; x=candidate x’s total votes; t=the total votes cast across the constituency.

239
(in other words the index of segregation has been calculated for each candidate, and each
candidate has been coded with the dummy variable of the province they are from).
The independent variables used in the regression are: a measure of voting age population
estimated from the 2009 census (taken as a natural log); a measure of population density
derived from the 2009 census and electorate land area data (as a natural log); a dummy
variable reflecting whether the candidate is an incumbent or not; and dummy variables for
each province except Malaita (which means, in effect, that the coefficient for each province’s
dummy shows the extent to which the province in question differs from Malaita).164 A negative
sign on a coefficient shows that on average the variable is associated with less concentrated
candidate support.
As can be seen, the results are, by-in-large, as predicted. More populous electorates tend,
everything else being equal, to see more concentrated support, although the difference across
population is not statistically significant. Meanwhile, more densely populated electorates,
everything else being equal, show less concentrated support. In Guadalcanal, Isabel, Western,
and Makira Provinces candidate support is, everything else being equal, more geographically
dispersed than in Malaita. Likewise, support is strongly dispersed in Rennell and Bellona, the
province of only two clans. Not only are results statistically significant but the magnitude of the
effects is non-trivial (if not massive).165
164
Population and population density variables are presented as natural logs to reduce skew and the influence of outliers. 165
All regression results are based on a regression run with robust standard errors clustered at the constituency level. To account for the risk of results being driven by outliers I re-ran the regression using Stata’s robust regression option as per Hamilton (2009, p. 256) and Treiman (2009, p. 237) with virtually identical results (except that with outliers excluded the coefficient on voting age population became statistically significant). Re-running the regression limiting data only to candidates who received less than 15 and five per cent of total votes cast (to exclude major candidates whose results might potentially be more heavily influenced by other attributes) also produced very similar results to those reported.

240
Table A5.1 – Regression Results, Support Dispersion by Population, Population Density and Province
Index of Segregation
Incumbent Dummy -0.150 ***
(0.014)
Voting age population (log) 0.030
(0.020)
Population density (log) -0.033 ***
(0.011)
Honiara -0.036
(0.062)
Central Province -0.011
(0.041)
Choiseul -0.179 ***
(0.029)
Guadalcanal -0.062 **
(0.026)
Isabel -0.072 ***
(0.027)
Makira -0.041 *
(0.022)
Rennell and Bellona -0.168 ***
(0.033)
Temotu 0.001
(0.030)
Western Province -0.114 ***
(0.030)
Constant 0.486 ***
(0.165)
Adjusted R-squared 0.206 n 917
Robust standard errors clustered at the electorate level in parentheses; ***significant at the 1% level; ** significant at 5% level; * significant at 10% level.
The only finding from the regression which does not fit expectations is to do with Central
Province where concentration of support is not significantly different from Malaita. Also it is
somewhat surprising to see candidate support so strongly dispersed in Choiseul province.
The finding in Central Province may have at least partial explanation in the fact that one of its
two constituencies, Russells/Savo, is spread over two separate island groups (see electorate
map in Appendix 1). Also, owing to a history of plantation employment, the Russell Islands are
home to a substantial number of migrants from other parts of the country (the current MP is a
settler from an Island in Temotu Province), which may also contribute to more fragmented
support. When I exclude Russells/Savo the coefficient for Central Province becomes of a
similar magnitude to Guadalcanal and statistically significant at the 1 per cent level. Similarly,
the spread of candidate support in Choiseul is not wholly inexplicable once one takes into
account the province having had similar patterns of migration to Western Province.
These results, it should be emphasised, are not telling a tale of categorical difference. The
coefficients on the dummy variables are only large enough to suggest a degree of difference in
dispersion between Malaita and provinces such as Guadalcanal and Isabel. Yet this we should

241
be expecting: in a country where ethnic ties only play contributing, rather than a determining,
role in electoral politics, where migration and marriage means that nowhere are ethnic ties
perfectly geographically bound, and where clan ties are only a subset of available ethnic ties, it
would be mistaken to expect categorical differences between provinces.
To reiterate, these tests are only an imperfect substitute for what might ideally have been
tested had better data been available. On their own they are suggestive rather than definitive.
However, the results concur with the clan-related findings from both my qualitative and
quantitative work in the main body of the thesis, and provide additional evidence that kinship
ties of the sort contained within clans play a contributing role in shaping the choices voters
make.

242
References
Afuga, B. 2013. Forum Solomon Islands International and Solomon Islands Politics.
Solomon Islands in Transition Conference. The Australian National University
Canberra.
Akin, D. 2013. Colonialism, Maasina Rule, and the Origins of Malaitan Kastom, Honolulu,
University of Hawai’i Press.
Alasia, S. 2008. Rainbows Across Mountains. In: Dinnen, S. & Firth, S. (eds.) Politics and
State-building in Solomon Islands. Canberra: Asia Pacific Press, 119-147.
Alesina, A., Baqir, R. & Easterly, W. 1999. Public Goods and Ethnic Divisions. Quarterly
Journal of Economics, 114(4), 1243-1284.
Alesina, A., Devleeschauwer, A., Easterly, W., Kurlat, S. & Wacziarg, R. 2003.
Fractionalization. Journal of Economic Growth, 8(2), 155-194.
Allan, C. H. 1957. Customary land tenure in the British Solomon Islands Protectorate: report
of the Special Lands Commission, Honiara, Western Pacific High Commission.
Allen, M. 2007. Greed and grievance in the conflict in Solomon Islands, 1998-2003. Thesis
Submitted for a Doctor of Philosophy, Australian National University.
Allen, M. 2008. Politics of disorder: the social unrest in Honiara. In: Dinnen, S. & Firth, S.
(eds.) Politics and State-building in Solomon Islands. Canberra: Asia Pacific Press,
39-63.
Allen, M. 2011. The Political Economy of Logging in Solomon Islands. In: Duncan, R. (ed.)
The Political Economy of Economic Reform in the Pacific. Manila: Asian
Development Bank, 265-288.
Allen, M., Dinnen, S., Evans, D. & Monson, R. 2013. Justice Delivered Locally: Systems,
Challenges and Innovations in Solomon Islands. Justice for the Poor. Washington
D.C.: The World Bank.
Allen, M. & Hasnain, Z. 2010. Power, pork and patronage: Decentralisation and the
politicisation of the development budget in Papua New Guinea. Commonwealth
Journal of Local Governance, (6), 7-31.
Anere, R. 1997. Milne Bay Provincial: Independents Versus Parties. In: May, R. & Anere, R.
(eds.) Maintaining Democracy: The 1997 Elections in Papua New Guinea. Port
Moresby: University of Papua New Guinea, 88-97.
ANU Enterprise 2009. People’s Survey 2009, Canberra, ANU Enterprise.
ANU Enterprise 2010. People’s Survey 2010, Canberra, ANU Enterprise.
ANU Enterprise 2011. People’s Survey 2011, Canberra, ANU Enterprise.
Aqorau, T. 2008. Crisis in Solomon Islands: foraging for new directions. In: Dinnen, S. &
Firth, S. (eds.) Politics and State-building in Solomon Islands. Canberra: Asia Pacific
Press, 246-268.

243
Bakke, K. M. 2013. Copying and learning from outsiders? Assessing diffusion from
transnational insurgents in the Chechen wars. In: Checkel, J. T. (ed.) Transnational
Dynamics of Civil War. Cambridge: Cambridge University Press, 31-62.
Baldwin, K. 2013. Why Vote with the Chief? Political Connections and Public Goods
Provision in Zambia. American Journal of Political Science, 57(4), 794-809.
Bates, R. H. 1983. Modernization, Ethnic Competition, and the Rationality of Politics in
Contemporary Africa. In: Rothchild, D. & Olorunsola, V. A. (eds.) State Versus Ethnic
Claims: African Policy Dilemmas. Boulder: Westview Press, 152-171.
Beber, B. & Scacco, A. 2012. What the Numbers Say: A Digit-Based Test for Election Fraud.
Political Analysis, 20(2), 211-234.
Bennett, A. 2010. Process Tracing and Casual Inference. In: Brady, H. E. & Collier, D. (eds.)
Rethinking Social Inquiry. 2nd ed. Lanham: Rowman and Littlefield, 207-219.
Bennett, J. 1974. Cross-cultural influences on village relocation on the Weather Coast of
Guadalcanal, Solomon Islands, c.1870-1953. Master of Arts Thesis, University of
Hawaii.
Bennett, J. 1987. Wealth of the Solomons: a history of a Pacific archipelago, 1980-1978,
Honolulu, University of Hawaii Press.
Bennett, J. 2000. Pacific Forest: a history of resource control and contest in Solomon Islands,
c.1800-1997, Cambridge, The White Horse Press.
Billy, A. 2002. Fighting for a fair deal in national politics. Development Bulletin, 59, 58-61.
Bird, C. 2007. Blowing the Conch Shell: a baseline survey of churches’ engagement in
service provision and governance in the Solomon Islands. Honiara: Solomon
Islands Christian Association.
Bogesi, G. 1948. Santa Isabel, Solomon Islands. Oceania, 18(3), 208-232.
Bossuroy, T. 2007. Voting in an African democracy: does only ethnicity rule? CSAE
Conference 2008 -- Economic Development in Africa. Oxford.
Bourke, R. M., McGregor, A., Allen, M. G., Evans, B. R., Mullen, B. F., Pollard, A. A., Wairiu, M.
& Zotalis, S. 2006. Solomon Islands Smallholder Agriculture Study. Canberra:
AusAID.
Bowles, S. 2009. Microeconomics: Behavior, Institutions, and Evolution, Princeton,
Princeton University Press.
Bowles, S. & Gintis, H. 2011. A Cooperative Species: Human Reciprocity and its Evolution,
Princeton, Princeton University Press.
Brady, H. E. 2010. Data-Set Observations versus Causal-Process Observations: The 2000
U.S. Presidential election. In: Brady, H. E. & Collier, D. (eds.) Rethinking Social
Inquiry. 2nd ed. Lanham: Rowman and Littlefield, 237-242.

244
Braithwaite, J., Dinnen, S., Allen, M., Braithwaite, V. & Charlesworth, H. 2010. Pillars and
Shadows: Statebuilding as Peacebuilding in Solomon Islands, Canberra, ANU E Press.
Bratton, M., Bhavnani, R. & Chen, T.-H. 2011. Voting Intentions in Africa: Ethnic, Economic
or Partisan? Afrobarometer Working Papers, 127.
Bratton, M. & Kimenyi, M. S. 2008. Voting in Kenya: Putting Ethnicity in Perspective.
University of Connecticut, Economics Working Papers, 200809.
Brigg, M. 2009. Wantokism and state building in Solomon Islands: a response to
Fukuyama. Pacific Economic Bulletin, Volume 24(3), 148-161.
Brusco, V., Nazareno, M. & Stokes, S. C. 2004. Vote Buying in Argentina. Latin American
Research Review, 39(2), 66-88.
Burt, B. 1994. Land in Kwara’ae and development in Solomon Islands. Oceania, 64(4).
Burt, B. 1994b. Tradition and Christianity: the colonial transformation of a Solomon Islands
society, Chur, Harwood Academic Publishers.
Burton, J. 1989. Tribal structure and rural ballot box counts in Hagen Open. In: Oliver, M.
(ed.) Eleksin: The 1987 National Election in Papua New Guinea. Port Moresby:
University of Papua New Guinea, 253-284.
Campbell, A. 1980. The American Voter, Chicago, University of Chicago Press.
Carlson, E. 2011. Great Expectations: Ethnicity, Performance, and Ugandan Voters.
Unpublished Working Paper. Los Angeles: UCLA.
Casson, M. C., Giusta, M. D. & Kambhampati, U. S. 2010. Formal and Informal Institutions
and Development. World Development, Vol. 38(No. 2), pp. 137–141.
Chandra, K. 2001. Cumulative Findings in the Study of Ethnic Politics. Newsletter of the
Organized Section in Comparative Politics of the American Political Science
Association, 12(1), 7-11.
Chandra, K. 2004. Why ethnic parties succeed: patronage and ethnic head counts in India,
Cambridge, Cambridge University Press.
Chandra, K. 2006. What is Ethnic Identity and Does it Matter? Annual Review of Political
Science, 9(1), 397-424.
Chandra, K. 2012. Introduction. In: Chandra, K. (ed.) Constructivist Theories of Ethnic
Politics. New York: Oxford University Press, 1-50.
Chick, J. 1979. Electoral Politics in the Solomon Islands. Pacific Perspectives, 8(2), 21-30.
Chick, J. 1983. The 1976 General Election. In: Larmour, P. & Tarua, S. (eds.) Solomon Islands
Politics. Suva: Institute of Pacific Studies of the University of the South Pacific, 63-
79.
Colebatch, P., Colebatch, H. K., Reay, M. & Strathern, A. J. 1971. Free Elections in a Guided
Democracy. In: Epstein, A. L., Parker, R. S. & Reay, M. (eds.) The Politics of

245
Dependence: Papua New Guinea 1968. Canberra: Australian National University
Press, 218-274.
Collier, D. 2011. Understanding Process Tracing. PS: Political Science & Politics, 44(04),
823-830.
Collier, D., Brady, H. E. & Seawright, J. 2010. Sources of Leverage in Causal Inference:
Toward and Alternative View of Methodology. In: Brady, H. E. & Collier, D. (eds.)
Rethinking Social Inquiry. 2nd ed.: Rowman and Littlefield, 161-199.
Commonwealth Secretariat 2006. Solomon Islands General Election Report of the
Commonwealth Observer Group. Commonwealth Secretariat.
Commonwealth Secretariat 2010. Report of the Commonwealth Observer Group: Solomon
Islands National Parliamentary Elections Commonwealth Secretariat.
Conroy-Krutz, J. 2012. Information and Ethnic Politics in Africa. British Journal of Political
Science, 43(2), 345-373.
Coppel, N. 2012. Transition of the Regional Assistance Mission to Solomon Islands. State,
Society and Governance in Melanesia Discussion Paper, 2012(10).
Corbett, J. Forthcoming. Being Political, Honolulu, University of Hawaii Press.
Corbett, J. & Wood, T. 2013. Profiling Politicians in Solomon Islands: Professionalisation of
a Political Elite? Australian Journal of Political Science, 48(3).
Corrin-Care, J. 2002. ‘Off the peg’ or ‘made to measure’: is the Westminster system of
government appropriate in Solomon Islands? Alternative Law Journal, 27(5), 207-
213.
Corrin, J. 2009. Solomon Islands. In: Levine, S. (ed.) Pacific Ways. Wellington: Victoria
University Press, 212-220.
Cox, G. W. 1997. Making Votes Count, Cambridge, Cambridge University Press.
Cox, J. 2009. Active citizenship or passive clientelism? Accountability and development in
Solomon Islands. Development in Practice, 19(8), 964-980.
Cox, J. & Morrison, J. 2004. Solomon Islands - Provincial Governance Information Paper.
Unpublished Consultant Report Prepared for AusAID.
Craig, D. & Porter, D. 2013. Political settlement, transitions, and lasting peace in Solomon
Islands? Some institutional perspectives. Paper presented at the Solomon Islands in
Transition Workshop. Canberra.
Craig, D. & Porter, D. 2013b. Political settlement in Solomon Islands: a political economic
basis for stability after RAMSI? SSGM Working Paper Series, 2013(1).
Dalsgaard, S. 2009. All the Government’s Men: State and Leadership in Papua New Guinea.
Thesis Submitted for a Doctor of Philosophy, University of Aarhus.

246
Dalton, R. J. & Klingemann, H. D. 2009. Overview of Political Behavior: Political Behavior
and Citizen Politics. In: Goodin, R. E. (ed.) The Oxford Handbook of Political Science.
Oxford: Oxford University Press, 322-344.
Davenport, W. & Çoker, G. 1967. The Moro Movement of Guadalcanal, British Solomon
Islands Protectorate. Journal of Polynesian Society, 76(2), 123-153.
Dawea, E. 2013. MP Admits Benefitting from Tourism Funds Solomon Star, 17/5/2013, p.3.
de Renzio, P. & Kavanamur, D. 1999. Tradition, society and development: social capital in
Papua New Guinea. Pacific Economic Bulletin, 14(2), 37-47.
Defence Imagery Geospatial Organisation 2005. Solomon Islands Gazetteer. Canberra:
Defence Imagery and Geospatial Organization.
Dickson, E. S. & Scheve, K. 2010. Social Identity, Electoral Institutions and the Number of
Candidates. British Journal of Political Science, 40(02), 349-375.
Dinnen, S. 2008. The Solomon Islands intervention and the instabilities of the post-colonial
state. Global Change, Peace & Security, 20(3), 339-355.
Dinnen, S. 2008b. State-Building in a Post-Colonial Society: The Case of Solomon Islands.
Chicago Journal of International Law, 9(1), 51-78.
Dinnen, S. 2009. The Crisis of State in Solomon Islands. Peace Review, 21(1), 70-78.
Dinnen, S. & Allen, M. 2012. Paradoxes of postcolonial police-building: Solomon Islands.
Policing and Society, 1-21.
Dinnen, S. & Haley, N. 2012. Evaluation of the Community Officer Project in Solomon
Islands. Justice for the Poor Research Reports. Washington: The World Bank.
Dorney, S. 1997. ‘If you Don’t Give them Money they Won’t Vote for You’: The Election
Campaign in Lagaip-Porgera. In: May, R. & Anere, R. (eds.) Maintaining Democracy:
The 1997 Elections in Papua New Guinea. Port Moresby: University of Papua New
Guinea, 113-122.
Douglas, B. 2007. Christian Custom and the Church as Structure in Weak States in
Melanesia. In: James, H. (ed.) Civil Society, Religion and Global Governance:
paradigms of power and persuasion. London: Routledge, 158-174.
Duncan, R. & Hassall, G. 2011. How Pervasive is Clientelist Politics in the Pacific? In:
Duncan, R. (ed.) The Political Economy of Economic Reform in the Pacific. Manila:
Asian Development Bank, 253-263.
Dunleavy, P., Diwakar, R. & Dunleavy, C. 2008. Is Duverger’s Law based on a mistake?
Paper presented at Political Studies Association Annual Conference 2008. Swansea
University.
Dureau, C. 1998. Decreed affinities: Nationhood and the western Solomon Islands. The
Journal of Pacific History, 33(2), 197-220.

247
Duverger, M. 1954. Political parties: their organization and activity in the modern state,
London, Methuen.
Duverger, M. 1986. Duverger’s Law: Forty Years Later. In: Grofman, B. & Lijphart, A. (eds.)
Electoral Laws and Their Political Consequences. New York: Agathon Press, 69-84.
East West Centre 2010. Asia Pacific Democracy Partnership Election Observation of the 4
August 2010 National Parliamentary Elections Solomon Islands: Preliminary
Statement. East West Center.
Easterly, W. & Levine, R. 1997. Africa’s growth tragedy: Policies and ethnic divisions.
Quarterly Journal of Economics, 112(4), 1203-50.
Evans, B. R. 2006. Literature Review: A Brief National Assessment of the Agricultural
Sector. Solomon Islands Smallholder Agriculture Study. Canberra: AusAID.
Fearon, J. 1999. Why Ethnic Politics and Pork Tend to go Together. Paper presented at the
Conference on Ethnic Politics and Democratic Stability. University of Chicago.
Fearon, J. D. & Laitin, D. D. 1996. Explaining Interethnic Cooperation. The American
Political Science Review, 90(4), 715-735.
Ferree, K. E. 2006. Explaining South Africa’s Racial Census. Journal of Politics, 68(4), 803-
815.
Filer, C. 1996. ‘Steak and Grease’: A Short History of Political Competition in Nuku. In:
Saffu, Y. (ed.) The 1992 Papua New Guinea elections: change and continuity in
electoral politics. Canberra: Australian National University Department of Political
and Social Change, 168-218.
Finan, F. & Schechter, L. 2012. Vote-Buying and Reciprocity. Econometrica, 80(2), 863-881.
Foale, S. & Macintyre, M. 2000. Dynamic and flexible aspects of land and marine tenure at
West Nggela: Implications for marine resource management. Oceania, 71(1), 30-
45.
Fono, F. 2007. A perspective on constituency development in Solomon Islands. Pacific
Economic Bulletin, 22(2), 127-131.
Fraenkel, J. 2004. The Manipulation of Custom: from Uprising to Intervention in the Solomon
Islands, Wellington, Victoria University Press.
Fraenkel, J. 2005. Democracy and its Pacific Discontents. In: Henderson, J. & Watson, G.
(eds.) Securing a Peaceful Pacific. Christchurch: Canterbury University Press.
Fraenkel, J. 2005b. Political Consequences of Pacific Island Electoral Laws. State, Society
and Government in Melanesia Discussion Paper, 2005(8).
Fraenkel, J. 2008. The Impact of RAMSI on the 2006 Elections. Political Science, 58(2), 63-
85.

248
Fraenkel, J. 2008b. Political Consequences of Pacific Island Electoral Laws. In: Rich, R.,
Hambly, L. & Morgan, M. G. (eds.) Political parties in the Pacific Islands. Canberra:
ANU E Press, 43-67.
Fraenkel, J. 2008c. The impact of RAMSI on the 2006 elections. In: Dinnen, S. & Firth, S.
(eds.) Politics and State-building in Solomon Islands. Canberra: Asia Pacific Press.
Fraenkel, J. 2011. The Atrophied State: A Supply-Side Perspective on Politician ‘Slush
Funds’ in Western Melanesia. In: Duncan, R. (ed.) The Political Economy of
Economic Reform in the Pacific. Manila: Asian Development Bank, 298-311.
Fraenkel, J. & Aspinall, E. 2013. Comparing Across Regions: Parties and Political Systems in
Indonesia and the Pacific Islands. CDI Policy Papers on Political Governance,
2013(2).
Fraenkel, J., Hegarty, D. & Nelson, H. 2007. Patrons Without Clients? Towards a Sociology
of Political Power in the Pacific. Paper presented at Executive Power and the Battle
for Parliamentary Confidence in the Pacific Islands Conference. Port Vila, Vanuatu.
Frazer, I. 1997. The Struggle for Control of Solomon Island Forests. The Contemporary
Pacific, 9(1), 39-72.
Fridy, K. S. 2007. The Elephant, Umbrella, and Quarrelling Cocks: Disaggregating
Partisanship in Ghana’s Fourth Republic. African Affairs, 106, 281-305.
Fry, G. 2000. Political Legitimacy and the Post-colonial State in the Pacific: Reflections on
Some Common Threads in the Fiji and Solomon Islands Coups. Pacifica Review:
Peace, Security & Global Change, 12(3), 295-304.
Fukuyama, F. 2007. Governance Reform in Papua New Guinea. Johns Hopkins University
Working Paper.
Fukuyama, F. 2007b. Observations on State-Building in the Western Pacific. Johns Hopkins
University Working Paper.
Fukuyama, F. 2008. State building in Solomon Islands. Pacific Economic Bulletin, 23(3), 18-
34.
Fukuyama, F. 2013. Democracy and the Quality of the State. Journal of Democracy, 24(4), 5-
16.
Geertz, C. 1973. The Interpretation of Cultures, New York, Basic Books.
George, A. L. & Bennett, A. 2005. Case studies and theory development in the social sciences,
Cambridge, MIT Press.
Gerber, A. S., Huber, G. A., Doherty, D. & Dowling, C. M. 2013. Is There a Secret Ballot?
Ballot Secrecy Perceptions and Their Implications for Voting Behaviour. British
Journal of Political Science, 43(01), 77-102.
Gerring, J. 2004. What Is a Case Study and What Is It Good for? American Political Science
Review, 98(2), 341-355.

249
Gerring, J. & Seawright, J. 2008. Case Selection Techniques in Case Study Research. Political
Research Quarterly, 61(2), 294-308.
Gibbs, P., Haley, N. & Mcleod, A. 2004. Politicking and Voting in the Highlands: the 2002
Papua New Guinea National Elections. State, Society and Governance in Melanesia
Discussion Paper, 2004(1).
Goertz, G. & Mahoney, J. 2012. A Tale of Two Cultures: Qualitative and Quantitative
Research in the Social Sciences, Princeton University Press.
Gonzalez-Ocantos, E., de Jonge, C. K., Meléndez, C., Osorio, J. & Nickerson, D. W. 2012. Vote
Buying and Social Desirability Bias: Experimental Evidence from Nicaragua.
American Journal of Political Science, 56(1), 202-217.
Guba, E. G. & Lincoln, Y. S. 2005. Paradigmatic Controversies, Contradictions, and
Emerging Confluences. In: Denzin, N. K. & Lincoln, Y. S. (eds.) The Sage Handbook of
Qualitative Research. Thousand Oaks: Sage, 191-215.
Habyarimana, J., Humphreys, M., Posner, D. N. & Weinstein, J. M. 2007. Why does ethnic
diversity undermine public goods provision? American Political Science Review,
101(4), 709-725.
Habyarimana, J., Humphreys, M., Posner, D. N. & Weinstein, J. M. 2009. Coethnicity:
diversity and the dilemmas of collective action, New York, Russell Sage Foundation.
Haley, N. 1997. Election Fraud on a Grand Scale: the Case of the Koroba-Kopiago Open
Electorate. In: May, R. & Anere, R. (eds.) Maintaining Democracy: The 1997
Elections in Papua New Guinea. Port Moresby: University of Papua New Guinea,
123-139.
Hall, P. A. 2003. Adapting Methodology to Ontology in Comparative Politics. The Political
Economist: Newsletter of the Section on Political Economy, American Political
Science Association, 11(1), 1-7.
Hameiri, S. 2009. Capacity and its Fallacies: International State Building as State
Transformation. Millennium - Journal of International Studies, 38(1), 55-81.
Hamilton, L. C. 2009. Statistics With Stata: Updated for Version 10, Belmont, Brooks/Cole.
Haque, T. A. 2012. The Influence of Culture on Economic Development in Solomon Islands:
A Political-Economy Perspective. SSGM Discussion Paper, 2012(1), 1-16.
Harding, T. G. 1965. The Rai Coast Open Electorate. In: Bettison, D. G., Hughes, C. A. & van
der Veur, P. W. (eds.) The Papua New Guinea Elections 1964. Canberra: The
Australian National University, 194-211.
Harris, B. 2007. Papua New Guinea: A Nation in Waiting: The Dance of Traditional and
Introduced Structures in a Putative State. World Bank Research Report. The World
Bank.

250
Hasnain, Z., Keefer, P. & Menzies, N. 2011. How Capital Projects are Allocated in Papua
New Guinean Villages: The Influence of Local Collective Action, Local-level
Institutions, and Electoral Politics. Justice for the Poor Research Paper. Washington
DC: The World Bank.
Hayward-Jones, J. 2008. Engineering Political Stability in Solomon Islands: Outcomes
Report.
Hegarty, D. 1983. The 1977 national elections in Papua New Guinea - an overview. In:
Hegarty, D. (ed.) Electoral Politics in Papua New Guinea: Studies on the 1977
National Elections. Port Moresby: University of Papua New Guinea Press, 1-17.
Henrich, N. & Henrich, J. 2007. Why humans cooperate: a cultural and evolutionary
explanation, Oxford, Oxford University Press.
Hicken, A. 2011. Clientelism. Annual Review of Political Science, 14(1), 289-310.
Hogbin, H. I. 1937. Social Organization of Guadalcanal and Florida, Solomon Islands.
Oceania, 8, 398.
Hogbin, H. I. 1937b. The Hill People of North-Eastern Guadalcanal. Oceania, 8, 62.
Hogbin, H. I. & Wedgwood, C. H. 1952. Local Grouping in Melanesia: (To be continued).
Oceania, 23, 241.
Horowitz, D. L. 1985. Ethnic groups in conflict, London, University of California Press.
Hou, R. 2012. Managing the Political Economy of Development in Solomon Islands [Online].
Available: http://devpolicy.org/managing-the-political-economy-of-development-
in-solomon-islands/ Accessed 2/10/2012.
Hou, T. & Kudu, D. 2012. Solomon Islands: Honiara Urban Profile. UN Habitat.
Hviding, E. 1993. Indigenous essentialism? Simplifying customary land ownership in New
Georgia. Bijdragen tot de Taal-, Land- en Volkenkunde, Politics, tradition and change
in the Pacific, 149(4), 802-824.
Hviding, E. 2003. Disentangling the Butubutu of New Georgia: Cognatic Kinship in Thought
and Action. In: Hoëm, I. & Roalkvam, S. (eds.) Oceanic Socialities and Cultural
Forms: Ethnographies of Experience. New York: Berghahn Books, 71-114.
Hviding, E. 2011. Re-placing the state in the Western Solomon Islands: the political rise of
the Christian Fellowship Church. In: Hviding, E. & Rio, K. (eds.) Made in Oceania:
Social Movements, Cultural Heritage and the State in the Pacific. Wantage: Sean
Kingston Publishing, 51-89.
Ichino, N. & Nathan, N. L. 2013. Crossing the Line: Local Ethnic Geography and Voting in
Ghana. American Political Science Review, 107(2), 344-361.
Joseph, K. & Beu, C. B. 2008. Church and State in Solomon Islands. State, Society and
Governance in Melanesia Discussion Paper, 2008(11).

251
Jourdan, C. & Maebiru, E. 2002. Pijin: a Trilingual Cultural Dictionary, Canberra, Pacific
Linguistics.
Justice Delivered Locally Field Team 2012. Malaita Province Field Note. Justice Delivered
Locally Field Notes. Honiara: The World Bank.
Kabutaulaka, T. T. 1997. Deforestation and Politics in Solomon Islands. In: Larmour, P.
(ed.) Governance and Reform in the South Pacific. Canberra: National Centre for
Development Studies, Australian National University, 121-153.
Kabutaulaka, T. T. 1998. Pacific Islands Stakeholder Participation in Development:
Solomon Islands. Pacific Islands Discussion Paper Series. The World Bank.
Kabutaulaka, T. T. 2008. Westminster Meets Solomons in the Honiara Riots. In: Dinnen, S.
& Firth, S. (eds.) Politics and State-building in Solomon Islands. Canberra: Asia
Pacific Press, 96-118.
Kabutaulaka, T. T. 2008b. Parties, Constitutional Engineering and Governance in the
Solomon Islands. In: Rich, R., Hambly, L. & Morgan, M. G. (eds.) Political parties in
the Pacific Islands. Canberra: ANU E Press, 103-116.
Kanbur, R. & Shaffer, P. 2007. Epistemology, Normative Theory and Poverty Analysis:
Implications for Q-Squared in Practice. World Development, 35(2), 183-196.
Kedar, O. 2012. Voter Choice and Parliamentary Politics: An Emerging Research Agenda.
British Journal of Political Science, 42(03), 537-553.
Keefer, P. 2010. The Ethnicity Distraction? Political Credibility and Partisan Preferences in
Africa. World Bank Policy Research Working Papers.
Keesing, R. M. 1968. Nonunilineal Descent and Contextual Definition of Status: The Kwaio
Evidence. American Anthropologist, 70(1), 82-84.
Keesing, R. M. 1971. Descent, Residence and Cultural Codes. In: Hiatt, L. R. & Jayawardena,
C. (eds.) Anthropology in Oceania: essays presented to Ian Hogbin. Sydney: Angus
and Robertson, 121-138.
Keesing, R. M. 1982. Kastom and Anticolonialism on Malaita: “Culture” as Political Symbol.
Mankind, 13(4), 357-373.
Keesing, R. M. 1987. African Models in the Malaita Highlands. Man, 22(3), 431-452.
Keesing, R. M. & Strathern, A. 1998. Cultural Anthropology, London, Harcourt Brace.
Kelly, N. 2010. Electoral Democracy in Post-Conflict Melanesia: The 2010 Bougainville and
Solomon Islands Elections. CDI Policy Paper Series on Political Governance,
2010(2), 1-29.
Ketan, J. 1996. Electoral Politics in Mount Hagen: The Dei Open Election. In: Saffu, Y. (ed.)
The 1992 Papua New Guinea elections: change and continuity in electoral politics.
Canberra: Australian National University Department of Political and Social
Change, 240-265.

252
Ketan, J. 2004. The Name Must Not Go Down: Political Competition and State-Society
Relations in Mount Hagen, Papua New Guinea, Suva, University of the South Pacific.
Ketan, J. 2007. The Use and Abuse of Electoral Development Funds and their Impact on
Electoral Politics and Governance in Papua New Guinea. CDI Policy Papers on
Political Governance, 2007(2), 1-65.
King, G. 1997. A Solution to the Ecological Inference Problem: Reconstructing Individual
Behavior from Aggregate Data, Princeton, Princeton University Press.
King, G., Keohane, R. O. & Verba, S. 1994. Designing social inquiry: scientific inference in
qualitative research, Princeton, Princeton University Press.
King, G., Rosen, O. & Tanner, M. A. 2004. Ecological inference: new methodological
strategies, Cambridge, Cambridge University Press.
King, N. & Horrocks, C. 2010. Interviews in Qualitative Research, London, SAGE
Publications.
Kingmele, E. & Paroi, H. 2000. Political Trends in the Solomon Islands. In: Rynkiewich, M.
A. & Seib, R. (eds.) Politics in Papua New Guinea: continuities, changes and
challenges. Goroka, Papua New Guinea: Melanesian Institute, 240-265.
Kitschelt, H. & Wilkinson, S. 2007. Patrons, clients, and policies: patterns of democratic
accountability and political competition, Cambridge, Cambridge University Press.
Kristín Birnir, J. 2007. Divergence in Diversity? The Dissimilar Effects of Cleavages on
Electoral Politics in New Democracies. American Journal of Political Science, 51(3),
602-619.
Kurer, O. 2007. Why do Papua New Guinean voters opt for clientelism? Democracy and
Governance in a Frail State. Pacific Economic Bulletin, Volume 22(1), 39-53.
Kurer, O. 2007b. Democracy and Economic Development: the Case of Papua New Guinea.
Executive Power and the Battle for Parliamentary Confidence in the Pacific Islands.
Emalus Campus of the University of the South Pacific (USP), Port Vila, Vanuatu.
Lapli, S. J. I., Munamua, R. L., Tropa, A. & Lemoba, R. 2008. A Report on Indigenous and
Local Governance in Temotu Province Identified Communities. Lata: Unpublished
report prepared for the Temotu Constitutional Congress.
Laracy, H. 1983. Pacific Protest: The Maasina Rule Movement, Solomon Islands, 1944-1952,
Suva, Institute of Pacific Studies of the University of the South Pacific.
Lavrakas, P. J. 2008. Ecological Fallacy. In: Lavrakas, P. J. (ed.) Encyclopedia of Survey
Research Methods. Thousand Oaks: SAGE Publications, 218.
Lewis-Beck, M. S., Jacoby, W. G., Norpoth, H. & Weisberg, H. F. 2008. The American Voter
Revisited, University of Michigan Press.

253
Lieberman, E. S. & Singh, P. 2012. Conceptualizing and Measuring Ethnic Politics: An
Institutional Complement to Demographic, Behavioral, and Cognitive Approaches.
Studies in Comparative International Development, 47(3), 255-286.
Lijphart, A. 1977. Democracy in plural societies: a comparative exploration, New Haven,
Yale University Press.
Lijphart, A. 1979. Religious vs. Linguistic vs. Class Voting: The "Crucial Experiment" of
Comparing Belgium, Canada, South Africa, and Switzerland. The American Political
Science Review, 73(2), 442-458.
Lijphart, A. 1995. Multiethnic Democracy. In: Lipset, S. M. (ed.) The encyclopedia of
democracy. London: Routledge.
Lindberg, S. I. & Morrison, M. K. C. 2008. Are African Voters Really Ethnic or Clientelistic?
Survey Evidence from Ghana. Political Science Quarterly, 123, 95-122.
Macqueen, N. 1989. Namatanai Open. In: Oliver, M. (ed.) Eleksin: the 1987 national election
in Papua New Guinea. Port Moresby: University of Papua New Guinea, 209-224.
Mahoney, J. 2010. After KKV: The New Methodology of Qualitative Research. World
Politics, 62(1), 120-147.
May, R. 1982. Political Style in Modern Melanesia. In: Nelson, H. & May, R. (eds.) Melanesia:
beyond diversity. Canberra: Research School of Pacific Studies, Australian National
University, 639-649.
May, R. 1989. Angoram Open. In: Oliver, M. (ed.) Eleksin: the 1987 national election in
Papua New Guinea. Port Moresby: University of Papua New Guinea, 111-122.
May, R. 1997. The East Sepik Electorates: the Demise of Pangu. In: May, R. & Anere, R.
(eds.) Maintaining Democracy: The 1997 Elections in Papua New Guinea. Canberra:
Department of Political Science, School of Humanities and Social Sciences,
University of Papua New Guinea, 149-161.
May, R. 2006. The ‘clan vote’ in Papua New Guinea open electorates: data from Angoram.
The Journal of Pacific Studies, 29(1), 108-130.
McDougall, D. 2003. Fellowship and Citizenship as Models of National Community: United
Church Women’s Fellowship in Ranongga, Solomon Islands. Oceania, 74(1/2), 61-
80.
McDougall, D. 2005. The Unintended Consequences of Clarification: Development,
Disputing, and the Dynamics of Community in Ranongga, Solomon Islands.
Ethnohistory, 52(1), 81-109.
McDougall, D. 2008. Religious Institutions as Alternative Structures in Post-Conflict
Solomon Islands? Cases from Western Province. State, Society and Governance in
Melanesia Discussion Paper, 2008(5).

254
McDougall, D. 2009. Becoming Sinless: Converting to Islam in the Christian Solomon
Islands. American Anthropologist, 111(4), 480-491.
Moore, C. 2004. Happy isles in crisis: the historical causes for a failing state in Solomon
Islands, 1998-2004, Canberra, Asia Pacific Press.
Moore, C. 2005. The RAMSI intervention in the Solomon Islands crisis. The Journal of
Pacific Studies, 28(1), 56-77.
Moore, C. 2006. No More Walkabout Long Chinatown: Asian Involvement in the Solomon
Islands Economic and Political Process. Paper presented at Solomon Islands: Where
to now? Canberra.
Moore, C. 2010. Decolonising the Solomon Islands: British theory and Melanesian Practice.
Alfred Deakin Research Institute Working Papers, 8, 1-27.
Morgan, M. 2005. Cultures of Dominance: Institutional and Cultural Influences on
Parliamentary Politics in Melanesia. State, Society and Government in Melanesia
Discussion Paper, 2005((2)).
Morgan, M. G. & McLeod, A. 2006. Have we failed our neighbour? Australian Journal of
International Affairs, 60(3), 412-428.
Mozaffar, S., Scarritt, J. R. & Galaich, G. 2003. Electoral Institutions, Ethnopolitical
Cleavages, and Party Systems in Africa’s Emerging Democracies. American Political
Science Review, 97(03), 379-390.
Naitoro, J. 1993. The Politics of Development in ‘Are ‘Are Malaita. MA Thesis, Otago
University.
Nanau, G. L. 2011. The Wantok System as a Socio-economic and Political Network in
Melanesia. OMNES : The Journal of Multicultural Society, 2(1), 31-55.
Nanau, G. L. 2011b. Solomon Islands. The Contemporary Pacific, 23(2), 504-512.
Neto, O. A. & Cox, G. W. 1997. Electoral Institutions, Cleavage Structures, and the Number
of Parties. American Journal of Political Science, 41(1), 149-174.
Neuman, W. L. 2006. Social research methods: qualitative and quantitative approaches,
Boston, Allyn and Bacon.
Norris, P. 2004. Electoral Engineering: Voting Rules and Political Behavior, Cambridge,
Cambridge University Press.
Norris, P. & Mattes, R. 2003. Does Ethnicity Determine Support for the Governing Party?
The Structural and Attitudinal Basis of Partisan Identification in 12 African
Nations. Harvard University Faculty Research Working Papers Series, (9).
Ogden, P. 2000. Indices of Segregation. In: Johnston, R. J., Gregory, D., Pratt, G. & Watts, M.
(eds.) The Dictionary of Human Geography. Oxford: Blackwell Publishers, 379-380.

255
Okole, H. 2001. The Fluid Party System of Papua New Guinea: Continuity and Change in a
Third Wave Democracy. Thesis Submitted for a Doctor of Philosophy, Northern
Illinois University.
Okole, H. 2002. Political participation in a fragmented democracy: ethnic and religious
appeal in Papua New Guinea. Development Bulletin, (59), 31-34.
Okole, H. 2005. The ‘Fluid’ Party System of Papua New Guinea. Commonwealth &
Comparative Politics, 43(3), 362-381.
Oliver, D. L. & Johnson, L. 1989. Oceania: the native cultures of Australia and the Pacific
Islands, Honolulu, University of Hawaii Press.
Ordeshook, P. C. & Shvetsova, O. V. 1994. Ethnic Heterogeneity, District Magnitude, and the
Number of Parties. American Journal of Political Science, 38(1), 100-123.
Orlegge, W. 1997. Goroka Open: From Rural Capitalist to Tribes and their Educated Elites.
In: May, R. & Anere, R. (eds.) Maintaining Democracy: The 1997 Elections in Papua
New Guinea. Port Moresby: University of Papua New Guinea, 99-111.
Osi, H. 2013. The 2012 Elections in Oro Province: the Emerging Candidate and Voter
Behaviour and Distinct Differences between the Open Constituencies, vis-à-vis the
Provincial Constituency. Paper Presented at the SSGM Pacific Week. Canberra.
Osifelo, E. 2012a. Church Rift: houses burnt as church rift deepens. Solomon Star, 25/4/12.
Osifelo, E. 2012b. More Water Tanks for Savo-Russells. Solomon Star, 25/4/12.
Ostrom, E. 1999. Institutional Rational Choice: An Assessment of the Institutional Analysis
and Development Framework. In: Sabatier, P. (ed.) Theories of Policy Process.
Boulder: Westview Press, 35-71.
Pacific Islands Forum Secretariat 2010. Report of the Pacific Islands Forum Secretariat’s
Election Observer Team to the 2010 General Elections for the Solomon Islands.
Suva: Pacific Islands Forum Secretariat.
Padro i Miquel, G. & Yao, Y. 2012. Social Fragmentation, Public Goods and Elections:
Evidence from China. NBER Working Papers, (18633).
Paia, W. 1983. Traditionally-Based Associations. In: Larmour, P. & Tarua, S. (eds.) Solomon
Islands politics. Suva: Institute of Pacific Studies of the University of the South
Pacific.
Paternorte, M. & de Gabriel, J. A. 2010. Final Report: European Union Electoral Expert
Mission to the Solomon Islands 2010 European Union.
Pollard, A. A. e. 2003. Women’s Organizations, Voluntarism, and Self-Financing in Solomon
Islands: a Participant Perspective. Oceania, 74(1/2), 44-60.
Pollard, A. A. e. 2006. Painaha: Gender and Leadership in ‘Are ‘Are Society, the South Sea
Evangelical Church and Parliamentary Leadership-Solomon Islands. Thesis
Submitted for a Doctor of Philosophy, Victoria University.

256
Popper, K. R. 1968. The Logic of Scientific Discovery, New York, Harper and Row.
Posner, D. N. 2004. The Political Salience of Cultural Difference: Why Chewas and
Tumbukas are Allies in Zambia and Adversaries in Malawi. The American Political
Science Review, 98(4), 529-545.
Posner, D. N. 2005. Institutions and Ethnic Politics in Africa, Cambridge; New York,
Cambridge University Press.
Posner, D. N. 2007. Regime Change and Ethnic Cleavages in Africa. Comparative Political
Studies, 40(11), 1302-1327.
Posner, D. N. & Simon, D. J. 2002. Economic Conditions and Incumbent Support in Africa’s
New Democracies: Evidence from Zambia. Comparative Political Studies, 35(3),
313-336.
Poteete, A. R. 2010. Small-N Case Studies. In: Poteete, A. R., Janssen, M. & Ostrom, E. (eds.)
Working together: collective action, the commons, and multiple methods in practice.
Princeton: Princeton University Press.
Premdas, R. 1989. Ethnicity and Nation-building: The Papua New Guinea Case. In: Howard,
M. C. (ed.) Ethnicity and Nation-building in the Pacific. Tokyo: The United Nations
University, 244-258.
Premdas, R. & Steeves, J. 1978. Electoral Politics in a Third World City: Port Moresby 1977,
Port Moresby, University of Papua New Guinea.
Premdas, R. & Steeves, J. 1983. The 1980 General Election. In: Larmour, P. & Tarua, S.
(eds.) Solomon Islands Politics. Suva: Institute of Pacific Studies of the University of
the South Pacific, 80-98.
Premdas, R. & Steeves, J. 1994. The 1993 National Elections in the Solomon Islands. The
Journal of Pacific History, 29(3), 46-56.
Premdas, R., Steeves, J. & Larmour, P. 1983. The Western Breakaway Movement. In:
Larmour, P. & Tarua, S. (eds.) Solomon Islands Politics. Suva: Institute of Pacific
Studies at the University of the South Pacific, 164-195.
Provincial Government Development Unit 1998a. Constituency Development Profile and
Action Plan: Rennell and Bellona. Honiara: Department of Provincial Government
and Rural Development.
Provincial Government Development Unit 1998b. Constituency Development Profile and
Action Plan: Central Kwara’ae. Honiara: Department of Provincial Government and
Rural Development.
Qwaina, F. 2011. RCDF: name change or real change? [Online]. Honiara. Available:
http://www.solomonstarnews.com/viewpoint/private-view/9825-rcdf-name-
change-or-real-change Accessed 27/3/12.

257
Rathbun, B. C. 2009. Interviewing and Qualitative Field Methods: Pragmatism and
Practicalities. In: Box-Steffensmeier, Brady, H. E. & Collier, D. (eds.) The Oxford
Handbook of Political Methodology. Oxford: Oxford University Press, 685-701.
Ratuva, S. 2008. Primordial Politics? Political Parties and Tradition in Melanesia. In: Rich,
R., Hambly, L. & Morgan, M. G. (eds.) Political parties in the Pacific Islands.
Canberra: ANU E Press, 27-43.
Reilly, B. 1997. Continuity and Change in Papua New Guinea Elections 1964-1997. In: May,
R. & Anere, R. (eds.) Maintaining Democracy: The 1997 Elections in Papua New
Guinea. Port Moresby: University of Papua New Guinea, 17-37.
Reilly, B. 1999. Party Politics in Papua New Guinea: A Deviant Case? Pacific Affairs, 72(2),
225-246.
Reilly, B. 2000. Democracy, ethnic fragmentation, and internal conflict - Confused theories,
faulty data, and the "crucial case" of Papua New Guinea. International Security,
25(3), 162-185.
Reilly, B. 2001. Democracy in Divided Societies, Cambridge, Cambridge University Press.
Reilly, B. 2004. Ethnicity, democracy and development in Papua New Guinea. Pacific
Economic Bulletin, 19(1), 46-54.
Reilly, B. 2006. Democracy and Diversity: political engineering in the Asia-Pacific, Oxford,
Oxford University Press.
Reilly, B. & Phillpot, R. 2002. "Making democracy work" in Papua New Guinea - Social
capital and provincial development in an ethnically fragmented society. Asian
Survey, 42(6), 906-927.
Riker, W. H. 1982. The Two-Party System and Duverger’s Law: An Essay on the History of
Political Science. The American Political Science Review, 76(4), 753-766.
Roberts Clark, W. & Golder, M. 2006. Rehabilitating Duverger’s Theory: Testing the
Mechanical and Strategic Modifying Effects of Electoral Laws. Comparative Political
Studies, 39(6), 679-708.
Ross, H. M. 1978. Baegu Markets, Areal Integration, and Economic Efficiency in Malaita,
Solomon Islands. Ethnology, 17(2), 119-138.
Roughan, P. 2004. National Integrity Systems - Transparency International Country Study
Report: Solomon Islands 2004. Canberra: Transparency International.
Rural Development Division 2001. Choiseul Province Development Profile. Honiara:
Ministry of Provincial Government and Rural Development.
Rural Development Division 2001b. Temotu Province Development Profile. Honiara:
Ministry of Provincial Government and Rural Development.
Rural Development Division 2001c. Isabel Province Development Profile. Honiara:
Ministry of Provincial Government and Rural Development.

258
Rural Development Division 2001d. Makira Province Development Profile. Honiara:
Ministry of Provincial Government and Rural Development.
Rural Development Division 2001e. Central Province Development Profile. Honiara:
Ministry of Provincial Government and Rural Development.
Saffu, Y. 1989. Survey Evidence on Electoral Behavior in Papua New Guinea. In: Oliver, M.
(ed.) Eleksin: the 1987 national election in Papua New Guinea. Port Moresby:
University of Papua New Guinea, 15-36.
Saffu, Y. 1996. Continuity and Change in PNG Electoral Politics. In: Saffu, Y. (ed.) The 1992
Papua New Guinea Election: Change and Continuity in Electoral Politics. Canberra:
Department of Political and Social Change, Research School of Pacific and Asian
Studies, 1-42.
Samuels, D. 2000. Ambition and Competition: Explaining Legislative Turnover in Brazil.
Legislative Studies Quarterly, 25(3), 481-497.
Sanga, K. 2005. Digging Deeper: Resolving Conflict at a Community Level. In: Henderson, J.
& Watson, G. (eds.) Securing a Peaceful Pacific. Christchurch: Canterbury
University Press, 442-452.
Sasako, A. 2012. Govt bend the rules [Online]. Honiara. Available:
http://www.islandsun.com.sb/index.php?option=com_content&view=article&id=
5457:govt-bend-the-rules-&catid=36:latest-news&Itemid=79 Accessed 29/08/12.
Scales, I. 2008. The coup nobody noticed: the Solomon Islands Western State Movement in
2000. In: Dinnen, S. & Firth, S. (eds.) Politics and State-building in Solomon Islands.
Canberra: Asia Pacific Press, 213-245.
Scales, I., Dinnen, S. & Hegarty, D. 2002. Governance at the Grassroots. Paper presented at
the workshop on participation beyond the centre in Solomon Islands. Canberra.
Scheffler, H. W. 1963. Choiseul Island Descent Groups. The Journal of the Polynesian
Society, 72(3), 177-187.
Scheffler, H. W. 1985. Filiation and Affiliation. Man, 20(1), 1-21.
Scheffler, H. W. & Larmour, P. 1987. Solomon Islands: evolving a new custom. In: Arutangi,
S. & Crocombe, R. (eds.) Land Tenure in the Pacific. Suva: University of the South
Pacific, 303-323.
Scott, M. W. 2000. Ignorance is Cosmos; Knowledge is Chaos: Articulating a Cosmological
Polarity in Solomon Islands. Social Analysis, (44(2)), 56-83.
Scott, M. W. 2007. Neither ‘New Melanesian History’ nor ‘New Melanesian Ethnography’:
Recovering Emplaced Matrilineages in Southeast Solomon Islands. Oceania, 77(3),
337-354.
Seabright, P. 2004. The Company of Strangers: A Natural History of Economic Life,
Princeton, Princeton University Press.

259
Secretariat for the Pacific Community 2009. Solomon Islands Family Health and Safety
Study: a study on violence against women and children, Noumea, Secretariat for the
Pacific Community.
Secretariat for the Pacific Community. n.d. Prism database - Solomon Islands National
Population and Housing Census 2009 [Online]. Available:
http://www.spc.int/prism/nada/index.php/ddibrowser/36/datafile/F2 Accessed
1 March 2013.
Shively, W. P. 2009. The Craft of Political Research, Upper Saddle River, Pearson Education.
Sillitoe, P. 1983. Signs of development?: Nipa-Kutubu Open. In: Hegarty, D. (ed.) Electoral
Politics in Papua New Guinea: Studies on the 1977 National Elections. Port Moresby:
University of Papua New Guinea Press, 196-215.
Singer, M. M. 2012. Was Duverger Correct? Single-Member District Election Outcomes in
Fifty-three Countries. British Journal of Political Science, 43(1), 201-220.
Singer, M. M. & Stephenson, L. B. 2009. The political context and Duverger’s theory:
Evidence at the district level. Electoral Studies, 28(3), 480-491.
Slater, D. 2008. Can Leviathan be Democratic? Competitive Elections, Robust Mass Politics,
and State Infrastructural Power. Studies in Comparative International Development,
43(3-4), 252-272.
Solomon Islands National Statistics Office 1997. Village resources survey 1995/96 - Report
1, Honiara, Statistics Office, Ministry of Finance.
Solomon Islands National Statistics Office 2000. Report on the 1999 Population and
Housing Census: volume 2 (analysis), Honiara, Statistics Office, Ministry of Finance.
Solomon Islands National Statistics Office 2012. Solomon Islands Population and Housing
Census 2009: Basic Tables and Census Description. Statistical Bulletin. Honiara:
Statistics Office, Ministry of Finance.
Solomon Islands National Statistics Office 2013. Report on 2009 Population & Housing
Census: Basic Tables and Census Description, Honiara, Statistics Office, Ministry of
Finance.
Solomon Star News. 2011. SI democratic party has a new executive [Online]. Honiara.
Available: http://www.solomonstarnews.com/news/national/12909-si-
democratic-party-has-a-new-executive Accessed 17/10/2012.
Solomon Star News. 2013. Sikua slams Lilo’s $1m cash payout to Gaena’alu group [Online].
Honiara. Available: http://www.solomonstarnews.com/news/national/17185-
sikua-slams-lilos-1m-cash-payout-to-gaenaalu-group Accessed 1/9/13.
Standish, B. 1989. ‘After the Big One’: the 1982 Chimbu Provincial Campaign. In: King, P.
(ed.) Pangu Returns to Power: the 1982 Elections in Papua New Guinea. Canberra:

260
Department of Political and Social Change, Australian National University, 163-
205.
Standish, B. 2002. Electoral governance in Papua New Guinea: Chimbu Poll Diary, June 2002
[Online]. Available:
http://exkiap.net/articles/miscellaneous/bill_standish_20020628.htm#BillStandi
sh Accessed 1/3/2011.
Standish, B. 2007. The dynamics of Papua New Guinea’s democracy: an essay. Pacific
Economic Bulletin, 22(1), 135-157.
Steeves, J. 2011. ‘Unbounded politics’ and the democratic model in Solomon Islands: the
2010 national elections. Commonwealth & Comparative Politics, 49(3), 342-358.
Steeves, J. S. 1996. Unbounded Politics in the Solomon Islands: Leadership and Party
Alignments. Pacific Studies, 19(1), 115-138.
Steeves, J. S. 2001. Solomon Islands. In: Nohlen, D., Grotz, F. & Hartmann, C. (eds.) Elections
in Asia and the Pacific: a data handbook. Oxford: Oxford University Press, 795-808.
Stewart, P. J. & Strathern, A. 1998. Money, Politics, and Persons in Papua New Guinea.
Social Analysis: The International Journal of Social and Cultural Practice, 42(2), 132-
149.
Stokes, S., Dunning, T., Nazareno, M. & Brusco, V. 2013. Brokers, Voters, and Clientelism,
New York, Cambridge University Press.
Stokes, S. C. 2009. Political Clientelism. In: Goodin, R. E. (ed.) The Oxford Handbook of
Political Science. Oxford.
Stritecky, J. M. 2001. Looking through a moral lens: Morality, violence, and empathy in
Solomon Islands. Thesis submitted for a Doctor of Philosophy, The University of
Iowa.
Sumner, A. & Tribe, M. A. 2008. International Development Studies: Theories and Methods in
Research and Practice, London, Sage.
Ta’asi, E. 2012. Detke keeps constituents smiling [Online]. Available:
http://www.islandsun.com.sb/index.php/index.php?option=com_content&vi
ew=article&id=4807:-detke-keeps-constituents-
smiling&catid=36:latest-news&Itemid=79 Accessed 11/3/13.
Taagepera, R. 1999. The Number of Parties As a Function of Heterogeneity and Electoral
System. Comparative Political Studies, 32(5), 531-548.
Talasasa, W. K. 1979. Submission to the Solomon Islands Constituency Boundaries Report.
In: Siama, G., Sipolo, S. A., Sunaone, J. S., Scott, G. C. M., MacFadden, C. A. & Biku, R.
(eds.) Solomon Islands Constituency Boundaries Report. Honiara: Solomon Islands
National Parliament, 55-56.

261
Tansey, O. 2007. Process Tracing and Elite Interviewing: A Case for Non-Probability
Sampling. PS: Political Science and Politics, 40(4), 765-772.
Tryon, D. T. & Hackman, B. D. 1983. Solomon Islands languages: an internal classification,
Canberra, Dept. of Linguistics, Research School of Pacific Studies, Australian
National University.
Tuhanuku, J. 1995. The reality of governance in Solomon Islands today. Pacific Economic
Bulletin Volume 10(Number 2), 66-69.
Ulufa’alu, B. 1983. The Development of Political Parties. In: Larmour, P. & Tarua, S. (eds.)
Solomon Islands Politics. Suva: Institute of Pacific Studies of the University of the
South Pacific, 101-106.
Uppal, Y. 2009. The disadvantaged incumbents: estimating incumbency effects in Indian
state legislatures. Public Choice, 138(1-2), 9-27.
Van Evera, S. 1997. Guide to methods for students of political sciences, Ithaca, Cornell
University Press.
Van Evera, S. 2001. Primordialism Lives! Newsletter of the Organized Section in
Comparative Politics of the American Political Science Association, 12(1), 20-22.
Vicente, P. C. & Wantchekon, L. 2009. Clientelism and vote buying: lessons from field
experiments in African elections. Oxford Review of Economic Policy, 25(2), 292-305.
Wantchekon, L. 2003. Clientelism and Voting Behavior: Evidence from a Field Experiment
in Benin. World Politics, 55(3), 399-422.
Warry, W. 1987. Chuave politics: changing patterns of leadership in the Papua New Guinea
Highlands, Canberra, Australian National University.
Weghorst, K. R. & Lindberg, S. I. 2013. What Drives the Swing Voter in Africa? American
Journal of Political Science, 57(3), 717-734.
White, G. 2007. Indigenous Governance in Melanesia. State Society and Governance in
Melanesia Discussion Paper, 2007(5).
Wickham, A. 2004. Who Needs What & When from a Civil Society Network Secretariat
(Unpublished Pamphlet). Honiara.
Wood, T. 2013. The Causes and Consequences of Local Voting in Solomon Islands. State,
Society and Government in Melanesia in Brief, 2013(17).
World Bank. 2011. Solomon Islands: Rural Development Program in Pictures [Online].
Washington. Available: http://go.worldbank.org/S8L80WEHE0 Accessed 25
February 2013.
World Bank. 2013a. World Bank World Development Indicators [Online]. Available:
http://data.worldbank.org/data-catalog/world-development-indicators Accessed
28/1/2013.

262
World Bank. 2013b. Worldwide Governance Indicators [Online]. Washington: The World
Bank. Available: www.govindicators.org Accessed 21/10/2013.
Yasi, J. 1996. The Election in the Imbbongu Open Electorate. In: Saffu, Y. (ed.) The 1992
Papua New Guinea elections: change and continuity in electoral politics. Canberra:
Australian National University Department of Political and Social Change, 266-276.
Yin, R. K. 2013. Case Study Research: Design and Methods, Thousand Oaks, Sage.