tight junction and adherens junction proteins in biliary
TRANSCRIPT

Tight junction and adherens junction proteins in biliary tract cancers
Ph.D. Thesis Synopsis
Zsuzsanna Németh, MSc
Semmelweis University
School of Doctoral Studies of Pathology
Supervisor: Dr. András Kiss, Ph.D. Associate Professor
Critical Examiners: Dr. László Herszényi, Ph.D. Dr. Barna Bogner, Ph.D.
Members of the University Examination Committee:
Dr. Ilona Kovalszky, Ph.D., Professor of Pathology
Dr. Károly Simon, Ph.D., Head of Department
Dr. Sándor Paku, Ph.D.
Budapest
2010

2
I. INTRODUCTION
Biliary tract cancers primarily affect elderly patients. Development of these tumours have
different causes in the western countries as opposed to the Asian part of the world, although
the incidence and mortality of intrahepatic cholangiocarcinomas (IBDCs), as compared with
extrahepatic bile duct cancers (EBDCs) and gallbladder cancers (GBCs), show rising
tendency worldwide. Intrahepatic cholangiocarcinoma is the more aggressive group of these
diseases, with rapid infiltration of the deeper layers of the surrounding tissues, thereby the
lack of effective, speedy and appropriate therapeutic processes principally results in lethal
outcome. As regards the correct differential diagnosis of these tumours and the establishment
of a diagnosis on time, there are still many questions to be solved.
In tumour research, development and progression, the past ten years have seen studies mainly
related to cellular based alterations of the molecular processes. Functioning of the biliary
tracts requires, similar to intracellular signalling, intercellular connections too, which also
have important role. Although the last ten years have provided study results on these
connections regarding their function in pathological alterations and the relationship between
these protein expressions and certain diseases, numerous details are still to be elucidated.
The tight junction (TJ) and adherens junction (AJ) proteins have been found to show in many
cases significantly differing expression in normal, inflammatory and neoplastic tissues.
According to our present knowledge the cell junctional complexes not only form a physical
barrier, but also have importance in the communication with the environment. Thus the TJ
proteins, beyond the formation of cell polarity and paracellular diffusion, presumably take
part in the transmission of information. The proteins belonging to the claudin family are
among the principal elements of the TJ complex.
The claudin protein expressions have not yet been investigated in different parts of the normal
biliary tract (with the exception of claudins-1, -2, -3, -4 in the gallbladder). Strong claudin-4
expression was observed in biliary tract cancers by Lódi et al., which finding is important
because claudins-3 and -4 are the natural receptors of the toxin of the Clostridium perfringens
(CPE) Gram-positive bacteria, and this feature entails therapeutic consequences in case of the
tumours expressing these two proteins.
Based on the above, my aim was to investigate the claudin and certain other TJ and AJ
protein expressions in different parts of the normal and neoplastic biliary tract.

3
II. THE AIM OF THE STUDY
On the basis of the literary data we supposed that claudins show differing expression in the
different parts of the human biliary tract. I selected those claudins for which I found enough
information in the literature for subsequent analysis. My aim was:
1. To determine the claudin-1, -2, -3, -4, -7, -8 and -10 protein and mRNS expression
profiles (and possibly the functional explanation of the results) in the different parts of
the normal and tumorous biliary tract samples.
2. To study the differential diagnostic role of claudins in bile duct cancers.
It is known that E-cadherin expression is delayed during tumour development. Previous
results have shown the expression of TJ claudins to differ distinctly from that of AJ.
Accordingly, I planned to study the occludin, non-claudin integrant transmembrane - and ZO-
1, plaque protein expressions. My aim was:
3. To determine the ZO-1, occludin and E-cadherin expression profiles in the different
parts of the normal, and tumorous biliary tract samples.
4. To study the differential diagnostic role of ZO-1, occludin and E-cadherin proteins in
the bile duct cancers.
Based on the literary data, the amount of claudin-1 and claudin-4 proteins changes in the
blood and serous effusions parallel with the arising tumours.
5. My aim was to set an ELISA method for the detection of claudin-1 and claudin-4
proteins, applicable also as a supplemental or independent diagnostic method.
4
III. MATERIAL AND METHODS
Samples
I obtained formalin fixed, paraffin embedded (FFPE) normal and tumorous biliary tract (Table
1.) and hepatocellular carcinoma (HCC) samples, furthermore, for the protein and mRNA
methods, frozen HCC and colorectal cancer (CRC) samples from the archives (2001-2007
years) of the 2nd Department of Pathology of Semmelweis University (Regional Ethical
Committee permission #172/2003), as well as HuH7, PLC, HepG2, Hep3B, T47D, HT29,
HeLa cell lines.
Table 1. Distribution of the obtained biliary tract cancer samples according to the WHO
classification (Hamilton 2000; Guzman and Chejfec 2007). IBDC-intrahepatic bile duct
cancer, EBDC – extrahepatic bile duct cancer, GBC- gallbladder cancer
Groups G1 G2 G3
IBDC 1/11 6/11 4/11
EBDC 0/17 12/17 5/17
GBC 1/34 19/34 14/34
Tissue microarray (TMA)
15 TMA blocks, each including 24 x 2mm diameter tissue cylinders (cores) were prepared
from FFPE normal and tumorous biliary and HCC samples. 62 biliary tumours (11 IBDC, 17
EBDC, and 34 GBC) and 57 normal biliary tracts (12 NIBD, 12 NEBD, and 33 NGB) were
investigated. The selection of these tissues were based on the haematoxylin (H) – eosin (E)
stained slides used for routine diagnostic procedure taking into consideration the
pathohistological and immunohistochemical findings. According to the WHO classification
the samples were divided into well differentiated (G1), moderately differentiated (G2) and
poorly differentiated (G3) groups. Each blocks contained HCC and normal control samples.

5
Immunohistochemical staining on FFPE
After deparaffination immunohistochemical reactions were carried out for claudins-1, -2, -3, -
4, -7, -8, -10, ZO-1, occludin, E-cadherin and cytokeratin-7 using 3-5 µm slides cut from the
TMA blocks. The slides, after washing in PBS (pH 7.4) for 3 x 5 minutes, were treated in a
microwave oven for 30 minutes to retrieve the antigens. The immunohistochemical reactions
were performed by automated VENTANA ES staining system: following incubation with the
diluted primary, then the biotinylated antibody and Streptavidin-HRP complex, the antigens
were detected with the color change of DAB on the tissue specimens.
Immunocytochemistry with DAB
The cells were treated with trypsin-EDTA, then the reaction was blocked with 6-fold volume
of the medium. After centrifugation and discarding of the supernatant, the cells were washed
in 1 x PBS. 500-500 µl amounts of the cells were placed on the slides using cytospin
centrifuge. Following methanol – acetone fixation, the samples were marked as described
above.
Fluorescent immunohistochemistry and cytochemistry
In those cases in which the detected amount of the protein was too low, therefore the
conventional adjustment of immunohistochemical reactions did not allow for making clear
consequences, I used the fluorescent immunohistochemical method for checking the presence
of the observed proteins. I also used the fluorescent immunocytochemical process for the cell-
line controls of the ELISA method to detect the expressions of the TJ- and AJ- protein
complexes.
Real-time RT PCR
Total mRNA was isolated from normal and tumorous biliary tract samples using trizol
reagent, then after measuring the concentration of the resulted solutions cDNAs were
prepared in 1:1 ratio. Using cDNA extracts from normal and tumorous bile duct samples,
quantitative PCR was carried out comparing the quantity of the nascent DNA to the reference
gen (β-actin).

6
Western blot
The frozen tissue samples were homogenized, or the cells after trypsin-EDTA treatment were
lysed with a buffer containing a Triton-X, SDS, protease inhibitor cocktail. After
centrifugation and discarding the supernatant, the protein concentrations were measured. The
proper volume of solution, which involved 20-20 µg protein, respectively, was mixed with 4 x
treatment buffer in 3:1 ratio, then put into ice after thermodenaturation at 100 ºC. The proteins
were separated with SDS-PAGE by their molecular weight, then blotted into PVDF
membrane. After immunoreactions (incubation with specific primary and HRP conjugated
secondary antibody) the chemiluminescence (ECL) was detected on X-ray film.
ELISA
Using the normal ELISA method the surface of the 96-well plate was coated with 0.5 µg/well
amount of the antigen solution. Using specific primary- and HRP conjugated secondary
antibodies for marking the antigen, then applying TMB or fluorescent detection, the
absorbance and emission values were measured.
With the sandwich ELISA method the coating process was carried out with a specific
antibody (for the antigen) produced in a host other than the detecting specific primary
antibody. Putting the samples into wells, the adherent antigens were detected in the same
manner as mentioned previously.
Statistical analysis
Semiquantitative analysis, using the Mann-Whitney U test, Bonferroni-Holmes correction, as
well as discriminant analysis were carried out with SPSS 15.0 software.
The statistical results of the mRNA assay were calculated with the REST-384-beta-v2
software.
The results of the ELISA method (interpolation/extrapolation analysis) were calculated using
GraphPad Prism v5 software.

7
IV. RESULTS
Determination of the expression profile of claudins in different parts of the normal and
neoplastic biliary tract samples
Characterization of claudin immunoreactions
In the normal biliary epithelia, in accordance with the corresponding positive control tissues,
immunostaining of claudins-1, -3, -4, -8, and -10 appeared only on plasma membranes.
In addition to the membranous staining, cytoplasmic immunoreactions of claudin-2 were
evident in both the normal biliary epithelia and the normal colon control. Furthermore,
cytoplasmic claudin-7 immunostaining also appeared in the gallbladder epithelial cells but not
in the control mammary gland epithelium. The cell surface reactions of claudins-3, -8, and -10
were often restricted to the apical membrane domain of biliary epithelial cells; of these, only
claudin-8 exhibited the same apical restriction in the positive control tissue (normal renal
tubules). The other claudins were distributed more or less evenly across the apical, lateral, and
basal membrane domains (Table 2). Similar observations were made on biliary tract cancers,
with the following remarks: (a) the immunoreactions extended to the entire cell surface in the
case of claudins-8 and -10 and (b) additional cytoplasmic staining of claudin-10 appeared in
the tumour cells. Claudin-1, -3, and -10 proteins showed a ring-like structure around the
tumours in some cases (similarly to the agrin protein expression).
Table 2. Localization of claudin proteins after analysing the immunohistochemical reactions.
Cldn: claudin; A: apical-; AL: apicolateral-; BL: basolateral-; B: basal expression; *: cytoplasmic, too
Localization of the immunoreactions
normal samples tumorous samples
A AL BL B A AL BL B
Cldn1 + + + - + + + + Cldn2* + + + + - - - - Cldn3 + + + + + + + + Cldn4 + + + - + + + + Cldn7 + + + - + + + + Cldn8 + + - - + + - + Cldn10 + + - - +* +* +* +*

8
Evaluation of claudin immunoreactions
Immunoreactions were evaluated with regard to two parameters: immunoreaction intensity
was measured with 4 degree (negative, weak, intermediate, and strong), while the positivity
value was counted as percentage of immunopositive cells.
Three comparisons were used: protein expressions were compared in the different parts of the
normal bile duct, in the tumorous bile ducts and in the corresponding normal tissues, as well
as in the tumorous groups of samples. This evaluation resulted that the different parts of the
normal biliary tract differed significantly from each other primarily in the expression of
claudins-2, -3 and -4, the normal and tumorous tissues differed in all claudin expressions,
while the neoplastic groups showed significant difference in all protein expression as well,
with the exception of claudin-7. Significant differences in the cancer vs. normal comparisons
exceeded in number those found in the cancer vs. cancer comparisons: immunoreaction
intensity, the percent of immunopositive cells, or both were significantly different in 14/21
cancer vs. normal comparisons (of which 11 were strongly significant ; p <0.001 in at least
one aspect), whereas this proportion was 10/21 in the case of cancer vs. cancer comparisons
(none of which were strongly significant; 0.05 <p <0.01). Eleven of 24 significant differences
were manifested in both aspects of the immunoreactions, indicating a positive correlation
between the two parameters, which was statistically confirmed in the case of claudins-1, -2,
-3, -4, -7, and -10 (Spearman's rank correlation, p≤0.001 for all). Discriminant analysis was
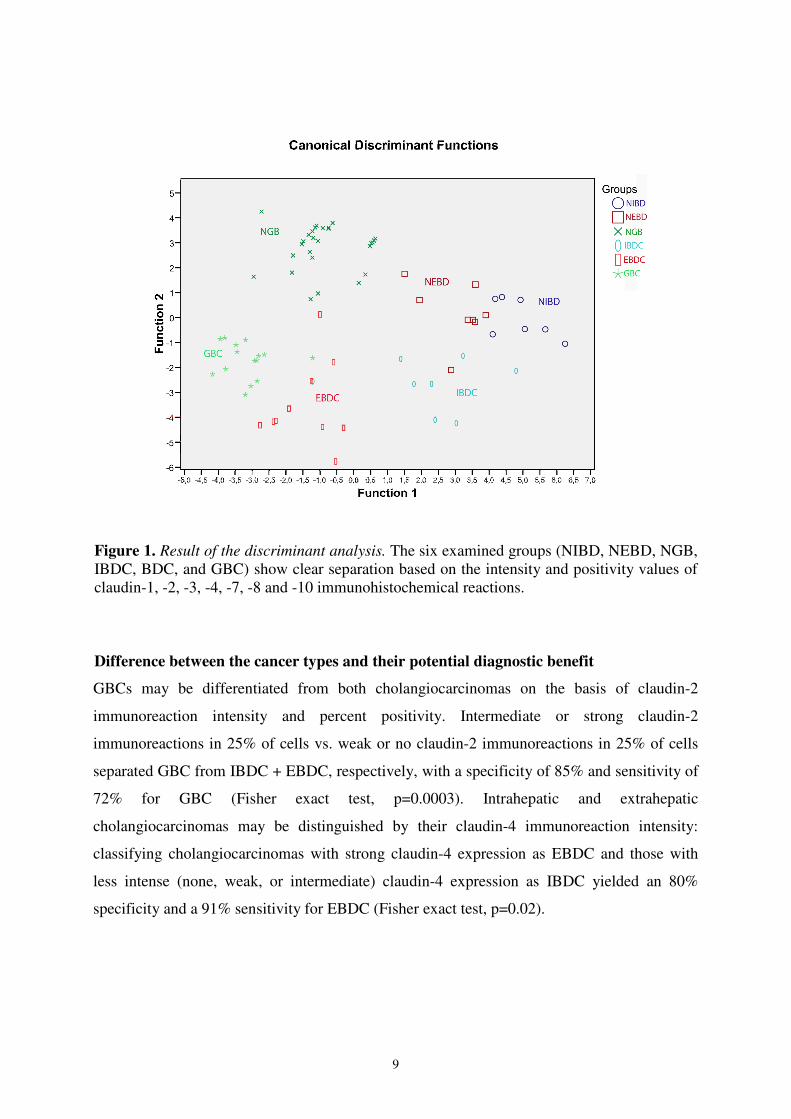
based on all intensity and percent positivity data of the performed immunoreactions. The
result of the evaluation are observable on Figure 1, which shows all the three normal and
neoplastic groups by various colours and shapes. Each “point” represents a sample. If the
expression of the claudins is characteristic only to a given group, the identical signs of the
samples are localize in a distinct area of the picture. Accordingly, the result showed on Figure
1 confirm that the claudin expressions are specific for all the six groups, thus resulting in a
clear separation of the six sample groups.
Comparison of cancers with the corresponding normal groups
Significantly lower expression, regarding at least one evaluation parameter, of claudins in the
various cancers was observed as follows: claudins3, -7, -8, and -10 in IBDC; claudins-1, -8,
and -10 in EBDC; and claudins-1, -2, -3, -7, -8, and -10 in GBC. In other words, claudin-2
was found to be downregulated in GBC only; claudins-1, -3, and -7 were downregulated in
two cancer types; and claudins-8 and -10 were downregulated in all the three cancer types.
9
Figure 1. Result of the discriminant analysis. The six examined groups (NIBD, NEBD, NGB, IBDC, BDC, and GBC) show clear separation based on the intensity and positivity values of claudin-1, -2, -3, -4, -7, -8 and -10 immunohistochemical reactions.
Difference between the cancer types and their potential diagnostic benefit
GBCs may be differentiated from both cholangiocarcinomas on the basis of claudin-2
immunoreaction intensity and percent positivity. Intermediate or strong claudin-2
immunoreactions in 25% of cells vs. weak or no claudin-2 immunoreactions in 25% of cells
separated GBC from IBDC + EBDC, respectively, with a specificity of 85% and sensitivity of
72% for GBC (Fisher exact test, p=0.0003). Intrahepatic and extrahepatic
cholangiocarcinomas may be distinguished by their claudin-4 immunoreaction intensity:
classifying cholangiocarcinomas with strong claudin-4 expression as EBDC and those with
less intense (none, weak, or intermediate) claudin-4 expression as IBDC yielded an 80%
specificity and a 91% sensitivity for EBDC (Fisher exact test, p=0.02).
10
Claudin-3 resulted positive immunohistochemical reaction in 100% of EBDC, 50% of IBDC,
and more than 60% in GBC samples.
The claudin-7 immunoreactions were positive in 30% of cholangiocellular carcinomas, and
the intensity was mainly weak (1+).
Based on the survival data the lower expression of claudin-10 protein was correlated with a
significantly (p <0.01) longer lifespan in the examined patients. Oppositely, neither the
claudin-1, nor the claudin-4 expression showed significant correlation with survival.
Moreover, the same or nearly the same expressions of the last two claudins in the tumorous
tissues as in the normal samples resulted a group with longer (253, ill. 595.5 days as opposed
to 246, 154, and 124, 110 days) lifespan, than the groups showing other degrees of protein
expression.
mRNA expression
For comparisons of the mRNA expression in the “normal” and tumorous biliary tracts we
used normal tissues surrounding the tumorous regions and the tumorous tissue samples.
Between the neoplastic groups we confined an intrahepatic and a contracted group: from the
extrahepatic- and gallbladder cancer samples. The calculated values of the mRNA expression
analysis did not result significant differences between the studied groups (Table 3).
Table 3. Results of the statistical analysis of the mRNS expressions. None of the results are significant. IBDC: intrahepatic bile duct tumour; EBDC/GBC: extrahepatic bile duct and gallbladder tumour; Itu/n: normal surroundings of intrahepatic tumour; EBDC: extrahepatic bile duct tumour; Etu/n: normal surroundings of extrahepatic tumour; significant: p <0.5
P values of the statistical analysis
Groups Cl1 Cl2 Cl3 Cl4 Cl7 Cl8 Cl10
IBDC-EBDC/GBC 0,651 0,791 0,275 0,347 0,569 0,468 0,794
IBDC-Itu/n 0,327 0,944 0,932 0,672 0,814 0,754 0,411
EBDC-Etu/n 0,937 0,994 0,584 0,235 0,790 0,372 0,782

11
Determination of the expression profile of ZO-1, occludin, and E-cadherin in different
parts of the normal and neoplastic biliary tract samples
Characterization of ZO-1, occludin, and E-cadherin immunoreactions
ZO-1 and occludin showed plasma membrane immunoreaction pattern on the apical side of
the membrane only, whereas E-cadherin exhibited both membranous and cytoplasmic
reactions (Table 4, Figure 2). While the immunoreactions remained apical in acinary
structures of well-differentiated tumours, aberrant diffuse membrane localisation of ZO-1 and
occludin was observed on small- to medium-sized cells in higher-grade tumours with solid
growth pattern.
Table 4. Observed localization of ZO-1, occludin, and E-cadherin proteins after analysing
the immunohistochemical reactions. A: apical-; AL: apicolateral-; BL: basolateral-; B: basal expression
Localization of the immunoreactions
normal samples tumorous samples
A AL BL B A AL BL B
ZO-1 + - - - + - - - Occludin + - - - + - - - E-cadherin + + + - + + + +
Figure 2. ZO-1 immunoreactions showed in the examined groups. Picture a-c: normal samples, d-f: carcinoma samples, a and d: intrahepatic localization, b and e: extrahepatic localization, c and f: gallbladder samples. Bar: 50 µm
12
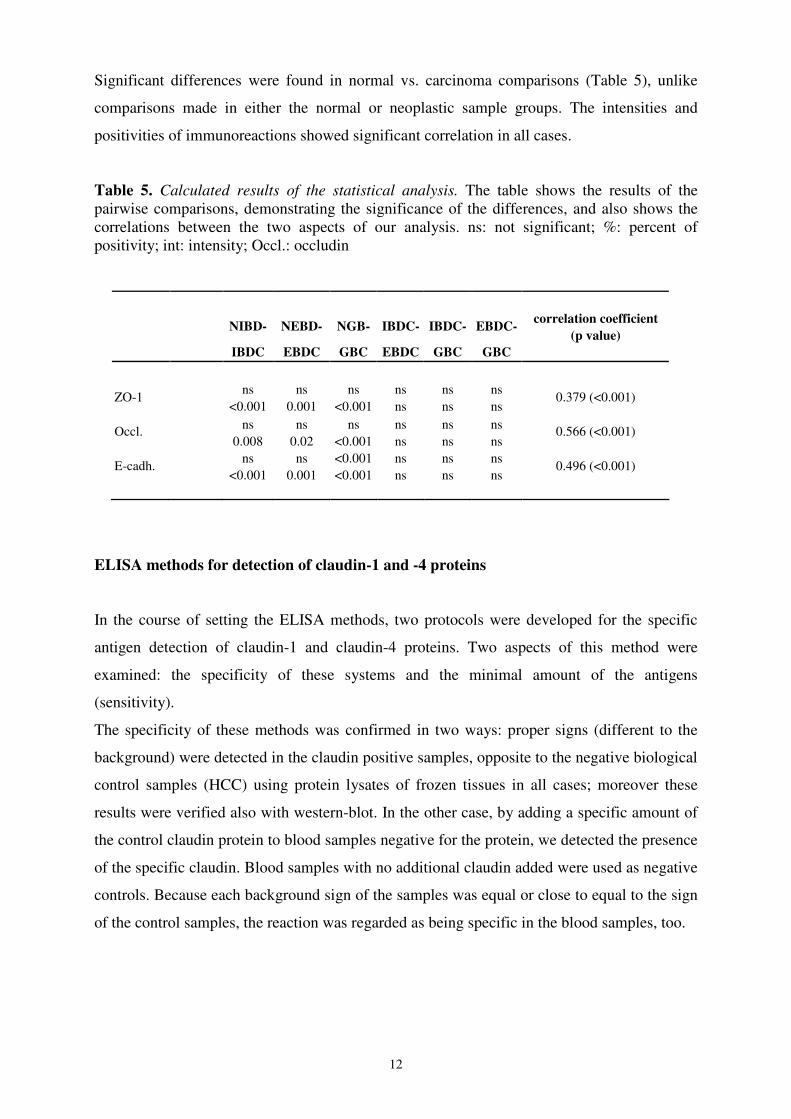
Significant differences were found in normal vs. carcinoma comparisons (Table 5), unlike
comparisons made in either the normal or neoplastic sample groups. The intensities and
positivities of immunoreactions showed significant correlation in all cases.
Table 5. Calculated results of the statistical analysis. The table shows the results of the pairwise comparisons, demonstrating the significance of the differences, and also shows the correlations between the two aspects of our analysis. ns: not significant; %: percent of positivity; int: intensity; Occl.: occludin
correlation coefficient
NIBD- NEBD- NGB- IBDC- IBDC- EBDC-
(p value)
IBDC EBDC GBC EBDC GBC GBC
int ns ns ns ns ns ns
ZO-1 <0.001 0.001 <0.001 ns ns ns
0.379 (<0.001)
int ns ns ns ns ns ns Occl. 0.008 0.02 <0.001 ns ns ns
0.566 (<0.001)
int ns ns <0.001 ns ns ns E-cadh.
<0.001 0.001 <0.001 ns ns ns 0.496 (<0.001)
ELISA methods for detection of claudin-1 and -4 proteins
In the course of setting the ELISA methods, two protocols were developed for the specific
antigen detection of claudin-1 and claudin-4 proteins. Two aspects of this method were
examined: the specificity of these systems and the minimal amount of the antigens
(sensitivity).
The specificity of these methods was confirmed in two ways: proper signs (different to the
background) were detected in the claudin positive samples, opposite to the negative biological
control samples (HCC) using protein lysates of frozen tissues in all cases; moreover these
results were verified also with western-blot. In the other case, by adding a specific amount of
the control claudin protein to blood samples negative for the protein, we detected the presence
of the specific claudin. Blood samples with no additional claudin added were used as negative
controls. Because each background sign of the samples was equal or close to equal to the sign
of the control samples, the reaction was regarded as being specific in the blood samples, too.

13
The sensitivity was laid down by dilution curves. In case of the developed ELISA methods
detecting claudin-1 and claudin-4 proteins, the measurable minimal protein amount was 0.3
ng/well. The unknown protein concentrations of the tissue lysates were determined by using
interpolation/extrapolation software (Figure 3).
Figure 3. Determination of claudin amount in the samples by the calibrating/dilution curve. Emisszió: degree of the detected signs; Antigén mennyiség: power of 10 in ng; the vertical lines under the curve show the counted values of the concentrations
Based on our results the developed ELISA methods are usable for determining the amount of
claudin-1 and claudin-4 proteins in tissue lysetes. Clear answer was not found to the question
whether all the amounts of claudin proteins could be determined in blood samples (possible
binding of claudins to other ingredients of the blood, or possible effect of the blood collecting
process for the quantitative detection of claudins). Therefore, further studies would be
necessary to answer this question.
14
V. NEW ESTABLISHMENTS, SUMMARY
In my dissertation I demonstrated for the first time the differences of claudin-1, -2, -3, -
4, -,7, -8 and -10 protein expressions in several parts of the biliary tract in normal and
tumorous samples. Based on my results, the claudin proteins are specifically expressed
in several parts of the biliary tract in both normal- and tumorous tissues, as opposed to
the other proteins I examined.
1. a, Based on the obtained results of semiquantitative immunohistochemistry, I
demonstrated that claudin-1, -3, -4, -7, -8 and -10 proteins are expressed apically and
apicolaterally in different parts of the biliary tract in normal and neoplastic tissues,
moreover that claudins-1, -3, -4, and -7 show basolateral, whereas claudins-2 and -3
show basal expression as well. Claudin-2 protein also shows cytoplasmic reaction.
Except for claudin-4, all other protein expressions were downregulated in the neoplastic
samples as compared with the corresponding normal tissues (in some cases changes
were not detected).
b, The observed immunohistochemical reactions of claudins-2, -7, -8 and -10 elucidate
the role of the biliary epithelium in the production/generation of bile composition.
2. The specific reaction of claudins was confirmed in several parts of the biliary tract, in
the normal and neoplastic samples as well. Different expression of claudin-3 was
observed in the majority of intrahepatic cholangiocarcinomas, opposite to ductal
pancreatic tumours.
3. Based on the results of the semiquantitative immunohistochemistry, I demonstrated that
ZO-1 and occludin proteins show apical, E-cadherin protein apical, apicolateral,
basolateral expression, too (tumorous samples show basal expression as well).

15
4. Group-specific reactions of ZO-1, occludin and E-cadherin were not confirmed in
several parts of the biliary tract, in the normal and neoplastic samples as well.
Significant differences were found in normal vs. carcinoma comparisons.
5. Different expressions of ZO-1 and occludin were observed compared with that of
claudins, the main part of TJ complexes in the biliary tract.
The most suitable fixation was demonstrated in the HuH7, PLC, HepG2, Hep3B, T47D,
HT29 cell-lines for the detection of claudins with fluorescent immunocytochemistry,
moreover the claudin-1 and -4 expression profile was confirmed in the same cell-lines.
Two ELISA based protocols were established, suitable for the detection of claudin-1 and
claudin-4 proteins from tissue- and cell-lysates.
6. a, The most suitable fixation method used in the cell-lines for claudin protein detection
was demonstrated.
b, It was established that all the HuH7, PLC, HepG2, Hep3B, T47D, HT29 cell-lines
express claudin-1 protein, while only the HepG2, T47D and HT29 cell-lines show
claudin-4 protein expression.
c, An ELISA based method was developed for detection of claudin-1 from tissue- and
cell-line lysates in the range of 0.3ng - 306ng protein amount.
d, An ELISA based method was developed for detection of claudin-4 from tissue- and
cell-line lysates with 0.3ng minimal amount of protein.

16
VI. LIST OF PUBLICATIONS
Cumulative impact factor (IF): 9.135
Publications related to the Dissertation (IF: 4.083):
Németh Z, Szász AM, Tátrai P, Németh J, Győrffy H, Somorácz A, Szíjártó A, Kupcsulik P,
Kiss A, Schaff Z (2009) Claudin-1, -2, -3, -4, -7, -8, and -10 protein expression in biliary tract
cancers. J Histochem Cytochem 57(2):113-21 IF: 2.823
Németh Z, Szász AM, Somorácz A, Tátrai P, Németh J, Győrffy H, Szíjártó A, Kupcsulik P,
Kiss A, Schaff Z (2009) Zonula Occludens-1, Occludin, and E-cadherin Protein Expression in
Biliary Tract Cancers. Pathol Oncol Res 15(3):533-539 IF: 1.260
Publications not related to the Dissertation (IF: 5.052):
Szendrői A, Dinya E, Kardos M, Szász AM, Németh Z, Ats K, Kiss J, Antal I, Romics I,
Szendrői M (2009) Prognostic factors and survival of renal clear cell carcinoma patients with
bone metastases. Pathol Oncol Res (Epub ahead of print) IF: 1.260
Németh J, Németh Z, Tátrai P, Péter I, Somorácz Á, Szász AM, Kiss A, Schaff Zs (2009)
High expression of claudin-1 protein in papillary thyroid tumor and its regional lymph node
metastasis. Pathol Oncol Res (Epub ahead of print) IF: 1.260
Kulka J, Szász AM, Németh Z, Madaras L, Schaff Z, Molnár IA, Tőkés AM (2009)
Expression of tight junction protein claudin-4 in Basal-like breast carcinomas. Pathol Oncol
Res 15(1):59-64 IF: 1.260
Riesz P, Lotz G, Páska C, Szendrői A, Majoros A, Németh Z, Törzsök P, Szarvas T,
Kovalszky I, Schaff Z, Romics I, Kiss A (2007) Detection of bladder cancer from the urine
using fluorescence in situ hybridization technique. Pathol Oncol Res 13(3):187-94 IF: 1.272

17
Co-author in Book:
Halmy L, Németh Z, Halmy E. Hungarian Bibliography of Obesity. Folpress 2008
Quotable abstract related to the Dissertation:
Németh Z, Szász AM, Somorácz A, Tátrai P, Németh J, Gyorffy H, Szíjártó A, Kupcsulik P,
Kiss A, Schaff Z (2009) Zonula Occludens-1, Occludin, and E-cadherin Protein Expression in
Biliary Tract Cancers. 44th Annual Meeting of the European Association for the Study of the
Liver, Copenhagen, Denmark, April 22-26, 2009. J Hepatol 50 S1: S107-108, 2009
Non-quotable abstracts not related to the Dissertation:
Németh Z (2004) Angiotenzin convertase enzyme (ACE) - cardiovascular disease. BM
Jubilee Conference 2004. november 18-20, Budapest, BM Duna Palota, Jubilee Scientific
Program and Collection of Abstracts 2004. Abstracts No. 38 and 39.