tijdschrift voor economische en sociale geografie paper accepted
TRANSCRIPT

Tijdschrift voor Economische en Sociale Geografie
Paper accepted for publication in
TESG 100 Special Issue on Networks and Economic Agglomerations
Metropolitan Regions in the Knowledge Economy:
Network Analysis as a Strategic Information Tooli
Authors
Arno Brandt
Claudia Hahn
NORD/LB Regional Economics, Hannover
Stefan Krätke
Chair of Economic and Social Geography
European University Viadrina, Frankfurt/Oder
Matthias Kiese (corresponding author)
Department of Geography
Ludwig-Maximilians-Universität München
Luisenstr. 37
D-80333 München

Abstract
Since the early 1990s, regional networks have received a lot of academic and political attention as
vehicles for knowledge-based economic development. However, this powerful rhetoric has been
accompanied by surprisingly little concrete analysis. Economic Geography is only recently wak-
ing up to the potential of network analysis for interorganisational linkages within and between
regions. We discuss network analysis as a strategic information tool for regional knowledge man-
agement and apply it to the metropolitan region of Hannover-Braunschweig-Göttingen-Wolfsburg
in the northern German state of Lower Saxony. Producing network diagrams and parameters of
network size, density, centrality, cohesion and connectivity from a large sample of actors and
linkages, our survey shows striking differences between different fields of competence that high-
light the potential of network analysis as a powerful tool and a necessary basis for decision-
making to propel metropolitan regions into the knowledge economy. We outline both case-
specific and generic implications for the practice of regional knowledge management. However, a
few methodological shortcomings still call for further research to be conducted.
Key words: Knowledge, networks, network analysis, network management, metropolitan regions,
Lower Saxony

3
1 Networks and Metropolitan Regions in the Knowledge Economy
Advanced national and regional economies tend to graduate into knowledge economies
directly based on the production, distribution and application of knowledge (cf. OECD
1996, Neef 1998, Cooke 2002; see Sokol 2004 for a critique). According to Smith
(2002, pp. 7-12), the transition to a knowledge-based economy (KBE) comes in four
dimensions: Firstly knowledge assumes increasing importance as an input vis-à-vis the
conventional factors of production, both quantitatively and qualitatively. Secondly,
knowledge also features more prominently as a product as evident from the above-
average growth of high-tech manufacturing industries and knowledge-intensive busi-
ness services. Thirdly, we observe an increasing codification of knowledge: tacit knowl-
edge (know-how, know-who) is transformed into explicit knowledge (know-what,
know-why) at an ever-faster pace, leading to an unprecedented flood of information (cf.
Lundvall & Johnson 1994). However, Klapp (1982) pointed out the lack of meaning in
information: while the quantity of available information is steadily rising, the share of
meaningful knowledge embodied therein is constantly falling. Furthermore, there are
natural limits to the codification of tacit knowledge, and implicit knowledge hence re-
mains important not only as the only source of codified knowledge, but also as a neces-
sary precondition for its context-specific application as emphasised by Nonaka & Ta-
keuchi (1995).
Fourthly, the advance of information and communication technologies leads to a dra-
matic decline in the costs of acquiring and diffusing knowledge. As another transforma-
tion typical of a KBE we may add the rise of hybrid forms of knowledge that are neither
private nor public in character (cf. Arrow 1994). This hybrid form of knowledge is
freely available only to members of knowledge-based networks, but not to outsiders,
thus resembling a club good as conceived by Buchanan (1965). Cooke & Morgan

4
(1993) were among the first to acknowledge the advent of a new “network paradigm” in
regional economic development. Despite findings such as the impact of a firm’s net-
work position on its performance (e.g. Uzzi 1996, Powell et al. 1999), however, recent
reviews by Cantner & Graf (2008) and ter Wal & Boschma (2008) show that the em-
pirical picture on the innovation-related outcomes of networking is still far from conclu-
sive, both at the firm and regional level.
As we move from industrial to increasingly knowledge-based forms of economic activi-
ties, the traditional division of labour is being transformed into a division of knowledge:
knowledge that is distributed across a large number of individual and collective actors
needs to be combined in novel ways to create commercial value (cf. von Hayek 1937,
1945; Smith 2002). This seminal principle is reflected by interactive models of innova-
tion (Kline & Rosenberg 1986) and the ensuing systemic view of innovation encapsu-
lated in concepts of national, regional or metropolitan innovation systems (cf. Capello
2001, Fischer et al. 2001, Revilla Diez 2002, p. 64-67, and Simmie 2003 for the latter).
Metropolitan regions (MRs) are commonly seen as nodes within the emerging KBE as
they offer a high density and large variety of actors as carriers of knowledge, forming a
vibrant repository. Spatial proximity facilitates face-to-face contacts, accelerates the
transfer of tacit knowledge ("buzz", cf. Storper & Venables 2004), and reduces uncer-
tainty through building trust. However, recent literature acknowledges that spatial prox-
imity by itself is an insufficient precondition for knowledge transfer - there is no simple
“learning by being there” (Gertler 2003). Collective learning first and foremost requires
cognitive and social proximity, which may be correlated with or facilitated by spatial
proximity (cf. Breschi & Lissoni 2003, Boschma 2005). Assuming that space does mat-
ter under certain conditions such as radical technological change and knowledge tacit-
ness, metropolitan regions may be seen as spaces of localised learning (cf. Malmberg &

5
Maskell 2006, Brenner 2007, Lorenzen 2007). While metropolitan regions have always
fed on agglomeration economies, the growing importance of knowledge as both a prod-
uct and a factor of production has introduced localised knowledge spillovers as a new
dynamic quality of agglomeration economies (cf. Breschi & Lissoni 2001).
Over the past 15 years, the network paradigm has become firmly established in acade-
mia, policy and practice. To succeed in an increasingly knowledge-based locational
competition, a region needs internal network structures to fully exploit its internal
knowledge base while at the same time absorbing state-of-the-art knowledge from out-
side the region. However, there is still a striking mismatch between the rhetoric and
sound empirical analysis of regional networks, with a lack of original network analysis
at the meso-scale of the region. Instead, regional networks are usually taken for granted
as soon as there is some kind of industrial and/or technological agglomeration. The re-
search presented in this paper applies network analysis to map knowledge-based link-
ages between research institutions and innovating firms in the Metropolitan Region of
Hannover-Braunschweig-Göttingen-Wolfsburg (MRHBGW) and to systematically
compare network properties between different industries and technologies. Before pre-
senting our findings, we will introduce network analysis as a tool for knowledge-based
regional development, followed by a brief sketch of our case study region and an outline
of our methodology. Our empirical results allow us to derive a number of important
policy recommendations that underscore the value of network analysis as a tool for re-
gional knowledge management. However, some methodological limitations open up
avenues for further research.

6
2 Network Analysis as a Tool for Knowledge-based Regional Development
For a detailed investigation of knowledge exchanges between regional actors, network
analysis offers a promising methodical approach (cf. Knoke & Kuklinski 1982; Burt &
Minor 1983; Jansen 2006). First developed in sociology for the analysis of interpersonal
relationships with a comparatively small numbers of actors (cf. Marsden & Lin 1982), it
is increasingly applied to interorganisational relations in the social and behavioural sci-
ences, economics, marketing, and industrial engineering. In general, social network
analysis reflects a perspective that concentrates on relationships among social entities
and is an important addition to the focus on attributes of the social units analysed by
standard social and behavioural research (cf. Wasserman & Faust 1994; Carrington et
al. 2005). Economic Geography is only recently waking up to the hitherto largely un-
tapped potential of network analysis for interorganisational linkages within and between
regions (cf. ter Wal & Boschma 2008).
For regional science applications, the value of network analysis lies in its potential to
identify specific strengths and weaknesses of regional knowledge network structures.
As far as we know, however, primary network analysis has only been applied to the
interlinking of regional economic actors in very few cases. One of these notable excep-
tions is Krätke’s analysis of the Potsdam/Babelsberg film industry (Krätke 2002), while
Wrobel (2004) basically applied the same methodological framework to the logistics
industry of Bremen. In contrast, network analysis in Economic Geography has been
spearheaded by analyses of co-patenting activities which highlighted the role of labour
mobility for the establishment of networks of innovators, as illustrated by the work of
Fleming & Frenken (2006) for the U.S. or that of Cantner & Graf (2006) covering Jena,
Germany. However, further to the drawbacks of patents as a measure of innovative ac-
tivity per se (cf. Grupp & Schmoch 1999), this research only measures a rather small

7
and formalised subset of the diverse range of interactions that make up innovation net-
works. The shortage of original network analyses based on primary survey data con-
trasts sharply with the high level of attention that regional networks currently receive
from theorists and policy-makers alike. To measure the density and structure of the
linkages between scientific institutions and firms and to systematically compare net-
work properties between different fields of competence (as well as vis-à-vis other re-
gions) therefore remain a particular challenge for the analysis of regional knowledge
networks.
To start with, the methodical approach of a network analysis shall be briefly introduced.
As a first step, relational data on the regional actors’ co-operative linkages need to be
gathered to identify who is collaborating with whom. The identification of network rela-
tions is based on a survey of relevant actors on the co-operation with identifiable busi-
ness partners and institutions on the regional, national and international level. In princi-
ple, there are two possible variants of “data mining” for network relations: Firstly, the
list query asks for the relations of an actor with all other given actors of a network. This
promises a complete capture of the regional actors’ network relations. Since all relevant
network partners must be known in advance, list query is mainly only applicable to
rather small networks. Secondly, the open query method asks respondents for a given
number of their most important partners, e.g. the top three according to their own
judgement, while the total population of network actors remains unknown. It thus al-
lows for the identification of actors which could not be listed in advance, such as the
multitude of private sector firms which might be identified as partners within a regional
network. In most cases of open network query, the network relations within a region
cannot be recorded completely because some relevant actors will not participate in the
survey, while others may not be able or willing to reveal all their partners. Therefore,
8
the analysis only covers the observable part of regional network relations. Open query is
mainly employed for the investigation of large networks with an extensive number of
actors, as in the analysis described in this paper.
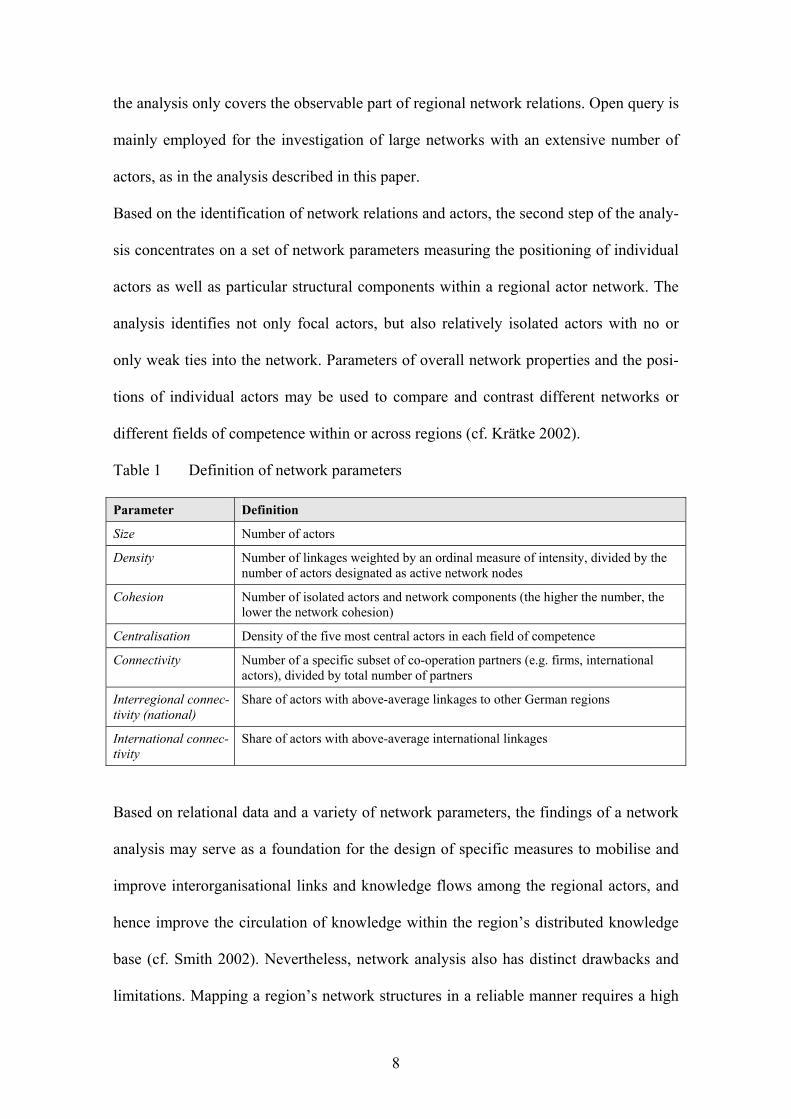
Based on the identification of network relations and actors, the second step of the analy-
sis concentrates on a set of network parameters measuring the positioning of individual
actors as well as particular structural components within a regional actor network. The
analysis identifies not only focal actors, but also relatively isolated actors with no or
only weak ties into the network. Parameters of overall network properties and the posi-
tions of individual actors may be used to compare and contrast different networks or
different fields of competence within or across regions (cf. Krätke 2002).
Table 1 Definition of network parameters Parameter Definition
Size Number of actors
Density Number of linkages weighted by an ordinal measure of intensity, divided by the number of actors designated as active network nodes
Cohesion Number of isolated actors and network components (the higher the number, the lower the network cohesion)
Centralisation Density of the five most central actors in each field of competence
Connectivity Number of a specific subset of co-operation partners (e.g. firms, international actors), divided by total number of partners
Interregional connec-tivity (national)
Share of actors with above-average linkages to other German regions
International connec-tivity
Share of actors with above-average international linkages
Based on relational data and a variety of network parameters, the findings of a network
analysis may serve as a foundation for the design of specific measures to mobilise and
improve interorganisational links and knowledge flows among the regional actors, and
hence improve the circulation of knowledge within the region’s distributed knowledge
base (cf. Smith 2002). Nevertheless, network analysis also has distinct drawbacks and
limitations. Mapping a region’s network structures in a reliable manner requires a high

9
response rate, i.e. a near-complete coverage of the relevant actorsii. Even if this is
achieved, however, a respondent’s knowledge about the transaction and communication
linkages of her/his organisation still introduces a considerable source of error that
should always be remembered when interpreting fractional differences in network pa-
rameters (cf. ter Wal & Boschma 2008, p. 10). Likewise, researchers depend on respon-
dents’ judgements when it comes to the intensity of co-operations. From a practical
point of view, however, the main reason for not carrying out network analyses on a re-
gional scale is not methodological flaws but the high costs - this is why collective learn-
ing is commonly inferred from the spatial concentration of actors alone. However, any
attempt to economise by not carrying out a proper network analysis from the start might
in the end backfire and incur much higher long-term costs through an unspecific and
inefficient network management that addresses the wrong actors.
3 Case Study Region and Research Design
The Metropolitan Region of Hannover-Braunschweig-Göttingen-Wolfsburg
With 3.9 million inhabitants spread throughout 18,600 square kilometres, the Metropoli-
tan Region of Hannover-Braunschweig-Göttingen-Wolfsburg (MRHBGW) is about a
quarter of the size of The Netherlands in terms of population, but 45 % in terms of area.
Comprising 16 counties and three urban districts, the MRHBGW has been officially
designated as one of eleven European Metropolitan Regions (EMR) by the German
Ministerial Conference for Spatial Planning in April 2005. Among the German EMRs,
the MRHBGW occupies a medium rank in terms of size, economic performance and
knowledge potential as assessed in terms of the share of R&D staff in manufacturing,
the share of engineers and scientists in total employment, and start-up activities in high-
tech manufacturing normalised against the national average. Hence, the region has some

10
significant knowledge potential, but does not rival Germany’s leading high-tech regions
in the South (cf. Table 2). Rather, it belongs to the large category of ‘grey mass’ regions
often neglected in regional studies.
Figure 1 The Metropolitan Region of Hannover-Braunschweig-Göttingen-Wolfsburg
With its 16 universities and universities of applied sciences comprising some 433 facul-
ties and institutes in fields widely regarded as economically relevant, the MRHBGW is
sometimes referred to as the “research triangle” within the state of Lower Saxony. This
status is further reinforced by 52 non-university research institutes, including renowned
institutions of the Max Planck and the Fraunhofer Society, as well as some large indus-
trial R&D facilities, most notably that belonging to VW at the company’s Wolfsburg
headquarters. However, previous research such as the European Regional Innovation
Survey (ERIS) covering eleven sub-national European regions in the late 1990s indi-
cates that the weakness of intraregional innovation linkages might obstruct the transla-

11
tion of this excellent research infrastructure into regional development outcomes (cf.
Backhaus 2000, Sternberg 2000). Drawing on the region's well-developed knowledge
base, some cities and counties within the MR teamed up with private partners to devise
and pursue cluster-based economic development strategies (cf. Kiese 2008). In its
search for content, the fledgling MRHBGW commissioned a study of innovation poten-
tial and knowledge-based networking to strengthen the region’s competitive position.
Table 2 Germany’s metropolitan regions, ranked by gross value added Metropolitan region
Popu-lation Area Density GVA GVA/labour
force Unem-
ploymentMfg R&D
staff Eng’ers & scientists
High-tech start-ups
million km2 pop/km2 € bn € share GER=100
2006 2006 2006 2005 2005 2007 2005 2002-05
Munich 5.1 21,500 236 171 62,200 7.2 %d 13.7% 5.8% 143
Frankfurt/ Rhine-Main 5.5 14,800 374 168 60,500 10.2 % 6.6% 3.4% 105
Stuttgart 5.3e 15,400e 343e 164 61,200 n. a. 8.5% 5.2% 90
Hamburg 4.3 19,800 216 124 61,300d 10.6 %c 6.7% 2.8% 81
Berlin-Brandenburg 6.0 30,370 196 118d 45,600d 17.1 % 6.0% 2.7% 83
Rhine-Ruhr 5.2e 4,435e 1,183e 116 51,448 14.2 %c 5.0% 2.7% 87
Nuremberg 3.5c 20,544c 171c 103 57,775 6.3 % 6.1% 3.4% 104
Hannover-Braunschweig-Göttingen-Wolfsburg
3.9e 18,600e 210e 93 50,811 9.1 % 5.7% 3.3% 89
Saxon Trian-gle 3.5b 12,100b 290b 64a 39,000a 19.8 %c 5.4% 3.0% 84
Rhine-Neckar 2.4 5,637 419 62d 56,700d 8.0 %d 6.5% 3.4% 137
Bremen-Oldenburg 2.4 11,600b 205b 55b 50,000a 13.7 %c 5.0% 2.4% 94
a) 2003, b) 2004, c) 2005, d) 2006, e) 2007 Data Initiativkreis Europäische Metropolregionen in Deutschland
(www.deutsche-metropolregionen.org, last accessed April 9th, 2008); NORD/LB calculations based on Univ. of Dortmund and ZEW

12
Research Design
To evaluate the state of knowledge-based networking within the MRHBGW, we applied
network analysis to survey data from all economically relevant university and non-
university research institutions and innovation-oriented firms. Covering research insti-
tutes only, the first phase of our survey was conducted between January and June 2006.
496 such units were identified across the MRHGB, 403 of which responded to the sur-
vey, yielding a respectable response rate of 81 %. In total, these research institutes dis-
closed 363 regional firms as their co-operation partners, which formed the basis of a
regional database of innovating firms that was further informed by a survey asking eco-
nomic development agencies to identify the ten most prominent innovating firms within
their respective sub-regions. After consolidation, the database comprised 770 firms,
which were subsequently reduced to 670 following feedback from firms indicating they
would not classify themselves as innovative. Surveyed between October 2006 and May
2007, 363 usable replies yielded a response rate of 61 %, which is very satisfactory by
corporate survey standards. Such a high response rate is a necessary precondition for
inferring from partial sample results to entire regional network structures in each field
of competence. Joining both phases, our survey identified 1,138 actors including re-
search institutes and innovative firms, as well as chambers, associations, foundations,
economic development agencies and network initiatives that were identified as co-
operation partners during the first stage of our survey.
For our survey, we distinguish three forms of co-operation, which are sorted by inten-
sity in descending order:
• Long-term strategic co-operations designed to improve the actors’ competitive-
ness through intensive exchange of knowledge over several years (e.g. R&D part-
nerships);

13
• Short-term co-operations for specific tasks: temporary but nevertheless intensive
exchange of knowledge to solve specific problems based on trust and embedded
in long-term relationships; and
• Co-operation on HR issues (qualification, vocational training) including the gen-
eration of tacit knowledge through apprenticeships, internships or trainings pro-
grams (learning by doing).
Following the first survey stage, actors were classified into nine fields of competence,
while our findings reported here will focus on seven fields with direct economic appli-
cability. These are life sciences (medical research and technology, pharmaceuticals,
biotechnology), information and communication technology (ICT) including media,
power generation and environmental technologies, agriculture and forestry, planning
and construction, mobility (manufacturing of automobiles, railways, air- and spacecraft)
as well as manufacturing technologies (materials science, process technology, mecha-
tronicsiii, microsystems, measurement and optical technologies). Two predominantly
academic fields of competence have also been surveyed but will not be reported here,
namely basic research in natural sciences (physics, mathematics, chemistry, biology and
earth sciences) as well as economics, law and social sciences.
4 Empirical Findings
4.1 Cross-Sectional Findings
The survey identified a total of 2,183 co-operation linkages within the MRHGB, the
majority of which (58 %) were classified as long-term strategic co-operations. Around
35 % were characterised as short-term co-operations for specific tasks, while only 7 %
focused on HR development. Summarising network parameters, Table 3 displays char-
acteristic differences in the network properties of the seven applied fields of compe-

14
tence. Across the board, networks are fairly homogenous in size, the only exception
being the cross-sectional field of manufacturing technologies, which comprises a much
larger number of actors. Similarly, network density does not vary too much across the
fields. However, network relations tend to be denser than the average in the related
fields of mobility and manufacturing technologies. Relative differences between the
fields increase slightly when it comes to measures of network cohesion and centralisa-
tion. As for network density, cohesion is lowest in life science and ICT, while the inter-
linked network structures of mobility and manufacturing technologies stand out as the
most centralised, reflecting the dominance of VW and some large suppliers within the
regional economy.
Table 3 Network parameters across the seven fields of competence
Fields of competence Network parameter 1 2 3 4 5 6 7
Size (no. of actors) 167 209 180 122 164 192 367
Density 16.8 14.5 18.4 15.7 16.8 26.0 22.5
Cohesion 23 29 20 19 13 12 22
Centralisation 289 282 265 268 225 452 555
Connectivity
- S to B 47.3 % 56.2 % 49.8 % 39.5 % 46.9 % 56.8 % 54.4 %
- B to S 43.0 % 24.2 % 29.1 % 43.3 % 28.3 % 20.6 % 32.2 %
- B to B 9.5 % 15.9 % 15.0 % 5.0 % 12.5 % 19.5 % 11.1 %
Regional connectivity
- S to B 17.5 % 40.7 % 33.6 % 24.5 % 36.0 % 37.7 % 44.3 %
- B to S 38.5 % 24.8 % 24.2 % 30.8 % 23.9 % 32.2 % 24.0 %
- all to B 36.5 % 56.9 % 52.2 % 40.2 % 47.0 % 52.1 % 59.4 %
- all to S 59.3 % 36.8 % 42.2 % 53.3 % 40.9 % 42.2 % 35.1 %
Interregional connectivity (national)
39.8 % 25.2 % 28.9 % 34.3 % 32.4 % 46.0 % 33.7 %
International connectivity 43.9 % 20.3 % 27.8 % 42.9 % 24.3 % 33.3 % 20.0 %
Fields of competence: 1 = Life Sciences; 2 = ICT; 3 = Power generation and environmental technologies; 4 = Agri-culture and forestry; 5 = Planning and construction; 6 = Mobility; 7 = Manufacturing technologies B = Business sector (innovating firms); S = Science sector (research institutes)

15
Looking at connectivity in general, i.e. without reference to spatial scales and across all
fields of competence, it is worth noting significant differences according to type of col-
laboration. With a weighted average of 51.4 %, connectivity is much higher from re-
search institutes to firms than the other way around at 30.8 %. At a mere 12.9 %, con-
nectivity is even much lower within the business sector alone. With some minor varia-
tions, this pattern is stable across most of the seven fields of competence. For instance,
business-to-business connectivity is particularly poor in agriculture and forestry, but
much higher in the field of mobility with its multi-tiered supplier system.
Introducing the spatial dimension, we distinguish the (intra-)regional, the national and
the international scale. On the whole, linkages to innovating firms appear to be more
strongly localised than those with research institutes. Across all scales, the mobility
field is more strongly connected to external partners than the average. Connectivity out-
side the region is also above average in agriculture and forestry, as well as in the field of
life sciences. The latter also displays above-average connectivity to research institutes
within the MRHBGW, but markedly less to regional firms. This reflects a mismatch
between a well-developed research infrastructure on the one hand and a relative dearth
of innovative life sciences firms in the region. International connectivity may be seen as
a proxy for access to state-of-the-art knowledge worldwide, or the external dimension in
cluster terms (“pipelines”, cf. Bathelt et al. 2004). In this respect, the seven fields of
competence do vary substantially. As may be expected from a young and science-based
field, life sciences are most strongly connected internationally, closely followed by the
smallest field of agriculture and forestry, which appears less obvious at first sight but
may be explained by its strong research focus. On the other hand, the regional ICT and
manufacturing technology networks display comparatively few international linkages,
the former hardly networking beyond the regional scale.

16
Based on this overview, we proceed by selecting two fields of competence for a com-
parative evaluation. We contrast the relatively dense, coherent and centralised field of
mobility with that of ICT, which is comparable in size, but much less dense, coherent
and centralised.
4.2 Case Study I: Mobility Industry
Including automotive, railway, space and aircraft manufacturers as well as suppliers,
service providers and research institutes, the field of mobility represents the region’s
traditional industrial strength. Within our sample, it is a medium-sized network with
192 actors, of which almost one third may be assigned to the automotive industry. The
network is dominated by one large and highly connected component comprising eight
actors who are integrated particularly strongly into regional knowledge flows, one of
them being VW as the focal actor. Besides this central complex, there are only a few
isolated smaller components and unconnected individual actors. As a consequence, the
field of mobility shows the highest density of all covered fields, and comes second in
centralisation only to manufacturing technologies. These measures indicate favourable
conditions for intraregional knowledge flows, especially since more than half of the
linkages displayed in Figure 2 represent long-term strategic co-operations as the most
intense form of linkage. However, an excessive degree of centralisation and stability of
‘strong ties’ may just as well be seen as a lack of flexibility and a risk of lock-ins (cf.
Grabher 1993). This may be counteracted by a continuous renewal of the regional stock
of firms through start-ups, and a sufficient measure of openness vis-à-vis sources of
knowledge external to the region.

17
Figure 2 Network diagram of the mobility field of competence in the Metropolitan
Region of Hannover-Braunschweig-Göttingen-Wolfsburg
The mobility industry displays the strongest linkages between research institutes and
firms, and business-to-business collaborations also make up for a comparatively large
share of linkages. However, their focus on large firms not just in the region but nation-
wide means that linkages between research institutes are not as well developed as in the
other fields of competence. Compared to the other fields of competence, the region’s
mobility industry is strongly linked to national partners outside the MRHBGW. This
can mainly be attributed to innovative firms, while the regional research institutions
have fewer interregional or even international linkages than in any other field.
All in all, networking is most intense in the mobility industry, with a particular empha-
sis on science-to-business relations. This field is most strongly integrated into national

18
networks and dominated by the automotive industry, reflecting the dominant position of
VW and its associated R&D activities.
4.3 Case Study II: ICT Industry
With 209 actors, the field of ICT (information and communication technology including
media) is only a fraction larger than the mobility industry’s network, but it displays a
completely different network structure. The ICT industry has more isolated actors than
any other field in our survey, and this fragmented structure explains why this network is
also the least dense. Nevertheless, certain research institutes and innovative firms are
fairly well integrated into regional knowledge flows. While collaboration between re-
gional research institutes appears weak, linkages between science and industry are
above average and more intense than the other way around. As a reasonable explana-
tion, we suggest that these research co-operations tend to focus on applied research.
Similarly, the intensity of business-to-business co-operations also exceeds the average.
Compared to other fields of competence, network linkages are predominantly local in
the ICT industry. Only 35 % of all surveyed actors in this field reported linkages ex-
tending beyond the MRHBGW. This especially applies to firms, while research insti-
tutes reported interregional linkages more frequently. As is the case overall, long-term
strategic partnerships are still the most common form of linkage in the ICT field, but its
share of short-term specific collaborations is higher than in any other field.

19
Figure 3 Network diagram of the ICT field of competence in the Metropolitan Region
of Hannover-Braunschweig-Göttingen-Wolfsburg
In summary, ICT contrasts sharply with the mobility field of competence in its low net-
work density and strong intraregional focus. The fragmented nature of the regional ICT
network with twice as many isolated actors than in any other field may be both the
cause and effect of a rather heterogeneous knowledge base. In any case, it poses a seri-
ous obstacle to intraregional knowledge circulation and a challenge to any attempt at
regional knowledge management.
5 Implications for Policy and Research
Being the subject of the first network analysis of this size using primary survey data on
co-operations between research institutions and innovating firms across all fields of
competence in an entire metropolitan region gives the MRHGB an informational edge

20
for the design and implementation of a network-based regional knowledge management
strategy. As our most basic finding, the variety of network properties across the fields of
competence directly translates into the advice to account for these differences in the
design and implementation of a knowledge-based regional networking strategy. We
suggest that such a strategy focus on the fields of mobility, manufacturing technologies,
life sciences, ICT as well as power generation and environmental technologies.
The analysis has identified significant nodes of competence in the mobility industry and
the related field of manufacturing technologies. These focal actors are embedded in
dense co-operative relationships and may serve as motors and multipliers of a regional
networking strategy. Conversely, such a strategy might also concentrate on integrating
peripheral actors, and on overcoming institutional barriers to intraregional co-operation.
This is most urgently needed in the automotive field, where more than 55 % of all actors
are concentrated in the Braunschweig sub-region, and another 30 % in the neighbouring
Hannover sub-region. Despite this intraregional concentration, more than half of all
identified co-operation linkages are within Braunschweig, but only 17 % between the
two sub-regions. Furthermore, the city of Wolfsburg and the sub-regions of Braun-
schweig and Hannover pursue independent, overlapping and competitive strategies of
cluster promotion (cf. Kiese 2008). Taking the findings from our network analysis seri-
ously, the metropolitan region should use the mobility field as a model case for a flexi-
ble geometry of cluster promotion that is aligned to the actual geography of networks
and overcomes the current underbounding of cluster policy.
In contrast to the region’s strongholds in mobility and manufacturing technology, our
network analysis highlights the potential of the still underdeveloped network structures
in life sciences, ICT as well as power generation and environmental technologies for
further development. However, we would not advocate the pursuit of a regional network

21
strategy for planning and construction owing to its predominantly local outreach. Con-
versely, the network pattern of research into agriculture and forestry is too international
for an intraregional knowledge management strategy to make any sense. Albeit for very
different reasons, attempts to intensify intraregional knowledge circulation through net-
work policies are not bound to produce any significant effects in these two fields.
Further to the necessity to differentiate between fields of competence, our network
analysis identified a number of further challenges that regional network management
needs to address:
• Network management could make an attempt at bridging gaps to increase the cir-
culation of knowledge. This may be done by a systematic promotion of co-
operations, the targeted attraction of mobile firms, and the likewise promotion of
start-ups. However, such a high degree of selectivity looks like being a very de-
manding endeavour in the practice of regional economic development.
• The analysis reveals hitherto isolated actors and network fragments that may be
integrated for the better use of existing knowledge and new opportunities for col-
lective learning. However, there may be reasons for isolation and fragmentation
that may not be removable by any means. More detailed qualitative research is
needed to clearly identify the underlying obstacles. Nevertheless, in the case of
our study region, it seems safe to advocate a closer integration of partial networks
across the different sub-regions.
• Network analysis clearly identifies the central or focal actors within regional net-
works. These actors can assume a strategic role for network management not only
as important carriers of knowledge, but by using their central position to dissemi-
nate knowledge throughout the network. However, strategic actors should not ex-
clusively be sought in the centre of networks, but also at the interfaces between

22
established fields of competence, where previously isolated bodies of knowledge
within the bands of related variety (cf. Frenken et al. 2007) may be combined for
new breakthrough innovations. Another set of actors that warrants special atten-
tion are SMEs that are to a lesser extent integrated into regional networks for re-
source constraints, but may for the same reason gain most from improved link-
ages.
• It goes without saying that a regional networking strategy must strengthen interre-
gional and international linkages where needed to absorb interregional knowledge
and to prevent lock-ins.
• A knowledge-based networks strategy for the MRHBGW needs to be institution-
alised by a relay centre that co-ordinates the existing sub-regional cluster and eco-
nomic development agencies for those fields of competence that display a clear
metropolitan outreach in our network analysis, developing the MR into a new co-
operation space. Such a relay centre would have to balance subsidiarity and in-
traregional competition vis-à-vis interregional competitiveness.
Perhaps the main practical drawback of network analysis is that it is a rather expensive
information tool. Political vision and long-term leadership is thus needed to commit
resources not only to network analysis, but especially to the ensuing strategy develop-
ment and regional network management. In our case study region, it still remains to be
seen if our rich informational foundation will translate into a proper knowledge man-
agement strategy. As a final word of caution, occupation with the co-operative “network
paradigm” must not blind us to overlook competition as an important alternative source
of knowledge spillovers (Porter externalities, cf. Glaeser et al. 1992, pp. 1127 f.).
Our exercise highlights the potential of network analysis as a strategic information tool
for regional knowledge management. This methodology offers more detailed insights

23
into regional network structures than the conventional analysis of regional innovative
potential as applied, for instance, by the European Regional Innovation Survey (ERIS)
in the late 1990s (cf. Sternberg 2000). While ERIS only measured ordinal intensity of
co-operations by scale and type of partner, our network analysis goes one critical step
further in disclosing co-operative linkages and measuring network parameters. How-
ever, network analysis also has its drawbacks and limitations as it hinges on the individ-
ual respondent’s limited information and subjective judgement. It can only approximate
the existence and intensity of actual knowledge flows; more in-depth case-study re-
search is needed to assess the magnitude and impact of the phenomenon, but also to
explain the reasons underlying the different network properties between the various
fields of competenceiv. Furthermore, a well-founded approach to regional knowledge
management would need more insights into obstacles to co-operation. Network defi-
ciencies uncovered in our network analysis do not necessarily mean that their removal
might lead to improved knowledge circulation; they may equally be a consequence of
an excessively heterogeneous knowledge base that might call for a finer delineation of
fields of competence. After all, our empirical exercise can only provide a snapshot of
network relationships, while secondary network analysis of patent data has already pro-
vided some insight into the evolution of narrowly defined networks of innovators. As
Glückler (2007, p. 631) points out, networks are not ends in themselves, but a means of
facilitating innovation and growth. This critical transmission between means and ends
thus remains yet another unresolved challenge that is likely to keep scholars busy for
some time to come.

24
References
ARROW, K.J. (1994), Methodological Individualism and Social Knowledge. American Economic Association Papers and Proceedings 84, pp. 1-9.
BACKHAUS, A. (2000), Öffentliche Forschungseinrichtungen im regionalen Innovati-onssystem: Verflechtungen und Wissenstransfer - Empirische Ergebnisse aus der Re-gion Südostniedersachsen. Hannoversche Geographische Arbeiten 55. Münster, Hamburg: Lit.
BATHELT, H., A. MALMBERG & P. MASKELL (2004), Clusters and Knowledge: Local Buzz, Global Pipelines and the Process of Knowledge Creation. Progress in Human Geography 28, pp. 31-56.
BOSCHMA, R.A. (2005), Proximity and Innovation: A Critical Assessment. Regional Studies 39, pp. 61-74.
BRENNER, T. (2007), Local Knowledge Resources and Knowledge Flows. Industry and Innovation 14, pp. 121-128.
BRESCHI, S. & F. LISSONI (2001), Localised Knowledge Spillovers vs. Innovative Mi-lieux: Knowledge “Tacitness” Reconsidered. Papers in Regional Science 80, pp. 255-273.
BRESCHI, S. & F. LISSONI (2003), Mobility and Social Networks: Localised Knowledge Spillovers Revisited. CESPRI Working Papers 142. Milano: Centro di Ricerca sui Processi di Innovazione e Internazionalizzazione.
BUCHANAN, J.M. (1965), An Economic Theory of Clubs. Economica 32, pp. 1-14.
BURT, R.S. & M.J. MINOR, M.J., eds. (1983), Applied Network Analysis. Beverly Hills: Sage.
CANTNER, U. & H. GRAF (2006), The Network of Innovators in Jena: An Application of Social Network Analysis. Research Policy 35, pp. 463-480.
CANTNER, U. & H. GRAF (2008), Interaction Structures in Local Innovation Systems. Jena Economic Research Papers, 2008-040. Jena: Friedrich Schiller University and Max Planck Institute of Economics.
CAPELLO, R. (2001), Urban Innovation and Collective Learning: Theory and Evidence from Five Metropolitan Cities in Europe. In: Fischer, M.M. & J. Fröhlich, eds., Knowledge, Complexity and Innovation Systems. Advances in Spatial Science. Ber-lin, Heidelberg, New York: Springer, pp. 181-208.
CARRINGTON, P.J., J. SCOTT & S. WASSERMAN, eds. (2005), Models and Methods in Social Network Analysis, Structural Analysis in the Social Sciences 27, Cambridge: Cambridge Univ. Press.
COOKE, P.N. (2002), Knowledge Economies: Clusters, Learning and Co-operative Ad-vantage. Routledge Studies in International Economics and the World Economy 26. London: Routledge.
COOKE, P.N. & K. MORGAN (1993), The Network Paradigm: New Departures in Corpo-rate and Regional Development. Environment and Planning C 11, pp. 543-564.

25
FISCHER, M.M., J. REVILLA DIEZ & F. SNICKARS (2001), Metropolitan Innovation Sys-tems: Theory and Evidence from Three Metropolitan Regions in Europe. Advances in Spatial Science. Berlin, Heidelberg, New York: Springer.
FLEMING, L. & K. FRENKEN (2007), The Evolution of Inventor Networks in the Silicon Valley and Boston Regions. Advances in Complex Systems 10, pp. 53-71.
FRENKEN, K., F.G. VAN OORT & T. VERBURG (2007), Related Variety, Unrelated Variety and Regional Economic Growth. Regional Studies 41, pp. 685-697.
GERTLER, M.S. (2003), Tacit Knowledge and the Economic Geography of Context, or the Undefinable Tacitness of Being (There). Journal of Economic Geography 3, pp. 75-99.
GLAESER, E.L., H.D. KALLAL, J.A. SCHEINKMAN & A. SHLEIFER (1992): Growth in Cit-ies. Journal of Political Economy 100, pp. 1126-1152.
GLÜCKLER, J. (2007), Economic Geography and the Evolution of Networks. Journal of Economic Geography 7, pp. 619-634.
GRABHER, G. (1993): The Weakness of Strong Ties: The Lock-in of Regional Develop-ment in the Ruhr Area. In: Grabher, G., ed., The Embedded Firm: On the Socio-economics of Industrial Networks. London: Routledge, pp. 255-277.
GRUPP, H. & U. SCHMOCH (1999), Patent Statistics as Economic Indicators. Research Policy 28, pp. 377-396.
JANSEN, D. (2006), Einführung in die Netzwerkanalyse: Grundlagen, Methoden, An-wendungen, 3rd ed. Opladen: Leske & Budrich.
KIESE, M. (2008), Cluster Approaches to Local Economic Development: Conceptual Remarks and Case Studies from Lower Saxony, Germany. In: Blien, U. & G. Maier, eds., The Economics of Regional Clusters: Networks, Technology and Policy. New Horizons in Regional Science Series. Cheltenham: Edward Elgar, pp. 269-303.
KLAPP, O.E. (1982), Meaning Lag in the Information Society. Journal of Communica-tion 32, pp. 56-66.
KLINE, S.J. & N. ROSENBERG (1986), An Overview of Innovation, in: Landau, R. & N. Rosenberg, eds., The Positive Sum Strategy: Harnessing Technology for Economic Growth, Washington, DC: National Academy Press, pp. 275-305.
KNOKE, D. & J.H. KUKLINSKI (1982), Network Analysis. SAGE University Papers 28. London: Sage.
KRÄTKE, S. (2002), Network Analysis of Production Clusters: The Potsdam/Babelsberg Film Industry as an Example. European Planning Studies 10, pp. 27-54.
LORENZEN, M. (2007), Social Capital and Localised Learning: Proximity and Place in Technological and Institutional Dynamics. Urban Studies 44, pp. 799-817.
LUNDVALL, B.-A.; JOHNSON, B. (1994), The Learning Economy, Journal of Industry Studies 1, pp. 23-42.
MALMBERG, A. & P. MASKELL (2006), Localized Learning Revisited. Growth and Change 37, pp. 1-18.
MARSDEN, P.V. & N. LIN, eds. (1982), Social Structure and Network Analysis. Beverly Hills, London, New Delhi: Sage Publications.
NEEF, D., ed. (1998), The Knowledge Economy. Boston: Butterworth-Heinemann.

26
NONAKA, I. & H. TAKEUCHI (1995), The Knowledge-creating Company: How Japanese Companies Create the Dynamics of Innovation. New York: Oxford Univ. Press.
OECD (1996), The Knowledge-based Economy. Paris: OECD.
POWELL, W.W., K.W. KOPUT, L. SMITH-DOERR & J. OWEN-SMITH (1999), Network Po-sition and Firm Performance: Organizational Returns to Collaboration in the Bio-technology Industry, in Andrews, S.B. & D. Knoke (eds.), Research in the Sociology of Organizations. Greenwich, CT: JAI Press, pp. 129-159.
REVILLA DIEZ, J. (2002), Metropolitan Innovation Systems: A Comparison between Barcelona, Stockholm, and Vienna. International Regional Science Review 25, pp. 63-85.
SIMMIE, J. (2003), Innovation and Urban Regions as National and International Nodes for the Transfer and Sharing of Knowledge. Regional Studies 37, pp. 607-620.
SMITH, K. (2002), What is the "Knowledge Economy"? Knowledge Intensity and Dis-tributed Knowledge Bases. Institute for New Technologies Discussion Papers 2002-6. Maastricht: INTECH.
SOKOL, M. (2004), The 'Knowledge Economy': A Critical View. In: Cooke, P.N. & A. Piccaluga, eds., Regional Economies as Knowledge Laboratories. Cheltenham, Northampton: Elgar, pp. 216-238.
STERNBERG, R. (2000), Innovation Networks and Regional Development - Evidence from the European Regional Innovation Survey (ERIS): Theoretical Concepts, Methodological Approach, Empirical Basis and Introduction to the Theme Issue. European Planning Studies 8, pp. 389-407.
STORPER, M.C. & A.J. VENABLES (2004), Buzz: Face-to-face Contact and the Urban Economy. Journal of Economic Geography 4, pp. 351-370.
TER WAL, A.L.J. & R. BOSCHMA (2008), Applying Social Network Analysis in Eco-nomic Geography: Framing Some Key Analytic Issues. Annals of Regional Science, advance online publication.
UZZI, B. (1996), The Sources and Consequences of Embeddedness for the Economic Performance of Organizations: The Network Effect. American Sociology Review 61, pp. 674-698.
VON HAYEK, F.A. (1937), Economics and Knowledge. Economica 4, pp. 33-54.
VON HAYEK, F.A. (1945), The Use of Knowledge in Society. American Economic Re-view 35, pp. 519-530.
WASSERMAN, S. & K. FAUST (1994), Social Network Analysis: Methods and Applica-tions, Structural Analysis in the Social Sciences 8, Cambridge: Cambridge Univ. Press.
WROBEL, M. (2004), Die Logistik als Motor regionaler Strukturentwicklung: Sektorale Clusterstrukturen und Netzwerkpotentiale am Beispiel Bremen und Hamburg. Struk-turwandel und Strukturpolitik 8. Frankfurt am Main: Peter Lang.
i Funding from the Metropolitan Region of Hannover-Braunschweig-Göttingen-Wolfsburg is greatfully acknowledged. The authors would like to thank Hans-Martin Zademach and three anonymous reviewers for helpful comments on an earlier draft of this paper. The usual disclaimer applies. ii Some non-response is commonly considered tolerable since each link should ideally be mentioned by both of the partners involved (reciprocation, cf. ter Wal & Boschma 2008, p. 9).

27
iii As a portmanteau of mechanics and electronics, the term mechatronics denotes the fusion of convergent technologies in mechanical, electronic and computer engineering. iv The patent-based network analysis by Fleming & Frenken (2006) may serve as a good example for the bridging of quantitative and qualitative methods in regional network analysis.