tilburg university assessing the performance of business ... · assessing the performance of...
TRANSCRIPT

Tilburg University
Assessing the Performance of Business Unit Managers
Bouwens, Jan; van Lent, Laurence
Publication date:2006
Link to publication
General rightsCopyright and moral rights for the publications made accessible in the public portal are retained by the authors and/or other copyright ownersand it is a condition of accessing publications that users recognise and abide by the legal requirements associated with these rights.
- Users may download and print one copy of any publication from the public portal for the purpose of private study or research - You may not further distribute the material or use it for any profit-making activity or commercial gain - You may freely distribute the URL identifying the publication in the public portal
Take down policyIf you believe that this document breaches copyright, please contact us providing details, and we will remove access to the work immediatelyand investigate your claim.
Download date: 20. Aug. 2018

No. 2006–92
ASSESSING THE PERFORMANCE OF BUSINESS UNIT MANAGERS
By Jan Bouwens, Laurence van Lent
September 2006
ISSN 0924-7815
Assessing the performance of business unit managers*
Jan Bouwens
†, Laurence van Lent
§
September 2006
Abstract
Using a sample of 140 managers, we investigate the use of various performance metrics in
determining the periodic assessment, bonus decisions, and career paths of business unit
managers. We show that the weight on accounting return measures is associated with the
authority of these managers, and we document that both disaggregated measures (expenses
and revenues), and non-financial measures play a greater role as interdependencies between
business units increase. The results suggest separate and distinct roles for different types of
performance measures. Accounting return measures are used to create the proper incentives
for managers with greater authority, while disaggregated and non-financial measures are
employed in response to interdependencies.
JEL classification: M41
Keywords: performance measures, business units, managerial performance
* We appreciate comments from Margaret Abernethy, Eddy Cardinaels, Henri Dekker, Peter Easton,
Chris Ittner, Anne Lillis, Ken Merchant, Valeri Nikolaev, Mark Penno, Frank Selto, Steve Salterio and
Ann Vanstraelen, and also from workshop participants at the Vrije Universiteit Amsterdam, University
of Antwerpen, University of Melbourne, Tilburg University, the 2004 Global Management Accounting
Research Symposium, the 2005 Management Accounting Section mid-year meeting in Scottsdale,
Arizona, and the 2005 European Accounting Association annual congress in Göteborg. † Both authors are at Tilburg University.
§ Corresponding author. Department of Accountancy, PO Box 90153, 50000 LE Tilburg, the
Netherlands. Phone: +31 13 466 8288; Fax: +31 13 466 8001; e-mail: [email protected].

1
1. Introduction
To encourage rapid and relevant decision making, firms move towards organizational
designs in which authority over operations and strategy is assigned to business unit managers
(Aghion and Tirole 1997; Roberts 2004). However, empowering business unit managers is
also likely to undermine cooperation among managers. We conjecture that different
performance measures play different and distinct roles in evaluating the performance of
business unit managers according to the organizational design of the firm. More specifically,
we hypothesize that the use of accounting return measures provides incentives to managers to
use their authority appropriately and that the use of disaggregated accounting measures, such
as costs and revenues, as well as various non-financial measures, mitigates the individual
manager’s tendency to attach too little value to the impact of his or her decisions on other
parts of the firm (Baiman and Baldenius 2006). To test these predictions, we use survey data
on 140 business unit managers and assess the use of a range of measures for evaluating the
performance of business unit managers.
Accounting return measures are more aggregated than profit measures, as they relate
profit to resources employed (e.g., return on investment, residual income, return on capital).
Profits, in turn, are more aggregated than expenses and revenues. Profits are thus an
intermediate category between accounting return measures and fully disaggregated measures
such as expenses and revenues. Following previous theoretical research, we assume that
accounting return measures are the best choice for assessing the performance of a business
unit manager and are more likely to be used when more authority is vested in the business
unit manager. To the extent that return and profit measures substitute for each other, however,
we will see shifts from returns to profits as the level of authority declines, as well as from
more disaggregated measures to profits as the level of authority increases. We suggest that the
primary function of disaggregated and non-financial measures is to reduce the noise in
aggregated financial measures (accounting returns, profits) or to provide a signal about a
manager’s actions. We therefore posit that these measures are used when aggregated

2
accounting measures are noisy or when they are not sufficiently sensitive to the cooperative
efforts of managers.
We document that accounting return and profit measures are associated with the level
of authority of the business unit manager (relative to that of his or her superior) with regard to
key decisions. In contrast, the use of disaggregated and non-financial measures, is associated
with interdependencies among business units within the firm, i.e., the extent to which the
decisions of one business unit manager affect other managers in the firm and vice versa.
This study builds on and extends early work by Scapens and Sale (1985) who seek
but fail to establish an association between delegated authority and the use of accounting
return metrics. Since this early work, relatively little progress has been made in identifying
the circumstances under which firms use various types of performance measures,1 perhaps
because the classifications that researchers use are often too general (e.g., financial vs. non-
financial or market vs. accounting measures). Thus, by analyzing four different types of
performance measures — accounting return, profit, disaggregated, and non-financial
measures — we contribute to the literature by distinguishing the differential effects of
organizational design on the use of each metric type.
Ittner and Larcker (2001) warn that the use of performance measures is likely to vary
with the decision context in which they are applied. To accommodate this possibility, we
provide exploratory evidence on the use of different types of performance measures in three
decision contexts: (1) the periodic assessment of business unit managers, (2) the
determination of managers’ bonuses, and (3) the determination of managers’ long-term career
paths. The literature is somewhat critical about the use of survey data in accounting research
(Young 1996; Ittner and Larcker 2001; Zimmerman 2001). In performing our tests, we heed
the warnings in the literature about potential measurement error, “leading” or “soft”
questions, inadequate sampling, and inappropriate econometric techniques.
1 Several authors (Gordon and Narayanan 1984; Chenhall and Morris 1986; Gul and Chia 1994; Scott
and Tiessen 1999) investigate the association between organizational design and “broad control
system” issues (Ittner and Larcker 2001).

3
Our finding that accounting return (profit) measures are used more (less) often when
business unit managers enjoy more decision-making authority is important because some
authors stress that the use of performance measures is independent of a manager’s authority
(Solomons 1965), whereas others maintain that profit and return measures are only
meaningful if a manager has significant decision-making power (Vancil 1978). These views
are often expressed when discussing the use of responsibility centers (emphasis added in the
following excerpts):
“ ... A common misconception is that the term profit center (and in some cases
investment center) is a synonym for a decentralized subunit ... [M]anagers in a
division organized as a profit center may have little leeway in making decisions …”
(Horngren, Foster and Datar 1994, pg.863)
“Responsibility accounting is a term used to describe the use of accounting data in
managerial evaluation. … Authority and responsibility are distinct. For example, the
manager of a fast food facility is usually evaluated as a profit center. Yet the menu
and prices, not to mention cooking procedures and ingredients, are determined by
central management. The manager has little authority but considerable
responsibility.” (Demski 1994, pg. 538)
and, in contrast,
“ ... one of the major purposes behind the use of a profit center [is] to encourage
local decision making and initiative. … A profit center is a unit for which the
manager has the authority to make decisions on sources of supply and choice of
markets ...” (Kaplan and Atkinson 1989, pg. 590)
Our evidence takes issue with both sides of the debate. First, we show that the use of
performance measures (and thus the designation of responsibility centers) is strongly
correlated with the authority of business unit managers. At the same time, we believe that
requiring investment or profit centers to be decentralized units by definition obfuscates the
substantial observed variety in the authority of managers who are evaluated on accounting
returns and/or profits. It also prevents researchers from investigating the mapping between
performance measure and authority.
We find no evidence that the use of accounting return measures is affected by the
presence of interdependencies, nor is the use of disaggregated and non-financial measures
associated with the level of authority. Instead, firms use aggregated measures relatively more
than disaggregated measures when more authority is delegated to business unit managers, and

4
disaggregated and non-financial measures gain more weight as interdependencies increase. In
short, performance measures have very distinct roles: whereas the use of accounting return
measures is correlated with the authority of business unit managers, disaggregated and non-
financial measures are employed to provide incentives for managers to cooperate in the
presence of interdependencies between business units.
2. Hypothesis development
2.1. Authority of business unit managers
Performance evaluation measures should fulfill two purposes: (1) to give managers
incentives to use their authority optimally, and (2) to “disaggregate” the firm’s total economic
performance into a summary estimate of each manager’s contribution to firm value
(Zimmerman 1997; Raith 2005). Accounting return measures, designed to capture the
economic value generated from specified resources (Scapens 1979; Anthony and
Govindarajan 2004), should accomplish both purposes. However, the normative literature
warns against using accounting return measures when the authority of managers does not
extend to decisions about the acquisition of new resources or the disposal of existing
resources:2
“Both the measure of performance and the standard against which it is compared
must reflect the degree of control that the division manager can exert on profit
and investment.” (Shillinglaw 1959, page 46)
Notwithstanding this warning, recent theoretical work concludes that accounting
return measures provide not only information about how well resources are used, but also
incentives that encourage optimal resource use (Reichelstein 1997; Rogerson 1997; Dutta and
Reichelstein 1999; Zimmerman 2001). Even if managers have little authority over investment
decisions, theory suggests that accounting return measures are informative (Holmstrom 1979;
Indjejikian 1999) about the way in which managers wield their authority. Note that while the
2 The normative literature traditionally invokes the “controllability principle” to argue that managers
should only be charged for the resources over which they have control. The controllability principle has
been somewhat discredited in more recent theoretical (Indjejikian 1999) and empirical (Merchant
1989) work.
5
managers in our sample do not typically have full investment authority,3 they substantially
affect the use of current resources. Accounting return measures should therefore provide
valuable information about their performance.
Extant empirical research supports textbook prescriptions calling for performance
measures that capture the decisions and actions of managers (Chenhall and Morris 1986).
Whereas earlier empirical work does not specify the type of metric that fulfils this purpose,
we propose that accounting return measures summarize the performance of managers whose
authority impacts the value of the resources they use (Scapens and Sale 1985, pg. 240), and
we therefore expect a positive association between the weight on accounting return measures
and the authority of business unit managers.
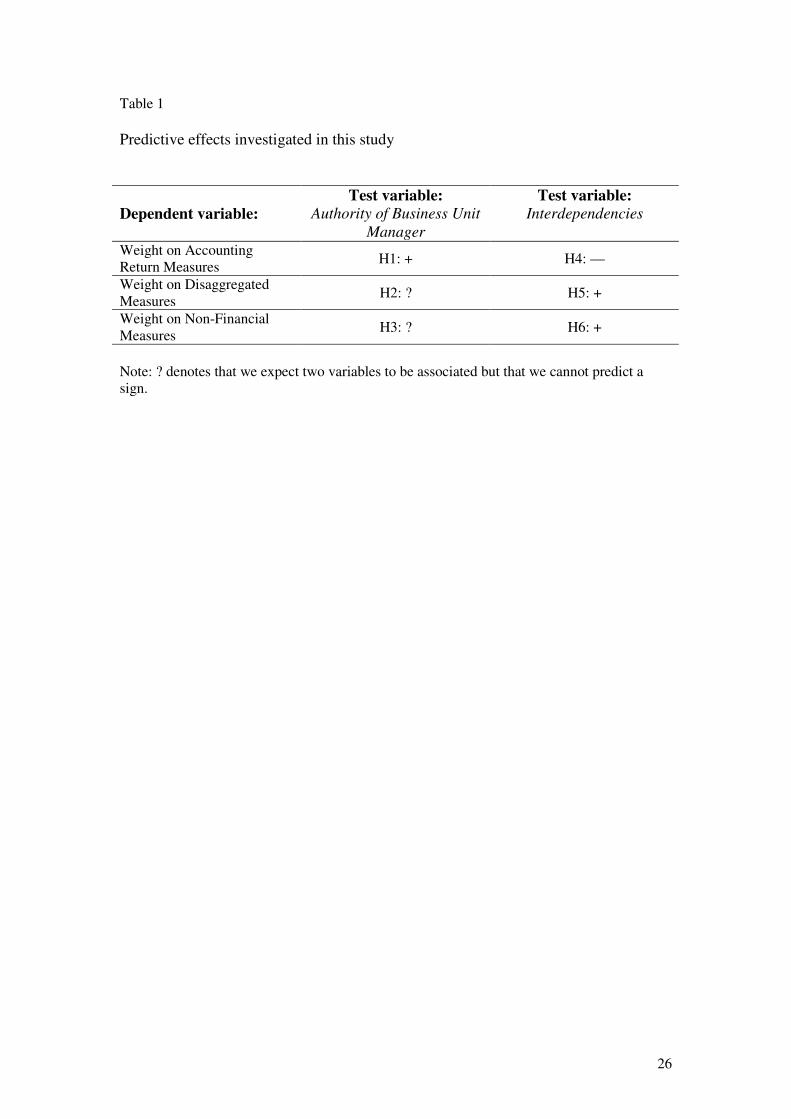
H1: The weight on accounting return measures in the evaluation of business unit
managers is positively associated with their decision-making authority.
We also want to know whether an increased weight on accounting returns implies a
reduction in the weight on disaggregated and non-financial measures. Agency models suggest
that the relative importance of a performance measure depends on the “signal” provided by
the measure about an employee’s action and the “noise” with which the actions are captured
(Lambert and Larcker 1987; Banker and Datar 1989; Indjejikian 1999). Several authors have
noted the lack of causal relation between aggregated financial measures and the actions of
managers with low authority, and advocate the use of disaggregated and non-financial
measures as being more directly under these managers’ control (Wruck and Jensen 1994;
Ittner and Larcker 1998b; Ittner and Larcker 2003). Disaggregated and non-financial
measures are less subject to exogenous events and therefore contain less noise. In contrast,
accounting return measures are expected to be too coarse to provide desirable signals and lack
precision when managers have little authority (Horngren 2004). This “signal-to-noise”
argument suggests a negative association between authority and the use of disaggregated and
non-financial measures.
3 Managers are said to have full investment authority if they can acquire or dispose fixed assets without
prior approval from their superior.

6
On the other hand, more recent models that consider the implications of allowing
agents to perform multiple, heterogeneous tasks would seem to support a positive association
between authority and the use of disaggregated and non-financial measures. The chief
concern in these “multi-tasking” models is to ensure that managers choose the combination of
actions that will support the firm’s objective (Indjejikian 1999). Gersbach (1998)
demonstrates that specific, task-related measures are preferred to one broad, aggregated
measure when managers face multiple tasks, although Feltham and Xie (1994) suggest that
the use of multiple measures will induce managers to allocate effort across tasks
suboptimally. An often-voiced concern is that managers will allocate too much attention to
tasks that have an immediate impact on performance at the cost of tasks whose benefits will
be realized in the future (Hemmer 1996; Hayes and Schaefer 2000; Smith 2002). Future
performance is not directly observable (or contractible), although earlier empirical work
shows that non-financial measures are often associated with future performance (Ittner and
Larcker 1998a; Banker, Potter and Srinivasan 2000; Ittner, Larcker and Randall 2003; Bryant,
Jones and Widener 2004). In addition, Fairfield, Sweeney and Yohn (1996) show that
disaggregating financial measures improves their predictive abilities with regard to future
profitability. Thus, the use of non-financial and disaggregated measures can discourage
managers from improving short-run performance to the detriment of future profitability.
To summarize, while under both single and multi-task agency models we expect a
relation between authority and the use of disaggregated and non-financial measures, it is
unclear which direction the relation will take.4 We therefore hypothesize:
H2: The weight on disaggregated measures in the evaluation of business unit managers
is associated with their authority.
4 Other theory on the use of non-financial and disaggregated measures includes the observation that
non-financial measures are often very concrete “behavioral” measures (Ittner and Larcker 2002), i.e.,
measures that recommend or prohibit certain actions by managers (e.g., absenteeism, safety inspection
ratings). As profit center managers receive more authority, it becomes increasingly important to ensure
that their actions do not cross boundaries to the detriment of the firm; non-financial measures are one
way to clearly communicate to managers what behavior is acceptable and what is not.
7
H3: The weight on non-financial measures in the evaluation of business unit managers
is associated with their authority.
We do not state formal expectations about the weight on profit measures as profits
are the intermediate category between accounting return measures and fully disaggregated
measures such as expenses and revenues. When accounting return measures receive more
weight, this will likely result in a decrease in the weight on profit measures (because
weight is “shifted” from profits toward accounting returns). On the other hand, if
disaggregated measures are used less as authority increases, it is likely that the weight on
profit measures increases (because weight is shifted from disaggregated measures to
profits). Which of these alternatives dominates is an empirical matter.
2.2 Interdependencies
Performance metrics used at lower levels in the hierarchy become increasingly noisy
as interdependencies among units within the firm increase (Bushman, Indjejikian and Smith
1995; Keating 1997; Abernethy, Bouwens and van Lent 2004) because the indivisibility of
certain resources makes the attribution of performance to individual managers or units within
the firm increasingly difficult. For instance, while all business units of a firm benefit from
brand name effects, allocation of the brand name’s value to any individual unit is an arbitrary
exercise. The problem of attributing performance to individual business unit managers
becomes less severe as one moves from accounting return measures to profits to more
disaggregated measures. We therefore expect the following relation between the use of
accounting return measures and interdependencies:
H4: The weight on accounting return measures in the evaluation of business unit
managers is negatively associated with the degree of interdependency among business
units.
How changes in the weight on accounting return measures affect the use of profits
and disaggregated measures depends on the type of interdependencies. If the appropriate
allocation of (indivisible) resources to a business unit is the main difficulty, then profits are a
better summary measure of performance. However, interdependencies can also arise due to
8
joint production functions or joint demand functions (Milgrom and Roberts 1992), in which
case, further disaggregation of profits into expenses and revenues may be needed. With joint
production functions, for example, the unique attribution of expenses becomes tenuous and
we are thus likely to see revenues receive more weight in the performance evaluation than
either profits or accounting return measures. Similarly, if multiple business units have to
cooperate to serve the same customer, the attribution of revenues to these business units
becomes difficult and we expect that expense measures are likely to receive more weight than
either accounting return or profit measures. In short, aggregated profits weights expenses and
revenues equally by definition, although their “signal-to-noise” ratios may be different
(Holmstrom 1979; Banker and Datar 1989; Feltham and Xie 1994); disaggregation allows for
non-equal weighting to reflect differences in the signal and/or noise of the various profit
components.
We cannot unambiguously infer what will happen to the weight on profit measures,
which may either increase (owing to a shift from accounting return measures to profit
measures) or decrease (due to a shift from profit measures to disaggregated measures).
However, we can derive signed predictions for the weight on disaggregated measures:
H5: The weight on disaggregated measures in the evaluation of a business unit
manager is positively associated with the level of interdependencies among the
business units.
Banker et al. (1995) argue that “detailed performance evaluations should include
quality, material use (yield), labor use (yield), and service measures that the [business unit
manager] can control” (pg. 498). Similarly, Hirsch (1994, pg. 609) notes that non-financial
measures can be used in an integrated way to show “how managers are achieving the goals
and objectives of the company rather than how they might be optimizing some local measures
irrespective of global company outcomes.” Baiman and Baldenius (2006) show that non-
financial measures can signal whether managers act in a cooperative fashion or can put
bounds on non-cooperative behavior. We therefore hypothesize the following relation:

9
H6: The weight on non-financial measures in the evaluation of a business unit manager
is positively associated with the level of interdependencies in the unit.
Table 1 summarizes our predictions.
3. Full model, sample selection, variable measurement, and estimation
3.1. Full model
We argue that the type of performance measure used in business units is conditional
on the authority of the business unit manager and the degree of interdependencies among
business units. Prior research, however, shows that the authority of managers is itself a
function of interdependencies5 (Jensen and Meckling 1992; Christie, Joye and Watts 2003;
Abernethy et al. 2004; Roberts 2004)6 and information asymmetry (Wruck and Jensen 1994;
Baiman, Larcker and Rajan 1995; Nagar 2002; Christie et al. 2003; Abernethy et al. 2004;
Roberts 2004). Fig. 1 summarizes this discussion.7
3.2. Sample selection
Our unit of observation is the business unit manager.8 We select our sample randomly
from a database that contains addresses of firms domiciled in the Netherlands. Using firms’
annual reports and, in some cases, phone calls with representatives of the company, we
establish whether the firm is of sufficient size to have more than one business unit. Student
teams then requested that qualifying firms participate in our project and administered the
questionnaire on-site. This procedure produced a high response rate: 89% of our 140 sample
5 We rely on earlier work to argue that interdependencies may be taken as a given when considering
individual business units as they typically arise from joint costs and production functions or dependent
demand functions (Milgrom and Roberts 1992; Abernethy et al. 2004). 6 Transfer pricing is another mechanism used to deal with interdependencies among units in the firm
(see, e.g., Zimmerman 2003). If transfer prices are set perfectly, they should be able to reduce the
problems associated with interdependencies and admit authority to be delegated to business unit
managers. It is unlikely, however, that transfer prices can be set perfectly. Top management will often
lack the knowledge necessary to design a pricing system that fully reflects all the ways in which
decisions of business unit managers impact on each other. 7 While we do not hypothesize a relation between information asymmetry and the weight on return
measures (or any other performance measures), we do not restrict the relation between these variables
to zero since extant research suggests that such a relation exists (Keating 1997; Demers, Shackell and
Widener 2004). On theoretical grounds, we expect that any impact of information asymmetry on the
weight on performance measures will be indirect via its impact on the authority of business unit
managers. This expectation is consistent with the empirical findings in Abernethy et al. (2004). 8 Firms were asked to identify the lowest level organizational unit that still had full production and
sales tasks.

10
firms agreed to have a business unit manager meet with one of the student teams.9 In ten
firms, students spoke with more than one business unit manager; thus, the final sample of
business unit managers consists of 140 observations from 125 firms.10
Untabulated analysis of
the final sample reveals no obvious bias in terms of size or respondent characteristics.11
Finally, author follow-up calls with respondents verified that the student teams followed the
study’s protocol.
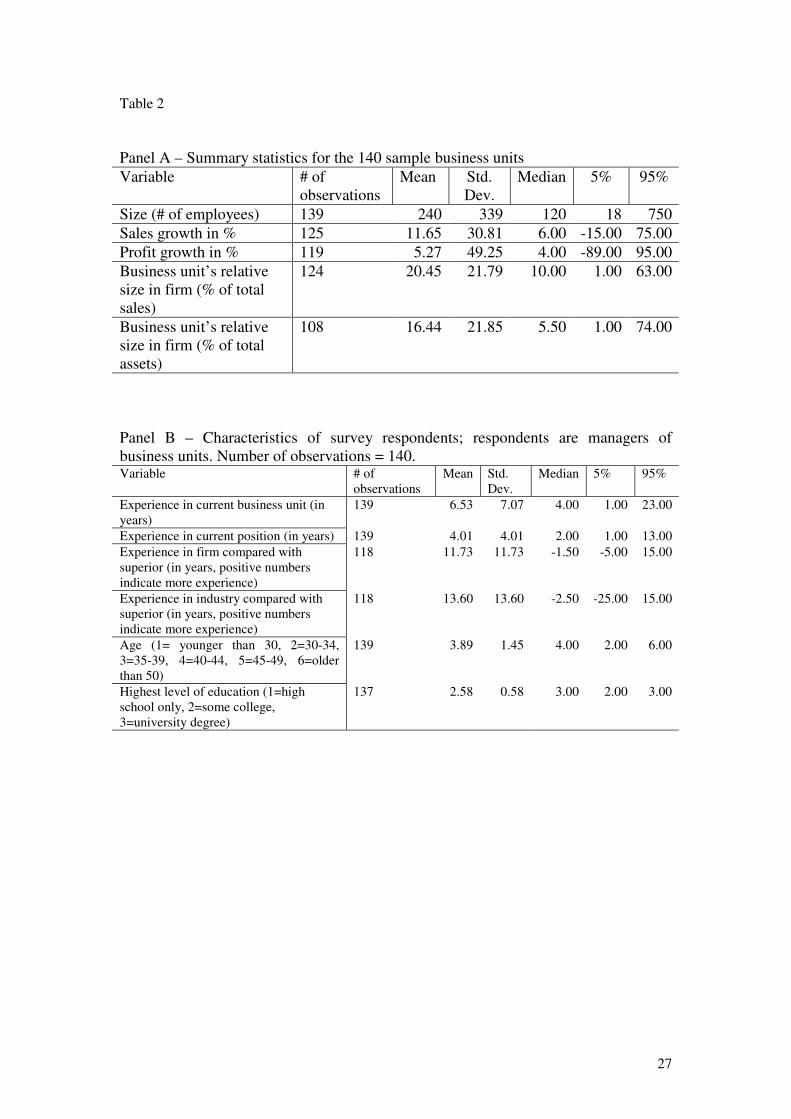
Table 2, Panels A and B, report summary statistics about the sample business units.
The average business unit has 240 employees (median = 120) and represents 20.45% of its
firm’s total sales (16.44% of total assets). In terms of industry affiliation, 60 business units
are in the service industry, 20 are engaged in financial services, with the remaining 60 in
manufacturing. Compared to the population of Dutch firms with more than 100 employees (to
proxy for our requirement that sample firms have more than one business unit), our sample
includes more business units from the manufacturing industry (population = 34%) and
financial services (population = 9%) and fewer from the service industry (population = 57%).
Table 2, Panel C, contains descriptive statistics about the sample respondents.
Business unit managers are between the ages of 35 and 39 on average, although the median is
between 40 and 44. Most respondents have a university degree. The longevity of managers in
their current organizational unit is 6.53 years on average (median = 4 years), and managers
9 This response rate is high compared to what is usually reported in relation to mail or telephone
surveys. We believe this reflects the effort we put in contacting each firm personally and explaining to
one of the top executives what we hoped to achieve. In addition, the fact that we mention that student
teams would visit the firm on-site also is likely to have provided a clear signal of the researchers’
commitment to the project. 10
We also run all analyses on a sample (of 125 observations) in which we include just one observation
per firm. This does not change our results. 11
There is also a question of how it is that managers know the (weights on) performance measures their
superior uses to evaluate their work. If managers are unaware of these matters, then our dependent
variables may suffer from measurement error. Student teams are instructed to ask managers to consult
with company manuals or their superior if they have doubts about the specifics of their performance
evaluations. In questionnaire pre-tests, we find that performance measures and their importance are a
matter of routine discussion at periodic performance appraisals between the business unit managers and
their boss and our respondents are generally knowledgeable about the (importance of) performance
criteria. We further explore the potential impact of measurement error by conducting our analysis on a
subsample of 104 managers who report that their bonus is determined using an explicit formula that
specifies the measures and their weights used to compute the bonus awarded to managers. Managers
with formula-based bonuses should be more certain about the weight on performance measures than
those without formula-based bonuses. We replicate all findings in the subsample of managers with
formula-based bonuses and thus we conclude that our respondents seem to be well aware of which
measures are used to evaluate their performance
11
have about four years’ experience in their current position (median = 2 years). The median
respondent is slightly less experienced than his or her immediate superior both in the firm
(1.50 years less experience) and in the industry (2.50 years less experience).
3.2. Variable measurement
The Appendix contains an overview of all survey items and scales reported in this
paper. Table 3 contains descriptive statistics based on the original scales of all survey items
that we use to measure the latent variables. We use factor analysis to pre-test the
measurement properties of our variables (Hair, Anderson, Tatham and Black 1998; Chenhall
2005),12
and the results suggest that our constructs display good reliability and construct
validity.
3.2.1. Main variables
Weight and relative weight on performance measure: We ask respondents to report the
weight their superior assigns to a range of possible performance measures in the context of
three decisions: (1) the periodic assessment of the respondent’s performance, (2) the
determination of the respondent’s bonus, and (3) the determination of the respondent’s future
career. There are two main reasons to study more than one use of performance measures.
First, the determinants of a performance measure’s weight may depend on its use (Ittner and
Larcker 2001). We provide evidence on the degree to which the authority of business unit
managers and business unit interdependencies are important determinants of each of these
different uses of performance measures. Second, while the three decisions we investigate are
distinct, they are still somewhat related in the sense that we describe the weight on
performance measures in the context of managerial evaluation and remuneration. We may
therefore consider each of the three uses of performance metrics as checks on the validity of
the others.
12
Specifically, we conduct factor analyses on each multi-item measure separately and on all latent
variables with multiple items jointly and show that the constructs are unidimensional and exhibit a
“clean” factor structure (i.e., each item loads on the factor it is theoretically associated with and not
significantly on any other factor. The joint factor analysis also allows us to assess the potential for
common rater bias (Harman 1967). Our results strongly suggest that the common rater bias is not a
problem in this dataset.

12
Within this multidecision context, we use six different categories of performance
measures: (1) stock-price-related metrics, (2) non-financial metrics, (3) profit metrics, (4)
disaggregated measures such as revenue and cost metrics, (5) accounting return metrics, and
(6) other metrics. We use the weight a respondent places on category (5) in our empirical tests
of hypotheses 1 and 4 about the relation between the use of accounting returns and authority
or interdependencies; the weight on category (2) in our empirical tests of hypotheses 3 and 6
about the relation between the use of non-financial metrics and authority or
interdependencies, and the weight on category (4) in the tests of hypotheses 2 and 5 about the
relation between the use of disaggregated measures and authority or interdependencies.
Following the admonition of Ittner and Larcker (2001), we take care to elicit “harder”
responses in our survey questions. In particular, we specify the decision context for particular
performance measures and we ask for the actual weight placed on a range of performance
measures (rather than determining the use of each by Likert scales). We also do not force
respondents to rank measures that may in fact be (almost) equally important.
Authority of business unit managers: We ask respondents to evaluate differences in authority
between themselves and their immediate superiors in four major areas: strategy, investments,
marketing, and human resources. This approach is consistent with that of earlier studies (e.g.,
Gordon and Narayanan 1984; Abernethy et al. 2004). Our estimation procedure (see below)
delivers measurement model measures of internal consistency, measurement error, and
discriminant validity (Fornell and Larcker 1981). These findings,13
in addition to Cronbach’s
alpha (0.73), support the use of the four-item measure as a unidimensional construct.
Interdependencies: Following Keating (1997), we ask about the extent to which other
business units impact the performance of the respondent’s unit, and we ask about the extent to
which the respondent’s business unit impacts the performance of other units. We also ask
about the extent to which the business unit could operate as an independent, stand-alone firm.
While some prior studies follow Keating (1997) and use each survey item as a separate
13
Untabulated, but available from the authors upon request.

13
variable, the results of the pre-test factor analysis, measurement model, and Cronbach’s alpha
(0.63) suggest that the three items be combined in a composite construct.
In addition, we compute the correlation between our construct and the percentage of a
business unit’s total production that is delivered to other units within the firm. When more
goods or services are provided to other units in the firm, interdependencies will be higher. We
find that the correlation between the two variables is positive and significant (correlation =
0.50, p-value = 0.01), which suggests that our construct exhibits convergent validity.
3.2.2. Control variables
We control for the potentially confounding effects of information asymmetry, size,
and industry affiliation on the weight of a performance measure and the authority of business
unit managers.
Information asymmetry: We rely on Dunk’s (1993) six-item scale to measure the extent of
information asymmetry between a respondent and his or her superior. The results of the
measurement model and Cronbach’s alpha (0.83) are consistent with using this scale as a
unidimensional construct. We provide further evidence on the convergent validity of our
information asymmetry measure by correlating the measure with characteristics of
respondents that reflect their accumulated experience and knowledge. As a manager’s
experience grows, there is an increasing likelihood that his or her knowledge base exceeds
that of the immediate superior. In untabulated results, we find significant, positive
correlations between each of these characteristics and information asymmetry, which we
construe as evidence of convergent validity.
Size: Size is the natural logarithm of the number of employees that work in the business unit
of the respondent.14
Industry affiliation: We ask respondents to report the main industry in which their business
unit operates (manufacturing, financial services, and other services), and we denote each by
an indicator variable.
14
We also conduct robustness checks, which include firm size (in addition to business unit size) as a
control variable. Including firm size does not change our results substantively. Details are available
from the authors upon request.
14
3.3. Model estimation and econometric issues
In our model, the weight of a performance measure is frequently equal to zero and it
cannot take values below zero. This implies that the data are potentially censored and are
unlikely to have a normal distribution. Thus, we estimate our causal model using a latent
variable technique that has been shown to provide robust results in small-sample settings in
which the usual distributional assumptions are unlikely to hold (Fornell and Cha 1994).
Specifically, we apply partial least squares (PLS); PLS also allows the researcher to deal with
measurement error and to provide evidence on construct validity (Ittner and Larcker 2001).15
Path models with latent variables in PLS modeling consist of three parts: (1) the
structural model, which depicts the relations among the latent variables as suggested by
theory, (2) the measurement model, which defines the relations between the manifest
variables (indicators) and the latent variables, and (3) the weight relations, which rescale the
loadings of the manifest variables to make the variance of the latent variables equal to unity.
Estimation in PLS proceeds in an iterative fashion whereby a set of model parameters is
divided into subsets and estimated by ordinary least square (OLS), with the values of
parameters in other subsets taken as given (Fornell and Cha 1994). We evaluate the statistical
significance of the resulting parameter estimates of the structural model using a bootstrapping
procedure (1,000 samples with replacement; all samples have the same size as the original
sample).16
4. Results
15
We choose PLS instead of alternative latent variable estimation methods, such as LISREL or other
covariance-based structural equation models, for the following reasons. First, PLS has superior
properties in samples of less than 250 observations (Hu and Bentler 1995). Second, covariance-based
models assume that observations are independent and the observed variables are normally distributed,
which is unrealistic given the measurement scales used in the survey. Finally, covariance-based models
are full information estimation techniques, whereas PLS is a limited information estimation technique.
While full information estimation is more efficient, it is also vulnerable to model misspecification.
Unless theory is sufficiently strong about which variables matter and the relation among these
variables, the more conservative approach is to use a limited information technique (Chin and Newsted
1999). 16
The bootstrapping procedure should provide more reasonable confidence intervals using our
censored and potentially non-normal data. To provide some insights into the robustness of our
analyses, we also estimated a model for only non-zero values of the weight on a performance measure,
and a model using an indicator variable (1 = performance measure is used) as the dependent variable.
The results of these two sensitivity tests are similar to those reported and our conclusions remained
unchanged.

15
Table 4, Panels A and B, report descriptive statistics on the use of the six different
performance measure categories. In Table 5, we report the Pearson correlations among our
variables. Table 6, Panels A through D, presents the results of each of the four path models.
4.1. Summary statistics
Table 4, Panel A, shows that a substantial number of the business unit managers in
our sample are evaluated on accounting return measures. The accounting return measure that
is used most (68% of respondents) is return on investment (or return on net assets or return on
capital employed); the remainder use either residual income or economic value added (18%),
cash flow return-on-investment (11%), or shareholder value added (3%). Although the results
vary across the three different decisions (periodic assessment, bonus determination, and
career), in all cases at least 40% of the respondents report that their superior uses accounting
return measures.
Profit receives the most weight in each of the three decisions, accounting for 39% of
the measures in periodic assessments, 47% in bonus determinations, and 32% in career-
related decisions (Panel B). The average weight on accounting return measures is 14.3% for
periodic assessments, 12.9% for bonus determinations, and 9.9% for career-related decisions.
There is considerable skewness in the distribution, however, as the median respondent reports
weights of 7.0%, 0.0%, and 0.0%, respectively, for accounting returns. Notice that for most
performance measures the weight differs significantly across the three decision contexts (see
the note to Table 4, Panel A): for bonus determination, profit measures are used most,
whereas for career-related decisions, “other measures” receive relatively more weight. Upon
closer analysis of the responses to this question, we find that many respondents report that
subjective measures about “personal growth” and “leadership skills” are important for
decisions regarding their career.
Non-financial measures are used with some frequency. Their average weight ranges
between 18% and 25%. Significantly fewer companies use non-financial measures for bonus
and career decisions than for periodic performance evaluation.

16
Table 5 reports the Pearson correlations among all variables in this study. We find
that accounting return measures are strongly positively associated with the authority of
business unit managers and significantly negatively related to interdependencies among
business units. In contrast, disaggregated measures are negatively correlated with the
authority of business unit managers and strongly positively with interdependencies. Non-
financial measures appear only to be (positively) associated with interdependencies. Profit
measures are negatively associated with both authority and interdependencies. We also find
that information asymmetry and interdependencies are significantly associated with the
authority of business unit managers. These findings provide preliminary support for our
hypotheses and for our model.
4.2. Full model results17
4.2.1. Results for the weight on performance measures
Hypothesis H1 conjectures that the weight on accounting return measures is
positively associated with the authority of business unit managers. We find evidence
consistent with this hypothesis in the context of all three decisions we consider. Table 6,
Panel A, presents the details of the PLS estimation of our model. The coefficient values of the
path connecting authority with the weight on accounting return measures are 0.33 (periodic
performance assessment), 0.34 (bonus determination), and 0.25 (career-related decisions),
with t-statistics equal to 3.16, 3.12, and 1.99, respectively.
Hypotheses H2 and H3 summarize our expectations about what happens with the
weights on disaggregated and non-financial measures as the authority of business unit
17
We have 12 sets of estimates for the paths between (1) information asymmetry and (2)
interdependencies and the authority of business unit managers. We do not expect the estimates of these
paths to change very much across the different models, since the PLS algorithm considers these paths
in relative isolation from the remainder of the model (linking interdependencies, information
asymmetry and authority of business unit managers to the (relative) weight on performance measures).
Indeed, our results turn out to be very consistent across the 12 models. We summarize the estimation
results in Table 7. Notice that we control for size and industry affiliation when estimating each model.
For brevity, we suppress details in the description of the results. We find that interdependencies are
negatively associated with the authority of business unit managers in all models, albeit in two cases the
path is not significant (mean coefficient = -0.22, mean t-statistic = -2.37). Information asymmetry is
consistently positively associated with the authority of business unit managers (mean coefficient =
0.44, mean t-statistic = 3.69). This path is significant in all causal models. On average, the explanatory
power for the authority of business unit managers is 31.0% (as measured by the Multiple R2).
17
managers changes. Recall that we do not have a signed prediction for these measures, as the
single and multiple task agency models point in opposite directions. As Panel C of Table 6
indicates, the association between disaggregated measures and the authority of business unit
managers is never significant (coefficients are –0.04, 0.18, and 0.04; t-statistics are -0.29,
1.26, and 0.20, respectively). Similarly, our results on non-financial measures, reported in
Panel D of Table 6, are inconclusive. In all three decision contexts we consider, the
association between the authority of business unit managers and the weight on non-financial
measures is insignificant (path coefficients are 0.06, 0.00, and 0.03; t-statistics are 0.48, 0.02,
and 1.12, respectively).
While we have no predictions as to what happens with the weight on profit measures
when authority changes, we find strong evidence in Panel B of Table 6 that profits are used
less when authority increases (coefficients are –0.35, –0.37, and –0.24, t-statistics are -2.29,
-2.06, and -1.42). Together with the findings on hypotheses H1 and H2, this suggests that
weight is moved away from profits towards accounting return measures as authority
increases.
Hypothesis H4 predicts that accounting return measures are used less when
interdependencies increase. Table 6, Panel A, shows that our evidence is inconsistent with
this prediction. In fact, we find marginal support only for the association between accounting
return measures and bonus decisions. Coefficient values are 0.08, –0.14, and –0.13 (t-
statistics are 0.85, -1.64, and -1.25).
As hypothesis H5 predicts, the evidence in Panel C of Table 6 suggests that
disaggregated measures receive more weight as interdependencies between business units
grow. While the coefficient value is marginally significant in the context of periodic
assessment, interdependencies are strongly positively associated with the weight on
disaggregated measures in the two other decision contexts (coefficient values are 0.17, 0.48,
and 0.29; t-statistics are 1.58, 4.23, and 2.41).
In hypothesis H6 we argue that non-financial measures receive more weight when
interdependencies are more important. Our evidence in Panel D of Table 6 strongly supports

18
this hypothesis for periodic assessment and bonus decisions, but not for career-related
decisions (coefficients 0.46, 0.42, and 0.13; t-statistics 4.84, 3.67, and 1.17).
We argue that it is not clear how the weight on profit measures changes as
interdependencies increase. The empirical evidence (reported in Table 6, Panel B) suggests
that the weight on profit measures is negatively associated with interdependencies
(coefficients are –0.38, –0.36, and –0.10; t-statistics are -4.24, -2.89, and -0.77). Combined
with our earlier findings, this suggests that weight is moved away from profit measures
toward disaggregated measures in response to increasing interdependencies.
4.2.2. Additional analyses
The role of investment authority. Our results indicate that the overall authority of managers
is positively associated with the use of accounting return measures. One question that remains
unanswered, however, is whether the authority of managers over investments (which is part of
our composite measure of business unit manager authority) drives this result. Many writers
argue strongly in favor of the “controllability principle” and warn that accounting return
measures should be used only if managers can exercise direct control over the resources in
their unit. We investigate this matter by separating out from the authority of business unit
manager variable the item that asks respondents about their authority over investments and
then running all models with both the modified authority variable and the one-item construct
that measures the respondent’s investment authority.18
The findings of this (untabulated)
analysis support the idea that managers who possess authority over investment decisions are
evaluated more (less) on accounting return (profit) measures. We also find some evidence that
non-financial measures (in bonus and career decisions) and disaggregated measures (in
periodic assessment and bonus decisions) receive more weight in response to increasing
investment authority. These results are consistent with the conjecture that investment rights
18
Note that the results from this analysis should be interpreted with due care. Earlier factor analyses
and results from the measurement model indicate strongly that our original construct, which measures
the authority of a business unit manager, is unidimensional, has strong internal consistency and
reliability, and good discriminant validity. These properties are compromised by separating out the
investment authority item. In addition, basing inferences on a one-item construct is hazardous. Finally,
the correlation between the investment authority item and the modified authority construct is high
(average correlation = 0.45), which may cause multi-collinearity problems in the reported regressions.

19
drive the use of accounting return measures and that non-financial and disaggregated
measures are used to give managers incentives to use investment rights for the long-term
benefit of the firm (as predicted by the multiple task agency models). The findings with
regard to the association between the weight of performance measures and interdependencies
remain unchanged in these regressions.
Given the importance of investment authority, we conducted follow-up interviews to
establish a more complete picture of the investment rights of the business unit managers in
our sample. We conducted semi-structured interviews with a subsample of 32 respondents
who have moderate-to-complete investment authority (score of 4 or higher on the scale
reproduced in Panel B of the Appendix).19
In almost all cases, managers need to submit an
investment plan to their superior for approval; only three respondents indicated that they can
make investment decisions without even informing their manager. Once a plan has been
approved, the authority of the respondents varies considerably with the type of investment in
question. Respondents are most restricted (have low authority) with regard to decisions that
involve capacity extensions. Indeed, one manager, who heads a business unit in the fast-
moving consumer goods industry, observes:
“It is remarkable how much freedom I have to employ or deploy people in
[marketing and product] development activities, while I have only limited discretion
in acquiring assets that go on the balance sheet and require depreciation.”
We find that investments in new buildings require prior approval from the
respondent’s manager in 72% of the sample. In contrast, replacement of production capacity
or R&D expenditures must be approved in advance in only 25% and 16% of the sample,
respectively. Spending limits as defined in the pre-approved investment plan vary as expected
with the scores on the investment authority scale. The average spending limit for respondents
with moderate (score = 4) investment authority is €240,000. The average limit increases to
€660,000, €3,290,000, and €3,420,000 with increasing levels of investment authority (score =
5, 6, and 7), respectively. Taking these observations together, we conclude that even
19
76 respondents fulfill this criterion. Of these, 25 respondents asked to remain anonymous in our
original survey; 14 respondents had left their firm and we could not trace their current whereabouts;
five refused to be included in the follow-up interviews.

20
managers who indicate that they have very substantial investment authority are usually
subject to oversight with regard to investments in fixed assets. In that sense, it would seem
that the managers in our sample exert considerable influence over the investment decision (in
the planning and implementation stages), but their discretion is clearly bounded. It appears
that the use of accounting return measures is more consistent with creating incentives for
these managers to use the assets at their disposal appropriately than with evaluating their
decisions on the disposal/acquisition of fixed assets. Notice that the average weight on
accounting return measures is low compared with the weight on profit measures, and that in
many cases (50% of the sample in the periodic assessment context) both accounting return
measures and profit measures are used to evaluate managers.
“Higher-level” performance measures. Some authors point to the use of “higher-level”
performance measures such as a firm’s stock price or firm-level profit to address problems
associated with interdependencies between business units (Bushman et al. 1995; Keating
1997; Abernethy et al. 2004). The performance of a single business unit manager is then
evaluated with measures that reflect the joint performance of two or more managers. The
focus in this paper is not on the use of higher-level measures, but rather on the type of
measure. To ensure that our results are not driven by the possibility that some types of
measure are often defined at a higher level than others, we ask respondents to indicate how
much weight is given to measures defined at their own level compared to higher-level
measures and re-run our analyses (see Panel E in the Appendix). The results (untabulated)
remain very much the same with a control variable for the use of higher-level measures: the
signs on all the hypothesized relations do not change and their significance is generally only
marginally affected.
5. Discussion, limitations, and conclusions
Performance measures are expected to provide managers incentives to work towards
the accomplishment of firm objectives and to promote cooperation within the firm. As such,
theory suggests that the authority of business unit managers and interdependencies among
business units are important determinants of the weights placed on different performance

21
measures. Our main proposition is that accounting return measures, while always informative
about the actions of business unit managers, gain particular importance when these managers
have more decision-making authority. We take the degree of authority that business unit
managers enjoy as a proxy for the impact of managerial actions on the value of resources. We
find evidence that accounting return measures receive more weight in periodic assessment,
bonus determination, and career decisions related to business unit managers who have more
authority. Additional analysis suggests that the use of accounting return measures is more
pronounced when managers have more influence on investment decisions, even though the de
facto investment authority of the manager does not extend to increasing the investment base
and/or is subject to strict spending limits and pre-approval requirements.
We also show that accounting return measures increase in importance vis-à-vis profit
measures as authority increases. We conclude that as authority increases, weight shifts
towards measures that not only summarize the actions taken by the business unit manager but
also provide incentives for the appropriate use of resources.
In contrast, theory is equivocal with respect to the expected association between the
level of authority and disaggregated or non-financial measures of performance. On the one
hand, such measures may be informative about the decisions of business units managers with
little authority (in which case accounting return measures are likely to be too coarse), but
these metrics may also be used when managers have extensive decision-making
responsibilities to focus attention on the impact of current decisions on future performance or
to help mitigate the problems associated with “gaming” the performance measurement
system. Perhaps due to these conflicting possibilities, we do not find a relation between
authority and either disaggregated or non-financial measures. Alternatively, our approach
may lack statistical power to discriminate between these two competing predictions.
In the presence of interdependencies, such as joint demand or production functions,
ensuring cooperation among business unit managers is not a straightforward task. We find
that firms do not reduce their use of accounting return measures in an effort to encourage
cooperation but instead add weight to disaggregated measures such as expenses and revenues,
22
and non-financial measures, which are less susceptible to the effects of these
interdependencies. Both categories appear to play a key role in “managing”
interdependencies. This is a potentially important finding because extant work that models the
choice of non-financial measures omits this variable from analysis (e.g., Ittner, Larcker and
Rajan 1997; Ittner et al. 2003; Said, HassabElnaby and Wier 2003). Our theory suggests that
non-financial measures are used in response to increasing interdependencies because they are
able to reduce the noise in accounting measures. Our data do not admit further exploration of
this issue, however, as our “non-financial measure” category is not very descriptive, and in
fact our findings for non-financial measures should be interpreted with care in view of the
relative coarseness of the classification we use. Classifying the ability of different non-
financial measures to cope with interdependencies may be a useful avenue for future work.
While this study is susceptible to the criticisms frequently raised in association with
survey-based research, we take extensive precautions to mitigate the concerns relating to: (1)
reliability and validity of the constructs, (2) narrowness of the survey and lack of information
about organizational practices, (3) specificity of the survey questions, and (4) reliance on
perceptions instead of hard data. However, several issues remain. Because only one
respondent in each business unit answers our questions, the data may be subject to a common-
rater bias (although tests results are not consistent with the presence of such a bias).
Moreover, despite our use of PLS estimation, we cannot rule out the possibility that
measurement error still may affect our results. In addition, while the relations we test are
informed by theory and prior empirical work, we have a cross-sectional data set and therefore
cannot make causal interpretations, nor can we exclude the possibility that we omit a variable
that is causally linked to our model. Finally, our unit of analysis is that of the business unit
manager. Thus, we cannot generalize these findings to managers of other types of units
(division managers, department managers).
Notwithstanding the above limitations, this paper takes up issues about which
accountants have surprisingly strong opinions given the scarcity of empirical evidence.
23
References
Abernethy, M. A., J. Bouwens and L. van Lent (2004). "Determinants of control system
design in divisionalized firms." The Accounting Review 79(3): 545-570.
Aghion, P. and J. Tirole (1997). "Formal and real authority in organizations." Journal of
Political Economy 105(1): 1-29.
Anthony, R. N. and V. Govindarajan (2004). Management control systems. New York,
McGraw-Hill/Irwin.
Atkinson, A. A., R. D. Banker, R. S. Kaplan and S. M. Young (1995). Management
Accounting. Upper Saddle River, NJ, Prentice Hall.
Baiman, S. and T. Baldenius (2006). Non-financial performance measures as coordination
devices. Working paper, University of Pennsylvania and Columbia University.
Baiman, S., D. F. Larcker and M. V. Rajan (1995). "Organizational design for business units."
Journal of Accounting Research 33(2): 205-230.
Banker, R. and S. Datar (1989). "Sensitivity, precision and the linear aggregation of signals
for performance evaluation." Journal of Accounting Research 27: 21-39.
Banker, R., G. Potter and D. Srinivasan (2000). "An empirical investigation of an incentive
plan that includes nonfinancial performance measures." The Accounting Review 75:
65-92.
Bryant, L., D. A. Jones and S. K. Widener (2004). "Managing value creation within the firm:
an examination of multiple performance measures." Journal of Management
Accounting Research 16: 107-131.
Bushman, R. M., R. J. Indjejikian and A. Smith (1995). "Aggregate performance measures in
business unit manager compensation: The role of intrafirm interdependencies."
Journal of Accounting Research 33(Supplement): 101-127.
Chenhall, R. and D. Morris (1986). "The impact of structure, environment and within-firm
dependencies on the perceived usefulness of management accounting systems." The
Accounting Review 61: 16-35.
Chenhall, R. H. (2005). "Integrative strategic performance measurement systems, strategic
alignment of manufacturing, learning and strategic outcomes: an exploratory study."
Accounting, Organizations and Society 30(5): 395-422.
Chin, W. W. and P. R. Newsted (1999). Structural equation modeling analysis with small
samples using partial least squares. Statistical strategies for small sample research. R.
H. Hoyle. Thousand Oaks, Sage: 307-341.
Christie, A. A. (1990). "Aggregation of test statistics. An evaluation of the evidence on
contracting and size hypotheses." Journal of Accounting and Economics 12(1-3): 15-
36.
Christie, A. A., M. Joye and R. Watts (2003). "Decentralization of the firm: theory and
evidence." Journal of Corporate Finance 9(1): 3-36.
Demers, E. A., M. Shackell and S. K. Widener (2004). Incentives, performance measurement,
and delegation: an empirical analysis of interdependencies in the organizational
architecture of new economy firms. Working paper, University of Rochester.
Demski, J. (1994). Managerial uses of accounting information. Boston, Kluwer Academic
Publishers.
Dunk, A. (1993). "The effects of budget emphasis and information asymmetry on the relation
between budgetary participation and slack." The Accounting Review 68(2): 400-410.
Dutta, S. and S. Reichelstein (1999). "Asset valuation and performance measurement in a
dynamic agency setting." Review of Accounting Studies 4(3): 253-281.
Fairfield, P. M., R. J. Sweeney and T. Lombardi Yohn (1996). "Accounting classification and
the predictive content of earnings." The Accounting Review 71(3): 337-355.
Feltham, G. and J. Xie (1994). "Performance measure congruity and diversity in multi-task
principal agent relations." The Accounting Review 69(3): 429-453.
Fornell, C. and L. Cha (1994). Partial Least Squares. Advanced methods of marketing
research. R. P. Bagozzi. Cambridge, Blackwell.

24
Fornell, C. and D. F. Larcker (1981). "Evaluating structural equation models with
unobservable variables and measurement error." Journal of Marketing Research 18:
39-50.
Gersbach, H. (1998). "On the equivalence of general and specific control in organizations."
Management Science 44(5): 730-737.
Gordon, L. and V. Narayanan (1984). "Management accounting systems, perceived
environmental uncertainty and organizational structure: an empirical investigation."
Accounting, Organizations and Society 9(1): 33-47.
Gul, F. and Y. Chia (1994). "The effect of management accounting systems, perceived
environmental uncertainty and decentralization on managerial performance: a test of
three-way interaction." Accounting, Organizations and Society 19: 413-426.
Hair, J. F., R. E. Anderson, R. L. Tatham and W. C. Black (1998). Multivariate data analysis.
Upper Saddle River, NJ, Prentice Hall.
Harman, H. H. (1967). Modern factor analysis. Chicago, IL, University of Chicago Press.
Hayes, R. M. and S. Schaefer (2000). "Implicit contracts and the explanatory power of top
executive compensation for future performance." RAND Journal of Economics 31(2):
273-293.
Hemmer, T. (1996). "On the design and choice of "modern" management accounting
measures." Journal of Management Accounting Research 8: 87-116.
Hirsch, M. L. (1994). Advanced management accounting. Cincinnati, Ohio, South-Western
Publishing.
Holmstrom, B. (1979). "Moral hazard and observability." Bell Journal of Economics 10: 74-
91.
Horngren, C. T. (2004). "Management accounting: some comments." Journal of Management
Accounting Research 16: 207-211.
Horngren, C. T., G. Foster and S. M. Datar (1994). Cost accounting: a managerial emphasis.
Englewood Cliffs, NJ, Prentice Hall.
Hu, L.-T. and P. M. Bentler (1995). Evaluating model fit. Structural equation modeling:
concepts, issues, and applications. R. H. Hoyle. Newbury Park, CA, Sage: 76-99.
Indjejikian, R. J. (1999). "Performance evaluation and compensation research: an agency
perspective." Accounting Horizons 13(2): 147-157.
Ittner, C. D. and D. F. Larcker (1998a). "Are nonfinancial measures leading indicator of
financial performance? An analysis of customer satisfaction." Journal of Accounting
Research 36(Supplement): 1-35.
Ittner, C. D. and D. F. Larcker (1998b). "Perspectives on field research in management
accounting." Journal of Management Accounting Research: 205-238.
Ittner, C. D. and D. F. Larcker (2001). "Assessing empirical research in managerial
accounting: a value based management perspective." Journal of Accounting and
Economics 32(1): 349-410.
Ittner, C. D. and D. F. Larcker (2002). "Determinants of performance measure choices in
worker incentive plans." Journal of Labor Economics 20(2): S58-S90.
Ittner, C. D. and D. F. Larcker (2003). "Coming up short on nonfinancial performance
measurement." Harvard Business Review(November): 88-95.
Ittner, C. D., D. F. Larcker and M. V. Rajan (1997). The choice of performance measures in
annual bonus contracts. The Accounting Review. 72: 231-256.
Ittner, C. D., D. F. Larcker and T. Randall (2003). "Performance implications of strategic
performance measurement in financial services firms." Accounting, Organizations
and Society 28(7): 715-742.
Jensen, M. C. and W. E. Meckling (1992). Specific and general knowledge and organizational
structure. Contract Economics. L. Werin and H. Wijkander. Cambridge, Blackwell.
Kaplan, R. S. and A. A. Atkinson (1989). Advanced management accounting. Englewood
Cliffs, NJ, Prentice Hall.
Keating, A. S. (1997). "Determinants of divisional performance evaluation practices." Journal
of Accounting and Economics 24: 243-274.
25
Lambert, R. A. and D. F. Larcker (1987). "An analysis of the use of accounting and market
measures of performance in executive compensation contracts." Journal of
Accounting Research 25(Supplement): 85-125.
Merchant, K. (1989). Rewarding results: motivating profit center managers. Boston, Harvard
Business School Press.
Milgrom, P. and J. Roberts (1992). Economics, organization and management. Englewood
Cliffs, NJ, Prentice Hall.
Nagar, V. (2002). "Delegation and incentive compensation." The Accounting Review 77(2):
379-395.
Raith, M. (2005). Specific knowledge and performance measurement. Working paper,
University of Rochester.
Reichelstein, S. (1997). "Investment decisions and managerial performance evaluation."
Review of Accounting Studies 2: 157-180.
Roberts, J. (2004). The modern firm: Organizational design for performance and growth.
Oxford, Oxford University Press.
Rogerson, W. (1997). "Intertemporal cost allocation and managerial investment incentives: a
theory explaining the use of economic value added as a performance measure."
Journal of Political Economy 105: 770-795.
Said, A. A., H. R. HassabElnaby and B. Wier (2003). "An empirical investigation of the
performance consequences of nonfinancial measures." Journal of Management
Accounting Research 15: 193-223.
Scapens, R. W. (1979). "Profit measurement in divisionalized companies." Journal of
Business Finance and Accounting 6(3): 281-305.
Scapens, R. W. and J. T. Sale (1985). "An international study of accounting practices in
divisionalized companies and their associations with organizational variables." The
Accounting Review 60(2): 231-247.
Scott, T. and P. Tiessen (1999). "Performance measurement and managerial teams."
Accounting, Organizations and Society 24: 263-285.
Shillinglaw, G. (1959). "Divisionalization, decentralization and return on investment." NAA
Bulletin 41(4): 19-33.
Smith, M. J. (2002). "Gaming nonfinancial performance measures." Journal of Management
Accounting Research 14: 119-133.
Solomons, D. (1965). Divisional performance: measurement and control. Homewood, Illinois,
Irwin.
Vancil, R. F. (1978). Decentralization: Managerial ambiguity by design. Homewood, IL, Dow
Jones-Irwin.
Wruck, K. H. and M. C. Jensen (1994). "Science, specific knowledge, and total quality
management." Journal of Accounting and Economics 18: 247-287.
Young, S. (1996). Survey research in management accounting: a critical assessment. Research
methods in accounting: issues and debates. A. Richardson. Vancouver, BC, CGA
Canada Research Foundation: 55-68.
Zimmerman, J. L. (1997). "EVA and divisional performance measurement: capturing
synergies and other issues." Journal of Applied Corporate Finance 10: 98-109.
Zimmerman, J. L. (2001). "Conjectures regarding empirical managerial accounting research."
Journal of Accounting and Economics 32: 411-427.
Zimmerman, J. L. (2003). Accounting for decision making and control. Homewood, Irwin.
26
Table 1
Predictive effects investigated in this study
Dependent variable:
Test variable:
Authority of Business Unit
Manager
Test variable:
Interdependencies
Weight on Accounting
Return Measures H1: + H4: —
Weight on Disaggregated
Measures H2: ? H5: +
Weight on Non-Financial
Measures H3: ? H6: +
Note: ? denotes that we expect two variables to be associated but that we cannot predict a
sign.
27
Table 2
Panel A – Summary statistics for the 140 sample business units
Variable # of
observations
Mean Std.
Dev.
Median 5% 95%
Size (# of employees) 139 240 339 120 18 750
Sales growth in % 125 11.65 30.81 6.00 -15.00 75.00
Profit growth in % 119 5.27 49.25 4.00 -89.00 95.00
Business unit’s relative
size in firm (% of total
sales)
124 20.45 21.79 10.00 1.00 63.00
Business unit’s relative
size in firm (% of total
assets)
108 16.44 21.85 5.50 1.00 74.00
Panel B – Characteristics of survey respondents; respondents are managers of
business units. Number of observations = 140. Variable # of
observations
Mean Std.
Dev.
Median 5% 95%
Experience in current business unit (in
years)
139 6.53 7.07 4.00 1.00 23.00
Experience in current position (in years) 139 4.01 4.01 2.00 1.00 13.00
Experience in firm compared with
superior (in years, positive numbers
indicate more experience)
118 11.73 11.73 -1.50 -5.00 15.00
Experience in industry compared with
superior (in years, positive numbers
indicate more experience)
118 13.60 13.60 -2.50 -25.00 15.00
Age (1= younger than 30, 2=30-34,
3=35-39, 4=40-44, 5=45-49, 6=older
than 50)
139 3.89 1.45 4.00 2.00 6.00
Highest level of education (1=high
school only, 2=some college,
3=university degree)
137 2.58 0.58 3.00 2.00 3.00

28
Table 3 Summary statistics for Authority of business unit managers, Interdependencies, and
Information asymmetry. The panel reports the mean, standard deviation, minimum, median
and maximum values for each item in these three latent variables. The theoretical range for all
items is 1–7. Refer to the Appendix for a complete description of all survey items and their
associated scales.
Survey items
Mean Std.
Dev.
Min. Median Max.
Authority of business unit manager:
Please compare your authority in making decisions
with the authority of your superior. If you or your
subordinates in your unit make decisions without
prior consent of your superior, you are considered
to have all authority.
Strategic decisions 3.49 1.60 1.00 4.00 7.00
Investment decisions 3.75 1.67 1.00 4.00 7.00
Marketing decisions 5.00 1.85 1.00 6.00 7.00
Human resource decisions 5.26 1.49 1.00 6.00 7.00
Interdependencies:
To what extent do your unit’s actions impact on
work carried out in other units of your firm?
4.33 1.70 1.00 4.00 7.00
To what extent do actions of other units of the firm
impact on work carried out in your own unit?
4.40 1.68 1.00 5.00 7.00
To what extent could your unit operate as an
independent firm on the work (outside the current
firm)? [Reverse coded]
2.39 2.07 1.00 1.00 7.00
Information asymmetry: Please compare the amount of information you have
relative to your superior.
How much better informed are you about the type
of activities undertaken in your unit?
5.94 1.24 2.00 6.00 7.00
How much more familiar are you with the type of
input output relations inherent in the internal
operations of your unit?
5.94 1.17 2.00 6.00 7.00
How much more certain are you about the
performance potential of your unit?
5.46 1.24 3.00 6.00 7.00
How much more familiar are you with the technical
aspects of the work in your unit?
5.72 1.41 1.00 6.00 7.00
How much better are you able to assess the
potential impact on your activities of factors
internal to your unit?
4.66 1.28 2.00 4.00 7.00
How much better do you understand what can be
achieved in your unit?
5.34 1.16 3.00 5.00 7.00

29
Table 4
Panel A – Summary statistics about the use of and the weight on different
performance measures by industry. Based on 140 observations. Respondents are
business unit managers.
Decision context Periodic assessment
(n=139)
Bonus determination
(n=122)
Career-related
(n=135)
Performance measure: Use Mean
(std.)
Median Use Mean
(std.)
Median Use Mean
(std.)
Median
Stock price-related 25 2.70
(7.20)
0.00 22 0.32
(1.89)
0.00
20 1.76
(5.59)
0.00
Non-financial
measures
117 20.05
(17.46)
15.00 87 18.69
(22.39)
10.00 116 25.56
(20.62)
22.50
Profit measures 127 39.37
(24.63)
33.00 119 47.14
(33.69)
50.00 116 32.49
(23.59)
30.00
Disaggregated
measures such as costs
and revenues
115 21.82
(15.62)
20.00 74 14.21
(18.07)
0.00 88 17.06
(17.61)
15.00
Accounting return
measures
81 14.25
(20.65)
7.00 54 12.94
(25.69)
0.00 54 9.85
(17.01)
0.00
Other measures 14 1.87
(6.68)
0.00 41 6.30
(15.24)
0.00 46 13.24
(25.50)
0.00
Note: The Column ‘Use’ reports the number of business units that use a performance
measure in the specified decision context. Mean and median statistics are reported for
the weight on a performance measure in each decision context.
The mean weight on most performance measures differs across decision contexts. The
results of a paired sample t-test shows that:
1. In a comparison of the mean weight on each measure in the periodic
assessment and bonus determination, only non-financial measures and
accounting return measures are not significantly different.
2. In a comparison of the mean weight on each measure in the periodic
assessment and career-related decisions, only stock price-related measures are
not significantly different.
3. In a comparison of the mean weight on each measure in the bonus
determination and career-related decisions, only accounting return measures
are not significantly different.
Panel B – Detailed information about the type of accounting return measure used in
the evaluation of business unit managers. Entries are in percentages of the 81 business
unit managers who report the use of an accounting return measure for the periodic
assessment of their performance.
Type of accounting return measure used:
Return on investment, return on net assets, return on capital employed 68%
Residual income, economic value added 18%
Cash flow return on investment 11%
Shareholder value added 3%

Table 5. Pearson correlations between all variables (refer to the appendix for variable definitions)
Cell entries represent the across model average Pearson correlation between Type of performance measure (i.e., weight on accounting return measures, weight
on profit measures, weight on disaggregated measures, and weight on non-financial measures), size of the business unit, industry indicators, authority of
business unit managers, interdependencies, and information asymmetry. Note that the construction of the latent variables in PLS may vary across the different
causal models, which in turn affects the correlation between the latent variables and all other variables. Correlations are based on 140 (periodic assessment
and career-related decisions) or 119 (bonus decisions) observations. Significance levels are aggregated across models and determined by a chi-square test
(Christie 1990). This test assumes independence across samples and is therefore likely to overstate significance.
(1) (2) (3) (4) (5) (6) (7) (8) (9)
1. Weight on accounting return measures -
2. Weight on profit measures -0.39*** -
3. Weight on disaggregated measures -0.28*** -0.29*** -
4. Weight on non-financial measures -0.20** -0.46*** 0.06** -
5. Authority of business unit managers 0.31*** -0.27*** -0.11 0.01 -
6. Interdependencies -0.20*** -0.16** 0.31*** 0.28*** -0.36*** -
7. Information asymmetries 0.06 -0.12 -0.16** 0.07*** 0.43*** -0.12*** -
8. Size of the business unit 0.20*** -0.21*** -0.05 0.05 0.12*** -0.11 0.13*** -
9. Indicator variable for financial service
industry
0.05 0.01 -0.04 0.07** 0.06 0.03 0.08 -0.06 -
10. Indicator variable for other service industries -0.22*** 0.11** 0.14*** -0.02 -0.06 -0.02 -0.09 0.00 -0.25***
Notes: *, **, *** denotes significance at the 10%, 5%, and 1% level (two-tailed).

Table 6
Weight on type of performance measure
Results of the Partial Least Squares analysis of the causal model in Fig. 1. Based on 140 (119)
observations (bonus determination). While models include industry fixed effects and size
controls, these results are suppressed due to space considerations. Reported are PLS
coefficient estimates of the path from (1) authority of business unit managers, (2)
interdependencies, and (3) information asymmetry to the (relative) weight on accounting
return. Absolute values of t-statistics based on a bootstrapping procedure (1,000 samples with
replacement) are in parentheses.
Equation:
Type of performance measure = f {authority of business unit manager,
interdependencies; control variables}
Panel A – Dependent variable: weight on accounting return measures
Decision context Path from: Predicted
Sign
Periodic
assessment
Bonus
determination
Career-related
decisions
Test variables:
Authority of business
managers
+,+,+ 0.33***
(3.16)
0.34***
(3.12)
0.25**
(1.99)
Interdependencies -,-,- -0.08
(0.85)
-0.14*
(1.64)
-0.13
(1.25)
Control variable:
Information asymmetry NP -0.10
(0.98)
-0.22**
(1.98)
-0.19
(1.53)
Multiple R2:
Periodic assessment: 22.7%
Bonus determination: 21.8%
Career-related decisions: 13.7%
Panel B – Dependent variable: weight on profit measures
Decision context Path from: Predicted
Sign
Periodic
assessment
Bonus
determination
Career-related
decisions
Test variables:
Authority of business
managers
NP -0.35**
(2.29)
-0.37**
(2.06)
-0.24
(1.42)
Interdependencies NP -0.38***
(4.24)
-0.36***
(2.89)
-0.10
(0.77)
Control variable:
Information asymmetry NP 0.07
(0.52)
-0.02
(0.18)
-0.09
(0.71)
Multiple R2:
Periodic assessment: 19.3%
Bonus determination: 31.2%
Career-related decisions: 12.1%

32
Panel C – Dependent variable: weight on disaggregated measures
Decision context Path from: Predicted
Sign
Periodic
assessment
Bonus
determination
Career-related
decisions
Test variables:
Authority of business
managers
NP -0.04
(0.29)
0.18
(1.26)
0.04
(0.20)
Interdependencies +,+,+ 0.17*
(1.58)
0.48***
(4.23)
0.29***
(2.41)
Control variable:
Information asymmetry NP -0.18*
(1.66)
0.00
(0.18)
-0.03
(0.16)
Multiple R2:
Periodic assessment: 11.5%
Bonus determination: 22.4%
Career-related decisions: 10.8%
Panel D – Dependent variable: weight on non-financial measures
Decision context Path from: Predicted
Sign
Periodic
assessment
Bonus
determination
Career-related
decisions
Test variables:
Authority of business
manager
NP 0.06
(0.48)
0.00
(0.02)
0.03
(1.12)
Interdependencies +,+,+ 0.46***
(4.84)
0.42***
(3.67)
0.13
(1.17)
Control variable:
Information asymmetry NP 0.14
(1.26)
0.23
(1.06)
0.02
(0.13)
Multiple R2:
Periodic assessment: 19.6%
Bonus determination: 17.6%
Career-related decisions: 4.8%
Notes: *, **, *** denotes significance at the 10%, 5%, and 1% level, respectively. Reported
p-values are one-tailed for variables with a directional prediction and two-tailed otherwise.
NP = no relation predicted.

33
Table 7
PLS estimation results for interdependencies and information asymmetry as explanatory
variables for the authority of business unit managers. Reported is the distribution of the
coefficient estimates from 12 causal models.
Equation:
Authority of business unit manager = f {interdependencies, information asymmetry;
control variables}
Path to authority of
business unit managers
Multiple R2 range = [26.0% - 33.3%]
Path from:
Mean Chi-square test,
df. = 30
(p-value)
Std. Min. Max. # of
significant
paths (max. =
12)
Information asymmetry 0.44
(3.69)
207.7
(<0.001)
0.05 0.38 0.53 12
Interdependencies -0.22
(-2.37)
100.1
(<0.001)
0.05 -0.27 -0.08 10
Note: parentheses denote the average of 12 t-statistics on the coefficients of the paths from
information asymmetry and interdependencies to the authority of business unit managers.
Authority of business unit managers is modeled as a function of interdependencies,
information asymmetry, size, and industry affiliation. For brevity, we only report the results
of the main variables of interest.
Chi-square tests consider the joint null hypothesis that the t-statistic on a given variable in all
models is less than or equal to zero (Christie 1990). The test assumes each sample to be
independent and therefore overstates the significance level.
34
Appendix Panel – A
Panel A of the appendix replicates the instrument we use to measure the weight on
performance metrics in three decision contexts: (1) periodic assessment, (2) bonus
determination, and (3) career decisions. Only the heading differs across the three decision
contexts; we therefore replicate the common part of the instrument just once.
1. We wish to understand the relative importance of performance measures used to
assess your business unit’s performance. Given below are descriptions of
performance measures. Depending on the context in which you operate, your
supervisor has (implicitly or explicitly) assigned weights to each of these measures to
assess your unit’s performance. We would like you to indicate these weights for each
of these measures. Your answers should total 100%.
Performance metric: Example %weight
Stock price-related
measures
Non-financial measures Market share, customer satisfaction, quality
Profit measures Net income, profit margin, operating profit
Disaggregated measures Costs, revenues
Return measures Please check below the measure used:
• Return on investment, return on net assets,
return on capital employed
• Residual income
• Economic value added
• Cash flow return on investment
• Shareholder value added
• Other return metric, please specify its
computation:
Other measures, not
mentioned above
Please specify
2. Please indicate for each the performance measures below the weight assigned to
determine your bonus. You may either supply the weights that are specified by the
specific rules or company regulations that exist in your firm, or in the absence of such
specific rules, you should supply the weights used by your superior determining your
bonus. Your answers should total 100%.
3. We would like to know how important the performance measures listed below are
when decisions are made about your (longer term) career. Please indicate the weight
each measure receives when decisions about your career are made by your superior.
Your answers should total 100%.
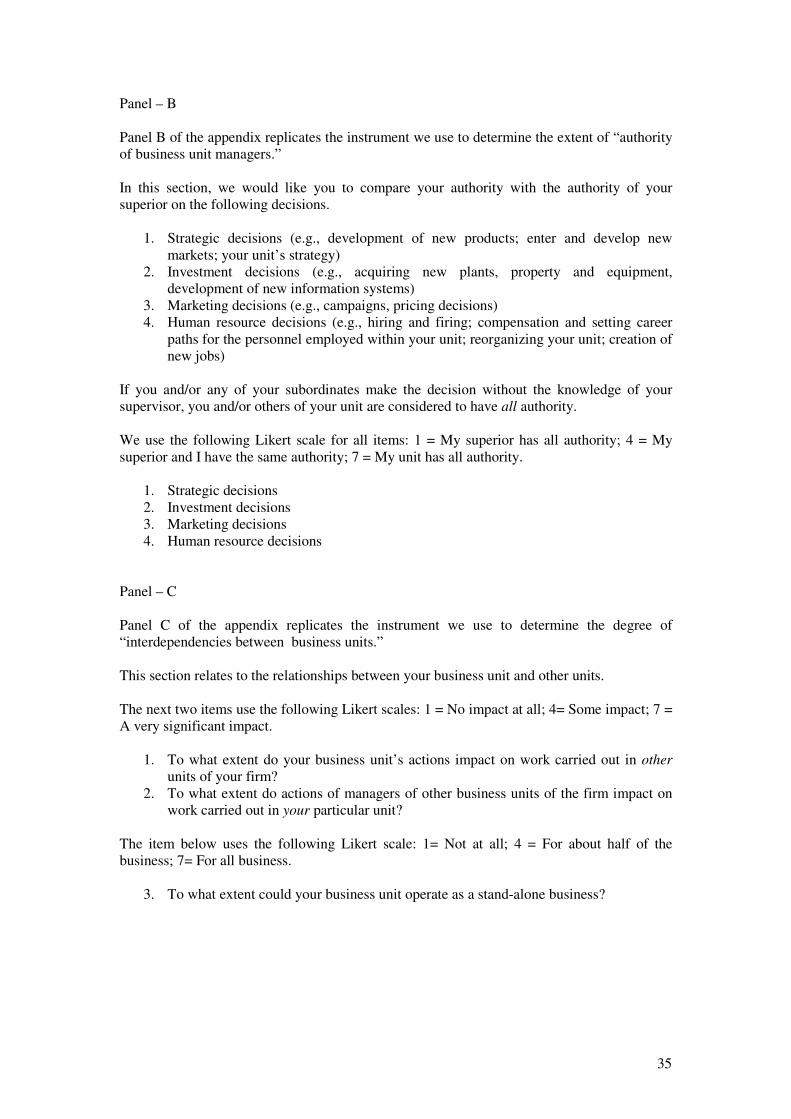
35
Panel – B
Panel B of the appendix replicates the instrument we use to determine the extent of “authority
of business unit managers.”
In this section, we would like you to compare your authority with the authority of your
superior on the following decisions.
1. Strategic decisions (e.g., development of new products; enter and develop new
markets; your unit’s strategy)
2. Investment decisions (e.g., acquiring new plants, property and equipment,
development of new information systems)
3. Marketing decisions (e.g., campaigns, pricing decisions)
4. Human resource decisions (e.g., hiring and firing; compensation and setting career
paths for the personnel employed within your unit; reorganizing your unit; creation of
new jobs)
If you and/or any of your subordinates make the decision without the knowledge of your
supervisor, you and/or others of your unit are considered to have all authority.
We use the following Likert scale for all items: 1 = My superior has all authority; 4 = My
superior and I have the same authority; 7 = My unit has all authority.
1. Strategic decisions
2. Investment decisions
3. Marketing decisions
4. Human resource decisions
Panel – C
Panel C of the appendix replicates the instrument we use to determine the degree of
“interdependencies between business units.”
This section relates to the relationships between your business unit and other units.
The next two items use the following Likert scales: 1 = No impact at all; 4= Some impact; 7 =
A very significant impact.
1. To what extent do your business unit’s actions impact on work carried out in other
units of your firm?
2. To what extent do actions of managers of other business units of the firm impact on
work carried out in your particular unit?
The item below uses the following Likert scale: 1= Not at all; 4 = For about half of the
business; 7= For all business.
3. To what extent could your business unit operate as a stand-alone business?

36
Panel – D
Panel D of this appendix replicates the instrument we use to determine the degree of
“information asymmetry between business unit managers and their superiors.”
In this section, we are interested in the way in which information is distributed in your firm.
The next three items use the following Likert scale: 1= My superior is much more familiar; 4
= We are about equally familiar; 7 = I am much more familiar.
1. Compared to your superior, who is in possesion of better information regarding the
activities undertaken in your business unit?
2. Compared to your superior, who is more familiar with the input-output relationships
inherent in the internal operations of your business unit?
3. Compared to your superior, who is more familiar technically with the work of your
business unit?
The next item uses the following Likert scale: 1= My superior is much more certain; 4 = we
are about equally certain; 7 = I am much more certain.
4. Compared to your superior, who is more certain about the performance potential of
your organizational unit?
The two items below use the following Likert scale: 1 = My superior has a much better
understanding; 4 = We have about the same understanding; 7 = I have a much better
understanding.
5. Compared to your superior, who is better able to assess the potential impact on your
activities of factors external to your business unit?
6. Compared to your superior, who has a better understanding of what can be achieved
in your business unit?
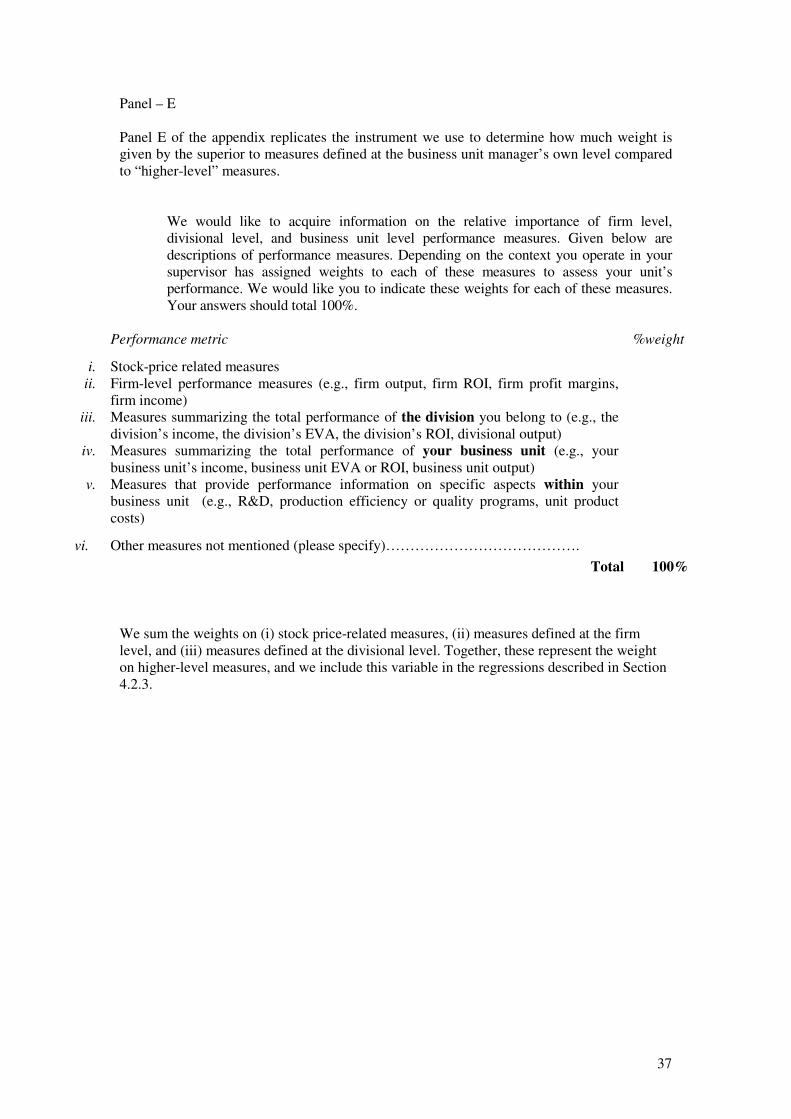
37
Panel – E
Panel E of the appendix replicates the instrument we use to determine how much weight is
given by the superior to measures defined at the business unit manager’s own level compared
to “higher-level” measures.
We would like to acquire information on the relative importance of firm level,
divisional level, and business unit level performance measures. Given below are
descriptions of performance measures. Depending on the context you operate in your
supervisor has assigned weights to each of these measures to assess your unit’s
performance. We would like you to indicate these weights for each of these measures.
Your answers should total 100%.
Performance metric %weight
i. Stock-price related measures ii. Firm-level performance measures (e.g., firm output, firm ROI, firm profit margins,
firm income)
iii. Measures summarizing the total performance of the division you belong to (e.g., the
division’s income, the division’s EVA, the division’s ROI, divisional output)
iv. Measures summarizing the total performance of your business unit (e.g., your
business unit’s income, business unit EVA or ROI, business unit output)
v. Measures that provide performance information on specific aspects within your
business unit (e.g., R&D, production efficiency or quality programs, unit product
costs)
vi. Other measures not mentioned (please specify)…………………………………. Total 100%
We sum the weights on (i) stock price-related measures, (ii) measures defined at the firm
level, and (iii) measures defined at the divisional level. Together, these represent the weight
on higher-level measures, and we include this variable in the regressions described in Section
4.2.3.
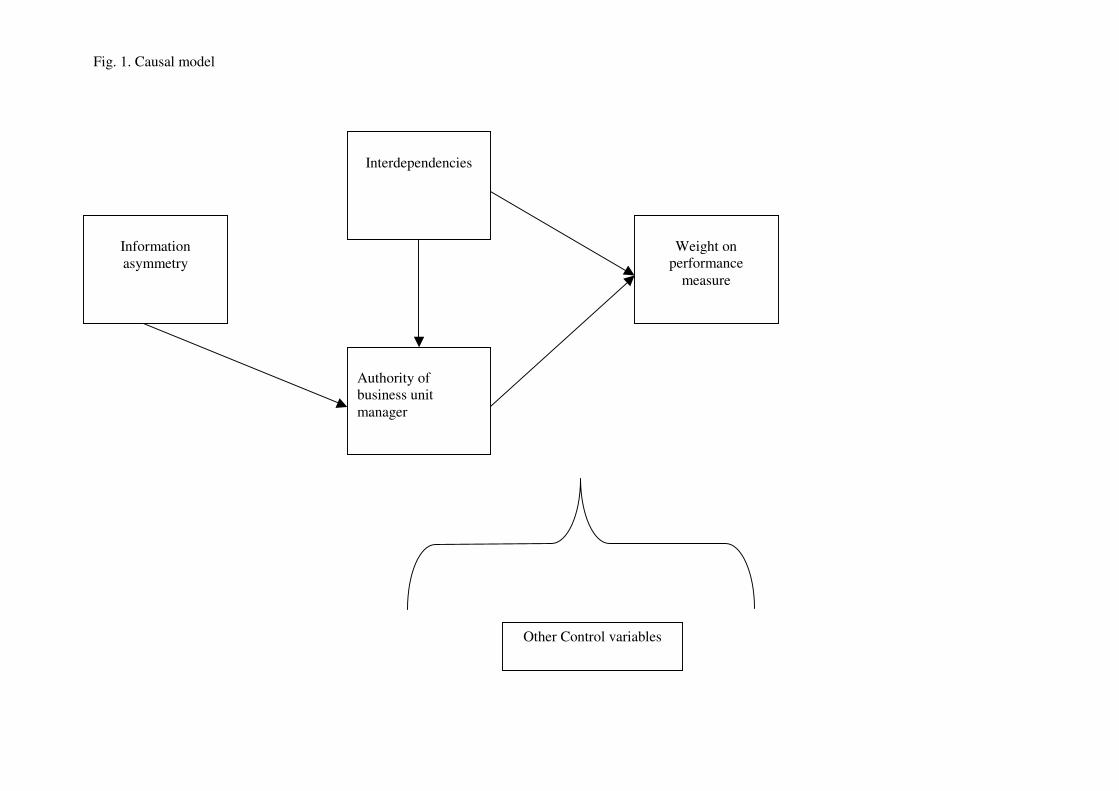
Information
asymmetry
Interdependencies
Authority of
business unit
manager
Weight on
performance
measure
Other Control variables
Fig. 1. Causal model