tilly’s, inc
TRANSCRIPT

Table of Contents
UNITED STATESSECURITIES AND EXCHANGE COMMISSION
Washington, DC 20549__________________________________________________
FORM 10-Q __________________________________________________
☒ QUARTERLY REPORT PURSUANT TO SECTION 13 OR 15(d) OF THE SECURITIES EXCHANGE ACT OF1934
For the quarterly period ended July 31, 2021
OR
☐ TRANSITION REPORT PURSUANT TO SECTION 13 OR 15(d) OF THE SECURITIES EXCHANGE ACT OF1934
Commission file number: 001-35535 __________________________________________________
TILLY’S, INC.(Exact name of Registrant as specified in its charter)
__________________________________________________
Delaware 45-2164791(State or other jurisdiction of
incorporation or organization) (I.R.S. Employer
Identification No.)
10 WhatneyIrvine, CA 92618
(Address of principal executive offices)
(949) 609-5599(Registrant’s telephone number, including area code)
__________________________________________________
Securities registered pursuant to Section 12(b) of the Act:
Title of each classTradingSymbol(s) Name of each exchange on which registered
Class A Common Stock, $0.001 par value per share TLYS New York Stock Exchange
Indicate by check mark whether the Registrant (1) has filed all reports required to be filed by Section 13 or 15(d) of the Securities Exchange Act of 1934during the preceding 12 months (or for such shorter period that the Registrant was required to file such reports), and (2) has been subject to such filingrequirements for the past 90 days. Yes ☒ No ☐
Indicate by check mark whether the registrant has submitted electronically every Interactive Data File required to be submitted pursuant to Rule 405 ofRegulation S-T (§232.405 of this chapter) during the preceding 12 months (or for such shorter period that the registrant was required to submit and postsuch files). Yes ☒ No ☐
Indicate by check mark whether the registrant is a large accelerated filer, an accelerated filer, a non-accelerated filer, a smaller reporting company, or anemerging growth company. See the definitions of “large accelerated filer,” “accelerated filer,” “smaller reporting company,” and “emerging growthcompany” in Rule 12b-2 of the Exchange Act. Large accelerated filer ☐ Accelerated Filer ☒
Non-accelerated filer ☐ Smaller reporting company ☒
Emerging growth company ☐
If an emerging growth company, indicate by check mark if the registrant has elected not to use the extended transition period for complying with any newor revised financial accounting standards provided pursuant to Section 13(a) of the Exchange Act. ☐
Indicate by check mark whether the registrant is a shell company (as defined in Exchange Act Rule 12b-2) Yes ☐ No ☒
As of September 7, 2021, the registrant had the following shares of common stock outstanding:

Class A common stock $0.001 par value 23,651,085 Class B common stock $0.001 par value 7,306,108

Table of Contents
TILLY’S, INC.FORM 10-Q
For the Quarterly Period Ended July 31, 2021
Index PagePART I. FINANCIAL INFORMATIONItem 1. Financial Statements (Unaudited) 6
Consolidated Balance Sheets as of July 31, 2021, January 30, 2021 and August 1, 2020 6Consolidated Statements of Operations for the Thirteen and Twenty-Six Weeks Ended July 31, 2021 and August 1, 2020 7Consolidated Statements of Comprehensive Income (Loss) for the Thirteen and Twenty-Six Weeks Ended July 31, 2021 and August 1,2020 8Consolidated Statement of Stockholders’ Equity as of July 31, 2021 and August 1, 2020 9Consolidated Statements of Cash Flows for the Twenty-Six Weeks Ended July 31, 2021 and August 1, 2020 11Notes to the Consolidated Financial Statements 12
Item 2. Management’s Discussion and Analysis of Financial Condition and Results of Operations 24Item 3. Quantitative and Qualitative Disclosures About Market Risk 32Item 4. Controls and Procedures 32PART II. OTHER INFORMATIONItem 1. Legal Proceedings 34Item 1A. Risk Factors 34Item 6. Exhibits 35
Signatures 36
3

Table of Contents
Forward-Looking Statements
This Report contains forward-looking statements that are subject to risks and uncertainties. All statements other than statements of historical or current factincluded in this Report are forward-looking statements. Forward-looking statements refer to our current expectations and projections relating to ourfinancial condition, results of operations, plans, objectives, strategies, future performance and business. You can identify forward-looking statements by thefact that they do not relate strictly to historical or current facts. These statements may include words such as “anticipate”, “estimate”, “expect”, “project”,“plan”, “intend”, “believe”, “may”, “might”, “will”, “should”, “can have”, “likely” and other words and terms of similar meaning in connection with anydiscussion of the timing or nature of future operating or financial performance or other events. For example, all statements we make relating to ourestimated and projected earnings, revenues, comparable store sales, operating income, earnings per share, costs, expenditures, cash flows, growth rates andfinancial results, our plans and objectives for future operations, growth or initiatives, strategies or the expected outcome or impact of pending or threatenedlitigation are forward-looking statements. All forward-looking statements are subject to risks and uncertainties that may cause actual results to differmaterially from those that we expected, including:
• the impacts of the COVID-19 pandemic generally (including any future surges in the number of cases or new variants or strains related thereto), and onour operations, future financial or operational results;
• our ability to adapt to changes in traffic trends for our stores and changes in our customers' purchasing patterns;• our ability to successfully open new stores and profitably operate our existing stores;• our ability to attract customers to our e-commerce website;• our ability to efficiently utilize our e-commerce fulfillment center;• effectively adapting to new challenges associated with our expansion into new geographic markets;• our ability to establish, maintain and enhance a strong brand image;• generating adequate cash from our existing stores to support our growth;• identifying and responding to new and changing customer fashion preferences and fashion-related trends;• competing effectively in an environment of intense competition both in stores and online;• the success of the malls, power centers, neighborhood and lifestyle centers, outlet centers and street-front locations in which our stores are located;• our ability to attract customers in the various retail venues and geographies in which our stores are located;• adapting to periods of decline in consumer confidence and consumer spending;• our ability to adapt to significant changes in sales due to the seasonality of our business;• our ability to compete in social media marketing platforms;• price reductions or inventory shortages resulting from failure to purchase the appropriate amount of inventory in advance of the season in which it will
be sold;• natural disasters, unusually adverse weather conditions, port delays, boycotts, epidemics, pandemics, acts of war, terrorism, civil unrest, and other
unanticipated events;• our dependence on third-party vendors to provide us with sufficient quantities of merchandise at acceptable prices;• increases in costs of energy, transportation or utility costs and in the costs of labor and employment;• our ability to balance proprietary branded merchandise with the third-party branded merchandise we sell;• adjusting to increasing costs of mailing catalogs, paper and printing;• most of our merchandise is made in foreign countries, making price and availability of our merchandise susceptible to international trade conditions;• failure of our vendors and their manufacturing sources to use acceptable labor or other practices;• our dependence upon key executive management or our inability to hire or retain the talent required for our business;• our ability to effectively adapt to our planned expansion;• failure of our information technology systems to support our current and growing business, before and after our planned upgrades;• disruptions in our supply chain and distribution center;• our indebtedness and lease obligations, including restrictions on our operations contained therein;• our reliance upon independent third-party transportation providers for certain of our product shipments;• our ability to increase comparable store sales or sales per square foot, which may cause our operations and stock price to be volatile;
4

Table of Contents
• disruptions to our information systems in the ordinary course of business or as a result of systems upgrades;• our inability to protect our trademarks or other intellectual property rights;• the impact of governmental laws and regulations and the outcomes of legal proceedings;• our ability to secure our data and comply with the security standards for the credit card industry;• our failure to maintain adequate internal controls over our financial and management systems; and• continuing costs incurred as a result of being a public company.
We derive many of our forward-looking statements from our operating budgets and forecasts, which are based upon detailed assumptions. While webelieve that our assumptions are reasonable, we caution that it is very difficult to predict the impact of known factors, and it is impossible for us toanticipate all factors that could affect our actual results.
See “Risk Factors” within our most recent Annual Report on Form 10-K for a more complete discussion of the risks and uncertainties mentioned above andfor discussion of other risks and uncertainties. All forward-looking statements attributable to us are expressly qualified in their entirety by these cautionarystatements as well as others made in this Report and hereafter in our other SEC filings and public communications. You should evaluate all forward-looking statements made by us in the context of these risks and uncertainties.
We caution you that the risks and uncertainties identified by us may not be all of the factors that are important to you. Furthermore, the disclosures andforward-looking statements included in this Report are made only as of the date hereof. We undertake no obligation to publicly update or revise anyforward-looking statement as a result of new information, future events or otherwise, except as otherwise required by law.
5

Table of Contents
Part I. Financial Information Item 1. Financial Statements (Unaudited)
TILLY’S, INC.CONSOLIDATED BALANCE SHEETS
(In thousands, except par value)(Unaudited)
July 31,2021
January 30,2021
August 1,2020
ASSETSCurrent assets:Cash and cash equivalents $ 81,894 $ 76,184 $ 132,955 Marketable securities 66,644 64,955 15,939 Receivables 13,143 8,724 13,287 Merchandise inventories 86,853 55,698 68,067 Prepaid expenses and other current assets 7,810 6,595 3,956
Total current assets 256,344 212,156 234,204 Operating lease assets 216,046 229,864 245,004 Property and equipment, net 51,172 52,639 56,805 Other assets 11,601 12,797 8,458
Total assets $ 535,163 $ 507,456 $ 544,471 LIABILITIES AND STOCKHOLDERS’ EQUITYCurrent liabilities:Accounts payable $ 59,053 $ 24,983 $ 48,710 Accrued expenses 23,898 30,682 19,416 Line of credit — — 23,675 Deferred revenue 13,040 13,492 9,443 Accrued compensation and benefits 16,567 9,899 6,891 Current portion of operating lease liabilities 53,022 54,503 64,470 Other 948 632 339
Total current liabilities 166,528 134,191 172,944 Noncurrent operating lease liabilities 196,018 211,292 222,015 Other 1,385 1,351 944
Total liabilities 363,931 346,834 395,903 Commitments and contingencies (Notes 2 and 5)Stockholders’ equity:Common stock (Class A), $0.001 par value; 100,000 shares authorized; 23,651, 22,477 and22,414 shares issued and outstanding, respectively 24 22 22 Common stock (Class B), $0.001 par value; 35,000 shares authorized; 7,306, 7,306 and 7,366shares issued and outstanding, respectively 7 8 8 Preferred stock, $0.001 par value; 10,000 shares authorized; no shares issued or outstanding — — — Additional paid-in capital 165,407 155,437 154,386 Retained earnings (Accumulated deficit) 5,782 5,135 (5,849)Accumulated other comprehensive income 12 20 1
Total stockholders’ equity 171,232 160,622 148,568 Total liabilities and stockholders’ equity $ 535,163 $ 507,456 $ 544,471
The accompanying notes are an integral part of these consolidated financial statements.
6

Table of Contents
TILLY’S, INC.CONSOLIDATED STATEMENTS OF OPERATIONS
(In thousands, except per share data)(Unaudited)
Thirteen Weeks Ended Twenty-Six Weeks Ended
July 31,
2021August 1,
2020July 31,
2021August 1,
2020Net sales $ 201,952 $ 135,845 $ 365,109 $ 213,134 Cost of goods sold (includes buying, distribution, and occupancy costs) 127,225 94,171 235,543 169,866 Gross profit 74,727 41,674 129,566 43,268 Selling, general and administrative expenses 48,300 33,965 88,265 63,960 Operating income (loss) 26,427 7,709 41,301 (20,692)Other (expense) income, net (102) 311 (218) 720 Income (loss) before income taxes 26,325 8,020 41,083 (19,972)Income tax expense (benefit) 5,927 2,754 9,726 (7,843)Net income (loss) $ 20,398 $ 5,266 $ 31,357 $ (12,129)Basic earnings (loss) per share of Class A and Class B common stock $ 0.67 $ 0.18 $ 1.04 $ (0.41)Diluted earnings (loss) per share of Class A and Class B commonstock $ 0.66 $ 0.18 $ 1.02 $ (0.41)Weighted average basic shares outstanding 30,500 29,694 30,189 29,686 Weighted average diluted shares outstanding 31,113 29,700 30,837 29,686
The accompanying notes are an integral part of these consolidated financial statements.
7

Table of Contents
TILLY’S, INC.CONSOLIDATED STATEMENTS OF COMPREHENSIVE INCOME (LOSS)
(In thousands)(Unaudited)
Thirteen Weeks Ended Twenty-Six Weeks Ended
July 31,
2021August 1,
2020July 31,
2021August 1,
2020Net income (loss) $ 20,398 $ 5,266 $ 31,357 $ (12,129)Other comprehensive income (loss), net of tax:
Net change in unrealized (loss) gain on available-for-salesecurities, net of tax (11) (200) (8) (213)
Other comprehensive (loss) income, net of tax (11) (200) (8) (213)Comprehensive income (loss) $ 20,387 $ 5,066 $ 31,349 $ (12,342)
The accompanying notes are an integral part of these consolidated financial statements.
8

Table of Contents
TILLY’S, INC.CONSOLIDATED STATEMENT OF STOCKHOLDERS’ EQUITY
(In thousands)(Unaudited)
Number of Shares
CommonStock
(Class A)
CommonStock
(Class B)Common
Stock
AdditionalPaid-inCapital
RetainedEarnings
AccumulatedOther
ComprehensiveIncome
TotalStockholders’
EquityBalance at May 1, 2021 22,837 7,306 $ 30 $ 158,454 $ 16,094 $ 23 $ 174,601
Net income — — — — 20,398 — 20,398 Dividends paid ($1.00 per share) — — — — (30,710) — (30,710)Restricted stock 20 — — — — — — Share-based compensation expense — — — 531 — — 531 Exercises of stock options 794 — 1 6,422 — — 6,423 Net change in unrealized gain onavailable-for-sale securities — — — — — (11) (11)
Balance at July 31, 2021 23,651 7,306 $ 31 $ 165,407 $ 5,782 $ 12 $ 171,232
Number of Shares
CommonStock
(Class A)
CommonStock
(Class B)Common
Stock
AdditionalPaid-inCapital
RetainedEarnings
(AccumulatedDeficit)
AccumulatedOther
ComprehensiveIncome
TotalStockholders’
EquityBalance at May 2, 2020 22,363 7,366 $ 30 $ 153,878 $ (11,115) $ 201 $ 142,994
Net income — — — — 5,266 — 5,266 Restricted stock 51 — — — — — — Share-based compensation expense — — — 508 — — 508 Net change in unrealized gain onavailable-for-sale securities — — — — — (200) (200)
Balance at August 1, 2020 22,414 7,366 $ 30 $ 154,386 $ (5,849) $ 1 $ 148,568
The accompanying notes are an integral part of these consolidated financial statements.
9
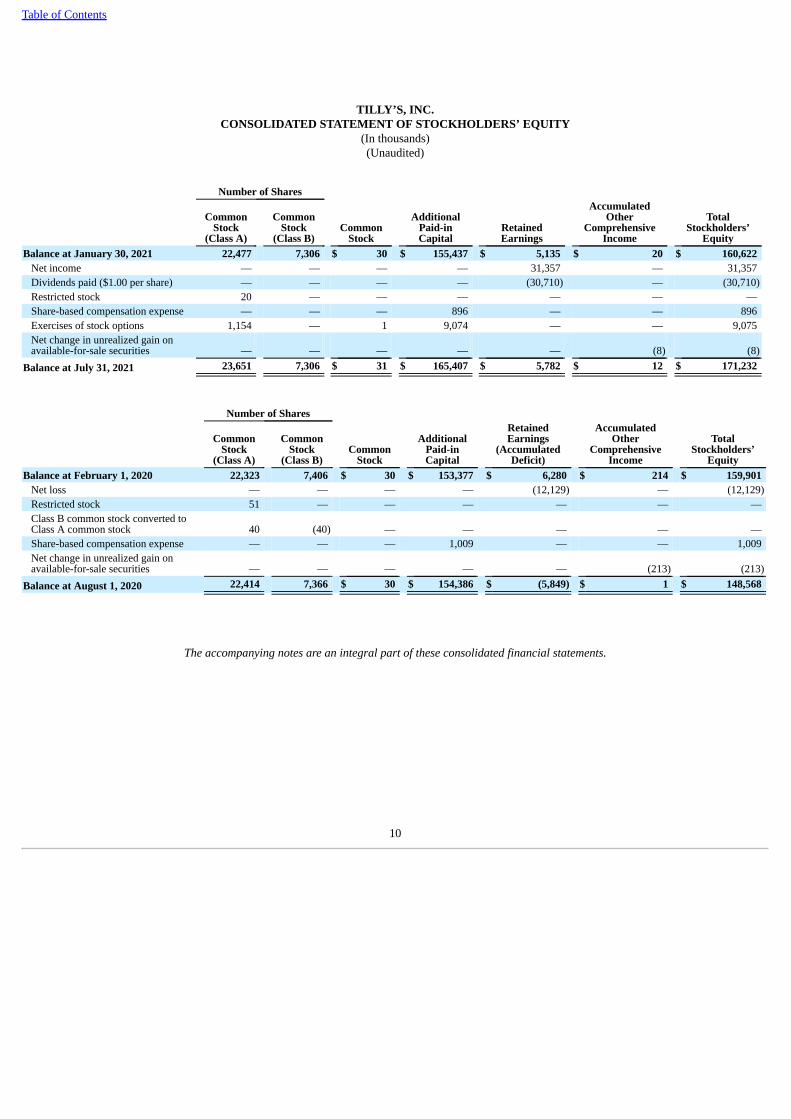
Table of Contents
TILLY’S, INC.CONSOLIDATED STATEMENT OF STOCKHOLDERS’ EQUITY
(In thousands)(Unaudited)
Number of Shares
CommonStock
(Class A)
CommonStock
(Class B)Common
Stock
AdditionalPaid-inCapital
RetainedEarnings
AccumulatedOther
ComprehensiveIncome
TotalStockholders’
EquityBalance at January 30, 2021 22,477 7,306 $ 30 $ 155,437 $ 5,135 $ 20 $ 160,622
Net income — — — — 31,357 — 31,357 Dividends paid ($1.00 per share) — — — — (30,710) — (30,710)Restricted stock 20 — — — — — — Share-based compensation expense — — — 896 — — 896 Exercises of stock options 1,154 — 1 9,074 — — 9,075 Net change in unrealized gain onavailable-for-sale securities — — — — — (8) (8)
Balance at July 31, 2021 23,651 7,306 $ 31 $ 165,407 $ 5,782 $ 12 $ 171,232
Number of Shares
CommonStock
(Class A)
CommonStock
(Class B)Common
Stock
AdditionalPaid-inCapital
RetainedEarnings
(AccumulatedDeficit)
AccumulatedOther
ComprehensiveIncome
TotalStockholders’
EquityBalance at February 1, 2020 22,323 7,406 $ 30 $ 153,377 $ 6,280 $ 214 $ 159,901
Net loss — — — — (12,129) — (12,129)Restricted stock 51 — — — — — — Class B common stock converted toClass A common stock 40 (40) — — — — — Share-based compensation expense — — — 1,009 — — 1,009 Net change in unrealized gain onavailable-for-sale securities — — — — — (213) (213)
Balance at August 1, 2020 22,414 7,366 $ 30 $ 154,386 $ (5,849) $ 1 $ 148,568
The accompanying notes are an integral part of these consolidated financial statements.
10

Table of Contents
TILLY’S, INC.CONSOLIDATED STATEMENTS OF CASH FLOWS
(In thousands)(Unaudited)
Twenty-Six Weeks Ended
July 31,
2021August 1,
2020Cash flows from operating activitiesNet income (loss) $ 31,357 $ (12,129)Adjustments to reconcile net income (loss) to net cash provided by operating activities:
Depreciation and amortization 8,809 9,987 Insurance proceeds from casualty loss 117 — Share-based compensation expense 896 1,009 Impairment of long-lived assets 136 903 Loss on disposal of assets 62 64 Gain on sales and maturities of marketable securities (74) (677)Deferred income taxes 1,462 (490)Changes in operating assets and liabilities:
Receivables (2,997) (5,802)Merchandise inventories (31,272) (11,166)Prepaid expenses and other current assets (1,483) 2,107 Accounts payable 34,077 28,376 Accrued expenses (5,859) 701 Deferred revenue (452) (2,318)Accrued compensation and benefits 6,668 (299)Operating lease liabilities (3,481) 8,802 Other liabilities (524) (225)
Net cash provided by operating activities 37,442 18,843 Cash flows from investing activitiesPurchases of property and equipment (8,511) (4,250)Proceeds from sale of property and equipment 10 — Insurance proceeds from casualty loss 29 — Purchases of marketable securities (66,625) (15,968)Maturities of marketable securities 65,000 70,195
Net cash (used in) provided by investing activities (10,097) 49,977 Cash flows from financing activitiesProceeds from line of credit — 23,675 Dividends paid (30,710) (29,677)Proceeds from exercise of stock options 9,075 —
Net cash used in financing activities (21,635) (6,002)Change in cash and cash equivalents 5,710 62,818 Cash and cash equivalents, beginning of period 76,184 70,137 Cash and cash equivalents, end of period $ 81,894 $ 132,955 Supplemental disclosures of cash flow information
Interest paid $ — $ 128 Income taxes paid $ 17,790 $ 828
Supplemental disclosure of non-cash activitiesUnpaid purchases of property and equipment $ 1,571 $ 1,845 Leased assets obtained in exchange for new operating lease liabilities $ 9,790 $ 7,168
The accompanying notes are an integral part of these consolidated financial statements.
11

Table of Contents
TILLY’S, INC.NOTES TO THE CONSOLIDATED FINANCIAL STATEMENTS
(Unaudited)
Note 1: Description of the Company and Basis of Presentation
Tillys is a leading destination specialty retailer of casual apparel, footwear and accessories for young men, young women, boys and girls with an extensiveassortment of iconic global, emerging, and proprietary brands rooted in an active and social lifestyle. Tillys is headquartered in Irvine, California andoperated 244 stores, in 33 states as of July 31, 2021. Our stores are located in malls, lifestyle centers, ‘power’ centers, community centers, outlet centersand street-front locations. Customers may also shop online, where we feature the same assortment of products as carried in our brick-and-mortar stores,supplemented by additional online-only styles. Our goal is to serve as a destination for the latest, most relevant merchandise and brands important to ourcustomers.
The Tillys concept began in 1982, when our co-founders, Hezy Shaked and Tilly Levine, opened their first store in Orange County, California. Since 1984,the business has been conducted through World of Jeans & Tops, a California corporation, or “WOJT”, which operates under the name “Tillys”. In May2011, Tilly’s, Inc., a Delaware corporation, was formed solely for the purpose of reorganizing the corporate structure of WOJT in preparation for an initialpublic offering. As part of the initial public offering in May 2012, WOJT became a wholly owned subsidiary of Tilly's, Inc.
The consolidated financial statements include the accounts of Tilly's Inc. and WOJT. All intercompany accounts and transactions have been eliminated inconsolidation.
As used in these Notes to the Consolidated Financial Statements, except where the context otherwise requires or where otherwise indicated, the terms "theCompany", "World of Jeans and Tops", "WOJT", "we", "our", "us" and "Tillys" refer to WOJT before our initial public offering, and to Tilly's, Inc. and itssubsidiary after our initial public offering.
We have prepared the accompanying unaudited consolidated financial statements in accordance with accounting principles generally accepted in the UnitedStates of America ("GAAP") for interim financial reporting. These unaudited consolidated financial statements have been prepared pursuant to the rulesand regulations of the Securities and Exchange Commission (the "SEC"). Certain information and footnote disclosures normally included in financialstatements prepared in accordance with GAAP have been omitted from this Quarterly Report on Form 10-Q as is permitted by SEC rules and regulations.
In the opinion of management, the accompanying unaudited consolidated financial statements contain all normal and recurring adjustments necessary topresent fairly the financial condition, results of operations and cash flows for the interim periods presented. The results of operations for the thirteen andtwenty-six week periods ended July 31, 2021 are not necessarily indicative of results to be expected for the full fiscal year, especially in light of thefavorable circumstances surrounding federal stimulus checks and atypical back-to-school timing that occurred during the first quarter of fiscal 2021. Theaccompanying unaudited consolidated financial statements should be read in conjunction with the consolidated financial statements and notes included inour Annual Report on Form 10-K for the fiscal year ended January 30, 2021 ("fiscal 2020").
Fiscal Periods
Our fiscal year ends on the Saturday closest to January 31. References to fiscal 2021 refer to the fiscal year ending January 29,2022. References to the fiscal quarters or first halves July 31, 2021 and August 1, 2020 refer to the thirteen and twenty-six week periods ended as of thosedates, respectively.
Impact of the COVID-19 Pandemic on our Business
As of the date of filing this Quarterly Report on Form 10-Q (this "Report"), there remain many uncertainties regarding the ongoing COVID-19 pandemic(the "pandemic"), including the anticipated duration and severity of the pandemic, particularly in light of ongoing vaccination efforts and emerging variantstrains of the virus. To date, the pandemic has had far-reaching impacts on many aspects of the operations of the Company, directly and indirectly,including on consumer behavior, store traffic, operational capabilities and our operations generally, timing of deliveries, demands on our informationtechnology and e-commerce capabilities, inventory and expense management, managing our workforce, our storefront configurations and operations uponreopening, and our people, which have materially disrupted our business and the market generally. The scope and nature of these impacts continue toevolve. With the current resurgence of COVID-19, we may experience adverse impacts in the future, including similar impacts we have previouslyexperienced during the pandemic, such as regional quarantines, labor stoppages and shortages, changes in consumer purchasing patterns, mandatory orelective shut-downs of retail locations, disruptions to supply chains, including the inability of our suppliers and service providers to deliver materials andservices on a timely basis, or at all, severe market volatility, liquidity disruptions, and overall economic instability, which, in many cases, had, and may inthe future continue to have, material adverse impacts on our business, financial condition and results of
12

Table of Contents
operations. This situation is continually evolving, and additional impacts may arise that we are not aware of currently, or current impacts may becomemagnified.
Note 2: Summary of Significant Accounting Policies
Information regarding our significant accounting policies is contained in Note 2, “Summary of Significant Accounting Policies”, of the consolidatedfinancial statements in our Annual Report on Form 10-K for the fiscal year ended January 30, 2021.
Revenue Recognition
Revenue is recognized for store sales when the customer receives and pays for the merchandise at the register, net of estimated returns. Taxes collectedfrom our customers are recorded on a net basis. For e-commerce sales, we recognize revenue, net of sales taxes and estimated sales returns, and the relatedcost of goods sold at the time the merchandise is shipped to the customer. Amounts related to shipping and handling that are billed to customers arereflected in net sales, and the related costs are reflected in cost of goods sold in the Consolidated Statements of Operations.
The following table summarizes net sales from our retail stores and e-commerce (in thousands):
Thirteen Weeks Ended Twenty-Six Weeks EndedJuly 31,
2021August 1,
2020July 31,
2021August 1,
2020Retail stores $ 164,626 $ 83,858 $ 292,302 $ 130,811 E-commerce $ 37,326 51,987 $ 72,807 82,323
Total net sales $ 201,952 $ 135,845 $ 365,109 $ 213,134
The following table summarizes the percentage of net sales by department:
Thirteen Weeks Ended Twenty-Six Weeks EndedJuly 31,
2021August 1,
2020July 31,
2021August 1,
2020Mens 36 % 35 % 36 % 35 %Womens 28 % 27 % 28 % 27 %Accessories 17 % 16 % 16 % 16 %Footwear 10 % 13 % 11 % 13 %Boys 4 % 5 % 4 % 5 %Girls 4 % 4 % 4 % 4 %Hardgoods 1 % — % 1 % — %
Total net sales 100 % 100 % 100 % 100 %
The following table summarizes the percentage of net sales by third-party and proprietary branded merchandise:
Thirteen Weeks Ended Twenty-Six Weeks EndedJuly 31,
2021August 1,
2020July 31,
2021August 1,
2020Third-party 70 % 77 % 71 % 77 %Proprietary 30 % 23 % 29 % 23 %
Total net sales 100 % 100 % 100 % 100 %
We accrue for estimated sales returns by customers based on historical sales return results. As of July 31, 2021, January 30, 2021 and August 1, 2020, ourreserve for sales returns was $3.9 million, $1.4 million and $2.1 million, respectively.
We recognize revenue from gift cards as they are redeemed for merchandise. Prior to redemption, we maintain a current liability for unredeemed gift cardbalances. The customer liability balance was $7.9 million, $9.6 million and $7.7 million as of July 31, 2021, January 30, 2021 and August 1, 2020,respectively, and is included in deferred revenue on the accompanying Consolidated Balance Sheets. Our gift cards do not have expiration dates and inmost cases there is no legal obligation to remit unredeemed gift cards to relevant jurisdictions. Based on actual historical redemption patterns, wedetermined that a small percentage of gift cards are unlikely to be redeemed (which we refer to as gift card “breakage”). Based on our historical gift
13

Table of Contents
card breakage rate, we recognize breakage revenue over the redemption period in proportion to actual gift card redemptions. Revenue recognized from gift cards was $3.4 million and $2.7 million for the thirteen weeks ended July 31, 2021 and August 1, 2020, respectively. For thethirteen weeks ended July 31, 2021 and August 1, 2020, the opening gift card balance was $8.4 million and $8.1 million, respectively, of which$1.2 million and $1.1 million respectively, was recognized as revenue during the respective periods. Revenue recognized from gift cards was $7.2 millionand $5.4 million for the twenty-six weeks ended July 31, 2021 and August 1, 2020, respectively. For the twenty-six weeks ended July 31, 2021 and August1, 2020, the opening gift card balance was $9.6 million and $9.3 million, respectively, of which $3.4 million and $3.1 million, respectively, was recognizedas revenue during the respective periods.
We have a customer loyalty program where customers accumulate points based on purchase activity. Once a loyalty member achieves a certain point level,the member earns an award that may be used towards the purchase of merchandise. Unredeemed awards and accumulated partial points are accrued asdeferred revenue and awards redeemed by the member for merchandise are recorded as an increase to net sales. Our loyalty program allows customers toredeem their awards instantly or build up to additional awards over time. We currently expire unredeemed awards and accumulated partial points 365 daysafter the last purchase activity. A liability is estimated based on the standalone selling price of awards and partial points earned and estimated redemptions.The deferred revenue for this program was $5.1 million, $3.9 million and $1.8 million as of July 31, 2021, January 30, 2021 and August 1, 2020,respectively. The value of points redeemed through our loyalty program was $2.7 million and $1.5 million for the thirteen weeks ended July 31, 2021 andAugust 1, 2020, respectively. For the thirteen weeks ended July 31, 2021 and August 1, 2020, the opening loyalty program balance was $4.5 million and$2.6 million, respectively, of which $1.2 million and $1.2 million, respectively, was recognized as revenue during the respective periods. The value ofpoints redeemed through our loyalty program was $4.8 million and $2.4 million for the twenty-six weeks ended July 31, 2021 and August 1, 2020,respectively. For the twenty-six weeks ended July 31, 2021 and August 1, 2020, the opening loyalty program balance was $3.9 million and $2.4 million,respectively, of which $2.3 million and $1.2 million, respectively, was recognized as revenue during the respective periods.
Leases
We conduct all of our retail sales and corporate operations in leased facilities. Lease terms for our stores are generally for ten years (subject to electiveextensions) and provide for escalations in base rents. Many of our store leases contain one or more options to renew the lease at our sole discretion.Generally, we do not consider any additional renewal periods to be reasonably certain of being exercised.
Most store leases include tenant allowances from landlords, rent escalation clauses and/or contingent rent provisions. Certain leases provide for additionalrent based on a percentage of sales and annual rent increases generally based upon the Consumer Price Index. In addition, most of our store leases are netleases, which typically require us to be responsible for certain property operating expenses, including property taxes, insurance, common area maintenance,in addition to base rent. Many of our store leases contain certain co-tenancy provisions that permit us to pay rent based on a pre-determined percentage ofsales when the occupancy of the retail center falls below minimums established in the lease. For non-cancelable operating lease agreements, operating leaseassets and operating lease liabilities are established for leases with an expected term greater than one year and we recognize lease expense on a straight-linebasis. Contingent rent, determined based on a percentage of sales in excess of specified levels, is recognized as rent expense when the achievement of thespecified sales that triggers the contingent rent is probable.
In response to stores being closed to the public as a result of the COVID-19 pandemic, we elected to withhold payment of our contractual lease obligationswith respect to certain stores for the periods we were unable to operate such stores. We have substantially completed negotiating COVID-19 related leaseconcessions for most of our stores, with less than 10 stores and $0.4 million of withheld rents remaining unresolved as of July 31, 2021. These agreementshave generally resulted in a combination of rent abatements and/or rent deferrals. With respect to all of our stores, we continue to have ongoingconversations with our landlords generally regarding what we believe to be commercially reasonable lease concessions given the current environment. Wehave considered the Financial Accounting Standards Board's (“FASB”) guidance regarding COVID-19 lease concessions and have elected to account forthe lease concessions that have been granted as lease modifications.
We lease approximately 172,000 square feet of office and warehouse space (10 and 12 Whatney, Irvine, California) from a company that is owned by theco-founders of Tillys. During the thirteen and twenty-six week periods ended July 31, 2021, we incurred rent expense of $0.5 million and $1.0 million,respectively, related to this lease. During the thirteen and twenty-six week periods ended August 1, 2020, we incurred rent expense of $0.6 million and$1.1 million, respectively, related to this lease. Our lease began in January 1, 2003 and terminates on December 31, 2027.
We lease approximately 26,000 square feet of office and warehouse space (11 Whatney, Irvine, California) from a company that is owned by one of the co-founders of Tillys. During each of the thirteen and twenty-six week periods ended July 31, 2021 and August 1, 2020, we incurred rent expense of$0.1 million and $0.2 million, respectively, related to this lease. Pursuant to
14

Table of Contents
the lease agreement, the lease payment adjusts annually based upon the Los Angeles/Anaheim/Riverside Urban Consumer Price Index, with the adjustmentnot to be below 3% nor exceed 7% in any one annual increase. The lease began on June 29, 2012 and terminates on June 30, 2022.
We lease approximately 81,000 square feet of office and warehouse space (17 Pasteur, Irvine, California) from a company that is owned by one of the co-founders of Tillys. We use this property as our e-commerce distribution center. During the thirteen and twenty-six week periods ended July 31, 2021, weincurred rent expense of $0.2 million and $0.5 million, respectively, relate to this lease. During the thirteen and twenty-six week periods ended August 1,2020, we incurred rent expense of $0.3 million and $0.5 million, respectively, related to this lease. Pursuant to the lease agreement, the lease paymentadjusts annually based upon the Los Angeles/Anaheim/Riverside Urban Consumer Price Index, with the adjustment not to be below 3% nor exceed 7% inany one annual increase. The lease began on November 1, 2011 and terminates on October 31, 2021. We expect to have a fully negotiated renewalcompleted in advance of lease expiration.
The maturity of operating lease liabilities as of July 31, 2021 were as follows (in thousands):
Fiscal Year Related Party Other Total2021 $ 1,417 $ 33,076 $ 34,493 2022 2,246 62,432 64,678 2023 2,168 51,904 54,072 2024 2,233 41,225 43,458 2025 2,300 32,170 34,470 Thereafter 4,393 61,304 65,697
Total minimum lease payments 14,757 282,111 296,868 Less: Amount representing interest 1,813 46,015 47,828
Present value of operating lease liabilities $ 12,944 $ 236,096 $ 249,040
As of July 31, 2021, additional operating lease contracts that have not yet commenced are approximately $2.9 million. Further, additional operating leasecontract modifications executed subsequent to the balance sheet date, but prior to the filing date, are approximately $3.6 million.
Lease expense for the thirteen and twenty-six week periods ended July 31, 2021 and August 1, 2020 was as follows (in thousands):
Thirteen Weeks EndedJuly 31, 2021
Thirteen Weeks EndedAugust 1, 2020
Cost of goodssold SG&A Total Cost of goods
sold SG&A Total
Fixed operating lease expense $ 14,841 $ 416 $ 15,257 $ 14,886 $ 402 $ 15,288 Variable lease expense 4,835 11 4,846 4,425 28 4,453
Total lease expense $ 19,676 $ 427 $ 20,103 $ 19,311 $ 430 $ 19,741
Twenty-Six Weeks EndedJuly 31, 2021
Twenty-Six Weeks EndedAugust 1, 2020
Cost of goodssold SG&A Total Cost of goods
sold SG&A Total
Fixed operating lease expense $ 30,057 $ 825 $ 30,882 $ 30,400 $ 803 $ 31,203 Variable lease expense 8,735 1 8,736 8,244 50 8,294
Total lease expense $ 38,792 $ 826 $ 39,618 $ 38,644 $ 853 $ 39,497
15

Table of Contents
Supplemental lease information for the twenty-six weeks ended July 31, 2021 and August 1, 2020 was as follows:
Twenty-Six Weeks EndedJuly 31, 2021
Twenty-Six Weeks EndedAugust 1, 2020
Cash paid for amounts included in the measurement of operating leaseliabilities (in thousands) $34,452 $20,446Weighted average remaining lease term (in years) 5.5 years 5.9 yearsWeighted average interest rate (1) 6.40% 4.26%
(1) Since our leases do not provide an implicit rate, we used our incremental borrowing rate ("IBR") on date of adoption, at lease inception, or lease modification in determining the present valueof future minimum payments.
During the second quarter of fiscal 2021, we corrected an immaterial error in our balance sheets as of January 30, 2021 and August 1, 2020, whereby wepreviously presented our operating lease assets on a net basis rather than presenting any negative operating lease asset balances as an operating leaseliability. As such, we have presented the corrected balances herein as of January 30, 2021 and August 1, 2020, for which there was a $2.0 million and $1.0million gross-up of both operating lease assets and operating lease liabilities as of the respective dates. Further, we have presented the corrected Statementof Cash Flows for the twenty-six weeks ended August 1, 2020 for which there was no net impact on net cash provided by operating activities.
Income Taxes
Our income tax expense was $9.7 million, or 23.7% of pre-tax income, compared to an income tax benefit of $(7.8) million, or 39.3% of pre-tax loss, forthe twenty-six weeks ended July 31, 2021 and August 1, 2020, respectively. The decrease in the effective income tax rate was primarily due to deferredincome tax benefits of $1.0 million derived from employee stock option exercise activity this year and the prior year impact of the CARES Act, whichprovided for net operating losses in fiscal 2020 to be carried back to earlier tax years with higher tax rates.
New Accounting Standards Not Yet Adopted
In June 2016, the FASB issued Accounting Standards Update ("ASU") No. 2016-13, Measurement of Credit Losses on Financial Instruments (ASU 2016-13), which modifies or replaces existing models for impairment of trade and other receivables, debt securities, loans, beneficial interests held as assets,purchased-credit impaired financial assets and other instruments. The new standard requires entities to measure expected losses over the life of the assetand recognize an allowance for estimated credit losses upon recognition of the financial instrument. ASU 2016-13 will become effective for us in the firstquarter of fiscal 2023, with early adoption permitted and must be adopted using the modified retrospective method. We expect the new rules to apply to ourfixed income securities recorded at amortized cost and classified as held-to-maturity and our trade receivables. We do not expect the adoption of this newstandard to have a material impact on our consolidated financial statements and related disclosures.
In December 2019, the FASB issued ASU No. 2019-12, Simplifying the Accounting of Income Taxes ("ASU 2019-12"), which enhances and simplifiesvarious aspects of income tax accounting guidance. The guidance is effective for annual periods after December 15, 2020. The Company adopted ASU2019-12 in the first quarter of fiscal 2021. The impact this guidance has on our consolidated financial statements and related disclosures is immaterial.
In March 2020, the FASB issued ASU No. 2020-04, Reference Rate Reform (Topic 848): Facilitation of the Effects of Reference Rate Reform on FinancialReporting, which provides optional expedients and exceptions for applying GAAP to contracts, hedging relationships, and other transactions affected byreference rate reform if certain criteria are met. The amendments apply only to contracts, hedging relationships, and other transactions that referenceLondon Interbank Offered Rate ("LIBOR") or another reference rate expected to be discontinued because of reference rate reform. The amendments areeffective for all entities as of March 12, 2020 through December 31, 2022. We are currently evaluating the impact this guidance may have on ourconsolidated financial statements and related disclosures.
Note 3: Marketable Securities
Marketable securities as of July 31, 2021 consisted of commercial paper, classified as available-for-sale, and fixed income securities, classified as held-to-maturity as we have the intent and ability to hold them to maturity. Our investments in commercial paper and fixed income securities are recorded at fairvalue and amortized cost, respectively, which approximates fair value. All of our marketable securities are less than one year from maturity.
16

Table of Contents
The following table summarizes our investments in marketable securities at July 31, 2021, January 30, 2021 and August 1, 2020 (in thousands):
July 31, 2021
Cost or
Amortized CostGross Unrealized
Holding Gains
GrossUnrealized
HoldingLosses
EstimatedFair Value
Commercial paper $ 59,962 $ 16 $ — $ 59,978 Fixed income securities 6,666 — — 6,666
Total marketable securities $ 66,628 $ 16 $ — $ 66,644
January 30, 2021
Cost or
Amortized CostGross Unrealized
Holding Gains
GrossUnrealized
HoldingLosses
EstimatedFair Value
Commercial paper $ 64,928 $ 28 $ (1) $ 64,955 Total marketable securities $ 64,928 $ 28 $ (1) $ 64,955
August 1, 2020
Cost or Amortized Cost
Gross UnrealizedHolding Gains
GrossUnrealized
HoldingLosses
EstimatedFair Value
Commercial paper $ 9,973 $ 1 $ — $ 9,974 Fixed income securities 5,965 — — 5,965 Total marketable securities $ 15,938 $ 1 $ — $ 15,939
We recognized gains on investments for commercial paper that matured during the thirteen and twenty-six week periods ended July 31, 2021 and August 1,2020. Upon recognition of the gains, we reclassified these amounts out of Accumulated Other Comprehensive Income and into “Other income (expense),net” on the Consolidated Statements of Operations.
The following table summarizes our gains on investments for commercial paper (in thousands):
Thirteen Weeks Ended Twenty-Six Weeks EndedJuly 31,
2021August 1,
2020July 31,
2021August 1,
2020Gains on investments $ 43 $ 302 $ 72 $ 554
Note 4: Asset-Backed Credit Facility
On November 9, 2020 (the “Closing Date”), we entered into an asset-backed credit agreement (the “Credit Agreement”) with Wells Fargo Bank, NationalAssociation ("Bank"), as lender, administrative agent and collateral agent (the “Agent”). The Credit Agreement replaced our then-existing amended andrestated credit agreement (the “Prior Credit Agreement”), dated as of May 3, 2012, as amended, with the Agent.
The Credit Agreement provides for an asset-based, senior secured revolving credit facility of up to $65.0 million consisting of revolving loans, letters ofcredit and swing line loans provided by lenders, with a sub limit on credit outstanding at any time of $10.0 million and a sub limit for swing line loans of$7.5 million. The Credit Agreement also includes an uncommitted accordion feature whereby we may increase the revolving commitment by an aggregateamount not to exceed $12.5 million, subject to certain conditions. The revolving facility matures on November 9, 2023. The payment and performance infull of the secured obligations under the revolving facility are secured by a lien on and security interest in all of the assets of our Company.
17

Table of Contents
The maximum borrowings permitted under the revolving facility is equal to the lesser of (x) the revolving commitment and (y) the borrowing base. Theborrowing base is equal to (a) 90% of the borrower's eligible credit card receivables, plus (b) 90% of the cost of the borrower's eligible inventory, lessinventory reserves established by the Agent, and adjusted by the appraised value of such eligible inventory, plus (c) 90% of the cost of the borrower'seligible in-transit inventory, less inventory reserves established by the Agent, and adjusted by the appraised value of such eligible in-transit inventory (notto exceed 10% of the total amount of all eligible inventory included in the borrowing base) less (d) reserves established by the Agent. As of the ClosingDate, we were eligible to borrow up to a total of $40.1 million under the revolving facility. As of the Closing Date, we had no outstanding borrowingsunder the Credit Agreement and the only utilization of the letters of credit sub limit under the Credit Agreement was a $2.0 million irrevocable standbyletter of credit, which was previously issued under the Prior Credit Agreement and was transferred on the Closing Date to the Credit Agreement.
The unused portion of the revolving commitment accrues a commitment fee, which ranges from 0.375% to 0.50% per annum, based on the average dailyborrowing capacity under the revolving facility over the applicable fiscal quarter. Borrowings under the revolving facility bear interest at a rate per annumthat ranges from the LIBOR rate plus 2.0% to the LIBOR rate plus 2.25%, or the base rate plus 1.0% to the base rate plus 1.25%, based on the averagedaily borrowing capacity under the revolving facility over the applicable fiscal quarter. We may elect to apply either the LIBOR rate or base rate interest toborrowings at our discretion, other than in the case of swing line loans, to which the base rate shall apply.
Under the Credit Agreement, we are subject to a variety of affirmative and negative covenants of types customary in an asset-based lending facility,including a financial covenant relating to availability, and customary events of default. Prior to the first anniversary of the Closing Date, we are prohibitedfrom declaring or paying any cash dividends to our respective stockholders or repurchasing of our own common stock. After the first anniversary of theClosing Date, we are allowed to declare and pay cash dividends to our respective stockholders and repurchase our own common stock, provided, amongother things, no default or event of default exists as of the date of any such payment and after giving effect thereto and certain minimum availability andminimum projected availability tests are satisfied.
On June 8, 2021, we entered into a Consent Agreement authorizing us to declare and pay cash dividends to our shareholders of up to $31 million in theaggregate on or before July 31, 2021. We paid a one-time special cash dividend of $1.00 per share on July 9, 2021, to all holders of record of issued andoutstanding common stock in the aggregate of $30.7 million.
In connection with the entry into the Credit Agreement, on November 9, 2020, we entered into certain ancillary agreements, including (i) a securityagreement in favor of the Agent, and (ii) a guaranty by us in favor of the Agent. The security agreement and the guaranty replaced (i) the general pledgeagreement, dated as of May 3, 2012, by us in favor of the bank, (ii) the continuing guaranty by us in favor of the Agent, dated May 3, 2012, and (iii) theamended and restated security agreement with respect to equipment and the amended and restated security agreement with respect to rights to payment andinventory, in each case, dated as of May 3, 2012.
As of July 31, 2021, we were in compliance with all of our covenants, were eligible to borrow up to a total of $63.0 million, and had no outstandingborrowings under the Credit Agreement.
The Prior Credit Agreement was terminated concurrently with the entry into the Credit Agreement. No borrowings were outstanding under the Prior CreditAgreement as of the Closing Date. The interest rate charged on borrowings under the Prior Credit Agreement was selected at our discretion at the time ofdraw between LIBOR plus 0.75%, or at the Bank’s prime rate. The Prior Credit Agreement was secured by substantially all of our assets. In March 2020,we borrowed $23.7 million under our Prior Credit Agreement, which represented the maximum borrowings permitted thereunder, and which weresubsequently repaid in September 2020.
Note 5: Commitments and Contingencies
From time to time, we may become involved in lawsuits and other claims arising from our ordinary course of business. We are currently unable to predictthe ultimate outcome, determine whether a liability has been incurred or make an estimate of the reasonably possible liability that could result from anunfavorable outcome because of the uncertainties related to the incurrence, amount and range of loss on any pending litigation or claim. Because of theunpredictable nature of these matters, we cannot provide any assurances regarding the outcome of any litigation or claim to which we are a party or that theultimate outcome of any of the matters threatened or pending against us, including those disclosed below, will not have a material adverse effect on ourfinancial condition, results of operations or cash flows.
18

Table of Contents
Juan Carlos Gonzales, on behalf of himself and all others similarly situated, v. Tilly’s Inc. et al, Superior Court of California, County of Orange, Case No.30-2017-00948710-CU-OE-CXC. In October 2017, the plaintiff filed a putative class action against us, alleging various violations of California’s wage andhour laws. The complaint seeks class certification, unspecified damages, unpaid wages, penalties, restitution, interest, and attorneys’ fees and costs. InDecember 2017, we filed an answer to the complaint, denying all of the claims and asserting various defenses. In April 2018, the plaintiff filed a separateaction under the Private Attorneys General Act ("PAGA") against us seeking penalties on behalf of himself and other similarly situated employees for thesame alleged violations of California's wage and hour laws. We requested the plaintiff to dismiss the class action claims based on an existing class actionwaiver in an arbitration agreement which plaintiff signed with our co-defendant, BaronHR, the staffing company that employed plaintiff to work at theCompany. In June 2018, the plaintiff's class action complaint was dismissed. The parties mediated the PAGA case with a well-respected mediator in March2020. Although the case did not settle at the mediation, the parties have agreed to continue their settlement discussions with the assistance of the mediator.The court has not yet issued a trial date. By agreement between co-defendant BaronHR and Tilly's, BaronHR is required to indemnify us for all of ourlosses and expenses incurred in connection with this matter. We have defended this case vigorously, and will continue to do so. We believe that a loss iscurrently not probable or estimable under ASC 450, “Contingencies,” and no accrual has been made with regard to the verdict.
Skylar Ward, on behalf of herself and all others similarly situated, v. Tilly’s, Inc., Superior Court of California, County of Los Angeles, Case No.BC595405. In September 2015, the plaintiff filed a putative class action lawsuit against us alleging, among other things, various violations of California'swage and hour laws. The complaint sought class certification, unspecified damages, unpaid wages, penalties, restitution, and attorneys' fees. In June 2016,the court granted our demurrer to the plaintiff's complaint on the grounds that the plaintiff failed to state a cause of action against us and dismissed thecomplaint. Specifically, the court agreed with us that the plaintiff's cause of action for reporting-time pay fails as a matter of law as the plaintiff and otherputative class members did not "report for work" with respect to certain shifts on which the plaintiff's claims are based. In November 2016, the courtentered a written order sustaining our demurrer to the plaintiff's complaint and dismissing all of plaintiff’s causes of action with prejudice. In January 2017,the plaintiff filed an appeal of the order to the California Court of Appeal. In February 2019, the Court of Appeal issued an opinion overturning the trialcourt’s decision, holding that the plaintiff’s allegations stated a claim. In March 2019, we filed a petition for review with the California Supreme Courtseeking its discretionary review of the Court of Appeal’s decision. The California Supreme Court declined to review the Court of Appeal’s decision. Sincethe case was remanded back to the trial court, the parties have been engaged in discovery. In March 2020, the plaintiff filed a motion for class certification.In July 2020, we filed our opposition to the motion for class certification. In September 2020, the plaintiff filed her reply brief in support of the motion forclass certification. In October 2020, the court denied plaintiff's motion for class certification. In December 2020, the plaintiff filed a notice of appeal of thecourt's order denying her motion for class certification. We have defended this case vigorously, and will continue to do so. We believe that a loss iscurrently not probable or estimable under ASC 450, “Contingencies,” and no accrual has been made with regard to the verdict.
Note 6: Fair Value Measurements
We determine fair value based on a three-level valuation hierarchy as described below. Fair value is defined as the exit price associated with the sale of anasset or transfer of a liability in an orderly transaction between market participants at the measurement date. The three-level hierarchy of inputs used todetermine fair value is as follows:
• Level 1 – Quoted prices in active markets for identical assets and liabilities.
• Level 2 – Inputs other than Level 1 that are observable, either directly or indirectly, such as quoted prices for similar assets and liabilities;quoted prices in markets that are not active; or other inputs that are observable or can be corroborated by observable market data for substantiallythe full term of the assets or liabilities.
• Level 3 – Unobservable inputs (i.e., projections, estimates, interpretations, etc.) that are supported by little or no market activity and thatare significant to the fair value of the assets or liabilities.
We measure certain financial assets at fair value on a recurring basis, including our marketable securities, which are classified as available-for-sale, andcertain cash equivalents, specifically money market securities, and commercial paper. The money market accounts are valued based on quoted marketprices in active markets. The marketable securities are valued based on other observable inputs for those securities (including market corroborated pricingor other models that utilize observable inputs such as interest rates and yield curves) based on information provided by independent third-party entities.
From time to time, we measure certain assets at fair value on a non-recurring basis, including evaluation of long-lived assets for impairment usingCompany specific assumptions which would fall within Level 3 of the fair value hierarchy.
Fair value calculations contain significant judgments and estimates, which may differ from actual results due to, among other things, economic conditions,changes to the business model or changes in operating performance.
19

Table of Contents
During the thirteen and twenty-six week periods ended July 31, 2021 and August 1, 2020, we did not make any transfers between Level 1 and Level 2financial assets. Furthermore, as of July 31, 2021, January 30, 2021 and August 1, 2020, we did not have any Level 3 financial assets. We conduct reviewson a quarterly basis to verify pricing, assess liquidity and determine if significant inputs have changed that would impact the fair value hierarchy disclosure.
Financial Assets
We have categorized our financial assets based on the priority of the inputs to the valuation technique for the instruments as follows (in thousands):
July 31, 2021 January 30, 2021 August 1, 2020Level 1 Level 2 Level 3 Level 1 Level 2 Level 3 Level 1 Level 2 Level 3
Cash equivalents (1):Money market securities $ 63,097 $ — $ — $ 67,115 $ — $ — $ 128,036 $ — $ —
Marketable securities:Commercial paper $ — $ 59,978 $ — $ — $ 64,955 $ — $ — $ 9,974 $ —
(1) Excluding cash.
Impairment of Long-Lived Assets
An impairment is recorded on a long-lived asset used in operations whenever events or changes in circumstances indicate that the net carrying amounts forsuch asset may not be recoverable. Important factors that could result in an impairment review include, but are not limited to, significant under-performance relative to historical or planned operating results, significant changes in the manner of use of the assets, a decision to relocate or permanentlyclose a store, or significant changes in our business strategies.
An evaluation is performed using estimated undiscounted future cash flows from operating activities compared to the carrying value of related assets forthe individual stores. If the undiscounted future cash flows are less than the carrying value, an impairment loss is recognized for the difference between thecarrying value and the estimated fair value of the assets based on the discounted cash flows of the assets using a rate that approximates our weightedaverage cost of capital. With regard to retail store assets, which are comprised of leasehold improvements, fixtures, computer hardware and software, andoperating lease assets, we consider the assets at each individual retail store to represent an asset group. In addition, we have considered the relevantvaluation techniques that could be applied without undue cost and effort and have determined that the discounted estimated future cash flow approachprovides the most relevant and reliable means by which to determine fair value in this circumstance.
On a quarterly basis, we assess whether events or changes in circumstances have occurred that potentially indicate the carrying value of long-lived assetsmay not be recoverable. During the twenty-six weeks ended July 31, 2021, based on Level 3 inputs of historical operating performance, including salestrends, gross margin rates, current cash flows from operations and the projected outlook for each of our stores, we determined that 1 of our stores would notbe able to generate sufficient cash flows over the remaining term of the related lease to recover our investment in the respective store. As a result, werecorded $0.1 million impairment charges to write-down the carrying value of certain long-lived store assets to their estimated fair values.
Thirteen Weeks Ended Twenty-Six Weeks EndedJuly 31,
2021August 1,
2020July 31,
2021August 1,
2020($ in thousands)
Carrying value of assets with impairment $176 $570 $176 $903Fair value of assets impaired $40 $— $40 $—Number of stores tested for impairment 3 37 11 40Number of stores with impairment 1 7 1 10
* Not applicable
20

Table of Contents
Note 7: Share-Based Compensation
The Tilly's, Inc. 2012 Second Amended and Restated Equity and Incentive Plan, as amended in June 2020 (the "2012 Plan"), authorizes up to 6,613,900shares for issuance of options, shares or rights to acquire our Class A common stock and allows for, among other things, operating income and comparablestore sales growth targets as additional performance goals that may be used in connection with performance-based awards granted under the 2012 Plan. Asof July 31, 2021, there were 2,272,522 shares available for future issuance under the 2012 Plan.
Stock Options
We grant stock options to certain employees that give them the right to acquire our Class A common stock under the 2012 Plan. The exercise price ofoptions granted is equal to the closing price per share of our stock at the date of grant. The non qualified options vest at a rate of 25% on each of the firstfour anniversaries of the grant date provided that the award recipient continues to be employed by us through each of those vesting dates, and expire tenyears from the date of grant.
The following table summarizes the stock option activity for the twenty-six weeks ended July 31, 2021 (aggregate intrinsic value in thousands):
StockOptions
Grant DateWeightedAverage
Exercise Price
WeightedAverage
RemainingContractual
Life (in Years)
AggregateIntrinsicValue (1)
Outstanding at January 31, 2021 2,602,212 $ 8.19 Granted 508,700 $ 10.79 Exercised (1,154,258) $ 7.86 Forfeited (258,886) $ 9.31 Expired (32,000) $ 16.26 Outstanding at July 31, 2021 1,665,768 $ 8.88 7.9 $ 10,014 Exercisable at July 31, 2021 485,355 $ 10.47 5.1 $ 2,208 (1) Intrinsic value for stock options is defined as the difference between the market price of our Class A common stock on the last business day of the fiscal period and the weighted average
exercise price of in-the-money stock options outstanding at the end of the fiscal period. The market value per share was $14.83 at July 31, 2021.
The stock option awards were measured at fair value on the grant date using the Black-Scholes option valuation model. Key input assumptions used toestimate the fair value of stock options include the exercise price of the award, the expected option term, expected volatility of our stock over the option’sexpected term, the risk-free interest rate over the option’s expected term and our expected annual dividend yield, if any. We account for forfeitures as theyoccur. We will issue shares of Class A common stock when the options are exercised.
The fair values of stock options granted during the thirteen and twenty-six weeks ended July 31, 2021 and August 1, 2020 were estimated on the grant dateusing the following assumptions:
Thirteen Weeks Ended Twenty-Six Weeks Ended
July 31,
2021August 1,
2020July 31,
2021August 1,
2020Weighted average grant-date fair value per option granted $8.56 $3.62 $5.67 $2.11Expected option term (1) 5.6 years 5.5 years 5.4 years 5.3 yearsWeighted average expected volatility factor (2) 59.4% 59.7% 59.9% 57.3%Weighted average risk-free interest rate (3) 0.9% 0.5% 0.9% 0.4%Expected annual dividend yield (4) —% —% —% —%
(1) The expected option term of the awards represents the estimated time that options are expected to be outstanding based upon historical option data.(2) Stock volatility for each grant is measured using the historical daily price changes of our common stock over the most recent period equal to the expected option term
of the awards.(3) The risk-free interest rate is determined using the rate on treasury securities with the same term as the expected life of the stock option as of the grant date.(4) We do not currently have a dividend policy.
21
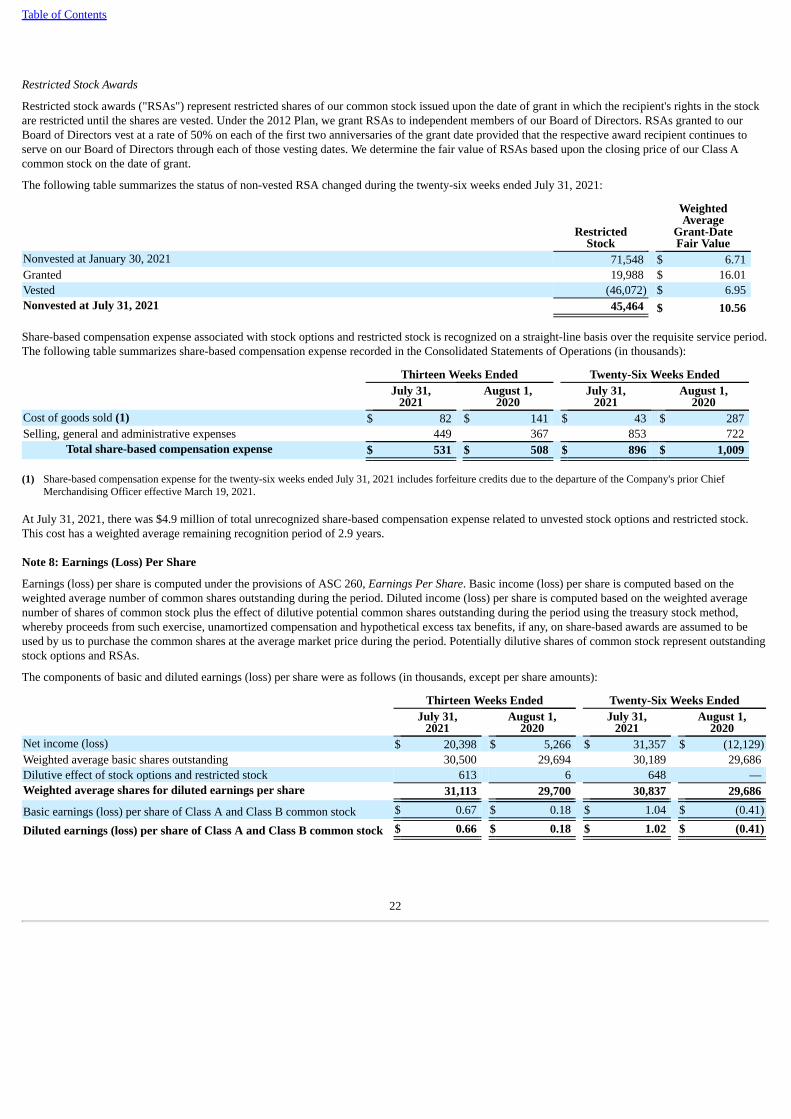
Table of Contents
Restricted Stock Awards
Restricted stock awards ("RSAs") represent restricted shares of our common stock issued upon the date of grant in which the recipient's rights in the stockare restricted until the shares are vested. Under the 2012 Plan, we grant RSAs to independent members of our Board of Directors. RSAs granted to ourBoard of Directors vest at a rate of 50% on each of the first two anniversaries of the grant date provided that the respective award recipient continues toserve on our Board of Directors through each of those vesting dates. We determine the fair value of RSAs based upon the closing price of our Class Acommon stock on the date of grant.
The following table summarizes the status of non-vested RSA changed during the twenty-six weeks ended July 31, 2021:
RestrictedStock
WeightedAverage
Grant-DateFair Value
Nonvested at January 30, 2021 71,548 $ 6.71 Granted 19,988 $ 16.01 Vested (46,072) $ 6.95 Nonvested at July 31, 2021 45,464 $ 10.56
Share-based compensation expense associated with stock options and restricted stock is recognized on a straight-line basis over the requisite service period.The following table summarizes share-based compensation expense recorded in the Consolidated Statements of Operations (in thousands):
Thirteen Weeks Ended Twenty-Six Weeks Ended
July 31,
2021August 1,
2020July 31,
2021August 1,
2020Cost of goods sold (1) $ 82 $ 141 $ 43 $ 287 Selling, general and administrative expenses 449 367 853 722
Total share-based compensation expense $ 531 $ 508 $ 896 $ 1,009
(1) Share-based compensation expense for the twenty-six weeks ended July 31, 2021 includes forfeiture credits due to the departure of the Company's prior ChiefMerchandising Officer effective March 19, 2021.
At July 31, 2021, there was $4.9 million of total unrecognized share-based compensation expense related to unvested stock options and restricted stock.This cost has a weighted average remaining recognition period of 2.9 years.
Note 8: Earnings (Loss) Per Share
Earnings (loss) per share is computed under the provisions of ASC 260, Earnings Per Share. Basic income (loss) per share is computed based on theweighted average number of common shares outstanding during the period. Diluted income (loss) per share is computed based on the weighted averagenumber of shares of common stock plus the effect of dilutive potential common shares outstanding during the period using the treasury stock method,whereby proceeds from such exercise, unamortized compensation and hypothetical excess tax benefits, if any, on share-based awards are assumed to beused by us to purchase the common shares at the average market price during the period. Potentially dilutive shares of common stock represent outstandingstock options and RSAs.
The components of basic and diluted earnings (loss) per share were as follows (in thousands, except per share amounts):
Thirteen Weeks Ended Twenty-Six Weeks Ended
July 31,
2021August 1,
2020July 31,
2021August 1,
2020Net income (loss) $ 20,398 $ 5,266 $ 31,357 $ (12,129)Weighted average basic shares outstanding 30,500 29,694 30,189 29,686 Dilutive effect of stock options and restricted stock 613 6 648 — Weighted average shares for diluted earnings per share 31,113 29,700 30,837 29,686
Basic earnings (loss) per share of Class A and Class B common stock $ 0.67 $ 0.18 $ 1.04 $ (0.41)
Diluted earnings (loss) per share of Class A and Class B common stock $ 0.66 $ 0.18 $ 1.02 $ (0.41)
22

Table of Contents
The following stock options have been excluded from the calculation of diluted earnings (loss) per share as the effect of including these stock optionswould have been anti-dilutive (in thousands):
Thirteen Weeks Ended Twenty-Six Weeks EndedJuly 31,
2021August 1,
2020July 31,
2021August 1,
2020Stock options 659 2,593 803 2,593 Restricted stock 20 51 20 72
Total 679 2,644 823 2,665
23

Table of Contents
Item 2. Management’s Discussion and Analysis of Financial Condition and Results of Operations
The following discussion and analysis of the financial condition and results of our operations should be read together with the financial statements andrelated notes of Tilly’s, Inc. included in Part I Item 1 of this Quarterly Report on Form 10-Q and with our audited consolidated financial statements and therelated notes included in our Annual Report on Form 10-K for the fiscal year ended January 30, 2021. As used in this Quarterly Report on Form 10-Q,except where the context otherwise requires or where otherwise indicated, the terms “the Company”, “World of Jeans & Tops”, “we”, “our”, “us”,"Tillys" and “Tilly’s” refer to Tilly’s, Inc. and its subsidiary.
Overview
Tillys is a destination specialty retailer of casual apparel, footwear, accessories and hardgoods for young men, young women, boys and girls. We believe webring together an unparalleled selection of iconic global, emerging, and proprietary brands rooted in an active and outdoor lifestyle. The Tillys conceptbegan in 1982, when our co-founders, Hezy Shaked and Tilly Levine, opened our first store in Orange County, California. As of July 31, 2021, we operated244 stores in 33 states, averaging approximately 7,300 square feet per store, compared to 238 total stores last year at this time, of which 33 Californiastores were temporarily closed as a result of government response to the COVID-19 pandemic. We also sell our products through our e-commerce website,www.tillys.com.
Known or Anticipated Trends
As of the date of filing this Quarterly Report on Form 10-Q (this "Report"), there remain many uncertainties regarding the ongoing COVID-19 pandemic(the "pandemic"), including the anticipated duration and severity of the pandemic, particularly in light of ongoing vaccination efforts and emerging variantstrains of the virus. To date, the pandemic has had far-reaching impacts on many aspects of the operations of the Company, directly and indirectly,including on consumer behavior, store traffic, operational capabilities and our operations generally, timing of deliveries, demands on our informationtechnology and e-commerce capabilities, inventory and expense management, managing our workforce, our storefront configurations and operations uponreopening, and our people, which have materially disrupted our business and the market generally. The scope and nature of these impacts continue toevolve. With the current resurgence of COVID-19, we may experience adverse impacts in the future, including similar impacts we have previouslyexperienced during the pandemic, such as regional quarantines, labor stoppages and shortages, changes in consumer purchasing patterns, mandatory orelective shut-downs of retail locations, disruptions to supply chains, including the inability of our suppliers and service providers to deliver materials andservices on a timely basis, or at all, severe market volatility, liquidity disruptions, and overall economic instability, which, in many cases, had, and may inthe future continue to have, material adverse impacts on our business, financial condition and results of operations. This situation is continually evolving,and additional impacts may arise that we are not aware of currently, or current impacts may become magnified. As a result, we cannot reliably predictfuture business trends with any certainty at this time.
How We Assess the Performance of Our Business
In assessing the performance of our business, we consider a variety of performance and financial measures. The key indicators of the financial conditionand operating performance of our business are net sales, comparable store sales, gross profit, selling, general and administrative expenses and operatingincome.
Net Sales
Net sales reflect revenue from the sale of our merchandise at store locations and through e-commerce, net of sales taxes. Store sales are reflected in saleswhen the merchandise is received by the customer. For e-commerce sales, we recognize revenue, and the related cost of goods sold at the time themerchandise is shipped to the customer. Net sales also include shipping and handling fees for e-commerce shipments that have been shipped to thecustomer. Net sales are net of returns on sales during the period as well as an estimate of returns expected in the future stemming from current period sales.We recognize revenue from gift cards as they are redeemed for merchandise. Prior to redemption, we maintain a current liability for unredeemed gift cardbalances. Our gift cards do not have expiration dates and in most cases there is no legal obligation to remit unredeemed gift cards to relevant jurisdictions.Based on actual historical redemption patterns, we determined that a small percentage of gift cards are unlikely to be redeemed (which we refer to as"breakage"). Based on our historical gift card breakage rate, we recognize breakage revenue over the redemption period in proportion to actual gift cardredemptions. Net sales are also adjusted for the unredeemed awards and accumulated partial points on our customer loyalty program.
Our business is seasonal and as a result our revenues fluctuate from quarter to quarter. In addition, our revenues in any given quarter can be affected by anumber of factors including the timing of holidays and weather patterns. The third and fourth quarters of the fiscal year, which include the back-to-schooland holiday sales seasons, have historically produced stronger sales and disproportionately stronger operating results than have the first two quarters of thefiscal year.
24

Table of Contents
Comparable Store Sales
Comparable store sales is a measure that indicates the change in year-over-year comparable store sales which allows us to evaluate how our store base isperforming. Numerous factors affect our comparable store sales, including:
• overall economic trends;• our ability to attract traffic to our stores and e-commerce platform;• our ability to identify and respond effectively to consumer preferences and fashion trends;• competition;• the timing of our releases of new and seasonal styles;• changes in our product mix;• pricing;• the level of customer service that we provide in stores and through our e-commerce platform;• our ability to source and distribute products efficiently;• calendar shifts of holiday or seasonal periods;• the number and timing of new store openings and the relative proportion of new stores to mature stores; and• the timing and success of promotional and advertising efforts.
Historically, our comparable store sales are sales from our e-commerce platform and stores open at least 12 full fiscal months as of the end of the currentreporting period. However, as a result of the COVID-19 pandemic, our comparable store sales this fiscal year are defined as sales from our e-commerceplatform and stores open on a daily basis compared to the same respective fiscal dates of last year. A remodeled, relocated or refreshed store is included incomparable store sales, both during and after construction, if the square footage of the store used to sell merchandise was not changed by more than 20%and the store was not closed for remodel for more than five days in any fiscal month. We include sales from our e-commerce platform as part ofcomparable store sales as we manage and analyze our business on a single omni-channel basis and have substantially integrated our investments andoperations for our stores and e-commerce platform to give our customers seamless access and increased ease of shopping. Comparable store sales excludegift card breakage income and e-commerce shipping and handling fee revenue. Some of our competitors and other retailers may calculate comparable or“same store” sales differently than we do. As a result, data in this report regarding our comparable store sales may not be comparable to similar data madeavailable by other retailers.
Gross Profit
Gross profit is equal to our net sales less our cost of goods sold. Cost of goods sold reflects the direct cost of purchased merchandise as well as buying,distribution and occupancy costs. Buying costs include compensation and benefit expense for our internal buying organization. Distribution costs includecosts for receiving, processing and warehousing our store merchandise, and shipping of merchandise to or from our distribution and e-commercefulfillment centers and to our e-commerce customers and between store locations. Occupancy costs include the rent, common area maintenance, utilities,property taxes, security and depreciation costs of all store locations. These costs are significant and can be expected to continue to increase as our companygrows. The components of our reported cost of goods sold may not be comparable to those of other retail companies.
We regularly analyze the components of gross profit as well as gross profit as a percentage of net sales. Specifically we look at the initial markup onpurchases, markdowns and reserves, shrinkage, buying costs, distribution costs and occupancy costs. Any inability to obtain acceptable levels of initialmarkups, a significant increase in our use of markdowns or a significant increase in inventory shrinkage or inability to generate sufficient sales leverage onthe buying, distribution and occupancy components of cost of goods sold could have an adverse impact on our gross profit and results of operations.
Gross profit is also impacted by shifts in the proportion of sales of proprietary branded products compared to third-party branded products, as well as bysales mix shifts within and between brands and between major product departments such as mens apparel, womens apparel, footwear or accessories. Asubstantial shift in the mix of products could have a material impact on our results of operations. In addition, gross profit and gross profit as a percentage ofnet sales have historically been higher in the third and fourth quarters of the fiscal year, as these periods include the back-to-school and winter holidayselling seasons. In those periods, various costs, such as occupancy costs, generally do not increase in proportion to the seasonal sales increase.
25

Table of Contents
Selling, General and Administrative Expenses
Our selling, general and administrative, or SG&A, expenses are composed of store selling expenses and corporate-level general and administrativeexpenses. Store selling expenses include store and regional support costs, including personnel, advertising and debit and credit card processing costs, e-commerce receiving and processing costs and store supplies costs. General and administrative expenses include the payroll and support costs of corporatefunctions such as executive management, legal, accounting, information systems, human resources, impairment charges and other centralized services.Store selling expenses generally vary proportionately with net sales and store growth. In contrast, general and administrative expenses are generally notdirectly proportional to net sales and store growth, but will be expected to increase over time to support the needs of our growing company. SG&Aexpenses as a percentage of net sales are usually higher in lower volume periods and lower in higher volume periods.
Operating Income (Loss)
Operating income (loss) equals gross profit less SG&A expenses. Operating income (loss) excludes interest income, interest expense and income taxes.Operating income (loss) percentage measures operating income (loss) as a percentage of our net sales.
We believe that drawing specific conclusions from comparative financial performance against fiscal 2020 results may be misleading given the variousimpacts of the COVID-19 pandemic. Further, it is challenging to predict future performance trends with any certainty due to many continuing unknowablefactors in the current environment. These factors include but are not limited to:
• how the pandemic may continue to impact consumer habits;• how the continuation or cessation of federal or state/local stimulus payments may continue to impact consumer spending;• how store performance will compare relative to fiscal 2020 or fiscal 2019 over a longer period of time, particularly against last year’s strong
results upon the initial reopening of stores which occurred on a staggered basis over several months;• how our e-commerce business will perform relative to the significant increases in e-commerce net sales we experienced during the varying periods
of store closures during fiscal 2020;• whether or not we will have a more typical back-to-school season this year, which typically begins in late July; and• whether any of the first quarter business we did in traditional back-to-school product categories will represent a pull-forward of normal back-to-
school spending or if these first quarter sales will be incremental to the normal back-to-school season.
The extent to which the COVID-19 pandemic and our response thereto may impact our business, financial condition, and results of operations will dependon future developments, which are highly uncertain and cannot be predicted at this time. For more details, see Item 1A. “Risk Factors - Risks Related toOur Business” within our most recently filed Annual Report on Form 10-K.
26

Table of Contents
Results of Operations
The following tables summarize key components of our unaudited results of operations for the periods indicated, both in dollars (in thousands) and as apercentage of our net sales: Thirteen Weeks Ended Twenty-Six Weeks Ended
July 31,
2021August 1,
2020July 31,
2021August 1,
2020Statements of Operations Data:Net sales $ 201,952 $ 135,845 $ 365,109 $ 213,134 Cost of goods sold 127,225 94,171 235,543 169,866 Gross profit 74,727 41,674 129,566 43,268 Selling, general and administrative expenses 48,300 33,965 88,265 63,960 Operating income (loss) 26,427 7,709 41,301 (20,692)Other (expense) income, net (102) 311 (218) 720 Income (loss) before income taxes 26,325 8,020 41,083 (19,972)Income tax expense (benefit) 5,927 2,754 9,726 (7,843)Net income (loss) $ 20,398 $ 5,266 $ 31,357 $ (12,129)
Percentage of Net Sales:Net sales 100.0 % 100.0 % 100.0 % 100.0 %Cost of goods sold 63.0 % 69.3 % 64.5 % 79.7 %Gross profit 37.0 % 30.7 % 35.5 % 20.3 %Selling, general and administrative expenses 23.9 % 25.0 % 24.2 % 30.0 %Operating income (loss) 13.1 % 5.7 % 11.3 % (9.7)%Other (expense) income, net (0.1) % 0.2 % (0.1) % 0.3 %Income (loss) before income taxes 13.0 % 5.9 % 11.3 % (9.4)%Income tax expense (benefit) 2.9 % 2.0 % 2.7 % (3.7) %Net income (loss) 10.1 % 3.9 % 8.6 % (5.7)%
The following table presents store operating data for the periods indicated:
Thirteen Weeks Ended Twenty-Six Weeks Ended
July 31,
2021August 1,
2020July 31,
2021August 1,
2020Operating Data:Stores operating at end of period 244 238 244 238 Comparable store sales change (1) 10.6 % 8.3 % 9.5 % 8.6 %Total square feet at end of period (in thousands) 1,788 1,760 1,788 1,760 Average net sales per brick-and mortar store (inthousands) (2) $ 676 $ 352 $ 1,213 $ 550 Average net sales per square foot (2) $ 92 $ 48 $ 165 $ 74 E-commerce revenues (in thousands) (3) $ 37,326 $ 51,987 $ 72,807 $ 82,323 E-commerce revenues as a percentage of net sales 18.5 % 38.3 % 19.9 % 38.6 %(1) Comparable store sales from our e-commerce platform and stores open at least 12 full fiscal months as of the end of the current reporting period. However, as a result of the COVID-19
pandemic, our comparable store sales are defined as sales from our e-commerce platform and stores open on a daily basis compared to the same respective fiscal dates last year. Aremodeled or relocated store is included in comparable store sales, both during and after construction, if the square footage of the store used to sell merchandise was not changed by morethan 20% and the store was not closed for remodel for more than five days in any fiscal month. We include sales from our e-commerce platform as part of our comparable store sales as wemanage and analyze our business as a single omni-channel and have substantially integrated our investments and operations for our stores and e-commerce platform to give our customersseamless access and increased ease or shopping. Comparable store sales exclude gift card breakage income, and e-commerce shipping and handling fee revenue.
(2) The number of stores and the amount of square footage reflect the number of days during the period that stores were open. E-commerce sales, e-commerce shipping and handling feerevenue and gift card breakage are excluded from net sales in deriving average net sales per retail store.
(3) E-commerce revenues include e-commerce sales and e-commerce shipping and handling fee revenue.
27

Table of Contents
Second Quarter (13 Weeks) Ended July 31, 2021 Compared to Second Quarter (13 Weeks) Ended August 1, 2020
Net Sales
Net sales were $202.0 million, an increase of $66.1 million, or 48.7%, compared to $135.8 million for the corresponding period last year.
◦ Net sales from physical stores were $164.6 million, an increase of $80.8 million or 96.3%, compared to $83.9 million last year, partially due to theimpact of the various periods of government-mandated store closures during last year's second quarter, which resulted in only 65% of total storeoperating days being available during that period last year. Net sales from stores represented 81.5% of total net sales compared to 61.7% of totalnet sales last year. The Company ended the second quarter with 244 total stores compared to 238 total stores at the end of the second quarter lastyear (33 of which were closed to the public at that time). During the second quarter of fiscal 2021, the Company opened six new stores.
◦ Net sales from e-commerce were $37.3 million, a decrease of $(14.7) million or (28.2)%, compared to $52.0 million last year, primarily due to theanniversary of last year's triple-digit e-commerce net sales growth during May and June last year during the period of significant government-mandated store closures. E-commerce net sales represented 18.5% of total net sales compared to 38.3% of total net sales last year.
Gross Profit
Gross profit was $74.7 million, or 37.0% of net sales, compared to $41.7 million, or 30.7% of net sales, last year. Buying, distribution and occupancy costsimproved by 800 basis points collectively, despite increasing by $1.7 million in total, due to leveraging these costs against higher net sales. Product marginsdecreased 170 basis points as a percentage of net sales due to the anniversary of last year's strong full-price selling upon the initial reopening of storesrelative to certain inventory reserves applied to idle store inventory at the end of the first quarter last year when all stores were closed. Compared to fiscal2019’s second quarter, product margins improved by 190 basis points primarily due to lower markdowns.
Selling, General and Administrative Expenses
SG&A expenses were $48.3 million, or 23.9% of net sales, compared to $34.0 million, or 25.0% of net sales, for the corresponding period last year. Thecomponents of the SG&A variances, both in terms of percentage of net sales and total dollars, were as follows:
% $ millions Primarily Attributable to
2.1% $10.2 Increase in store payroll and related benefits due to operating all stores for the entirety of this year’s second quarterand serving a higher level of net sales.
1.4% 2.7 Corporate bonus accruals due to strong operating performance to date in fiscal 2021.(4.6)% 1.4 Net change in all other SG&A expenses.(1.1)% $14.3 Total
Operating Income
Operating income was $26.4 million, or 13.1% of net sales, compared to $7.7 million, or 5.7% of net sales, for the corresponding period last year. Theincrease in operating income was primarily due to the factors noted above.
Income Tax Expense
Income tax expense was $5.9 million, or 22.5% of pre-tax income, compared to $2.8 million, or 34.3% of pre-tax income, last year. The decrease in theeffective income tax rate was primarily due to deferred income tax benefits of $0.9 million derived from employee stock option exercise activity this yearand the prior year impact of the Coronavirus Aid, Relief, and Economic Security Act (the "CARES Act"), which provided for net operating losses in fiscal2020 to be carried back to earlier tax years with higher tax rates.
Net Income and Income Per Diluted Share
Net income was $20.4 million, or $0.66 per diluted share, which are records for any quarter since the Company became publicly-traded in 2012, comparedto $5.3 million, or $0.18 per diluted share, for the corresponding period last year primarily as a result of the factors noted above.
28

Table of Contents
First Half (26 Weeks) Ended July 31, 2021 Compared to First Half (26 Weeks) Ended August 1, 2020
Net Sales
Total net sales were $365.1 million, which represented an increase of $152.0 million or 71.3%, compared to $213.1 million last year.
• Net sales from physical stores were $292.3 million, an increase of $161.5 million or 123.5%, compared to $130.8 million last year, primarily dueto the impact of the various periods of government-mandated store closures last year as a result of the COVID-19 pandemic. Net sales from storesrepresented 80.1% of total net sales compared to 61.4% of total net sales last year.
◦ Net sales from e-commerce were $72.8 million, a decrease of $(9.5) million or (11.6)%, compared to $82.3 million last year, primarily due to theanniversary of last year's significant increases in e-commerce net sales during the various periods of government-mandated store closures. E-commerce net sales represented 19.9% of total net sales compared to 38.6% of total net sales last year.
Gross Profit
Gross profit was $129.6 million, or 35.5% of net sales, compared to $43.3 million, or 20.3% of net sales, last year. Buying, distribution and occupancycosts improved by 1300 basis points collectively, despite increasing by $3.2 million in total, due to leveraging these costs against higher net sales. Productmargins improved by 220 basis points primarily due to lower markdowns.
Selling, General and Administrative Expenses
SG&A was $88.3 million or 24.2% of net sales, compared to $64.0 million, or 30.0% of net sales, last year. The components of the SG&A variances, bothin terms of percentage of net sales and total dollars, were as follows:
% $ millions Primarily Attributable to
(0.3)% $16.4 Increase in store payroll and related benefits due to operating all stores for the entirety of the current year and servinghigher net sales.
1.2% 4.2 Corporate bonus accruals due to strong operating performance to date in fiscal 2021.
(1.1)% 2.2 Increase in corporate payroll and related benefits due to being more fully staffed this year compared to significantfurloughs and temporary management pay reductions last year.
(5.6)% 1.5 Net change in all other SG&A expenses.(5.8)% $24.3 Total
Operating Income (Loss)
Operating income improved to $41.3 million, or 11.3% of net sales, compared to an operating loss of $(20.7) million, or (9.7)% of net sales, for thecorresponding period last year. The increase in operating income was due to the factors noted above.
Income Tax Expense (Benefit)
Income tax expense was $9.7 million, or 23.7% of pre-tax income, compared to an income tax benefit of $(7.8) million, or 39.3% of pre-tax loss, last year.The decrease in the effective income tax rate was primarily due to deferred income tax benefits of $1.0 million derived from employee stock optionexercise activity this year and the prior year impact of the CARES Act, which provided for net operating losses in fiscal 2020 to be carried back to earliertax years with higher tax rates.
Net Income (Loss) and Income (Loss) Per Diluted Share
Net income improved to $31.4 million, or $1.02 per diluted share, compared to a net loss of $(12.1) million, or $(0.41) per share, for the correspondingperiod last year primarily as a result of the factors noted above.
Liquidity and Capital Resources
Our business relies on cash flows from operating activities as well as cash on hand as our primary sources of liquidity. We currently expect to financecompany operations, store growth and remodels with existing cash on hand, marketable securities and cash flows from operations.
In addition to cash and cash equivalents and marketable securities, the most significant components of our working capital are merchandise inventories,accounts payable and accrued expenses. We believe that cash flows from operating activities, our cash and marketable securities on hand, and credit facilityavailability will be sufficient to cover our working capital requirements and anticipated capital expenditures for the next 12 months from the filing of thisReport. If cash flows from
29

Table of Contents
operations are not sufficient or available to meet our capital requirements, then we will be required to obtain additional equity or debt financing in thefuture. There can be no assurance that equity or debt financing will be available to us when we need it or, if available, that the terms will be satisfactory tous and not dilutive to our stockholders.
Working Capital
Working capital at July 31, 2021, was $89.9 million compared to $78.0 million at January 30, 2021, an increase of $11.9 million. The changes in ourworking capital during the first half of fiscal 2021 were as follows:
$ millions Description$78.0 Working capital at January 30, 202138.1 Increase in cash, cash equivalents, and marketable securities, primarily due to higher net income.9.5 Increase primarily due to timing of income tax payments.
(30.7) Payment of special cash dividend.(6.7) Decrease primarily due to corporate bonus accruals and timing of accrued compensation and benefits.1.7 Other net increases.
$89.9 Working capital at July 31, 2021
Asset-Backed Credit Facility
On November 9, 2020 (the “Closing Date”), we entered into a credit agreement (the “Credit Agreement”) with Wells Fargo Bank, National Association("Bank"), as lender, administrative agent and collateral agent (the “Agent”). The Credit Agreement replaced our existing amended and restated creditagreement (the “Prior Credit Agreement”), dated as of May 3, 2012, as amended, with the Agent.
The Credit Agreement provides for an asset-based, senior secured revolving credit facility of up to $65.0 million consisting of revolving loans, letters ofcredit and swing line loans provided by lenders, with a sub limit on credit outstanding at any time of $10.0 million and a sub limit for swing line loans of$7.5 million. The Credit Agreement also includes an uncommitted accordion feature whereby we may increase the revolving commitment by an aggregateamount not to exceed $12.5 million, subject to certain conditions. The revolving facility matures on November 9, 2023. The payment and performance infull of the secured obligations under the revolving facility are secured by a lien on and security interest in all of the assets of our Company.
The maximum borrowings permitted under the revolving facility is equal to the lesser of (x) the revolving commitment and (y) the borrowing base. Theborrowing base is equal to (a) 90% of the borrower's eligible credit card receivables, plus (b) 90% of the cost of the borrower's eligible inventory, lessinventory reserves established by the Agent, and adjusted by the appraised value of such eligible inventory, plus (c) 90% of the cost of the borrower'seligible in-transit inventory, less inventory reserves established by the Agent, and adjusted by the appraised value of such eligible in-transit inventory (notto exceed 10% of the total amount of all eligible inventory included in the borrowing base) less (d) reserves established by the Agent. As of the ClosingDate, we were eligible to borrow up to a total of $40.1 million under the revolving facility. As of the Closing Date, we had no outstanding borrowingsunder the Credit Agreement and the only utilization of the letters of credit sub limit under the Credit Agreement was a $2.0 million irrevocable standbyletter of credit, which was previously issued under the Prior Credit Agreement and was transferred on the Closing Date to the Credit Agreement.
The unused portion of the revolving commitment accrues a commitment fee, which ranges from 0.375% to 0.50% per annum, based on the average dailyborrowing capacity under the revolving facility over the applicable fiscal quarter. Borrowings under the revolving facility bear interest at a rate per annumthat ranges from the LIBOR rate plus 2.0% to the LIBOR rate plus 2.25%, or the base rate plus 1.0% to the base rate plus 1.25%, based on the averagedaily borrowing capacity under the revolving facility over the applicable fiscal quarter. We may elect to apply either the LIBOR rate or base rate interest toborrowings at our discretion, other than in the case of swing line loans, to which the base rate shall apply.
Under the Credit Agreement, we are subject to a variety of affirmative and negative covenants of types customary in an asset-based lending facility,including a financial covenant relating to availability, and customary events of default. Prior to the first anniversary of the Closing Date, we are prohibitedfrom declaring or paying any cash dividends to our respective stockholders or repurchasing our own common stock. After the first anniversary of theClosing Date, we are allowed to declare and pay cash dividends to our respective stockholders and repurchase our own common stock, provided, amongother things, no default or event of default exists as of the date of any such payment and after giving effect thereto and certain minimum availability andminimum projected availability tests are satisfied.
On June 8, 2021, we entered into a Consent Agreement authorizing us to declare and pay cash dividends to our shareholders of up to $31 million in theaggregate on or before July 31, 2021. We paid a one-time special cash dividend of $1.00 per share on July 9, 2021, to all holders of record of issued andoutstanding common stock in the aggregate of $30.7 million.
30

Table of Contents
In connection with the entry into the Credit Agreement, on November 9, 2020, we entered into certain ancillary agreements, including (i) a securityagreement in favor of the Agent, and (ii) a guaranty by us in favor of the Agent. The security agreement and the guaranty replaced (i) the general pledgeagreement, dated as of May 3, 2012, by us in favor of the bank, (ii) the continuing guaranty by us in favor of the Agent, dated May 3, 2012, and (iii) theamended and restated security agreement with respect to equipment and the amended and restated security agreement with respect to rights to payment andinventory, in each case, dated as of May 3, 2012.
The Prior Credit Agreement was terminated concurrently with the entry into the Credit Agreement. No borrowings were outstanding under the Prior CreditAgreement as of the Closing Date. The interest rate charged on borrowings under the Prior Credit Agreement was selected at our discretion at the time ofdraw between LIBOR plus 0.75%, or at the Bank’s prime rate. The Prior Credit Agreement was secured by substantially all of our assets. In March 2020,we borrowed $23.7 million under our Prior Credit Agreement, which represented the maximum borrowings permitted thereunder, and which weresubsequently repaid in September 2020.
As of July 31, 2021, we were in compliance with all of our covenants, were eligible to borrow up to a total of $63.0 million and had no outstandingborrowings under the Credit Agreement.
Impact of CARES Act on Company Liquidity
On March 27, 2020, the CARES Act, was signed into law. The CARES Act includes tax provisions applicable to businesses, such as net operating losses,enhanced interest deductibility, optional deferral of deposits of payroll taxes, a refundable employee retention payroll tax credit and changes to thedepreciation rules for qualified improvement property. As of July 31, 2021, pursuant to the CARES Act, we have deferred the deposit of certain payrolltaxes, applied for certain tax credits and accelerated depreciation on qualified improvement property.
Cash Flow Analysis
A summary of operating, investing and financing activities for the twenty-six weeks of fiscal 2021 compared to the twenty-six weeks of fiscal 2020 isshown in the following table (in thousands):
Twenty-Six Weeks Ended
July 31,
2021August 1,
2020Net cash provided by operating activities $ 37,442 $ 18,843 Net cash (used in) provided by investing activities (10,097) 49,977 Net cash used in financing activities (21,635) (6,002)Net increase in cash and cash equivalents $ 5,710 $ 62,818
Net Cash Provided by Operating Activities
Operating activities consist primarily of net income (loss) adjusted for non-cash items, plus the effect on cash of changes during the period in our assets andliabilities.
Net cash flows provided by operating activities were $37.4 million this year compared to $18.8 million last year. The $18.6 million increase in cashprovided by operating activities was primarily due to higher net sales in fiscal 2021 due to the closure of all stores during the latter half of the first quarterlast year as a result of the COVID-19 pandemic. Other variances include increases in accrued compensation and benefits, partially offset by decreases inaccounts payable, net of merchandise inventories, operating lease liabilities and accrued expenses.
Net Cash (Used In) Provided By Investing Activities
Cash flows from investing activities consist primarily of capital expenditures and maturities and purchases of marketable securities.
Net cash used in investing activities was $10.1 million this year compared to $50.0 million provided by investing activities last year. Net cash used ininvesting activities in the first half of fiscal 2021 consisted of purchases of marketable securities of $66.6 million and capital expenditures totaling $8.5million, partially offset by the maturities of marketable securities of $65.0 million. Net cash provided by investing activities during the first half of fiscal2020 consisted of proceeds from the maturities of marketable securities of $70.2 million, partially offset by purchases of marketable securities of $16.0million and capital expenditures totaling $4.3 million.
Net Cash Used in Financing Activities
Financing activities primarily consist of cash dividend payments, borrowings and repayments of our line of credit, taxes paid in lieu of shares issued forshare based compensation and proceeds from employee exercises of stock options.
31

Table of Contents
Net cash used in financing activities was $21.6 million this year compared to $6.0 million last year. Financing activities in the first half of fiscal 2021consisted of dividends paid of $30.7 million, partially offset by proceeds from the exercise of stock options of $9.1 million. Financing activities in the firsthalf of fiscal 2020 consisted of dividends paid of $29.7 million, partially offset by $23.7 million of borrowings under the Prior Credit Agreement.
Contractual Obligations
As of July 31, 2021, there were no material changes to our contractual obligations as described in the “Management’s Discussion and Analysis of FinancialCondition and Results of Operations” section of our Annual Report on Form 10-K for the fiscal year ended January 30, 2021.
Off-Balance Sheet Arrangements
We are not a party to any off-balance sheet arrangements, except for purchase obligations and our revolving credit facility.
Critical Accounting Policies and Estimates
The preparation of financial statements in accordance with accounting principles generally accepted in the United States requires the appropriateapplication of certain accounting policies, some of which require us to make estimates and assumptions about future events and their impact on amountsreported in our consolidated financial statements. Since future events and their impact cannot be determined with absolute certainty, the actual results willinevitably differ from our estimates. As noted elsewhere in this Report, the COVID-19 pandemic has had significant, adverse impacts on our business andthe economy generally, making estimates and assumptions about future events far more difficult, if not impossible. A summary of our significantaccounting policies is included in Note 2 to the consolidated financial statements in our Annual Report on Form 10-K for the fiscal year ended January 30,2021.
Item 3. Quantitative and Qualitative Disclosures About Market Risk
As of July 31, 2021, there were no material changes in the market risks described in the “Quantitative and Qualitative Disclosure of Market Risks” sectionof our Annual Report on Form 10-K for the fiscal year ended January 30, 2021.
Item 4. Controls and Procedures
Evaluation of Disclosure Controls and Procedures
Our management, with the participation of our Disclosure Committee, including our Chief Executive Officer and our Chief Financial Officer, evaluated theeffectiveness of our disclosure controls and procedures as of July 31, 2021. The term “disclosure controls and procedures,” as defined in Rules 13a-15(e)and 15d-15(e) under the Exchange Act, means controls and other procedures of a company that are designed to ensure that information required to bedisclosed by a company in the reports that it files or submits under the Exchange Act is recorded, processed, summarized and reported, within the timeperiods specified in the SEC’s rules and forms. Disclosure controls and procedures include, without limitation, controls and procedures designed to ensurethat information required to be disclosed by a company in the reports that it files or submits under the Exchange Act is accumulated and communicated toour management, including its principal executive and principal financial officers, as appropriate to allow timely decisions regarding required disclosure.Based on the evaluation of our disclosure controls and procedures as of July 31, 2021, our Chief Executive Officer and Chief Financial Officer concludedthat, as of such date, our disclosure controls and procedures were effective at the reasonable assurance level.
Changes in Internal Control Over Financial Reporting
There was no change in our internal control over financial reporting identified in connection with the evaluation required by Rule 13a-15(d) and 15d-15(d)of the Exchange Act that occurred during the period covered by this Quarterly Report on Form 10-Q that has materially affected, or is reasonably likely tomaterially affect, our internal control over financial reporting.
Inherent Limitations on Effectiveness of Controls
Our management, including our Chief Executive Officer and Chief Financial Officer, believes that our disclosure controls and procedures and internalcontrol over financial reporting are designed to provide reasonable assurance of achieving their objectives and are effective at the reasonable assurancelevel. However, our management does not expect that our disclosure controls and procedures or our internal control over financial reporting will prevent allerrors and all fraud. A control system, no matter how well conceived and operated, can provide only reasonable, not absolute, assurance that the objectivesof the control system are met. Further, the design of a control system must reflect the fact that there are resource constraints, and the benefits of controlsmust be considered relative to their costs. Because of the inherent limitations in all control systems, no evaluation of controls can provide absoluteassurance that all control issues and instances of fraud, if any, have been detected.
32

Table of Contents
These inherent limitations include the realities that judgments in decision making can be faulty, and that breakdowns can occur because of a simple error ormistake. Additionally, controls can be circumvented by the individual acts of some persons, by collusion of two or more people or by management overrideof the controls. The design of any system of controls also is based in part upon certain assumptions about the likelihood of future events, and there can beno assurance that any design will succeed in achieving its stated goals under all potential future conditions; over time, controls may become inadequatebecause of changes in conditions, or the degree of compliance with policies or procedures may deteriorate. Because of the inherent limitations in a cost-effective control system, misstatements due to error or fraud may occur and not be detected.
33

Table of Contents
Part II. Other Information
Item 1. Legal Proceedings
The information contained in “Note 5: Commitments and Contingencies” to our consolidated financial statements included in this Report is incorporated byreference into this Item.
Item 1A. Risk Factors
We operate in a rapidly changing environment that involves a number of risks that could materially and adversely affect our business, financial condition,prospects, operating results or cash flows. In addition to the other information set forth in this Quarterly Report on Form 10-Q, please refer to the sectiontitled “Risk Factors” in our Annual Report on Form 10-K for the fiscal year ended January 30, 2021 for a detailed discussion of the risks that affect ourbusiness.
34

Table of Contents
Item 6. Exhibits
ExhibitNo. Description of Exhibit
10.1 Consent Agreement, dated June 8, 2021, between World of Jeans & Tops and Wells Fargo Bank, National Association (incorporated byreference to Exhibit 10.1 to the Registrant's Current Report on Form 8-K filed on June 9, 2021)
31.1* Certification of Chief Executive Officer pursuant to Rule 13a-14(a) of the Securities Exchange Act of 1934, as amended.
31.2* Certification of Chief Financial Officer pursuant to Rule 13a-14(a) of the Securities Exchange Act of 1934, as amended.
32.1** Certification of Chief Executive Officer and Chief Financial Officer pursuant to 18 U.S.C. Section 1350, as adopted pursuant to Section 906of the Sarbanes-Oxley Act of 2002.
101 Interactive data files from Tilly’s, Inc.’s Quarterly Report on Form 10-Q for the quarter ended July 31, 2021, formatted in iXBRL (InlineeXtensible Business Reporting Language): (i) the Consolidated Balance Sheets; (ii) the Consolidated Statements of Operations; (iii) theConsolidated Statements of Comprehensive Income (Loss); (iv) the Consolidated Statement of Stockholders’ Equity; (v) the ConsolidatedStatements of Cash Flows and (vi) Notes to the Consolidated Financial Statements.
104 Cover Page Interactive Data File (formatted as Inline XBRL and contained in Exhibit 101)
* Filed herewith.
** Furnished herewith and not “filed” for purposes of Section 18 of the Securities Exchange Act of 1934, as amended.
35

Table of Contents
SIGNATURES
Pursuant to the requirements of the Securities Exchange Act of 1934, the registrant has duly caused this report to be signed on its behalf by theundersigned, thereunto duly authorized.
Tilly’s, Inc.Date: September 8, 2021
/s/ Edmond ThomasEdmond ThomasPresident, Chief Executive Officer and Director(Principal Executive Officer)
Date: September 8, 2021/s/ Michael HenryMichael HenryExecutive Vice President, Chief Financial Officer(Principal Financial Officer)
36

Exhibit 31.1
CERTIFICATION OF CHIEF EXECUTIVE OFFICERPURSUANT TO RULE 13a-14(a)
OF THE SECURITIES EXCHANGE ACT OF 1934, AS AMENDED
I, Edmond Thomas, certify that:
1. I have reviewed this Quarterly Report on Form 10-Q of Tilly’s, Inc. for the quarter ended July 31, 2021;
2. Based on my knowledge, this report does not contain any untrue statement of a material fact or omit to state a material fact necessary to make thestatements made, in light of the circumstances under which such statements were made, not misleading with respect to the period covered by thisreport;
3. Based on my knowledge, the financial statements, and other financial information included in this report, fairly present in all material respects thefinancial condition, results of operations and cash flows of the registrant as of, and for, the periods presented in this report;
4. The registrant’s other certifying officer and I are responsible for establishing and maintaining disclosure controls and procedures (as defined inExchange Act Rules 13a-15(e) and 15d-15(e)) and internal control over financial reporting (as defined in Exchange Act Rules 13a-15(f) and 15d-15(f)) for the registrant and have:
(a) Designed such disclosure controls and procedures, or caused such disclosure controls and procedures to be designed under our supervision, toensure that material information relating to the registrant, including its consolidated subsidiaries, is made known to us by others within thoseentities, particularly during the period in which this report is being prepared;
(b) Designed such internal control over financial reporting, or caused such internal control over financial reporting to be designed under oursupervision, to provide reasonable assurance regarding the reliability of financial reporting and the preparation of financial statements forexternal purposes in accordance with generally accepted accounting principles;
(c) Evaluated the effectiveness of the registrant’s disclosure controls and procedures and presented in this report our conclusions about theeffectiveness of the disclosure controls and procedures, as of the end of the period covered by this report based on such evaluation; and
(d) Disclosed in this report any change in the registrant’s internal control over financial reporting that occurred during the registrant’s most recentfiscal quarter (the registrant’s fourth fiscal quarter in the case of an annual report) that has materially affected, or is reasonably likely tomaterially affect, the registrant’s internal control over financial reporting; and
5. The registrant’s other certifying officer and I have disclosed, based on our most recent evaluation of internal control over financial reporting, to theregistrant’s auditors and the audit committee of the registrant’s Board of Directors (or persons performing the equivalent functions):
(a) All significant deficiencies and material weaknesses in the design or operation of internal control over financial reporting which are reasonablylikely to adversely affect the registrant’s ability to record, process, summarize and report financial information; and
(b) Any fraud, whether or not material, that involves management or other employees who have a significant role in the registrant’s internalcontrol over financial reporting.
Date: September 8, 2021
/s/ Edmond ThomasEdmond ThomasPresident, Chief Executive Officer and Director

Exhibit 31.2
CERTIFICATION OF CHIEF FINANCIAL OFFICERPURSUANT TO RULE 13a-14(a)
OF THE SECURITIES EXCHANGE ACT OF 1934, AS AMENDED
I, Michael Henry, certify that:
1. I have reviewed this Quarterly Report on Form 10-Q of Tilly’s, Inc. for the quarter ended July 31, 2021;
2. Based on my knowledge, this report does not contain any untrue statement of a material fact or omit to state a material fact necessary to make thestatements made, in light of the circumstances under which such statements were made, not misleading with respect to the period covered by thisreport;
3. Based on my knowledge, the financial statements, and other financial information included in this report, fairly present in all material respects thefinancial condition, results of operations and cash flows of the registrant as of, and for, the periods presented in this report;
4. The registrant’s other certifying officer and I are responsible for establishing and maintaining disclosure controls and procedures (as defined inExchange Act Rules 13a-15(e) and 15d-15(e)) and internal control over financial reporting (as defined in Exchange Act Rules 13a-15(f) and 15d-15(f)) for the registrant and have:
(a) Designed such disclosure controls and procedures, or caused such disclosure controls and procedures to be designed under our supervision, toensure that material information relating to the registrant, including its consolidated subsidiaries, is made known to us by others within thoseentities, particularly during the period in which this report is being prepared;
(b) Designed such internal control over financial reporting, or caused such internal control over financial reporting to be designed under oursupervision, to provide reasonable assurance regarding the reliability of financial reporting and the preparation of financial statements forexternal purposes in accordance with generally accepted accounting principles;
(c) Evaluated the effectiveness of the registrant’s disclosure controls and procedures and presented in this report our conclusions about theeffectiveness of the disclosure controls and procedures, as of the end of the period covered by this report based on such evaluation; and
(d) Disclosed in this report any change in the registrant’s internal control over financial reporting that occurred during the registrant’s most recentfiscal quarter (the registrant’s fourth fiscal quarter in the case of an annual report) that has materially affected, or is reasonably likely tomaterially affect, the registrant’s internal control over financial reporting; and
5. The registrant’s other certifying officer and I have disclosed, based on our most recent evaluation of internal control over financial reporting, to theregistrant’s auditors and the audit committee of the registrant’s Board of Directors (or persons performing the equivalent functions):
(a) All significant deficiencies and material weaknesses in the design or operation of internal control over financial reporting which arereasonably likely to adversely affect the registrant’s ability to record, process, summarize and report financial information; and
(b) Any fraud, whether or not material, that involves management or other employees who have a significant role in the registrant’s internalcontrol over financial reporting.
Date: September 8, 2021
/s/ Michael HenryMichael HenryChief Financial Officer

Exhibit 32.1
CERTIFICATIONS OF CHIEF EXECUTIVE OFFICER AND CHIEF FINANCIAL OFFICERPURSUANT TO 18 U.S.C. SECTION 1350,
AS ADOPTED PURSUANT TOSECTION 906 OF THE SARBANES-OXLEY ACT OF 2002
In connection with the Quarterly Report on Form 10-Q for the fiscal quarter ended July 31, 2021 of Tilly’s, Inc. (the “Company”) as filed with theSecurities and Exchange Commission on the date hereof (the “Report”), I, Edmond Thomas, Chief Executive Officer of the Company, certify, pursuant to18 U.S.C. Section 1350, as adopted pursuant to Section 906 of the Sarbanes-Oxley Act of 2002, that:
(i) the Report fully complies with the requirements of Section 13(a) or 15(d) of the Securities Exchange Act of 1934, as amended; and(ii) the information contained in the Report fairly presents, in all material respects, the financial condition and results of operations of the Company.
Date: September 8, 2021
/s/ Edmond ThomasEdmond ThomasPresident, Chief Executive Officer and Director
In connection with the Quarterly Report on Form 10-Q for the fiscal quarter ended July 31, 2021 of Tilly’s, Inc. (the “Company”) as filed with theSecurities and Exchange Commission on the date hereof (the “Report”), I, Michael Henry, Chief Financial Officer of the Company, certify, pursuant to 18U.S.C. Section 1350, as adopted pursuant to Section 906 of the Sarbanes-Oxley Act of 2002, that:
(i) the Report fully complies with the requirements of Section 13(a) or 15(d) of the Securities Exchange Act of 1934, as amended; and(ii) the information contained in the Report fairly presents, in all material respects, the financial condition and results of operations of the Company.
Date: September 8, 2021
/s/ Michael HenryMichael HenryChief Financial Officer
The foregoing certifications are being furnished solely to accompany the Report pursuant to 18 U.S.C. Section 1350 and in accordance with SEC ReleaseNo. 33-8238. These certifications shall not be deemed “filed” for purposes of Section 18 of the Securities Exchange Act of 1934, as amended, nor shallthey be incorporated by reference in any filing of the Company under the Securities Act of 1933, as amended, whether made before or after the date hereof,regardless of any general incorporation language in such filing.