tim day in ny
TRANSCRIPT


Market data revenues was expected to overcome voice revenues in 2017…
Transformation is accelerating, adjustments underway to resume growth
2
… market trend anticipated for 2016 instead.
0%
25%
50%
75%
100%
2011 2012 2013 2014 2015e 2016e 2017e
Voice Revenues Data Revenues
2011 2012 2013 2014 2015e 2016e 2017e
Voice Revenues Data Revenues

Less relevance for community effect
Caring service with bad track record
Commoditization of offers
Market Reality....
Consumer behavior changing fast to data
Offer Repositioning: Addressing Opportunities in the New Environment
3
Market Stabilization
Market subscribers growth (%QoQ)
Mln subscribers
266 276 282
+0.6% +0.8%
-0.3%
2Q13 2Q14 2Q15

Protecting the Value of Our Customer Base (prepaid) , while increasing our base of value
customers.
…TIM NEW APPROACH
Free up and simplify offer and usage: (best value for money)
• Voice, Data and VAS • OTT offsetting community • Essence of TIM positioning • Still room for FMS
Improving customer experience
• Process transformation • Digital experience • Better network quality
Infrastructure as a key enabler
• Competitive network • Focus on 4G • 3G evolution + migration
Offer Repositioning: Addressing Opportunities in the New Environment
4

From volume to value in Prepaid
Strict Disconnection Policy Greater segmentation with Big-Data
Improving ARPU
Reducing OPEX
Back to offer differentiation
Revenue Share x Market Share
Focus on preference
42 85
351 476
362
836 719
63.2 63.1 62.7 62.3 61.9 61.1 60.3
JAN FEB MAR APR MAY JUN JUL
From Mass Offer… …to Offer by Need 2009 - 2013 2014 – 1H15 2H15 – 2016
Source: Anatel
Disconnections (in thd)
Prepaid Customer Base (in mln)
Per call
On net calls
R$0.30
Per month
R$12.00 WhatsApp
+50MB
Price per call
5
Per day
300min
R$0.75
R$0.99 15MB
+ WhatsApp +SMS
Per week
R$7.00 300min/day 10MB/day
+SMS +WhatsApp
Continuous Evolution

Back to the Value Game: First Results on Postpaid
Postpaid Acquisition
Source: Company
Acquisition Mix (%)
100% 100% HIGH value
LOW value
JAN-JUL AUGe
Improving share
YoY sales uplift
Focus on pre-post migration
All in one: Voice + Data w/o subsidy
Different market, different approach
ARPU uplift expected
Post-Post Migration to Liberty TOP (%)
6
20%
80%
Downgrade
Upgrade
JUN'15 JUL'15 AUG'15
Postpaid Liberty Top
Gross + Migrations Postpaid Share on Net Adds:
2Q14
2Q15
JUL’15

Infrastructure as the key enabler for offer repositioning
% Capex over sales (TIM) 1H15 - Capex Distribution (as % of total capex)
65%
Live TIM Other & Licenses Transmission 2G 3G + 4G
Access (+23% YoY)
Mix of Capex (%)
Capex Evolution (R$ mln; % YoY)
After working on TRANSMISSION, additional focus to ACCESS network
7
16.5% 17.5%
23.7%
1H13 1H14 1H15
16% 19%
Innovative
Traditional
1H14 1H15
2,108 1,654

Capex Driving Data growth
Data Traffic (Bytes of Use)
2Q14 2Q15
+32%
Data ARPU* (R$; %YoY)
2Q14 2Q15
+42%
4G Users (mln users; %YoY)
1.0
3.8
2Q14 2Q15
4x
8
Infrastructure as the key enabler for offer repositioning
Capex Evolution (R$ mln; % YoY)
Innovative
Traditional
1H14 1H15
2,108 1,654

9
+96%
3,009
3,091
3,098
3,206
P1
P4
P3
TIM
4G Sites in state capitals 4G Traffic*
jan/15 jul/15
~20% 4G / total traffic
~2.7x
*4G traffic in São Paulo, Rio de Janeiro, Belo Horizonte, Brasília and Curitiba.
4Q14 2Q15
3G Cities
2Q14 2Q15
3G Sites (% YoY)
+19%
1,623 1,365
>80% Urban population covered
2Q14 2Q15
Small Cells & Wi-Fi (% YoY)
New approach to coverage challenges
10
New approach to coverage challenges: Bio Site
2Q13 2Q14 2Q15
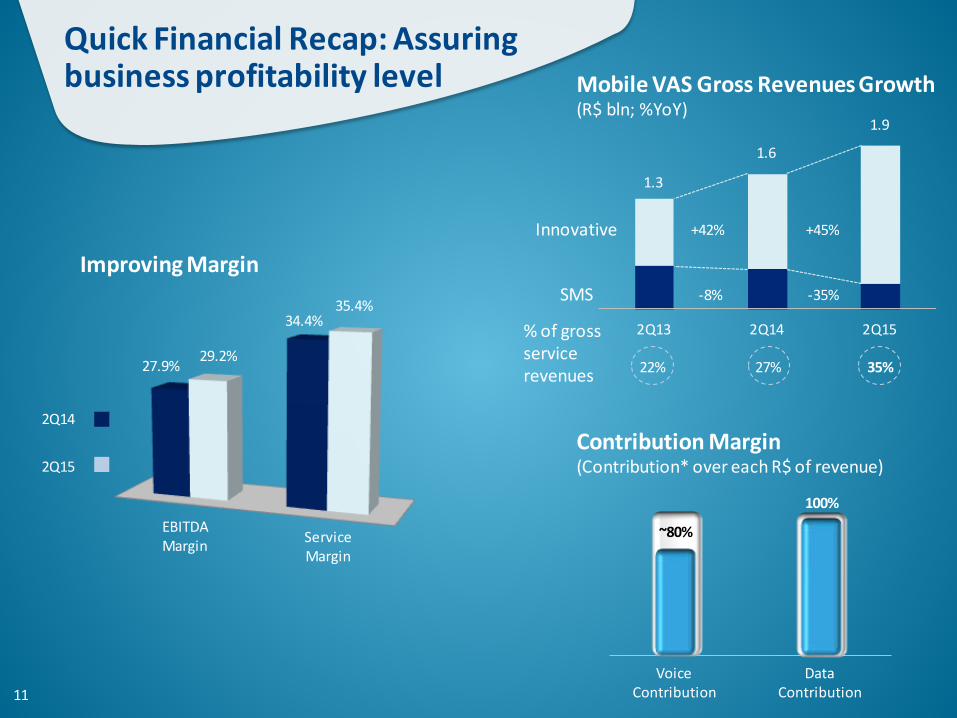
Quick Financial Recap: Assuring business profitability level
SMS
Innovative
Mobile VAS Gross Revenues Growth (R$ bln; %YoY)
+42% +45%
-35% -8%
1.3
1.9
1.6
% of gross service revenues 22% 27% 35%
Improving Margin
35.4% 34.4%
EBITDA Margin Service
Margin
Contribution Margin (Contribution* over each R$ of revenue)
Voice Contribution
Data Contribution
100%
~80%
29.2% 27.9%
2Q15
2Q14
11

More than R$1 bln in 3 years (sum of savings in 2015, 2016 and 2017)
Quick Financial Recap: Assuring business profitability level Opex Breakdown
(% YoY; R$mln Δ YoY)
Selling & Marketing
Bad Debt
G&A
ITX & Network
COGS
Personnel Expenses
-R$60
-R$73
-R$190
-R$50
-R$18
+R$34
-6%
-7%
-23%
+15%
-28%
-23%
Opt
imiz
atio
n/
Cont
rol
Stra
tegi
c So
urci
ng
Righ
tsiz
ing
Proc
ess
Engi
neer
ing
Busi
ness
M
odel
Improving Margin
EBITDA Margin Service
Margin
2Q15
2Q14
12
35.4% 34.4%
29.2% 27.9%

Challenges do not Deviate the Vision and Execution of our Long-Term Strategy
13
Protecting & Increasing Value of Customer Base Back to essence of TIM positioning Knowing our customers behaviors Segmented go to market while maintaining simplicity Smart pricing: differentiate offer in a rationale environment
Sustaining Investments on Data Infrastructure & Services Developing robust 4G infrastructure, to stimulate adoption and
market share Customer experience on an end-to-end approach

Underlying Asset Transformation Not Reflected in Price
Source: Company and Bloomberg
(EOP2011) (EOP2Q15)
Number of Sites (BTS) 11,335 14,781
15,833 3G & 4G Elements 6,476
% Sites with Fiber 27% 0%
Km of Fiber 61,232 28,891
14
22,677 21,499
1,458 2,582
Market Cap
Net debt Dec/11 Dec/12 Dec/13 Dec/14 Aug/15
Voice World Modest residual
value of cash flow
Data World Higher residual
value of cash flow
R$ 24,132 R$ 24,081 EV
4.2x 5.2x Consensus EV/EBITDA