timber mart-south & southern trends€¦ · timbermart-south. 1. southern timber trends. 9...
TRANSCRIPT
TimberMart-South 1
Southern Timber Trends9 March 2012
Four State Forestry on The GrowIdabel, Oklahoma
Thomas G. Harris, Jr., Jacek Siry. Sara Baldwin, Jonathan Smith & Robert Simmons
TimberMart-South 2
TimberMart-SouthCenter for Forest Business
D.B. Warnell School of Forest ResourcesThe University of Georgia
Thomas G. Harris, Jr. , Jacek Siry, Sara Baldwin, Jonathan Smith & Robert Simmons
TimberMart-South 3
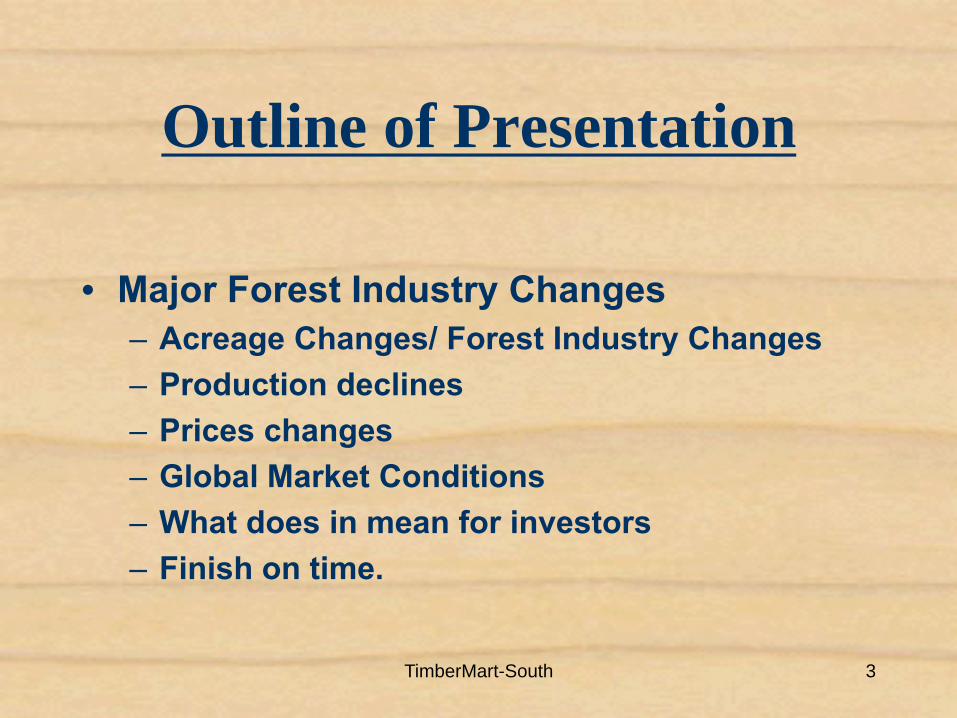
Outline of Presentation
• Major Forest Industry Changes– Acreage Changes/ Forest Industry Changes– Production declines– Prices changes– Global Market Conditions– What does in mean for investors– Finish on time.
TimberMart-South 4
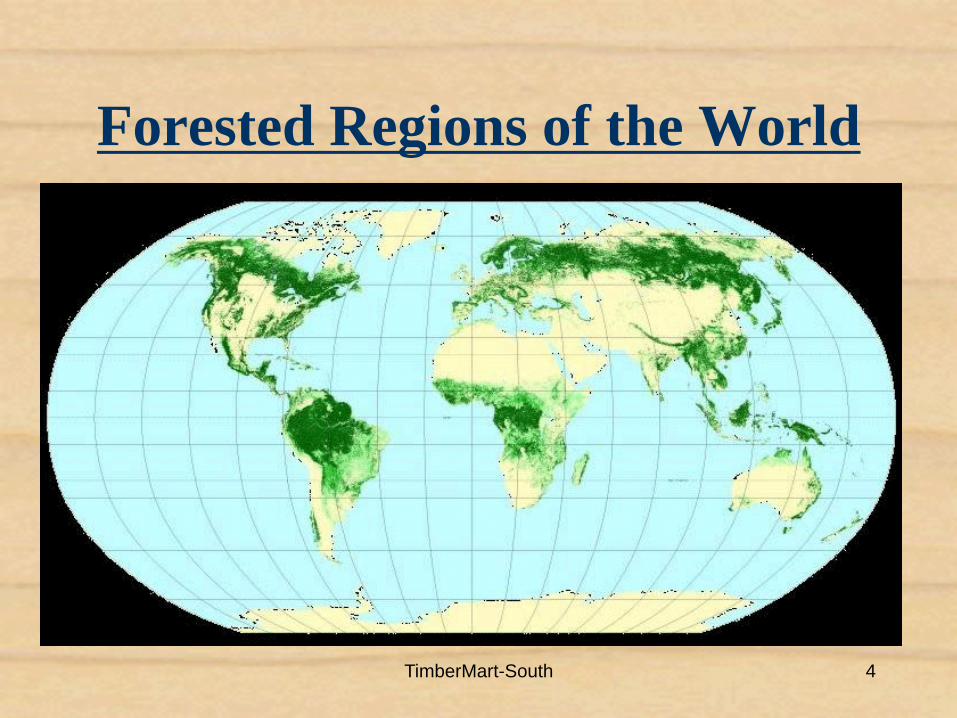
Forested Regions of the World
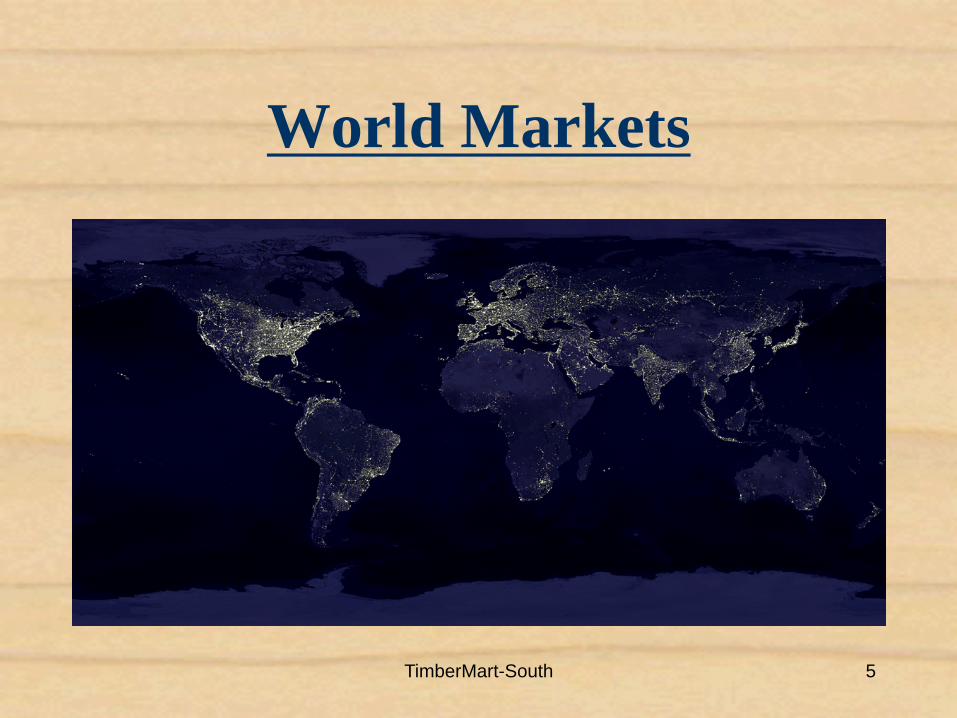
TimberMart-South 5
World Markets
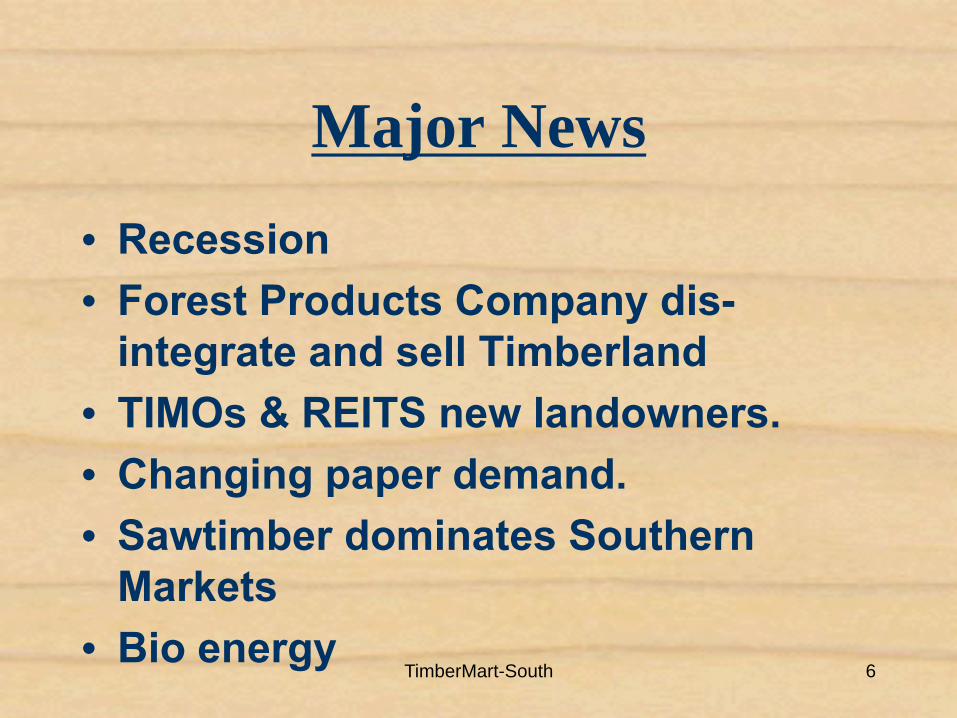
Major News
• Recession• Forest Products Company dis-
integrate and sell Timberland• TIMOs & REITS new landowners.• Changing paper demand.• Sawtimber dominates Southern
Markets• Bio energy
TimberMart-South 6
TimberMart-South 7
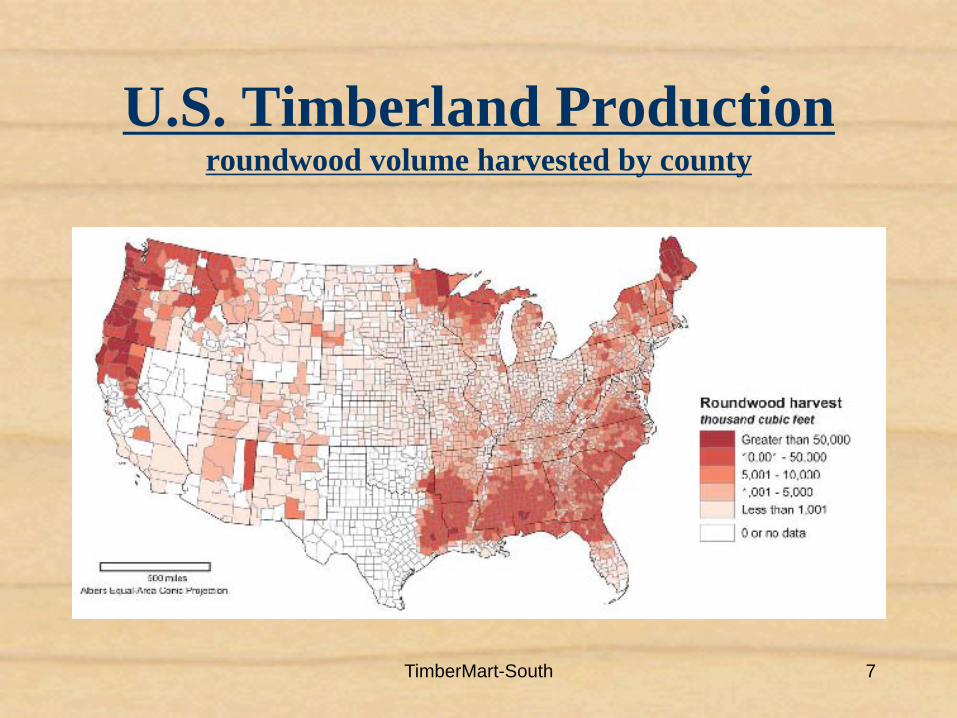
U.S. Timberland Production roundwood volume harvested by county
TimberMart-South 8
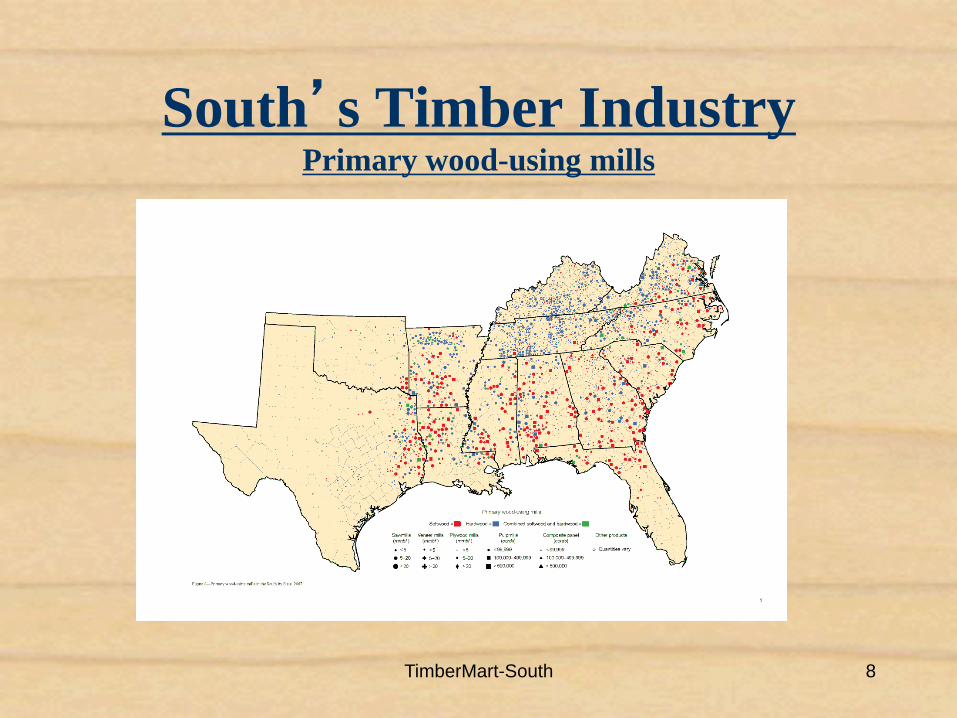
South’s Timber IndustryPrimary wood-using mills
TimberMart-South 9
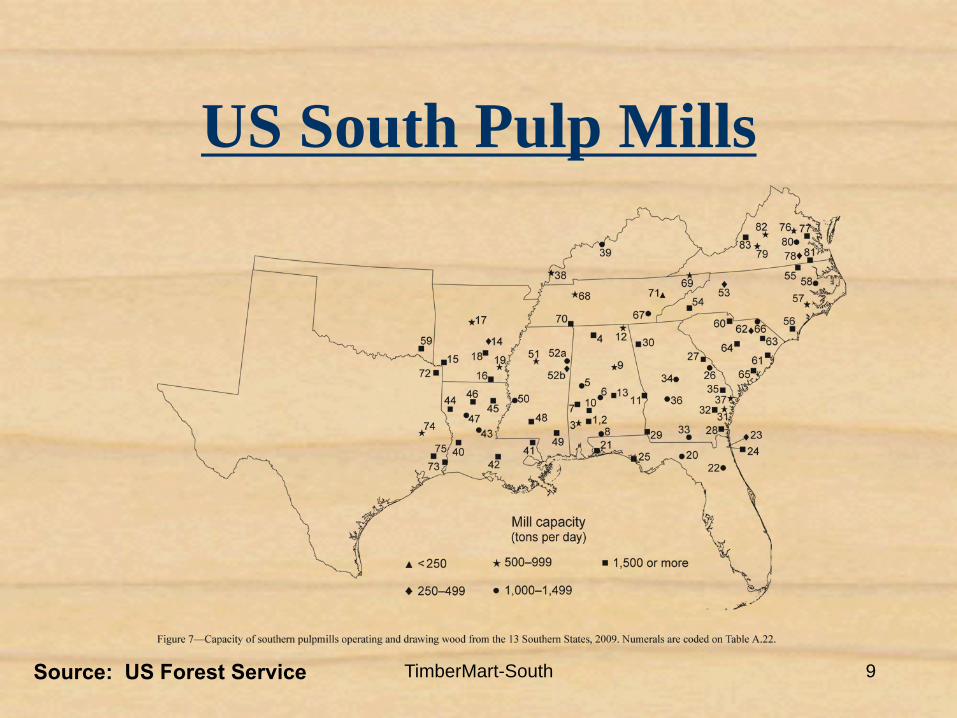
US South Pulp Mills
Source: US Forest Service
TimberMart-South 10
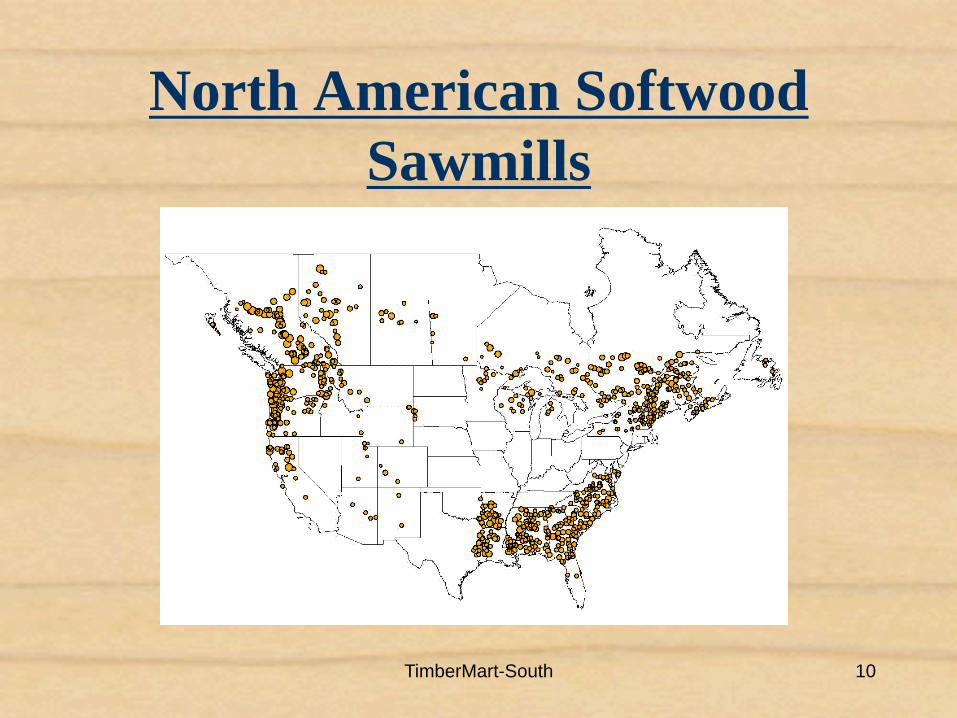
North American Softwood Sawmills
TimberMart-South 11
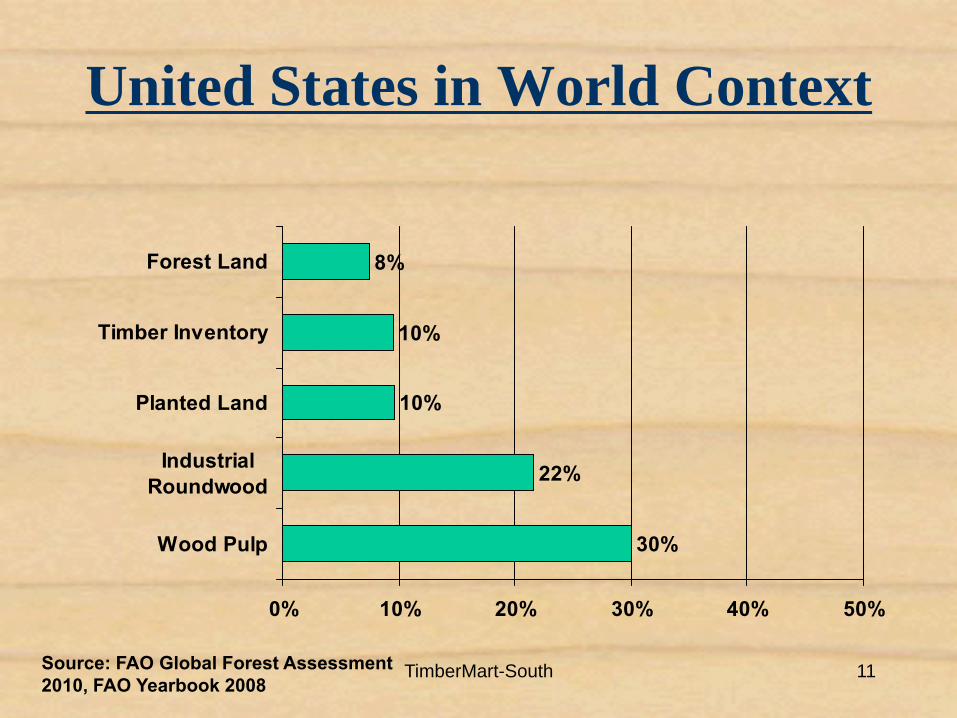
United States in World Context
8%
10%
10%
22%
30%
0% 10% 20% 30% 40% 50%
Forest Land
Timber Inventory
Planted Land
IndustrialRoundwood
Wood Pulp
Source: FAO Global Forest Assessment 2010, FAO Yearbook 2008
TimberMart-South 12
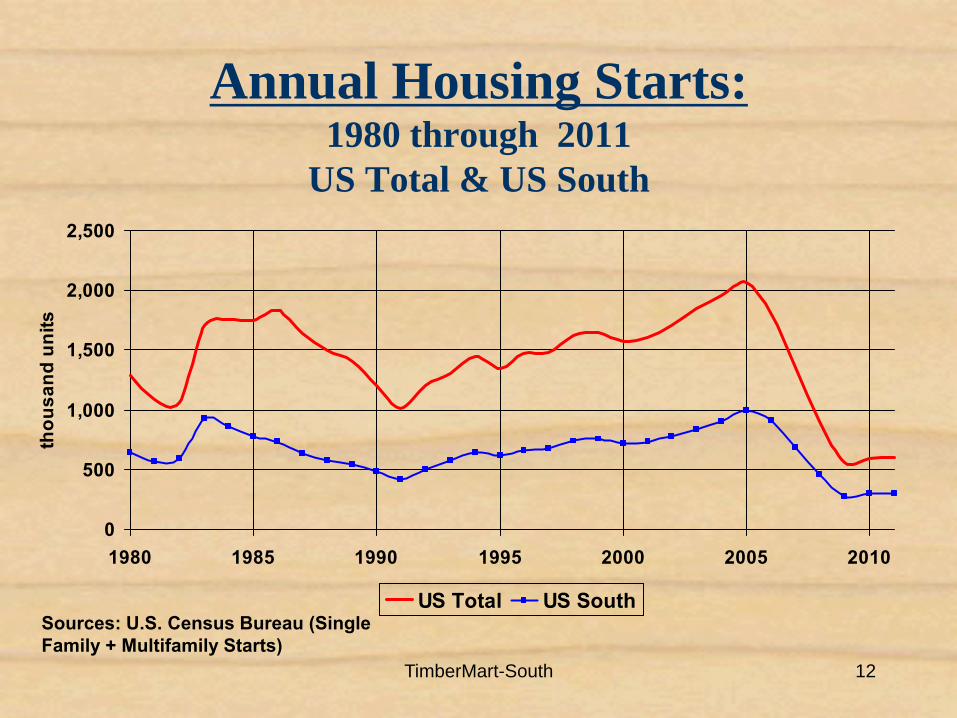
Annual Housing Starts:1980 through 2011
US Total & US South
0
500
1,000
1,500
2,000
2,500
1980 1985 1990 1995 2000 2005 2010
thou
sand
uni
ts
US Total US SouthSources: U.S. Census Bureau (Single Family + Multifamily Starts)
TimberMart-South 13
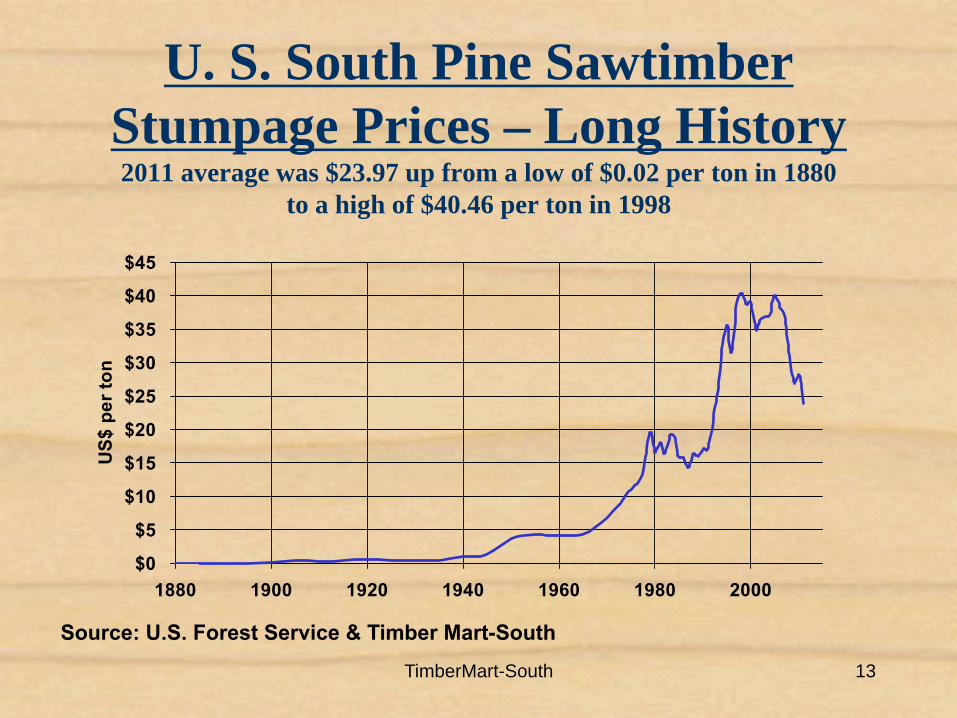
U. S. South Pine Sawtimber Stumpage Prices – Long History2011 average was $23.97 up from a low of $0.02 per ton in 1880
to a high of $40.46 per ton in 1998
$0
$5
$10
$15
$20
$25
$30
$35
$40
$45
1880 1900 1920 1940 1960 1980 2000
US$
per
ton
Source: U.S. Forest Service & Timber Mart-South
TimberMart-South 14
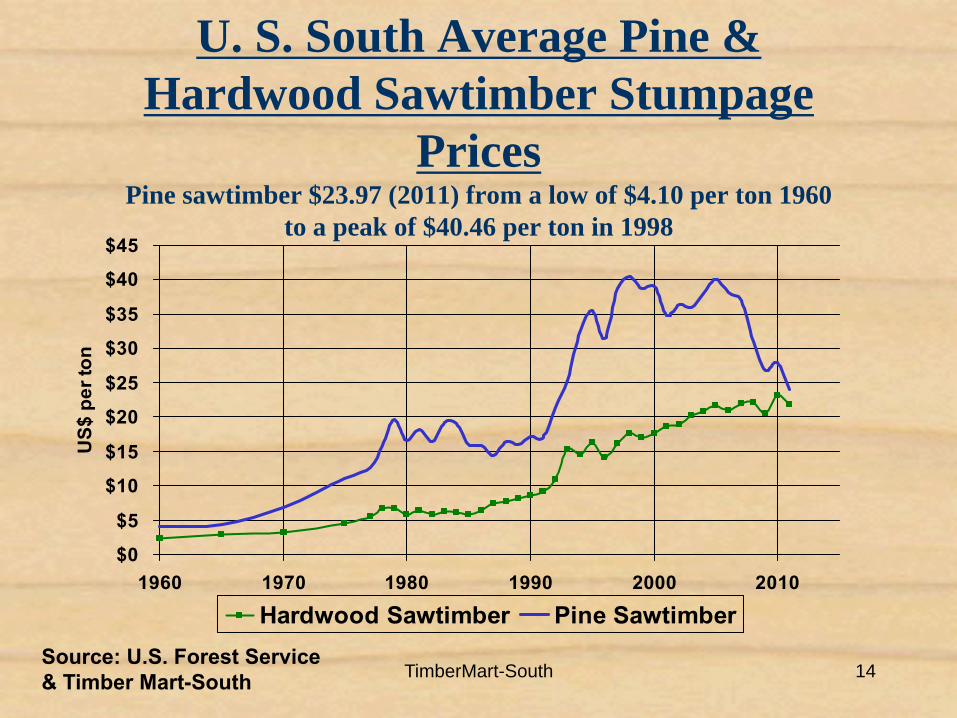
U. S. South Average Pine & Hardwood Sawtimber Stumpage
PricesPine sawtimber $23.97 (2011) from a low of $4.10 per ton 1960
to a peak of $40.46 per ton in 1998
$0
$5
$10
$15
$20
$25
$30
$35
$40
$45
1960 1970 1980 1990 2000 2010
US$
per
ton
Hardwood Sawtimber Pine SawtimberSource: U.S. Forest Service & Timber Mart-South
TimberMart-South 15
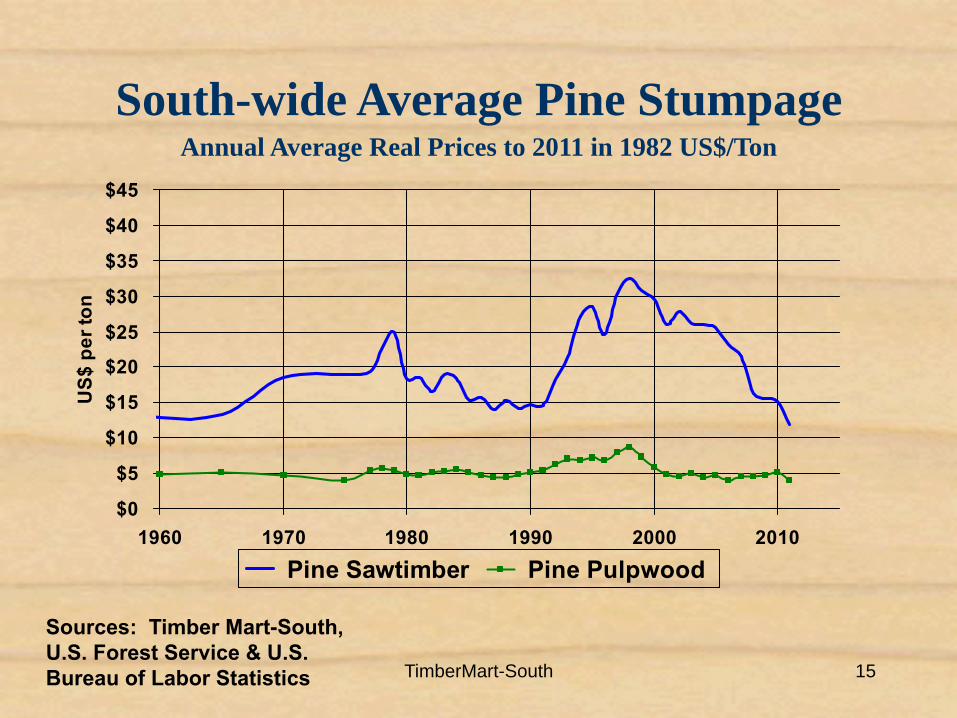
Sources: Timber Mart-South, U.S. Forest Service & U.S. Bureau of Labor Statistics
$0
$5
$10
$15
$20
$25
$30
$35
$40
$45
1960 1970 1980 1990 2000 2010
US$
per
ton
Pine Sawtimber Pine Pulpwood
South-wide Average Pine StumpageAnnual Average Real Prices to 2011 in 1982 US$/Ton

TimberMart-South 16
U. S. South Average Pulpwood Stumpage Prices
Annual Average 1960 to 2011
$0
$2
$4
$6
$8
$10
$12
1960 1970 1980 1990 2000 2010
US$
per
ton
Hardwood Pulpwood Pine PulpwoodSource: U.S. Forest Service & Timber Mart-South
TimberMart-South 17
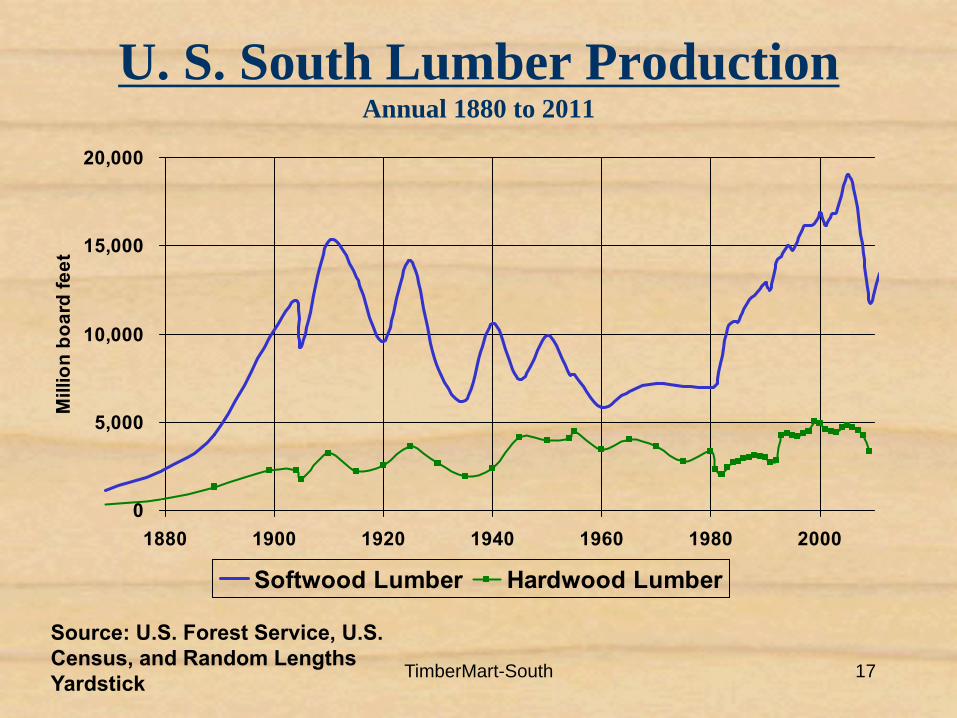
U. S. South Lumber ProductionAnnual 1880 to 2011
0
5,000
10,000
15,000
20,000
1880 1900 1920 1940 1960 1980 2000
Mill
ion
boar
d fe
et
Softwood Lumber Hardwood Lumber
Source: U.S. Forest Service, U.S. Census, and Random Lengths Yardstick
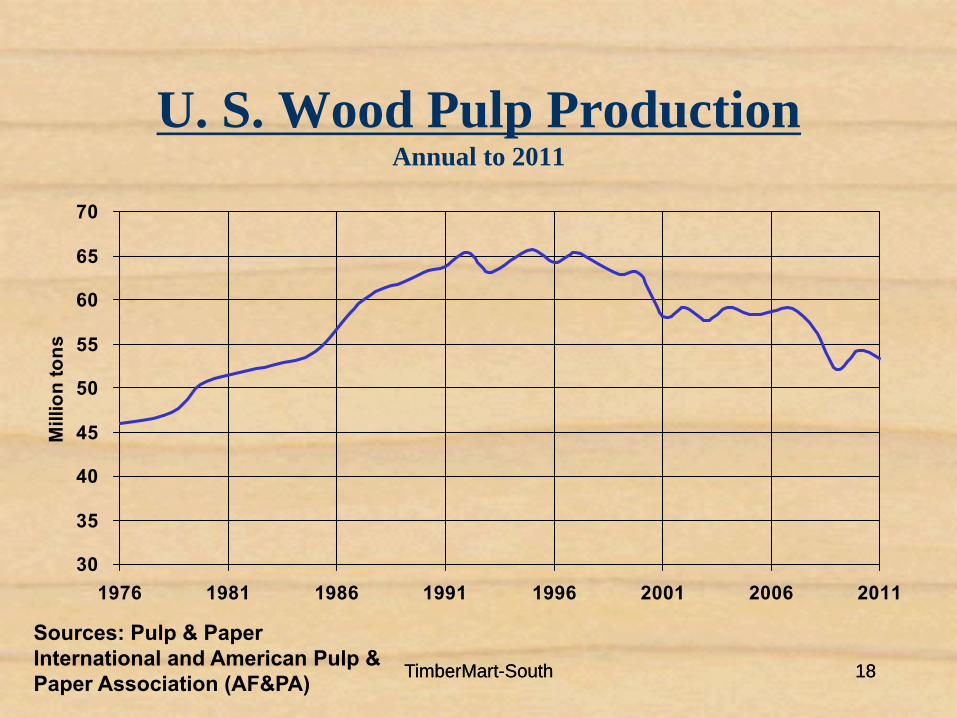
TimberMart-South 18TimberMart-South 18
U. S. Wood Pulp Production Annual to 2011
30
35
40
45
50
55
60
65
70
1976 1981 1986 1991 1996 2001 2006 2011
Mill
ion
tons
Sources: Pulp & Paper International and American Pulp & Paper Association (AF&PA)
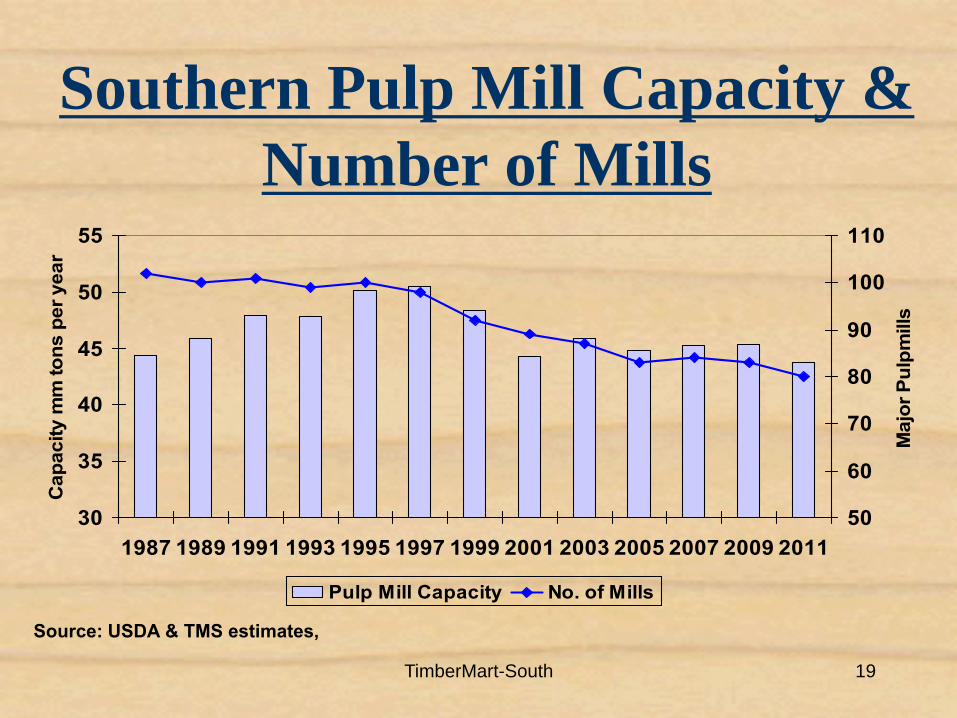
TimberMart-South 19
Southern Pulp Mill Capacity & Number of Mills
Source: USDA & TMS estimates,
30
35
40
45
50
55
1987 1989 1991 1993 1995 1997 1999 2001 2003 2005 2007 2009 2011
Cap
acity
mm
tons
per
yea
r
50
60
70
80
90
100
110
Maj
or P
ulpm
ills
Pulp Mill Capacity No. of Mills
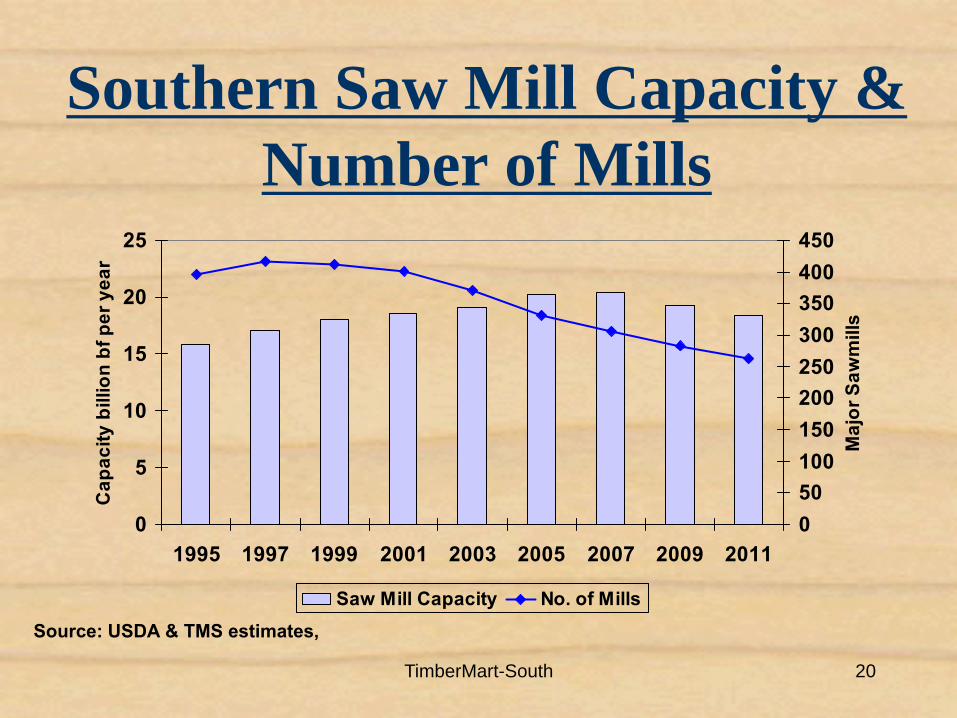
TimberMart-South 20
Southern Saw Mill Capacity & Number of Mills
Source: USDA & TMS estimates,
0
5
10
15
20
25
1995 1997 1999 2001 2003 2005 2007 2009 2011
Cap
acity
bill
ion
bf p
er y
ear
050100150200250300350400450
Maj
or S
awm
ills
Saw Mill Capacity No. of Mills
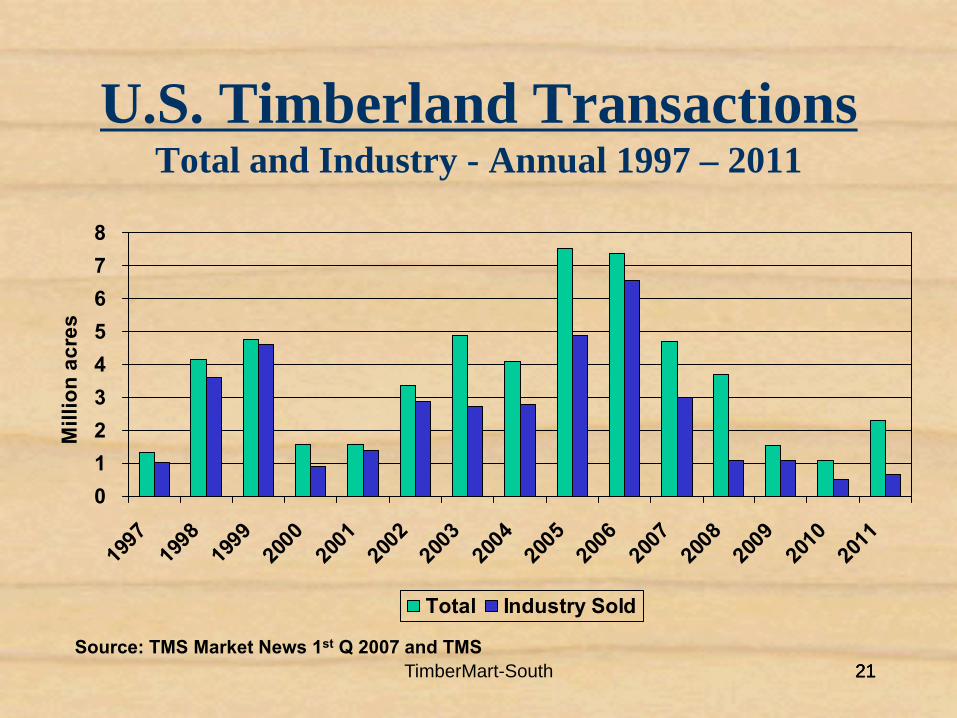
TimberMart-South 212121
U.S. Timberland TransactionsTotal and Industry - Annual 1997 – 2011
012345678
1997
1998
1999
2000
2001
2002
2003
2004
2005
2006
2007
2008
2009
2010
2011
Mill
ion
acre
s
Total Industry Sold
Source: TMS Market News 1st Q 2007 and TMS
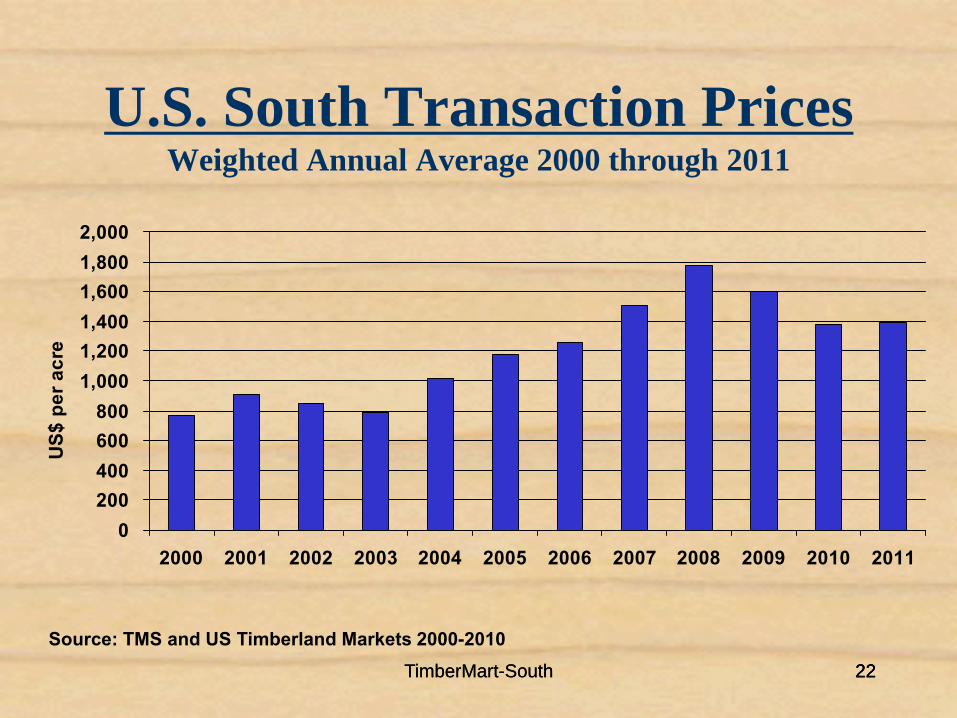
TimberMart-South 2222TimberMart-South 22
U.S. South Transaction PricesWeighted Annual Average 2000 through 2011
0200400600800
1,0001,2001,4001,6001,8002,000
2000 2001 2002 2003 2004 2005 2006 2007 2008 2009 2010 2011
US$
per
acr
e
Source: TMS and US Timberland Markets 2000-2010
TimberMart-South 23
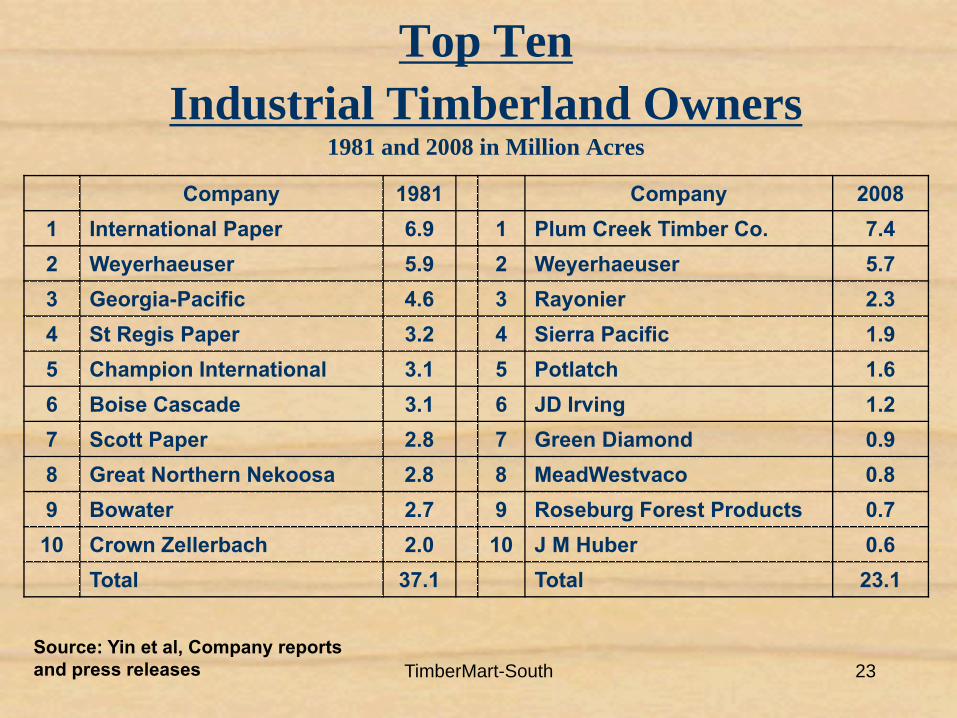
Top Ten Industrial Timberland Owners
1981 and 2008 in Million Acres
Source: Yin et al, Company reports and press releases
Company 1981 Company 20081 International Paper 6.9 1 Plum Creek Timber Co. 7.42 Weyerhaeuser 5.9 2 Weyerhaeuser 5.73 Georgia-Pacific 4.6 3 Rayonier 2.34 St Regis Paper 3.2 4 Sierra Pacific 1.95 Champion International 3.1 5 Potlatch 1.66 Boise Cascade 3.1 6 JD Irving 1.27 Scott Paper 2.8 7 Green Diamond 0.98 Great Northern Nekoosa 2.8 8 MeadWestvaco 0.89 Bowater 2.7 9 Roseburg Forest Products 0.710 Crown Zellerbach 2.0 10 J M Huber 0.6
Total 37.1 Total 23.1
TimberMart-South 24
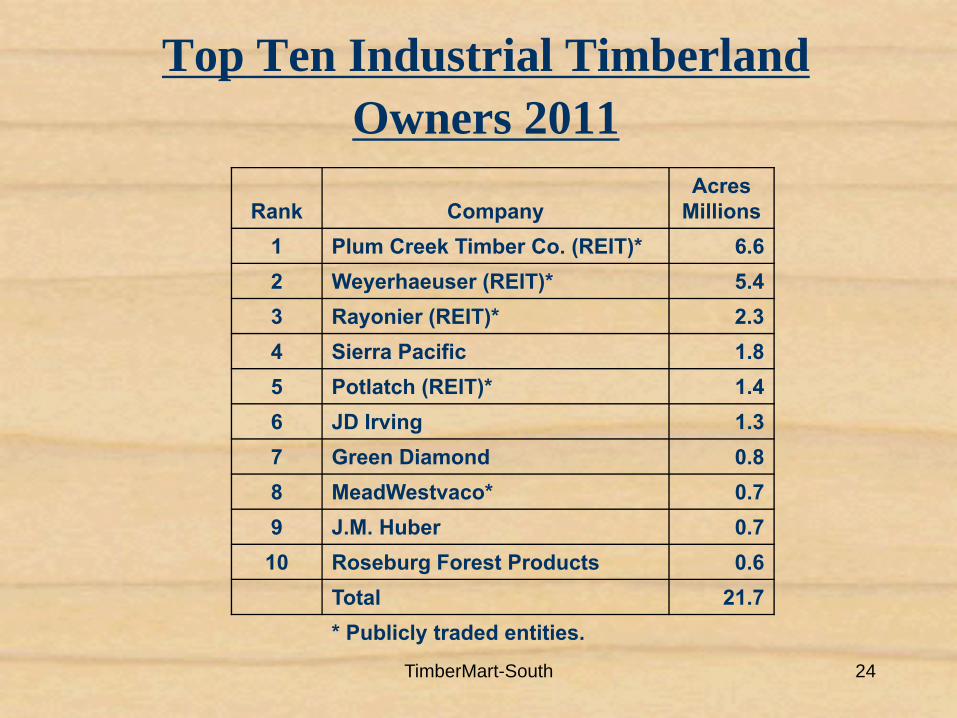
Top Ten Industrial Timberland Owners 2011
Rank CompanyAcres
Millions1 Plum Creek Timber Co. (REIT)* 6.62 Weyerhaeuser (REIT)* 5.43 Rayonier (REIT)* 2.34 Sierra Pacific 1.85 Potlatch (REIT)* 1.46 JD Irving 1.37 Green Diamond 0.88 MeadWestvaco* 0.79 J.M. Huber 0.710 Roseburg Forest Products 0.6
Total 21.7* Publicly traded entities.
TimberMart-South 25
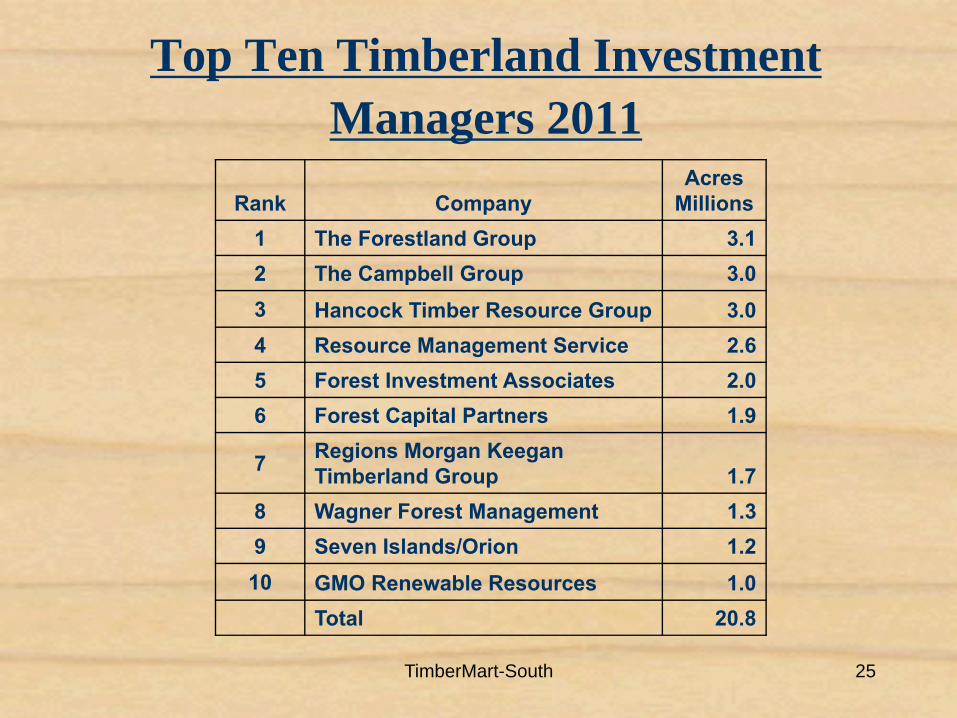
Top Ten Timberland Investment Managers 2011
Rank CompanyAcres
Millions1 The Forestland Group 3.12 The Campbell Group 3.03 Hancock Timber Resource Group 3.04 Resource Management Service 2.65 Forest Investment Associates 2.06 Forest Capital Partners 1.9
7 Regions Morgan Keegan Timberland Group 1.7
8 Wagner Forest Management 1.39 Seven Islands/Orion 1.2
10 GMO Renewable Resources 1.0Total 20.8
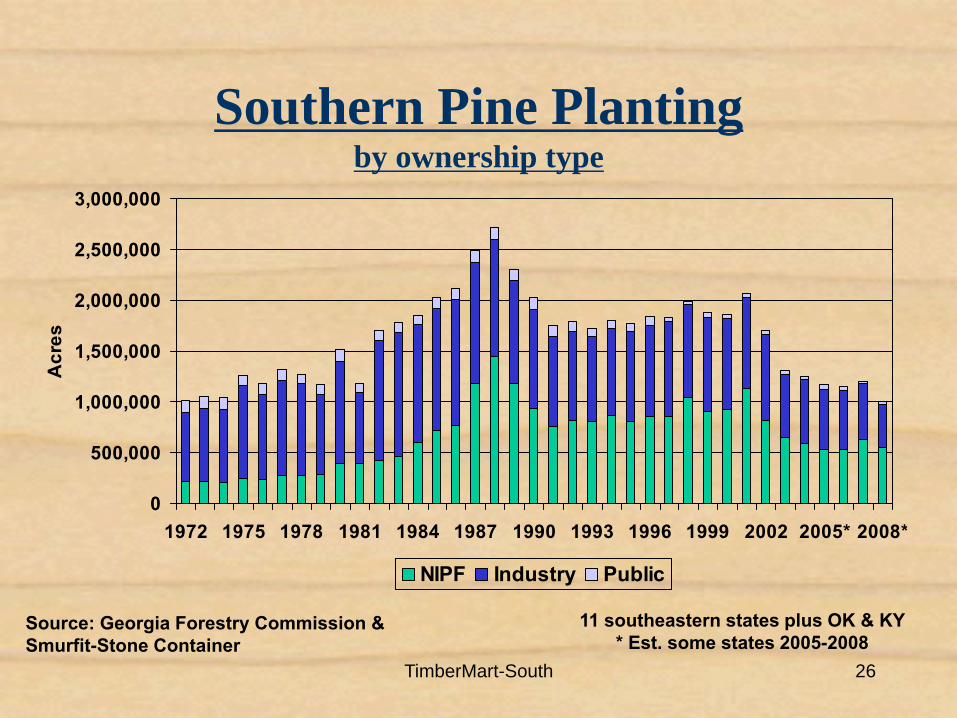
TimberMart-South 26
Southern Pine Plantingby ownership type
0
500,000
1,000,000
1,500,000
2,000,000
2,500,000
3,000,000
1972 1975 1978 1981 1984 1987 1990 1993 1996 1999 2002 2005* 2008*
Acr
es
NIPF Industry Public
Source: Georgia Forestry Commission & Smurfit-Stone Container
11 southeastern states plus OK & KY* Est. some states 2005-2008
TimberMart-South 27
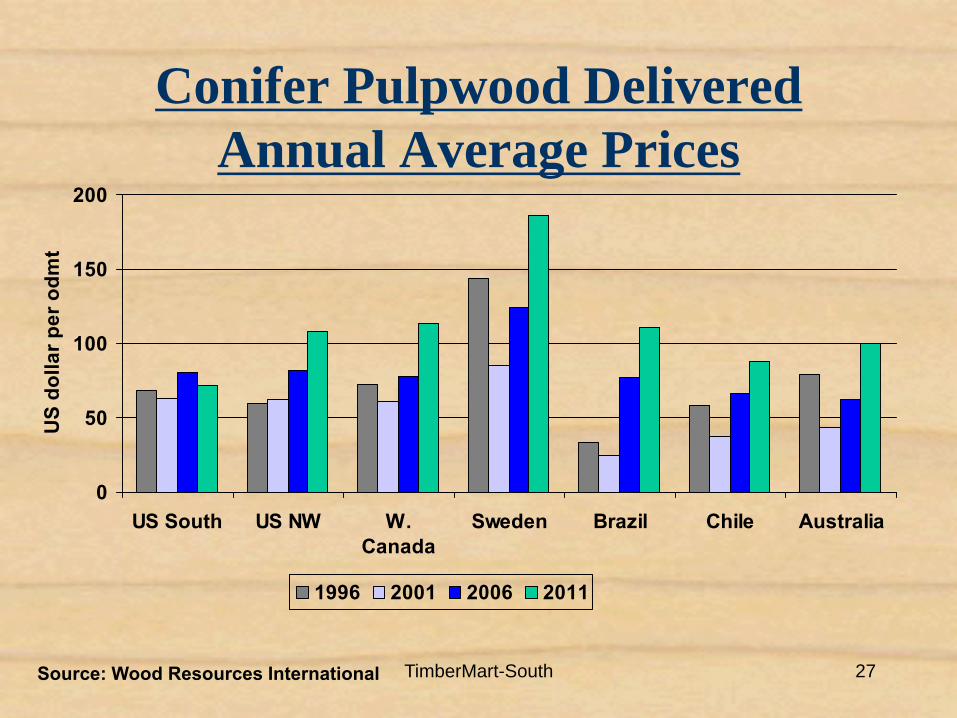
Conifer Pulpwood Delivered Annual Average Prices
0
50
100
150
200
US South US NW W.Canada
Sweden Brazil Chile Australia
US
dolla
r per
odm
t
1996 2001 2006 2011
Source: Wood Resources International
TimberMart-South 2828
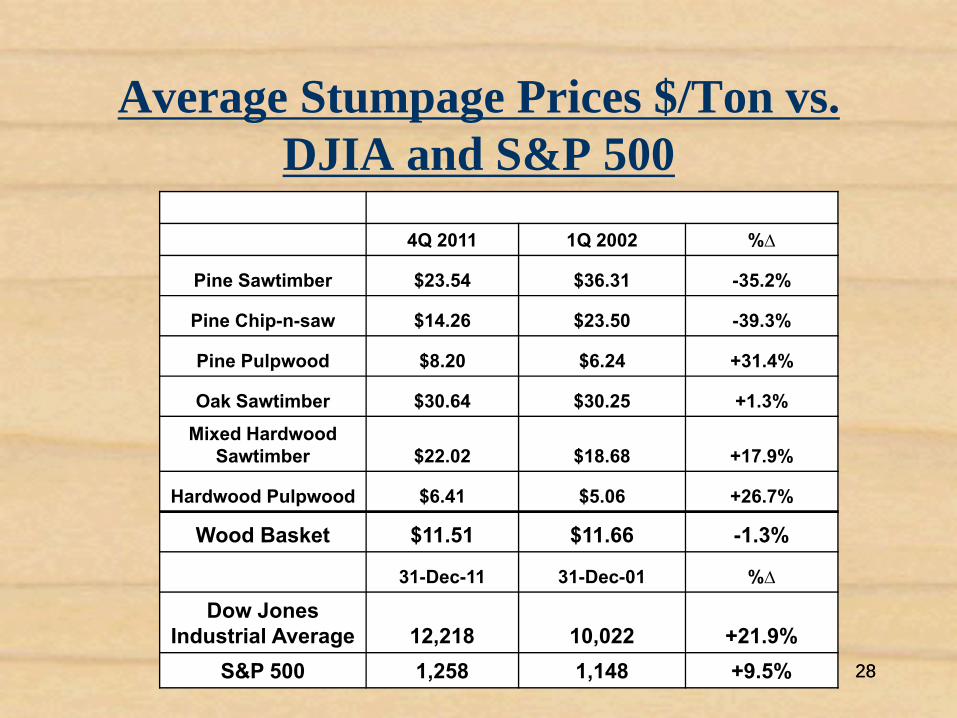
Average Stumpage Prices $/Ton vs. DJIA and S&P 500
4Q 2011 1Q 2002 %∆
Pine Sawtimber $23.54 $36.31 -35.2%
Pine Chip-n-saw $14.26 $23.50 -39.3%
Pine Pulpwood $8.20 $6.24 +31.4%
Oak Sawtimber $30.64 $30.25 +1.3%
Mixed Hardwood Sawtimber $22.02 $18.68 +17.9%
Hardwood Pulpwood $6.41 $5.06 +26.7%
Wood Basket $11.51 $11.66 -1.3%
31-Dec-11 31-Dec-01 %∆
Dow Jones Industrial Average 12,218 10,022 +21.9%
S&P 500 1,258 1,148 +9.5%
TimberMart-South 2929
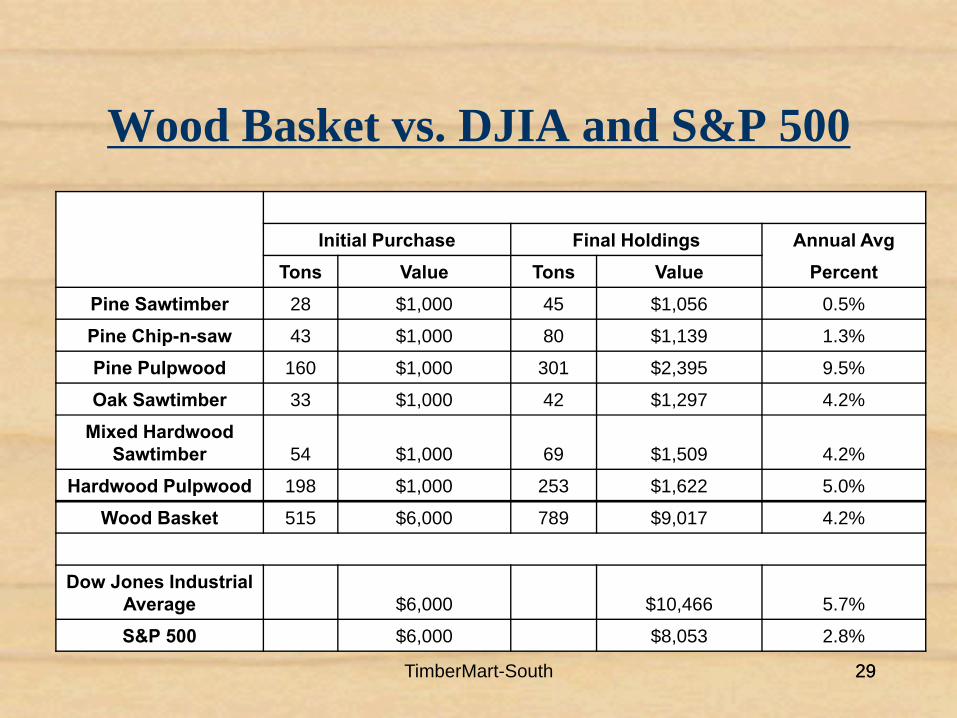
Wood Basket vs. DJIA and S&P 500
Initial Purchase Final Holdings Annual AvgTons Value Tons Value Percent
Pine Sawtimber 28 $1,000 45 $1,056 0.5%
Pine Chip-n-saw 43 $1,000 80 $1,139 1.3%
Pine Pulpwood 160 $1,000 301 $2,395 9.5%
Oak Sawtimber 33 $1,000 42 $1,297 4.2%
Mixed Hardwood Sawtimber 54 $1,000 69 $1,509 4.2%
Hardwood Pulpwood 198 $1,000 253 $1,622 5.0%
Wood Basket 515 $6,000 789 $9,017 4.2%
Dow Jones Industrial Average $6,000 $10,466 5.7%
S&P 500 $6,000 $8,053 2.8%
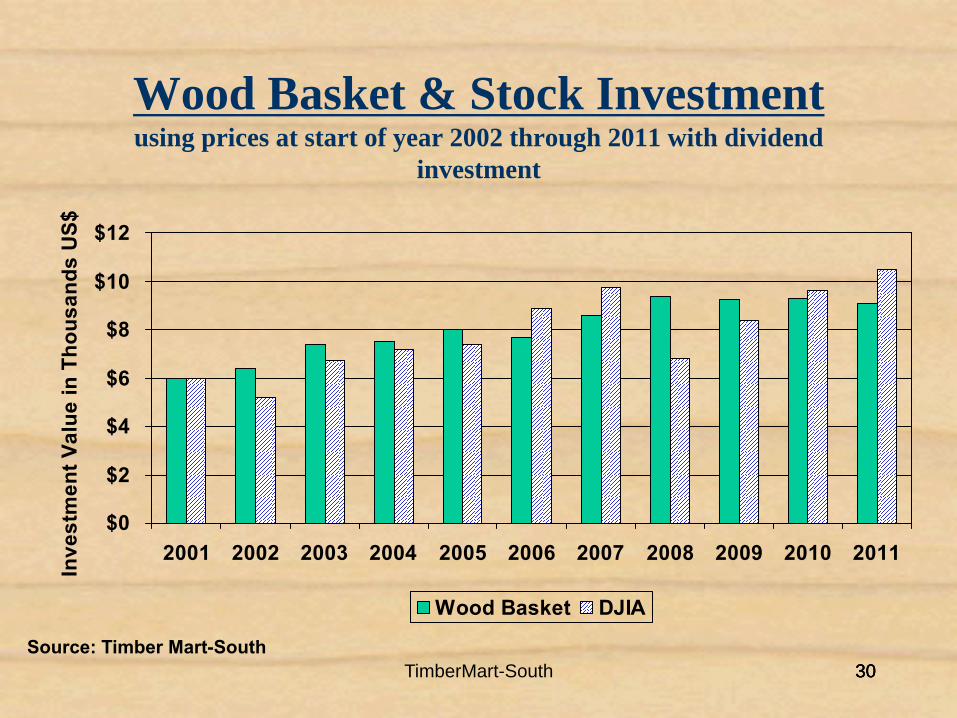
TimberMart-South 303030
Wood Basket & Stock Investmentusing prices at start of year 2002 through 2011 with dividend
investment
$0
$2
$4
$6
$8
$10
$12
2001 2002 2003 2004 2005 2006 2007 2008 2009 2010 2011
Inve
stm
ent V
alue
in T
hous
ands
US$
Wood Basket DJIA
Source: Timber Mart-South
TimberMart-South 31
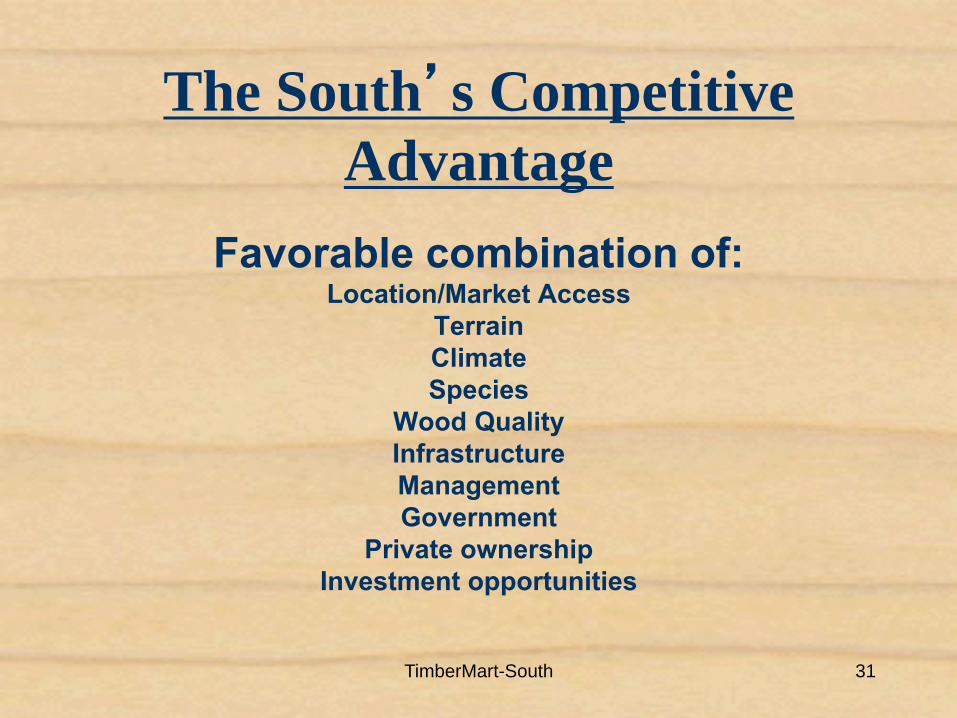
The South’s Competitive Advantage
Favorable combination of:Location/Market Access
TerrainClimateSpecies
Wood QualityInfrastructureManagementGovernment
Private ownershipInvestment opportunities
TimberMart-South 32
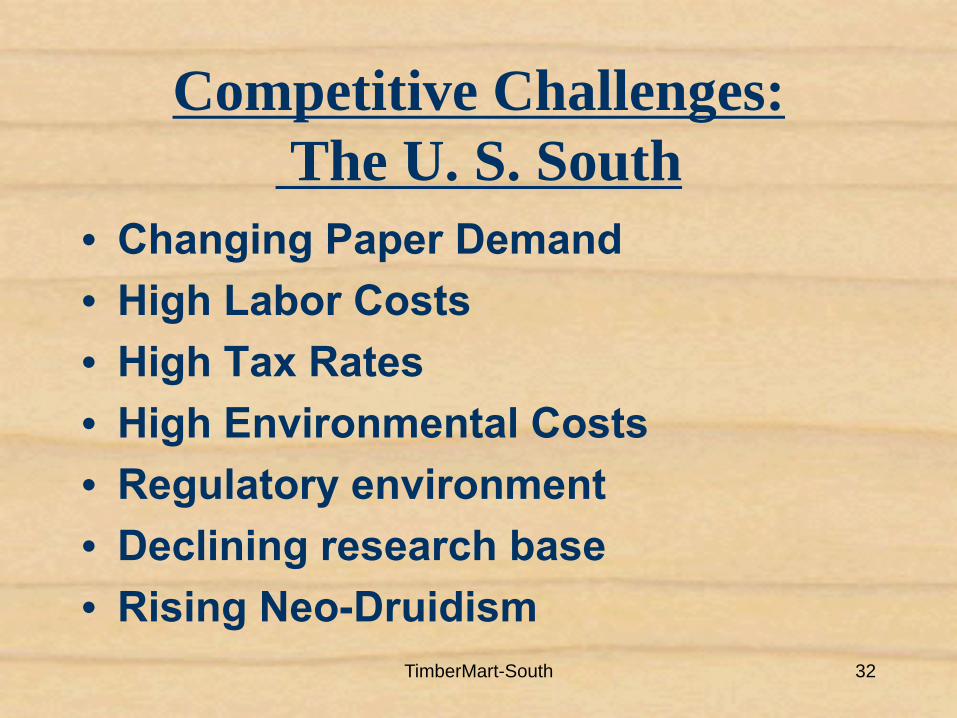
Competitive Challenges:The U. S. South
• Changing Paper Demand• High Labor Costs• High Tax Rates• High Environmental Costs• Regulatory environment• Declining research base• Rising Neo-Druidism
TimberMart-South 33
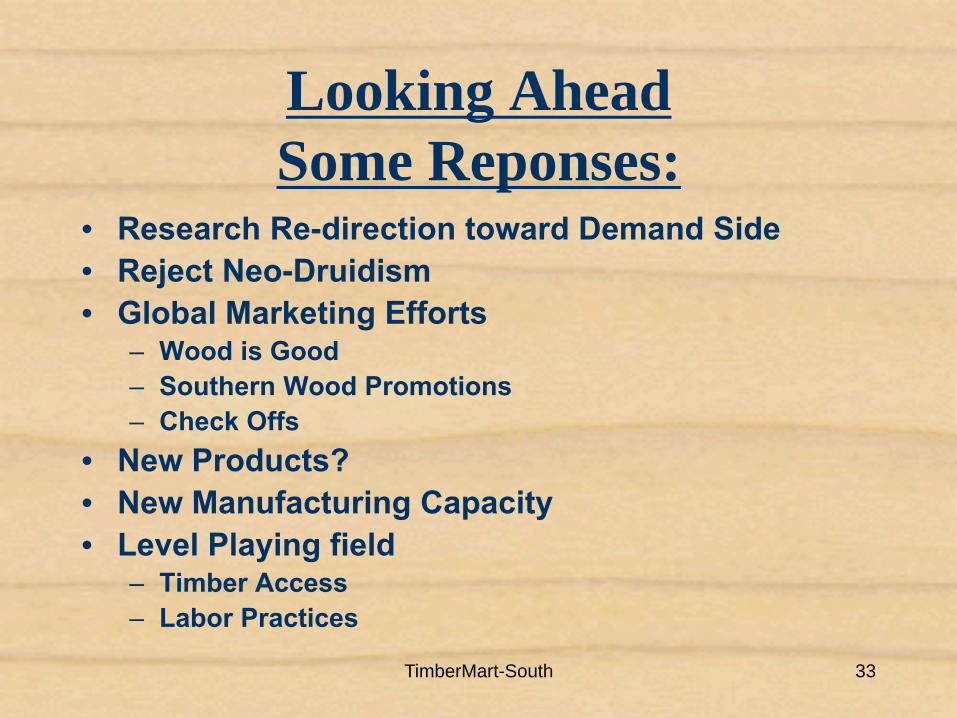
Looking AheadSome Reponses:
• Research Re-direction toward Demand Side• Reject Neo-Druidism• Global Marketing Efforts
– Wood is Good– Southern Wood Promotions– Check Offs
• New Products?• New Manufacturing Capacity • Level Playing field
– Timber Access– Labor Practices
TimberMart-South 3434
Wood is Good
• Renewable• Available• Sustainable• Energy efficient• Versatile• Essential
TimberMart-South 35
Southern Timber TrendsForest Investment Outlook
Questions ?