time allocation between work and family over the life ...ftp.iza.org/dp3193.pdf · time allocation...
TRANSCRIPT

IZA DP No. 3193
Time Allocation between Work and Family overthe Life-Cycle: A Comparative Gender Analysis ofItaly, France, Sweden and the United States
Dominique Anxo Ariane PailhéLennart Flood Anne SolazLetizia Mencarini Maria Letizia Tanturri
DI
SC
US
SI
ON
PA
PE
R S
ER
IE
S
Forschungsinstitutzur Zukunft der ArbeitInstitute for the Studyof Labor
November 2007

Time Allocation between Work and Family over the Life-Cycle: A Comparative Gender Analysis of Italy, France, Sweden and the United States
Dominique Anxo Vaxjo University
Lennart Flood
Göteborg University and IZA
Letizia Mencarini University of Florence
Ariane Pailhé
INED, Paris
Anne Solaz INED, Paris
Maria Letizia Tanturri
University of Pavia
Discussion Paper No. 3193 November 2007
IZA
P.O. Box 7240 53072 Bonn
Germany
Phone: +49-228-3894-0 Fax: +49-228-3894-180
E-mail: [email protected]
Any opinions expressed here are those of the author(s) and not those of the institute. Research disseminated by IZA may include views on policy, but the institute itself takes no institutional policy positions. The Institute for the Study of Labor (IZA) in Bonn is a local and virtual international research center and a place of communication between science, politics and business. IZA is an independent nonprofit company supported by Deutsche Post World Net. The center is associated with the University of Bonn and offers a stimulating research environment through its research networks, research support, and visitors and doctoral programs. IZA engages in (i) original and internationally competitive research in all fields of labor economics, (ii) development of policy concepts, and (iii) dissemination of research results and concepts to the interested public. IZA Discussion Papers often represent preliminary work and are circulated to encourage discussion. Citation of such a paper should account for its provisional character. A revised version may be available directly from the author.

IZA Discussion Paper No. 3193 November 2007
ABSTRACT
Time Allocation between Work and Family over the Life-Cycle: A Comparative Gender Analysis of Italy, France, Sweden
and the United States*
This article analyses the extent to which changes in household composition over the life course affect the gender division of labour. It identifies and analyses cross-country disparities between France, Italy, Sweden and United States, using most recent data available from the Time Use National Surveys. We focus on gender differences in the allocation of time between market work, domestic work and leisure over the life-cycle. In order to map the life-cycle, we distinguish between nine key cross-country comparable life stages according to age and family structure such as exiting parental home, union formation, parenthood, and retiring from work. By using appropriate regression techniques (Tobit with selection, Tobit and OLS), we show large discrepancies in the gender division of labour at the different life stages. This gender gap exists in all countries at any stage of the life course, but is usually smaller at the two ends of the age distribution, and larger with parenthood. Beyond social norms, the impact of parenthood on time allocation varies across countries, being smaller in those where work-family balance policies are more effective and traditionally well-established. JEL Classification: D13, J22, O17 Keywords: time use, gender, life-cycle, paid and unpaid work Corresponding author: Lennart Flood Department of Economics School of Business, Economics and Law Göteborg University Box 640 S-405 30 Göteborg Sweden E-mail: [email protected]
* The financial support received by the French Ministry of Research is gratefully acknowledged. We thank all the members of the ACI “Temps de vie” for their helpful comments and Olivier Thévenon for giving us access to the more recent comparative contextual data.
1. Introduction
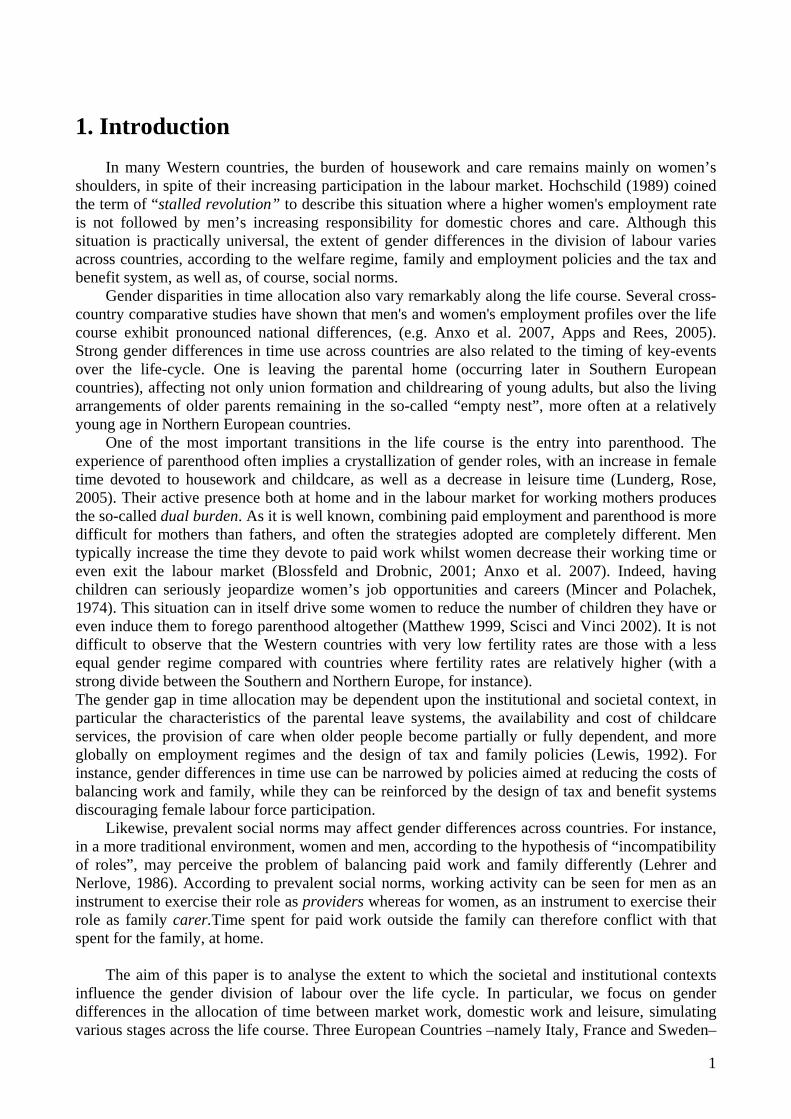
In many Western countries, the burden of housework and care remains mainly on women’s
shoulders, in spite of their increasing participation in the labour market. Hochschild (1989) coined the term of “stalled revolution” to describe this situation where a higher women's employment rate is not followed by men’s increasing responsibility for domestic chores and care. Although this situation is practically universal, the extent of gender differences in the division of labour varies across countries, according to the welfare regime, family and employment policies and the tax and benefit system, as well as, of course, social norms.
Gender disparities in time allocation also vary remarkably along the life course. Several cross-country comparative studies have shown that men's and women's employment profiles over the life course exhibit pronounced national differences, (e.g. Anxo et al. 2007, Apps and Rees, 2005). Strong gender differences in time use across countries are also related to the timing of key-events over the life-cycle. One is leaving the parental home (occurring later in Southern European countries), affecting not only union formation and childrearing of young adults, but also the living arrangements of older parents remaining in the so-called “empty nest”, more often at a relatively young age in Northern European countries.
One of the most important transitions in the life course is the entry into parenthood. The experience of parenthood often implies a crystallization of gender roles, with an increase in female time devoted to housework and childcare, as well as a decrease in leisure time (Lunderg, Rose, 2005). Their active presence both at home and in the labour market for working mothers produces the so-called dual burden. As it is well known, combining paid employment and parenthood is more difficult for mothers than fathers, and often the strategies adopted are completely different. Men typically increase the time they devote to paid work whilst women decrease their working time or even exit the labour market (Blossfeld and Drobnic, 2001; Anxo et al. 2007). Indeed, having children can seriously jeopardize women’s job opportunities and careers (Mincer and Polachek, 1974). This situation can in itself drive some women to reduce the number of children they have or even induce them to forego parenthood altogether (Matthew 1999, Scisci and Vinci 2002). It is not difficult to observe that the Western countries with very low fertility rates are those with a less equal gender regime compared with countries where fertility rates are relatively higher (with a strong divide between the Southern and Northern Europe, for instance). The gender gap in time allocation may be dependent upon the institutional and societal context, in particular the characteristics of the parental leave systems, the availability and cost of childcare services, the provision of care when older people become partially or fully dependent, and more globally on employment regimes and the design of tax and family policies (Lewis, 1992). For instance, gender differences in time use can be narrowed by policies aimed at reducing the costs of balancing work and family, while they can be reinforced by the design of tax and benefit systems discouraging female labour force participation.
Likewise, prevalent social norms may affect gender differences across countries. For instance, in a more traditional environment, women and men, according to the hypothesis of “incompatibility of roles”, may perceive the problem of balancing paid work and family differently (Lehrer and Nerlove, 1986). According to prevalent social norms, working activity can be seen for men as an instrument to exercise their role as providers whereas for women, as an instrument to exercise their role as family carer.Time spent for paid work outside the family can therefore conflict with that spent for the family, at home.
The aim of this paper is to analyse the extent to which the societal and institutional contexts
influence the gender division of labour over the life cycle. In particular, we focus on gender differences in the allocation of time between market work, domestic work and leisure, simulating various stages across the life course. Three European Countries –namely Italy, France and Sweden–
1

and the United States are selected for cross-country comparison. These countries represent different institutional contexts and diverge significantly in terms of welfare state regime, employment and working time systems, family policy and social norms. We distinguish nine key life-cycle stages according to age and family structure, reflecting major life events and life phases for a large majority of individuals, such the transition out of the parental home, union formation, parenthood, and transitions to retirement and old age This approach makes it possible to identify and map the cross-country variations in the gender time allocation across the life cycle and to relate these variations to the prevalent welfare state regime, employment system, as well as to social norms.
The article is organised as follows. In section 2 the institutional framework of the four selected countries is presented. The main features of the most recent national Time Use Surveys and our methodological approach are described in section 3 and 4. We then analyse the extent to which the changes in household composition over the life course affect the gender allocation of paid work, housework and leisure of men and women in the four selected countries by using appropriate regression techniques (Generalised Tobit, standard Tobit and OLS).
2. Different institutional contexts
The four countries selected belong to different welfare state regimes, and have different labour
market regulations, family support policies and policies to reconcile paid employment and family obligations.
Often presented as the ideal type of the so-called Nordic social democratic regime, the Swedish welfare state emphasizes the principle of egalitarianism, de-commodification2 and individualisation3 (Esping-Andersen, 1999). The Swedish model is based on a strong political commitment to the goal of full employment and to egalitarian ideals (Anxo and Niklasson, 2006). The Swedish societal system is based on a high incidence of dual earner households, egalitarian wage structures, including low gender wage inequality, extensive and generous family policy, strong welfare support systems both for childcare and parental leave4 (tables 1 and 2). Individualised taxation systems in a context of high average and marginal tax rates reinforce the dual breadwinner model. As far as working time is concerned, some gender differences persist, with a relatively high share of women working in the public sector and working part-time. But in contrast to other European countries with high part-time employment rates, like the UK or the Netherlands, many women in Sweden work long part-time and receive income compensation for working reduced hours. In Sweden, the development of part-time work among women, which started in the early 1970s, is indicative: in 1981 47% of Swedish women worked part-time, compared to 33% in 2005. Part-time work in Sweden must be considered more as an historical transition from married women’s inactivity towards a strategy, largely initiated by labour market and political institutions, to strengthen women’s labour market commitments. The parental leave system allows for income compensated temporary reduction of working time, thereby reinforcing women’s status as a significant breadwinner even when they are temporarily not participating on a full time basis in the labour market. The overall political context characterized by gender mainstreaming, high female involvement in the political process and instances (government bodies, parliament, and labour market organisations) creates a favourable institutional set up conducive to a more balanced gender division of labour and responsibilities over the life course.
France occupies an often contradictory position in the classification of Western welfare systems, partly because of the variegated nature of its family policy. As stressed by Caldwell and
2 Strategies of decommodification are aimed at making people more independant of markets by insulating the satisfaction of wants and needs from the nexus of market transactions. 3 Individualization has been a key part of the Swedish universal welfare state: the individual, and not the family, has for many years been the unit not only of taxation but also of social benefits and social rights. 4 Sweden is one of the countries with the lowest general gender gap worldwide, and has the second highest GEM-Gender Empowerment Measure Index (UN, 2006).
2

Schindlmayr (2003: 255) “France remains a problem for the model builders”. Under the Esping-Andersen (1999) classification, France belongs to the conservative welfare state, characterised by policies geared at preserving existing statuses and traditional family forms, and where the provision of welfare is still a mainly family responsibility. Feminist researchers, focusing on the impact of social policies on female employment, classify France and Sweden in the same category, as countries where social policies help women to remain in the labour force (Neyer, 2003; Gornick, Meyers and Ross, 1997). The employment rate of French adult women started to rise from the mid-1950s onwards, but there is still a pronounced ‘cohort effect’ whereby younger generations of mothers have more continuous employment profiles across their working lives than their predecessors. This life course employment pattern for French mothers is supported by the high coverage rate and lower cost of public childcare, but, in contrast to Sweden, provisions are less extensive, in particular for young pre-school children (table 2). However, unemployment has been high in France since the 1980s, and unemployment rates for women consistently exceed those of men (even among the younger cohorts). Thus, while the gender gap in employment rates continues to decline it remains more difficult for women to establish and pursue a continuous employment profile over the life course; motherhood is still associated with withdrawal from the labour market for some groups of women, in particular low-skill women (Anxo et al, 2007; Pailhé and Solaz, 2006).
Table 1: Employment indicators Sweden France United
States Italy
Female employment rate 71.5 56.7 65.4 42.7
Employment rate Women with child <3 72.9 66.2 56.6 54.4
Part time employment rate Women with child <6 41 23 29 29
Male employment rate 25-54 86.1 87 86.3 86.6
Female employment rate 25-54 80.8 72.9 71.8 57.9
Male employment rate 55-64 71.6 44.5 66 44.2
Female employment rate 55-64 67.4 36.8 54.3 19.8
Mean age at withdrawal from labour force. Men 63.1 58.4 62.2(a) 60.9
Mean age at withdrawal from labour force. Women 62.4 59.4 62.2(a) 61
(a) Average 1995-2000 Sources: OECD Employment database; OECD Society at glance (2005); OECD Employment Outlook (2006)
Italy shares common elements with the conservative welfare states, but with a stronger family bias, with limited public support and a greater reliance on family relations to provide social support. A high level of rigidity characterizes the Italian labour market, with strong protection for those in permanent employment, and very little protection for those in temporary employment. These rules severely restrict opportunities for labour-market entrants, a feature that has been claimed to be the main reason for the high unemployment rates among women and young people (Del Boca et al., 2005).
Young people leave the parental home late, owing to both cultural factors and structural constraints, such as high unemployment, low entry salary, lack of state support and barriers to entering the housing market (Barbagli et al., 2003). Women play a crucial role as carers both for the young and for the old members of the family, barely supported by their partners and by public services. The employment rate among mothers with children under the age of 3 is only 54 percent, one of the lowest in Europe (table 1). Due to working time rigidity, married women are often forced to choose between not working or working full time (Del Boca et al., 2003). In fact, flexible
3

working hours and part-time work are rare: less than 30% of mothers with children under 6 work part-time (table 1).
Balancing childrearing and market work is also made more difficult by the limited supply of public childcare for children under 3 years old, both in terms of availability (only 6% of children attend a public crèche) and of the number of hours supplied on a day-to-day basis (table 2). Conversely, maternity leave duration is quite long compared with the other countries (21 weeks), and paid at 80% of previous earnings (table 2). As gender roles are still shaped in a traditional way, paternity leave has never been enacted, but since 2000 both fathers and mother can take parental leave for a total period of 36 weeks, at 30% of previous earnings (law of 8 March 2000). A further month is given if the father takes at least three months of paternal leave. In 2004, the take-up rates of eligible mothers was 75% and 7% for eligible fathers (Anxo et al. 2007).
Table 2: Family policy indicators Sweden France United States Italy
Total expenses for child care (% GDP) 1.45 1.6 0.65 0.65 Childcare expenses (per child, US PPP) 5300 4000 1800 2761 Childcare attendance rate
(1-2 years old) 65 39 16 6
Pre-school establishment
attendance rate (3-6 years old)
82 99 53 71
Paternity leave (weeks) 11 2 0 0 Maternity leave duration (first birth) 15 16 12 21 Paid parental leave duration (weeks) 52 156 0 36 Level of financial support, parental leave 80% of previous
earnings Low flat rate
allowance - 30% of previous
earnings for 6 months (child <3)
Sources: OECD Family and educational database; and OECD (2002);
The United-States is often classified as the archetype of the so-called ‘liberal' or residual welfare state regime. This regime is characterized by a low degree of social protection with an emphasis on poverty alleviation mainly based on means-tested benefits, as well as limited involvement of the State in the provision of services. The minimal safety net against poverty favours also the existence of a low-wage low-skill labour market. The United-States has a strong institutionalised working-culture and the market and the family play a dominant role in providing welfare. The low level of public-funded social protection is offset by market-based means of risk diversification through private insurance.
The US does not, however, have a unified welfare system. The Federal government has had a limited role in social welfare provision; many important functions are administered at state level, including public assistance, social care and various health schemes.
The high flexibility of the US labour market, in particular low employment protection and external flexibility, diminishes long-term unemployment risks and creates greater opportunities for the young to enter the labour market. In contrast to Sweden and France, US family policy is weak and policies favouring a balance between market work and family obligations are limited. Family policy predominantly favours the provision of private services through tax deductions for childcare for example (Orloff, 2006). A national parental leave entitlement was introduced in 1993 but it is unpaid5 and the take-up rate among mothers is only 36% (Waldfogel, 2001).
The US ranks twelfth in the gender empowerment measure index according to indicators such as the number of seats in parliament held by women, the estimated ratio of female to male earned
5 The Family and Medical Leave Act (FMLA) states that eligible workers may take a maximum of 12 weeks of annual parental leave with subsequent employment guaranty, but the leave is unpaid.
4
income (Sweden ranks second, and Italy 24th; see UN, 2006). The U.S. average female-male earnings ratio has shown considerable progress since the 1970s and the wage gap is close to the level of Nordic countries (Datta Gupta, Oaxaca and Smith, 2001). 3. Time-Use Surveys
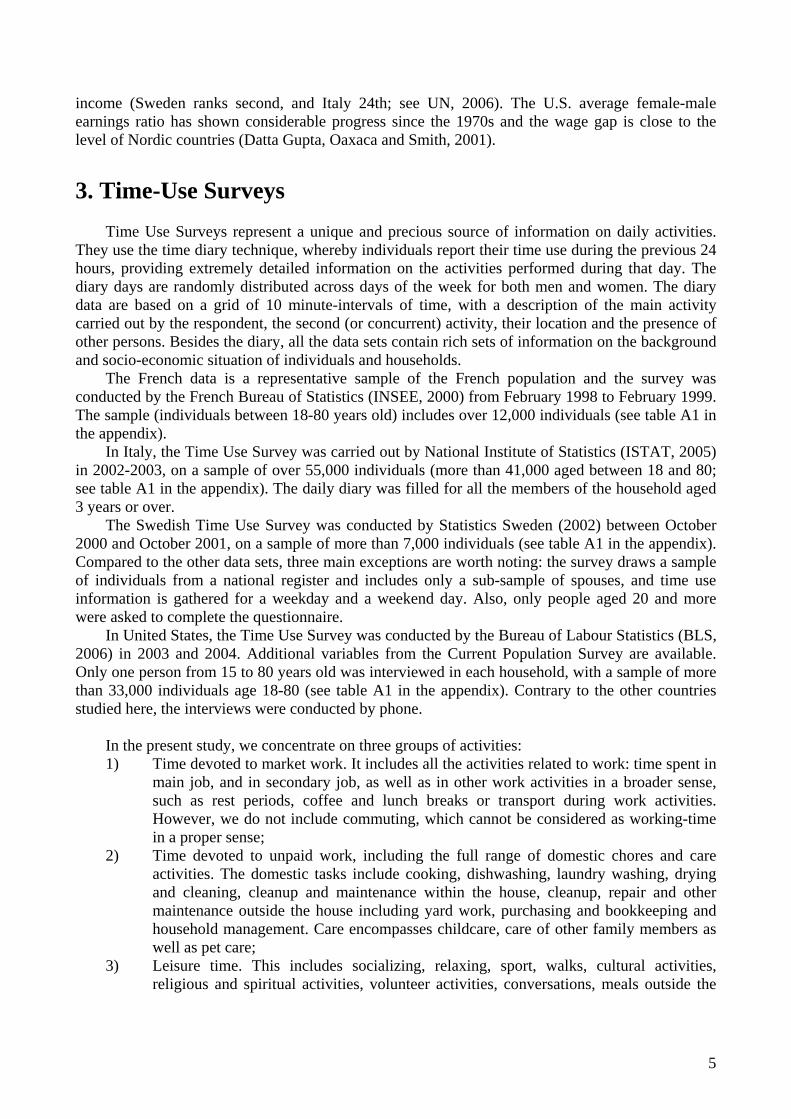
Time Use Surveys represent a unique and precious source of information on daily activities.
They use the time diary technique, whereby individuals report their time use during the previous 24 hours, providing extremely detailed information on the activities performed during that day. The diary days are randomly distributed across days of the week for both men and women. The diary data are based on a grid of 10 minute-intervals of time, with a description of the main activity carried out by the respondent, the second (or concurrent) activity, their location and the presence of other persons. Besides the diary, all the data sets contain rich sets of information on the background and socio-economic situation of individuals and households.
The French data is a representative sample of the French population and the survey was conducted by the French Bureau of Statistics (INSEE, 2000) from February 1998 to February 1999. The sample (individuals between 18-80 years old) includes over 12,000 individuals (see table A1 in the appendix).
In Italy, the Time Use Survey was carried out by National Institute of Statistics (ISTAT, 2005) in 2002-2003, on a sample of over 55,000 individuals (more than 41,000 aged between 18 and 80; see table A1 in the appendix). The daily diary was filled for all the members of the household aged 3 years or over.
The Swedish Time Use Survey was conducted by Statistics Sweden (2002) between October 2000 and October 2001, on a sample of more than 7,000 individuals (see table A1 in the appendix). Compared to the other data sets, three main exceptions are worth noting: the survey draws a sample of individuals from a national register and includes only a sub-sample of spouses, and time use information is gathered for a weekday and a weekend day. Also, only people aged 20 and more were asked to complete the questionnaire.
In United States, the Time Use Survey was conducted by the Bureau of Labour Statistics (BLS, 2006) in 2003 and 2004. Additional variables from the Current Population Survey are available. Only one person from 15 to 80 years old was interviewed in each household, with a sample of more than 33,000 individuals age 18-80 (see table A1 in the appendix). Contrary to the other countries studied here, the interviews were conducted by phone.
In the present study, we concentrate on three groups of activities: 1) Time devoted to market work. It includes all the activities related to work: time spent in
main job, and in secondary job, as well as in other work activities in a broader sense, such as rest periods, coffee and lunch breaks or transport during work activities. However, we do not include commuting, which cannot be considered as working-time in a proper sense;
2) Time devoted to unpaid work, including the full range of domestic chores and care activities. The domestic tasks include cooking, dishwashing, laundry washing, drying and cleaning, cleanup and maintenance within the house, cleanup, repair and other maintenance outside the house including yard work, purchasing and bookkeeping and household management. Care encompasses childcare, care of other family members as well as pet care;
3) Leisure time. This includes socializing, relaxing, sport, walks, cultural activities, religious and spiritual activities, volunteer activities, conversations, meals outside the
5

house. Leisure time is not the complement of paid and unpaid work since physiological needs (sleeping, personal care, etc) are not included6.
4. Methodological approach and sample characteristics
To map the time allocation profile of men and women at different points in the life course we restrict the sample populations to adult aged 18-80 years old7 and use a variant of the family cycle approach developed by Glick in the late 1940s (Glick, 1947) Our methodological choice consisted of selecting a range of household categories coinciding with widely experienced transitions and phases in the life course. These typologies can be depicted as results of some steps in an individual biography: transition out of the parental home (young single living in the parental home) and the constitution of an independent household (young singles without children), union formation (cohabiting couples without children), parenthood (differentiating couples according to the mean age of children), midlife empty nest period (middle-aged couples without cohabiting children) and lastly the older phase and exit from the labour market (couples and singles above 59 years old). See the box below for the details of the nine typologies of household life-phases that we focus on in our analysis.
Box 1: Stylised household life-course typologies Single and childless young people 1. Single persons (under 36 years), without children living with their parents 2. Single persons (under 36 years), without children living on their own
Childless couples 3. Younger couples (woman aged under 46 years), without children
Couple households with resident children The mean age of the children is used to indicate the nature of parental responsibilities across the life course, from the intense nature of pre-school childcare through to the different needs and demands of children as they grow up and become more independent. 4. Couple with youngest children (mean age of children is under 6 years) 5. Couple with young children (mean age of children 6-15 years) 6. Couple with teenage children (mean age of children 16-25 years)
Older couples or singles without children living at home 7. Midlife 'empty nest' couples without resident children, (woman aged 45-59 years) 8. Older ‘retired’ couples without resident children (both spouses aged 60 years or older) 9. Older ‘retired’ singles without resident children aged 60 years or older
Although our approach is not longitudinal and is based on cross-sectional time use surveys, it
can serve as a heuristic device to identify cross-country differences in the patterns of labour market integration and the gender division of unpaid work and leisure over the life course and to assess the influence of the societal context on the prevailing gender division of labour. However, one needs to
6 There is endless debate on the definition of leisure; some consider that physiological time may be a leisure time.
Physiological time is not included in leisure time, because introducing sleeping masks a lot of minor differences. Moreover, we considered that physiological time such as washing oneself are incompressible.
7 Except for Sweden, where it is between 20 and 80.
6

be cautious with the interpretation of the results and bear in mind the usual drawbacks associated with cross-section analysis, in particular the difficulties of disentangling age, cohort and period effects. Furthermore, the family cycle suffers from some limitations that should be stressed. This approach implies a “natural sequence” of predetermined stages in the family’s progression from marriage to widowhood, yet this sequencing of life stages is becoming more diversified in contemporary societies. We make no assumptions about sequencing or duration on the different life stage situations we have selected for analysis; rather in our typology we have sought to include some of the most prevalent transitions and life phases for comparative analysis. This typology does not include all the possible household situations and it leaves out important and growing categories such as, for example, lone parents or prime age and mid-life singles. However, our typology covers between 80% (Italy) and 88% (Sweden) of all household categories found in each society at a given point in time (set Table 3 and Table A1 in the Appendix).
Table 3: Country samples by household types in the life-cycle (weighted proportion) Individual 18-80 years old FRANCE ITALY SWEDEN* US
Single <36 with parents 9.0 16.8 1.7 8.8 Single <36 on their own 4.3 2.2 9.4 5.4 Couple <46 no children 6.9 4.7 9.3 8.3 Couple children 0-5 7.6 8.1 15.2 9.5 Couple children 6-15 15.8 12.2 8.9 14.3 Couple children 16-25 11.1 13.1 5.2 7.7 Empty nest 45-59 7.4 3.7 15.5 9.2 Couple 60 + 13.8 12.0 15.1 11.9 Single 60 + 6.1 6.9 7.8 7.2 Total excluded 18.2 20.3 11.7 17.8 single-parent families 5.8 5.3 4.4 5.9 single 36-59 4.6 3.8 7.3 8.1 other excluded 7.8 11.2 - 3.9 Total 12,442 41,440 7,272 33,077 *from 20 to 80 years old Sources: Own calculations based on the national time use surveys
We are therefore aware that the life-cycle stages considered are not (and cannot be) exhaustive,
and they do not necessarily occur in the expected order. As the individual life trajectories become more and more heterogeneous, the predictive value of average time-use profiles weakens. Moreover, families with children are not differentiated according to the number of children, but only with respect to the children’s mean age. Nevertheless, the description of these simple time-use profiles can be a very useful basis for comparative studies, both across time and across countries.
In a comparative perspective it is also interesting to assess whether being in a specific life-cycle stage has the same effect on time use for men and women, all other things being equal. We therefore estimate three different equations with, as dependent variables, time in paid work, time in unpaid work, and time in leisure. The variables of interest are our household typologies and control variables include educational attainment, income or economic situation, regional and urban areas, characteristics of the home (ownership, number of rooms, presence of a garden), access to domestic services (housekeepers, baby sitter or a carer for older people), other specific characteristics by country (such as ethnicity for US or citizenship for France) and day of the week of the interview as control. For market work, in order to correct for potential selection bias and to discriminate between the impact of covariates on participation in market work that day and working hours given participation, we use a Generalised Tobit (see Heckman,1978 and the technical appendix for details). For housework we use a standard Tobit to take account of the fact that some individuals do not report housework. Since in the Generalised and standard Tobit, the estimated coefficients have
7

no natural interpretation, we report marginal effects evaluated at sample means. For leisure, a usual OLS is used since all individuals in our four samples report that they spent time on leisure. 5. Employment profiles across the life-cycle
First, we examine the pattern of employment over the life-cycle. We adopt a relatively broad
definition of employment since we count as employed, people currently working or temporarily absent from work8.
For men, employment profiles over the life-cycle are quite similar across countries (see figure 1) and follow an inverse U-curve. Men progressively enter the labour force in their youth and reach a very high level when being fathers. Young men living with their parents have a lower employment rate compared with those living on their own, reflecting the transition from the educational system to the labour market. Leaving the parental home often coincides with entry into the labour market and financial independence. This effect is particularly strong in France and Sweden, lower in Italy and US since respectively 60% and 70% of males living with their parents are already working. Concerning the following steps, i.e. forming a couple and having children, fathers work a little more than childless cohabiting or married men, especially in France, but also in Sweden and the US. Family responsibilities may exert a push effect to find a job, and/or couples may wait until the man has a job before having a child. This is not the case in Italy where the highest male employment rate is already reached when they form a childless couple. This effect could also be ascribed to an age effect, since, as mentioned previously, the transition out of the parental home in Italy occurs later than in the other countries. Middle-aged and older men withdraw earlier from the labour market in Italy, due to early retirement schemes. Note also that the employment rate of older men is comparatively higher in Sweden and the US, while extremely low in France. Despite quite comparable minimum legal retirement ages(60 in France, 61 in Sweden, 62 in United States), the conditions for entitlement to a full retirement pension, the nature of employment policies and of human resources strategies differ and explain the main disparities in the mean age of withdrawal from the labour market across countries (see table 2 for statistics on the mean age of men's withdrawal from labour force). Furthermore, the French low senior employment rate may be explained by a relatively low retirement age, extensive use of early retirement schemes9, a high rate of senior unemployment and by the existence of specific retirement regimes (with earlier retirement age) in certain sectors. Indeed, encouraging older people to leave the labour market was common practice in the 1980s and 1990s in France as a tool to reduce unemployment. On the contrary, Sweden, has set up a very active employment policy targeted at older workers. Also in the United States, anti-age-discrimination laws, introduced in the early 1960s, have helped to maintain senior employment rates.
Not surprisingly, female employment patterns across the life cycle differ from their male counterpart in all countries, with some notable discrepancies across countries. In France and Sweden, union formation is associated with increasing labour force participation (see Figure 1), while in Italy, the employment rate of women living in a couple without children is slightly lower than for their childless single counterparts. This suggests that union formation in Italy is still associated with a decline in women’s labour force participation. The arrival of children has a negative impact on female employment rates in all countries. The decrease is particularly pronounced in the US (the employment rate falls from 82% to 58%) and Italy (from 74% to 54%).
8 People absent from work due to illness, holidays, vocational training, temporary layoff, labour dispute, sick child
or family member, maternity/paternity or parental leave are included. 9 Because of declining demand and rising unemployment, early retirement has been increasingly considered by
firms as a way to deal with their excess capacities and rejuvenate their work force.
8

The gender employment gap is particularly high in those two countries at this stage of the life course, amounting to around 40 percentage points compared to around 20 percentage points in France and Sweden. While in the USA, France and Sweden, the female employment rate increases again when children become older, in Italy it continues to decline with the age of children. However, rather than a life course change, it may be ascribed to a cohort effect, with older cohorts having a lower attachment to the labour market.
If we look now at the volume of hours spent on market work per week (based on the time use surveys) given employment, (see Figure 2), the decrease in working hours for employed women with pre-school children is larger, due to the large and increasing proportion of women working part-time, taking parental leave or maternity leave when they have young children. The work-time reduction is more concentrated around the children's very early years, particularly in France, Italy and Sweden. In Italy, there is a real specialization between men and women, with an increase in men's working hours, not perceptible in the other countries, where the volume of hours spent on the labour market seems to be independent of the family situation.
Even though the identified patterns of labour market integration over the life course reveal some interesting features, the observed cross-country discrepancies may conceal important structural differences in household socio-economic characteristics. In order to control for these structural differences, we estimate a set of labour supply equations by gender and countries using a Generalised Tobit model to take account of potential selection bias (see the technical appendix).
The results of the estimations are consistent with the above described employment and working time profiles. After controlling for educational attainment, the day of the week, and the town size for all four countries and by some additional specific covariates not available in all countries such as predicted wage, non labour income and citizenship in France, ethnicity in US, region of residence in Italy and US, our variables of interest i.e the nine household categories of our typology, are still significant10. In the following development we discriminate between the impact of our life stage categories on employment rates (second part of table 4), and working time, given participation in the labour market (third part of Table 4).
The effect of children on male employment rates differs significantly across countries. We observe no impact of young children for French fathers, but a positive impact on labour supply in Italy and the US, and a negative impact in Sweden. The reduction of the Swedish fathers’ labour supply can be ascribed to the use of parental leave (even for a short period) and not to a withdrawal from the labour market. On the other hand, we found no impact of young children on fathers’ working time, given participation.
As their children grow older, the employment rate of American fathers continues to increase (without impact on working time given participation), but the impact on Italian or Swedish fathers’ labour supply vanishes. US fathers of children aged 16-25 have a higher labour supply, both in terms of participation and working time given participation. By contrast, French fathers reduce both their participation and their working hours when children are teenagers or young adults. We find a negative effect on participation for the empty nest category in Italy and France. The above-mentioned earlier retirement and pre-retirement schemes could explain this decline. Furthermore, unemployment also affects older workers whereas in Sweden and United States, anti-discrimination laws and employment policies protect these categories. Men in an empty nest also work less given participation in France and Italy. Part-time early retirement programs could explain this effect in France. As expected, after age sixty, participation decreases dramatically in our four countries independently of household composition (single/widow or in couple). Like men, young women living with their parents participate less (Italian and American) or work less when they participate (French and American) compared with cohabiting childless women. By contrast, childless young singles participate more in Italy and the United States, reflecting the
10 The reference category is couple without children.
9

penalty of union formation on female labour supply in these two countries which is absent in France and Sweden.
Not surprisingly, having very young children has a strong and universal negative effect on female labour supply and reduces both the extent of participation and the time devoted to market work, given participation.
The labour force participation of mothers of older children remains weaker in Italy (even for 16-25 year-olds) and the United States. Italian mothers cumulate both a weaker participation and shorter working time when they participate, while for American mothers the impact of children essentially takes the form of reduced participation. In France and Sweden, mothers of children aged 6-15 or older have the same level of participation as young childless cohabiting women, but they work fewer hours when they do work (except Swedish mothers of 16-25 year-olds). In the United States, one strategy available for parents is to stagger their working hours so that only one parent is working at any given time. For instance in 1997, in 31% of dual-earner couples with children under 14, at least one partner worked a schedule other than standard office hours (Presser 1999).
The “empty nest” phase is associated with a decline in women’s labour force participation in France, Italy and the United States, that could be explained by the less inclusive labour market for older women. It could be also ascribed to a cohort effect, that we are not able to control for with our cross sectional data. When they work, their working time is also shorter than that of childless cohabiting women.
As expected, we observe overall a decrease in both participation and working time for older women living in couples or for single women over sixty.
10

Figure 1: Profile of employment rates over the life course Profile of employment rate over the life course variant, ITALY, 2002-2003
0
10
20
30
40
50
60
70
80
90
100
Single <36with parents
Singles <36on their own
Couples <45,no children
Couples,children 0-5
Couples,children 6-15
Couples,children 16-25
Couplesempty-nest,age 45-59
Older retiringcouples >59
Older singles>59
MenWomen
Profile of employment rate over the life course, USA 2003-2004
0.0
10.0
20.0
30.0
40.0
50.0
60.0
70.0
80.0
90.0
100.0
Singles withParents <36
Singles <36on their own
Couples < 45no children
Coupleschildren 0-5
Coupleschildren 6-15
Coupleschildren 16-
25
Couplesempty nestage 45-59
Older retiringcouples >59
Older singles>59
EMPL
OYM
ENT
RA
TE
MW
Profile of employment rate over the life course, FRANCE 1998-1999
0
10
20
30
40
50
60
70
80
90
100
Singles withParents <36
Singles <36on their own
Couples < 45no children
Coupleschildren 0-5
Coupleschildren 6-15
Coupleschildren 16-
25
Couplesempty nestage 45-59
Older retiringcouples >59
Older singles>59
EMPL
OYM
ENT
RA
TE
MenWomen
Profile of employment rate over the life course, SWEDEN 2000
0
10
20
30
40
50
60
70
80
90
100
Singles withParents<36
Singles <36on their own
Couples < 45no children
Couples,children 0-4
Couples,children 5-12
Couples,children 13-
25
Couplesempty nestage 45-59
Older retiringcouples >59
Older singles>59
EMPL
OYM
ENT
RA
TE
MenWomen
Sources: Own calculations based on national time use surveys
11

Figure 2: Time spent on market work, employed, hours per week Time spent on market work, employed, hours par week, USA 2003-2004
0
5
10
15
20
25
30
35
40
45
50
single <36with parents
single <36 ontheir own
couple <46 nochildren
couplechildren 0-5
couplechildren 6-15
couplechildren 16-25
empty nest45-59
couple 60 + single 60 +
Men Women
Time spent on market work, employed,hours per week, FRANCE 1998-1999
0
5
10
15
20
25
30
35
40
45
50
Singles withParents <36
Singles <36on their own
Couples < 45no children
Coupleschildren 0-5
Coupleschildren 6-15
Coupleschildren 16-25
Couplesempty nestage 45-59
Older retiringcouples >59
Older singles>59
hour
s/w
eek
Working MenWorking Women
Time spent on market work, employed,hours per week, SWEDEN 2000
0
5
10
15
20
25
30
35
40
45
50
Singles withParents<36
Singles <36on their own
Couples < 45no children
Couples,children 0-4
Couples,children 5-12
Couples,children 13-25
Couplesempty nestage 45-59
Older retiringcouples >59
Older singles>59
hour
s/w
eek
Working MenWorking Women
Time spent on market work, employed, hours par week, ITALY 2002-2003
Singles <36on their own
Couples <45, no children Couples,
children 0-5 Couples, children 6-15 Couples,
children 16-25Couplesempty-nest,age 45-59
Older retiringcouples >59
Older singles>59
MenWomen
50 45 40 35 30 25 20 15 10 5 0
Single <36 with parents
Sources: Own calculations based on the national time use surveys
12

Table 4: Generalised Tobit, market work (marginal effects evaluated at sample mean) by country and gender Total marginal effect MEN WOMEN
FRANCE ITALY SWEDEN US FRANCE ITALY SWEDEN USHousehold life-course typologies (ref.: couple <46 no children) Single <36 with parents -4.75 -9.37 -10.82 -6.77
-1.73 -2.55 3.61 -3.38 Single <36 on their own
1.09 -1.37 -7.21 1.32 -1.16 1.42 -1.08 3.87
Couple children 0-5 -1.85 2.94 -4.16 4.99 -4.68 -3.74 -6.21 -6.49Couple children 6-15 -4.40 0.78 -0.92 5.12 -2.62 -2.21 0.28 -3.25Couple children 16-25 -7.15 -4.18 -2.70 4.70 -2.85 -2.35 0.56 -0.64
Empty nest 46-59
-8.70 -7.95 -2.03 0.48 -3.99 -3.25 -0.57 -1.75Couple 60 +
-26.50 -21.53 -18.79 -17.57 -9.87 -7.58 -12.71 -12.14
Single 60 + -19.13 -17.31 -18.81 -18.05 -9.18 -7.31 -12.32 -12.41Expected value 20.0 17.1 17.6 21.8 7.4 5.3 12.2 12.7
Impact on participation (selection effect) MEN WOMEN
FRANCE ITALY SWEDEN US FRANCE ITALY SWEDEN USHousehold life-course typologies (ref.: couple <46 no children) Single <36 with parents -0.03 -0.17 -0.22 -0.10 -0.02 -0.06 0.10 -0.05 Single <36 on their own 0.08 -0.03 -0.14 0.02
-0.02 0.03 -0.03 0.08 Couple children 0-5 -0.03 0.05 -0.07 0.10 -0.12 -0.08 -0.10 -0.12 Couple children 6-15 -0.08 0.03 0.01 0.10 -0.04 -0.04 0.04 -0.04 Couple children 16-25 -0.13 -0.07 -0.03 0.07 -0.04 -0.04 0.02 0.00 Empty nest 46-59 -0.15 -0.14 -0.02 0.01 -0.08 -0.07 0.02 -0.02 Couple 60 + -0.50 -0.41 -0.35 -0.31 -0.26 -0.17 -0.27 -0.25 Single 60 + -0.39 -0.33 -0.36 -0.35 -0.23 -0.17 -0.26 -0.26
Expected value 0.42 0.34 0.36 0.43 0.22 0.12 0.27 0.28 Conditional marginal effect MEN WOMEN
FRANCE ITALY SWEDEN US FRANCE ITALY SWEDEN USHousehold life-course typologies (ref.: couple <46 no children) Single <36 with parents -8.17 -1.80 0.07 -5.43 -5.70 0.95 -2.02 -4.30 Single <36 on their own
-5.23 0.37 -1.97 0.55
-1.85 -0.08 0.95 1.41Couple children 0-5 -1.40 1.10 -1.46 0.32 -4.86 -7.71 -8.18 -6.58 Couple children 6-15 -1.84 -1.60 -3.97 0.54 -6.69 -6.61 -4.48 -5.42 Couple children 16-25 -3.37 -2.19 -4.00 2.03 -8.54 -4.63 -1.31 -1.53
Empty nest 46-59
-5.28 -3.48 -2.51 -0.47 -8.58 -3.91 -5.55 -2.43 Couple 60 +
-20.12 -6.48 -15.01 -9.21 -16.30 -9.30 -10.75 -10.92
Single 60 + -10.25 -6.16 -22.64 -2.73 -23.16 -6.18 -10.89 -8.14 Expected value 47.5 51.1 48.6 50.2 33.9 43.3 44.4 44.1
Other covariates: educational attainment, urban areas, weekday in all countries, plus predicted wage, non labour income, citizenship (France), ethnicity (US), regional area (Italy and US), see Table A3 in the statistical appendix for a detailed presentation of the estimation results. Bold= coefficient significant at 5%
13

6. Time spent in unpaid work over the life-cycle The time devoted to unpaid work (housework and care activities) varies considerably across
countries (Figure 3). Italian women spend on average more hours in household activities at all stages of the life cycle (between 12 and 51 hours per week), followed by French women. Conversely, Swedish women devote remarkably fewer hours to these activities (from 8 to 29 hours per week). American women are usually in between, but they work at home more hours than French women when they have pre-school children. Women’s time spent in unpaid work increases with union formation everywhere, but particularly in Italy and France. Not surprisingly, independently of the country, women’s profiles show a peak when they have pre-school children. In general, women reduce their involvement in domestic activities only when they live alone in the final phase of their life cycle (the “merry widows11”).
Men usually spend less time on housework and care activities than their female counterparts: Apart from very few exceptions (older men) their involvement is always less than 20 hours a week (Figure 3). Moreover, the profile of their participation is quite flat over the life-cycle and more similar across-country. The number of hours they spend on housework and care increases significantly only after retiring and for those living alone at older ages (the “unhappy widowers”). In three countries out of four (the US is the exception) men over 60 devote more hours to unpaid work than the younger men, even when the latter are fathers of pre-school children.
The gender gap in time devoted to domestic chores and care activities exists in all countries at all stages of the life course (Figure 3). It is usually less remarkable at the extreme phases of the life cycle: among the very young singles, and at older ages, again especially among singles. In France and in Italy the gender gap increases with union formation. Gender differences are extremely wide for the Italians at all steps of the life cycle, but in particular when they live in a couple with children: Italian women with children under three work on average 40 hours a week more than their male counterpart, while in Sweden only 11 hours more. In Italy the gender gap is noteworthy (about 10 hours a week), also among the young living both in the parental home and alone, as well as among the widowed. The opposite case is represented by Sweden where the gender differences are never remarkable and in no case do they count for more than 11 hours. French and American women are somewhere in between: the gender differences are similarly small in the early stage of the life cycle, and they grow with the presence of children under three: women work at home around 20 hours more then men at that stage. In France the gender gap remains large until the the empty nest phase, while in the US it decreases quickly as the children grow up.
The results of the Tobit estimations are summarised in Table 7; The time spent in unpaid work varies significantly across our simulated life cycle, even after controlling for educational attainment (that could shape attitudes and gender roles), the day of the week, place of residence for all four countries and for some additional specific covariates not available in all countries such as predicted wage, non labour income and citizenship in France, ethnicity in US, geographical area in Italy and US, housing characteristics and the presence of paid domestic services in Italy and in France.
Our estimations confirm that women’s time in unpaid work is much more influenced by the various phases of our stylised life course (all the marginal effect are statistically significant and larger in magnitude) than their male counterparts (table 7).
With respect to the reference category (young couple without children), we find that young singles living with their parents do the least work at home and that the reduction is particularly strong for women in France and in Italy. In all countries, the transition out of the parental home entails an increase in the time devoted to domestic activities. Note also that both young single men and those living in couple spend the same amount of time on domestic activities in Sweden and in
11 A large majority of female older singles are either widows (67% in Italy and US, 75% in France), or
divorced/separated (11% in France and 25% in Italy and US). The rest are single.
14

France (parameter not significant at conventional level) and in Italy (small marginal effect), whereas for women, the fact of living in couple means in all countries a heavier burden in terms of unpaid work. Childless young female singles spend less time in domestic activities than their childless cohabiting counterparts, but in this case the differences are statistically significant everywhere and the marginal effect is not negligible, especially in Italy and in the US (table 7).
The greatest “revolution” in the time that individuals spend in unpaid work is related to the presence of children, especially the youngest (under 6 years old). When they become mothers, Italian women are those whose domestic time increases (in absolute terms) the most (more than 22 hours on average per week) followed by American women (more than 18 hours on average per week), all other things being equal (table 7). French and Swedish women increased it by about 16 hours. As children grow up, women reduce the time devoted to unpaid work, but when children are teenagers or young adults (16-25) they still spend from 5 hours more per week (in Sweden) to 13 hours more (in Italy) in unpaid work than cohabiting women without children.
Young fathers’ involvement in the domestic sphere is more heterogeneous across countries. Swedish fathers significantly increase the amount of time spent in domestic tasks and care activities when they have pre-school children (more than 10 hours a week) and they also maintain their involvement as children grow up (around 6 hours). Their Italian or French counterparts show a smaller change when children are younger (around 6 hours), and only a very small one when children grow up. US fathers are in an intermediate position.
For the fathers with resident 16-25 year-olds, things are also different across countries (table 7). Italian, French and American men with children aged 16 to 25 increase their involvement by less than 2 hours a week with respect to childless cohabiting men, whereas Swedish fathers spend more time on domestic chores than cohabiting men without children (more than 5 hours per week).
Overall, both men and women in an “empty nest” family spend, ceteris paribus, more time in domestic activities than the reference category (table 7). In Italy, France and Sweden compared to mothers of 16-25 year-olds, the quantity of unpaid work decreases when children have left the parental home. An even larger reduction is observed in the US. Only in Sweden, do men in empty nest families slightly reduce the time devoted to unpaid work compared to fathers of 16-25 year-olds. Conversely, in Italy and in France the time increases whereas in the US we do not find any statistically significant effect at conventional level.
Retirement is associated overall with an intensification of men’s participation in unpaid work, while female participation decreases only in France (table 7). In Italy the male contribution increases only slightly, while in Sweden and especially in the US the intensification is more notable.
Lastly, widowhood/singlehood has opposite effects on the time devoted to domestic activities for men and women (table 7): it is much higher for men and lower for women compared to the same age categories still living in a couple. Of course, being single reduces the total amount of housework and this result is beneficial for widows/singles. Conversely, widowers are obliged to do the domestic tasks previously performed by their wife. The effect seems to be particularly strong in Italy and in France. In the US the involvement of older widows/singles in unpaid work is also lower with respect to the reference category.
15
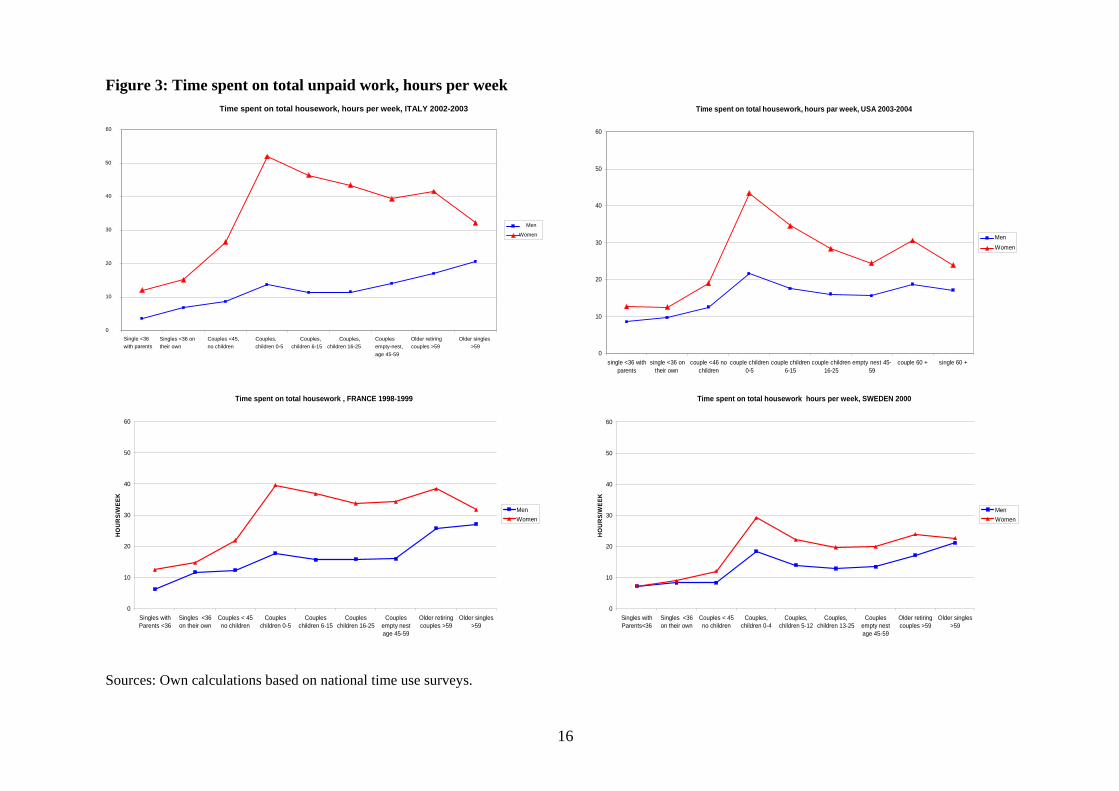
Figure 3: Time spent on total unpaid work, hours per week Time spent on total housework, hours par week, USA 2003-2004
0
10
20
30
40
50
60
single <36 withparents
single <36 ontheir own
couple <46 nochildren
couple children0-5
couple children6-15
couple children16-25
empty nest 45-59
couple 60 + single 60 +
MenWomen
Time spent on total housework , FRANCE 1998-1999
0
10
20
30
40
50
60
Singles withParents <36
Singles <36on their own
Couples < 45no children
Coupleschildren 0-5
Coupleschildren 6-15
Coupleschildren 16-25
Couplesempty nestage 45-59
Older retiringcouples >59
Older singles>59
HO
UR
S/W
EEK
MenWomen
Time spent on total housework hours per week, SWEDEN 2000
0
10
20
30
40
50
60
Singles withParents<36
Singles <36on their own
Couples < 45no children
Couples,children 0-4
Couples,children 5-12
Couples,children 13-25
Couplesempty nestage 45-59
Older retiringcouples >59
Older singles>59
HO
UR
S/W
EEK
MenWomen
Time spent on total housework, hours per week, ITALY 2002-2003
Singles <36 ontheir own
Couples <45, no children Couples,
children 0-5 Couples, children 6-15 Couples,
children 16-25Couplesempty-nest,age 45-59
Older retiringcouples >59
Older singles>59
Men
Women
60
50
40
30
20
10
0 Single <36 with parents
Sources: Own calculations based on national time use surveys.
16

Table 7: Marginal effects from Tobit model for total housework time (evaluated at sample mean, bootstrap) by country and gender FRANCE ITALY SWEDEN US Men Women Men Women Men Women Men Women dy/dx P>|z| dy/dx P>|z| dy/dx P>|z| dy/dx P>|z| dy/dxdy/dx P>|z| P>|z| dy/dx P>|z| dy/dx P>|z|Household life-course typologies (ref.: couple <46 no children) Single <36 with parents -10.63 0.000 -17.63 0.000 -7.71 0.000 -16.39 0.000 -2.77 0.111 -5.79 0.000 -6.70 0.000 -11.18 0.000 Single <36 on their own -0.03 0.982 -5.36 0.000 -2.73 0.000 -10.10 0.000 -1.27 0.106 -3.04 0.000 -4.19 0.000 -9.50 0.000 Couple children 0-5 5.53 0.000 16.04 0.000 6.15 0.000 22.67 0.000 10.42 0.000 15.93 0.000 7.43 0.000 18.19 0.000 Couple children 6-15 3.14 0.000 11.78 0.000 2.63 0.000 16.19 0.000 6.04 0.000 9.38 0.000 3.77 0.000 10.17 0.000 Couple children 16-25 1.71 0.050 9.59 0.000 1.31 0.001 13.17 0.000 5.46 0.000 7.59 0.000 1.03 0.154 4.74 0.000 Empty nest 46-59 2.85 0.015 8.72 0.000 2.69 0.000 10.27 0.000 5.12 0.000 7.47 0.000 0.40 0.493 1.44 0.014 Couple 60 + 6.65 0.000 7.26 0.000 4.36 0.000 10.45 0.000 6.88 0.000 9.94 0.000 1.41 0.011 4.04 0.000 Single 60 + 7.91 0.000 2.20 0.028 9.30 0.000 1.38 0.039 9.41 0.000 7.55 0.000 1.75 0.003 -1.55 0.004 Other characteristics Predicted wage 0.00 0.000 0.00 0.000 Non labour income 0.00 0.008 0.00 0.018 Income (elasticity) -0.04 0.163 0.01 0.488
Low income/ec. sit. (ref.: med.) -3.40 0.000 -1.45 0.191 -3.43 0.001 2.42 0.016 High income/ec. sit. (ref.: med.) 0.50 0.028 1.94 0.000 -0.04 0.904 -0.74 0.071 Low education (ref.: medium) -0.38 0.456 0.66 0.286 -0.70 0.003 3.31 0.000 -0.30 0.674 0.23 0.754 -1.93 0.003 -0.02 0.982 High education (ref.: medium) 0.77 0.141 0.31 0.649 0.33 0.284 -1.67 0.000 0.19 0.641 0.96 0.094 0.77 0.020 -0.43 0.244 French citizenship 1.63 0.094 -1.38 0.214 Hispanic (ref.: White non Hisp.) -1.88 0.001 0.16 0.766 Black (ref.: White non Hispanic) -3.53 0.000 -5.04 0.000 Others (ref.: White non Hispanic) -1.51 0.011 0.60 0.471 Living in big city -0.02 0.964 -0.74 0.186 0.11 0.631 -0.65 0.038 -3.17 0.000 -2.04 0.000 -0.40 0.193 0.04 0.883 Paid domestic services -0.04 0.955 -4.36 0.000 -0.09 0.004 -0.33 0.000 Home owner 1.02 0.000 -0.33 0.380 House dweller 2.47 0.000 0.35 0.655 Number of rooms in house or flat -0.04 0.853 0.87 0.000 0.12 0.122 0.08 0.430 Garden 1.95 0.002 2.28 0.001 1.37 0.000 0.66 0.026 Centre (ref.: North) -0.67 0.009 1.89 0.000 South (ref.: North) -2.69 0.000 4.22 0.000 Midwest (ref.: North East) -0.04 0.922 -0.92 0.038 South (ref.: North East) -0.38 0.348 -1.79 0.000 West (ref.: North East) 0.45 0.352 -1.07 0.030 Saturday (ref.: Mon-Fri) 6.88 0.000 4.08 0.000 3.77 0.000 2.34 0.000 4.22 0.000 3.14 0.000 6.71 0.000 4.80 0.000 Sunday (ref.: Mon-Fri) 0.26 0.687 -2.48 0.000 0.03 0.895 -5.40 0.000 3.70 0.000 1.54 0.021 5.17 0.000 0.31 0.415 Expected value 16.7 31.9 11.5 34.4 15.2 21.3 18.4 28.3 Number of obs. 4,768 5,069 16,187 17,096 2,893 3,329 12,555 16,268 Censored obs. 887 150 4,814 914 363 112 1,978 887 Log likelihood -17444 -20755 -52224 -70361 -10749 -13237 -49209 -69937 Prob. > chi2 0.000 0.000 0.000 0.000 0.000 0.000 0.000 0.000 Pseudo R2 0.029 0.047 0.028 0.057 0.017 0.022 0.010 0.017
17

7. Time spent on leisure over the life-cycle The pattern of time spent on leisure over the life-cycle is very similar across countries,
following a u-curve with high level of leisure at the two ends of the age distribution (Figure 4). The gender gap in leisure time12 is much smaller than for paid and unpaid work and this gap varies less according to the stages of the life course. However, we observe some gender discrepancies across countries; leisure time being higher for men than for women, except in Sweden. The gender gap is larger in Italy and almost negligible in Sweden, consistent with what we have seen for market and unpaid work.
Not surprisingly, retired people and young men and women still living with their parents have higher levels of leisure. When they quit their parents, on average much earlier than their counterparts in the other countries, Swedish boys and girls are the only ones who increase their leisure time, whereas the transition out of the parental home entails a reduction of leisure time in the other countries. As shown by the estimation results (table 8), French, Italian and Swedish female childless singles have more leisure time than cohabiting childless women, though this is not the case in America. Except for Sweden, there are no differences for men: living in a childless couple allows French, US and Italian men to maintain their previous leisure level.
The negative impact on leisure of having pre-school children is universal (significant in the four countries and for both sexes) and always significantly stronger for women. For children between 6 and 15 years old, the penalty on their mothers’ leisure is still high in the four countries. It disappears for French and Italian fathers, but not for Swedish and US fathers, reflecting their stronger involvement in parental tasks. Later, with 16-25 year-olds, the penalty is still large for Swedish and US mothers, whereas a noticeable leisure gain is observed for Italian fathers (table 8). The negative impact of children on fathers’ leisure, more persistent in Sweden and the United States (not only visible for pre-school children), disappears for older teenagers and young adults still living at the parental home (16-25 years old).
When the children leave the parental home (empty nest) and later, the gender gap remains: men’s leisure time is always higher than women’s, but again the gender gap is significantly lower in Sweden. For couples over 60, the gender differences remains large: ceteris paribus, the increase in leisure time for cohabiting men is twice that of their female counterparts in France, Italy and Sweden. Women have to wait until widowhood/singlehood in older age to overtake male leisure time in France and Italy (the merry widows). In the United States, leisure seems to be more equally shared between genders, the time spent on leisure activities becoming similar between spouses over 60 years old or between widows and widowers.
Finally, the pattern of leisure by gender is obviously the counterpart of working and housework
history. The life stages where time is the most constrained, such as preschool childrearing, are those where leisure is the most reduced. At those crucial stages, the gender gap is particularly low, as if inequalities between parents in leisure time would be considered unfair. One explanation of this comparable level of leisure time between mothers and fathers would be that they spend their scarce leisure time together. The data we use do not allow us to check this explanation, as individuals and not couples are interviewed, except in France. But, Hamermersh (2002) on British data, and Barnet-Verzat et al (2007) on French data, found that the leisure time spent together by partners is also reduced for young parents. So, this level of leisure seems to be an individual minimum which cannot be cut down. However, this minimum level differs according to countries; it is especially low in Italy (about 20 minutes per day, 50% more in the other countries).
12 Leisure time is not exactly the complement of paid and unpaid work since physiological needs (sleeping,
personal care, etc) are not included.
18

Figure 4: Time spent on leisure, hours per week Time spent on leisure, hours par week, USA 2003-2004
0
10
20
30
40
50
60
70
single <36 withparents
single <36 ontheir own
couple <46 nochildren
couple children0-5
couple children6-15
couple children16-25
empty nest 46-59
couple 60 + single 60 +
MenWomen
Time spent on leisure, hours per week, FRANCE1998-1999
0
10
20
30
40
50
60
70
Singles withParents <36
Singles <36on their own
Couples < 45no children
Coupleschildren 0-5
Coupleschildren 6-15
Coupleschildren 16-25
Couplesempty nestage 45-59
Older retiringcouples >59
Older singles>59
HO
UR
S/W
EEK
MenWomen
Time spent on leisure, hours per week, SWEDEN 2000
0
10
20
30
40
50
60
70
Singles withParents<36
Singles <36on their own
Couples < 45no children
Couples,children 0-4
Couples,children 5-12
Couples,children 13-25
Couplesempty nestage 45-59
Older retiringcouples >59
Older singles>59
HO
UR
S/W
EEK
MenWomen
Time spent on leisure, hours per week, ITALY 2002-2003
Singles <36 ontheir own
Couples <45, no children Couples,
children 0-5 Couples,children 6-15
Couples,children 16-25
Couplesempty-nest,age 45-59
Older retiringcouples >59
Older singles>59
MenWomen
70
60
50
40
30
20
10
0 Single <36
with parents
Sources: Own calculations based on time use surveys
19

Table 8: Marginal effects from OLS regression model for leisure time, by country and gender FRANCE ITALY SWEDEN US Men Women Men Women Men Women Men Women Coeff. P>|z| Coeff. P>|z| Coeff. P>|z| Coeff. P>|z| Coeff.Coeff. P>|z| P>|z| Coeff. P>|z| Coeff. P>|z|Constant 35.13 0.000 33.31 0.000 26.49 0.000 22.86 0.000 36.53 0.000 40.59 0.000 35.81 0.000 32.95 0.000Household life-course typologies (ref.: couple <46 no children) Single <36 with parents 5.93 0.000 4.18 0.004 7.43 0.000 8.26 0.000 6.91 0.038 1.64 0.580 3.44 0.001 4.68 0.000 Single <36 on their own 1.70 0.299 3.92 0.018 1.60 0.117 2.71 0.004 8.33 0.000 6.97 0.000 0.35 0.717 -0.69 0.507 Couple children 0-5 -3.51 0.004 -5.13 0.000 -4.43 0.000 -5.83 0.000 -5.19 0.000 -7.12 0.000 -7.20 0.000 -11.20 0.000 Couple children 6-15 -1.77 0.139 -5.00 0.000 -0.43 0.523 -3.83 0.000 -4.16 0.013 -7.48 0.000 -4.23 0.000 -7.40 0.000 Couple children 16-25 1.97 0.140 -1.93 0.108 4.26 0.000 -0.40 0.461 0.90 0.656 -5.83 0.000 -0.81 0.306 -3.52 0.000 Empty nest 46-59 2.59 0.061 0.51 0.672 5.84 0.000 1.68 0.012 1.71 0.288 -2.11 0.096 2.51 0.000 0.24 0.786 Couple 60 + 10.02 0.000 5.07 0.000 15.11 0.000 6.47 0.000 14.17 0.000 8.58 0.000 11.37 0.000 12.25 0.000 Single 60 + 10.77 0.000 12.87 0.000 11.37 0.000 11.89 0.000 18.04 0.000 11.86 0.000 16.10 0.000 15.04 0.000 Other characteristics Predicted wage 0.00 0.000 0.00 0.000 Non labour income 0.00 0.001 0.00 0.000 Income (elasticity) -0.54 0.003 -0.032 0.021 Low income/ec. sit. (ref.: med.) 0.47 0.633 0.65 0.395 2.79 0.000 3.56 0.000 High income/ec. sit. (ref.: med.) 0.65 0.068 -0.32 0.234 -1.58 0.000 -2.12 0.000 Low education (ref.: medium) -0.19 0.790 -0.88 0.133 -1.97 0.000 -1.06 0.000 1.62 0.115 1.14 0.228 0.90 0.311 1.67 0.124 High education (ref.: medium) 3.14 0.000 1.50 0.020 -0.64 0.257 0.72 0.112 0.65 0.492 -1.35 0.074 -1.95 0.000 -2.16 0.000 French citizenship -0.15 0.908 0.62 0.591 Hispanic (ref.: White non Hisp.) -4.34 0.000 -2.42 0.002 Black (ref.: White non Hispanic) 1.54 0.014 7.01 0.000 Others (ref.: White non Hispanic) -2.45 0.004 0.90 0.374 Living in big city -0.79 0.198 -0.33 0.522 1.18 0.000 1.48 0.000 3.82 0.000 1.51 0.046 0.57 0.123 0.33 0.482 Domestic paid services -0.28 0.797 2.18 0.019 -0.05 0.240 0.09 0.008 House dweller -4.37 0.000 -2.08 0.010 Number of rooms in house or flat 0.43 0.086 -0.22 0.300 -0.22 0.027 -0.10 0.181 Garden -0.21 0.826 -0.78 0.308 -1.85 0.000 -0.68 0.009 Home owner 0.13 0.708 -0.57 0.041 Centre (ref.: North) -2.13 0.000 -2.64 0.000 South (ref.: North) -1.68 0.000 -1.56 0.000 Midwest (ref.: North East) -0.28 0.593 0.10 0.871 South (ref.: North East) -0.06 0.910 0.24 0.694 West (ref.: North East) -1.03 0.058 0.01 0.987 Saturday (ref.: Mon-Fri) 14.74 0.000 7.64 0.000 7.96 0.000 3.03 0.000 17.60 0.000 13.17 0.000 9.62 0.000 15.30 0.000 Sunday (ref.: Mon-Fri) 22.87 0.000 15.10 0.000 15.79 0.000 8.87 0.000 13.38 0.000 10.31 0.000 13.37 0.000 17.79 0.000 Model Number of obs. 4,768 5,069 16,187 17,096 2,893 3,329 16,268 12,555 R-squared 0.306 0.281 0.187 0.185 0.223 0.188 0.175 0.206
20

8. Conclusion This study examined time allocation over the life cycle in a gender and comparative
perspective. Our hypotheses were that disparities in the institutional and societal context i) do influence the extent of involvement in various activities of men and women, and ii) shape differences in gender roles across countries to varying degrees according to life cycle stages. For that purpose, we compared Italy, France, Sweden and the United States, which represent different institutional contexts and diverge significantly in terms of welfare regimes, employment systems, family policy and social norms. We distinguished nine key life-cycle stages according to age and family structure, reflecting major life events and life stages for a majority of individuals, such as the transition out of the parental home, union formation, parenthood and retirement phases.
In a gender and comparative perspective, this life course approach gives a new and innovative way of analysing time allocation. Indeed, our results show large discrepancies in the gender division of labour at the different life stages. This gender gap, which exists in all countries at all stages of the life course, is usually smaller at the two ends of the age distribution, but larger with parenthood. Pre-school children especially reinforce the gender gap in time allocation, particularly for participation in domestic chores and care activities.
Despite these similarities we find large cross-country differences; different contexts shape gender roles in different ways. If social norms play a huge role in explaining the large and persistent gender differences in time allocation, the design of family policies and employment regimes may also play a non-negligible role in the cross-country differences along the life-cyle. Thanks to its active gender and work-family balance policies, Sweden presents the lowest gender gap in time allocation, while Italy presents the largest. This gender gap is of comparable level in France and the US. This intermediate level is due to the provision of subsidized childcare facilities in France while it comes from less traditional gender roles in the US, as reflected in the Gender empowerment index for instance.
Moreover, the influence of phases in the life course on the gender gap varies between countries : Italian leisure is more sensitive to life-course phases than Sweden. The widening of the gender gap in time allocation starts also at different life stages across countries. The decline of female labour supply starts at the time of union formation in Italy and the US, whereas in France and Sweden, the fall in market work coincides with the presence of pre-school children. For unpaid work likewise, the gender gap starts increasing with union formation in France and in Italy –characterised by more traditional gender roles– while in the other countries it widens only with the presence of children.
The duration of the impact of parenthood on time allocation varies according to countries. In countries where work-family balance policies are more effective and traditionally well-established such as in Sweden and France, the major effect of having young children is a temporary reduction of paid working time. Conversely, in countries where family policies are almost absent (US) or where the provision of public child care services is limited (Italy and the US), a significant share of women still withdraw from the labour market. Italy is the only country where the female employment rate does not start rising again when children become older.
Lastly, to finish on a fairy tale note, their long experience in doing more housework may benefit women at the end of their life: female (merry) widows spend then less time on housework than their male counterparts. This is the only life-course phase in which gender roles are reversed.
References Anxo D. and Niklasson H. (2006): The Swedish Model in Turbulent Times: Decline or
Renaissance? International Labour Review, Vol. 145 (2006), No. 4 2006, Geneva
21

Anxo D., Fagan C., Cebriuan I. and Moreno G. (2006): Patterns of Labour Market Integration in Europe: a Life Course Perspective on Time Policies, the Socio-Economic Review, Vol. 5 no 2, Oxford University Press, 2007.
Anxo D,. C. Fagan, M-T Letablier., C Peraudin and M. Smith (2007) Parental leave in European companies, European Foundation for the Improvement of Working Life and Working Conditions, Dublin, 2007.
Apps P. and Rees R. (2005), Gender, Time Use and Public Policies over the Life-cycle, Discussion Paper Series, IZA, n. 1855.
Barbagli, M., Castiglioni, M., Dalla Zuanna, G. (2003), Fare famiglia in Italia. Un secolo di cambiamenti. Il Mulino, Bologna.
Barnet-Verzat C., Pailhé A., Solaz A. (2007), “ Being together or entertaining together ? The impact of children on couples' activity synchronization” working paper.
Blossfeld H.P. and Drobnic S., 2001, Careers of Couples in Contemporary Society. From Male Breadwinner to Dual-Earner Families”, Oxford University Press.
BLS (2006): American Time Use survey 2004-2005, Bureau of Labor Statistics, Department of Labor, http://www.bls.gov/tus/.
Burda M. C., Hamermesh D. S., Weil P., 2006, “The distribution of Total Work in the EU and US”, IZA DP No 2270.
Caldwell J. C., Schindlmayr T. 2004. “Explanations of the fertility crisis in modern societies : a research for commonalities.” Population studies, vol. 57, n° 3, November 2003, p. 241-263.
Del Boca, D., Locatelli, M., Pasqua, S. and Pronzato, C. (2003) ‘Analysing Women’s Employment and Fertility Rates in Europe: Differences and Similarities in Northern and Southern Europe’, paper presented at the Epunet conference (June), Colcester.
Del Boca, D., Aaberge, R., Colombino, U., Ermisch, J., Francesconi, M., Pasqua, S, and Strom, S. (2005) ‘Labour Market Participation of Women and Fertility: the Effect of Social Policies’, in T. Boeri, D. Del Boca and C. Pissarides (eds) European Women at Work: an Economic Perspective. Oxford: Oxford University Press.
Esping-Andersen, G. (1990) The three Worlds of Welfare Capitalism. Princeton: Princeton University Press.
Esping-Andersen, G. (1999) The Social Foundations of Post-industrial Economies. Oxford: Oxford University Press.
Glick, 1947: The Family Cycle, American Sociological Review, Vol 12, no2, 1947, pp 164-174.
Gornick, Meyers and Ross (1997): Supporting the employment of mothers: policy variation across fourteen welfare states. Journal of European social policy 7/1, 45-70
Datta Gupta N., R.L. Oaxaca & N. Smith (2001), Swimming upstream, floating downstream : trends in the U.S. and Danish gender wage gaps, CLS Working Paper 01-06.
Hamermesh D. (2002), "Timing, togetherness and time windfalls, Journal of Population Economics, 15.
Heckman J. (1978), «Dummy Endogenous Variables in a Simultaneous Equation System», Econometrica, vol. 46, n 4, pp. 931-960.
Hochschild A. (1989), The second shift. Working parents and the revolution at home, Viking, New York.
22

Insee (2000), Enquête emploi du temps, 1998/1999, Institut National de la Statistique et Etudes Econmiques, Paris.
Istat (2005), Rapporto Annuale - La situazione del Paese nel 2004, Par. 4.3, pp 258-271, Istat, 2005, http://www.istat.it/dati/catalogo/rapporto2004/rapporto2004.pdf .
Istat (2005): L’uso del tempo, anni 2002-2003 2002/2003, Instituto Nazionale de Statistica, Roma, Italy.
Leher E., Nerlove M. (1986) Female Labor Force Behavior and Fertility in the United States. Annual Review of Sociology 12: 181-204.
Lewis J., 1992 Gender and the Development of Welfare Regimes”, Journal of European Social Policy, 2(3), 159-173.
Lundberg Shelly; Rose Elaina. (2005) " The Determinants of Specialization within Marriage," <http://www.econ.washington.edu/user/erose/spec.pdf> working paper UWEC-2005-07
Mathews B. (1999), The gender system and fertility: an exploration of the hidden links, Canadian Studies in Population, 26 (1), 21-38.
McDonald P. (2000), Gender equity in theories of fertility, Population and Development Review, 26 (3), 427-439.
Mincer J., Polachek S., 1974 : « Family Investments in Human Capital : Earnings of Women », Journal of Political Economy, vol. 82, n° 2, pp. S76-S108.
Neyer Gerda. 2003. “Family policies and low fertility in Western Europe.” MPIDR working paper WP 2003-021.
OECD (2001) Employment Outlook, June. Paris: OECD Publications.
OECD. (2002). Babies and bosses: reconciling work and family life: volume 1,Australia, Denmark, and the Netherlands. Organization for Economic Co-operation and Devlopment. Paris: OECD Publications.
Pailhé A., Solaz A., 2006, « Employment and childbearing: women bear the burden of the work-family balance », Population and societies, n°426.
Scisci A., Vinci M. (2002), Differenze di genere, famiglia e lavoro, Carocci, Roma.
Statitics Sweden (2002): Time Use Survey 2000/2001, "Tidsanvändningsundersökningar 2000/01", Statistiska Centralbyrå, Stocholm, Sweden
United Nations (2006) Human Development Report, http://hdr.undp.org/hdr2006/report.cfmUNDP, NY.
23

Statistical appendix Table A1: Household life-course typologies in the country surveys sample FRANCE Total Men Women
Household life-course typologies N % weighted N % weighted N % weighted
Single <36 with parents 1,027 9.0 551 10.3 476 7.8 Single <36 on their own 411 4.3 218 4.7 193 3.9 Couple <46 no children 752 6.9 358 7.0 394 6.8 Couple children 0-5 1,078 7.6 540 7.8 538 7.3 Couple children 6-15 2,085 15.8 1,030 16.4 1,055 15.3 Couple children 16-25 1,383 11.1 691 11.6 692 10.5 Empty nest 46-59 1,042 7.4 467 7.1 575 7.7 Couple 60 + 1,851 13.8 963 14.8 888 12.8 Single 60 + 749 6.1 182 3.2 567 8.8 Total excluded 2,064 18.2 903 17.1 1,161 19.2 single-parent families 676 5.8 199 3.7 477 7.8 single 36-59 518 4.6 274 5.3 244 3.9 other excluded 870 7.8 430 8.1 440 7.5
Total 12,442 100.0 5,903 100.0 6,539 100.0 Source: INSEE (2000) and own calculations ITALY Total Men Women
Household life-course typologies N % weighted N % weighted N % weighted
Single <36 with parents 7,130 16.8 3,845 19.3 3,285 14.5 Single <36 on their own 875 2.2 510 2.8 365 1.7 Couple <46 no children 1,803 4.7 855 4.6 948 4.7 Couple children 0-5 3,196 8.1 1,598 8.4 1,598 7.8 Couple children 6-15 5,418 12.2 2,696 12.6 2,722 11.8 Couple children 16-25 5,754 13.1 2,859 13.6 2,895 12.7 Empty nest 46-59 1,668 3.7 686 3.2 982 4.2 Couple 60 + 4,801 12.0 2,487 12.8 2,314 11.3 Single 60 + 2,645 6.86 652 3.31 1,993 10.13 Total excluded 8,150 20.3 3,666 19.3 4,,484 21.2 single-parent families 2,107 5.3 531 2.8 1576 7.5 single 36-59 1,512 3.8 850 4.6 662 3.1 other excluded 4,531 11.2 2,285 11.9 2,246 10.7
Total 41,440 100.0 19,854 100.0 21,586 100.0 Source: Istat (2005) and own calculations
24

(Table A1 continued) SWEDEN Total Men Women
Household life-course typologies N % weighted N % weighted N % weighted
Single <36 with parents 105 1.7 52 1.9 53 1.5 Single <36 on their own 594 9.4 362 12.8 232 6.3 Couple <46 no children 729 9.3 315 9.3 414 9.4 Couple children 0-5 1,245 15.2 559 15.4 686 15.0 Couple children 6-15 754 8.9 312 9.0 442 8.9 Couple children 16-25 431 5.2 182 5.2 249 5.2 Empty nest 46-59 1,187 15.5 527 14.3 660 16.7 Couple 60 + 805 15.1 409 15.6 396 14.7 Single 60 + 372 7.8 175 5.4 197 10.1 Total excluded 1,050 11.7 317 11.3 733 12.3 single-parent families 593 4.4 94 3.5 499 5.4 single 36-59 457 7.3 223 7.8 234 6.9 other excluded Total 7,272 100.0 3,210 100.0 4,062 100.0 Source: Statistics Sweden (2002) and own calculations UNITED STATES Total Men Women
Household life-course typologies N % weighted N % weighted N % weighted
Single <36 with parents 1,479 8.8 813 10.7 666 7.2 Single <36 on their own 1,453 5.4 831 6.9 622 4.0 Couple <46 no children 1,936 8.3 896 8.7 1,040 7.9 Couple children 0-5 3,681 9.5 1,755 9.9 1,926 9.2 Couple children 6-15 5,595 14.3 2,578 14.7 3,017 13.9 Couple children 16-25 1,773 7.7 848 8.1 925 7.2 Empty nest 46-59 2,859 9.2 1,267 9.0 1,592 9.3 Couple 60 + 3,745 11.9 1,979 13.3 1,766 10.7 Single 60 + 3,451 7.2 916 4.4 2,535 9.7 Total excluded 7,105 17.8 2,454 14.5 4,651 21.0 single-parent families 2,735 5.9 469 2.2 2,266 9.2 single 36-59 3,336 8.1 1650 9.5 1,686 6.9 other excluded 1,034 3.9 335 2.8 699 4.9 Total 33,077 100.0 14,337 100.0 18,740 100 Source: BLS (2006) and own calculations
25

Table A2: Descriptive statistics by country FRANCE Men Women Mean St Dev Min Max Mean St Dev Min Max Background characteristics Age in years 44.9 17.1 18 80 46.0 17.6 18 80 Married or cohabiting 0.7 0.5 0 1 0.6 0.5 0 1 Num. resident children under 18 1.1 1.3 0 10 1.0 1.2 0 10 Living in big city more than 100,000 0.4 0.5 0 1 0.5 0.5 0 1 French citizenship 1.0 0.2 0 1 1.0 0.2 0 1 Low education 0.3 0.5 0 1 0.4 0.5 0 1 Medium education 0.4 0.5 0 1 0.3 0.5 0 1 High education 0.3 0.5 0 1 0.3 0.4 0 1 In paid employment 0.6 0.5 0 1 0.4 0.5 0 1 Out of labour force=1 0.3 0.5 0 1 0.5 0.5 0 1 Equalised hh income FrFranc/month 9408 6033 1500 60000 9038 5688 1500 60000 Monthly non-labour income 2236 3997 0 60000 4095 4484 0 60000 Monthly wage, predicted 6690 7334 0 85200 3270 4678 0 40000Time use: hours per week Market work 26.6 31.5 0 122.5 15.0 24.9 0 119 Housework 14.6 15.9 0 82.83 27.6 17.0 0 91 Care 2.0 4.9 0 78.17 3.9 7.4 0 71.17 Total unpaid work 16.5 16.9 0 88.67 31.5 18.8 0 94.5 Total work (paid and unpaid) 43.1 27.7 0 122.5 46.5 22.9 0 121.3 Leisure 38.0 22.9 0 123.7 33.66 19.3 0 106.2Share of participants doing activity on day of interview Market work 0.48 0.5 0 1 0.31 0.46 0 1 Housework 0.77 0.43 0 1 0.96 0.19 0 1 Care 0.26 0.44 0 1 0.38 0.48 0 1 Total unpaid work 0.81 0.4 0 1 0.97 0.18 0 1 Total work (paid and unpaid) 0.94 0.23 0 1 0.99 0.12 0 1 Leisure 0.98 0.13 0 1 0.98 0.14 0 1Other variables Domestic paid services 0.07 0.27 0 1 0.08 0.27 0 1 House dweller 0.66 0.48 0 1 0.64 0.48 0 1 Number of rooms in house or flat 4.2 1.5 0 1 4.1 1.5 0 1 Access to a garden 0.66 0.48 0 1 0.64 0.48 0 1Sample size 4,768 5,069 Source: INSEE (2000) and own calculations
26

(Table A2 continued) ITALY Men Women Mean St Dev Min Max Mean St Dev Min Max Background characteristics Age in years 46.2 16.7 18 80 47.5 17.3 18 80 Married 0.6 0.5 0 1 0.6 0.5 0 1 Num. resident children under 18 0.4 0.8 0 7 0.4 0.8 0 7 Living in big city more than 50,000 0.4 0.5 0 1 0.4 0.5 0 1 Low education 0.6 0.5 0 1 0.6 0.5 0 1 Medium education 0.3 0.5 0 1 0.3 0.5 0 1 High education 0.1 0.3 0 1 0.1 0.3 0 1 In paid employment 0.6 0.5 0 1 0.4 0.5 0 1 Out of labour force 0.3 0.5 0 1 0.6 0.5 0 1Time use: hours per week Market work 20.0 28.6 0 144.7 8.7 19.6 0 143.5 Housework 10.3 13.6 0 91.0 32.1 19.6 0 133.0 Care 2.0 6.0 0 78.2 4.0 8.9 0 94.5 Total unpaid work 11.8 14.6 0 91.0 35.4 21.4 0 133.0 Total work (paid and unpaid) 31.8 27.6 0 144.7 44.0 23.4 0 149.3 Leisure 36.1 20.9 0 123.7 27.2 16.5 0 136.5Share of participants doing activity on day of interview Market work 0.38 0.49 0 1 0.19 0.40 0 1 Housework 0.67 0.48 0 1 0.95 0.22 0 1 Care 0.25 0.44 0 1 0.37 0.49 0 1 Total unpaid work 0.71 0.46 0 1 0.95 0.22 0 1 Total work (paid and unpaid) 0.86 0.35 0 1 0.97 0.18 0 1 Leisure 0.98 0.15 0 1 0.97 0.17 0 1Other variables Low economic situation 0.02 0.15 0 0.02 0.15 0 1 0.02 Medium economic situation 0.73 0.45 0 0.72 0.45 0 1 0.72 High economic situation 0.24 0.43 0 0.26 0.44 0 1 0.26 Domestic paid services 0.59 3.74 0 90 0.63 4.17 0 129 Home owner 0.75 0.44 0 1 0.74 0.44 0 1 Number of rooms in house or flat 4.55 1.63 1 20 4.52 1.68 1 20 Garden 0.64 0.48 0 1 0.63 0.49 0 1 North 0.46 0.50 0 1 0.45 0.50 0 1 Centre 0.19 0.39 0 1 0.19 0.40 0 1 South 0.36 0.48 0 1 0.35 0.48 0 1Sample size 19,853 21,575 Source: Istat (2005) and own calculations
27

(Table A2 continued) SWEDEN Men Women Mean St Dev Min Max Mean St Dev Min Max Background characteristics Age in years 45.9 16.8 20 80 47.6 16.6 20 80 Married or cohabiting 0.8 0.4 0 1 0.8 0.4 0 1 Num. resident children under 18 0.7 1.1 0 6 0.6 1.0 0 6 Living in urban areas 0.7 0.5 0 1 0.7 0.4 0 1 Low education 0.3 0.5 0 1 0.3 0.4 0 1 Medium education 0.5 0.5 0 1 0.5 0.5 0 1 High education 0.3 0.5 0 1 0.3 0.4 0 1 In paid employment 0.7 0.5 0 1 0.6 0.5 0 1 Out of labour force=1 0.3 0.5 0 1 0.4 0.5 0 1 Equalized hh income SEK/month 15857 9097 0 95400 15415 9035 1000 141846 Monthly non labour income 20967 13002 0 126100 14385 7983 0 99999Time use: hours per week Market work 26.9 32.4 0 168.0 17.2 25.6 0 143.5 Housework 12.5 13.6 0 94.5 17.6 13.0 0 108.5 Care 1.6 4.5 0 70.0 3.3 7.3 0 75.8 Total unpaid work 14.1 14.3 0 94.5 20.9 14.8 0 134.2 Total work (paid and unpaid) 40.9 29.6 0 168.0 38.1 24.0 0 143.5 Leisure 45.6 24.3 0 131.8 44.6 20.9 0 126.0Share of participants doing activity on day of interview Market work 0.49 0.52 0 1 0.35 0.47 0 1 Housework 0.85 0.37 0 1 0.96 0.2 0 1 Care 0.21 0.42 0 1 0.31 0.46 0 1 Total unpaid work 0.87 0.35 0 1 0.97 0.18 0 1 Total work (paid and unpaid) 0.96 0.21 0 1 0.98 0.12 0 1 Leisure 0.99 0.11 0 1 1 0.06 0 1Sample size 2,893 3,329 Source: Statistics Sweden (2002) and own calculations
28

(Table A2 continued) UNITED STATES Men Women Mean St Dev Min Max Mean St Dev Min Max Background characteristics Age in years 44.8 17.4 18 80 46.2 16.6 18 80 Married or cohabiting 0.7 0.5 0 1 0.6 0.5 0 1 Num. resident children under 18 0.7 1.1 0 10 0.8 1.1 0 11 Living in large city 0.6 0.5 0 1 0.6 0.5 0 1 White non Hispanic 0.7 0.5 0 1 0.7 0.4 0 1 Hispanic 0.1 0.3 0 1 0.1 0.3 0 1 Black 0.1 0.3 0 1 0.1 0.3 0 1 Others 0.1 0.2 0 1 0.1 0.2 0 1 Low education 0.1 0.3 0 1 0.1 0.2 0 1 Medium education 0.4 0.5 0 1 0.4 0.5 0 1 High education 0.5 0.5 0 1 0.5 0.5 0 1 In paid employment 0.7 0.5 0 1 0.6 0.5 0 1 Equalized hh income US$/month 10 000 3.6 2.8 0.1 25 3.3 2.5 0.1 25Time use: hours per week Market work 30.2 33.6 0 166.8 19.7 26.3 0 162.8 Housework 11.6 16.3 0 149.3 19.7 17.2 0 125.4 Care 3.8 9.5 0 124.3 6.9 11.9 0 149.3 Total unpaid work 15.4 18.9 0 150.0 26.7 21.1 0 149.3 Total work (paid and unpaid) 45.6 31.7 0 166.8 46.3 25.8 0 163.3 Leisure 40.5 27.4 0 162.8 37.3 22.3 0 163.3Share of participants doing activity on day of interview Market work 0.54 0.52 0 1 0.40 0.46 0 1 Housework 0.74 0.46 0 1 0.91 0.28 0 1 Care 0.40 0.51 0 1 0.54 0.47 0 1 Total unpaid work 0.82 0.40 0 1 0.94 0.23 0 1 Total work (paid and unpaid) 0.93 0.26 0 1 0.97 0.16 0 1 Leisure 0.97 0.17 0 1 0.97 0.15 0 1Other variables North East 0.2 0.4 0 1 0.2 0.4 0 1 Midwest 0.3 0.5 0 1 0.3 0.4 0 1 South 0.3 0.5 0 1 0.4 0.5 0 1 West 0.2 0.4 0 1 0.2 0.4 0 1Sample size 14,337 18,740 Source:BLS (2006) and own calculations
29

Table A3: Detailed marginal effects from Heckman model for market work time: (evaluated at sample mean), by country and gender
FRANCE MEN WOMEN
Total effect
Conditional effect
Effect on participation
Total effect
Conditional effect
Effect on participation
dy/dx P>|z| dy/dx P>|z| dy/dx P>|z| dy/dx P>|z| dy/dx P>|z| dy/dx P>|z|Household life-course typologies (ref.: couple <46 no children) Single <36 with parents -4.75 0.011 -8.17 0.000 -0.03 0.414 -1.73 0.087 -5.70 0.003 -0.02 0.571 Single <36 on their own 1.09 0.661 -5.23 0.011 0.08
0.121 -1.16 0.367 -1.85 0.390 -0.02 0.502 Couple children 0-5 -1.85 0.359 -1.40 0.384 -0.03 0.480 -4.68 0.000 -4.86 0.007 -0.12 0.000 Couple children 6-15 -4.40 0.016 -1.84 0.220 -0.08 0.025 -2.62 0.002 -6.69 0.000 -0.04 0.115 Couple children 16-25 -7.15 0.000 -3.37 0.048 -0.13 0.000 -2.85 0.001 -8.54 0.000 -0.04 0.187 Empty nest 46-59 -8.70 0.000 -5.28 0.003 -0.15 0.000 -3.99 0.000 -8.58 0.000 -0.08 0.002 Couple 60 + -26.50 0.000 -20.12 0.000 -0.50 0.000 -9.87 0.000 -16.30 0.000 -0.26 0.000 Single 60 + -19.13 0.000 -10.25 0.099 -0.39 0.000 -9.18 0.000 -23.16 0.000 -0.23 0.000Other characteristics Predicted wage 0.00 0.000 0.00 0.000 0.00 0.000 0.00 0.000 0.00 0.000 0.00 0.000 Non labour income 0.00 0.003 0.00 0.039 0.00 0.017 0.00 0.000 0.00 0.002 0.00 0.000 Low education (ref.: medium) -1.75 0.160 -0.13 0.909 -0.04 0.123 -0.31 0.648 -0.09 0.939 -0.01 0.628 High education (ref.: medium)
-6.51 0.000 -4.81 0.000 -0.10 0.000 -0.14 0.840 -2.59 0.014 0.01 0.465
French citizenship 2.08 0.319 1.52 0.417 0.03 0.437 0.75 0.534 0.79 0.735 0.02 0.587 Living in big city more than 100,000
0.11 0.911 -1.37 0.091 0.01 0.436 -0.63 0.244 -1.34 0.131 -0.01 0.477
Saturday (ref.: Mon-Fri) -20.99 0.000 -13.43 0.000 -0.40 0.000 -7.42 0.000 -9.23 0.000 -0.20 0.000 Sunday (ref.: Mon-Fri) -23.85 0.000 -18.72 0.000 -0.47 0.000 -9.70 0.000 -17.11 0.000 -0.26 0.000 Expected value 20.0 47.5 0.42 7.4 33.9 0.22 Model
Number of obs. 4,768 5,069 Censored obs. 2,457 3,437 Wald chi2(14) 99.56 139.06 Log likelihood -11859 -8780 Prob. > chi2
0.000 0.000
Rho -.647 0.03 -0.65 0.03 Sigma 20.6 0.36 19.41 0.45 Lambda -13.35 0.81 -12.6 0.94
30
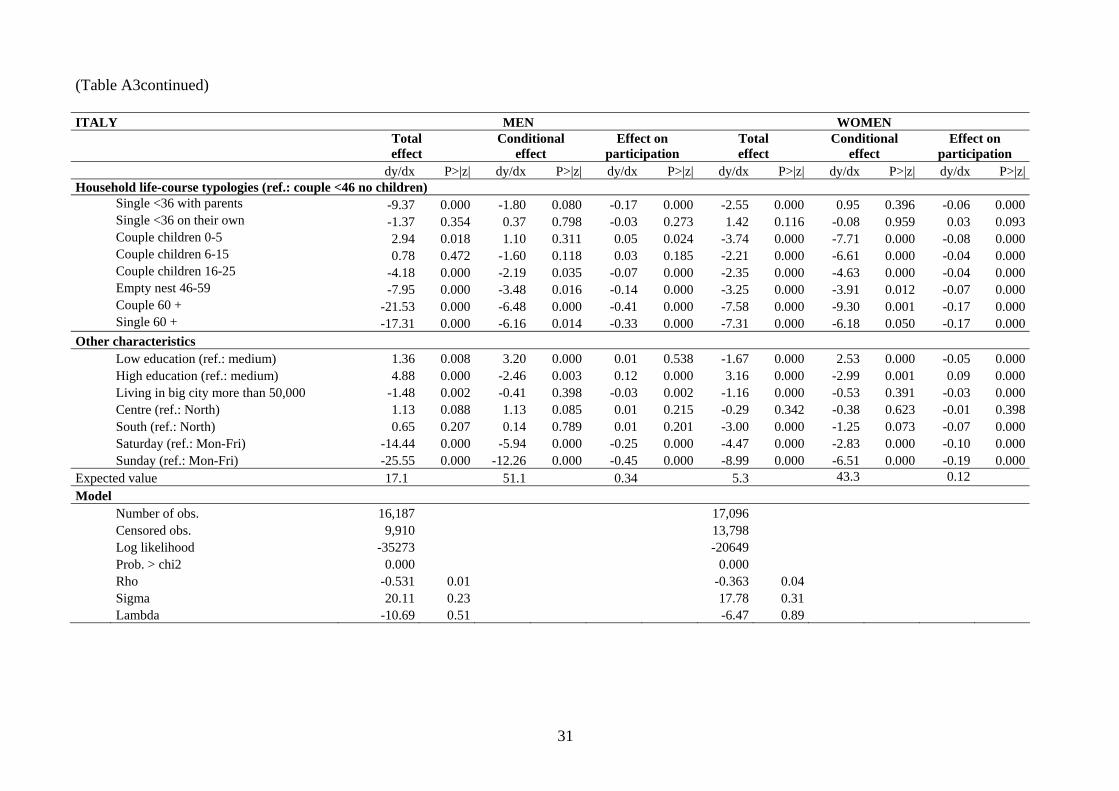
(Table A3continued) ITALY MEN WOMEN
Total effect
Conditional effect
Effect on participation
Total effect
Conditional effect
Effect on participation
dy/dx P>|z| dy/dx P>|z| dy/dx P>|z| dy/dx P>|z| dy/dx P>|z| dy/dx P>|z|Household life-course typologies (ref.: couple <46 no children) Single <36 with parents -9.37 0.000 -1.80 0.080 -0.17 0.000 -2.55 0.000 0.95 0.396 -0.06 0.000 Single <36 on their own -1.37 0.354 0.37 0.798 -0.03
0.273 1.42 0.116 -0.08 0.959 0.03 0.093 Couple children 0-5 2.94 0.018 1.10 0.311 0.05 0.024 -3.74 0.000 -7.71 0.000 -0.08 0.000 Couple children 6-15 0.78 0.472 -1.60 0.118 0.03 0.185 -2.21 0.000 -6.61 0.000 -0.04 0.000 Couple children 16-25 -4.18 0.000 -2.19 0.035 -0.07 0.000 -2.35 0.000 -4.63 0.000 -0.04 0.000 Empty nest 46-59 -7.95 0.000 -3.48 0.016 -0.14 0.000 -3.25 0.000 -3.91 0.012 -0.07 0.000 Couple 60 + -21.53 0.000 -6.48 0.000 -0.41 0.000 -7.58 0.000 -9.30 0.001 -0.17 0.000 Single 60 + -17.31 0.000 -6.16 0.014 -0.33 0.000 -7.31 0.000 -6.18 0.050 -0.17 0.000Other characteristics Low education (ref.: medium) 1.36 0.008 3.20 0.000 0.01 0.538 -1.67 0.000 2.53 0.000 -0.05 0.000 High education (ref.: medium) 4.88 0.000 -2.46 0.003 0.12 0.000 3.16 0.000 -2.99 0.001 0.09 0.000 Living in big city more than 50,000 -1.48 0.002 -0.41 0.398 -0.03 0.002 -1.16 0.000 -0.53 0.391 -0.03 0.000 Centre (ref.: North) 1.13 0.088 1.13 0.085 0.01 0.215 -0.29 0.342 -0.38 0.623 -0.01 0.398 South (ref.: North) 0.65 0.207 0.14 0.789 0.01 0.201 -3.00 0.000 -1.25 0.073 -0.07 0.000 Saturday (ref.: Mon-Fri) -14.44 0.000 -5.94 0.000 -0.25 0.000 -4.47 0.000 -2.83 0.000 -0.10 0.000 Sunday (ref.: Mon-Fri) -25.55 0.000 -12.26 0.000 -0.45 0.000 -8.99 0.000 -6.51 0.000 -0.19 0.000 Expected value 17.1 51.1 0.34 5.3 43.3 0.12 Model
Number of obs. 16,187 17,096 Censored obs. 9,910 13,798 Log likelihood -35273 -20649 Prob. > chi2
0.000 0.000
Rho -0.531 0.01 -0.363 0.04 Sigma 20.11 0.23 17.78 0.31 Lambda -10.69 0.51 -6.47 0.89
31
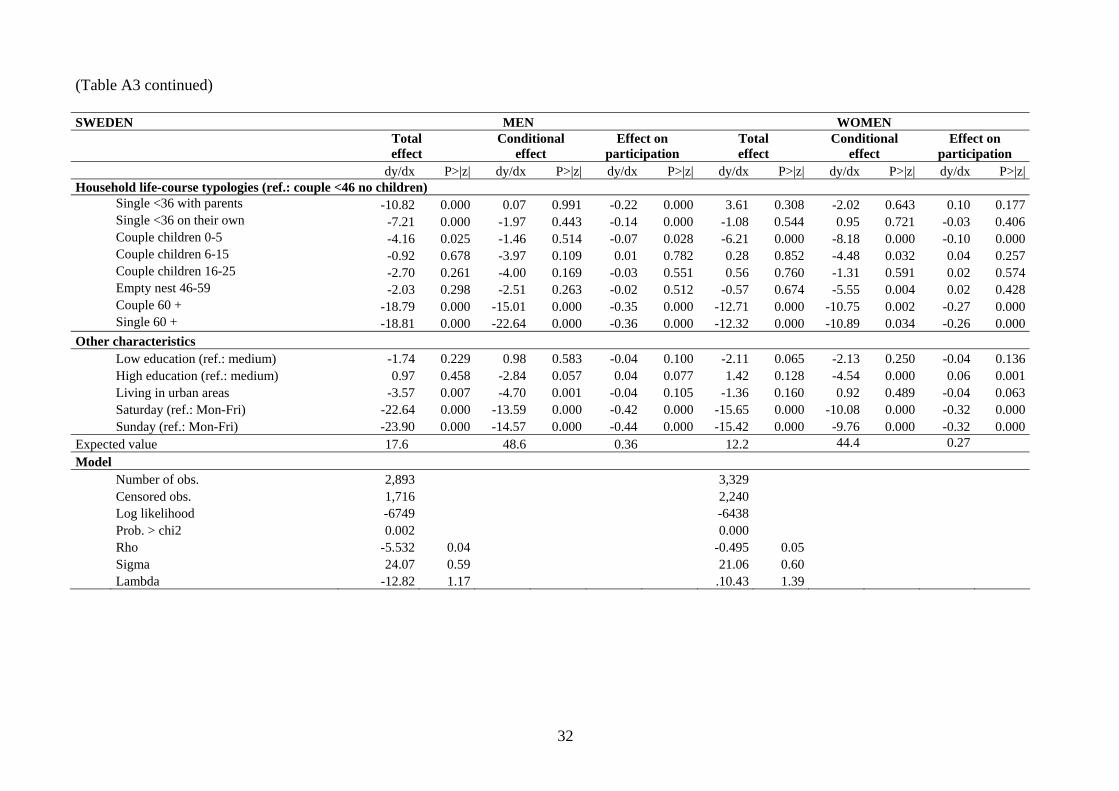
(Table A3 continued) SWEDEN MEN WOMEN
Total effect
Conditional effect
Effect on participation
Total effect
Conditional effect
Effect on participation
dy/dx P>|z| dy/dx P>|z| dy/dx P>|z| dy/dx P>|z| dy/dx P>|z| dy/dx P>|z|Household life-course typologies (ref.: couple <46 no children) Single <36 with parents -10.82 0.000 0.07 0.991 -0.22 0.000 3.61 0.308 -2.02 0.643 0.10 0.177 Single <36 on their own -7.21 0.000 -1.97 0.443 -0.14
0.000 -1.08 0.544 0.95 0.721 -0.03 0.406 Couple children 0-5 -4.16 0.025 -1.46 0.514 -0.07 0.028 -6.21 0.000 -8.18 0.000 -0.10 0.000 Couple children 6-15 -0.92 0.678 -3.97 0.109 0.01 0.782 0.28 0.852 -4.48 0.032 0.04 0.257 Couple children 16-25 -2.70 0.261 -4.00 0.169 -0.03 0.551 0.56 0.760 -1.31 0.591 0.02 0.574 Empty nest 46-59 -2.03 0.298 -2.51 0.263 -0.02 0.512 -0.57 0.674 -5.55 0.004 0.02 0.428 Couple 60 + -18.79 0.000 -15.01 0.000 -0.35 0.000 -12.71 0.000 -10.75 0.002 -0.27 0.000 Single 60 + -18.81 0.000 -22.64 0.000 -0.36 0.000 -12.32 0.000 -10.89 0.034 -0.26 0.000Other characteristics Low education (ref.: medium) -1.74 0.229 0.98 0.583 -0.04 0.100 -2.11 0.065 -2.13 0.250 -0.04 0.136 High education (ref.: medium) 0.97 0.458 -2.84 0.057 0.04 0.077 1.42 0.128 -4.54 0.000 0.06 0.001 Living in urban areas -3.57 0.007 -4.70 0.001 -0.04 0.105 -1.36 0.160 0.92 0.489 -0.04 0.063 Saturday (ref.: Mon-Fri) -22.64 0.000 -13.59 0.000 -0.42 0.000 -15.65 0.000 -10.08 0.000 -0.32 0.000 Sunday (ref.: Mon-Fri) -23.90 0.000 -14.57 0.000 -0.44 0.000 -15.42 0.000 -9.76 0.000 -0.32 0.000 Expected value 17.6 48.6 0.36 12.2 44.4 0.27 Model
Number of obs. 2,893 3,329 Censored obs. 1,716 2,240 Log likelihood -6749 -6438 Prob. > chi2
0.002 0.000
Rho -5.532 0.04 -0.495 0.05 Sigma 24.07 0.59 21.06 0.60 Lambda -12.82 1.17 .10.43 1.39
32

(Table A3 continued) UNITED STATES MEN WOMEN
Total effect
Conditional effect
Effect on participation
Total effect
Conditional effect
Effect on participation
dy/dx P>|z| dy/dx P>|z| dy/dx P>|z| dy/dx P>|z| dy/dx P>|z| dy/dx P>|z|Household life-course typologies (ref.: couple <46 no children)
Single <36 with parents -6.77 0.000 -5.43 0.000 -0.10 0.000 -3.38 0.000 -4.30 0.004 -0.05 0.002 Single <36 on their own 1.32
0.272 0.55 0.666 0.02 0.292 3.87 0.000 1.41 0.288 0.08 0.000 Couple children 0-5 4.99 0.000 0.32 0.738 0.10 0.000 -6.49 0.000 -6.58 0.000 -0.12 0.000 Couple children 6-15 5.12 0.000 0.54 0.522 0.10 0.000 -3.25 0.000 -5.42 0.000 -0.04 0.000 Couple children 16-25 4.70 0.000 2.03 0.098 0.07 0.000 -0.64 0.414 -1.53 0.200 0.00 0.772 Empty nest 46-59 0.48 0.640 -0.47 0.666 0.01 0.432 -1.75 0.004 -2.43 0.013 -0.02 0.046 Couple 60 + -17.57 0.000 -9.21 0.000 -0.31 0.000 -12.14 0.000 -10.92 0.000 -0.25 0.000 Single 60 + -18.05 0.000 -2.73 0.169 -0.35 0.000 -12.41 0.000 -8.14 0.000 -0.26 0.000Other characteristics Low education (ref.: medium) -3.66 0.002 -0.72 0.639 -0.07 0.001 -5.27 0.000 0.64 0.718 -0.12 0.000 High education (ref.: medium) 2.83 0.000 -3.15 0.000 0.08 0.000 3.44 0.000 -1.71 0.005 0.09 0.000 Hispanic (ref.: White non Hisp.) 0.20 0.837 1.00 0.342 0.00 0.771 0.67 0.319 2.89 0.005 0.00 0.784 Black (ref.: White non Hispanic) -5.81 0.000 -1.43 0.188 -0.11 0.000 -1.00 0.067 1.89 0.032 -0.03 0.001 Others (ref.: White non Hispanic) -2.51 0.031 -1.07 0.422 -0.04 0.042 0.32 0.706 -0.14 0.917 0.01 0.629 Living in big city -0.18 0.755 -1.13 0.072 0.01 0.523 -1.06 0.006 -1.35 0.022 -0.01 0.049 Midwest (ref.: North East) 1.08 0.182 0.49 0.573 0.02 0.206 1.69 0.002 2.40 0.004 0.02 0.040 South (ref.: North East) 1.19 0.118 1.99 0.016 0.01 0.614 0.64 0.208 1.27 0.109 0.01 0.535 West (ref.: North East) -1.11 0.184 1.71 0.063 -0.04 0.010 0.45 0.435 0.99 0.261 0.00 0.745 Saturday (ref.: Mon-Fri) -20.71 0.000 -12.25 0.000 -0.35 0.000 -13.42 0.000 -11.81 0.000 -0.26 0.000 Sunday (ref.: Mon-Fri) -24.83 0.000 -15.60 0.000 -0.42 0.000 -15.08 0.000 -13.85 0.000 -0.29 0.000 Expected value 21.8 50.2 0.43 12.7 44.1 0.28 Model
Number of obs. 14,337 18,740 Censored obs. 7,789 12,594 Log likelihood -37851 -37471 Prob. > chi2
0.000 0.000
Rho -0.65 0.01 -0.67 0.01 Sigma 26.8 0.31 25.7 0.36 Lambda -17.57 0.58 -17.28 0.66
33

Technical Appendix
Generalised Tobit (Heckman Type II), market work
Heckman’s (1978) generalized Tobit model (Tobit type II), consists of a structural equation (preferred labour supply function), an index equation (labour participation), a threshold equation linking preferred and observed hours and finally a stochastic specification.
(1) Structural equation: *
1 1´i iy x iβ ε= + (2) Index equation: *
2 2´i id x vβ i= +
(3) Threshold index equation: ⎩⎨⎧
≤>
=0 if 00 if 1
*
*
i
ii
ddd
(4) Threshold structural equation: ⎩⎨⎧ =
=else 0
1 if *ii
idyy
(5) Stochastic specification: εi,νi ~ N(0,0,σ 2,1,ρ)
yi* denotes the latent (non-observed) endogenous variable, in our case the preferred
hours of market work, and yi denotes the corresponding observed variable (measured hours of work). x1i and x2i are vectors of explanatory variables, which are assumed to be uncorrelated with the error terms εi och νi. β1 and β2 are vectors of parameters. di
* is a latent variable that represents binary censoring and di is the observed value (1 if the individual reports market work, else 0).
Given the stochastic specification, the likelihood function can be derived as
(6) ∏∏ >=⎪⎭
⎪⎬⎫
⎪⎩
⎪⎨⎧
−⎟⎟
⎠
⎞
⎜⎜
⎝
⎛
−
−+Φ−Φ= 0 11
12
11220 22 )/)((
1
)()( yy Xy
XyXXL σβφ
ρ
βββ σ
σρ
where y=0 denotes the individuals with zero working hours and y>0 the individuals with positive hour, Φ and φ denotes the univariate cdf and pdf of the standard normal. Estimation of this model is straightforward and the software Stata has been used in the present article.
34

Since the interpretation of the estimated coefficients is not straightforward it is necessary to calculate the marginal effects
The Expected value is equal to
2´´ ´´
2i 21ii 12
2i 2
* *E( )= P( > 0) E( | > 0)y yd di ii i( )X= ( ) +X X ( )X
φ βρσβ ββ
⎡ ⎤Φ ⎢ ⎥Φ⎣ ⎦
and the Marginal effects are
[ ] ( ) ( ) (2 2 1 2 2 2 1 1 2 21
´ ´ ´ij j
j
E yX X X X
Xβ β δ φ β β β ρσ β
∂⎡ ⎤= Φ + −⎣ ⎦∂
)´
where δ=1 if X1j is included in X2 and else δ=0
Furthermore, McDonald et Moffitt (1980) have shown that the total marginal effect could be decomposed into two distinct effects
(7) ( ) ( ) ( ) ( )11|1|1)(111
=∂
=∂+=
∂=∂
=∂
∂ dpxdyEdyE
xdp
xYE
The first term on the right side of the equation (7) reflects the impact of the covariate x1 on the likelihood of participating in the labour market weighted by the expected value of working time. The second term reflects the impact of the covariate x1 on working time for those participating weighted by the probability of being in the labour force. In other word, the first term reflects the variation of the exogenous variable on the likelihood to work and the second term the impact on the exogenous variable on working time given participation.
The Generalised Tobit method presents therefore two advantages. First, this method is
more flexible than a standard Tobit since it allows selecting different explanatory variables in the participation and hours’ equations. Second, in contrast to a standard Tobit, the decomposition of the total marginal effect (effect on participation and effect on hours given participation) is not assumed to be constant for all exogenous variables as in the standard Tobit.
35