time and locational value of distributed energy resources: …pjm.raabassociates.org/articles/roark...
TRANSCRIPT
© 2016 Electric Power Research Institute, Inc. All rights reserved.
Jeffrey D. RoarkTechnical Executive
Power Delivery & Utilization, EPRIEnergy Policy Roundtable
September 28, 2016
Time and Locational Value of Distributed Energy Resources:
Methods & Applications

2© 2016 Electric Power Research Institute, Inc. All rights reserved.
EPRI’s Study: “Time and Locational Value of DER: Methods and Applications” Used the EPRI Benefit-Cost Framework
– Objective, reproducible– Assesses impacts of interconnected DER – Estimates value/cost to society
Two DER Interconnection Scenarios– DER only to meet all load growth– DER at customer discretion
Modeled Actual Systems– Two systems: Con Edison Mesh
and SCE Flexible Radial – Studied 10-year period to align
with distribution planning timeframe
Asks whether DER can economically replace or avoidinvestments otherwise needed to accommodate growth.
Note: Companion study conducted by Sue Tierney, The Analysis Group. “The Value of “DER” to “D”: The Role of Distributed Energy Resources in Supporting Local Electric Distribution Reliability.”

3© 2016 Electric Power Research Institute, Inc. All rights reserved.
121 24 Hours
kW
Concept: Deferral of Distribution Upgrades with DER
Current Demand
Forecasted Demand
Network Capacity Expansion
Current Network Capacity
Traditional Approach
• Expand infrastructure to keep up with load growth

4© 2016 Electric Power Research Institute, Inc. All rights reserved.
Thousands of customer‐sited
solutions
Concept: Deferral of Distribution Upgrades with DER
• Assemble a portfolio of DER technologies to shave peak.• Peak load duration matters.
Current Network Capacity
DER Portfolio Approach
121 24 Hours
kW
Current Demand
Forecasted Demand

5© 2016 Electric Power Research Institute, Inc. All rights reserved.
Study assembled DER portfolios based on technology, customer, and system load-curve characteristics for both Con Edison and Southern California Edison
Energy Efficiency
DRPV
CHP
Fuel CellStorage
Con Edison Case Study Portfolio
Time
SCE Case Study Portfolio
Energy Efficiency
Demand Response
Solar PV
Storage
Two very different portfolios demonstrate the methodology.

6© 2016 Electric Power Research Institute, Inc. All rights reserved.
Mesh Network System (Con Edison)
The Systems: Mesh Network vs. Flexible Radial Topologies
Two very different systems demonstrate the methodology.
138 kV Transmission Supply
26.4 kV Distribution
LOAD
LOW-VOLTAGE GRID NETWORK(MESHED)
FEEDERS
Flexible Radial System(SCE)

7© 2016 Electric Power Research Institute, Inc. All rights reserved.
Neighboring transformer
Neighboring transformer
Overloaded Transformer
Network systems present challenges when targeting DER to address specific distribution violations
Network System: Multi-directional Power Flows
Locational SensitivityOverloaded Transformer
A DER energy disperses from point A.
Simple Radial System: Unidirectional Power Flows
B
C
A
BC
DER energy directly reduces transformer flow
whether at A, B, or C.
Effectiveness degradeswith distance.
Distance
∆Flow
8© 2016 Electric Power Research Institute, Inc. All rights reserved.
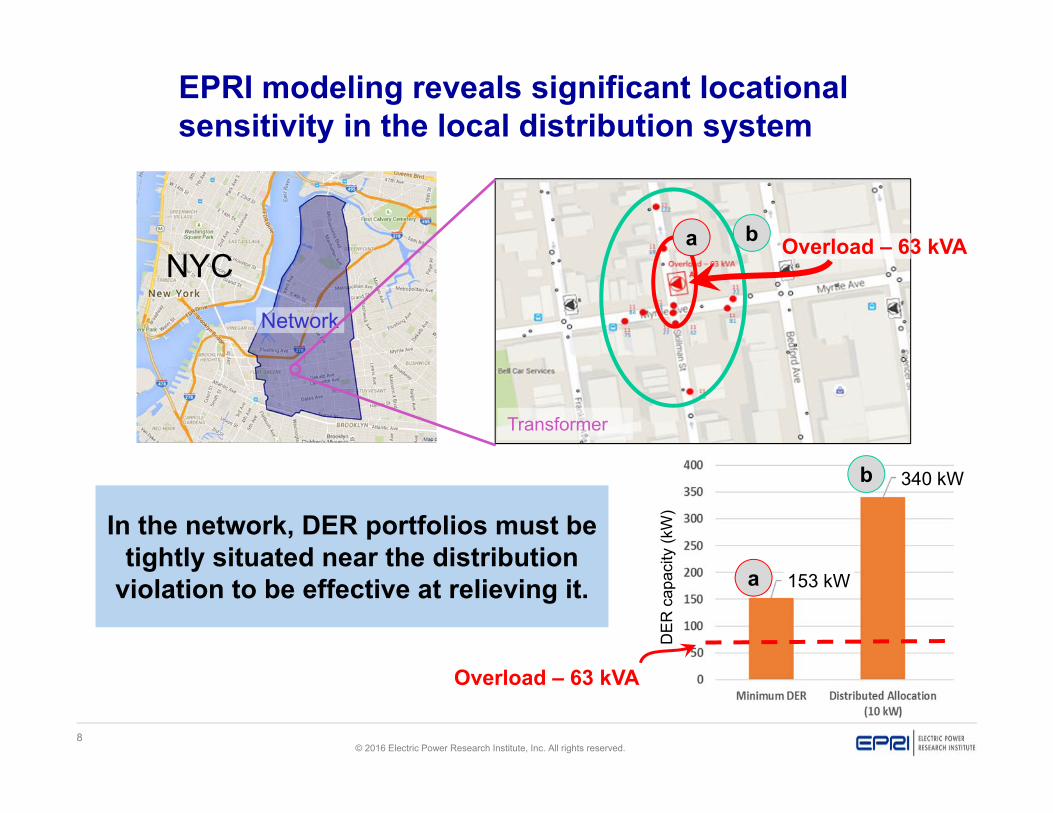
EPRI modeling reveals significant locational sensitivity in the local distribution system
340 kW
Network
Transformer
a
b
a b
DER
cap
acity
(kW
)
NYCOverload – 63 kVA
In the network, DER portfolios must be tightly situated near the distribution
violation to be effective at relieving it.
Overload – 63 kVA
153 kW

9© 2016 Electric Power Research Institute, Inc. All rights reserved.
Economic Evaluation of Alternative Distribution PlansModeling Assumptions
and Outputs
Distribution-system/feederEnergy growthLoad shape
One of:10-year distribution upgrade plans to satisfy voltage, capacity, and protection constraints
Economic Analysis Outputs
Load Cost ($/kWhgrth)
Cost of serving load growth:• Energy cost (load and losses)
• Capacity cost• Carbon cost
Accom-modation($/kWhgrth)
Cost of distribution upgrades:• Asset ownership costs
(revenue requirements)• O&M costs
Cost and value of DER:• Equipment cost
(Utility procurement)• Net energy value• Loss-reduction value• Carbon-reduction value• Avoided capacity value
10-year DER plans to satisfy voltage, capacity, and protection constraints
Bulk-system characteristicsLMP & Carbon cost ratesCapacity cost rates
Incremental Cost to Serve
Growth in Load
($/kWhgrth)
Cost Normalized to Load Energy Growth
In this study we estimated the cost to serve load growth.

10© 2016 Electric Power Research Institute, Inc. All rights reserved.
Comparison of Costs for Con Edison Portfolio and Mesh Distribution Network w/No Headroom
Cost to Meet Load Growth –Traditional Utility Solution
Cost to Meet Load Growth –DER Solution No Headroom
DER solution’s net cost is slightly higher than traditional solution,but leaves the circuit with no headroom.
15.7
0
4
8
12
16
20
24
Incr
emen
tal C
ost (
cent
s/kW
h)
14.7
0
4
8
12
16
20
24
Incr
emen
tal C
ost (
cent
s/kW
h)

11© 2016 Electric Power Research Institute, Inc. All rights reserved.
20.0
0
4
8
12
16
20
24
28
32
Incr
emen
tal C
ost (
cent
s/kW
h)
Comparison of Costs for Con Edison Portfolio and Mesh Distribution Network w/10% Headroom
Cost to Meet Load Growth –Traditional Utility Solution
Cost to Meet Load Growth –DER Solution 10% Headroom
Providing similar headroom with DER was more expensive, caused in part by greater dispersion of DER energy.
14.7
0
4
8
12
16
20
24
28
32
Incr
emen
tal C
ost (
cent
s/kW
h)
12© 2016 Electric Power Research Institute, Inc. All rights reserved.
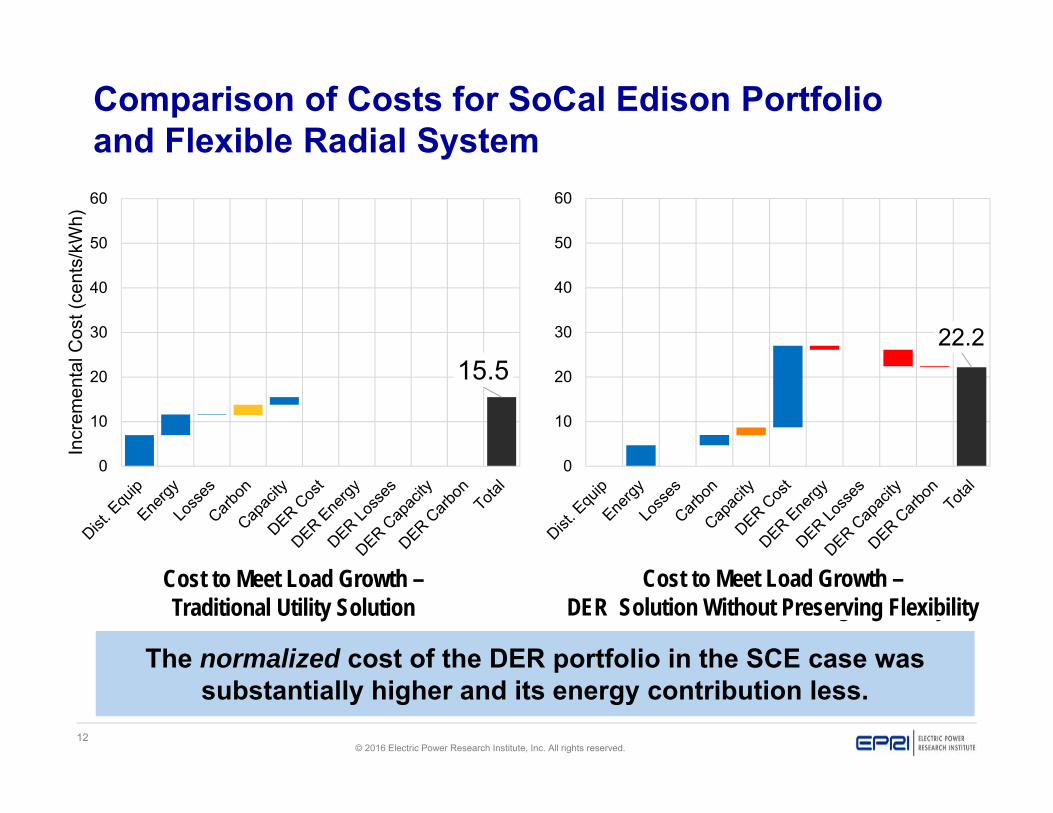
Comparison of Costs for SoCal Edison Portfolio and Flexible Radial System
Cost to Meet Load Growth –Traditional Utility Solution
Cost to Meet Load Growth –DER Solution Preserving Flexibility
The normalized cost of the DER portfolio in the SCE case was substantially higher and its energy contribution less.
41.1
0
10
20
30
40
50
60
Incr
emen
tal C
ost (
cent
s/kW
h)
15.5
0
10
20
30
40
50
60
Incr
emen
tal C
ost (
cent
s/kW
h)
22.2
0
10
20
30
40
50
60
Cost to Meet Load Growth –DER Solution Without Preserving Flexibility

13© 2016 Electric Power Research Institute, Inc. All rights reserved.
Time and Location Value of DER: Conclusions from Study
Time and locational impacts are key determinants in valuing DER.
It is hard to generalize the net benefits of DER as an alternative to conventional grid.
Comprehensive, consistent, and transparent methods are requiredfor consistent and sensible results.

14© 2016 Electric Power Research Institute, Inc. All rights reserved.
Questions?
Together…Shaping the Future of Electricity
Jeffrey D. RoarkTechnical ExecutiveElectric Power Research Institute3379 Lakewind WayAlpharetta, GA [email protected]