time-dependent correlation of the microbial community and
TRANSCRIPT
Time-Dependent Correlation of the Microbial Communityand the Metabolomics of Traditional Barley Nuruk Starter Fermentation
Kannan PONNUSAMY, Sarah LEE, and Choong Hwan LEEy
Department of Bioscience and Biotechnology, Konkuk University, Seoul 143-701, Republic of Korea
Received August 28, 2012; Accepted December 8, 2012; Online Publication, April 7, 2013
[doi:10.1271/bbb.120665]
The microbial community and the metabolites ofbarley nuruk were studied to determine the time-dependent correlation between the fermentation ofmicrobes and metabolites. Samples were analyzed by apolyphasic approach based on culture-dependent, cul-ture-independent (PCR-DGGE and qPCR analysis), andmetabolite analysis using GC-MS. Barley nuruk consistsof varying amounts of bacteria, yeasts, and molds. ThePCR-DGGE results showed that only one phylotype,Aspergillus oryzae, was predominant throughout fer-mentation, reaching a maximum on day 9. The bacterialload was higher on day 6 of fermentation, and thengradually decreased because of increased fungal activ-ity. The shift in fungal and bacterial diversity observedby DGGE was further confirmed by qPCR analysis. Inaddition, microbes closely related to Pantoea agglomer-ans and Saccharomycopsis fibuligera appeared to playkey roles in the fermentation of barley nuruk. GC-MSanalysis combined with multivariate analysis, includingPCA, PLS-DA, and OPLS-DA, showed fermentationtime-dependent metabolite patterns. A total of 21metabolites, including organic acids, amino acids,sugars, and sugar alcohols, were identified. In partic-ular, glycerol, malic acid, fructose, glucose, sucrose, andmaltose were produced at the early fermentation stages(0–6 d), whereas glutamine, aspartic acid, glutamic acid,mannitol, and xylitol were produced during the latterstages of fermentation (9–18 d). Mixed culture fermen-tation was found throughout the natural fermentation ofbarley nuruk starter. Most likely, A. oryzae had a majorrole in saccharification, along with other mixed cultures.
Key words: barley nuruk starter; microbial community;DGGE; metabolites; GC-MS
The preliminary breakdown of starch into simplesugars by single culture fermentation (mostly Aspergil-lus oryzae) is called koji fermentation. On the otherhand, mixed cultures by means of natural fermentationare referred as nuruk starter fermentation, a first step inmost of the cereal-based traditional Korean alcoholicbeverages, makgeolli and takju.1) In general makgeolli isprepared using rice as raw material; wheat and barleyare also used as alternative cereals. Nuruk fermentationconsists of a mixed culture of microorganisms, includingfungi, yeast, and bacterial species. A small amount ofearlier fermented solid material is added as inoculum tosteamed rice, barley, soybean or wheat for saccharifica-tion.2) Microbial fermentation reduces the level of anti-
nutrients such as polyphenols and phytic acids.3) Variousfermented foods (miso, tofu and tempeh) are known tohave improved digestibility of carbohydrates, protein,enhanced bioavailability of simple sugars, minerals, andsecondary metabolites.4) Fermented foods have addi-tional value such as antitumor, antibacterial (ferulicacid), and antioxidant properties (terphenyllin).5) Theyare either derived from raw materials or the secondarymetabolites of the fermenting microorganisms.The microbial dynamics of starter barley nuruk during
natural fermentation must be understood to select thedesirable time point for the next step of alcoholfermentation. Hence, the microbial community and thequantity have to be monitored throughout fermentationto get desirable products, and at the same time to avoidundesirable microbes. The classical culture-dependentmethod is used widely for microbial community analy-sis, but this single method has limitations and thepolyphasic approach minimize, the biases of microbialdiversity from mixed culture.6) High-throughput mo-lecular biology techniques such as PCR based commun-ity DNA analysis with denaturing gradient gel electro-phoresis (DGGE) and quantitative real-time PCR(qPCR) provides more insight into microbial diversityand shifts in the fermentation medium.Microbiological and enzymatic processes contribute
to the production of desirable metabolites that generateunique aromas, flavors, and textures in the naturalfermentation of complex foods.7) Metabolomics studiesoffer quantitative profiling of metabolites in a complexbiological system,8) but studies of the metabolite profileof barley nuruk starter are scarce. Few studies of ricenuruk starters or other beverages have focused onmicrobial9) or metabolite profiles.10) The combinedstudy of microbial dynamics and its influence on thesaccarification of food and metabolite development isneeded for the recommendation or selection of effectivestarters. In the present study, a detailed comparativeinvestigation of barley nuruk starter fermentation wascarried out based on culture-dependent and culture-independent methods of microbial diversity and meta-bolic analysis by GC-MS.
Materials and Methods
Sample collection. Traditional barley nuruk starters were collected
at different fermentation times during June 2010. A grain sampler
was used to collect samples from various locations and depths in
fermentation boxes. A pH meter (Thermo Fisher Scientific, Fremont,
CA) was used to measure the pH of the barley nuruk samples.
y To whom correspondence should be addressed. Tel: +82-2-2049-6177; Fax: +82-2-455-4291; E-mail: [email protected]
Biosci. Biotechnol. Biochem., 77 (4), 683–690, 2013
Enumeration and isolation of culturable microorganisms. Samples
(0.5 g) were mixed with 4.5mL of sterile saline solution, soaked at 4 �C
for 30min, and mixed. Serially diluted samples were plated on Luria
Bertani (LB) agar medium supplemented with cyclohexamide
(0.001%; Sigma-Aldrich, Seoul, Korea) to isolate bacteria. Yeast
Mannitol (YM) agar (Difco Laboratories, Detroit, MI) medium was
used to isolate fungi, and chlortetracycline (0.01%; Sigma-Aldrich,
Seoul, Korea) and chloramphenicol (0.01%; Sigma-Aldrich, Seoul,
Korea) were used to prevent bacterial growth. In addition, 0.02%
Triton-X 100 was used to prevent spreading of fungal colonies.
Cultures were purified and subjected to molecular identification using
universal bacterial and fungal primers 16S and 26S rDNA respectively
(Table 1).
Standardization of DNA extraction from barley nuruk samples. The
barley nuruk samples were washed in phosphate buffer for 20min and
centrifuged at 4,000 rpm for 10min, and the supernatant was collected.
This was repeated 5 times, and the collected supernatant was
centrifuged at 15,000 rpm for 15min. The pelleted cells were digested
with lyticase enzyme (Sigma-Aldrich, Seoul, Korea) and incubated at
37 �C for 1 h, followed by SDS (2%, w/v) digestion for 45min at
65 �C. The mixture was mechanically disrupted with zirconium beads
for 20 s. This process was repeated 5 times. After centrifugation, an
equal volume of the following solutions was added to the supernatant:
chloroform:isoamyl alcohol (24:1) and phenol:chloroform:isoamyl
alcohol (25:24:1). DNA was precipitated with isopropanol and
centrifuged, and the remaining pellet was washed with 70% ethanol.
The resulting community DNA was resuspended in deionized distilled
water and stored at �20 �C until use.
PCR amplification of bacteria and fungi. The 16S rRNA gene was
amplified using GC-clamped universal primers 968f and 1401r, as
outlined in Table 1. The PCR reaction buffer consisted of universal
primers (0.18 mM), dNTPs (0.25mM), Ex Taq polymerase (0.75U;
Takara, Ohtsu, Japan), MgCl2 (2mM), and DNA template (10 ng).
Eukaryote-specific (63f-266r) GC-clamp primers were used to amplify
mold and yeasts. The primer specific PCR annealing temperatures are
listed in Table 1. The amplicon (5 mL) was analyzed by agarose gel
electrophoresis (1.2%, w/v) prior to DGGE analysis.
Denaturing gradient gel electrophoresis. PCR samples were loaded
onto 8% polyacrylamide gels in 1� TAE at a 45–55% urea and
formamide denaturing gradient (7 M urea and 40% (V/V) formamide,
corresponding to a 100% gradient) as described elsewhere.12) Electro-
phoresis was performed at 60 �C at a constant voltage.11) The gels were
stained with SYBR Green I (Invitrogen, Eugene, OR), observed under
UV transillumination, and documented with a Molecular Imager Gel
Doc (BioRad Laboratories, Hercules, CA). The PCR amplicons of the
type strains and a representative barley sample were included as
markers to serve as standards. The following type strains possessing
different Gþ C%, were obtained from the Korean Agricultural Culture
Collection (KACC) or Korean Collection for Type Cultures (KCTC):
Bacteroides fragilis (KCTC 3688), Bacteroides vulgatus (KCTC
2639), Enterococcus faecalis (KACC 13807), Escherichia coli (KCTC
1682), Lactobacillus acidophilus (KACC 12419), Lactobacillus casei
(KACC 12413), Candida albicans KACC 30062, Saccharomyces
cerevisiae KCTC 7906, Aspergillus oryzae KCCM 60345, Aspergillus
niger KACC 40280, and Aspergillus sojae KACC 40072. Unique,
repeated bands were PCR-amplified without a GC clamp and purified
before sequencing (Macrogen, Seoul, Korea).
Phylogenetic analysis. Sequences were analyzed using a Chroma-
sPro (Technelysium, Australia) and Sequence Scanner V1.0 (Applied
Biosystems, Foster City, CA) to remove redundant sequences. Partial
16S rRNA gene sequences were compared with sequences deposited in
GenBank (www.ncbi.nlm.nih.gov), Ribosomal Database Project II
(www.rdp.cme.msu.edu), and EzTaxon. They were deposited in
GenBank (Table 2). Phylogenetic trees were constructed by the
neighbor-joining method by 1,000 bootstrap analysis using MEGA 4.
qPCR. The qPCR reaction mixture (25mL) consisted of 1� SYBR
Premix Ex Taq II (Takara), ROX Reference Dye II, group-specific
primers (0.18mM), MgCl2 (2mM), and a DNA template (10 ng). The
amplification program included an initial denaturation step at 95 �C for
30 s, followed by 40 cycles of denaturation at 95 �C for 15 s, primer
annealing at 52.5–60 �C (Table 1) for 20 s, and extension at 72 �C
for 45 s. Fluorescence data were collected at the end of each PCR
cycle, and experiments were performed in triplicate using 7500 Fast
Real-Time PCR (Applied Biosystems). Melting curve analysis were
performed to determine the specificity of the resulting PCR products.
Melting curves were obtained by slowly heating the sample from 60 to
95 �C at a rate of 0.1 �C/s with continuous fluorescence collection. The
measured fluorescence was compared with the external standard, and
the efficiency of amplification of each primer was tested along with the
appropriate positive and negative controls. The type strains were used
to construct a standard curve, and the results were converted into log
values of the target microbial gene copy numbers per g of barley
sample.
TaqMan PCR quantitative estimation of A. oryzae. Optimal primers
and probes were designed based on the A. oryzae calmodulin gene by
means of Integrated DNA Technologies software (www.idtdna.com).
Reporter fluorescent dye 6-carboxyfluorescein (FAM) was labeled at
the 50 end, and conjugate BHQ1 was labeled at the 30 end. Primers and
probes were synthesized from Oligo (Macrogen, Seoul, Korea). The
1� Premix Ex Taq (Perfect Real Time; Takara) consisted of forward
and reverse primers (0.18mM), (0.09 mM), MgCl2 (2mM), and the DNA
template (10 ng). The amplification program included an initial
denaturation step at 95 �C for 30 s, followed by 40 cycles of
denaturation at 95 �C for 15 s, primer annealing at 61 �C (Table 1)
for 20 s, and extension at 72 �C for 45 s. ROX II was used as reference
dye.
Metabolite extraction and derivatization. Each barley nuruk starter
sample was homogenized with a mortar and pestle for metabolomic
analysis. The ground sample (100mg) was extracted with 1mL of 80%
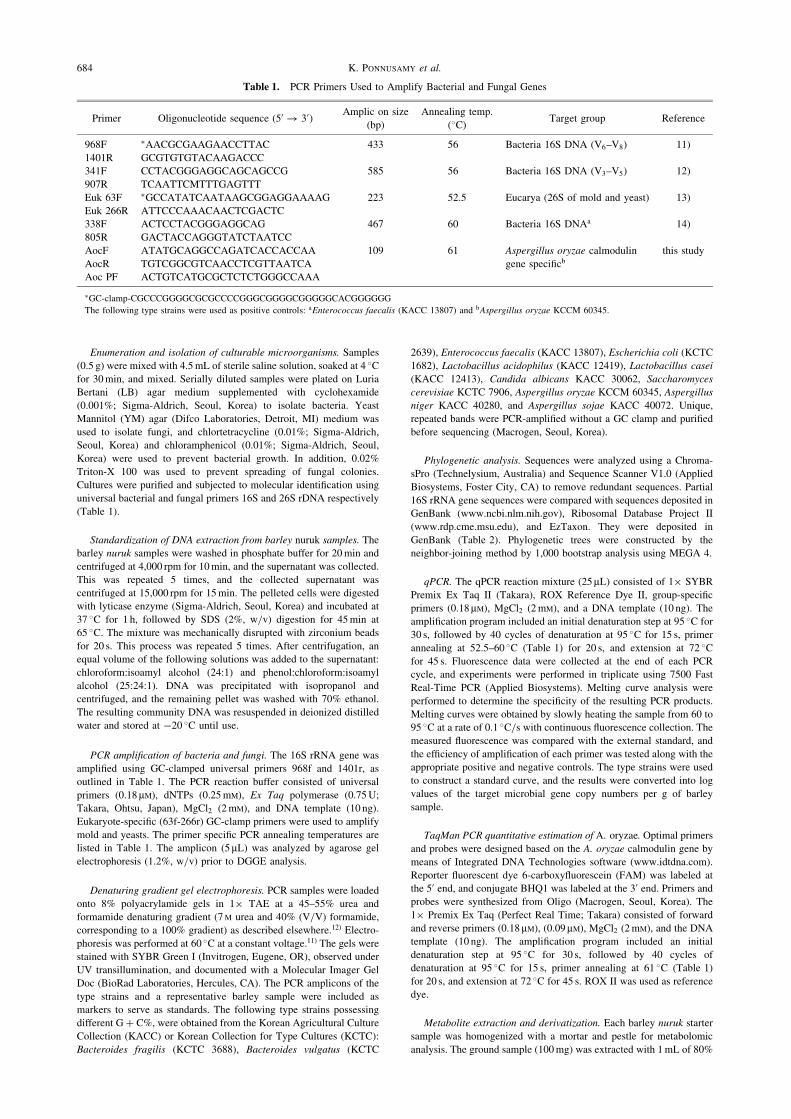
Table 1. PCR Primers Used to Amplify Bacterial and Fungal Genes
Primer Oligonucleotide sequence (50 ! 30)Amplic on size
(bp)
Annealing temp.
(�C)Target group Reference
968F �AACGCGAAGAACCTTAC 433 56 Bacteria 16S DNA (V6–V8) 11)
1401R GCGTGTGTACAAGACCC
341F CCTACGGGAGGCAGCAGCCG 585 56 Bacteria 16S DNA (V3–V5) 12)
907R TCAATTCMTTTGAGTTT
Euk 63F �GCCATATCAATAAGCGGAGGAAAAG 223 52.5 Eucarya (26S of mold and yeast) 13)
Euk 266R ATTCCCAAACAACTCGACTC
338F ACTCCTACGGGAGGCAG 467 60 Bacteria 16S DNAa 14)
805R GACTACCAGGGTATCTAATCC
AocF ATATGCAGGCCAGATCACCACCAA 109 61 Aspergillus oryzae calmodulin this study
AocR TGTCGGCGTCAACCTCGTTAATCA gene specificb
Aoc PF ACTGTCATGCGCTCTCTGGGCCAAA
�GC-clamp-CGCCCGGGGCGCGCCCCGGGCGGGGCGGGGGCACGGGGGG
The following type strains were used as positive controls: aEnterococcus faecalis (KACC 13807) and bAspergillus oryzae KCCM 60345.
684 K. PONNUSAMY et al.

methanol (Thermo Fisher Scientific, Fremont, CA) using an ultra-
sonicator (Hwashin, Seoul, Korea) for 30min and centrifuged at
5,000 rpm for 10min. Then 200mL of the supernatant was dried
completely with a speed vacuum concentrator (Biotron, Seoul, Korea)
for 12 h. For oximation and derivatization, 50 mL of methoxyamine
hydrochloride (10mg/mL) in pyridine (Sigma-Aldrich, Seoul, Korea)
was incubated with dried extract at 30 �C for 90min. The resulting
oximated samples were silylated with 50mL of N-methyl-N-trifluor-
oacetamide containing 1% trimethylchlorosilane (Sigma-Aldrich,
Seoul, Korea) at 37 �C for 30min.
GC-MS analysis. A Varian CP-3800 gas chromatography system
equipped with a Varian CP-8400 autosampler was coupled to a Varian
4000 ion-trap EI/CI mass spectrometric detector system (Varian,
Palo Alto, CA). A VF-1MS capillary column (length 30m�i.d. 0.25mm� film thickness 0.25 mm) was used with helium at a
constant flow of 1.0mL/min. The derivatized sample (1 mL) was
injected at a split ratio of 25:1. The oven temperature was held at
100 �C for 2min, ramped to 300 �C at a rate of 5 �C/min, and held for
10min. The mass data collected in EI mode using 70 eV of ionization
energy were used for a full scan of m=z 50 to 1,000. The injector and
transfer line temperatures were 200 and 250 �C respectively.
Metabolite data analysis. The GC-MS raw data were converted to
netCDF (�.cdf) files with Vx capture (version 2.1; Adron Systems,
Laporte, MN) and processed by XCMS for automatic peak detection
and alignment to obtain a data matrix containing retention times,
accurate masses, and normalized peak intensities. XCMS parameters
were obtained using the R-program, version 2.12.2 (http://metlin-.
scripps.edu). The resulting data were exported to Excel (Microsoft,
Redmond, WA), and statistical analysis was performed. After perform-
ing multivariate statistical analysis, major metabolites were positively
identified using authentic standards by comparing the mass spectra and
the retention times. When authentic standards were not available,
tentative identification of compounds was made on the basis of MS
spectra using the Wiley mass spectral database (Hewlett-Packard,
1995), NIST05 MS Library (NIST, 2005), and an in-house library.
Statistical analysis. Analysis of variance was done by ANOVA.
Significant differences (p < 0:05) between means were determined by
Student’s t-test. Multivariate data analysis was performed using
SIMCA-Pþ 11.0 (version 12.0; Umetrics, Umea, Sweden). Data were
centered and scaled using by unit variance (UV) scaling. Unsupervised
principal component analysis (PCA), supervised partial least squares
discriminant analysis (PLS-DA), and orthogonal projection to latent
structures discriminate analysis (OPLS-DA) were then used to predict
the variation of metabolites based on fermentation times. Metabolites
with variable importance projection (VIP) values greater than 0.7 and
p values less than 0.05 (threshold) were selected as metabolites to be
used to discriminate the fermentation times of the barley nuruk
samples. Culture dependent method results were obtained from the
mean of three replications� SD.
Results and Discussion
Culturable microbes and identificationCountable numbers of bacteria and fungi were
obtained throughout the fermentation period except forzero days (excluded from the DNA-based studies). Ricenuruk samples are composed of mixed cultures contain-ing filamentous fungi, yeast, and bacteria grown oncereals.9,15) Bacteria, molds, and yeasts have beenidentified in Chinese fermented liquor (Luzhou) bothculture and non-culture methods.16)
The A. oryzae and Pantoea agglomerans identified bythe main contributor to barley nuruk starter fermenta-tion. The bacterial load steadily increased over 6 d, andthen gradually decreased. In the total bacterial count,0:5 log (p < 0:005) CFU increased from 3 to 6 d offermentation (Fig. 1). In contrast, 1:4 log (p < 0:005)increased in A. oryzae over days 3 to 9. The pH of thefermentation medium remained nearly constant, withoutmuch fluctuation. The amount of viable A. oryzae wasmore or less maintained between 12 and 18 d offermentation. Yu and co-workers have reported thatAspergillus was the most dominant fungus in rice wine
Table 2. Predominant Bacteria and Fungi from Barley Nuruk Starter Identified by the PCR-DGGE Method
Genbank Total Next nearestMaximum
Culture IDaccess no. bp
Closest relativeGenBank ID
identity
(%)
FMNB 2 JF510529 348 Pantoea agglomerans strain ATCC 27987 FJ611824 100
FMNB 5 JF510530 349 Enterobacter cowanii strain 6L DQ919062 100
FMNB 7 JF510531 349 Enterobacteriaceae bacterium NES5 AB523725 100
FMNB 3 JF510532 325 Pantoea agglomerans; NCTC9381T AJ251466 99
FMNB 11 JF510533 498 Staphylococcus pasteuri strain ATCC51129 NR 024669 100
FMNB 12 JF510534 498 Staphylococcus warneri ATCC 27836(T) L37603 100
FMNB 14 JF510535 482 Streptomyces pactum NBRC 13433(T) AB184398 100
FMNB 305 JF510536 330 Bacillus siamensis PD-A10(T) GQ281299 99.7
FMNB 313 JF510537 511 Pantoea gaviniae A18/07(T) GQ367483 98.4
FMNB F1 181 Saccharomycopsis fibuligera strain g-4b-2 HM107786 100
FMNB F2 195 Aspergillus oryzae culture-collection VTCC:CF045 GQ382276 99
FMNB F3 188 Saccharomyces cerevisiae strain SS1-1 HM123752 100
FMNB F4 165 Saccharomycopsis fibuligera strain s-5b-2 HM107787 99
FMNB F5 156 Penicillium citrinum GU562425 100
FMNB F6 164 Saccharomycopsis fibuligera strain NY03 HQ199205 100
FMNB F7 163 Aspergillus niger HM352766 99
Fig. 1. Dynamics of Culturable Bacteria, Fungi, and Major Organ-isms in Barley Nuruk Starter Fermentation.
Values are means of three samples� SD.
Microbial Community and Metabolomics of Barley Nuruk 685
preparation17) whereas P. agglomerans was among themicroorganisms present in the Laminaria-based nurukmedium. The microecological environments in thefermentation area, the shape and size of the container,the production process, and time were plays major rolein the quality of mixed grain fermentation.18)
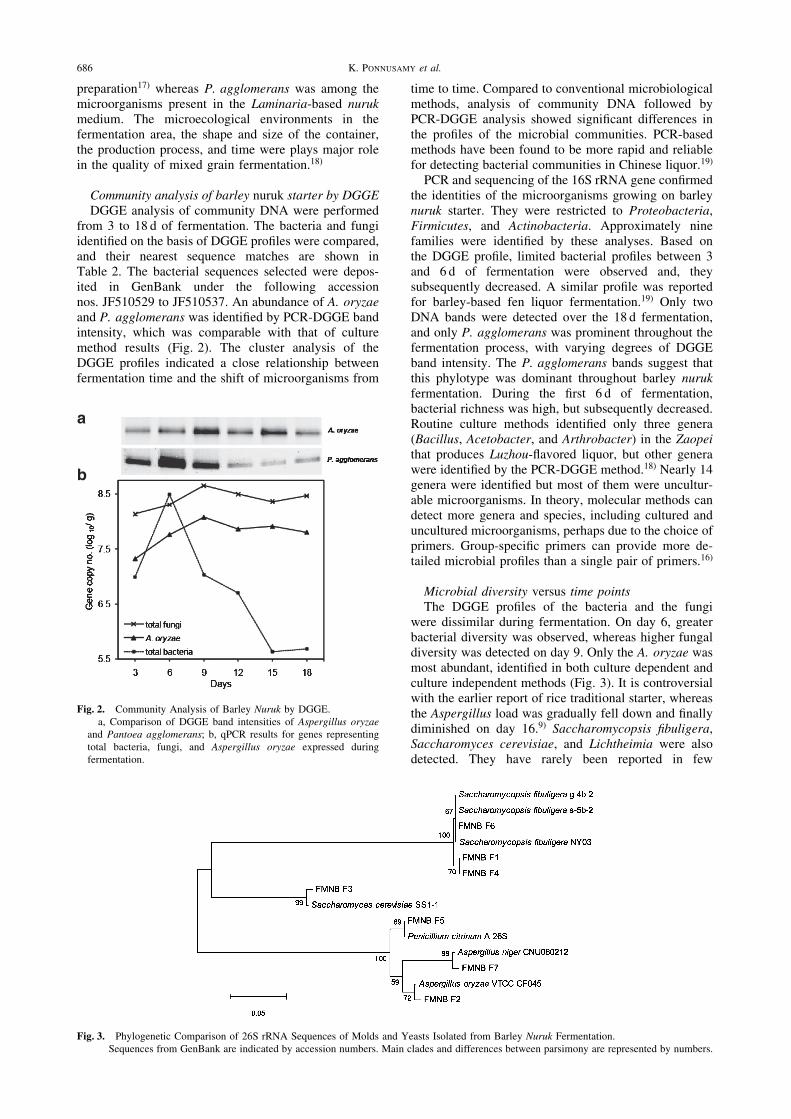
Community analysis of barley nuruk starter by DGGEDGGE analysis of community DNA were performed
from 3 to 18 d of fermentation. The bacteria and fungiidentified on the basis of DGGE profiles were compared,and their nearest sequence matches are shown inTable 2. The bacterial sequences selected were depos-ited in GenBank under the following accessionnos. JF510529 to JF510537. An abundance of A. oryzaeand P. agglomerans was identified by PCR-DGGE bandintensity, which was comparable with that of culturemethod results (Fig. 2). The cluster analysis of theDGGE profiles indicated a close relationship betweenfermentation time and the shift of microorganisms from
time to time. Compared to conventional microbiologicalmethods, analysis of community DNA followed byPCR-DGGE analysis showed significant differences inthe profiles of the microbial communities. PCR-basedmethods have been found to be more rapid and reliablefor detecting bacterial communities in Chinese liquor.19)
PCR and sequencing of the 16S rRNA gene confirmedthe identities of the microorganisms growing on barleynuruk starter. They were restricted to Proteobacteria,Firmicutes, and Actinobacteria. Approximately ninefamilies were identified by these analyses. Based onthe DGGE profile, limited bacterial profiles between 3and 6 d of fermentation were observed and, theysubsequently decreased. A similar profile was reportedfor barley-based fen liquor fermentation.19) Only twoDNA bands were detected over the 18 d fermentation,and only P. agglomerans was prominent throughout thefermentation process, with varying degrees of DGGEband intensity. The P. agglomerans bands suggest thatthis phylotype was dominant throughout barley nurukfermentation. During the first 6 d of fermentation,bacterial richness was high, but subsequently decreased.Routine culture methods identified only three genera(Bacillus, Acetobacter, and Arthrobacter) in the Zaopeithat produces Luzhou-flavored liquor, but other generawere identified by the PCR-DGGE method.18) Nearly 14genera were identified but most of them were uncultur-able microorganisms. In theory, molecular methods candetect more genera and species, including cultured anduncultured microorganisms, perhaps due to the choice ofprimers. Group-specific primers can provide more de-tailed microbial profiles than a single pair of primers.16)
Microbial diversity versus time pointsThe DGGE profiles of the bacteria and the fungi
were dissimilar during fermentation. On day 6, greaterbacterial diversity was observed, whereas higher fungaldiversity was detected on day 9. Only the A. oryzae wasmost abundant, identified in both culture dependent andculture independent methods (Fig. 3). It is controversialwith the earlier report of rice traditional starter, whereasthe Aspergillus load was gradually fell down and finallydiminished on day 16.9) Saccharomycopsis fibuligera,Saccharomyces cerevisiae, and Lichtheimia were alsodetected. They have rarely been reported in few
a
b
Fig. 2. Community Analysis of Barley Nuruk by DGGE.a, Comparison of DGGE band intensities of Aspergillus oryzae
and Pantoea agglomerans; b, qPCR results for genes representingtotal bacteria, fungi, and Aspergillus oryzae expressed duringfermentation.
Fig. 3. Phylogenetic Comparison of 26S rRNA Sequences of Molds and Yeasts Isolated from Barley Nuruk Fermentation.Sequences from GenBank are indicated by accession numbers. Main clades and differences between parsimony are represented by numbers.
686 K. PONNUSAMY et al.
fermented grains.20) Saccharomycopsis spp., such asS. fibuligera, are commonly found in Southeast Asianrice wine starter.21)
qPCR estimation of total bacteria and fungiIn this study, differences between the amounts of
fungi and bacteria during the fermentation process wereobserved. The total bacterial load increased during thefirst 6 d of incubation and then decreased, while thefungal load increased maximum. Fungal growth canlower the pH of the media slightly and might have beenone of the reasons for reduced bacterial growth. SinceA. oryzae was a major contributor to barley nurukstarter, it was attempted to quantify in the fermentedbarley samples. An A. oryzae spore-spiked barleyexperiment showed the minimum for DNA extractionand it was determined to be 9:2� 103 conidia per g ofsample.
Aspergillus oryzae was predominant among the fungi(8.07 conidia/g) and increased by 4% (p < 0:001) onday 3 of fermentation (Fig. 2). Most fungal communitiesare more oxygen-, temperature-, and pH-dependent.A. oryzae can provide adequate nutrition for fungalgrowth, and its metabolism may play a role in furthersaccharification. Barley-carbohydrates can be used assubstrates for energy and the synthesis of fatty acids.Most studies have reported that Aspergillus is thegenus responsible for starch saccharification in nuruk,
in agreement with previous reports21) on koji5) andZaopei.22)
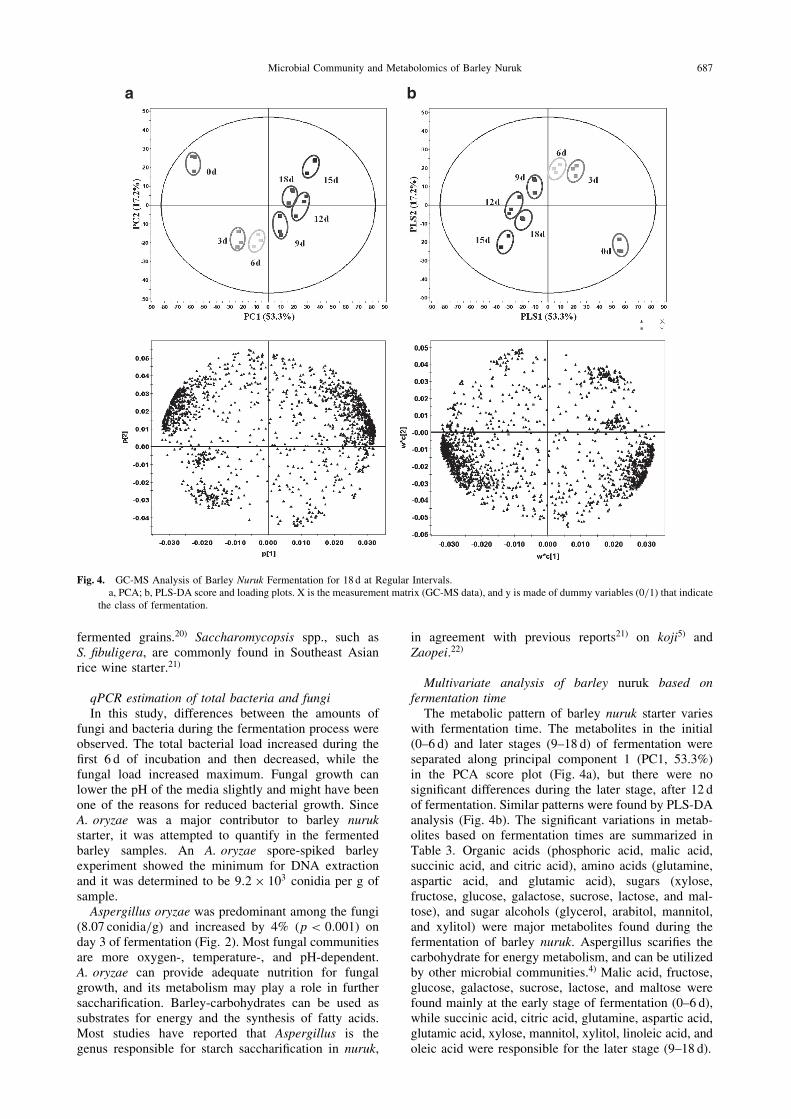
Multivariate analysis of barley nuruk based onfermentation timeThe metabolic pattern of barley nuruk starter varies
with fermentation time. The metabolites in the initial(0–6 d) and later stages (9–18 d) of fermentation wereseparated along principal component 1 (PC1, 53.3%)in the PCA score plot (Fig. 4a), but there were nosignificant differences during the later stage, after 12 dof fermentation. Similar patterns were found by PLS-DAanalysis (Fig. 4b). The significant variations in metab-olites based on fermentation times are summarized inTable 3. Organic acids (phosphoric acid, malic acid,succinic acid, and citric acid), amino acids (glutamine,aspartic acid, and glutamic acid), sugars (xylose,fructose, glucose, galactose, sucrose, lactose, and mal-tose), and sugar alcohols (glycerol, arabitol, mannitol,and xylitol) were major metabolites found during thefermentation of barley nuruk. Aspergillus scarifies thecarbohydrate for energy metabolism, and can be utilizedby other microbial communities.4) Malic acid, fructose,glucose, galactose, sucrose, lactose, and maltose werefound mainly at the early stage of fermentation (0–6 d),while succinic acid, citric acid, glutamine, aspartic acid,glutamic acid, xylose, mannitol, xylitol, linoleic acid, andoleic acid were responsible for the later stage (9–18 d).
a b
Fig. 4. GC-MS Analysis of Barley Nuruk Fermentation for 18 d at Regular Intervals.a, PCA; b, PLS-DA score and loading plots. X is the measurement matrix (GC-MS data), and y is made of dummy variables (0/1) that indicate
the class of fermentation.
Microbial Community and Metabolomics of Barley Nuruk 687
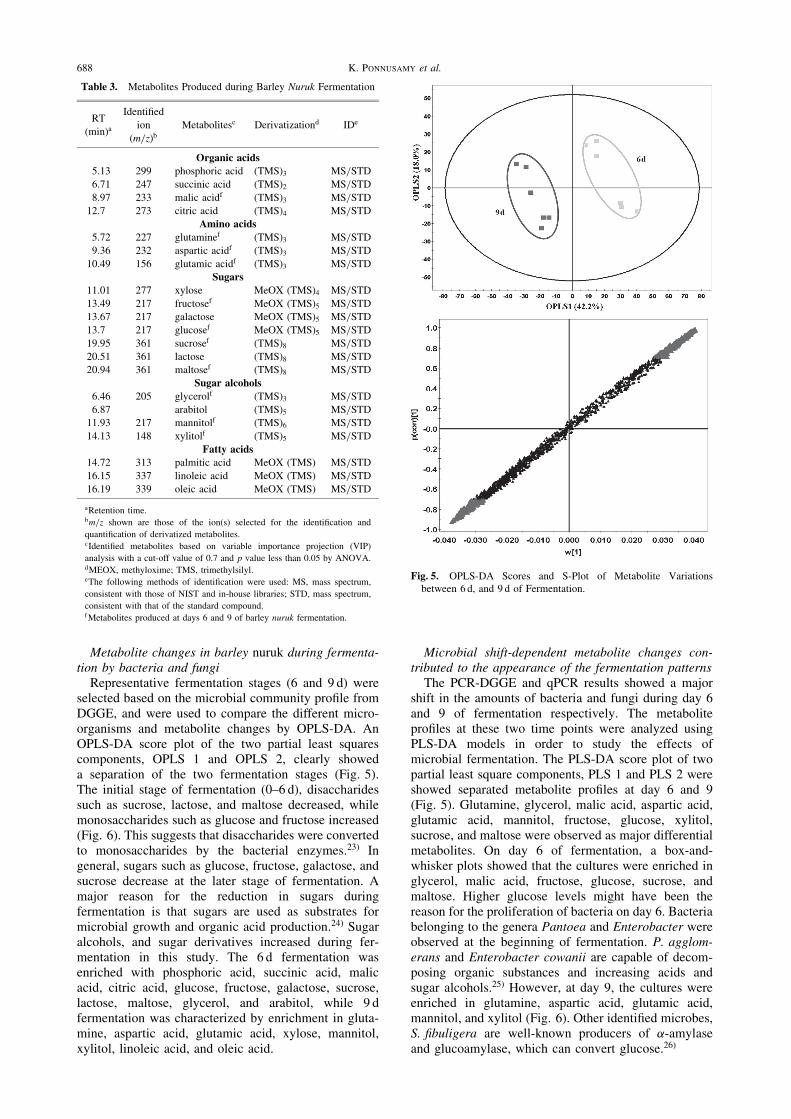
Metabolite changes in barley nuruk during fermenta-tion by bacteria and fungi
Representative fermentation stages (6 and 9 d) wereselected based on the microbial community profile fromDGGE, and were used to compare the different micro-organisms and metabolite changes by OPLS-DA. AnOPLS-DA score plot of the two partial least squarescomponents, OPLS 1 and OPLS 2, clearly showeda separation of the two fermentation stages (Fig. 5).The initial stage of fermentation (0–6 d), disaccharidessuch as sucrose, lactose, and maltose decreased, whilemonosaccharides such as glucose and fructose increased(Fig. 6). This suggests that disaccharides were convertedto monosaccharides by the bacterial enzymes.23) Ingeneral, sugars such as glucose, fructose, galactose, andsucrose decrease at the later stage of fermentation. Amajor reason for the reduction in sugars duringfermentation is that sugars are used as substrates formicrobial growth and organic acid production.24) Sugaralcohols, and sugar derivatives increased during fer-mentation in this study. The 6 d fermentation wasenriched with phosphoric acid, succinic acid, malicacid, citric acid, glucose, fructose, galactose, sucrose,lactose, maltose, glycerol, and arabitol, while 9 dfermentation was characterized by enrichment in gluta-mine, aspartic acid, glutamic acid, xylose, mannitol,xylitol, linoleic acid, and oleic acid.
Microbial shift-dependent metabolite changes con-tributed to the appearance of the fermentation patternsThe PCR-DGGE and qPCR results showed a major
shift in the amounts of bacteria and fungi during day 6and 9 of fermentation respectively. The metaboliteprofiles at these two time points were analyzed usingPLS-DA models in order to study the effects ofmicrobial fermentation. The PLS-DA score plot of twopartial least square components, PLS 1 and PLS 2 wereshowed separated metabolite profiles at day 6 and 9(Fig. 5). Glutamine, glycerol, malic acid, aspartic acid,glutamic acid, mannitol, fructose, glucose, xylitol,sucrose, and maltose were observed as major differentialmetabolites. On day 6 of fermentation, a box-and-whisker plots showed that the cultures were enriched inglycerol, malic acid, fructose, glucose, sucrose, andmaltose. Higher glucose levels might have been thereason for the proliferation of bacteria on day 6. Bacteriabelonging to the genera Pantoea and Enterobacter wereobserved at the beginning of fermentation. P. agglom-erans and Enterobacter cowanii are capable of decom-posing organic substances and increasing acids andsugar alcohols.25) However, at day 9, the cultures wereenriched in glutamine, aspartic acid, glutamic acid,mannitol, and xylitol (Fig. 6). Other identified microbes,S. fibuligera are well-known producers of �-amylaseand glucoamylase, which can convert glucose.26)
Table 3. Metabolites Produced during Barley Nuruk Fermentation
RTIdentified
(min)aion Metabolitesc Derivatizationd IDe
(m=z)b
Organic acids
5.13 299 phosphoric acid (TMS)3 MS/STD
6.71 247 succinic acid (TMS)2 MS/STD
8.97 233 malic acidf (TMS)3 MS/STD
12.7 273 citric acid (TMS)4 MS/STD
Amino acids
5.72 227 glutaminef (TMS)3 MS/STD
9.36 232 aspartic acidf (TMS)3 MS/STD
10.49 156 glutamic acidf (TMS)3 MS/STD
Sugars
11.01 277 xylose MeOX (TMS)4 MS/STD
13.49 217 fructosef MeOX (TMS)5 MS/STD
13.67 217 galactose MeOX (TMS)5 MS/STD
13.7 217 glucosef MeOX (TMS)5 MS/STD
19.95 361 sucrosef (TMS)8 MS/STD
20.51 361 lactose (TMS)8 MS/STD
20.94 361 maltosef (TMS)8 MS/STD
Sugar alcohols
6.46 205 glycerolf (TMS)3 MS/STD
6.87 arabitol (TMS)5 MS/STD
11.93 217 mannitolf (TMS)6 MS/STD
14.13 148 xylitolf (TMS)5 MS/STD
Fatty acids
14.72 313 palmitic acid MeOX (TMS) MS/STD
16.15 337 linoleic acid MeOX (TMS) MS/STD
16.19 339 oleic acid MeOX (TMS) MS/STD
aRetention time.bm=z shown are those of the ion(s) selected for the identification and
quantification of derivatized metabolites.cIdentified metabolites based on variable importance projection (VIP)
analysis with a cut-off value of 0.7 and p value less than 0.05 by ANOVA.dMEOX, methyloxime; TMS, trimethylsilyl.eThe following methods of identification were used: MS, mass spectrum,
consistent with those of NIST and in-house libraries; STD, mass spectrum,
consistent with that of the standard compound.fMetabolites produced at days 6 and 9 of barley nuruk fermentation.
Fig. 5. OPLS-DA Scores and S-Plot of Metabolite Variationsbetween 6 d, and 9 d of Fermentation.
688 K. PONNUSAMY et al.
Aspergillus oryzae was a major contributor to barleynuruk fermentation
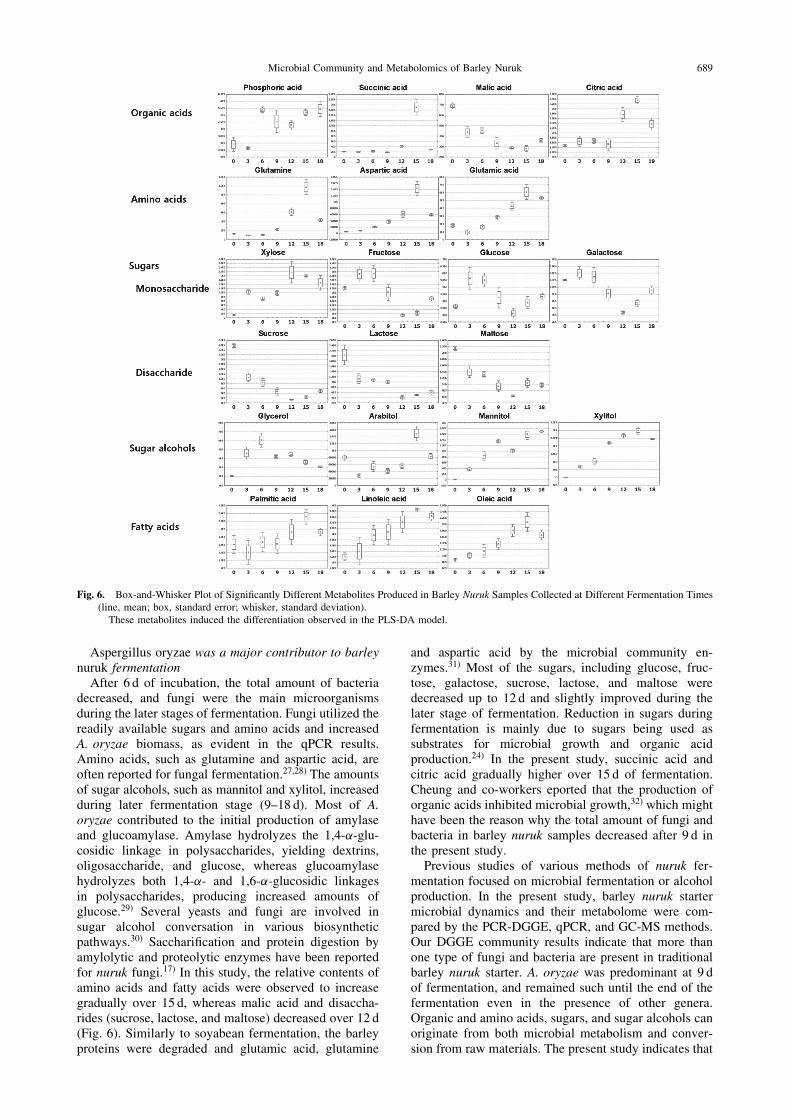
After 6 d of incubation, the total amount of bacteriadecreased, and fungi were the main microorganismsduring the later stages of fermentation. Fungi utilized thereadily available sugars and amino acids and increasedA. oryzae biomass, as evident in the qPCR results.Amino acids, such as glutamine and aspartic acid, areoften reported for fungal fermentation.27,28) The amountsof sugar alcohols, such as mannitol and xylitol, increasedduring later fermentation stage (9–18 d). Most of A.oryzae contributed to the initial production of amylaseand glucoamylase. Amylase hydrolyzes the 1,4-�-glu-cosidic linkage in polysaccharides, yielding dextrins,oligosaccharide, and glucose, whereas glucoamylasehydrolyzes both 1,4-�- and 1,6-�-glucosidic linkagesin polysaccharides, producing increased amounts ofglucose.29) Several yeasts and fungi are involved insugar alcohol conversation in various biosyntheticpathways.30) Saccharification and protein digestion byamylolytic and proteolytic enzymes have been reportedfor nuruk fungi.17) In this study, the relative contents ofamino acids and fatty acids were observed to increasegradually over 15 d, whereas malic acid and disaccha-rides (sucrose, lactose, and maltose) decreased over 12 d(Fig. 6). Similarly to soyabean fermentation, the barleyproteins were degraded and glutamic acid, glutamine
and aspartic acid by the microbial community en-zymes.31) Most of the sugars, including glucose, fruc-tose, galactose, sucrose, lactose, and maltose weredecreased up to 12 d and slightly improved during thelater stage of fermentation. Reduction in sugars duringfermentation is mainly due to sugars being used assubstrates for microbial growth and organic acidproduction.24) In the present study, succinic acid andcitric acid gradually higher over 15 d of fermentation.Cheung and co-workers eported that the production oforganic acids inhibited microbial growth,32) which mighthave been the reason why the total amount of fungi andbacteria in barley nuruk samples decreased after 9 d inthe present study.Previous studies of various methods of nuruk fer-
mentation focused on microbial fermentation or alcoholproduction. In the present study, barley nuruk startermicrobial dynamics and their metabolome were com-pared by the PCR-DGGE, qPCR, and GC-MS methods.Our DGGE community results indicate that more thanone type of fungi and bacteria are present in traditionalbarley nuruk starter. A. oryzae was predominant at 9 dof fermentation, and remained such until the end of thefermentation even in the presence of other genera.Organic and amino acids, sugars, and sugar alcohols canoriginate from both microbial metabolism and conver-sion from raw materials. The present study indicates that
Fig. 6. Box-and-Whisker Plot of Significantly Different Metabolites Produced in Barley Nuruk Samples Collected at Different Fermentation Times(line, mean; box, standard error; whisker, standard deviation).
These metabolites induced the differentiation observed in the PLS-DA model.
Microbial Community and Metabolomics of Barley Nuruk 689
a mixture of bacterial and fungal species contributes tothe saccharification of barley nuruk samples and variesat different times. The correlation between microbes andthe metabolome of barley nuruk may aid in to under-standing and controling the fermentation process, buttraditional starter fermentation varies in microbialconsortium and metabolites from different fermentationboxes and different places. The sampling method andmore precise analysis methods must be identified toovercome these pitfalls.
Acknowledgments
This work was supported by the National ResearchFoundation (NRF), and the Basic Science ResearchProgram (Grant no. 2010-0027204) of the Ministry ofEducation, Science, and Technology, Korea.
References
1) Kim CJ, J. Korean Agric. Chem. Soc., 10, 69–100 (1968).
2) Esaki H, Onazaki H, Kawakishi S, and Osawa T, J. Agric. Food
Chem., 45, 2020–2024 (1997).
3) Goyal R and Khetarpaul N, Plant Foods Hum. Nutr., 45, 81–89
(1994).
4) Ghorai S, Banik SP, Verma D, Chowdhury S, Mukherjee M, and
Khowala S, Food Res. Int., 42, 577–587 (2009).
5) Yen GC, Chang YC, and Su SW, Food Chem., 83, 49–54
(2003).
6) Escalante A, Giles-Gomez M, Hernandez G, Cordova-Aguilar
MS, Lopez-Munguia A, Gosset G, and Bolivar F, Int. J. Food
Microbiol., 124, 126–134 (2008).
7) Keatkrai J and Jirapakkul W, Sci. Asia, 36, 46–51 (2010).
8) Wishart DS, Trends Food Sci. Tech., 19, 482–493 (2008).
9) Jung MJ, Nam YD, Roh SW, and Bae JW, Food Microbiol., 30,
112–123 (2012).
10) Woo SM, Shin JS, Seong JH, Yeo SH, Choi JH, Kim TY, and
Jeong YJ, J. Korean Soc. Food Sci. Nutr., 39, 301–307 (2010).
11) Zoetendal EG, Rajilic-Stojanovic M, and de Vos WM, Gut, 57,
1605–1615 (2008).
12) Muyzer G and Smalla K, Antonie Van Leeuwenhoek, 73, 127–
141 (1998).
13) Cocolin L, Bisson LF, and Mills DA, FEMS Microbiol. Lett.,
189, 81–87 (2000).
14) Zwielehner J, Liszt K, Handschur M, Lassl C, Lapin A, and
Haslberger AG, Exp. Gerontol., 44, 440–446 (2009).
15) Park CD, Jung HK, Park HH, and Hong HH, Korean J. Food
Preserv., 14, 188–193 (2007).
16) Shi S, Zhang L, Wu ZY, Zhang WX, Deng Y, Zhong FD,
and Li JM, World J. Microbiol. Biotechnol., 27, 1869–1874
(2011).
17) Yu TS, Kim J, Kim HS, Hyun JS, Ha HP, and Park MG,
J. Korean Soc. Food Sci. Nutr., 27, 789–799 (1998).
18) Zhang WX, Qiao ZW, Shigematsu T, Tang YQ, Hu C,
Morimura S, and Kida K, J. Inst. Brew., 111, 215–222 (2005).
19) Li XR, Ma EB, Yan LZ, Meng H, Du XW, Zhang SW, and
Quan ZX, Int. J. Food Microbiol., 146, 31–37 (2011).
20) Law SV, Abu Bakar F, Mat Hashim D, and Abdul Hamid A,
Int. Food Res. J., 18, 475–484 (2011).
21) Limtong S, Sintara S, Suwannarit P, and Lotong N, Kasetsart J.
Nat. Sci., 36, 149–158 (2002).
22) Luo Z, Microbiology, 5, 36–47 (2003).
23) Schugerl K, Brandes L, Dullau T, Holzhauer-Rieger K, Hotop
S, Hubner U, Wu X, and Zhou W, Anal. Chim. Acta, 249, 87–
100 (1991).
24) Joo HK, Kim DH, and Oh KT, J. Korean Agric. Chem. Soc., 35,
351–360 (1992).
25) Kariluoto S, Aittamaa M, Korhola M, Salovaara H, Vahteristo
L, and Piironen V, Int. J. Food Microbiol., 106, 137–143
(2006).
26) Gonzalez CF, Farina JI, and de Figueroa LIC, Enzyme Microb.
Technol., 42, 272–277 (2008).
27) Shieh YSC, Beuchat LR, Worthington RE, and Phillips RD,
J. Food Sci., 47, 523–529 (1982).
28) Kinoshita S, Udaka S, and Shimamono M, J. Gen. Appl.
Microbiol., 3, 193–205 (1957).
29) Zambare V, Int. J. Life Sci., 4, 16–25 (2010).
30) Jennings DH, Adv. Microb. Physiol., 25, 149–193 (1984).
31) Je JY, Park PJ, Jung WK, and Kim SK, Food Chem., 91, 15–18
(2005).
32) Cheung HN, Huang GH, and Yu H, Bioresour. Technol., 101,
5925–5934 (2010).
690 K. PONNUSAMY et al.