time-in-cell · time-in-cell: the asca-liman 2014 national survey . of administrative segregation...
TRANSCRIPT

Time-In-Cell:
The ASCA-Liman 2014 National Survey of Administrative Segregation in Prison
The Liman Program, Yale Law School Association of State Correctional Administrators
August 2015
ASCA-Liman National Survey Segregation revised distribution August 31, 2015

The Arthur Liman Public Interest Program Yale Law School, New Haven, CT The Arthur Liman Public Interest Program was endowed to honor one of Yale Law School’s most accomplished graduates, Arthur Liman ’57. Arthur Liman personified the ideal of commitment to the public interest. Throughout his distinguished career, he demonstrated how dedicated lawyers, in both private practice and public life, can serve the needs of people and causes that might otherwise go unrepresented. The Liman Program was created in 1997 to forward the commitments of Arthur Liman as an exemplary lawyer dedicated to public service in the furtherance of justice. Association of State Correctional Administrators (ASCA) ASCA is the association of persons directly responsible for the administration of correctional systems. It includes heads of state corrections agencies, the Federal Bureau of Prisons, the District of Columbia, county systems such as Los Angeles County, Cook County (Chicago), municipalities such as New York City and Philadelphia, as well as certain former administrators of the above jurisdictions. ASCA, founded in the late 1960s and becoming a fully functional organization in 1985, was founded on the belief that each represented correctional jurisdiction is unique with regard to obligatory statutes, policies, structure, incarcerated population, resources, and burning issues, but that similarities of purpose, responsibilities, principles, and challenges among its member jurisdictions unite them in a quest for public safety, secure and orderly facilities, and professionalism that can be achieved through sharing ideas and vigorously entering into collaborative efforts to persistently improve the corrections profession.
Inquiries: [email protected] [email protected] [email protected] Yale Law School 127 Wall Street New Haven, CT 06511 George and Camille Camp Co-Executive Directors of the Association of State Correctional Administrators [email protected] [email protected] Acknowledgements The primary authors of this report are Sarah Baumgartel, Corey Guilmette, Johanna Kalb, Diana Li, Josh Nuni, Devon Porter, and Judith Resnik, who are faculty and students in the Yale Law School Liman Program, and from ASCA Camille Camp and George Camp, Co-Executive Directors. This project has been generously supported by the Yale Law School, the Liman Program, the Oscar M. Ruebhausen Fund at Yale Law School, and the Vital Projects Fund. Time-in-Cell To download copies of this report, please visit the website of the Liman Program at www.law.yale.edu/intellectuallife or ASCA at www.asca.net This report may be downloaded and reproduced free of charge and without the need for additional permission. All rights reserved.
ASCA-Liman National Survey Segregation revised distribution August 31, 2015

Time-In-Cell: The Liman-ASCA 2014 National Survey of Administrative Segregation in Prison1
Prolonged isolation of individuals in jails and prisons is a grave problem drawing national attention and concern. Commitments to lessen the numbers of people in isolated settings and to reduce the degrees of isolation have emerged from across the political spectrum. Legislators, judges, and directors of correctional systems at both state and federal levels, joined by a host of private sector voices, have called for change. In many jurisdictions, prison directors are revising their policies to limit the use of restricted housing and the deprivations it entails.
Although a few in-depth reports and litigation have provided detailed accounts of specific systems, relatively little nationwide information exists about the number of people held in restrictive housing, the policies determining their placement, how isolated the settings are, and whether the rules governing social contact, activities, and length of stay vary from place to place.
Therefore, in 2012, the Liman Program at Yale Law School joined with the Association
of State Correctional Administrators (ASCA), which is the national organization of the directors of all the U.S. prison systems, to gather information. We asked the directors of state and federal corrections systems to provide their policies governing administrative segregation, defined as removing a prisoner from general population to spend 22 to 23 hours a day in a cell for 30 days or more. The result, Administrative Segregation, Degrees of Isolation, and Incarceration: A National Overview of State and Federal Correctional Policies (2013), based on responses from 47 jurisdictions, analyzed the criteria for placement in and release from administrative segregation.
What we learned is that the criteria for entry were broad, as was the discretion accorded
correctional officials when making individual decisions about placement. Many jurisdictions provided very general reasons for moving a prisoner into segregation, such as that the prisoner posed “a threat” to institutional safety or a danger to “self, staff, or other inmates.” Some but not all jurisdictions provided notice to the prisoner of the grounds for the placement and an opportunity for a hearing. The kind of notice and what constituted a “hearing” varied substantially. In short, at the formal level, getting into segregation was relatively easy, and few policies focused on how people got out.
In 2014, to understand the impact of these policies, the Liman Program and ASCA
developed a survey of more than 130 questions, again sent to the directors of all the prison systems. Responses came from 46 jurisdictions, although not all jurisdictions answered all the
ASCA-Liman National Survey Segregation revised distribution August 31, 2015
i

questions. The result is this report, providing a unique inter-jurisdictional analysis of the use of administrative segregation around the United States.
A basic question is the number of prisoners in isolation. Commentators have relied on
estimates dating back ten years or more; the figures cited range from 25,000 to 80,000 prisoners. This Report is the first to update those figures; thirty-four jurisdictions, housing about 73% of the 1.5 million people incarcerated in U.S. prisons, provided numbers, totaling more than 66,000 prisoners in some form of restricted housing—whether termed “administrative segregation,” “disciplinary segregation,” or “protective custody.” If that number is illustrative of the whole, some 80,000 to 100,000 people were, in 2014, in segregation. And none of the numbers include people in local jails, juvenile facilities, or in military and immigration detention.
Having current information is one contribution of this Report. So is the documentation of
the commitments of correctional officials, nationwide, to reduce these numbers dramatically. Thus, directors of prison systems believe that these numbers are “wrong” in the sense that they are or will soon be out-of-date, based on their plans to cut back on the use of isolation and to change the conditions in it.
This Report focused on a subset of people in restricted housing—the 31,500 male prisoners held in administrative segregation. In terms of the demographics, 21 jurisdictions provided comparative information on general population and the administrative segregation population and, in those systems, Blacks and Hispanics were over-represented in administrative segregation. As for living conditions, the cells were small, ranging from 45 to 128 square feet, sometimes for two people. In many places, prisoners spent 23 hours in their cells on weekdays and 48 hours straight on weekends.
Opportunities for social contact, such as out-of-cell time for exercise, visits, and
programs, were limited; the time out-of-cell ranged from 3 to 7 hours a week in many jurisdictions. Phone calls and social visits were as few as one per month in several jurisdictions; in others, more opportunities existed. In virtually all jurisdictions, what the prisoners could keep in their cells, as well as their access to programs and to social contact, could be limited as sanctions for misbehavior.
Moreover, in most jurisdictions, administrative segregation had no fixed endpoint. (One
state imposed a twelve-month limit.) Further, while several systems did not keep track of the numbers of continuous days that a person remained in isolation, in the 24 jurisdictions that reported on that information, the time varied widely. In a substantial number, people remained in segregation for more than 3 years. Turning to the question of release, in 30 jurisdictions tracking the numbers in 2013, a total of 4,400 prisoners went from administrative segregation directly to the community.
ASCA-Liman National Survey Segregation revised distribution August 31, 2015
ii
The running of administrative segregation units poses many challenges for prison
systems. Some jurisdictions required staff to have additional training and offered flexible schedules, rotations, or provided extra benefits for the assignment. These issues were part of the incentives to make changes; in addition, many directors cited prisoner and staff well-being, pending lawsuits challenging their policies, and the costs. A few directors added that change was important because it “is the right thing to do.”
As noted, administrative segregation is not the only form of restrictive housing. Prisoners
are also held in close confinement as a disciplinary sanction and for their own protection, neither of which were the focus of this research. Thus, the Report offers a window into the practices of one kind of close confinement and a template for learning about whether the different rationales for restricted housing result in different modes of confinement.
By facilitating cross-jurisdictional comparisons of the rules and practices that surround
administrative segregation, this Report both reflects and supports ongoing efforts to understand its impact, reevaluate its use, and limit or end extended isolation. In some states, new legislation limits administrative segregation for subpopulations, such as the mentally ill, juveniles, and individuals with disabilities; many more proposals are pending at the state and national level. New programs for the mentally ill are mandating that prisoners spend 20 hours a week out of their cells. Lawsuits are attacking particular practices in specific states, and some advocates call for abolition. The 2015 “Mandela Rules,” shaped with input from leaders of corrections in the United States and promulgated by the Committee on Crime Prevention and Criminal Justice of the United Nations, have defined confinement of prisoners for 22 hours or more for longer than 15 days to be a form of “cruel, inhuman or degrading treatment.”
Calls for significant reductions in the use of isolation come from all quarters and,
importantly, from the chief operating officers of prison systems. But without a baseline, it is not possible to know the impact of the many efforts underway to reduce or eliminate the isolation of prisoners and to enable prisoners and staff to live and work in safe environments, respectful of human dignity. Time-in-Cell provides one measure, to use as a baseline to assess whether the changes hoped for are taking place, such that the number of persons held in such settings and the degrees of their isolation are substantially diminishing.
ASCA-Liman National Survey Segregation revised distribution August 31, 2015
iii

Table of Contents
I. The Parameters of and Concerns about Administrative Segregation 1 A. Separating and Segregating Prisoners: The National Debate about
Isolating Confinement 1
B. Getting In and Out of Administrative Segregation: The Formal Rules 7
II. The 2014 Liman-ASCA Survey 9 A. Defining and Collecting Data on the Impact of Administrative
Segregation 9
B. The Methodology’s Scope and Limitations 12
III. The Use of Administrative Segregation 14 A. Placing Administrative Segregation in the Context of Other Forms of
Restrictive Housing 14
B. The Percentage of Prisoners in Administrative Segregation 17 C. The Number of People in Administrative Segregation: 2011, 2014 22 D. The Duration of Administrative Segregation 27 1. Minimum and Maximum Time Periods 27 2. Continuous Days 27 E. Release from Administrative Segregation to the General Prison
Population and to the Community, as of 2013
29
IV. The Demographics of Administrative Segregation: 2011, 2014 30 A. Comparing the Total Custodial Population and the Population Held in
Administrative Segregation
30 B. A Two-Time Frame Comparison: 2011, 2014 33 C. Women in Administrative Segregation 34
V. Living in Administrative Segregation: Degrees of Isolation 36 A. Time-in-Cell 37 B. Inside the Cells 39 1. Single and Double Celling, Lighting, and Temperature Controls 39 2. Food, Personal Items Permitted, and Commissary Access 40 C. Exercise and Showers 41 D. Opportunities for Interpersonal Contact 43 1. Social Visits 44 2. Social Phone Calls 45 3. Social Correspondence 46 4. Legal Visits and Legal Mail 47 5. Communications Among Prisoners 47 6. Programming 48 E. Disciplinary Sanctions and Rewards 49
ASCA-Liman National Survey Segregation revised distribution August 31, 2015
iv

VI. The Administration of Administrative Segregation 50 A. Staff Policies 50 B. “Step-Down” and “Levels” Programs 51 C. Death-Sentenced Prisoners 52 D. Tracking Data 53
VII. Reconsidering Administrative Segregation 54 A. Internal Policy Reviews 55 B. Perceptions of Administrative Segregation 56 C. The Role of Mental Health 57 D. The Incentives for and the Barriers to Change 57
VIII. Revisiting the Use of Administrative Segregation: Lessening the Numbers in and the Degrees of Isolation 59 Endnotes 60 Appendix A: List of Charts and Tables Appendix B: Jurisdictions’ Goals for Reviewing Administrative Segregation Appendix C: Liman-ASCA 2014 Administrative Segregation Questionnaire Appendix D: Additional Questions on Incentives for and Barriers to Change
ASCA-Liman National Survey Segregation revised distribution August 31, 2015
v
I. The Parameters of and Concerns about Administrative Segregation The core goal of this Report is to understand, through survey responses from the directors
of prison systems around the United States, the number of people held in restricted housing, the “usual pattern” 2 for individuals in administrative segregation in terms of the conditions and duration of confinement, and how that pattern can be changed. By way of introduction, we outline the forms of restrictive housing, summarize the criteria used in different jurisdictions for placement in administrative segregation, and sketch the current critiques of expansive reliance on restricted confinement of individuals.
A. Separating and Segregating Prisoners: The National Debate about
Isolating Confinement All jurisdictions in the United States separate some prisoners from the general prison
population by placing individuals into “restricted housing.” Prison policies delineate three broad rationales for segregation—protection, discipline, and incapacitation. Segregation for an individual’s protection from particular threats is termed “protective custody,” and the decision to impose a sanction for violations of prison rules results in “punitive” or “disciplinary” segregation. When prison officials see an individual as a current or future risk to other prisoners or staff, that person is placed in what is often called “administrative segregation.”
Although formally distinct, a great deal of overlap exists among the rationales for and the
structures of segregation. For example, the criteria in some jurisdictions for putting a person into administrative segregation include a need to protect that person. Similarly, although disciplinary segregation is a sanction for a specific misdeed, in practice, disciplinary segregation can be long-term and far attenuated from the initial misbehavior.
A decision to segregate a prisoner need not inevitably result in isolating conditions. Just
as different reasons exist for segregation, so too could the forms of segregation vary. Indeed, the many terms that prison officials use for segregation—such as “administrative confinement,” “close supervision,” “behavior modification,” “departmental segregation,” “enhanced supervision housing” (“ESH”), “inmate segregation,” “intensive management,” “special management unit” (“SMU”), “security (or special) housing units” (“SHU”), “security control,” and “maximum control units,” as well as protective custody, disciplinary segregation, and administrative segregation—could reflect a variety of ways in which prisoners are treated while in restricted settings.
In practice, however, what this Report and other studies document is that despite the
different names, the key features of restricted housing are mostly the same. Decision-makers typically have broad discretion to put people into segregation. Placements are generally for an open-ended rather than for a fixed time period. Prisoners are restricted for most of 24 hours
ASCA-Liman National Survey Segregation revised distribution August 31, 2015
1

either to their single or double cells, and they have little or no access to outside contacts or to activities.
Concern about the harms imposed by such restrictions is widely shared. Illustrative is the
discussion, in June of 2015, by Justice Anthony Kennedy, in a case about a prisoner whom, the Justice explained, had spent “the great majority of his more than 25 years in custody in ‘administrative segregation,’ or, as it is better known, solitary confinement.”3 Justice Kennedy commented that, if following “the usual pattern,” the prisoner had likely been held “in a windowless cell no larger than a typical parking spot for 23 hours a day; and in the one hour when he leaves it, he likely is allowed little or no opportunity for conversation or interaction with anyone.”4 Justice Kennedy wrote about the “human toll wrought by extended terms of isolation,” as he called for change through more “public inquiry;” through judicial discussion of the harms; and, in an appropriate case, through decisions by judges about “whether workable alternative systems for long-term confinement exist, and, if so, whether a correctional system should be required to adopt them.” 5 Justice Kennedy also referenced prior decisions, which held that constitutional requirements of due process require procedural protections for placement in some forms of administrative segregation.6
Other Supreme Court justices have singled out isolated confinement as especially
troubling. In another decision also issued in June of 2015, Justice Breyer, joined by Justice Ginsburg, condemned the “dehumanizing effect of solitary confinement” and cited research “that solitary confinement can cause prisoners to experience ‘anxiety, panic, rage, loss of control, paranoia, hallucinations, and self-mutilations,’ among many other symptoms.”7 These Supreme Court Justices join a host of critics, some of whom call “solitary confinement” “the box” 8 or the “hole,” 9 provide in-depth accounts of particular jurisdictions,10 argue that it imposes “social death,”11 and press for these practices to stop.
The sense of urgency stems in part from the expansion, during the latter part of the
twentieth century, of this form of confinement through the construction of special, long-term isolation units and of entire prisons, colloquially termed “supermax.”12 Estimates of the number of prisoners in such confinement have ranged from 25,00013 to more than 80,000 people.14 The lower end of this range comes from a count of “supermax” bed space in U.S. facilities in the late 1990s.15 The 80,000 figure comes from a 2005 Bureau of Justice Statistics (BJS) Report.16 These estimates did not include jails, military facilities, juvenile or immigration detention centers.17 More recently, many prison systems kept and shared data through a Performance Based Measures System (PBMS), developed by the Association of State Correctional Administrators (ASCA), which is the national organization of the directors of prison systems in all the states and the federal system, to track a variety of issues for correctional administrators, including restrictive housing information.18
ASCA-Liman National Survey Segregation revised distribution August 31, 2015
2

But no published data have, until this Report, provided even a partial contemporary account of the number of people in isolation. Thirty-four jurisdictions provided information on all forms of restricted housing; according to 2013 prison census data from the Bureau of Justice Statistics (BJS), that set housed 1,149,291 prisoners, accounting for about 73% of the United States’ overall prison population of 1,574,741. Tallying those numbers, we can identify 66,000 people in those 34 jurisdictions in some form of restricted housing.19 Not included are people held in jails, which brings the estimate of incarcerated persons in the United States to more than two million.20 If the set of 34 are illustrative of the whole, then between 80,000 and 100,000 people were in isolation in prisons as of the fall of 2014.
Focusing, as this Report does, on the subset in administrative segregation, 41
jurisdictions provided their population numbers. According to the 2013 BJS prison census, that group of jurisdictions housed 1,186,159 people—about 81% of the total 1,463,454 male prisoners then in the United States.21 Tallying those in administrative segregation, about 31,500 men were held, in 2014, in that subset of prison systems. Like prior data collections, this information is about post-conviction prisoners and does not include those held awaiting trial or in military or immigration detention. Further, these numbers reflect only the facilities under the control of state-level departments; thus even if post-conviction prisoners are sent to county jails, they would only be included if the state ran those jails as well. Likewise, systems may vary on whether individuals in privately-run prisons or on special units such as for prisoners with capital sentences were included in the count.
The mix of concerns about the utility, legality, and morality of this form of confinement,
coupled with the growing literature on its harmful effects on the physical and mental health of all prisoners, 22 has produced many calls for reform. Some urge an overhaul, to abolish solitary confinement for any prisoner; others focus on subpopulations, including the mentally ill, juveniles, and pregnant prisoners. Thus, commitments to revisiting the use of and conditions in restrictive housing come from both public and private actors across the political spectrum.
As this Report exemplifies, prison directors are central to these reform efforts. Many are
seeking to alter the structure of administrative segregation, which was on the list of the “top five critical issues” reported by correctional agencies in 2014 to ASCA,23 which chartered a special subcommittee in 2012 to address administrative segregation. 24 Gary Mohr, the Chair of the ASCA Policy, Resolutions, Legislation and Legal Issues Committee and the Director of the Ohio Department of Rehabilitation and Correction, explained:
the issues surrounding restrictive housing must be a priority of our organization and . . . we have a clear calling to assist our members in creating an environment of hope and positive transition into the future for those who reside in these settings.25
ASCA-Liman National Survey Segregation revised distribution August 31, 2015
3
In 2013, ASCA adopted guidelines on Restrictive Status Housing Policy that aimed to constrain the use of isolating settings.26 Two years later, in the summer of 2015, sixteen “correctional directors and administrators with first-hand experience supervising solitary confinement units in prisons across the United States” joined together to file an amicus brief in the United States Supreme Court. 27 They argued that the Constitution requires individualized classification before a person could be placed in administrative segregation and, therefore, that the Court should review a lower court decision permitting across the board use of administrative segregation for all prisoners with capital sentences.28 Their concerns about the debilitating effects of isolation were echoed by a group of psychiatrists and psychologists, also calling for the Supreme Court to step in; these medical professionals highlighted the “scientific research” establishing the many harms imposed by prolonged solitary confinement.29
Several proposals have been introduced in the U.S. House of Representatives and the
Senate. “The Solitary Confinement Study and Reform Act of 2014,” proposed by Representative Cedric Richmond of Louisiana, sought to establish a “National Solitary Confinement Study and Reform Commission.” That body’s mandate was to report and recommend rules limiting restricted housing, so as to create a “more humane” approach to confinement.30
Other legislative initiatives focus on juveniles. Senators Cory Booker and Rand Paul
proposed the “REDEEM Act,” a shorthand for the “Record Expungement Designed to Enhance Employment Act of 2014.” That bill sought to prohibit the use of solitary confinement in juvenile facilities for “discipline, punishment, retaliation, staffing shortages, administrative convenience, or any other reason other than as a temporary response to the behavior” of juveniles posing serious threats of physical harm.31
In August of 2015, a bipartisan group of lawmakers, including Senators Richard Durbin,
Cory Booker, Rand Paul, and Mike Lee introduced the “MERCY Act” (Maintaining dignity and Eliminating unnecessary Restrictive Confinement of Youths), which would ban the use of solitary confinement for juveniles in federal facilities except under limited temporary circumstances.32 A parallel provision comes from Tony Cardenas, a member of the U.S. House of Representatives from California who, in 2015, introduced the “Protecting Youth from Solitary Confinement Act” to prohibit any “juvenile in Federal custody held in juvenile facilities” from being subjected to solitary confinement.33 Two other federal proposals focus on the mentally ill and immigration. One bill would provide grants for screening to protect the mentally ill from solitary confinement; another would limit solitary confinement for people held in immigration detention.34 Yet other rules preclude the use of isolation for pregnant women,35 a practice that Senator Richard Durbin has proposed to ban.36
ASCA-Liman National Survey Segregation revised distribution August 31, 2015
4

The Senate has also held hearings focused on the use of isolation in the Federal Bureau of Prisons (BOP). In 2014, Senators Durbin of Illinois and Ted Cruz of Texas presided at the hearing, “Reassessing Solitary Confinement II: The Human Rights, Fiscal, and Public Safety Consequences,”37 at which they heard testimony from a host of perspectives about the harms of isolating conditions. Thereafter, at Senator Durbin’s request, the BOP agreed to an independent audit of the federal prison system. The resulting report by CNA Analysis and Solutions, made publicly available in the spring of 2015, 38 raised a series of concerns about the overuse of restricted housing, 39 the need for diagnosis and treatment of mental health needs, 40 and the importance of providing prisoners in restrictive housing with programs and privileges akin to what is available to the general prison population.41 The report also identified “opportunities” for innovation42 to ameliorate some of the problems identified.
In August of 2015, the Senate Committee on Homeland Security and Governmental
Affairs, chaired by Senator Ron Johnson, from Wisconsin, held another hearing investigating problems in the federal system, including isolation. Senator Johnson was joined by Senator Thomas R. Carper of Delaware and Senator Cory Booker from New Jersey in convening Oversight of the Bureau of Prisons: First-Hand Accounts of Challenges Facing the Federal Prison System: Hearing Before the Senate Committee on Homeland Security & Governmental Affairs.43 Senator Booker called for the federal government to serve as a “model” in “ending this practice of solitary confinement.”44
States and localities have likewise addressed isolation. A few provisions, akin to Senator Booker’s call for “ending” solitary confinement, propose to impose limits for all kinds of prisoners.45 More common are efforts to limit the use of administrative segregation for specific populations. One focus, as noted by Justice Kennedy, is mentally ill prisoners.46 Some states, such as Massachusetts and Colorado,47 impose statutory restrictions on placement in isolation. For example, Colorado precluded placement of a “person with serious mental illness” in long-term isolation absent “exigent circumstances” and created a “work group” (including high-level personnel and “representatives from a nonprofit prisoners’ rights advocacy group”), charged with addressing conditions of confinement of mentally ill prisoners.48 In 2014, the Department of Corrections in Colorado also instituted a program for mentally ill prisoners in isolation to provide them with 10 hours of out-of-cell recreation and 10 hours of out-of-cell treatment programs; the state “dedicated” two facilities “to those with mental health issues.”49 A recent statute in Massachusetts requires screening for mental illness and provides that, except “in exigent circumstances . . . a segregated inmate diagnosed with a serious mental illness . . . shall not be housed in a segregated unit for more than 30 days.”50
Several other jurisdictions have also changed rules related to the placement of mentally
ill or disabled individuals in isolating housing, sometimes by virtue of court orders and consent decrees51 and other times through legislation or department regulations. Pennsylvania created a
ASCA-Liman National Survey Segregation revised distribution August 31, 2015
5

structure for the oversight of prisoners with “serious mental illness” to limit the use of restrictive housing and to create “secure residential treatment units” providing a minimum of 20 hours of out-of-cell time per week. 52 In the spring of 2015, Texas acted to require a “mental health assessment” of people placed in solitary confinement and their removal if the assessment indicated the confinement would be harmful. 53 In Arizona, a consent decree provided for increased access to healthcare for all those in administrative segregation and increased out-of-cell time for mentally ill prisoners.54 In New York City, cognitively impaired individuals are not to be put into isolation.55 In addition, mentally ill prisoners are protected in several jurisdictions through court orders or consent decrees resolving lawsuits.
In the states, like the federal system, the effect of segregation on younger people has been
of special concern.56 The sources of change are, once again, a mix of new correctional initiatives and policies; statutes and regulations; legislative reports and hearings; advocacy work; and court orders concluding lawsuits. 57 In 2015, the Council of Juvenile Correctional Administrators detailed segregation’s adverse consequences for juveniles and called for reducing its use. 58 Several jurisdictions have restricted placement of juveniles in “seclusion”59 and in “enhanced supervision housing,”60 which are the terms used in some juvenile facilities for administrative and disciplinary segregation. In June of 2015, for example, the New York State Assembly enacted a bill prohibiting “segregated confinement,” for discipline, for “juveniles under the age of 21” as well as for persons with mental illness or forms of developmental disabilities.61
The work of government officials interacts with efforts of several non-profit groups
concerned about the justice system and committed to civil and human rights. The Vera Institute has developed expertise in creating alternatives to administrative segregation;62 the American Bar Association has developed standards related to segregation; 63 Human Rights Watch has highlighted the harms to the mentally ill,64 and the American Civil Liberties Union has launched a project, “Stop Solitary,” that mixes public advocacy and litigation. 65 Further, as Justice Kennedy discussed, the media have also turned attention to prison conditions and isolated confinement.66 Efforts to bring the problem to the fore come also from social media, exemplified by the “National Day of Action to End Solitary,” supported by Think Ten Media, which aimed to “raise awareness of the harsh realities of solitary confinement” by a 30-second “social media clap.”67 In addition, several academics—coming from different disciplines—have done in-depth research on particular facets of segregation.68
Efforts to limit isolated confinement are not unique to prison systems in the United
States. In 2013, Juan Mendez, Special Rapporteur on Torture for the United Nations, proposed a ban on solitary confinement that exceeded 15 days.69 The question of the treatment of detainees has also been the subject of the United Nations Commission on Crime Prevention and Criminal Justice, which met in the spring of 2015 in Cape Town, South Africa and in Vienna, Austria to develop standards for the treatment of prisoners. Members of ASCA worked alongside the U.S.
ASCA-Liman National Survey Segregation revised distribution August 31, 2015
6

Department of State and many nongovernmental organizations (“NGOs”). The result, the United Nations Standard Minimum Rules for the Treatment of Prisoners (known as the “Mandela Rules”), was approved in the spring of 2015 by the Commission and forwarded to the General Assembly. 70 The Mandela Rules, which define “prolonged solitary confinement” as the placement of “prisoners for 22 hours or more a day without meaningful human contact” for “a time period in excess of 15 consecutive days,” called for its prohibition for subpopulations such as those with mental and physical disabilities and to stringent limits more generally on its use.71
In sum, dozens of initiatives are underway to reduce the degree and duration of isolation,
or to ban it outright, and to develop alternatives to protect the safety and well-being of the people living and working in prisons. The harms of such confinement for prisoners, staff, and the communities to which prisoners return upon release are more than well-documented. In some jurisdictions, isolated confinement has been limited or abolished for especially vulnerable groups (the mentally ill, juveniles, and pregnant women), and across the country, correctional directors are working on system-wide reforms for all prisoners.
B. Getting In and Out of Administrative Segregation: The Formal Rules This Report (the second in a series) contributes to those efforts. The work began in 2012
when the Arthur Liman Program at Yale Law School, working in collaboration with ASCA, sought to understand the formal rules that structure administrative segregation across the United States. In light of the variety of rules and practices in the 50 states and the federal system, we selected a subset of restricted housing—administrative segregation—rather than all forms of restricted housing.
The 2013 Report was based on the policies provided by jurisdictions; this 2015 Report is
based on survey data. In both instances, we asked primarily about administrative segregation, which we defined as the placement of inmates in a cell (either alone or with a cellmate) for most of their day (approximately 22-23 hours a day), and lasting thirty days or more, but excluding those placed in punitive segregation and protective custody. The 2013 Report examined the rules structuring administrative segregation, and this 2015 Report analyzes responses to a survey, seeking information about the number of people in all forms of restricted housing and then focused on the number in administrative segregation and the constraints under which they live.
A brief account of the 2013 study, Administrative Segregation, Degrees of Isolation, and
Incarceration: A National Overview of State and Federal Correctional Policies (2013 Liman Administrative Segregation Policies Report), is in order, as it provides the backdrop for this Report. We asked jurisdictions to provide their written policies governing this form of restrictive housing. We received information from 47 jurisdictions, including 45 states, the District of Columbia, and the BOP.72 The materials came from publicly accessible databases and from the directors of state and federal government prisons. Therefore, while private prisons represent a
ASCA-Liman National Survey Segregation revised distribution August 31, 2015
7

significant sector of detention facilities in the United States,73 neither the 2013 Liman Report nor this 2015 Report has information obtained directly from private sector prison companies.74
The goals of the 2013 Liman Administrative Segregation Policies Report were first, to
provide a national portrait of policies governing administrative segregation and second, by enabling comparisons across jurisdictions, to explore alternative methods of making prisons safe environments for prisoners and staff. We analyzed the criteria for entry; 75 the processes for placement; 76 the opportunities for review over time; 77 and the rules on when visits were permitted.78 Because the focus was on statewide regulations, we did not obtain institution-level policies or daily post orders and special directives, nor did we inquire about whether rules varied depending on a prisoner’s gender or age.
As that Report detailed, across the 47 jurisdictions, the criteria for entry were broad, as
was the discretion accorded correctional officials in making individual decisions about placement. Many jurisdictions provided very general reasons for moving a prisoner into segregation, such as that the prisoner posed “a threat” or “a serious threat” to “the life, property, security, or orderly operation of the institution.”79 Many jurisdictions also authorized separation because a person was seen as posing a danger to “self, staff, or other inmates,”80 or segregation was needed as a means to “protect the public.”81 Several states further specified that the purpose of administrative segregation was not punitive, 82 but to ensure the safety and security of prisoners and staff. Additional grounds for segregation were provided in many policies—such as the kind of offense for which a person was incarcerated, the sentence imposed,83 the number of infractions a person had, or whether a criminal or prison-based investigation of that individual was pending. 84 A few policies limited those criteria by requiring more specificity about the grounds, for example, by a showing of serious bodily harm85 or attempts at escape.86
In terms of the processes for deciding whether a particular individual met the criteria for
placement, all the policies authorized an immediate, temporary placement in segregation. Thereafter, some but not all jurisdictions provided for notice to the prisoner of the grounds for the placement and an opportunity for a hearing as a basis for continuing the segregated detention. The kind of notice and what constitutes a “hearing” varied substantially, 87 as did the staff personnel authorized to be decision-makers. Some systems left decisions at the ground level, with unit personnel; some jurisdictions’ policies placed authority in committees; and others required oversight by the warden or the central office.88 In short, at the formal policy level, most policies permitted placement in segregation based on a wide range of generally-described rationales. Because of the breadth of discretion, administrative segregation could be used for reasons other than incapacitation. Indeed, in our exchanges about administrative segregation, several correctional experts discussed the risk of overuse based on what is colloquially known as being “mad” at a prisoner, as contrasted with being “scared” of that individual.89
ASCA-Liman National Survey Segregation revised distribution August 31, 2015
8

In addition to entry into administrative segregation, we sought to learn about the policies in place to review that confinement and to consider returning prisoners to the general population. All the policies provided for some form of ongoing review but with diverse rules on the timing, level of oversight, and criteria. 90 Reading the policies did not provide insights into whether required layers of review resulted in returning prisoners to general population; we did not learn when and why individuals were released from administrative segregation.
The 2013 Liman Administrative Segregation Policies Report considered the question of
inter-personal contacts by analyzing some rules related to visits.91 Many policies provided for a limited number of social visits.92 Jurisdictions had different rules that enabled more access to religious personnel and lawyers,93 albeit often with constraints, such as lawyers needing special permission to visit clients.94 Some policies described processes by which individuals moved through “step-down” or “levels” programs and gained access to specified activities, including opportunities for visits, through completion of certain other activities, such as behavioral classes. Some jurisdictions used steps or levels as required routes to the general population. In other jurisdictions, policies did not detail transitions to the general population or, if prisoners’ sentences had been completed, to the community.
In sum, a wide net of authority permits institutions to place prisoners into segregation.
The 2013 policies made plain that, in most jurisdictions getting into administrative segregation was relatively easy to do, and that getting out of segregation was not a focus of the rules. In only a few jurisdictions, as of 2013, were policies in place that made administrative segregation placements more difficult, for example by limiting the authority of confining individuals in administrative segregation to specific, high-level prison administrators.
II. The 2014 Liman-ASCA Survey
A. Defining and Collecting Data on the Impact of Administrative Segregation
Reading rules does not reveal how policies are implemented at the institutional and system levels. We did not inquire in 2013 about the numbers of individuals in segregation, the demographics of the populations, the duration of time spent in segregation, the challenges of administering this form of confinement, and the ways in which jurisdictions were considering revising their administrative segregation policies. We did not attempt then—nor do we now—to evaluate whether the policies achieve their goals of enhancing safety; the economic costs of segregation; or the legitimacy of segregation as a mode of prison management.95 We have not assessed the long-term effects of administrative segregation on the safety and well-being of prisoners, staff, and communities, or the expenditures and the alternatives.
What this Report does provide is a window into the numbers of people in administrative
segregation and the conditions under which they are confined. To do so, the Liman Program and
ASCA-Liman National Survey Segregation revised distribution August 31, 2015
9

ASCA developed and distributed a national survey. We asked prison administrators in each jurisdiction in the United States to answer more than 130 questions. The topics addressed the number and demographic characteristics of prisoners in segregation; the physical conditions of segregation units; prisoners’ opportunities for social contact including visits and programs; the administration of segregation in terms of policy-making, information tracking; demands on staff; and the reasons for and the barriers to changing current policies.96
Further, we sought to understand the relationship between the numbers of persons in all
forms of restricted housing and administrative segregation, before honing in on more than 100 questions targeted at those in administrative segregation. As noted at the outset, 34 jurisdictions, which housed about 73% of the U.S. prison population in 2013, told us that, in the fall of 2014, about 66,000 people were in any form of restricted housing. If those numbers are illustrative of the 18 systems not detailing their numbers, it is fair to estimate that some 80,000-100,000 people were in restricted housing in prisons in the fall of 2014.
More jurisdictions—41 in all—provided numbers on the people in administrative
segregation, and the total in that subset of men and women tallied more than 32,000. Further, in some jurisdictions, the numbers of prisoners in administrative segregation and in all forms of restricted housing were reported to be roughly the same. In other jurisdictions, more people were reported to be in restricted housing than in administrative segregation. And the reminder is that 6 jurisdictions did not respond to any questions, and these 6 house about 175,000 prisoners.97
The process of developing the survey was collaborative—crossing professional domains
and jurisdictions. In the summer of 2014, members of the Liman Program and of ASCA drafted a preliminary survey that was circulated to 5 jurisdictions for pilot testing and comments. In August of 2014 at ASCA’s annual summer meeting, the Liman Program presented responses; ASCA members proposed expanding the scope of the research and the number of questions asked. After soliciting additional comments and suggestions from the directors of state correctional systems and advice on survey research from ASCA staff and Yale Law School faculty, we revised the survey and, in October of 2014, the Liman Program and ASCA launched the full survey, using Qualtrics software.
The survey was, therefore, unusually long for this genre; it included 133 questions, as
well as an optional subset of parallel questions addressing the treatment of women prisoners98—bringing the total for those jurisdictions answering all questions to more than 200 questions. The survey, set up in five segments, enabled respondents to move forward and back and also exit and return later to complete it.
ASCA-Liman National Survey Segregation revised distribution August 31, 2015
10

The questionnaire first requested system-wide information about the population of prisoners in restrictive housing in general and then asked for detailed information on administrative segregation, which we defined as follows:
For the purposes of this questionnaire, the term “administrative segregation” refers to separating prisoners from the general population, typically in cells (either alone or with cellmates), and holding them in their cells for most of the hours of the day for thirty days or more. Common terms for this type of confinement include administrative detention, intensive management, and restrictive housing. Please note that administrative segregation does not include punitive/disciplinary segregation or protective custody.
The second portion of the survey asked jurisdictions for information about the facility
that housed the largest population of male prisoners in administrative segregation. These questions focused on conditions for men housed in segregation, including the amount of time spent in cells and programming, as well as policies governing visits and the personal items that prisoners were permitted to possess. As noted, the survey also offered jurisdictions this set of questions twice (in the third portion of the survey), so as to gather data about the small number of women in administrative segregation. The fourth part of the survey asked about the demographic characteristics of the adults and juveniles in the general population of each jurisdiction’s incarcerated population and in administrative segregation. Finally, jurisdictions were asked a set of questions about what changes or reviews of their administrative segregation policies were in place or underway.
By the end of 2014, 34 jurisdictions had submitted responses and, in February of 2015 at
ASCA’s annual winter meeting, members of the Liman Program presented preliminary findings from those jurisdictions. During the discussion that ensued, directors suggested that we add questions to learn about the incentives for change and the barriers that jurisdictions face when seeking to alter administrative segregation policies. After drafts of these questions were circulated to a few state directors and revised, we obtained responses from 33 jurisdictions about the reasons for and challenges of changing administrative segregation.
In addition, ASCA enabled us to reach out to some jurisdictions to clarify answers that
we did not understand and to reconcile data from jurisdictions that submitted more than one response or appeared to have provided conflicting responses. We were able to reach 32 jurisdictions for this follow-up. 99 Given time constraints, we did not conduct follow-up interviews with jurisdictions that submitted survey responses after March 16, 2015 nor did we ask the additional “incentives” and “barriers” questions to the few jurisdictions responding after that date.100 Further, in the follow-up process, a few jurisdictions indicated that some of the numbers provided were estimates. Thus, the findings in this Report are based on 46 online responses (obtained from October 2014 to April 2015), supplemented with some clarifications
ASCA-Liman National Survey Segregation revised distribution August 31, 2015
11
and follow-ups, from prison administrators in 44 states, the District of Columbia, and the Federal Bureau of Prisons.101
In the summer of 2015, we circulated a draft of this Report to scholarly advisors and a
few prison systems directors; after further revisions, we sent a draft to the ASCA members to review and heard from more than two dozen jurisdictions. We then revised the materials when appropriate and again circulated a revised draft Report and presented the materials at the mid-August summer ASCA meeting. Upon receiving additional comments, we made further revisions, tallied overall numbers, and finalized the Report for publication. As noted, this Report is one of a series. The Liman Program and ASCA hope to build on these data to learn more about prisoners in all forms of restrictive housing and about the impact of changes underway.
B. The Methodology’s Scope and Limitations A series of caveats are in order. First, a total of 46 jurisdictions responded to the survey
but not every jurisdiction answered each question. Therefore, we report the total number of responses for each question, and that total varies throughout this Report. Further, as noted, the 6 jurisdictions that did not participate house about 175,000 prisoners.
Second, except when otherwise noted, we rely on “self-reported” data. We did not
independently verify any of the information that jurisdictions provided to us. The data were coded by student researchers, and then independently checked by other student researchers. When we were unsure how to interpret a jurisdiction’s response to a question or found it ambiguous, we tried to obtain clarification through following up when possible. When unable to obtain clarification, we generally did not include the information. In a few instances, we were unable to resolve inconsistencies in the reported data, and in some discussions, such as of the total percentages of persons in administrative segregation and of the demographics of those persons, discrepancies appear.
Third, the ever-present reminder is, we asked about restricted housing in general but
focused on one form of segregation—confinement for “administrative” reasons rather than “protective” or “disciplinary” reasons. Although we had asked for information on all forms of restricted housing, answers to those questions came from 34 jurisdictions, and hence we have total numbers (about 66,000 people) in restricted housing only for that set of jurisdictions.102 We did not ask how the rules for different forms of restrictive housing vary. Thus, we have not yet learned about the total numbers for all 52 jurisdictions (including the states, the federal prison system, and the District of Columbia) for all forms of restrictive housing in prison, the conditions in other forms of restrictive housing, or the numbers in jails, military and immigration detention, and juvenile facilities. What we can report is that some jurisdictions use “administrative segregation” less but make greater use of other forms of restrictive housing (for example, disciplinary segregation).
ASCA-Liman National Survey Segregation revised distribution August 31, 2015
12
Fourth, because some jurisdictions define administrative segregation differently, and
some departments of corrections have moved away from using this term, we specified in the questionnaire the definition of administrative segregation detailed above, and relied on jurisdictions to provide data on confinement that fit those parameters. In our follow up, we asked jurisdictions whether they used this definition when providing data. We have noted instances in which jurisdictions indicated that they were estimating, unable to provide data using this definition, or used a different definition of administrative segregation. Yet, despite these efforts to obtain consistency across jurisdictions and the many inquiries back and forth, we know that some inconsistencies remain; for example, some jurisdictions counted death-sentenced inmates who were segregated on what is sometimes called “death row” as a part of their total administrative segregation population, while others did not. Further, two states reported that they did not include prisoners housed in double-cells in their total count of administrative segregation, even when these prisoners spend most hours of the day in cell.103 Moreover, even though we had sought to obtain information on all persons confined under that jurisdiction’s authority, it is possible that some jurisdictions did not include information on prisoners placed in privately-run prisons or moved out of state. We have flagged all such differences whenever we were aware of them.
Fifth, this discussion is about adults in prison. The survey did not gather information
about confinement pre-trial, or in jails, nor were we able to obtain detailed information across the country on juveniles or the mentally ill. A few responses do include information about individuals in segregated housing because of mental illness.
Sixth, we obtained information on the numbers of people in confinement and the rules
under which they live. Because we were not aiming to identify the variables driving the use of and efforts to limit administrative segregation, we did not do multi-variable regression analyses.
A final caveat is that, in general, we were not able to report detailed findings on the use
of administrative segregation for female inmates. Because most of the people held in administrative segregation are men, the survey asked first about the use of administrative segregation for male prisoners. We did obtain information about women in administrative segregation; 38 jurisdictions reported on the numbers and identified about 800 women in such confinement.104 The optional section asked jurisdictions to respond, by repeating 76 questions in the context of their treatment of female inmates. Ten of 46 jurisdictions provided this information, and several other jurisdictions provided brief discussions explaining relevant differences. In our follow-up, we asked jurisdictions that had not answered the portion of the survey on female inmates to explain any differences in administrative segregation policies or practices for male as compared with female inmates. Given the limited materials obtained, we provide only a small amount of information on women in administrative segregation.
ASCA-Liman National Survey Segregation revised distribution August 31, 2015
13

III. The Use of Administrative Segregation
The survey sought, first, to understand the numbers of prisoners held in administrative segregation in relationship to those held in other forms of restrictive housing. To do so, the survey asked jurisdictions to specify the number of prisoners in their total custodial populations, the number in all forms of restrictive housing, and the number of prisoners held in administrative segregation for two points in time—September 15, 2011 and September 15, 2014. Jurisdictions vary the dates on which they routinely collect data; some but not all use September 15. Hence, this Report references the two timeframes as the fall of 2011 and the fall of 2014. We used general population numbers obtained from jurisdictions to calculate the percentage of the custodial population held in restricted housing and in administrative segregation when possible.
A. Placing Administrative Segregation in the Context of Other Forms
of Restrictive Housing The survey asked jurisdictions to specify the number of prisoners held in the fall of 2014
in any form of restricted housing—including disciplinary segregation, protective custody, and administrative segregation. Forty-one jurisdictions provided data on people in administrative segregation, describing a total of about 32,000 men and women;105 34 jurisdictions also reported information on all forms of restrictive housing that, when tallied, included about 66,000 people.
The caveat is that these totals depended on responding jurisdictions using the categories of all forms of restricted and of administrative segregation. As we learned, some responses may not have always have delineated the two categories in the same way. Thus, one jurisdiction may have greater numbers in administrative segregation or restricted housing than another because of variations in the definitions.106
A few jurisdictions reported that the percentage of the custodial population held in
administrative segregation was small in relation to the percentage of the custodial population held in the larger category of restrictive housing. Of the jurisdictions responding, for example, New York reported that less than 1 percent of its custodial population (23 of 53,613 prisoners) was held in what that jurisdiction called “administrative segregation,” while 7.8% of the custodial population (4,198 of 53,613 prisoners) was in some form of restrictive housing.107 North Carolina also reported relatively few (85) people in administrative segregation when compared to the number (3,052) of people held in all forms of restricted housing. Colorado offered another example, in that 207 people were in administrative segregation and 662 in all forms of restricted housing. In contrast, some jurisdictions, such as Kentucky and Texas, reported that the majority of prisoners in any form of restrictive housing were held in administrative segregation.
Below, we summarize, in tabular form and in a bar chart (Table 1, Chart 1), the
information from the 34 jurisdictions providing these data, detailing the percentages and the
ASCA-Liman National Survey Segregation revised distribution August 31, 2015
14

numbers of individuals in administrative segregation and in any form of restrictive housing. The percentages in any form of restrictive housing ranged from 2.1% (Montana) to 14.2% (Delaware). The median was 6.6% of the total custodial population held in restricted housing, and 3 jurisdictions—Iowa, Kentucky, and the BOP—reported that percentage.
Table 1 – Percentage of Custodial Population (Both Sexes) in Administrative Segregation Compared to Percentage of Custodial Population in Any Form of Restrictive Housing (Fall 2014) (n = 34)108
ASCA-Liman National Survey Segregation revised distribution August 31, 2015
15

Chart 1 – Percentage of Custodial Population (Both Sexes) in Administrative Segregation Compared to Percentage of Custodial Population in Any Form of Restrictive Housing (Fall 2014) (n = 34)109
ASCA-Liman National Survey Segregation revised distribution August 31, 2015
16

B. The Percentage of Prisoners in Administrative Segregation Turning to the details of one form of restrictive housing, the percentage of the custodial
population held in administrative segregation in the fall of 2014 varied across jurisdictions. The jurisdiction reporting the highest percentage of male prisoners in administrative segregation was Arkansas, where approximately 7.5% of the male custodial population (1,026 out of 13,703 prisoners) was in administrative segregation. The jurisdiction reporting the lowest percentage was New York, where less than 0.1% of the male custodial population (23 out of 51,217 prisoners) was in administrative segregation. The caveat is that, as noted, New York also reported that 7.8% of the male custodial population (4,121 out of 51,217 prisoners) was in some form of restrictive housing.
Of the 41 jurisdictions reporting, the median was in Florida, where approximately 2.5%
of its male custodial population (2,378 out of 93,708 prisoners) was in administrative segregation. Florida was also one of the 33 jurisdictions providing both sets of numbers and therefore reporting that many more people were housed in some form of restrictive housing. We provide the jurisdiction-by-jurisdiction information in Table 2 and Chart 2, below.
ASCA-Liman National Survey Segregation revised distribution August 31, 2015
17
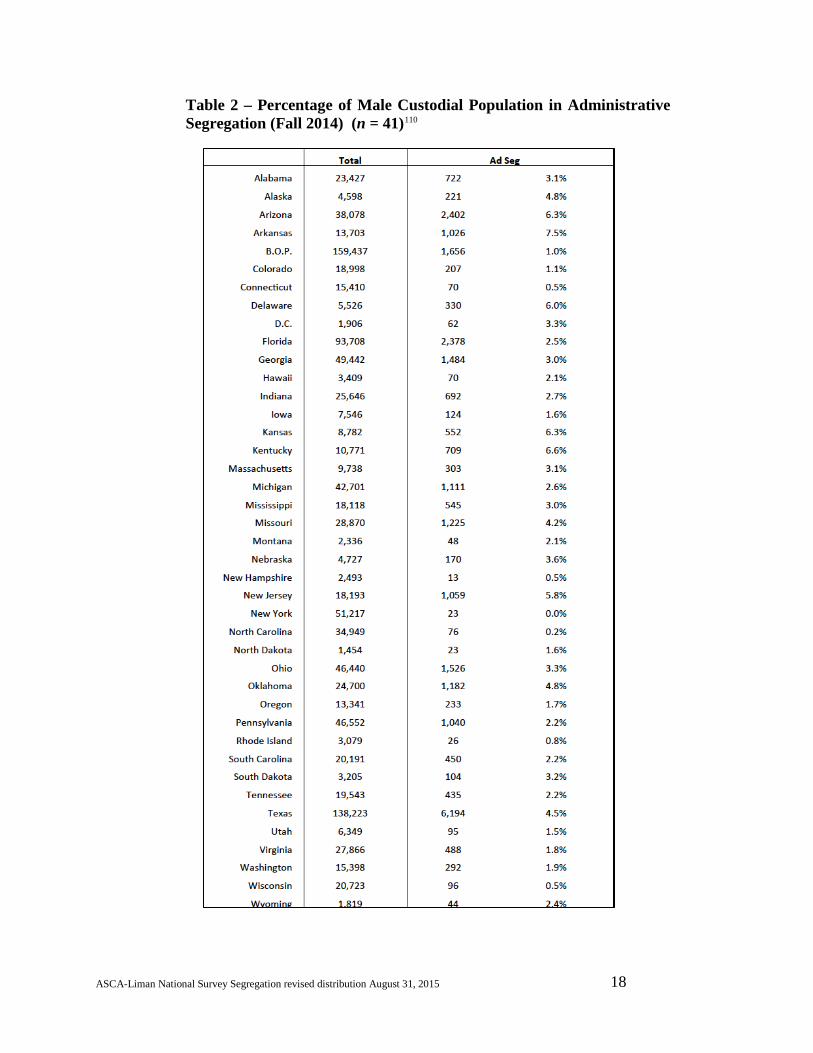
Table 2 – Percentage of Male Custodial Population in Administrative Segregation (Fall 2014) (n = 41)110
ASCA-Liman National Survey Segregation revised distribution August 31, 2015
18

Chart 2 – Percentage of Male Custodial Population in Administrative Segregation (Fall 2014) (n = 41)111
ASCA-Liman National Survey Segregation revised distribution August 31, 2015
19

Across all reporting jurisdictions, administrative segregation was used less frequently for
female prisoners. Here, as with male prisoners, administrative segregation is but one form of restricted housing. For example, of the 38 jurisdictions reporting on the question, 9 indicated that, as of the fall of 2014, no women were held in administrative segregation.112 Seven of these jurisdictions did report that they were housing women in some form of restricted confinement.113 In those 7 jurisdictions, the percentage of women housed in some form of restricted housing range from 1.5% (Colorado) to 4.4% (Montana). In jurisdictions reporting that women were in some form of restricted housing, the percent of women so confined ranged from 0.9% (Texas) to 7.0% (New Jersey).
Turning specifically to administrative segregation, Kentucky reported the highest rate of
confinement in administrative segregation for female prisoners, where 6.4% of the female custodial population (85 out of 1,332 prisoners) was held in administrative segregation. The median percentage of female prisoners in administrative segregation was less than 1 percent. Chart 3 and Table 3, below, provide the details.
Chart 3 – Percentage of Female Custodial Population in Administrative Segregation (Fall 2014) (n = 38)114
ASCA-Liman National Survey Segregation revised distribution August 31, 2015
20
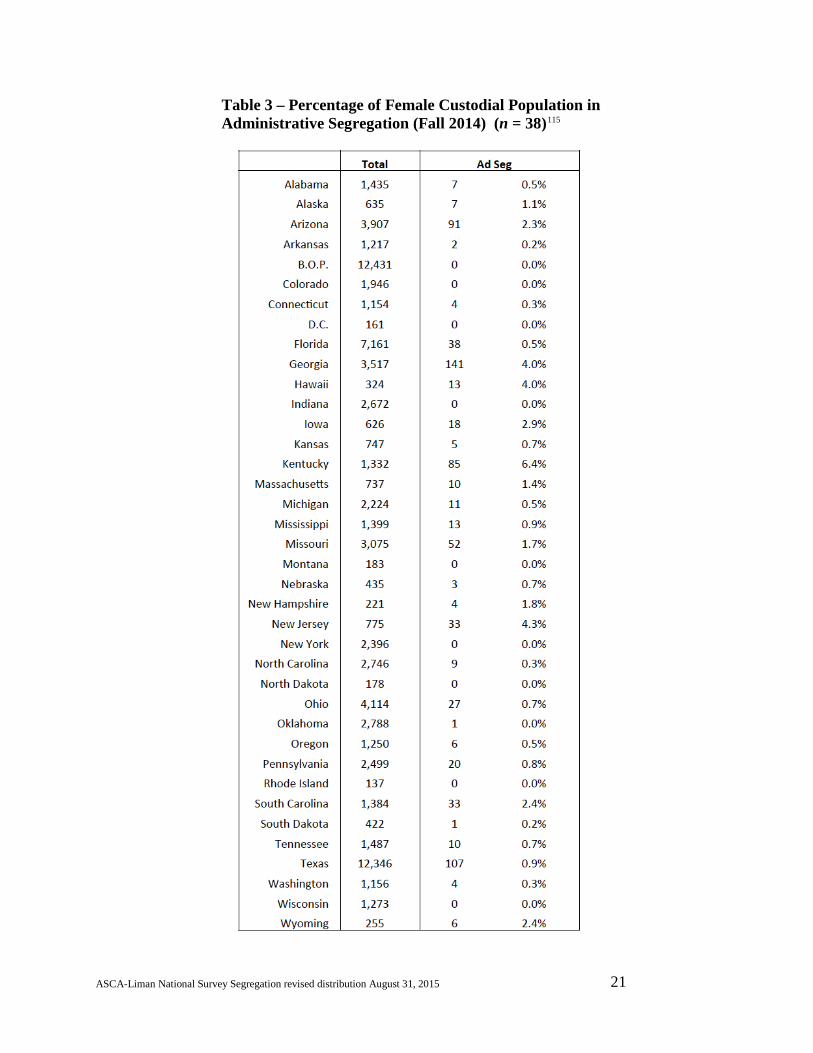
Table 3 – Percentage of Female Custodial Population in Administrative Segregation (Fall 2014) (n = 38)115
ASCA-Liman National Survey Segregation revised distribution August 31, 2015
21

C. The Number of People in Administrative Segregation: 2011, 2014 The survey sought to learn about whether the use of administrative segregation has been
stable or has changed. A complete picture would require monthly accounts, over years, of the numbers. To obtain a snapshot, the survey asked about populations in administrative segregation at two times, three years apart—the fall of 2011 and the fall of 2014. Thirty-six jurisdictions reported on these numbers for their male and female custodial populations; in many, the numbers of male prisoners in administrative segregation at the two intervals were roughly comparable. In a few, and notably, in Colorado, the reduction was substantial.
Specifically, in 19 of these 36 jurisdictions, the percentage of the male custodial
population held in administrative segregation decreased between the two times reported.116 The largest decrease was in Colorado where, in 2011, 7.4% (1,466 out a population of 19,738) of prisoners were in administrative segregation; in 2014, the percentage was 1.1% (207 out of 18,998 prisoners)—an absolute decrease of 1,259. Most of the jurisdictions reported smaller variations. The median decline was reported by Michigan, where the percentage of the male custodial population held in administrative segregation fell from 3.4% (1,465 out of 42,827 prisoners) in the fall of 2011 to 2.6% (1,111 out of 42,701 prisoners) in the fall of 2014.
In 14 out of 36 reporting jurisdictions, the percentage of the male custodial population
held in administrative segregation was higher in the fall of 2014 than in the fall of 2011. Again, the shifts were often small. The largest increase occurred in Kansas; in 2011, 4.0% (335 out of 8,437 prisoners) of its male custodial population was in administrative segregation. In 2014, 6.3% (552 out of 8,782 prisoners) of men were in administrative segregation. In these jurisdictions, the median increase between the two dates, 2011 and 2014, was 0.29%. Two states sat at the median; in Kentucky, the percentage of male prisoners held in administrative segregation was 6.3% (737 out of 11,743 prisoners) in the fall of 2011 and 6.6% (709 out of 10,771 prisoners) in the fall of 2014. In Florida, the percentage of male prisoners held in administrative segregation was 2.3% (2,131 out of 94,305 prisoners) in the fall of 2011 and 2.5% (2,378 out of 93,708 prisoners) in the fall of 2014. In 4 reporting jurisdictions, there were slight variations between the absolute number of men in administrative segregation between the two times, but the percentage relative to the custodial population did not change.
Across all 36 responding jurisdictions, the average change in the percentage of the male
custodial population held in administrative segregation between the fall of 2011 and the fall of 2014 was a decrease of 0.59%, and the median change was a decrease of 0.18%. In other words, aside from a few jurisdictions, the percentage of prisoners confined in administrative segregation remained relatively constant in the 2 time periods sampled.
ASCA-Liman National Survey Segregation revised distribution August 31, 2015
22

Chart 4 – Male Custodial Population in Administrative Segregation (Fall 2011, Fall 2014) (n = 36)117
ASCA-Liman National Survey Segregation revised distribution August 31, 2015
23

Table 4 – Male Custodial Population in Administrative Segregation (Fall 2011, Fall 2014) (n = 36)118
ASCA-Liman National Survey Segregation revised distribution August 31, 2015
24

We asked the same questions about changes in the number of women in administrative segregation in 2011 and in 2014, and 34 jurisdictions provided data. As noted, the numbers of women in this form of segregation were smaller than the numbers of men so confined, and administrative segregation is not the only form of restricted housing.
In 11 of the 34 reporting jurisdictions, the percentage of the female custodial population
held in administrative segregation decreased between the two snapshots of the fall of 2011 and the fall of 2014. In 15 jurisdictions, the percentage of women in administrative segregation was greater in 2014 than in 2011. In 2 jurisdictions, the number was constant in the sampled time periods.119 Six jurisdictions reported no women in administrative segregation at either time.120
The largest decrease was reported in Colorado, where the number of females held in
administrative segregation dropped from 39 (2.0% of a total female custodial population of 1,916) in 2011 to 0 in the fall of 2014. The largest increase occurred in South Carolina, which held 21 female prisoners (1.3% of a total female custodial population of 1,596) in administrative segregation in the fall of 2014 and 33 (2.4% of a total female custodial population of 1,384) in the fall of 2014.
Chart 5 – Female Custodial Population in Administrative Segregation (Fall 2011, Fall 2014) (n = 34)121
ASCA-Liman National Survey Segregation revised distribution August 31, 2015
25

Table 5 – Female Custodial Population in Administrative Segregation (Fall 2011, Fall 2014) (n = 34)122
ASCA-Liman National Survey Segregation revised distribution August 31, 2015
26

D. The Duration of Administrative Segregation The survey sought to understand the length of time that prisoners spend in administrative
segregation by learning about whether jurisdictions had policies addressing either a required minimum time period that prisoners had to spend in administrative segregation or a maximum amount of time after which prisoners had to be released. To understand, in practice, how much time prisoners spent in segregation, the survey asked jurisdictions to report the number of continuous days that prisoners had spent in administrative segregation as of the fall of 2014. To learn whether jurisdictions have rules addressing the transition from administrative segregation to other settings, the survey asked about policies related to release from administrative segregation.
1. Minimum and Maximum Time Periods
In response to questions about whether prisoners must stay in administrative segregation and/or in any particular phases of administrative segregation for fixed time periods, 32 of 44 responding jurisdictions reported no fixed minimum time period for being so confined. The remaining 12 jurisdictions reported that prisoners were required to stay in administrative segregation or in particular phases of administrative segregation for minimum time periods of between 30 days and more than a year.123 The survey also asked about whether jurisdictions had a maximum time period after which prisoners must be released into the general population. Forty-two jurisdictions reported no limits; in contrast, Colorado and Georgia reported imposing limitations. Colorado required prisoners to be released into the general population after 12 months in administrative segregation. Georgia reported that its administrative segregation process is based on a tiered program in which the “protocol, for time-served, varies depending on the Tier level in which the individual offender is assigned.”124
2. Continuous Days
Twenty-nine jurisdictions provided data on the number of continuous days that prisoners had spent in administrative segregation as of the fall of 2014.125 The questionnaire asked for the number of prisoners held in administrative segregation in intervals of less than 90 days; 90 to 180 days; 6 months to 1 year; 1 to 3 years; and more than 3 years. The survey asked for these data for the single facility holding the largest number of prisoners in administrative segregation. Some jurisdictions reported facility-specific numbers, but many responded with numbers for their entire correctional system, although some jurisdictions reported that all prisoners in administrative segregation were in one facility. In our follow-up, we asked about the number of prisoners held in administrative segregation for each period of continuous days across all of the facilities in their correctional systems. Below, we detail both facility-specific and system-wide data; when jurisdictions reported that all prisoners in administrative segregation were in a single facility, those jurisdictions are included in both accounts.
ASCA-Liman National Survey Segregation revised distribution August 31, 2015
27

Ten jurisdictions reported facility-specific data for their primary administrative detention facility (we did not learn whether the duration of administrative segregation in those facilities paralleled the duration in other prisons in that jurisdiction). Three of the 10 jurisdictions reported that the majority of prisoners in administrative segregation were there for fewer than 90 days. In Montana, for example, 94% of the prisoners held in administrative segregation (45 out of 48 prisoners) had spent fewer than 90 days in segregation as of September 15, 2014.
In 8 of these 10 jurisdictions, some prisoners had been held in administrative segregation
for more than 3 years. The two jurisdictions reporting the largest percentages of prisoners held in long-term segregation were the Federal Bureau of Prisons, which held 58% of the prisoners in administrative segregation at ADX Florence (234 out of 404 prisoners) for more than 3 years, and Pennsylvania, which held 45% of the prisoners in administrative segregation at SCI Greene (123 out of 271 prisoners) for more than 3 continuous years.126
The reminder is that these numbers are, in many jurisdictions, a subset of those in
administrative segregation which is, in turn, a subset of those in restrictive housing. For example, the BOP reported 1,656 people in administrative segregation and a total of 11,387 people in all forms of restrictive housing, and Pennsylvania reported 893 in administrative segregation and 1,279 in all forms of restrictive housing.
Table 6 – Length of Stay by Continuous Days in a Primary Administrative Segregation Facility in 10 Jurisdictions (as of Fall 2014) (n = 10)
Twenty-four jurisdictions reported system-wide data on length of stay. Eleven of these jurisdictions reported that the majority of prisoners held in administrative segregation across all correctional facilities were there for fewer than 90 days. Eighteen jurisdictions described holding some prisoners in administrative segregation for more than 3 years. The jurisdictions with the largest percentages of their administrative segregation populations serving over 3 continuous years in segregation were New York, where 83% (19 out of 23 prisoners) and Texas, where 44% (2,853 out of 6,491 prisoners) had spent more than 3 continuous years in segregation. Again, the caveat is that New York holds many more people in housing called “restrictive” but not “administrative segregation.”
ASCA-Liman National Survey Segregation revised distribution August 31, 2015
28
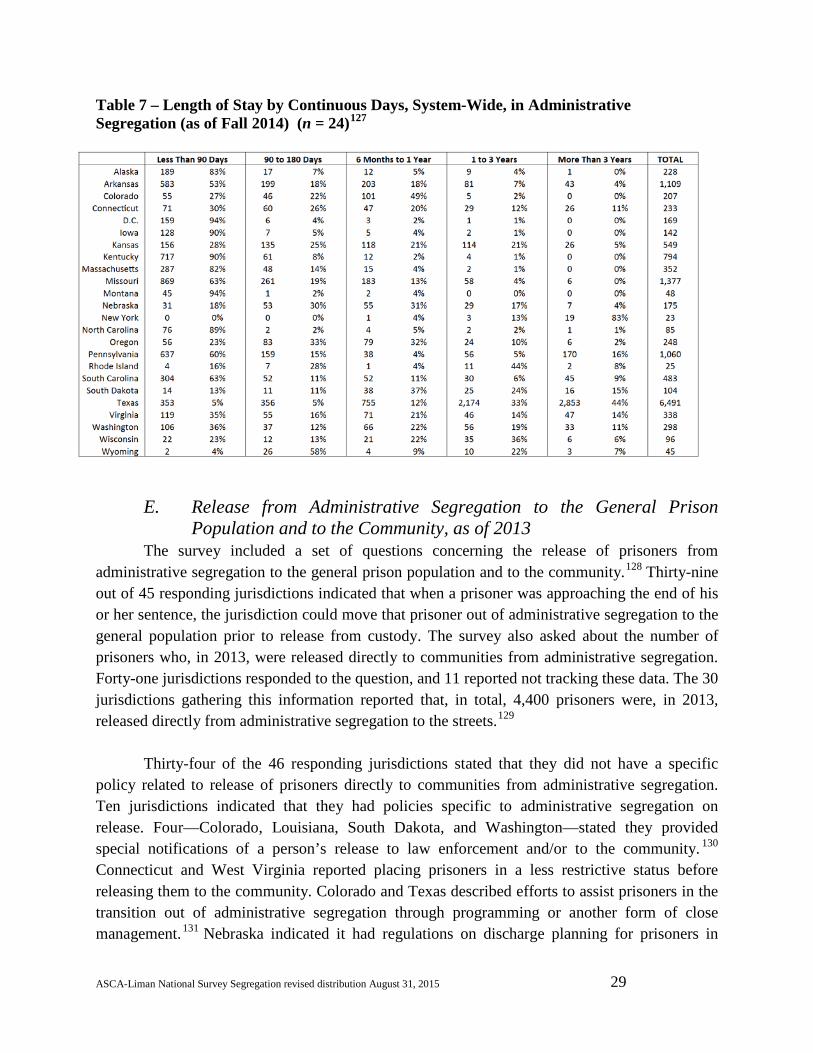
Table 7 – Length of Stay by Continuous Days, System-Wide, in Administrative Segregation (as of Fall 2014) (n = 24)127
E. Release from Administrative Segregation to the General Prison Population and to the Community, as of 2013
The survey included a set of questions concerning the release of prisoners from administrative segregation to the general prison population and to the community.128 Thirty-nine out of 45 responding jurisdictions indicated that when a prisoner was approaching the end of his or her sentence, the jurisdiction could move that prisoner out of administrative segregation to the general population prior to release from custody. The survey also asked about the number of prisoners who, in 2013, were released directly to communities from administrative segregation. Forty-one jurisdictions responded to the question, and 11 reported not tracking these data. The 30 jurisdictions gathering this information reported that, in total, 4,400 prisoners were, in 2013, released directly from administrative segregation to the streets.129
Thirty-four of the 46 responding jurisdictions stated that they did not have a specific
policy related to release of prisoners directly to communities from administrative segregation. Ten jurisdictions indicated that they had policies specific to administrative segregation on release. Four—Colorado, Louisiana, South Dakota, and Washington—stated they provided special notifications of a person’s release to law enforcement and/or to the community. 130 Connecticut and West Virginia reported placing prisoners in a less restrictive status before releasing them to the community. Colorado and Texas described efforts to assist prisoners in the transition out of administrative segregation through programming or another form of close management.131 Nebraska indicated it had regulations on discharge planning for prisoners in
ASCA-Liman National Survey Segregation revised distribution August 31, 2015
29

administrative confinement. Virginia stated its transition release policies were part of its step-down program. Wyoming reported that it had a “reintegration program in which small groups of inmates (4-6) participate in out of cell programming up to 4-6 hours a day,” as well as an in-cell journal of lessons that prisoners can discuss with a case worker.132 Two jurisdictions—Georgia and New Jersey—stated that the planning for all prisoners included those in administrative segregation. Georgia did not provide additional details; New Jersey stated it had general planning for all inmates, including those in administrative segregation, such as assisting in the provision of “appropriate continuity of care” for mental illness.
IV. The Demographics of Administrative Segregation: 2011, 2014
To learn more about the people in administrative segregation, the survey asked jurisdictions to provide demographic data for the total custodial population and for the population held in administrative segregation as of the fall of 2011 and the fall of 2014.133 Data were provided by 21 of the 46 responding jurisdictions, and those providing data did so for adult prisoners in 5 categories: White, Black, Hispanic, Asian, and Other.134 The age of individuals is another important dimension, but the responses did not provide a picture sufficiently comprehensive to detail the numbers of juveniles or those in other age brackets.
A. Comparing the Total Custodial Population and the Population Held
in Administrative Segregation As noted, fewer than half the jurisdictions answered these questions. In the 22 that did,
the demographic composition of the male population in administrative segregation in the fall of 2014 did not mirror the total male custodial population. In 18 of the 22 reporting jurisdictions, the male administrative segregation population contained a greater percentage of Black prisoners than the total male custodial population. In 13 of the 22 reporting jurisdictions, the male administrative segregation population contained a greater percentage of Hispanic prisoners than the total male custodial population. In 21 of the 22 jurisdictions, the male administrative segregation population contained a smaller percentage of White prisoners than the total male custodial population.
On average, among these 21 jurisdictions, Black prisoners comprised 47% of the
administrative segregation population, as compared with 39% of the total male prison population. On average, among these 21 jurisdictions, Hispanic prisoners comprised 14% of the administrative segregation population, as compared with 12% of the total male prison population. In contrast, on average there were fewer White and Asian prisoners in administrative segregation as compared to each jurisdiction’s total male prison population.
ASCA-Liman National Survey Segregation revised distribution August 31, 2015
30
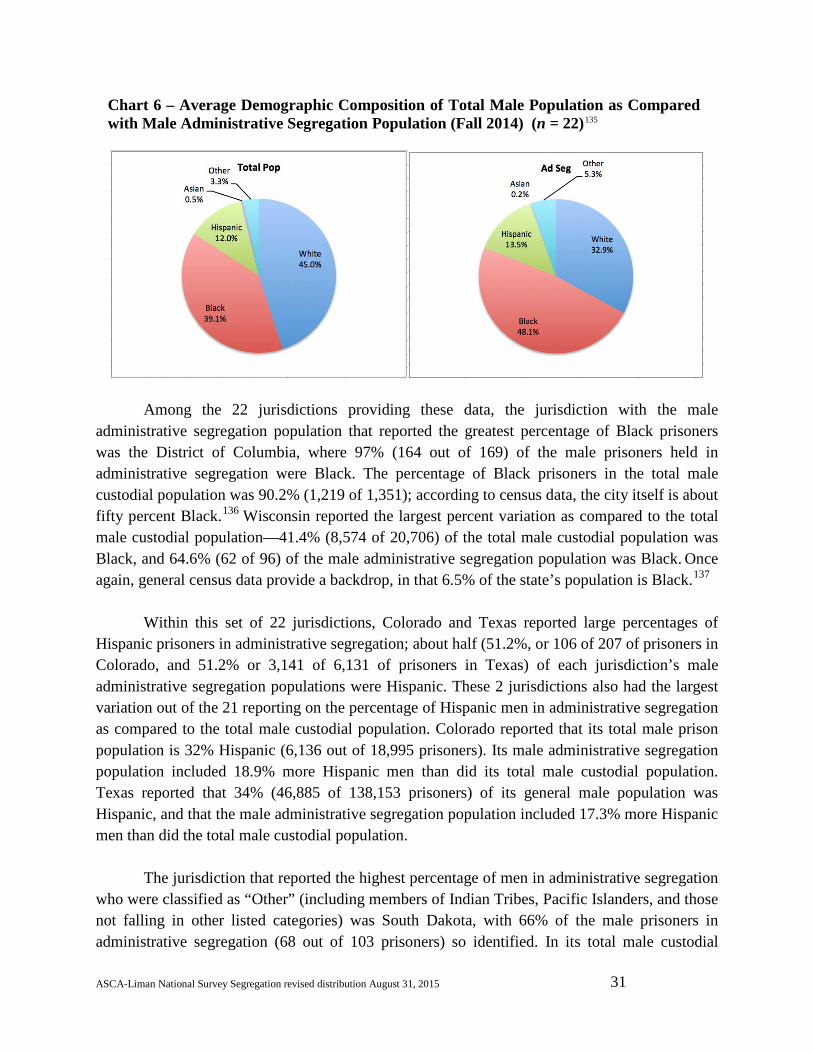
Chart 6 – Average Demographic Composition of Total Male Population as Compared with Male Administrative Segregation Population (Fall 2014) (n = 22)135
Among the 22 jurisdictions providing these data, the jurisdiction with the male administrative segregation population that reported the greatest percentage of Black prisoners was the District of Columbia, where 97% (164 out of 169) of the male prisoners held in administrative segregation were Black. The percentage of Black prisoners in the total male custodial population was 90.2% (1,219 of 1,351); according to census data, the city itself is about fifty percent Black.136 Wisconsin reported the largest percent variation as compared to the total male custodial population—41.4% (8,574 of 20,706) of the total male custodial population was Black, and 64.6% (62 of 96) of the male administrative segregation population was Black. Once again, general census data provide a backdrop, in that 6.5% of the state’s population is Black.137
Within this set of 22 jurisdictions, Colorado and Texas reported large percentages of
Hispanic prisoners in administrative segregation; about half (51.2%, or 106 of 207 of prisoners in Colorado, and 51.2% or 3,141 of 6,131 of prisoners in Texas) of each jurisdiction’s male administrative segregation populations were Hispanic. These 2 jurisdictions also had the largest variation out of the 21 reporting on the percentage of Hispanic men in administrative segregation as compared to the total male custodial population. Colorado reported that its total male prison population is 32% Hispanic (6,136 out of 18,995 prisoners). Its male administrative segregation population included 18.9% more Hispanic men than did its total male custodial population. Texas reported that 34% (46,885 of 138,153 prisoners) of its general male population was Hispanic, and that the male administrative segregation population included 17.3% more Hispanic men than did the total male custodial population.
The jurisdiction that reported the highest percentage of men in administrative segregation
who were classified as “Other” (including members of Indian Tribes, Pacific Islanders, and those not falling in other listed categories) was South Dakota, with 66% of the male prisoners in administrative segregation (68 out of 103 prisoners) so identified. In its total male custodial
ASCA-Liman National Survey Segregation revised distribution August 31, 2015
31

population, 28% were classified as “Other” (898 of 3,205 prisoners). Table 8 provides the details.
Table 8 – Demographic Composition of Total Male Population as Compared with Male Administrative Segregation Population (Fall 2014) (n = 22)138
ASCA-Liman National Survey Segregation revised distribution August 31, 2015
32

B. A Two-Time Frame Comparison: 2011, 2014 We also sought to understand whether the demographics of administrative segregation
were different in the fall of 2011 than in the fall of 2014. Information for both timeframes came from 15 of the 46 responding jurisdictions.139 On average, in 2011 for these jurisdictions, the male population held in administrative segregation included 6.1% more Black men, 2.6% more Hispanic men, and 8.7% fewer White men than did the total male custodial population.140 Five of these jurisdictions—Arkansas, Florida, Michigan, South Carolina, and Wisconsin—reported that the demographic composition in administrative segregation and in the total male custodial population remained relatively constant in both time periods.141
Chart 7 – Average Demographic Composition in 15 Jurisdictions of Total Male Population as Compared with Male Administrative Segregation Population (Fall 2011) (n = 15)142
Twelve of the 15 jurisdictions reported increases between 2011 and 2014 in the percentage of Black men in the male administrative segregation population as compared to the percentage in the custodial population.143 Nine of the 15 jurisdictions reported increases during the 3 years in the percentage of Hispanic men in administrative segregation as compared to the total custodial population.144 A few jurisdictions reported small shifts in both directions.145 The details are provided in Table 9.
ASCA-Liman National Survey Segregation revised distribution August 31, 2015
33

Table 9 – Demographic Composition in 15 Jurisdictions of Total Male Custodial Population as Compared with Male Administrative Segregation Population (Fall 2011) (n = 15)146
C. Women in Administrative Segregation Seventeen jurisdictions provided demographic data for the total female custodial
population and the female prisoners held in administrative segregation, and 13 jurisdictions provided information for 2011 and 2014. Tables 10 and 11 provide details on the small numbers of women so confined and the demographics in the reporting jurisdictions.
ASCA-Liman National Survey Segregation revised distribution August 31, 2015
34

Table 10 – Demographic Composition in 13 Jurisdictions of Total Female Population as Compared with Female Administrative Segregation Population (Fall 2011) (n = 13)147
Table 11 – Demographic Composition in 17 Jurisdictions of Total Female Population as compared to Female Administrative Segregation Population (Fall 2014) (n = 17)148
ASCA-Liman National Survey Segregation revised distribution August 31, 2015
35

V. Living in Administrative Segregation: Degrees of Isolation
This section details information about the structure of the daily life of prisoners in administrative segregation so as to provide a sense of what individuals can see and do. Below, we offer details on the time spent in cells; the physical environment (light, heat, cell type, and spatial dimensions); the personal items permitted in cells; the food provided; and access to the prison commissary, exercise, and showers.
A few introductory comments are in order. First, as we noted at the outset, not all of the
46 jurisdictions that responded to the survey addressed all the questions discussed below. Thus, we provide the number reporting for each question. Second, because a limited number of jurisdictions provided female-specific data, this section addresses administrative segregation’s conditions only for men. Third, this survey did not obtain sufficient detail on contact with medical and mental health personnel and with religious advisors to discuss access to those professionals. 149 Fourth, due to the large amount of data and the variation, this section discusses conditions at the facility that housed the largest number of prisoners in administrative segregation in each jurisdiction. In addition, we were not able to capture all the variation within jurisdictions, given that some had the same policies for all prisoners in administrative segregation, while others increased the scope of activities available as prisoners advanced through “step” or “level” classification systems.
Finally, the listing of possible activities, from showers to visits and programs, ought not
to be equated with participation in those activities. Factors affecting participation include prisoners’ physical and mental health, their ability to interact with others, facility resources, and whether activities are limited as sanctions. For example, a policy can permit an increase in the
ASCA-Liman National Survey Segregation revised distribution August 31, 2015
36

number of visits and can also authorize staff at specific facilities to limit visits at their discretion. Thus, the policies set the boundaries; studies of their application are required to understand how administrative segregation is experienced by both prisoners and staff. This overview needs, therefore, to be read with the understanding of a substantial variation in both rules and their implementation.150
A. Time-In-Cell Forty-one jurisdictions provided data on the amount of time prisoners spent in their cells.
Most stated that prisoners spent 23 hours a day in cells on weekdays; about half of all jurisdictions reported that prisoners spent 23 hours a day in cell on weekends. In about 30 percent of the jurisdictions, prisoners spent the full weekend in their cells. The activities that could bring prisoners out of their cells were exercise, showers, programming, visits, telephone calls, medical appointments, and work assignments.151 To the extent that time was spent outside cells, jurisdictions reported that the greatest percentage of that time was allocated for exercise; visits and programming were the two other major bases for out-of-cell time across many jurisdictions. As discussed in more detail hereafter, jurisdictions also withdrew opportunities for time out-of-cell as sanctions.
Information on the amount of time that prisoners spent in-cell was provided in three
formats. Twenty-eight jurisdictions answered by giving a single number of hours in cell for the entire administrative segregation population during weekdays; 27 jurisdictions gave a single number of hours in cell on weekends.152 Twelve jurisdictions reported either a range of in-cell time, often dependent on participation in a step/level program, or that prisoners spent “up to” a certain amount of time in-cell. 153 Two jurisdictions (New Jersey and Missouri) did not distinguish in-cell time between weekdays and weekends. 154 Charts 8 and 9 therefore are drawn from the jurisdictions giving a single time frame, and do not include the jurisdictions with the range of hours or the 2 that did not specify whether time varied for weekends and weekdays.
As Chart 8 shows, among the 28 jurisdictions that reported a single amount of in-cell
time for their entire administrative segregation population, 23 reported that prisoners spent 23 hours in cell on weekdays.155 In the remaining 5 jurisdictions, prisoners spent between 19 and 23 hours per day in cell on weekdays.
ASCA-Liman National Survey Segregation revised distribution August 31, 2015
37

Chart 8 – Hours per Day in Administrative Segregation Cells (Weekdays, Fall 2014) (n = 28)
Among the 27 jurisdictions included in Chart 9 below, 9 reported that prisoners spent more time in cell on weekends than they did on weekdays. Specifically, 8 jurisdictions reported that, on weekends, prisoners spent 24 hours per day in cell; 14 jurisdictions reported that prisoners spent 23 hours per day in cell,156 and 5 jurisdictions reported that prisoners spent under 23 hours per day in cell.
3.6% 3.6% 3.6%
7.1%
82.1%
Hours per Day in Administrative Segregation Cells (Weekdays)
19 Hours
20 Hours
21 Hours
22 Hours
23 Hours
ASCA-Liman National Survey Segregation revised distribution August 31, 2015
38

Chart 9 – Hours per Day in Administrative Segregation Cells (Weekends, Fall 2014) (n = 27)
B. Inside the Cells 1. Single and Double Celling, Lighting, and Temperature Controls
We asked a series of questions about the physical environment in which prisoners lived, in terms of the types of cells used, cell size, access to natural light, heating, and cooling. Twenty-six jurisdictions reported that they used only single-cells in administrative segregation;157 18 jurisdictions reported single-celling and double-celling prisoners. Among the 40 jurisdictions that reported data on cell size, the dimensions of cells used for single and double-celling were very similar. The median cell size used for both kinds of celling was 84 square feet. Cell size ranged from 45 square feet in both single and double cells158 to 120 square feet in single cells and 128 square feet in double cells.159
Of the 46 responding jurisdictions, 44 reported that cells in administrative segregation
had natural light. Of 42 jurisdictions, 28 reported that prisoners controlled in-cell artificial lighting, and 14 said that prisoners did not. 160 Thirty-two jurisdictions reported that cells in administrative segregation were equipped with air conditioning, and 45 jurisdictions provided heating.161 Jurisdictions that did not report having air conditioning included several in warmer climates, such as Alabama, the District of Columbia, Florida, Georgia, Louisiana, and Texas. Among the 30 jurisdictions that reported setting targets for cell temperatures during the summer months, those temperatures ranged from 68°F in Massachusetts to between 80 and 84°F in Wisconsin. Target temperatures during the winter months ranged from 65°F in New Hampshire to 76°F in Rhode Island.
3.7% 3.7% 3.7%
7.4%
51.9%
29.6%
Hours per Day in Administrative Segregation Cells (Weekends)
19 Hours20 Hours21 Hours22 Hours23 Hours24 Hours
ASCA-Liman National Survey Segregation revised distribution August 31, 2015
39
2. Food, Personal Items Permitted, and Commissary Access Forty-one jurisdictions reported that they served the same food in administrative
segregation as was served in the general population of prisoners; 2 jurisdictions reported serving different food in administrative segregation. Arizona adjusted meals to prevent providing components that could be turned into alcoholic beverages, and Iowa did not serve meat that had bones.162
The 45 responding jurisdictions all reported that prisoners could purchase items from the
commissary. Forty-one jurisdictions reported placing limits on prisoners’ commissary purchases; food items were the items most commonly listed as limited, and a number of jurisdictions also restricted what toiletries and personal correspondence items could be purchased. 163 In 17 jurisdictions, access to the commissary depended on a prisoner’s being in a particular “step” inside an administrative segregation program. Several jurisdictions specifically mentioned a dollar limit on personal funds that could be spent on commissary purchases; the limits ranged from $10 per month in Virginia to $120 per week in Oklahoma.
The 45 responding jurisdictions all reported that they permitted prisoners in
administrative segregation to keep books, religious materials, writing, and other items in their cells.164 Limitations came from rules on the amount of space permitted for such objects and from taking away materials as sanctions. Specifically, 16 jurisdictions reported restricting reading material as a sanction, and 6 reported using reading material as an incentive. Prisoners were permitted to keep letters, blank paper, toiletries, and pens or pencils in their cells in all responding jurisdictions, except for 1 (Virginia), which prohibited all these items. All responding jurisdictions except for 2 (New Hampshire and Virginia) reported permitting prisoners to keep magazines in their cells.
The amount of reading materials prisoners could possess was limited in most jurisdictions
(41 of the 45 responding). Reading materials were restricted in 2 primary ways—either by the total number of items or by the cubic foot. The permitted reading material items ranged from 1 book in the District of Columbia to 30 books, magazines, or newspapers in North Dakota. Restrictions based on space ranged from 1 cubic foot (Oklahoma) to 6 cubic feet (a subset of prisoners in Connecticut).
Many jurisdictions also reported restricting the content of reading materials. The most
commonly restricted types were hardcover books and materials denoted as having content that was pornographic, violent, or instructive on how to produce weapons. Almost all responding jurisdictions (41 of 45) reported that prisoners could obtain some amount of reading materials free of charge, typically through the facility library. One jurisdiction (South Carolina) reported that prisoners could have reading materials only if provided by the institutional library.
ASCA-Liman National Survey Segregation revised distribution August 31, 2015
40

Thirty-five of 44 responding jurisdictions reported that prisoners were allowed to have radios in their cells, and radios were provided free of charge in 5 jurisdictions. Thirty-five jurisdictions reported restricting radios as a sanction; 9 reported that gaining radios was offered as an incentive. Prisoners in 25 jurisdictions were permitted to have televisions in their cells, with 7 jurisdictions providing televisions free of charge. Thirty jurisdictions reported restricting televisions as a sanction; 12 reported using television as an incentive. Sixteen jurisdictions permitted prisoners to have digital or CD music players. One jurisdiction (New York) reported that prisoners could have access to in-cell programming via headphones and a jack in their cells that played radio, television, and other programs chosen by a committee of general population prisoners at the facility.
Forty-two of 45 jurisdictions reported permitting prisoners to keep photographs in their
administrative segregation cells, while 3 (Missouri, New Hampshire, and Virginia) stated that they prohibited photos in cells.165 Thirty-six jurisdictions reported that prisoners were permitted to keep food, in addition to that provided in meals. A few jurisdictions noted other items, such as playing cards (in Wisconsin and New Jersey) and a clock, a fan, and a hot pot in North Dakota. Prisoners in Arkansas were permitted to have MP4 players; prisoners in North Dakota and Ohio could have JP4 players, and North Dakota and Wyoming allowed prisoners to have video game consoles.166
C. Exercise and Showers Forty-five jurisdictions provided information about the amount of exercise time granted
to prisoners in administrative segregation, while 46 jurisdictions gave details on the types of exercises spaces available. The caveat is that while hours may be allotted, the opportunities to exercise depend on staffing levels, the availability of space, the weather, and on whether exercise is restricted as a sanction.
Twenty-six of 46 jurisdictions had indoor exercise areas, and 44 of 46 responding
jurisdictions had an outdoor exercise area.167 Eighteen jurisdictions reported using restrictions on exercise as a sanction, and 9 reported increasing hours of exercise as an incentive. Thirty-six jurisdictions stated that a certain number of exercise hours were available per week to all prisoners in administrative segregation; 9 jurisdictions reported that prisoners could receive more exercise as they advanced through a step classification system. Across the 45 responding jurisdictions, the time available for exercise each week ranged from 3 hours for all prisoners in administrative segregation (Missouri) and prisoners in some step levels (Delaware, South Dakota, and Utah) to 7.5 hours for all prisoners in administrative segregation (Illinois) and 14 hours for prisoners at some step levels (Delaware). In the majority of jurisdictions, the time allotted per week ranged from 5 to 7 hours; in the 36 identifying a standard amount for all people in administrative segregation, the median amount of exercise permitted was 5 hours per week.
ASCA-Liman National Survey Segregation revised distribution August 31, 2015
41

In terms of the types of exercise available, 17 jurisdictions reported that prisoners could exercise in groups. Group exercise activities included baseball, basketball, volleyball, running, and handball.168 When group exercise was offered, it was often offered only as a part of the final levels of a step-classification system. Ten jurisdictions provided prisoners with pull-up and/or dip bars, and 16 jurisdictions allowed prisoners to participate in some type of ball sport, such as basketball, handball, volleyball, or soccer. Twenty-one jurisdictions reported that prisoners could run during exercise periods, and 2 (Oregon and Indiana) reported that prisoners could lift weights. Ten jurisdictions said that prisoners could participate in yoga for exercise; some reported providing books or DVDs as guides, while others provided no instruction and stated that prisoners could do yoga on their own.
Some jurisdictions reported that they provided exercise equipment, such as treadmills,
cardio bikes, and “parcourses,” enabling exercise of different muscle groups without using weights. Florida permitted prisoners to enroll in a Wellness Education Program, addressing the spiritual, physical, intellectual, emotional, social, and environmental dimensions of well-being and using equipment such as cardiovascular endurance machines.
It appears that prisoners were not always able to take advantage of their full exercise
time. We asked jurisdictions to indicate what percentage of prisoners participated in the maximum number of permitted exercise hours during one week in the fall of 2014. Eight jurisdictions responded. Three jurisdictions reported that fewer than 10 percent of eligible inmates exercised; another three reported participation rates at more than 99 percent. Jurisdictions listed several reasons why prisoners were not exercising. The most common reasons were that an individual prisoner was seen as a threat to security, that an individual refused, that a unit was locked down, that inclement weather prevented exercise, or that an individual prisoner had engaged in a rules violation, either during the exercise period or at another time. Table 12 sets out the information in tabular form.
ASCA-Liman National Survey Segregation revised distribution August 31, 2015
42

Table 12 – Exercising in Administrative Segregation (Fall 2014) (n = 8)
Jurisdiction Number Participating in Maximum Amount of Exercise
Total in Administrative Segregation in Facility
Bureau of Prisons 38 404
Colorado 15 207169
Connecticut 40 40
Illinois 119 120
Iowa 30 40
Massachusetts 7 90
Oregon 233 233
Wisconsin 22 66
Jurisdictions were also asked about opportunities for prisoners to shower. Forty-one of
the 43 responding jurisdictions allowed all prisoners to shower at least 3 times per week, with 21 jurisdictions reporting limiting prisoners to 3 weekly showers. Thirteen jurisdictions permitted 5 or more showers per week.170 In addition, Missouri reported that prisoners in administrative segregation were permitted 1 shower every 3 days; Minnesota and Alabama permitted showers every other day.
Four jurisdictions reported restricting showers as a sanction, and 3 jurisdictions reported
using showers as an incentive. In Illinois, showers were linked to its step system; 1 shower per week was permitted during the first phase of a step-classification system, and 3 showers per week in phases 2 and 3.
D. Opportunities for Interpersonal Contact The questions related to visiting in the 2014 survey built on earlier efforts to understand
the parameters of outside contacts for prisoners. In 2012, the Liman Program had, in cooperation with ASCA, conducted a 50-state survey of visiting policies for prisoners in general populations.171 In the 2013 Liman Administrative Segregation Policies Report, we reviewed 47 jurisdictions’ policies on legal, religious, or social visitors.172 As that report discussed, policies then in place in 25 jurisdictions expressly authorized the superintendent, warden, or other designee to limit visitation at his/her discretion or upon a determination that visits would be a security risk.173 Six policies provided that prisoners be given “opportunities for visitation unless there are substantial reasons for withholding such privileges.”174
ASCA-Liman National Survey Segregation revised distribution August 31, 2015
43
In the 2014 survey, we sought to learn more about opportunities for social contact. Responding jurisdictions provided information on visits, social phone calls, social correspondence, legal visits and mail, communication among prisoners, and programming. In some jurisdictions, social contact depended on whether individuals were in certain levels of administrative segregation. In general, jurisdictions reported that opportunities for activities could be limited or increased through discretionary judgments on management and punishment at the institutional level.
1. Social Visits
All 45 responding jurisdictions permitted prisoners to receive social visits. Thirty-three jurisdictions reported reducing social visits as a sanction; 12 jurisdictions reported increasing social visits as an incentive. Twenty-five jurisdictions reported that all prisoners in administrative segregation were permitted a specified number of visits, including two responding that visits were unlimited; 18 jurisdictions provided a range in the number of visits per month—sometimes linked to advancement in a step system. In those 18 jurisdictions, the number of permitted visits ranged from none (in Montana and North Dakota) to 12 visits per month (in Connecticut). 175 Among those 18 jurisdictions, the most common lower end of the ranges provided was one visit per month (7 jurisdictions) and the most common upper end of the ranges provided was four visits per month (6 jurisdictions).176 West Virginia reported that as prisoners advanced through the step classification system, they received more visits, which became longer in duration and changed from non-contact to contact visits. Table 13 details the number of monthly permitted visits across all responding jurisdictions.
ASCA-Liman National Survey Segregation revised distribution August 31, 2015
44

Table 13 – Social Visits Possible per Length of Time in Administrative Segregation (n = 43)177
Visits Per Month Jurisdictions
1 per 90 days Mississippi
1 Colorado, Wyoming
2 Iowa, Louisiana, Ohio,178 South Carolina
4 Arizona, 179 Hawaii, Kansas, Michigan, Nevada, Oregon, Pennsylvania,
Rhode Island, Wisconsin
5 Bureau of Prisons
8 D.C., Massachusetts, Minnesota, Missouri, New Hampshire, Tennessee
Daily Alaska, Indiana
Depends on Prisoner
Classification
Alabama, Arkansas, Connecticut, Delaware, Florida, Georgia, Illinois,
Montana, Nebraska, New Jersey, North Dakota, New York, Oklahoma,
South Dakota, Texas, Virginia, Washington, West Virginia
In addition to limiting the number of visits prisoners could receive, 37 jurisdictions
placed limits on the people eligible to visit and whether contact was permitted. Many jurisdictions restricted visitors to those individuals named by the prisoner on an approved visitation list. Seven jurisdictions permitted visits from only family members; 3 jurisdictions did not permit visits by minors in some or all circumstances. Twenty-seven jurisdictions permitted only non-contact visits; 2 jurisdictions permitted only video visits. Eight jurisdictions reported using a mix of contact and non-contact visits, 4 used a mix of non-contact and video visits, and 3 jurisdictions used a mix of contact, non-contact, and video visits. The one jurisdiction (Alabama) that reported it provided only for contact visits limited those visits to 1 every 90 or 180 days, depending on the prisoner’s classification.
2. Social Phone Calls
Forty-three of the 44 responding jurisdictions permitted prisoners to place social phone calls, in addition to legal and religious phone calls. All responding jurisdictions reported monitoring the social phone calls made. Thirty-six jurisdictions reported limiting social phone calls as a sanction, and 12 jurisdictions reported increasing social phone calls as an incentive. We did not obtain systematic information on the ease of access to phones, the rates charged for making calls,180 or the length of the calls permitted.181
ASCA-Liman National Survey Segregation revised distribution August 31, 2015
45

As with social visits, some jurisdictions reported a range of permitted phone calls, and others a fixed number of permitted phone calls. In the 16 jurisdictions reporting a range, the most common lower end of the range was one call per month (in 5 jurisdictions), and the most common upper end of the range was 4 calls per month (in 3 jurisdictions); the number of calls ranged from none (in Montana, North Dakota, Oklahoma) to daily calls (in North Dakota and Oklahoma).182 Among jurisdictions reporting that all administrative segregation prisoners had the same number of calls permitted, 7 jurisdictions set that number at 4 per month. Table 14 provides more details.
Table 14 – Permitted Number of Possible Social Calls per Month (Fall 2014) (n = 42)183
Phone Calls per Month Jurisdictions
Only for “verified serious family emergencies”
Michigan
1 per 90 days Texas
1 Colorado, Missouri, Tennessee
2 Louisiana
4 Hawaii, Indiana, Iowa, Mississippi, Ohio, Pennsylvania, Rhode Island, South Carolina
8 Arizona, Massachusetts
12 Arkansas, Minnesota
20 D.C.
Daily Alaska, New Hampshire, Oregon, Wyoming
Not specifically limited184 South Dakota, Washington, West Virginia
Depends on Prisoner Classification Alabama, Bureau of Prisons, Connecticut, Delaware, Florida, Georgia, Illinois, Kansas, Montana, North Dakota, Nevada, New Jersey, New York, Oklahoma, Virginia, Wisconsin
3. Social Correspondence The 45 responding jurisdictions all reported permitting prisoners in administrative
segregation to send and receive social correspondence, 185 with some jurisdictions reporting restricting social correspondence as a sanction or imposing other limits. Seven jurisdictions reported restricting social correspondence as a sanction; none reported increasing access to social correspondence as an incentive. The most common limits on correspondence included
ASCA-Liman National Survey Segregation revised distribution August 31, 2015
46

prohibiting prisoners from corresponding with other prisoners and victims or imposing cubic foot restrictions on the amount of correspondence that prisoners could possess in their cells.
4. Legal Visits and Legal Mail
Prisoner interactions with attorneys occurred in different ways across the jurisdictions we surveyed. Factors included the processes for handling legal mail, how staff monitored legal visits, the methods of visiting (e.g., contact, non-contact, video), the timing of visits, the distances to travel to visit, and whether access was available by email or video.
Reflecting legal rights of access to courts, all responding jurisdictions permitted legal
visits (albeit with some constraints); none limited the number of legal visits a prisoner could receive. Thirty-one of the 45 responding jurisdictions reported monitoring legal visits visually, either by camera (without audio) or with an officer present. Twelve jurisdictions reported that legal visits were limited to an attorney of record or an attorney providing representation in current litigation. One jurisdiction reported permitting attorney visits only if the prisoner had a case pending against the Department of Corrections or a facility in the correctional system.186
In terms of the mode of visits and mail, 12 jurisdictions reported that all legal visits were
contact visits; 8 jurisdictions reported that all legal visits were non-contact. Fourteen jurisdictions reporting using a mix of contact and non-contact visits, and 11 jurisdictions used a mix of contact, non-contact, and video legal visits.187 Many jurisdictions reported handling legal mail through the same process in administrative segregation as they did in the general population of prisoners. The most frequent method described was for an officer, in the presence of the prisoner, to search mail for contraband.
5. Communications Among Prisoners
Jurisdictions reported that, in general, administrative segregation was not organized to enable prisoners to talk with each other. The opportunities for communication came informally, in or between cells, or through being permitted communal time at meals, exercise, and in activities.
Forty-five jurisdictions responded to questions about interpersonal contact among people
in administrative segregation; all reported that prisoners communicated with each other by talking between cells through vents, doors, and the like. Twenty-two jurisdictions stated that prisoners talked with each other during exercise/recreation periods, even if in separate exercise spaces (sometimes called “cages”). Nineteen jurisdictions reported that prisoners communicated with each other during group programming; 3 jurisdictions reported opportunities existed for communal meals. Five jurisdictions described restricting verbal exchanges between prisoners as a sanction, and none reported expressly offering more conversations (independent from opportunities such as in programming) as an incentive.
ASCA-Liman National Survey Segregation revised distribution August 31, 2015
47

6. Programming
“Programming” is a term used to describe the possibility of activities, sometimes through individual, cell-based lessons displayed on television screens and other times by prisoners joining others (“congregant programming”) and participating in a group activity, either while in restraints or unshackled. The potential for programming does not necessarily mean that prisoners are able to participate in that programming, and in this discussion, we obtained data from a small number of jurisdictions regarding actual rates of program use, which were generally low. Moreover, as in other activities, jurisdictions reported withdrawing options for programming as sanctions.
The survey asked jurisdictions to answer questions about 3 types of programming:
individual in-cell, individual out-of-cell, and group. Thirty-five jurisdictions offered individual in-cell programming, which meant the provision of written materials or televised broadcasts on a variety of topics, such as self-help, behavior modification, anger management, education/GED, reentry, gang awareness, religion, and mental health.188
Among 27 jurisdictions offering individual out-of-cell programming, the topics were
similar to those addressed in-cell, except that more out-of-cell programming focused on mental health. Group programming addressed similar topics, again with an emphasis on behavioral change. Such programs were for a limited number of hours—typically 1 to 3 hours per week. In Alabama, group programming was provided for 2 hours per week in the first of its “steps,” and increased to 4 hours per week in step 2; to 18 hours per week in step 3; to 28 hours per week in step 4, and to 35 hours per week in step 5. During the first 2 steps, prisoners were restrained by handcuffs and, in subsequent steps, unrestrained.
Forty-one jurisdictions provided information on the use of programming as an incentive,
and 5 (albeit not the same 5 in each instance) used individual in-cell programming as an incentive; 5 used individual out-of-cell programming as an incentive, and 5 used group programming as an incentive. Forty-two jurisdictions reported restricting programming as a sanction. Ten restricted individual in-cell programming as a sanction; 14 sanctioned individual out-of-cell programming, and 15 restricted group programming.
In addition, policies about programming may not mirror the practice; the challenges of
programming in administrative segregation can be seen from the information provided by 13 jurisdictions which gathered data on participation rates for at least 1 programming category. Eleven of those jurisdictions provided participation rates for in-cell programming during the week of September 15, 2014.189 As Table 15 details, 1 jurisdiction reported that all prisoners participated, while in 4 jurisdictions, participation rates for individual in-cell programming were under 10 percent. Five jurisdictions reported tracking participation rates for individual out-of-cell
ASCA-Liman National Survey Segregation revised distribution August 31, 2015
48
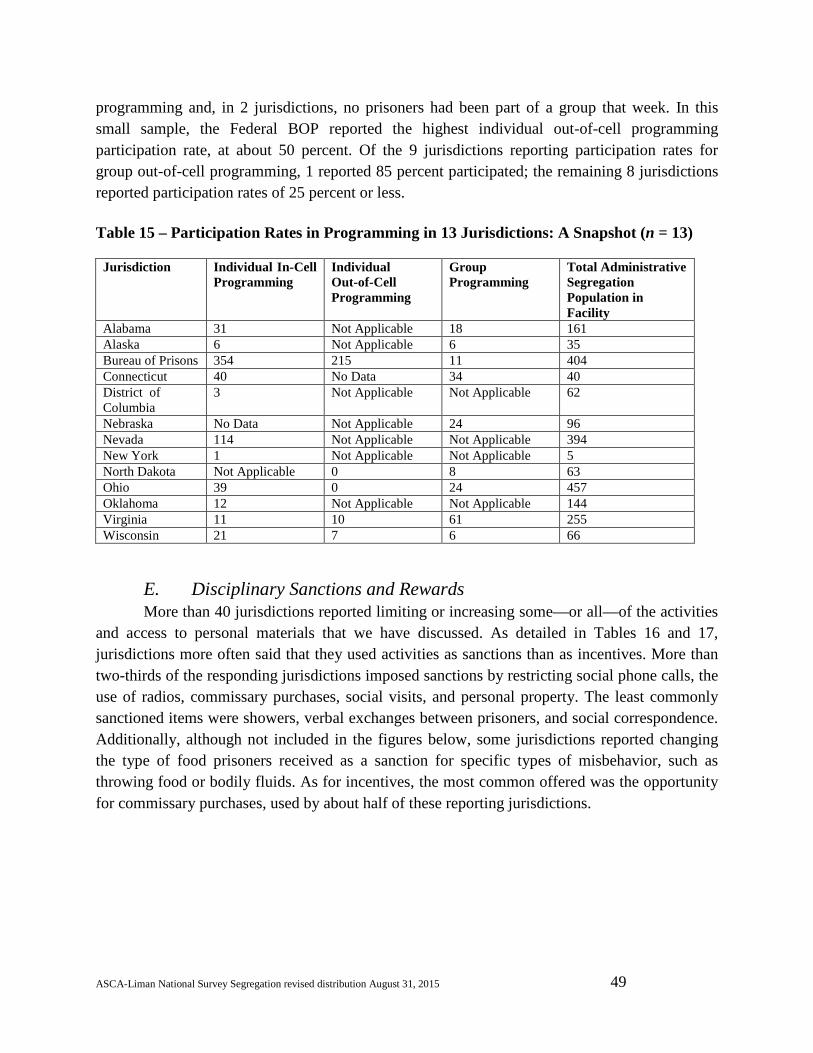
programming and, in 2 jurisdictions, no prisoners had been part of a group that week. In this small sample, the Federal BOP reported the highest individual out-of-cell programming participation rate, at about 50 percent. Of the 9 jurisdictions reporting participation rates for group out-of-cell programming, 1 reported 85 percent participated; the remaining 8 jurisdictions reported participation rates of 25 percent or less.
Table 15 – Participation Rates in Programming in 13 Jurisdictions: A Snapshot (n = 13)
Jurisdiction Individual In-Cell
Programming Individual Out-of-Cell Programming
Group Programming
Total Administrative Segregation Population in Facility
Alabama 31 Not Applicable 18 161 Alaska 6 Not Applicable 6 35 Bureau of Prisons 354 215 11 404 Connecticut 40 No Data 34 40 District of Columbia
3 Not Applicable Not Applicable 62
Nebraska No Data Not Applicable 24 96 Nevada 114 Not Applicable Not Applicable 394 New York 1 Not Applicable Not Applicable 5 North Dakota Not Applicable 0 8 63 Ohio 39 0 24 457 Oklahoma 12 Not Applicable Not Applicable 144 Virginia 11 10 61 255 Wisconsin 21 7 6 66
E. Disciplinary Sanctions and Rewards More than 40 jurisdictions reported limiting or increasing some—or all—of the activities
and access to personal materials that we have discussed. As detailed in Tables 16 and 17, jurisdictions more often said that they used activities as sanctions than as incentives. More than two-thirds of the responding jurisdictions imposed sanctions by restricting social phone calls, the use of radios, commissary purchases, social visits, and personal property. The least commonly sanctioned items were showers, verbal exchanges between prisoners, and social correspondence. Additionally, although not included in the figures below, some jurisdictions reported changing the type of food prisoners received as a sanction for specific types of misbehavior, such as throwing food or bodily fluids. As for incentives, the most common offered was the opportunity for commissary purchases, used by about half of these reporting jurisdictions.
ASCA-Liman National Survey Segregation revised distribution August 31, 2015
49
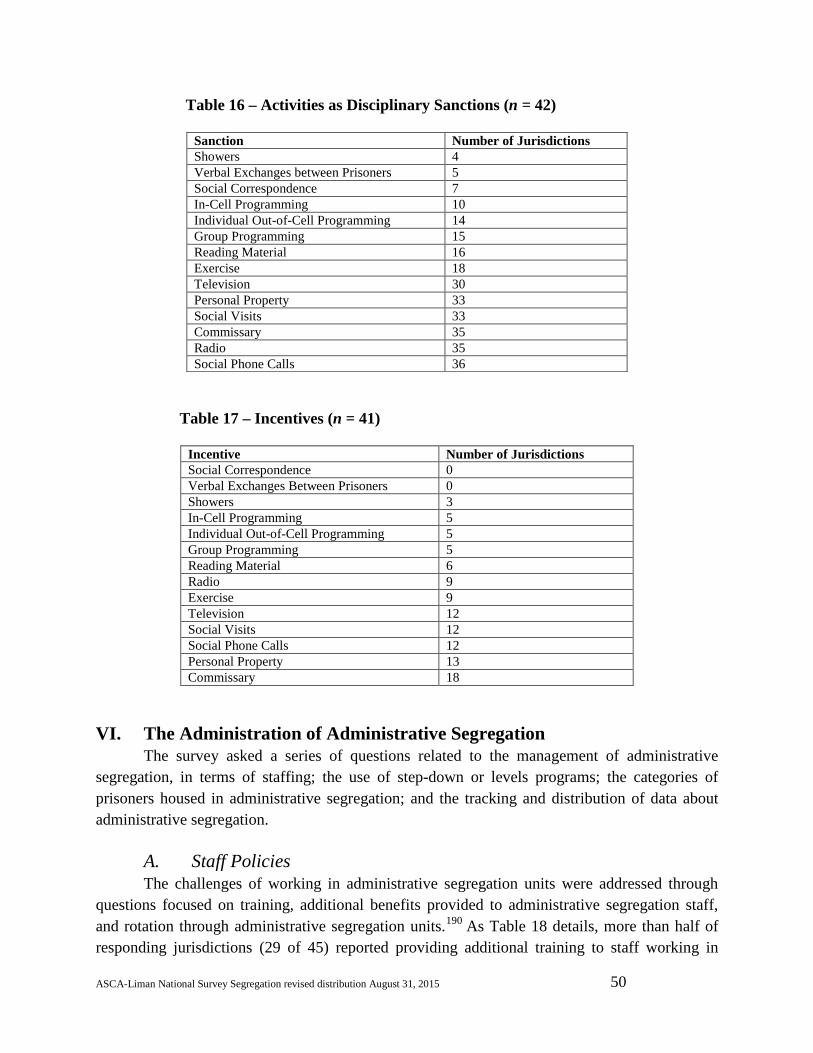
Table 16 – Activities as Disciplinary Sanctions (n = 42)
Sanction Number of Jurisdictions Showers 4 Verbal Exchanges between Prisoners 5 Social Correspondence 7 In-Cell Programming 10 Individual Out-of-Cell Programming 14 Group Programming 15 Reading Material 16 Exercise 18 Television 30 Personal Property 33 Social Visits 33 Commissary 35 Radio 35 Social Phone Calls 36
Table 17 – Incentives (n = 41)
Incentive Number of Jurisdictions Social Correspondence 0 Verbal Exchanges Between Prisoners 0 Showers 3 In-Cell Programming 5 Individual Out-of-Cell Programming 5 Group Programming 5 Reading Material 6 Radio 9 Exercise 9 Television 12 Social Visits 12 Social Phone Calls 12 Personal Property 13 Commissary 18
VI. The Administration of Administrative Segregation The survey asked a series of questions related to the management of administrative
segregation, in terms of staffing; the use of step-down or levels programs; the categories of prisoners housed in administrative segregation; and the tracking and distribution of data about administrative segregation.
A. Staff Policies The challenges of working in administrative segregation units were addressed through
questions focused on training, additional benefits provided to administrative segregation staff, and rotation through administrative segregation units.190 As Table 18 details, more than half of responding jurisdictions (29 of 45) reported providing additional training to staff working in
ASCA-Liman National Survey Segregation revised distribution August 31, 2015
50

administrative segregation. The most commonly reported topic areas for training were mental health (8), behavior management (5), crisis intervention (5), restraints, (5), cell extraction/cell entry (4), and suicide prevention (3).
Five of 45 jurisdictions reported providing extra benefits for staff working in
administrative segregation. These benefits typically included higher pay; one jurisdiction also reported providing staff in administrative segregation with more desirable schedules. About two-thirds of jurisdictions (27 of 42) reported having a rotation policy enabling staff to move in and out of the administrative segregation unit. These policies varied from rotation or review every 90 days to rotation every 5 years. Some jurisdictions did not report a specific timeframe for rotation and instead indicated that staff members were evaluated periodically for “burnout” or that staff could request transfer to other units.
Table 18 – Administrative Segregation: Staff Policies
Do staff who work in administrative segregation receive any additional training? (n = 45) 29 Yes 16 No
Are staff given any extra benefits if they work in administrative segregation? (n = 45)
5 Yes 40 No
Does your system have a staff rotation and/or post-rotation policy that causes staff to move in and out of the administrative segregation unit? (n = 42)
27 Yes 15 No
B. “Step-Down” and “Levels” Programs Most responding jurisdictions (33 of 45) reported using some kind of “step-down” or
“levels” program, whereby individuals confined in administrative segregation can gradually earn privileges, often with the goal of returning to the general population. Participating prisoners go through phases, and the number reported ranged from two to five. Every jurisdiction providing a description indicated that progress through the phases depended at least partly on prisoner behavior, while some jurisdictions also reported minimum periods of time that prisoners must spend in each phase before progressing to the next. In terms of the frequency of review for progress to the next phase, jurisdictions ranged from daily reviews, recorded on a form, to reviews by committees meeting “at a minimum every 180 days.”191
Given the variety, one illustration, from South Dakota, provides a sense of its step-down
program and some of its recent revisions: If placed on administrative restrictive housing status, offenders are now required to participate in a newly designed level system. This level system is intended to
ASCA-Liman National Survey Segregation revised distribution August 31, 2015
51

provide opportunities for inmates to demonstrate their readiness for return to general population through positive/pro-social behavior, participation in programming, and progressively earned privileges and property. An orientation manual was developed and is provided to each offender newly entering the level system, which ensures the offenders receive the details of the level system, unit procedures, and behavioral expectations. . . . Changes were made to the review process to add reviews for each inmate, every 30 days throughout their duration in the program. These reviews will take place out-of-cell and the offender will be provided with specific feedback regarding his progress in the level system. Additionally they will receive goals and/or recommendations for issues to address in order to progress. Offenders will also receive reviews by a Level Review Committee to be considered for progression to the next level or release to general populations. A Restrictive Housing Manager position was created to oversee the new program and to assist staff in the implementation and operation of the new level system.
C. Death-Sentenced Prisoners Many jurisdictions have prisoners who have been sentenced to death and are housed
separately (sometimes in an area called “death row”) from the general population. In some jurisdictions, these prisoners are part of the administrative segregation population.
Thirty of 43 jurisdictions responded that they housed a population of prisoners who had
been sentenced to death. As detailed in Table 19, among these jurisdictions, 18 reported separation other than administrative segregation, 192 and 10 said they used administrative segregation. Eight reported an “other” form of housing, and 1 jurisdiction stated that death-sentenced prisoners were in general population. Of the 10 jurisdictions that housed death-sentenced prisoners in administrative segregation, 8 reported housing them separately from non-death row prisoners. Of the jurisdictions with prisoners with death sentences, 11 of 28 reported that a statute or regulation in that jurisdiction required the segregation of death row prisoners.
The survey also asked whether categories other than death-sentenced prisoners were,
because of their sentence, housed in something akin to administrative segregation. Nine of 35 jurisdictions responded that they did have categories of such prisoners. Four of those 9 jurisdictions reported that some or all prisoners sentenced to life without the possibility of parole must serve the first portion of their sentence in administrative segregation, maximum custody, or close custody. Seven of the 9 indicated that they housed these categories of prisoners separately from the larger administrative segregation population. Other categories of prisoners confined to administrative segregation included those in protective custody, as well as those described as
ASCA-Liman National Survey Segregation revised distribution August 31, 2015
52

“high-profile offenders,” “security threat groups,” and those who are “convicted as adults but are under 18 years of age.”
Table 19 – Death-Sentenced Prisoners
How are inmates sentenced to death housed? (n = 29)
18 Another form of separation 10 Administrative segregation 9 Other 1 In the general population
If death row inmates are housed in administrative segregation, are they housed separately from other inmates in administrative segregation, or are they housed together? (n = 10) 193
8 Separately 2 Together
Are there any other categories of inmates who, because of their sentence, are housed in something akin to administrative segregation? (n = 35)
26 No 9 Yes
D. Tracking Data Prison systems do a good deal of data gathering, and we sought to understand what
information on administrative segregation was routinely collected, which issues were tracked, how information was stored and distributed, and what information was made publicly available. The form in which data were stored (for example, electronically or paper files) affects the ease with which data can be analyzed and shared.
Detailed information about the number of jurisdictions that track each type of information
is provided in Table 20, below. 194 A few explanations of the categories used are in order. Information that is “tracked electronically” is either gathered in the Offender Information System or in an electronic log (e.g., an Excel spreadsheet). Information stored in paper records included both data stored in physical files and data that are scanned and stored electronically. Information reported to the director included both incident reports and reports that provide an aggregate count of the information at issue.
Forty jurisdictions provided information about data tracking. Overall, we found that 39 of
these 40 jurisdictions tracked data about formal disciplinary violations, prisoner assaults of other prisoners and staff, and the mental health status of prisoners. Most jurisdictions reported tracking electronically, with 37 jurisdictions tracking formal disciplinary violations electronically, 35 tracking assaults electronically, and 32 tracking mental health status electronically. Prisoner assaults of other prisoners and staff were the categories of data most likely to be released in public reports.
ASCA-Liman National Survey Segregation revised distribution August 31, 2015
53

The categories of data most commonly reported to directors (either in aggregate form or in individual incident reports) were inmate-on-staff assaults (23 of 40), suicide attempts (22 of 40), staff uses of force (22 of 40), and inmate-on-inmate assaults (20 of 40). Finally, the categories of data less often tracked were recidivism rates for individuals previously housed in administrative segregation (with 21 of 32 jurisdictions reporting not tracking this information) and rates of return to administrative segregation within the same term of incarceration (19 of 32).
Table 20 – Data Tracking Categories are arranged in order of most commonly tracked to least commonly tracked, then by most commonly tracked electronically, and then by most commonly reported to director.
Tracked electron-ically
Paper records
Reported to director
Released in public reports
Not tracked
Formal disciplinary violations (n = 40) 37 24 13 6 1 Inmate-on-staff assaults (n = 40) 35 20 23 7 1 Inmate-on-inmate assaults (n = 40) 35 20 20 8 1 Mental health status (n = 40) 32 21 8 3 1 Suicide attempts (n = 40) 31 23 22 5 2 Reason for admission (n = 40) 31 23 14 4 2 Interventions by staff requiring the use of force and/or chemical agents (n = 40)
30 22 22 6 3
Incidents of self-harm (not suicide attempts) requiring medical attention (n = 37)
30 21 18 2 1
Incidents of inmates being placed in further restrictive setting within the facility (n = 36)
28 19 17 1 2
Type of release from administrative segregation (n = 36) 28 16 7 4 4 Hours of training or other professional development for staff (n = 35)
28 14 5 2 1
Grievances filed by individuals housed in administrative segregation (n = 35)
27 19 8 3 3
Grievances (or similar complaints) filed by staff (n = 36) 27 17 8 1 3 Workers’ compensation or other claims filed by staff (n = 33)
25 12 5 2 4
Sick days taken by staff (n = 34) 24 6 4 0 5 Informal disciplinary violations (n = 36) 19 14 6 2 9 Return rates (i.e., back to administrative segregation) within the same term of incarceration for individuals previously housed in administrative segregation (n = 33)
10 5 3 2 19
Recidivism rates for individuals previously housed in administrative segregation (n = 33)
9 4 3 2 21
VII. Reconsidering Administrative Segregation
Questions about the use and the scope of administrative segregation have prompted many jurisdictions as well as other branches of government and private sector actors to call for reconsideration and for change. As noted, in 2012, ASCA convened a special sub-committee to address the question of best practices and, after drafts of this survey were circulated, ASCA
ASCA-Liman National Survey Segregation revised distribution August 31, 2015
54

members requested that it include inquiries about recent revisions made to administrative segregation policies, how such changes were made, as well as the incentives for and the barriers to change.
As discussed below, we learned that most jurisdictions had conducted reviews in the past
3 years, and many had made changes to their administrative segregation policies during that time period. While jurisdictions reported using a variety of different processes for their reviews, most jurisdictions consulted with stakeholders both within and outside the Corrections Department. Common factors reported as motivating change in administrative segregation policies were concerns about the safety and well-being of prisoners and staff, while common barriers to change included the limits of facilities and of budgets.
A. Internal Policy Reviews Forty of 43 responding jurisdictions reported that they had reviewed their administrative
segregation policies and practices during the past 3 years. The three jurisdictions that had not reviewed their policies reported no plans to do so.195 We asked jurisdictions that had conducted a policy review to explain their goals for the review, the processes of review, and changes made.
Thirty-four jurisdictions explained their goals for a review, and the most commonly
mentioned goals centered around reducing isolation and ensuring that prisoners were housed using the least restrictive means of confinement. Specifically, 8 jurisdictions reported aiming to reduce the number in segregation or transitioning more prisoners back into the general population; 6 discussed seeking to decrease isolation and improve conditions of confinement for those in segregation, and 3 specified reducing the amount of time that prisoners spend in administrative segregation. Another set of goals focused on ensuring the safety of prisoners and staff. Eight jurisdictions mentioned maintaining safety as one of their goals in a review of administrative segregation policy. Six jurisdictions also discussed improving prisoners’ mental health, and 5 discussed identifying best practices or bringing their policies in line with national trends. Appendix B contains a compilation of the goals provided to us for the reviews of administrative segregation policy.
In conducting these policy reviews, the processes that jurisdictions most often reported
using were convening a task force with Department staff (30) or leadership (29), consulting with outside experts (16), and inviting comments from third parties (12), as detailed in Table 21 below. Jurisdictions reported consulting with a wide variety of experts: 6 cited the National Institute of Corrections, 4 referenced consultants or contractors, 5 jurisdictions turned to ASCA and/or other state departments of corrections, 2 jurisdictions asked the American Civil Liberties Union, and 2 asked their vendors. Eight jurisdictions also consulted with other parts of their own state governments outside their specific department. Nine jurisdictions reported taking actions other than those listed in the survey—such as conducting audits, attending a symposium on
ASCA-Liman National Survey Segregation revised distribution August 31, 2015
55

Restrictive Housing, visiting other states, and developing new staff management positions in administrative segregation units.
We also asked jurisdictions whether they had made any changes to their administrative
segregation policies during the last 3 years. Twenty-six of 41 jurisdictions reported that they had, and changes focused primarily on reducing the levels of isolation experienced by prisoners in segregation by placing prisoners in less restrictive environments. The most commonly reported changes (by 11 jurisdictions) were the introduction of step-down programs or procedures for reintegration into the general population. Seven jurisdictions reported altering how they addressed mental health issues; 6 reported changing procedures for reviewing inmates’ placement in segregation (typically to increase the frequency of reviews), and 6 reported providing additional programming opportunities. Three jurisdictions also reported increasing the availability of visits for prisoners in segregation. For example, Connecticut reported that it would be changing its policies “to allow inmates to have visits from non-immediate family members assuming that the visitors are positive people in their lives.” Rhode Island reported that segregation units would begin to “offer visits at night to assist families who work.”
Table 21 – Reviews of Administrative Segregation Policies within the Last 3 Years
During the last 3 years, has your system reviewed its administrative segregation policies and practices? (n = 43)
40 Yes 3 No
If your system has planned or conducted a review, what process(es) are you using? (n = 40)
30 Convene a task force with Department staff 29 Convene a task force with Department leadership 16 Consult with outside experts 12 Invite comments from third parties, such as reentry, religious, law schools,
and other groups 9 Take any other actions not listed to review your administrative segregation
practices 8 Consult with those within State government but outside Department
Has your system made any changes to administrative segregation during the last 3 years? (n = 41)
26 Yes 15 No
B. Perceptions of Administrative Segregation We inquired into attitudes toward administrative segregation, in terms of its perceived
benefits and the need for change. Overall, jurisdictions reported that administrative segregation was effective in ensuring the safety of staff and inmates in the general population. Common views on proposed change focused on ways to reduce reliance on segregation.
ASCA-Liman National Survey Segregation revised distribution August 31, 2015
56

Thirty-four jurisdictions described the aspects of administrative segregation understood
to be useful. Eleven jurisdictions stated that administrative segregation was an effective way to separate high-risk prisoners from the general population, both to protect the safety of prisoners and staff and to ensure that prisoners in the general population could make safe and effective use of programming and therapeutic opportunities. Seven jurisdictions described step-down programs as effective, while 5 called frequent and effective reviews of inmate placement useful.196 Four jurisdictions discussed the management of mental health issues in administrative segregation, and 2 noted the effectiveness of the form of administrative segregation that they provided.
Twenty-two jurisdictions also responded to whether aspects of administrative segregation
needed to be changed. Five jurisdictions reported that nothing needed to be changed. Other jurisdictions reported a wide variety of changes, including 4 referencing the length of stay in segregation; 4 pointing to the processes of entry into and exit from administrative segregation; 2 reporting the need to improve tracking and monitoring; 2 referencing problems of management of prisoners with mental illness; and 2 raising concerns about the potential overuse of administrative segregation.
C. The Role of Mental Health The survey also asked respondents to provide their opinion as to what role mental health
issues play in prisoners’ placement in administrative segregation. The 27 jurisdictions answering this question reported a wide range of beliefs. Some respondents described the role of mental health as “minimal,” and others described it as “significant” or “100%.” Several respondents also indicated that mental health problems often play a role in causing the behaviors resulting in the placement of prisoners in administrative segregation.
Some jurisdictions also discussed whether mentally ill inmates should be placed in
administrative segregation at all. Several jurisdictions reported that prisoners with mental health issues are diverted out of administrative segregation to the greatest extent possible, and other jurisdictions reported evaluating mentally ill inmates to determine whether placement in administrative segregation was contraindicated. In contrast, 1 jurisdiction indicated that “[o]ften, Ad Seg is the only choice for dangerous mentally ill inmates.” In addition, 1 jurisdiction reported that “we found that clustering the mental health inmates in the same housing area has improved their group engagement and increased their access to mental health staff.”
D. The Incentives for and the Barriers to Change After receiving our initial round of responses to the survey, we circled back at the behest
of ASCA members to ask the directors of jurisdictions’ prison systems about the incentives to make changes to administrative segregation policies and the barriers to doing so.197 We received
ASCA-Liman National Survey Segregation revised distribution August 31, 2015
57

33 responses. The primary incentives reported were inmate and staff safety and well-being; the most commonly reported barriers to change were facility and budgetary constraints.
We asked jurisdictions, when considering the incentives, to “check all that apply”; thus,
while we received 33 responses, the totals reported in Table 22 below sum to more than 33. At the top of the list were concerns about inmate and staff well-being (with 26 and 22 jurisdictions reporting these concerns, respectively) and inmate and staff safety (24 and 25, respectively). Other common incentives for change included stakeholder concerns (19), pending or potential litigation (18), and space/facility constraints (17). Four states (Missouri, Ohio, Pennsylvania, and Utah) also reported that making changes to administrative segregation is the “right thing to do.”198
Table 22 – Incentives For Making Changes to Administrative Segregation Policies (n = 33)
26 Concerns about inmate well-being 25 Staff safety concerns 24 Inmate safety concerns 22 Concerns about staff well-being
19 Stakeholder concerns
3 Media 7 Lawmakers
15 Advocacy groups
18 Pending or potential litigation 17 Space/facility constraints 16 Possible cost savings 6 Potential legislation 6 Other
1 “Re-entry and societal concerns” 1 “It is the right thing to do if our purpose is to return individuals that
are better suited to be parents, spouses, neighbors and employees than when they entered our system”
2 “Right thing to do” 1 “Public Safety – we were releasing [too] many high risk offenders
directly to the street. We also received a Technical Assistance Grant through the Crime and Justice Institute which was essential to this project.”
1 “Reduce demand on staff/mitigate staff vacancies” 1 “It is absolutely the right [thing] to do.”
5 Pressure from staff
2 Pressure from management or middle-management staff 2 Other 1 Pressure from front line operations staff 1 Pressure from employee unions
3 Statutory mandates 2 None
ASCA-Liman National Survey Segregation revised distribution August 31, 2015
58
To ask about barriers that jurisdictions face in making changes to administrative segregation policies, we used many of the same items in the checklist for the incentives question. For example, while the incentives question asked about “possible cost savings,” the barriers question asked about “budget constraints.” Overall, 18 jurisdictions reported space/facility constraints as barriers to change, 14 referenced budget constraints; 13 raised staff and/or inmate safety concerns, and 11 cited possible resistance from staff.
VIII. Revisiting the Use of Administrative Segregation: Lessening the Numbers in and the Degrees of Isolation It is appropriate to conclude where we began, which is to remind readers of the goals of
this joint Liman-ASCA undertaking. The concern about the harms imposed by placing prisoners in isolated settings prompted this project. The 2013 Liman Administrative Segregation Policies Report and this, the first national survey of prison officials on the structure of administrative segregation, provide cross-jurisdictional comparisons and a baseline against which to measure change.
Much more work is needed. The responses reported raise many questions—most vividly
about the total number of people in all forms of restricted housing and whether the portrait of administrative segregation provided here mirrors the ways in which prisoners are held under other rubrics of restricted confinement. Thus, despite its length, this Report is only one aspect of ongoing cooperative undertakings, across the public and private sectors, to reduce and to eliminate the isolation of prisoners, so as to enable prisoners and staff to live and work in safe environments, respectful of human dignity.
ASCA-Liman National Survey Segregation revised distribution August 31, 2015
59

Endnotes
1 For additional information, contact [email protected]; [email protected]; or Sarah [email protected]. All rights reserved. The primary authors of this report are Sarah Baumgartel, Corey Guilmette, Johanna Kalb, Diana Li, Josh Nuni, Devon Porter, and Judith Resnik, who are faculty and students in the Yale Law School Liman Program; these authors worked in conjunction with Camille and George Camp, Co-Executive Directors of the Association of State Correctional Administrators (ASCA). That association was “founded on the belief that each represented correctional jurisdiction is unique with regard to obligatory statutes, policies, structure, incarcerated population, resources, and burning issues, but that similarities of purpose, responsibilities, principles, and challenges among its member jurisdictions unite them in a quest for public safety, secure and orderly facilities, and professionalism that can be achieved through sharing ideas and vigorously entering into collaborative efforts to persistently improve the corrections profession.” See Principles of Collaboration Between Paroling Authorities and Correctional Agencies: Collaboration Principle #1, ASCA 1, available at http://www.asca.net/system/ assets/attachments/6200/G.%20 Proposed%20Mission%20Statements.pdf.
Thanks are due to many colleagues who helped us think through the parameters and the issues. At ASCA, several people assisted in shaping and disseminating the survey; they include Camille Camp, ASCA Co-Executive Director; Dr. Patricia Hardyman, ASCA Associate Director; Wayne Choinski, ASCA Senior Associate; Jill Brooks, Senior Associate; Brittany Brothers, Project Manager; and Joe Fenton, who had been an ASCA Senior Associate. Members of the ASCA Administrative Segregation Sub-Committee have repeatedly reviewed materials; thanks specifically to that subcommittee’s chair, Gary Mohr, Director of the Ohio Department of Rehabilitation and Correction; to Rick Raemisch, Executive Director of the Colorado Department of Corrections; to A.T. Wall, Director of the Rhode Island Department of Corrections; and to Bernie Warner, Secretary of the Washington State Department of Corrections. More generally, thanks are due to all the correctional directors and their staffs who contributed responses to survey requests and gave generously of their time to enable this cross-jurisdictional comparison.
At Yale Law School, we have been especially grateful for the guidance of Tom Tyler, Macklin Fleming Professor of Law and Professor of Psychology; of Hope Metcalf, who had been the Executive Director of the Liman Program and is now the Executive Director of the Orville H. Schell, Jr. Center for International Human Rights; and of Dennis Curtis, Clinical Professor Emeritus of Law; for the input of current and former Liman Senior Fellows in Residence—Fiona Doherty, Megan Quattlebaum, Sia Sanneh; to former Liman Fellow David Menschel, and to current Liman Project students Lucas Croslow and Shelle Shimizu, who helped to bring this report to fruition. Thanks are due to Kathi Lawton for providing ongoing support to the Liman Program, and to Bonnie Posick who edited and reviewed, as well as helped us to compile and exchange materials. This project has been generously supported by the Yale Law School, the Liman Program, the Oscar M. Ruebhausen Fund at Yale Law School, and Vital Projects Fund. 2 See Davis v. Ayala, 135 S. Ct. 2187, 2208 (2015) (Kennedy, J., concurring). 3 Id. 4 Id. 5 Id. at 2209-10. Justice Kennedy noted that the Supreme Court had concluded in other cases that the Eighth Amendment prohibition on cruel and unusual punishment applied to conditions in prisons. Further, in 1995, the Court had held that transferring prisoners to certain placements could impose “atypical and significant hardship on the inmate in relation to the ordinary incidents of prison life.” Sandin v. Conner,
ASCA-Liman National Survey Segregation revised distribution August 31, 2015
60

515 U.S. 472, 484 (1995). Therefore, because prisoners have a liberty interest in avoiding those conditions, prison systems must accord them procedural protections to ensure the legitimacy of the decision to put a person into such “atypical” conditions. See Wilkinson v. Austin, 545 U.S. 209, 223 (2005). When that liberty interest arises and what process is due are the subject of many lower court decisions. A recent example comes from a case in which a prisoner has “remained in solitary confinement for 20 years, despite not having committed a single disciplinary infraction during that time.” See Incumaa v. Stirling, No. 14-6411, 2015 WL 3973822, at *1 (4th Cir. Jul. 1, 2015). 6 See, e.g., Wilkinson v. Austin, 545 U.S. 209 (2005) (also authored by Justice Kennedy). There, the Supreme Court there held that placement by Ohio in its “supermax” facility involved conditions sufficiently atypical to trigger the constitutional obligation to provide a modicum of due process protections when making placement decisions. Lower courts have applied Wilkinson, and debated its scope. See, e.g., Wilkerson v. Goodwin, 774 F.3d 845 (5th Cir. 2014); Williams v. Hobbs, 662 F. 3d 994 (8th Cir. 2011), and the discussion of Prieto v. Clarke, infra note 28. 7 Glossip v. Gross, 135 S. Ct. 2726, 2765 (2015) (Breyer, J., dissenting) (quoting Craig Haney, Mental Health Issues in Long–Term Solitary and “Supermax” Confinement, 49 Crime & Delinquency 124, 130 (2003)). 8 See, e.g., NEW YORK CIVIL LIBERTIES UNION, BOXED IN: THE TRUE COST OF EXTREME ISOLATION IN NEW YORK’S PRISONS, (2012), available at http://www.nyclu.org/files/publications/nyclu_ boxedin_final.pdf 9 See, e.g., Atul Gawande, Hellhole, NEW YORKER, March 30, 2009, available at http://www.newyorker.com/magazine/2009/03/30/hellhole. 10 See, e.g, Burke Butler, Matthew Simpson & Rebecca L. Robertson, A SOLITARY FAILURE: THE WASTE, COST AND HARM OF SOLITARY CONFINEMENT, ACLU OF TEXAS (2015), available at http://www.aclutx.org/2015/02/05/a-solitary-failure/; BOXED IN: THE TRUE COST OF EXTREME ISOLATION IN NEW YORK’S PRISONS, supra note 8. 11 See Expert Reports in Ashker v. Brown, CENTER FOR CONSTITUTIONAL RIGHTS (Aug. 3, 2015), available at https://ccrjustic.org/expert-reports-ashker-v-brown. Asher v. Brown was a class action on behalf of prisoners in the Security Housing Unit at California’s Pelican Bay State Prison. 12 The supermax in Ohio was the example discussed in Wilkinson v. Austin, 545 U.S. 209, 213-14 (2005). 13 Justice Kennedy provided the figure of 25,000 in his concurrence in Davis v. Ayala, 135 S. Ct. at 2208, citing AMNESTY INTERNATIONAL, Entombed: Isolation in the U.S. Federal Prison System (2014), available at http://www.amnestyusa.org/sites/default/files/amr510402014en.pdf. That report stated that “[m]ore than 40 US states are believed to operate ‘super-maximum security’ units or prisons, collectively housing at least 25,000 prisoners.” Id. at 2 (citing Daniel P. Mears, A Critical Look at Supermax Prisons, Corrections Compendium, 2005); see note 15 infra. 14 Relying on statistics compiled by the Bureau of Justice Statistics (BJS), researchers concluded that as of 2005, 81,622 individuals were in forms of “restrictive housing.” Angela Browne, Alissa Cambier & Suzanne Agha, Prisons Within Prisons: The Use of Segregation in the United States, 24 FEDERAL SENTENCING REPORTER 46, 46 (October 2011) (citing James J. Stephan, Census of State and Federal Adult Correctional Facilities, 2005, BUREAU OF JUSTICE STATISTICS, U.S. DEPARTMENT OF JUSTICE,
ASCA-Liman National Survey Segregation revised distribution August 31, 2015
61

(October 2008), available at http://www.bjs.gov/content/pub/pdf/csfcf05.pdf) [hereinafter BJS 2005 CENSUS ADULT CORRECTIONAL FACILITIES].
The 80,000 number is also cited in John J. Gibbons & Nicholas de B. Katzenbach, Confronting Confinement: A Report of the Commission on Safety and Abuse in America’s Prisons, VERA INSTITUTE OF JUSTICE 52 (June 2006), available at http://www.vera.org/sites/default/files/resources/downloads/ Confronting_Confinement.pdf. The difficulties of making estimates are detailed in Alison Shames, Jessa Wilcox & Ram Subramanian, Solitary Confinement: Common Misconceptions and Emerging Safe Alternatives, VERA INSTITUTE OF JUSTICE (May 2015) [hereinafter VERA INSTITUTE, SOLITARY CONFINEMENT], available at http://www.vera.org/sites/default/files/resources/downloads/ solitary-confinement-misconceptions-safe-alternatives-report.pdf. As that report also noted, individuals in jails are often not included in such counts. 15 See DANIEL P. MEARS, EVALUATING THE EFFECTIVENESS OF SUPERMAX PRISONS 4, 74, app. tbl. 1 (March 2006), available at http://www.urban.org/research/publication/evaluating-effectiveness-supermax-prisons. The chart, which he borrowed from Roy D. King, identified states, as of 1997-1998, with supermax facilities, detailed the bed space in about 40 facilities, which had about 20,000 beds. The chart itself is reproduced in Judith Resnik, Detention, the War on Terror, and the Federal Courts, 110 COLUMBIA LAW REVIEW 579, 643 (2010). AMNESTY INTERNATIONAL, Entombed: Isolation in the U.S. Federal Prison System (2014), available at http://www.amnestyusa.org/sites/default/ files/amr510402014en.pdf. As noted, that report was also the basis for Justice Kennedy’s citation of the AMNESTY INTERNATIONAL Report, supra note 13. 16 BJS 2005 CENSUS ADULT CORRECTIONAL FACILITIES, supra note 14. As explained to us by the BJS, that census asked “several questions about restricted housing,” including “23. Does this facility have a restricted population unit? If Yes - On December 30, 2005, how many inmates were housed for -a. Protective custody? . . . b. Disciplinary action? . . . c. Administrative segregation? . . .” and seeking a total sum. The published report, available in 2008, did not include the 80,000 figure. Rather, one finds that material by looking at the underlying data, publicly available through the University of Michigan’s National Archive of Criminal Justice Data, Census of State and Federal Adult Correctional Facilities, 2005 (ICPSR 24642), available at https://www.icpsr.umich.edu/icpsrweb/ICPSR/studies/24642. The data were collected at the facility level. In addition to not receiving responses from all (perhaps because they did not have restricted housing), the BJS Study did not include jails, immigration facilities, and juveniles. BJS 2005 PRISON CENSUS at 1. 17 Id. See also VERA INSTITUTE, SOLITARY CONFINEMENT, supra note 14, at 6, n.2. 18 See Performance Measures System Overview, ASSOCIATION OF STATE CORRECTIONAL ADMINISTRATORS, available at http://www.asca.net/projects/1 (gathering data, sometimes monthly). 19 See E. ANN CARSON, PRISONERS IN 2013, BUREAU OF JUSTICE STATISTICS 5 tbl.2 (Sep. 30, 2014), available at http://www.bjs.gov/content/pub/pdf/p13.pdf (including prisoners under the authority of the 50 states, the District of Columbia, and the Federal Bureau of Prisons) [hereinafter BJS 2013 PRISONERS CENSUS]. 20 Peter Wagner & Leah Sakala, Mass Incarceration: The Whole Pie, PRISON POLICY INITIATIVE (Mar. 12, 2014) (describing the more than 1.5 million individuals incarcerated in prisons and over an additional 700,000 people in jails), available at http://www.prisonpolicy.org/reports/pie.html.
ASCA-Liman National Survey Segregation revised distribution August 31, 2015
62

21 BJS 2013 ADULT PRISON CENSUS, supra note 19, at 3, Table 2. 22 See e.g., Jamie Fellner, A Corrections Quandary: Mental Illness and Prison Rules, 41 HARV. C.R.–C.L. L. REV. 391 (2006); Graham D. Glancy & Erin L. Murray, The Psychiatric Aspects of Solitary Confinement, 1 VICTIMS & OFFENDERS 361 (2006); Craig Haney, Mental Health Issues in Long-Term Solitary and “Supermax” Confinement, 49 CRIME & DELINQUENCY 124 (2003); Craig Haney, The Psychological Impact of Incarceration: Implications for Post-Prison Adjustment, U.S. DEPARTMENT OF HEALTH & HUMAN SERVICES (2001), available at http://aspe.hhs.gov/hsp/prison2home02/haney.htm; Craig Haney & Mona Lynch, Regulating Prisons of the Future: A Psychological Analysis of Supermax and Solitary Confinement, 23 N.Y.U. REVIEW OF LAW & SOCIAL CHANGE 477 (1997); Frederick R. Maue, Management of the Mentally Ill in Administrative Segregation: Legal and Management Challenges, 68 CORRECTIONS TODAY 46 (2006). 23 Agencies’ Top Five Critical Issues, 2014, ASSOCIATION OF STATE CORRECTIONAL ADMINISTRATORS (June 2014), available at http://www.asca.net/system/assets/attachments/7363/ASCA-Critical%20issues-6-14-2014%20V4.pdf. 24 As explained by George Camp, the Co-Executive Director of ASCA, in 2012 the ASCA Committee on Policy, Resolutions, Legislation and Legal Issues created an Administrative Segregation Sub-Committee. That committee’s primary purpose “is to facilitate member dialogue on the use of administrative segregation.” Since its inception, “the sub-committee has undertaken a number of ASCA initiatives to facilitate that dialogue and to identify potential best practices for members to employ in their jurisdictions.” Further, the current Restrictive Guidelines policies are under review. See E-mail from George Camp, Co-Executive Director, ASCA, to the Liman Program, June, 2015. 25 The subcommittee’s work is discussed by Director Mohr in his submission, a “Written Statement of the Association of State Correctional Administrators” for the record in Reassessing Solitary Confinement II: The Human Rights, Fiscal, and Public Safety Consequences: Hearing Before the Subcommittee on the Constitution, Civil Rights and Human Rights of the Senate Committee on the Judiciary, 113th Congress (February 25, 2014) [hereinafter Senate 2014 Hearing, Reassessing Solitary Confinement II], available at http://www.judiciary.senate.gov/meetings/reassessing-solitary-confinement-ii-the-human-rights-fiscal-and-public-safety-consequences.
As Director Mohr explained: Correctional administrators . . . recognize and understand that our work does not end with the transfer of inmates to restrictive housing. Our responsibility extends to providing a pathway to a positive transition out of this status. ASCA recognized that effectively managing inmates who are placed in restrictive housing must be a priority of our organization. Our members consistently state that the number of dangerous incidents is higher in restrictive housing. These incidents include assaults on staff and inmates. Also of serious concern is the elevated rate of suicides beyond that in general population settings. Suicides are a tragic indicator of failure and are devastating both to families who have planned on the safe return home of their loved ones and to the staff who supervise and work with these offenders.
Restrictive housing by its purpose is a controlling environment. It includes real limitations on the freedom of movement of inmate occupants and access to other inmates
ASCA-Liman National Survey Segregation revised distribution August 31, 2015
63

and staff. It has also historically reduced inmate access to programs and services as well as to visiting. The analysis of these restrictions was depicted in the study conducted by Yale Law School. As ASCA continued to drill down into the implications of restrictive housing, we determined that more often than many of us realized inmates released from a restrictive housing status were actually discharged directly into our communities. In fact, Ohio found this number to be 20%. Some states actually discovered a higher rate. This practice does not support a successful transition for the inmates to their families and neighborhoods and increases the risk to the public whom we are committed to protect.
Director Mohr’s Statement is reproduced in Isolation and Reintegration: Punishment Circa 2014, 86-90 (Hope Metcalf, Judith Resnik & Megan Quattlebaum eds., Arthur Liman Program, Yale Law School, 2014), available at http://www.law.yale.edu/documents/pdf/Liman/Liman_Colloquium_2014_Isolation_ and_Reintegration_Punishment_Circa_2014_revised_Jan_8_2015.pdf. 26 Restrictive Status Housing Policy Guidelines, ASSOCIATION OF STATE CORRECTIONAL ADMINISTRATORS (Aug. 9, 2013), available at http://www.asca.net/system/assets/attachments/6145/B.% 20ASCA%20Restrictive%20Status%20Housing%20Policy%20Guidelines-Final%2008092013.pdf. The thirteen guidelines, endorsed August 9, 2013, can also be found in the Liman volume, Isolation and Reintegration: Punishment Circa 2014, supra note 25, at 88. 27 See Brief of Amici Curiae Corrections Experts in Support of Petitioner at 7, Prieto v. Clarke, on petition for a writ of certiorari to the United States Court of Appeals for the Fourth Circuit, No. 15-21 (filed Aug. 7, 2015). Included was Regional A. Wilkinson, the former director of Ohio’s Department of Rehabilitation and Corrections and of both ASCA and the American Correctional Association. Wilkinson was also the defendant in the 2005 Supreme Court decision, Wilkinson v. Austin, 545 U.S. 209 (2005), in which Justice Kennedy, writing for a unanimous Court, held that some process was due before placing individuals in Ohio’s administrative segregation, which imposed an “atypical and significant hardship.” See supra note 6. 28 Prieto v. Clarke, 780 F.3d 245 (4th Cir. 2015). 29 See Brief of Amici Curiae Professors and Practitioners of Psychiatry and Psychology in Support of the Petitioner at 3, Prieto v. Clarke, on petition for a writ of certiorari to the United States Court of Appeals for the Fourth Circuit, No. 15-21 (filed Aug. 5, 2015). 30 See Solitary Confinement Study and Reform Act of 2014, H.R. 4618, 113th Cong. § 2(2) (May, 2014). 31 See S. 2567, § 5045(b)(1) 113th Cong. (2014). 32 See S. 1965, § 5043(b), 114th Cong. (2015). A transcript of Senator Booker’s introduction of the bill is available at https://www.congress.gov/congressional-record/2015/08/05/senate-section/article/S6384-1. 33 See Protecting Youth from Solitary Confinement Act, H.R. 2823, 114th Cong. (June 18, 2015). 34 The Justice and Mental Health Collaboration Act of 2015 would authorize the Attorney General of the United States to award grants for mental health screenings for prisoners subject to solitary confinement and develop alternatives to solitary confinement. See Justice and Mental Health Collaboration Act of 2015, H.R. 731, 114th Cong. § 3(j)(2)(C)(iii) (Feb. 4, 2015). The Accountability in Immigration Detention Act of 2015 proposes that immigration detention centers can only use solitary confinement “to the extent that such techniques are necessary to ensure the security of other detainees, staff, or the public
ASCA-Liman National Survey Segregation revised distribution August 31, 2015
64

and only if less coercive measures will not ensure the security of other detainees, staff, and the public.” Accountability in Immigration Detention Act of 2015, H.R. 2314, 114th Cong. § 2(b)(3) (May 13, 2015). 35 See Stipulation, Peoples v. Fischer, No. 11-CV-2694 (S.D.N.Y. Feb. 19, 2014), ECF No. 124, at 3-4 § 2(B)(1) (“DOCCS shall implement a written policy by means of a memorandum issued by the Deputy Commissioner for Correctional Facilities establishing a presumption against placement of a pregnant female inmate in SHU for disciplinary purposes, except in exceptional circumstances referred to Central Office.”). 36 Senate 2014 Hearing, Reassessing Solitary Confinement II (opening statement of Sen. Durbin), supra note 25. 37 Id. In 2012, Senator Durbin convened a first hearing, Reassessing Solitary Confinement: The Human Rights, Fiscal, and Public Safety Consequences: Hearing Before the Subcommittee on Constitution, Civil Rights and Human Rights of the Senate Committee on the Judiciary, 112th Cong. (June 19, 2012) (statement by Sen. Richard Durbin), available at http://www.judiciary.senate.gov/imo/media/doc/CHRG-112shrg87630.pdf. 38 Kenneth McGinnis, Dr. James Austin, Karl Becker, Larry Fields, Michael Lane, Mike Maloney, Mary Marcial, Robert May, Jon Ozmint, Tom Roth, Emmitt Sparkman, Dr. Roberta Stellman, Dr. Pablo Stewart, George Vose & Tammy Felix, Federal Bureau of Prisons: Special Housing Unit Review and Assessment, CNA ANALYSIS & SOLUTIONS (December 2014) [hereinafter CNA Analysis of BOP SHU 2014], available at http://www.bop.gov/resources/news/pdfs/NA-SHUReportFinal_123014_2.pdf. The BOP concurred with “most of the key findings,” provided background information on its use of restricted housing, and underscored that the “total numbers of inmates” so confined had “decreased significantly beginning in 2012.” Special Housing Unit Review and Assessment Report Response, FEDERAL BUREAU OF PRISONS 2 (February 2015), available at http://www.bop.gov/resources/news/pdfs/CNA_Response-V05a-saa.pdf. 39 CNA Analysis of BOP SHU 2014, supra note 38, at 215-216. 40 Id. at 111-29, 222, 231. 41 Id. at 139-50. 42 Id. at v. 43 Oversight of the Bureau of Prisons: First-Hand Accounts of Challenges Facing the Federal Prison System: Hearing Before the Senate Committee on Homeland Security & Governmental Affairs, 114th Cong. (Aug. 4, 2015), available at http://www.hsgac.senate.gov/hearings/oversight-of-the-bureau-of-prisons-first-hand-accounts-of-challenges-facing-the-federal-prison-system [hereinafter Oversight of the Bureau of Prisons 2015]. 44 Id. (hearing transcript) at 4. 45 For example, a 2014 bill in New Jersey proposed limiting the grounds for placement in restricted housing to only “when necessary to protect the inmate or another inmate from physical harm.” S.R. 1650, § 4(1) 216th Legislature (N.J. 2014) (introduced by Raymond J. Lesniak).
ASCA-Liman National Survey Segregation revised distribution August 31, 2015
65

46 Justice Kennedy cited Fatos Kaba, Andrea Lewis, Sarah Glowa-Kollisch, James Hadler, David Lee, Howard Alper, Daniel Selling, Ross MacDonald, Angela Solimo, Amanda Parsons & Homer Venters, Solitary Confinement and Risk of Self-Harm Among Jail Inmates, 104 AMERICAN JOURNAL OF PUBLIC HEALTH 442 (2014); and Jeffrey L. Meltzer & Jamie Fellner, Solitary Confinement and Mental Illness in U.S. Prisons: A Challenge for Medical Ethics, 38 JOURNAL OF THE AMERICAN ACADEMY OF PSYCHIATRY AND & THE LAW 104-108 (2010). 47 See COLO. REV. STAT. § 17-1-113.8 (2015); MASS. GEN. LAWS ch. 127, § 39A (2015). 48 COLO. REV. STAT. § 17-1-113.8(1)-(2)(2015). 49 E-mail from Rick Raemisch, Executive Director, Colorado Department of Corrections, to Judith Resnik, Professor, Yale Law School, July 14, 2015. 50 MASS. GEN. LAWS ch. 127, § 39A(b) (2015). 51 See, e.g., Stipulation, Parsons v. Ryan, No. 12-00601-PHX-DJH (D. Ariz. Oct. 14, 2014), ECF No. 1185; Consent Order, S.H. v. Reed, No. 2:04-CV-1206 (S.D. Ohio Jan. 18, 2013), ECF No. 359; Settlement Agreement, Disability Rights Network of Pennsylvania v. Wetzel, No. 1:13-CV-00635-JEJ (M.D. Pa. Jan. 9, 2015), ECF No. 59. 52 See Disability Rights Network v. Pennsylvania, Settlement Agreement and General Release, Civil Case No. 1:13-CV00635 (M.D. Pa. Jan. 5, 2015), at para. 12-16, pp. 13-14. 53 See H.B. 1083, 84th Legislature § 501.068 (Tex. 2015), available at http://www.legis.state.tx.us/ tlodocs/84R/billtext/pdf/HB01083I.pdf. This bill is described as an “Act relating to a mental health assessment of certain inmates of the Texas Department of Criminal Justice.” Id. 54 See Parsons v. Ryan, 289 F.R.D. 513 (D. Ariz. 2013) (certifying a class and subclasses of all prisoners “subjected to the medical, mental health, and dental care policies and practices” of the Arizona Department of Corrections, and appointing counsel); Stipulation, Parsons v. Ryan, No. 12-00601-PHX-DJH (D. Ariz. October 14, 2014), ECF No. 1185. 55 See Stipulation, Peoples v. Fischer, No. 11-CV-2694 (S.D.N.Y. Feb. 19, 2014), ECF No. 124, at 3-4 § 2(C)(1) (describing “certain inmates [whom the Department] determines have significantly limited intellectual capabilities and/or adaptive functioning and coping skills”). 56 See, e.g., Attapol Kuanliang, Jon R. Sorensen & Mark D. Cunningham, Juvenile Inmates in an Adult Prison System: Rates of Disciplinary Misconduct and Violence, 35 CRIMINAL JUSTICE & BEHAVIOR 1186 (2008); Andrea J. Sedlak & Karla S. McPherson, Conditions of Confinement: Findings from the Survey of Youth in Residential Placement, JUVENILE JUSTICE BULLETIN (May 2010), available at http://www.ncjrs.gov/pdffiles1/ojjdp/227729.pdf; Growing Up Locked Down: Youth in Solitary Confinement in Jails and Prisons Across the United States, HUMAN RIGHTS WATCH & ACLU (2012), available at http://www/hrw.org/sites/default/files/reports/us1012ForUpload.pdf. 57 For example, an Agreed Order ended S.H. v. Reed, filed in the federal court for the Southern District of Ohio against the State of Ohio, and related to United States v. Ohio, also pending in federal court. The litigation addressed an alleged failure “to provide adequate treatment for youth who are or have been on the mental health caseload.” S.H. v. Reed, Civ. Action No. 2:04-cv-1206, at 1 (S.D. Ohio May 20, 2014). The agreement anticipated the “eventual elimination of disciplinary seclusion for all youth.” Id. at 2. In
ASCA-Liman National Survey Segregation revised distribution August 31, 2015
66
2014, a 16-year-old girl, Jessica Turner, filed a federal civil rights lawsuit against the administrators of the Iowa juvenile home in which she was confined. Turner v. Palmer, No. 1:14-cv-00024-JEG, 2015 WL 455404 (S.D. Iowa 2015). She alleged that they violated her Fifth, Eighth, and Fourteenth Amendment rights by “continuous and systematic use of isolation cells.” Id. at *2. In February 2015, the court denied the defendant’s motion to dismiss, and the case is still pending. 58 Council of Juvenile Correction Administrators Toolkit: Reducing the Use of Isolation, COUNCIL OF JUVENILE CORRECTIONAL ADMINISTRATORS (March 2015), available at http://cjca.net/attachments/ article/751/CJCA%20Toolkit%20Reducing%20the%20Use%20of%20Isolation.pdf. 59 See e.g., CONN. GEN. STAT. § 17a-16(d)(1) (2015); CONN. AGENCIES REGS. § 17a-16-11 (2015). 60 See, e.g., Notice of Adoption of Rules, NEW YORK CITY BOARD OF CORRECTION 1–16, 1-17 (January 13, 2015), available at http://rules.cityofnewyork.us/sites/default/files/adopted_rules_pdf/boc_rules_ governing_correctional_facilities_fr.pdf; Alaska Delinquency R. 13 (Supreme Court Order 845), available at http://www.courts.alaska.gov/rules/del.htm (“A juvenile may not be confined in solitary confinement for punitive reasons.”); Colorado Department of Human Services Division of Youth Corrections, Policy 14.3B(II)(A), available at http://www.colorado.gov/cdhsdyc/P-14-3B.pdf (“ADMINISTRATIVE SECLUSION SHALL NEVER BE USED AS A FORM OF PUNISHMENT AND only for the period of time necessary to accomplish its purpose.”); R.J. v. Jones, No. 1:12-cv-07289 (N.D. Ill. April 20, 2015) (order approving policies submitted pursuant to Consent Decree, R.J. v. Bishop, No. 1:12-cv-7289 (N.D. Ill. Dec. 6, 2012)).
A recent survey of the 50 states and the District of Columbia found that, for juveniles, “nineteen jurisdictions prohibit lengthy punitive solitary confinement . . . . A number of jurisdictions also restrict the use of confinement for even non-punitive reasons to under a few hours.” Catherine Weiss, Natalie J. Kraner & Jacob Fisch, 51-Jurisdiction Survey of Solitary Confinement Rules in Juvenile Justice Systems, LOWENSTEIN CENTER FOR THE PUBLIC INTEREST 1, available at http://www.lowensteinprobono.com/ files/Uploads/Documents/solitary%20confinement%20memo%20survey%20--%20FINAL.pdf. The survey found that 19 jurisdictions prohibited the use of solitary confinement as punishment for juveniles while continuing to permit its use for the safety of other inmates, security personnel, and the inmate himself. Id. at 2. The conditions of confinement in the 2 contexts are different because in the latter, “the juvenile may only be kept in room restriction until the juvenile is no longer a threat [and] must be released once he or she demonstrates a sufficient level of self-control,” but in practice, the line may be blurred. Id. at 2-3 61 See A. 01346-A, (N.Y. Jan. 12, 2015), available at http://legiscan.com/NY/text/A01346/id/1083439; Casey Tolan, Bill Banning Solitary Confinement for Inmates Under 21 Moves Forward in New York State, FUSION, June 15, 2015, available at http://fusion.net/story/150973/bill-banning-solitary-confinement-for-inmates-under-21-moves-forward-in-new-york-state. 62 See, e.g., VERA INSTITUTE, SOLITARY CONFINEMENT, supra note 14. 63 See AMERICAN BAR ASSOCIATION, ABA STANDARDS FOR CRIMINAL JUSTICE, TREATMENT OF PRISONERS (3d ed. 2011), available at http://www.americanbar.org/publications/criminal_justice_ section_archive/crimjust_standards_treatmentprisoners.html. The standards focused on segregated housing include: Standard 23-2.6 Rationales for segregated housing; Standard 23-2.7 Rationales for long-term segregated housing; Standard 23-2.8 Segregated housing and mental health; Standard 23-2.9 Procedures for placement and retention in long-term segregated housing; Standard 23-3.8 Segregated housing; and Standard 23-4.3 Disciplinary sanctions. Id. See generally Margo Schlanger, Regulating
ASCA-Liman National Survey Segregation revised distribution August 31, 2015
67

Segregation: The Contribution of the ABA Criminal Justice Standards on the Treatment of Prisoners, 47 AMERICAN CRIMINAL LAW REVIEW 1421 (2011). 64 See HUMAN RIGHTS WATCH, CALLOUS AND CRUEL: USE OF FORCE AGAINST INMATES WITH MENTAL DISABILITIES IN US JAILS AND PRISONS (May, 2015), available at http.hrw.org/print/reports/2015/05/12/ callous-and-cruel-0. 65 See We Can Stop Solitary, AMERICAN CIVIL LIBERTIES UNION, available at https://www.aclu.org/ feature/we-can-stop-solitary; Solitary Confinement: Resource Materials, AMERICAN CIVIL LIBERTIES UNION, available at https://www.aclu.org/files/assets/Solitary%20Confinement%20Resource%20 Materials%2012%2017%2013.pdf. An overview of litigation comes from Elizabeth Alexander, “This Experiment, So Fatal”: Some Initial Thoughts on Strategic Choices in the Campaign Against Solitary Confinement, 5 U.C. IRVINE LAW REVIEW 1 (2015). She analyzed legal claims on behalf of the mentally ill, cognitively disabled, physically disabled, pregnant women, and youth, and delineated claims under the Due Process Clause, Eighth Amendment, and Americans with Disabilities Act. Id. 66 See, e.g., Erica Goode, Punished for Life, N.Y. Times, August 4, 2015 at D1; Christie Thompson, From Solitary to the Street: What Happens When Prisoners Go from Complete Isolation to Complete Freedom in a Day?, MARSHALL PROJECT (June 11, 2015) [hereinafter MARSHALL PROJECT, Solitary to the Street], available at https://www.themarshallproject.org/2015/06/11/from-solitary-to-the-street; Emily Bazelon, The Shame of Solitary Confinement, N.Y. TIMES MAGAZINE (February 19, 2015), available at http://www.nytimes.com/2015/02/19/magazine/the-shame-of-solitary-confinement.html; Michael Cabral, How Solitary Confinement in Pelican Bay Almost Drove Me Mad, NEW AMERICA MEDIA (July 30, 2013), http://newamericamedia.org/2013/07/how-solitary-confinement-in-pelican-bay-almost-drove-me-mad.php; Jean Casella & James Ridgeway, Unlock the Box: The Fight Against Solitary Confinement in New York, NATION (October 2, 2012), available at http://www.thenation.com/article/170276/unlock-box-fight-against-solitary-confinement-new-york. 67 See Think Ten Media Group, Expose and End Solitary Now!, THUNDERCLAP (June 2015), available at http://www.thunderclap.it/projects/28324-expose-and-end-solitary-now. 68 See, e.g., Tamar R. Birckhead, Children in Isolation: The Solitary Confinement of Youth, 50 WAKE FOREST LAW REVIEW 1 (2015); Elizabeth Bennion, Banning the Bing: Why Extreme Solitary Confinement is Cruel and Far Too Usual Punishment, 90 INDIANA LAW JOURNAL 741 (2015); Sharon Dolovich, Exclusion and Control in the Carceral State, 16 BERKELEY JOURNAL OF CRIMINAL LAW 259 (2011); Sharon Dolovich, Strategic Segregation in the Modern Prison, 48 AMERICAN CRIMINAL LAW REVIEW 1 (2011); Lisa Coleen Kerr, The Chronic Failure to Control Prisoner Isolation in US and Canadian Law, 40 QUEENS LAW JOURNAL 483 (2015); Elli Marcus, Toward a Standard of Meaningful Review: Examining the Actual Protections Afforded to Prisoners in Long-Term Solitary Confinement, 163 UNIVERSITY OF PENNSYLVANIA LAW REVIEW 1159 (2015); Keramet Reiter, Supermax Administration and the Eighth Amendment: Deference, Discretion, and Double Bunking, 1986-2010, 5 U.C. IRVINE LAW REVIEW 89 (2015); Margo Schlanger, Prison Segregation: Symposium Introduction and Preliminary Data on Racial Disparities, 18 MICHIGAN JOURNAL OF RACE & LAW 241 (2013). 69 UN Special Rapporteur on Torture Warns About Abuse of Solitary Confinement in the Americas, OFFICE OF THE HIGH COMMISSIONER ON HUMAN RIGHTS (Mar. 13, 2013), available at http://www.ohchr.org/en/NewsEvents/Pages/DisplayNews.aspx?NewsID=13134&
[M]ost of the scientific literature shows that, after 15 days, certain changes in brain functions occur and the harmful psychological effects of isolation can become
ASCA-Liman National Survey Segregation revised distribution August 31, 2015
68

irreversible. Prolonged solitary confinement must be absolutely prohibited, because it always amounts to cruel, inhuman or degrading treatment, and may even constitute torture, in breach of article 7 of the International Covenant on Civil and Political Rights, articles 1 and 16 of the Convention against Torture and Other Cruel, Inhuman or Degrading Treatment or Punishment, and the jus cogens and customary prohibition of torture and ill-treatment. The Human Rights Committee and the Committee against Torture have also adopted this position. The European Court of Human Rights has recognised that ‘complete sensory isolation, coupled with total social isolation, can destroy the personality and constitutes a form of inhuman treatment which cannot be justified by the requirements of security or any other reason’. Similarly, the Inter-American Court of Human Rights has held that ‘prolonged isolation and deprivation of communication are in themselves cruel and inhuman treatment, harmful to the psychological and moral integrity of the person and a violation of the right of any detainee to respect for his inherent dignity as a human being’.
Juan Mendez, Preface to SHARON SHALEV, A SOURCEBOOK ON SOLITARY CONFINEMENT 2 (Spanish ed. 2014), available at http://solitaryconfinement.org/uploads/JuanMendezPrefaceSourcebookOnSolitary ConfinementTranslation2014.pdf (citations omitted). The cases he referenced from the European Court of Human Rights and the Inter-American Court of Human Rights were Ilaşcu v. Moldova & Russia, App. No. 48787/99, European Court of Human Rights ¶ 432 (2004), available at http://hudoc.echr. coe.int/sites/eng/pages/search.aspx?i=001-61886#{"itemid":["001-61886"]}; and Velázquez-Rodríguez v. Honduras, Inter-American Court Human Rights, (Series C) No. 4, ¶ 156 (1988), available at http:// www1.umn.edu/humanrts/iachr/b_11_12d.htm. 70 U.N. Standard Minimum Rules for the Treatment of Prisoners (Mandela Rules), U.N. ESC Committee on Crime Prevention and Criminal Justice, 24th Sess., U.N. Doc. E/CN.15/2015/L.6/Rev.1 (May 22, 2015), available at http://www.unodc.org/documents/commissions/CCPCJ/CCPCJ_Sessions/CCPCJ_24/ resolutions/L6_Rev1/ECN152015_L6Rev1_e_V1503585.pdf. In a parallel vein, the Committee of Ministers of the Council of Europe has adopted recommendations aiming “to counteract the damaging effects of life and long-term imprisonment,” including “intensive efforts . . . to avoid segregation” of those populations, and if used, to “reduce the period of its use.” Further, prison systems were to undertake “special efforts” to facilitate family contact, counseling, and opportunities for work and programs. See Management by Prison Administrations of Life-Sentence and Other Long-Term Prisoners, Recommendation REC (2003) 23, COMMITTEE OF MINISTERS OF THE COUNCIL OF EUROPE para. 19, 21-33 (Oct. 9 2003), available at http://www.coe.int/t/dghl/standardsetting/cdpc/(Rec%20_2003_%2023%20 E%20Manag%20PRISON%20ADM%20Life%20Sent%20Pris%20%20REPORT%2015_205).pdf. 71 These rules related to isolation are set forth below. Rule 43
1. In no circumstances may restrictions or disciplinary sanctions amount to torture or other cruel, inhuman or degrading treatment or punishment. The following practices, in particular, shall be prohibited:
(a) Indefinite solitary confinement; (b) Prolonged solitary confinement; (c) Placement of a prisoner in a dark or constantly lit cell; (d) Corporal punishment or the reduction of a prisoner’s diet or drinking water; (e) Collective punishment.
2. Instruments of restraint shall never be applied as a sanction for disciplinary offences.
ASCA-Liman National Survey Segregation revised distribution August 31, 2015
69

3. Disciplinary sanctions or restrictive measures shall not include the prohibition of family contact. The means of family contact may only be restricted for a limited time period and as strictly required for the maintenance of security and order.
Rule 44
For the purpose of these rules, solitary confinement shall refer to the confinement of prisoners for 22 hours or more a day without meaningful human contact. Prolonged solitary confinement shall refer to solitary confinement for a time period in excess of 15 consecutive days.
Rule 45 1. Solitary confinement shall be used only in exceptional cases as a last resort, for as short a time as possible and subject to independent review, and only pursuant to the authorization by a competent authority. It shall not be imposed by virtue of a prisoner’s sentence. 2. The imposition of solitary confinement should be prohibited in the case of prisoners with mental or physical disabilities when their conditions would be exacerbated by such measures. The prohibition of the use of solitary confinement and similar measures in cases involving women and children, as referred to in other United Nations standards and norms in crime prevention and criminal justice, continues to apply.
U.N. Standard Minimum Rules for the Treatment of Prisoners (Mandela Rules), supra note 70. 72 Hope Metcalf, Jamelia Morgan, Samuel Oliker-Friedland, Judith Resnik, Julia Spiegel, Haran Tae, Alyssa Work & Brian Holbrook, Administrative Segregation, Degrees of Isolation, and Incarceration: A National Overview of State and Federal Correctional Policies (Yale Law School, Public Law Working Paper No. 301, 2013) [hereinafter Liman 2013 Administrative Segregation Policies], available at http://www.law.yale.edu/intellectuallife/limanpubs.htm. 73 In 2013, 133,044 prisoners—or about 8.4% of the United States prison population—were in private prisons. Federal prisons accounted for 41,159 of those prisoners (19.1% of the total of prisoners then in detention in the federal system). About 91,885 were in state prisons (about 6.8% of the total number of people in state prisons). See E. Ann Carson, Prisoners in 2013, BUREAU OF JUSTICE STATISTICS 13, 14 tbl.12 (Sep. 20, 2014), available at http://www.bjs.gov/content/pub/pdf/p13.pdf. 74 See Liman 2013 Administrative Segregation Policies, supra note 72, at 2. 75 Id. at 5-11. 76 Id. at 11-14. 77 Id. at 14-17. 78 Id. at 18-20. 79 Id. at 5 (citing, e.g., Alaska, DOC 804.01(v); Alabama, AR 436; Arizona, DO 801.09.1.2.3; California, Cal. Code Regs. tit. 15 § 3335(a); Colorado, AR 650-03(IV)(A); Connecticut, AD 9.4(3)(B); Delaware, DOC Policy 4.3; Florida, Fla. Admin. Code r. 33-602.220; Hawaii, COR.11.01.2.2(a)(2); Idaho, DOC 319.02.01.001; Illinois, 20 Ill. Admin. Code §504.660(b)(2); Iowa, IO-HO-05(IV)(A)(3)(b); Indiana, DOC 02-01-111; Kentucky, PP 10.2; Maryland, DOC.100.0002; Massachusetts, 103 CMR 421;
ASCA-Liman National Survey Segregation revised distribution August 31, 2015
70

Michigan, DOC 04.05.120; Minnesota, DD 301.085; Mississippi, SOP 19-01-01; New Mexico, CD-143.000.A; New York, 7 NYCRR 301.4(6); North Dakota, DOC 5A-20; Ohio, DOC 5120:1-10-15; Oklahoma, OP 040204; Oregon, DOC 291-046-0030; Pennsylvania, DC-ADM 802; Rhode Island, DOC 15.11-3; Tennessee, DOC 404-10(VI)(A)(1); Vermont, DOC 410.03(1)(e); Wisconsin, Wis. Admin. Code DOC § 308.04(2); Wyoming, P&P 3.302(II)(A)). 80 Liman 2013 Administrative Segregation Policies, supra note 72, at 5 (citing, e.g., Alaska, DOC 804.01(v); Arizona, DOC 804.01(1.1.1); California, Cal. Code Regs. tit. 15 § 3335(a); Delaware, DOC Policy 4.3(IV)(A); Hawaii, COR.11.01.2.2(a)(2); Idaho, DOC 319.02.01.001; Indiana, DOC 02-01-111; Kentucky, PP 10.2; Maine, DOC 15.1; Maryland, DOC.100.0002; Minnesota, DD 301.085; Mississippi, SOP 19-01-01; North Dakota, DOC 5A-20; Oklahoma, OP 040204; Pennsylvania, DC-ADM 802; Rhode Island, DOC 15.11-3; Vermont, DOC 410.03(1)(d); Washington, DOC 320.200; Wisconsin, Wis. Admin. Code DOC § 308.04(2)). 81 Liman 2013 Administrative Segregation Policies, supra note 72, at 5; see also Federal Bureau of Prisons, BOP 541.23. 82 Liman 2013 Administrative Segregation Policies, supra note 72, at 5 (citing, e.g., Alabama, AR 436(III)(A); Colorado, AR 650-03(II); KS IMPP 20-103; Hawaii, COR.11.01.2.2(a)(2); Iowa, IA-HO-05(IV)(A); Illinois, Ill. Admin. Code tit. 20, § 504; Massachusetts, 103 CMR 421.09; Mississippi, SOP 19-01-01; Nebraska, AR 201.05(II)(E); Nevada, AR 507.01 (I)(D); South Dakota, DOC I.3.D.4 (III); Wisconsin, DOC 308.04, Note; Wyoming, P&P 3.302(II)(A)). 83 Some jurisdictions had specific policies related to death-sentenced prisoners. In this report, we provide some information on the use of segregation for death-sentenced prisoners. The Liman Program is also compiling a report on how certain states house death-sentenced prisoners. The legality of the automatic placement of death-sentenced prisoners in administrative segregation has been challenged as violating the Supreme Court’s decision in Wilkinson v. Austin, 545 U.S. 209 (2005), which some interpret as permitting that practice and others understand as requiring individualized decision-making on placements in isolation. Illustrative is Prieto v. Clarke, 780 F.3d 245 (4th Cir. 2015), petition for certiorari filed (summer, 2015). The majority noted the “harshness of Virginia’s regime” (which the lower court judge had called “dehumanizing”) but concluded that the “broad latitude” the Supreme Court accorded prison officials meant that Virginia’s blanket rule putting all death-sentenced inmates into isolation did not violate the Constitution. Id. at 254-55. The dissenting judge disagreed, and read Wilkinson to require “at least some modicum of procedural due process.” Id. at 255 (Wynn, J., dissenting). 84 Liman 2013 Administrative Segregation Policies, supra note 72, at 4; see also, e.g., Alaska, DOC 804.01(V); Miss. SOP 19-01-01(77) Tennessee, 404.10(VI)(A)(d). 85 Liman 2013 Administrative Segregation Policies, supra note 72, at 4; see also, e.g., Colorado 650-03.IV.B. 86 Liman 2013 Administrative Segregation Policies, supra note 72, at 4; see also, e.g., Nebraska, Admin. Reg. 201.05(V)(A)(5). 87 Liman 2013 Administrative Segregation Policies, supra note 72, at 5. Thirty-eight states required a hearing, but the provisions were far from uniform. Id. at 11 (citing, e.g., Alaska, DOC 804.01(VII)(B)(1)(c); Arizona, DO 801.10; Arkansas, AS 11-42(III)(A)(1); California, Cal. Code Regs. tit. 15 §3338(a); Colorado, AR 650.03(4)(D); Connecticut (within 30 days), AD 9.4(12)(A); Federal Bureau of Prisons, BOP 541.439(b); Florida, Fla. Admin. Code r. 33-601.800(3)(g); Georgia, SOP IIB09-
ASCA-Liman National Survey Segregation revised distribution August 31, 2015
71

0001(VI)(B); Hawaii, COR.11.01(3)(1)(b); Idaho, DOC 319.02.01.001(13); Indiana, DOC 02-01-111(VI)(B)(1) (only for department-wide administrative segregation); Iowa, IA-HO-05(IV)(A) (after 2 months); Kansas, IMPP 20-105 (I); Kentucky, PP 10.2(H)(3); Maine, DOC 15.1.1(VI)(C); Massachusetts, 103 CMR 421.10; Michigan, DOC 04.05.120(O); Mississippi, SOP 19-01-01(k); Missouri, IS21-1.2(III)(A); Montana, DOC 4.2.1(IV)(E); Nebraska, AR 201.05(VII)(B); Nevada, AR 507.01(2)(C); New Jersey, IMM.012.001(III); New Mexico, CD-143.001.4(J); New York, 7 NYCRR 301.4(a); North Carolina, DOC .0302(c); Ohio (local control), DOC 5120:1-10-15(D); Oregon (after 30 days), OAR DOC 291-046-0030; Pennsylvania, DC-ADM 802(2); Rhode Island, Procedure for Classification to Category C; South Dakota, DOC 1.3.D.4(IV); Tennessee, DOC 404.10(2)(c); Vermont, DOC 410.03(3); Virginia, OP 861.3(IV); Washington, DOC 320.200 (III); Wisconsin, Wis. Admin. Code DOC § 308.04(3); Wyoming P&P 3.302(IV)(B)(4)).
In states that required hearings, 30 specified that inmates could present evidence while 8 did not. Liman 2013 Administrative Segregation Policies, supra note 72, at 12 (citing Alaska, DOC 804.01(VII)(C); Arkansas, AD 11-42; Federal Bureau of Prisons, BOP 541.439(B)(1); California, Cal. Code Regs. tit. 15 §3337(b); Colorado, AR 600.02(IV)(K)(2); Florida, Fla. Admin. Code r. 33-601.800(3)(g); Georgia, SOP IIB09-001(IV)(B); Hawaii, COR.11.01(3)(1); Idaho, 319.02.01.001; Indiana, 02-01-111(VI)(B); Iowa, IA-HO-05(IV)(A); Kansas, IMPP 2-106; Kentucky, PP 10.2(H)(3); Massachusetts, 103 C.M.R. 421.07; Michigan, Mich. Admin. Code R. 791.3315(1)(c); Missouri, IS21-1.2(III)(B)(4)(a); Montana, DOC 4.2.1(IV)(E); Nebraska, AR 201.05(VII)(B); New Jersey, IMM.012.ADSEG.001; North Carolina, C.302(d); Ohio, Admin. Code. 5120-9-13.1(C); Oregon DOC 291-046-0030; Pennsylvania, DC-ADM 802(2)(6); Rhode Island, Procedure for Classification to Category C; South Dakota, DOC 1.3.D.4(iii); Tennessee, DOC 404-10-(VI)(A)2); Vermont, DOC 410.03; Virginia, OP 830.1(V); Washington, DOC 320.200(III)(I); Wisconsin, DOC 30604(4)(e); Wyoming, P&P 3.302(5)). 88 Liman 2013 Administrative Segregation Policies, supra note 72, at 5. Thirty-one jurisdictions authorized decision-making by a committee. Id. at 12. These states were Alabama, Arkansas, Colorado, Florida, Georgia, Idaho, Indiana, Iowa, Kansas, Maryland, Massachusetts, Maine, Minnesota, Missouri, Montana, Nebraska, Nevada, New Hampshire, New Jersey, New Mexico, New York, North Carolina, North Dakota, Oklahoma, Pennsylvania, Rhode Island, South Dakota, Virginia, Washington, Wisconsin, and Wyoming. See Arkansas, AR 11-42(II); Colorado, AR 650-03(B)(2)(e); Florida Admin. Code r.33.602.220(2)(c); Georgia, SOP IIB09-001(IV)(B); Idaho, 319.02.01.001(15); Indiana, Policy 02-01-0111(VIII); Iowa, IA-HO-05(IV)(A); Kansas, IMPP 20-106; Massachusetts, 103 C.M.R. 421.07; Maine, DOC 15.1; Missouri, MO IS21-1.2(III)(B); Nebraska, AR 201.05(IV)(A); Nevada, AR 507.01(2)(E); New Jersey, IMM.012.001; New Mexico, CD 143001.4(J)(3)(a); New York, 7 NYCRR 301.4(a); North Carolina, C.0302(d) (facility-level committee reviews placements up to 60 days); North Carolina, C.0302(d) (“Director’s Classification Committee” reviews longer-term referrals to intensive control); Pennsylvania, DC-ADM 802(3)(A)(1); South Dakota, DOC 1.3.D.4(iii); Virginia, OP 830.2(G)(3); Washington, DOC 320.220(I)(A); Wisconsin, DOC 308.04(3); Wyoming, P&P 3.302.
In some instances, as in New Jersey and Virginia, a hearing officer made an initial
recommendation to the committee. Liman 2013 Administrative Segregation Policies, supra note 72, at 12; see also New Jersey, IMM.012.001; Virginia, OP 830.2(G)(3). In 12 jurisdictions, a hearing officer (or another individual official) decided whether to place an inmate in administrative segregation. Liman 2013 Administrative Segregation Policies, supra note 72, at 12. These states were Alaska, Arizona, California, Connecticut, Delaware, the Federal Bureau of Prisons, Illinois, Michigan, Mississippi, Ohio, Oregon, and Vermont. See Alaska, DOC 804.01(VII)(C); Arizona, DO 801.10; California, Cal. Code Regs. tit. 15 §3337; Connecticut, AD 9.4(12)(A); Delaware, DOC Policy 4.3(VI)(A); Federal Bureau of Prisons, BOP
ASCA-Liman National Survey Segregation revised distribution August 31, 2015
72

541.23 (administrative detention); Michigan, Mich. Admin. Code R. 791.3315(5)(F); Mississippi, SOP 19-01-01; Oregon, DOC 291-046-0030; and Vermont, DOC 410.03(3).
In 3 jurisdictions, Hawaii, Kentucky, and Tennessee, the warden or his/her designee was
responsible for making initial determinations. Liman 2013 Administrative Segregation Policies, supra note 56, at 12; see also Hawaii, COR.11.01(3)(1); Kentucky, PP 10.2(H)(3); and Tennessee, DOC 404-10-(VI)(A)2). West Virginia’s policy did not specify the deciding authority. Liman 2013 Administrative Segregation Policies, supra note 72, at 12; see also West Virginia, PD 326.00. 89 Tom Clements, the Director of the Colorado Department of Corrections who led the effort to limit administrative segregation and who was murdered in 2013, is one expert offering this view. See Frank Bruni, Redemption’s Advocate, NEW YORK TIMES (Mar. 21, 2013, 12:06 PM), available at http:// bruni.blogs.nytimes.com/2013/03/21/redemptions-advocate. One article described him as a “fierce advocate for cutting Colorado’s overuse of ‘ad seg,’ especially among the mentally ill.” Tessa Cheek, Solitary Confinement by Any Other Name . . . , COLORADO INDEPENDENT (Apr. 23, 2014), available at http://www.coloradoindependent.com/147148/solitary-confinement-by-any-other-name. 90 Liman 2013 Administrative Segregation Policies, supra note 72, at 5. For example, the officials responsible for conducting periodic reviews varied, and some states’ statutes did not expressly assign the function to any official. Id. at 16; see also Minnesota, DD 301.085(C) (Unit Ad. Seg.); and Montana, MSP 3.5.1(H)(1). In general, the longer an individual had been in segregation, the more senior the official responsible for reviewing the assignment was. See, e.g., Maine, DOC 15.1 (approval by commissioner required for segregation longer than 6 months); Maryland, DOC 100.0002(5)(F)(9) (approval by commissioner required for segregation longer than one year); Colorado, AR 650-03(IV)(J)(4) (deputy director had to meet personally with inmate to determine propriety of segregation longer than one year). 91 A note about visiting policies is in order. Having the potential for visits does not translate into having visitors – in general population or in administrative segregation. Individuals’ families may not have the ability, in time or resources, to travel to institutions at the times permitted for visits; individuals usually have to be placed on lists before coming; and visitors generally face other predicates to entry, including searches. 92 Liman 2013 Administrative Segregation Policies, supra note 72, at 18. Institutional provisions for visiting in general are summarized in Prison Visitation Policies: A 50 State Survey. Chesa Boudin, Trevor Stutz & Aaron Littman, Prison Visitation Policies: A 50 State Survey (2012), available at http://www.law.yale.edu/documents/pdf/Liman/Prison_Visitation_Policies_A_Fifty_State_Survey.pdf.
The rules for individuals in administrative segregation at the time were in Alaska, DOC 804.01(VII)(F)(1) (access to visitation restricted only after individualized determination that participation threatens order and security); Arizona, DO 804.01.1.2.13 (non-contact visitation except when precluded by disciplinary sanctions); Arkansas, AD 11-42 (III)(C)(7)-(8) (stipulating visits in a separate visiting room and in the presence of an officer); Federal Bureau of Prisons, BOP 540.50 (permitting visiting privileges as in general population unless individualized disciplinary finding); California, Cal. Code Regs. tit. 15 § 3343(f) (inmates assigned to segregated housing permitted same visitation as general population, except for inmates in security housing units who are restricted to non-contact visitation); Colorado, AR 650-03(IV)(F)(1)(j) (permitting opportunities for non-contact and attorney visiting unless there are documented substantial reasons for withholding such privileges); Connecticut, Northern Correctional Institution Administrative Segregation Program Description (describing visiting privileges according to privilege level); Delaware, DOC Policy 4.3 (VI)(D)(1) (“Administrative Segregation offenders have opportunities for visitation, unless there are substantial reasons for withholding such privileges”); Florida,
ASCA-Liman National Survey Segregation revised distribution August 31, 2015
73

Fla. Admin. Code r. 33-602.220(5)(i) (permitting visits upon advance approval by warden or designee, and allowing warden or designee to determine whether such visit will be contact or non-contact; visitation denied to inmates “who are a threat to the security of the institution”) and Fla. Admin. Code r. 33-601.820(5)(e) (only specifying legal visits for inmates in maximum management); Georgia, SOP IIB09-0001(VI)(E)(5)(“visiting and correspondence privileges accorded the general population shall be allowed to inmates in Administrative Segregation”); Hawaii, Maximum Control Unit Functions (allowing 1 45-minute personal non-contact visit every 14 days for maximum custody inmates) and COR.11.01(3.1)(f) (allowing non-contact personal visits but contact official visits); Idaho, SOP 319.02.01.001(18) (allowing 1 visit per month upon request, excluding attorney visits, after twenty days of detention); Illinois, Ill. Admin. Code tit. 20 § 505.80 (permitting non-contact visits upon advance approval for all non-attorney visitors); Indiana, DOC Policy 02-01-111 (IX)(E) (allowing a minimum of 2 visits per month, with opportunity for contact determined by facility); Iowa, IO-HO-05(IV)(H)(2)(o)(i) (specifying “opportunities for visitation unless there are substantial reasons for withholding privileges”); Kansas, IMPP 20-101 (III)(B) (“visitation shall be allowed on a restricted basis unless there are substantial reasons for withholding the privilege”); Kentucky, CPP 10.2(II)(I)(6) (providing visitation “unless a documented reason for withholding exists”), 16.1(II)(G)(2) (“inmates in Special Management may be allowed normal visiting hours but may be restricted to a more secure visiting area” if a threat to security or order exists); Maine, DOC 15.1(VI)(E)(2)(C) (allowing non-contact regular visits once per week and professional visits as permitted); Maryland, DOC.100.0002(18)(F)(12) (permitting same number and duration of visits as general population, preferably in separate visiting room, “consistent with security staffing and institutional needs”); Massachusetts, 103 CMR 421.20(7) (“inmates in segregation shall be afforded visiting privileges which are, as much as practicable, the same as those available to inmates in the general population”); Michigan, PD 05.03.140(CC) (permitting non-contact visits only except for with an attorney); Minnesota, DD 301.087(E)(11) (requiring that inmates in administrative segregation status have access to visiting, and specifying CCTV visits 4 hours per month for Oak Park Heights Administrative Control Unit, with increased visitation opportunities at warden’s discretion); Mississippi, SOP 19-01-01 (permitting non-contact visits by ten visitors unless there are substantial reasons for withholding); Missouri, IS21-1.2(III)(E)(10)(a) (permitting 2 hour non-contact visits with possibility of additional privileges); Montana, MSP 3.5.1(III)(G)(2)(l) (social and legal visits must be permitted “provided the inmate is not under a properly imposed visiting restriction”); Nebraska, AR 210.01(III)(J) (allowing non-contact visits for inmates in intensive management, contact for administrative confinement unless in a unit with tele-visiting capability); Nevada, AR 507(4)(E) (“administrative segregation inmates will be allowed contact visits unless security of the institution dictates otherwise”); New Hampshire, PPD 7.09(IV)(D)(9) (permitting 2 visits per week besides attorney and clergy visits); New Jersey, ACSU Administrative Segregation Inmate Handbook (defining levels of program and corresponding non-contact visit privileges); New Mexico, CD-143000(X) (“inmates in segregation shall have opportunities for visitation unless there are substantial reasons for withholding such privileges”); New York, 7 NYCRR 1704.7(d) (permitting 1 non-legal visit per week, subject to further restriction); North Carolina, C.1215 (permitting 2 non-contact visits every thirty days); North Dakota, 5A-20(3)(H)(2) (permitting administrative segregation inmates 1 hour of visiting time on each authorized day and up to 10 hours per month); Ohio, AR 55-SPC-02(VI)(A)(14) (permitting “same access to visitation as general population unless security or safety considerations dictate otherwise”); Oklahoma, OP-040204(V)(A)(12) (permitting visiting privileges in accordance with level assignment); Oregon, OAR 291-127-0260(6) (permitting 1 non-contact 1-hour visit/week with 2 visitors); Pennsylvania, DC-ADM 802(§3)(A)(2)(d) (“all visits are non-contact” and governed by program phases); Rhode Island, 12.02-2 DOC(III)(E)(2) (1 visit per week, if detainee’s behavior permits, excluding visit with attorney); South Dakota, DOC Policy 1.3.D.4 & 1.5.D.1 (permitting non-contact visits); Tennessee, DOC Policy 506.16(IV)(E)(1) & 507.01.1 (allowing visits by family, attorney, and minister only; opportunity for contact visits determined by facility); Vermont, DOC Policy 410.06 (permitting 1 visit per week, non-contact or contact according to facility and step-down status); Virginia, OP 861.3(V)(D)(16) (establishing non-contact visitation, 1 1-hour visit
ASCA-Liman National Survey Segregation revised distribution August 31, 2015
74

per week with no more than 5 persons); Washington, DOC 320.260(III)(A)(2) (providing for no-contact visits with immediate family members); West Virginia, PD 326.00(V)(B)(18) (“inmates in segregation shall have opportunities for visitation unless there are substantial reasons for withholding such privileges”); Wisconsin, Wis. Admin. Code DOC §§ 309.09(4) & DOC 309.11(1) (allowing 1 hour per week, permitting warden to impose non-contact visiting on inmates in administrative segregation); Wyoming, P&P #5.400(IV)(K)(1)(iv) (requiring pre-arranged visits for inmates in long-term administrative segregation and varying hours of non-contact visitation per month depending on level of isolation). 93 Liman 2013 Administrative Segregation Policies, supra note 72, at 18-19. At that time, legal visits were governed by, in Maine, DOC Policy 15.1(VI)(E); Georgia, SOP IIB09-0001(VI)(E)(5); Hawaii, COR.11.01(3.1)(f); Idaho, SOP 319.02.01.001(18); Illinois, Ill. Admin. Code tit. 20, §505.80; Iowa, HO-05(H)(2)(h)(i), Kansas, IMPP 20-101 (II)(b); New Hampshire, PPD 7.09(IV)(A)(1); New York, 7 NYCRR 302.2(i)(1)(i); Rhode Island, 12.02-2(III)(E)(2); Tennessee, DOC 506.16(VI)(E)(1). At the time, religious visits were governed by Alaska, DOC Policy 804.01(VII)(G)(2)(b)(4); Arizona, AR 911.05.1.4; Arkansas, AD 11-42(III)(C)(7)-(8); Iowa, HO-05(H)(2)(o)(i); Kansas, IMPP 10-110; Kentucky, CPP 10.2(II)(O); Maine, DOC 15.1(VI)(E)(2)(O); Maryland, DOC.100.0002(18)(F)(13)(a); Massachusetts, 103 CMR 421.20(7); Minnesota, DD 301.087(E)(18), 301.085(E); Missouri, IS21-1.2(E)10)(a); Nevada, AR 507 4(Q); New Hampshire, PPD 7.09 (IV)(L); New Jersey, ACSU Administrative Segregation Inmate Handbook; New Mexico, CD-143005(A)(CC); North Dakota, 5A-20(I)(2); Rhode Island, 12.02-2(III)(E)(7); South Dakota, DOC Policy 1.3.D.4(IV); Tennessee, DOC 506.16(VI)(E)(12); Virginia, OP 861.3(V)(D)(22)(a). 94 Liman 2013 Administrative Segregation Policies, supra note 72, at 18-19 (citing Florida, Fla. Admin. Code r. 33-602.220(5)(i); Indiana, DOC 02-01-111 (IX)(E); Illinois, Ill. Admin. Code tit. 20, § 505.80; Maine, DOC 15.1(E)(2)(C); Minnesota, DD 301.087 (11) & 301.085(E); Mississippi, MS SOP 19-01-01(k); New Hampshire, PPD 7.09(IV)(I); New Jersey, IMM.012.001(IV)(I); New Mexico, CD-143000(X); Oregon, OAR 291-127-0260; Washington, DOC 320.260(III)(A)(2); Wyoming, DOC 5.400(IV)(K)). 95 A few prison systems, assisted by social scientists, have done case studies, to learn about levels of violence, mental illness, and costs. See, e.g., Maureen L. O’Keefe, Kelli J. Klebe, Alysha Stucker, Kristin Sturm & William Leggett, One Year Longitudinal Study of the Psychological Effects of Administrative Segregation, NATIONAL CRIMINAL JUSTICE REFERENCE SERVICE (October 31, 2010), available at https://www.ncjrs.gov/pdffiles1/nij/grants/232973.pdf; Terry A. Kupers, Theresa Dronet, Margaret Winter, James Austin, Lawrence Kelly, William Cartier, Timothy J. Morris, Stephen F. Hanlon, Emmitt L. Sparkman, Parveen Kumar, Leonard C. Vincent, Jim Norris, Kim Nagel & Jennifer McBride, Beyond Supermax Administrative Segregation: Mississippi’s Experience Rethinking Prison Classification and Creating Alternative Mental Health Programs, 36 CRIMINAL JUSTICE & BEHAVIOR 1037 (2009), available at http://www.aclu.org/files/images/asset_upload_file359_41136.pdf. 96 These 46 responding jurisdictions were Alabama, Alaska, Arizona, Arkansas, Colorado, Connecticut, Delaware, District of Columbia, Federal Bureau of Prisons, Florida, Georgia, Hawaii, Illinois, Indiana, Iowa, Kansas, Kentucky, Louisiana, Massachusetts, Michigan, Minnesota, Mississippi, Missouri, Montana, Nebraska, Nevada, New Hampshire, New Jersey, New York, North Carolina, North Dakota, Ohio, Oklahoma, Oregon, Pennsylvania, Rhode Island, South Carolina, South Dakota, Tennessee, Texas, Utah, Virginia, Washington, West Virginia, Wisconsin, and Wyoming. 97 Those six were California, Idaho, Maine, Maryland, New Mexico, and Vermont; estimated population totals come from the BJS 2013 ADULT PRISON CENSUS, supra note 19.
ASCA-Liman National Survey Segregation revised distribution August 31, 2015
75

98 The survey did not inquire about transgender prisoners. 99 The jurisdictions that we reached for this form of follow-up were Alabama, Alaska, Arizona, Arkansas, Colorado, Connecticut, Delaware, District of Columbia, Florida, Georgia, Hawaii, Indiana, Iowa, Missouri, Nebraska, New Jersey, New York, North Carolina, North Dakota, Ohio, Oklahoma, Oregon, Pennsylvania, Rhode Island, South Carolina, South Dakota, Tennessee, Texas, Washington, West Virginia, Wisconsin, and Wyoming. 100 The jurisdictions that submitted responses after March 16 were the Federal Bureau of Prisons, Kansas, Minnesota, Missouri, Montana, New Hampshire, and Virginia. 101 Six jurisdictions—California, Idaho, Maine, Maryland, New Mexico, and Vermont—did not respond to this survey or provide any information regarding their use of restrictive housing or administrative segregation. According to the Bureau of Justice Statistics, as of 2013, these jurisdictions housed 175,965 prisoners. See BJS 2013 ADULT PRISON CENSUS, supra note 19. 102 The jurisdictions not providing data on all forms of restricted housing (including the six jurisdictions not answering the survey) were: Alaska, Arizona, Arkansas, California, Hawaii, Idaho, Illinois, Louisiana, Maine, Maryland, Minnesota, Mississippi, Nevada, Rhode Island, Vermont, Virginia, and West Virginia. 103 Texas and Indiana reported not including double-celled prisoners in the numbers they provided. 104 As noted, 41 jurisdictions provided population figures on men in administrative segregation; the three that did not provide information on women were Delaware, Utah, and Virginia. 105 This count, along with that on administrative segregation, includes Missouri, which later informed us that its electronic tracking needed improvement in order to have accurate numbers, and that the “number of offender[s] assigned to administrative segregation included many other statuses such as protective custody and disciplinary segregation.” Information provided via email by the Missouri Department of Corrections on August 7, 2015. 106 Six jurisdictions reported the following kinds of challenges with the definition of administrative segregation provided in the survey.
Connecticut: “Connecticut DOC has several other restrictive status programs that separate inmates from a general population setting” (and describing them). Missouri: “Some of our institutions do not have defined disciplinary segregation or protective custody beds; the beds are in the administrative segregation unit. Thus, for data reporting, separating these out is difficult.” Massachusetts: “Our definition and use of administrative segregation largely fits the description above. However, many of our inmates in administrative segregation are there less than 30 days. Additionally there may be inmates in administrative segregation for punitive or disciplinary reasons. We do not have the ability to extract those from our data.” New Jersey: “The NJDOC [N.J. Department of Corrections]’s definition of administrative segregation (ad seg) means the removal of an inmate from the general population of a
ASCA-Liman National Survey Segregation revised distribution August 31, 2015
76

correctional facility to a close custody unit because of one or more disciplinary infractions or other administrative considerations. It is a punitive close custody unit.” Ohio: “We used the definition Ohio has created. Individuals confined to their cells for 22 or more hours per day for an indefinite period of time. In general, this is the same as [the survey’s], but it varies slightly.” Washington: “We used agency policy definitions for Intensive Management Status (IMS) or Intensive Treatment Status (ITS), both assignments to the highest classification custody level of maximum. Maximum custody is the most similar WADOC [Washington Department of Corrections] practice to the survey definition of administrative segregation (our agency defines administrative segregation much differently). Maximum custody is the longest form of restrictive housing. It’s easily 30 days or more. Inmate can be assigned to max custody and reviewed every couple of months (180 days) for retention on that status or release. It doesn’t include disciplinary segregation (this is their only restriction that is punishment). IMS is demotion to maximum custody for presenting a serious threat to the safety of employees, contract staff, volunteers or other offenders demonstrated through a pattern of violent or seriously disruptive behavior or extreme protection needs. ITS is assignment to maximum custody residential treatment beds for designated offenders with serious mental illness.”
In addition, as noted, two jurisdictions (Indiana and Texas) indicated that they did not consider prisoners in double cells to be in “administrative segregation.” In contrast, the Department of Justice has used the measure of confinement to one’s cell “for approximately 22 hours per day or more, alone or with other prisoners” as its measure. See Emma Roller, The Problem with Defining “Solitary Confinement,” National Law Journal, Aug. 4, 2015 (citing the letter from the Department of Justice to the Governor of Pennsylvania and detailing its May 31, 2013 findings of its investigation of the State Correctional Institution at Cresson, and its views that the isolation used in that facility violated prisoners’ statutory rights). The letter itself stated that for “purposes of this document, the terms ‘isolation’ or ‘solitary confinement’ mean the state of being confined to one’s cell for approximately 22 hours per day or more, alone or with other prisoners, that limits contact with others. Compare Wilkinson v. Austin, 545 U.S. 209, 214, 224 (2005) (describing solitary confinement as limiting human contact for 23 hours per day); Tillery v. Owens, 907 F.2d 418, 422 (3d Cir. 1990) (21 to 22 hours per day).” Letter from Thomas E. Perez, Assistant Attorney Gen., U.S. Department of Justice, Civil Rights Division, and David J. Hickton, U.S. Attorney, U.S. Attorney’s Office, Western District of Pennsylvania, to Honorable Tom Corbett, Governor of Pennsylvania, May 31, 2013, at 5, available at http://www.justice.gov/sites/default/files/crt/legacy/ 2013/06/03/cresson_findings_5-31-13.pdf.
The issue of whether double-celling qualified as isolation was also discussed in the hearings, on August 4, 2015, of the Senate Committee on Homeland Security and Governmental Affairs. See 2015 Oversight of the Bureau of Prisons, supra note 43, at 32-26. 107 New York has been the subject of a report by the New York Civil Liberties Union, BOXED IN, supra note 8, focusing on its restricted housing, mapping the isolation beds across the state, and discussing the conditions. 108 This discussion includes revised information provided by the North Dakota Department of Corrections on July 28, 2015; the Oklahoma Department of Corrections on July 29; the Pennsylvania Department of Corrections on July 31; and the Missouri Department of Corrections on August 10.
ASCA-Liman National Survey Segregation revised distribution August 31, 2015
77

109 This discussion includes revised information provided by the North Dakota Department of Corrections on July 28, 2015; the Oklahoma Department of Corrections on July 29; the Pennsylvania Department of Corrections on July 31; and the Missouri Department of Corrections on August 10. 110 This discussion includes revised information provided by the North Dakota Department of Corrections on July 28, 2015; the Oklahoma Department of Corrections on July 29; the Pennsylvania Department of Corrections on July 31; and the Missouri Department of Corrections on August 10. 111 This discussion includes revised information provided by the North Dakota Department of Corrections on July 28, 2015; the Oklahoma Department of Corrections on July 29; the Pennsylvania Department of Corrections on July 31; and the Missouri Department of Corrections on August 10. 112 The BOP did not answer this question specifically but, in response to another question, stated, “There are no women in administrative segregation status.” We therefore included the BOP in the 9 jurisdictions. Responses from Delaware, Utah, and Virginia left the question blank, and these jurisdictions were not included in this analysis. Further, we received corrected information in July 2015 by email from the North Dakota Department of Corrections and the Oklahoma Department of Corrections. 113 The other 2 jurisdictions, Delaware and North Dakota, informed us that they had no women in either restricted housing or in administrative segregation. 114 This discussion includes revised information provided by the North Dakota Department of Corrections on July 28, 2015; the Oklahoma Department of Corrections on July 29; the Pennsylvania Department of Corrections on July 31; and the Missouri Department of Corrections on August 10. 115 This discussion includes revised information provided by the North Dakota Department of Corrections on July 28, 2015; the Oklahoma Department of Corrections on July 29; the Pennsylvania Department of Corrections on July 31; and the Missouri Department of Corrections on August 10. 116 This discussion includes revised information provided by the New Jersey Department of Corrections on July 24, 2015; the North Dakota Department of Corrections on July 28; and the Oklahoma Department of Corrections on July 29. North Dakota corrected its total number of male inmates in administrative segregation as of September 15, 2014, resulting in a lower percentage of inmates in administrative segregation in the fall of 2014 than in the fall of 2011. 117 This discussion includes revised information provided by the New Jersey Department of Corrections on July 24, 2015; the North Dakota Department of Corrections on July 28; the Oklahoma Department of Corrections on July 29; the Pennsylvania Department of Corrections on July 31; and the Missouri Department of Corrections on August 10. 118 This discussion includes revised information provided by the New Jersey Department of Corrections on July 24, 2015; the North Dakota Department of Corrections on July 28; the Oklahoma Department of Corrections on July 29; the Pennsylvania Department of Corrections on July 31; and the Missouri Department of Corrections on August 10. 119 This discussion includes revised information provided by the North Dakota Department of Corrections on July 28, 2015, and the Oklahoma Department of Corrections on July 29. North Dakota’s corrections indicated that no female inmates were in administrative segregation for both the 2011 and 2014 report date. Oklahoma indicated that one female inmate was in administrative segregation on those dates.
ASCA-Liman National Survey Segregation revised distribution August 31, 2015
78

120 This comparison depends on data from 2011 and 2014. Table 3, with 38 jurisdictions reporting, details 9 jurisdictions with no women in administrative segregation in 2014. Table 5 reflects only jurisdictions that reported information about both 2011 and 2014. 121 This discussion includes revised information provided by the North Dakota Department of Corrections on July 28, 2015; the Oklahoma Department of Corrections on July 29; the Pennsylvania Department of Corrections on July 31; and the Missouri Department of Corrections on August 10. 122 This discussion includes revised information provided by the North Dakota Department of Corrections on July 28, 2015; the Oklahoma Department of Corrections on July 29; the Pennsylvania Department of Corrections on July 31; and the Missouri Department of Corrections on August 10. 123 South Dakota reported that its step-level program was designed to last 14 months, but that modifications could be made for prisoners scheduled to be discharged less than 14 months after placement in segregation. South Carolina reported that it had a minimum stay of 18 months for “escapes.” Alaska reported a minimum period of 12 months. All other jurisdictions reporting a minimum time period gave a shorter time frame. 124 Georgia’s response was updated based on August 3, 2015 correspondence from the Georgia Department of Corrections. 125 The length of stay has been a focus of both case law and media attention. Some litigation centers around the legality of decades in administrative segregation. See, e.g., Order Granting in Part Motion for Class Certification; Denying Motion to Intervene, Ashker v. Governor of the State of California, No. C 09–5796 CW, 2014 WL 2465191, at *9 (N.D. Cal. Jun. 2, 2014) (certifying a Due Process Class and an Eighth Amendment Class of prisoners, held in the Security Housing Unit (SHU) at California’s Pelican Bay State Prison, and who have spent decades in solitary confinement); Anderson v. Colorado, 887 F. Supp. 2d 1133, 1150 (D. Colo. 2012) (finding that a prisoner in administrative segregation for 12 years was in “atypical” conditions and therefore had a constitutionally protected interest); Jamerson v. Heimgartner, 326 P.3d 1091 (Table), 3 (Kan. Ct. App. 2014) (rejecting a claim by a prisoner alleging that he had been held for more than 1000 days in administrative segregation and that the duration of segregation itself did not establish a protected liberty interest) review granted in part, Jamerson v. Heimgartner, No. 110,977, 2015 BL 137422, *1 (Kan. May 04, 2015) (considering “whether the duration of administrative segregation alone implicates a due process liberty interest.”). Media reports include discussions of individuals in for more than a decade. See, e.g., Eric Dexheimer, 30 Years. One Room., AUSTIN AMERICAN-STATESMAN, April 25, 2015, available at http://www.mystatesman.com/ news/news/opinion/30-years-one-room/nkycs. As detailed in Table 6, some jurisdictions reported that prisoners had remained in administrative segregation for more than 3 years. 126 For a detailed analysis of the use of restricted housing in the federal system, see CNA Analysis of BOP SHU 2014, supra note 38. The report compared the average length of stay in different kinds of restrictive housing and found that the average length of stay was greatest in administrative maximum (ADX) facilities (1,376 days), compared to 277 days in special housing units (SHU) and 76 days in special management units (SMU). Id. at 58 tbl.13; see also GAO-13-429, Bureau of Prisons: Improvements Needed in Bureau of Prisons’ Monitoring and Evaluation of Impact of Segregated Housing, U.S. GOVERNMENT ACCOUNTABILITY OFFICE (2013), available at http://www.gao.gov/assets/660/654349.pdf. 127 This chart and discussion includes revised information provided by the Pennsylvania Department of Corrections on July 31, 2015.
ASCA-Liman National Survey Segregation revised distribution August 31, 2015
79

128 The questions included: “If an inmate’s sentence is ending, can he [or she] be moved out of administrative segregation before release?” The question may have not been sufficiently precise to clarify whether, as a practice, jurisdictions move individuals into general population to avoid direct release from isolation to the community. 129 In June of 2015, the Marshall Project, a nonprofit, nonpartisan news organization covering America’s criminal justice system, reported that it received information from 24 jurisdictions who released 10,000 prisoners directly from solitary in 2014. See MARSHALL PROJECT, Solitary to the Street, supra note 66. According to the author, the remaining 26 states and the Federal Bureau of Prisons did not have data on this practice, and hence, many more people may have been released directly to the community. Id. 130 For example, Colorado’s policy called for “a stabilization meeting with the appropriate Pre-Release Specialist, the assigned Case Manager, Community Re-Entry Specialist for the releasing location, assigned Community Parole Officer or, Community Parole Supervisor, Clinical staff (if appropriate), Inspector General staff (if appropriate) and the offender (if appropriate) to establish a Stabilization Plan.” Colo. Admin. Reg. 550-11, at IV.D.4, available at http://www.doc.state.co.us/sites/default/files/ ar/0550_11_060114.pdf. The policies of Louisiana and of South Dakota required notification to law enforcement and/or probation or parole officers, and Washington stated that it provided some community notice and sought to avoid “releasing inmates on public transport.” 131 Texas stated that it provided programs “to assist offenders in their transition to general population prior to release” and to the “street.” The Colorado Department of Corrections reported, “At the start of FY 2014, case managers began coordinating with Parole so that a Community Parole Officer was available to personally transport an offender who was releasing directly from administrative segregation to parole.” Rick Raemisch, SB 11-176 Annual Report: Administrative Segregation for Colorado Inmates: A Report Submitted to the Judiciary Committees of the Senate and House of Representatives, S.B. 11-176, COLORADO DEPARTMENT OF CORRECTIONS 8 (January 1, 2015), available at http://docz.io/ doc/118279/sb-11-176-annual-report---colorado-department-of-corrections; see also Laura Engleman & Maureen O’Keefe, Administrative Segregation for Colorado Inmates: A Report Submitted to the House and Senate Judiciary Committees, S.B. 11-176, COLORADO DEPARTMENT OF CORRECTIONS (January 1, 2013), available at http://www.doc.state.co.us/sites/default/files/opa/SB%2011-176%20Report%20Jan% 202013_0.pdf. Colorado has previously explained its policies, including that if prisoners were 180 days away from being released from segregation, they are placed in “a step-down program that connects them with case managers and mental health staff that help them adjust to social interaction.” See MARSHALL PROJECT, Solitary to the Street, supra note 66. 132 The Wyoming Department of Corrections provided additional information by email on July 20, 2015. 133 As noted, some jurisdictions used variations on the definition of administrative segregation. Thus, this discussion includes those jurisdictions, even as their counting methods may have resulted in over or under inclusion for some responses. 134 The survey we sent left the category “Other” open. The responses suggest that, in this questionnaire, “Other” referenced members of Indian tribes, or Alaska Native, Native Hawaiian or Other Pacific Islanders. Cf. Karen R. Humes, Nicholas A. Jones & Roberto R. Ramirez, Overview of Race and Hispanic Origin: 2010, U.S. CENSUS BUREAU 3 (March 2011), available at http://www.census.gov/prod/ cen2010/briefs/c2010br-02.pdf.
ASCA-Liman National Survey Segregation revised distribution August 31, 2015
80

135 This analysis includes information provided by the Oklahoma and Pennsylvania Departments of Corrections on August 3, 2015, and information from Alabama, Arkansas, and Arizona, provided by their Departments in March of 2015. 136 The U.S. Census Bureau reported that in 2013, African-Americans made up 49.5% of D.C.’s population. District of Columbia, U.S. CENSUS BUREAU (May 28, 2015), available at http:// quickfacts.census.gov/qfd/states/11000.html. 137 The U.S. Census Bureau reported that in 2013, African-Americans made up 6.5% of Wisconsin’s population. Wisconsin, U.S. CENSUS BUREAU (May 28, 2015), available at http://quickfacts.census.gov/ qfd/states/55000.html. 138 This analysis includes information provided by the Oklahoma and Pennsylvania Departments of Corrections on August 3, 2015 and by the Alabama, Arkansas, and Arizona Departments of Corrections in March of 2015. 139 If a jurisdiction provided demographic information for only 2011 or only 2014, the jurisdiction is not included in this comparison. 140 In the jurisdictions reporting this data, the percentages of Asian prisoners in the total male custodial population and in the administrative segregation population were roughly comparable. 141 In these states, no demographic category changed by more than 3% either in the segregated population or in the total custodial population during that 3-year period. 142 This analysis includes information provided by the Arkansas and Arizona Departments of Corrections in March of 2015. 143 The largest reported increase was in North Carolina. In the fall of 2011, North Carolina reported that 58.6% (106 out of 181 prisoners) of its male administrative segregation population was Black, and the total male custodial population was 58.2% (21,938 out of 37,680 prisoners) Black. Thus, 0.3% more Black men were in the administrative segregation population than the total male custodial population. In the fall of 2014, Black men were 67.1% of the male administrative segregation population (51 out of 76 prisoners); the total male custodial population was 56.1% Black (19,611 out of 34,947 prisoners). Thus, 11.0% more Black men were in the segregated population than the total male custodial population. 144 For example, the total number of individuals in administrative segregation declined substantially in Colorado over the 3 years while the percentage of Hispanic men compared to the total custodial population grew. In the fall of 2011, the male administrative segregation population in Colorado was 49.3% Hispanic (723 out of 1,466 prisoners) and the total male custodial population was 33.6% Hispanic (6,932 out of 20,631 prisoners); thus 15.7% more Hispanic men were in the male administrative segregation population than in the total male custodial population. In the fall of 2014, the male administrative segregation population was 51.2% Hispanic (106 out of 207 prisoners) and the total male custodial population was 32.3% Hispanic (6,136 out of 18,995 prisoners); thus, 18.9% more Hispanic men were in the male administrative segregation population than in the total male custodial population. 145 Michigan, for example, reported that, in the fall of 2011, its male administrative segregation population included 19.3% more Black men than did the total male custodial population (686 out of 936 prisoners, or 73.3%, for administrative segregation as contrasted to 23,000 out of 42,632 prisoners, or 54.0%, for the total male custodial population). In the fall of 2014, the male administrative segregation
ASCA-Liman National Survey Segregation revised distribution August 31, 2015
81

population included 17.3% more Black men than the total male custodial population (736 out of 1,032 prisoners, or 71.3%, for administrative segregation as contrasted to 22,090 out of 40,894 prisoners, or 54.0%, for the total male custodial population). Oregon reported that, in the fall of 2011, the male administrative segregation population included 5.6% more Hispanic men than did the total male custodial population (44 out of 211 prisoners, or 20.9%, in administrative segregation as contrasted with 1,872 out of 12,202 prisoners, or 15.3%, in the total male custodial population). In the fall of 2014, the male administrative segregation population had 1.6% less Hispanic men than the total male custodial population (28 out of 233 prisoners, or 12.0%, in administrative segregation as compared to 1,809 out of 13,341 prisoners, or 13.6%, in the total male custodial population). 146 This discussion includes information provided by the Arkansas and Arizona Departments of Corrections in March of 2015. 147 This discussion includes information provided by the Arizona Department of Corrections in March of 2015. 148 This discussion includes information provided by the Pennsylvania Department of Corrections on August 3, 2015 and the Arizona Department of Corrections in March of 2015. 149 The 2013 Liman Report on policies governing administrative segregation did address these questions, and we determined,
All [policies] appear to assume lawyer access to clients, and a few specify additional requirements or note opportunities for contact visits. Twenty states specifically provide inmates in administrative segregation units with access to religious personnel. In some instances, the focus is on institutional employees, such as chaplains. Arkansas, for example, specifies that chaplains visit ‘regularly and on request.’ Iowa provides that religious personnel may visit ‘upon request.’ Illinois, Indiana, Kentucky, Maine, and New York advise that the chaplain is to visit at least once a week. Minnesota authorizes a facility’s religious coordinator to make visits once a month. Nevada provides that visitation by religious personnel ‘will be encouraged and allowed.’
Liman 2013 Administrative Segregation Policies, supra note 72, at 18-19 (citing Florida, Fla. Admin. Code r. 33-602.220(5)(i); Maine, DOC 15.1(VI)(E)(2)(C); Oregon, OAR 291-127-0260; Washington, DOC 320.260(III)(A)(2); Alaska, DOC Policy 804.01(VII)(G)(2)(b)(4); Arizona, AR 911.05.1.4; Arkansas, AD 11-42(III)(C)(7)-(8); Iowa, HO-05(H)(2)(o)(i); Kansas, IMPP 10-110; Kentucky, CPP 10.2(II)(O); Maine, DOC 15.1(VI)(E)(2)(O); Maryland, DOC.100.0002(18)(F)(13)(a); Massachusetts, 103 CMR 421.20(7); Minnesota, DD 301.087(E)(18), 301.085(E); Missouri, IS21-1.2(E)10)(a); Nevada, AR 507 4(Q); New Hampshire, PPD 7.09 (IV)(L); New Jersey, ACSU Administrative Segregation Inmate Handbook; New Mexico, CD-143005(A)(CC); North Dakota, 5A-20(I)(2); Rhode Island, 12.02-2(III)(E)(7); South Dakota, DOC Policy 1.3.D.4(IV); Tennessee, DOC 506.16(VI)(E)(12); Virginia, OP 861.3(V)(D)(22)(a)). 150 For example, even when eligible, many prisoners have no one to visit them. See Grant Duwe & Valerie Clark, Blessed Be the Social Tie that Binds: The Effects of Prison Visitation on Offender Recidivism, 24 CRIMINAL JUSTICE POLICY REVIEW 271, 277 (2013); Gary C. Mohr, An Overview of Research Findings in the Visitation, Offender Behavior Connection, OHIO DEPARTMENT OF REHABILITATION & CORRECTION (2012), available at http://www.asca.net/system/assets/attachments/5101/Mohr%20-%20OH%20DRC%20Visitation%20Research%20Summary.pdf.
ASCA-Liman National Survey Segregation revised distribution August 31, 2015
82

151 The survey asked: “Are inmates permitted to be outside their cells for reasons other than showers, exercise, or programming?” Ten jurisdictions responded affirmatively, as detailed below.
Federal Bureau of Prisons: “Inmates are frequently moved to other areas of the facility for legal/social visits and medical appointments. Inmates may also use the unit’s law library. In addition, certain inmates may be evaluated and screened for employment as a range orderly.” Florida: “visitations, phone calls, work squad assignments.” Kentucky: “phone calls, visits, jobs.” Louisiana: “Telephone calls, visits, and medical callouts. Offenders housed in the Working Cellblock also perform janitorial work on the unit.” Nebraska: “Inmates can be out of cell on passes, as part of the levels program they can earn additional out of cell time and we have inmates within restrictive housing who serve as porters.” North Dakota: “janitors.” South Dakota: “Level 4 offenders have non-paid work assignments on the unit. Level 5 offenders can eat meals out of cell and have non-paid work assignments on the unit.” Virginia: “work, medical, school/program, mental health – all depending on level of step down.” Washington: “In some instances offenders assigned to MAX custody have work assignments in the unit (allowed to be porters in the units where they’re housed.).” West Virginia: “janitorial duties.”
152 The difference between the weekday and weekend breakdowns reflects that North Dakota reported a single number for weekday hours and a range for weekend hours. 153 The responses from those twelve were:
Delaware: “Prisoners spend between 21 and 23 hours in cell on weekdays and weekends depending on the level received from quality of life review and staffing levels.”
Federal Bureau of Prisons: “Prisoners spend a maximum of 23 hours per day in cell.”
Florida: “Level-1 prisoners spend 24 hours in cell minus exercise time. Level-2 prisoners spend 24 hours in cell minus exercise and 4 hours out of cell, 2 times per week. Level-3 prisoners spend 24 hours in cell minus exercise, some work assignments, and 4 hours out of cell, 5 times per week.”
Kansas: “Prisoners spend up to 23 hours in cell on weekdays and weekends.”
Kentucky: “Prisoners spend a maximum of 23 hours in cell on weekdays and it varies on weekends.”
ASCA-Liman National Survey Segregation revised distribution August 31, 2015
83

Nebraska: “Prisoners spend up to 23 hours in cell, depending on a number of factors including status in the levels program and programming needs.”
New York: “Prisoners receive 1 hour of out-of-cell exercise daily and are thereby confined for 23 hours. A pilot program exists where prisoners can earn additional out-of-cell time.”
North Dakota: “Prisoners spend 23 hours in cell on weekdays and 24 hours in cell on weekends unless the prisoner is at Level 4. Prisoners at Level 4 spend 23 hours in their cells on Saturday. They are afforded 1 hour of out-of-cell recreation. On Sunday they are in their cells for 24 hours.”
Ohio: “Prisoners spend between 21 and 23 hours in cell. In general, prisoners are provided one hour of recreation and about 30 minutes for shower/hygiene. On weekends, it could be less. Some prisoners receive out-of-cell time for programming or jobs.”
Pennsylvania: “Prisoners spend 23 hours per day in cell unless they are seriously mentally ill. Seriously mentally ill prisoners receive more time out of cell.”
South Dakota: “Prisoners spend between 21 and 22.5 hours in cell. Prisoners receive more out-of-cell group programming time as they move up in the levels system. Additionally, prisoners receive more recreation time as they move up in the levels system. Level-1 prisoners receive 60 minutes of recreation, 3 times per week. Level-2 and Level-3 prisoners receive 60 minutes of recreation, 5 times per week. Level-4 prisoners receive 60 minutes of recreation, 7 times per week. Level-5 prisoners receive 75 minutes of recreation, 7 times per week.”
Washington: “Prisoners are provided at least 1 hour of recreation 5 days a week and a shower at least 3 times a week. Additional out of cell time can occur if a prisoner is participating in out-of-cell programming. Prisoners that are participating in several out-of-cell programs can increase out-of-cell time by 3 to 6 hours per week. Prisoners who earn visitation can receive visits for up to 3 hours per week, and can utilize the legal law computer out-of-cell.”
154 Prisoners in New Jersey received 5 hours of exercise out-of-cell each week, and additional time for showers and medical appointments. Missouri was among the jurisdictions that reported keeping prisoners in their cells for the greatest number of hours per day. Missouri stated that prisoners were permitted to be out of the cells once every 3 days for showers and recreation, as well as out-of-cell time for medical appointments, and on Fridays, Saturdays, and Sundays if they had a scheduled family visit. Thus, if prisoners had no medical and mental health appointments or visits, they were confined to their cell for 24 hours every 2 out of 3 days. 155 The responses from Colorado (22 hours and 40 minutes) and Wyoming (22 hours and 44 minutes) were rounded to 23 hours. 156 Wyoming, which reported that prisoners spent 22 hours and 44 minutes in cell on weekdays and 23 hours on weekends, is included as part of the 14, as we rounded up to the nearest hour. 157 As noted, supra note 103, two jurisdictions (Indiana and Texas) indicated that they did not consider prisoners in double cells to be in “administrative segregation.” 158 These dimensions were reported by Iowa. In its report, the Vera Institute described a typical cell as “six by eight feet.” VERA INSTITUTE, SOLITARY CONFINEMENT, supra note 14, at 8. Also recall that two jurisdictions excluded data on double-celled prisoners. See note 103, supra.
ASCA-Liman National Survey Segregation revised distribution August 31, 2015
84

159 Both of these dimensions were reported by Oklahoma. 160 The 2 jurisdictions reporting that cells did not have natural light were Iowa and Oklahoma. The questions on lighting were: “Do cells in administrative segregation have natural light?” and “Does an inmate control his own in-cell lighting?” The survey did not ask for descriptions of the source of natural light in the cells nor the dimensions of the windows. 161 Hawaii was the one jurisdiction reporting that it did not provide heating. 162 We did not inquire about the availability of special diets, for religious or other purposes. 163 In South Carolina, prisoners’ purchases were restricted to a Walkman radio, ear buds, and batteries. 164 This information was updated on August 13, 2015 by the Michigan Department of Corrections to clarify that religious items, “such as tefillin or crucifixes,” were not permitted in cells. 165 This information was updated on July 30, 2015. Florida stated that CM (Close Management) inmates can have up to 50 photographs, unless there is an indication of a security problem, and cited FAC 33-601.800. 166 Wyoming permitted prisoners in long-term administrative segregation to possess a PlayStation. 167 Oregon and the District of Columbia did not report providing outdoor exercise space. 168 For the purposes of this section, if a jurisdiction permitted some prisoners to participate in a given activity when reaching a step level, those jurisdictions were classified as permitting that activity. 169 In the survey, Colorado indicated that the number in the facility was 207, as detailed in the Table; a response to another question suggested that the number at the facility was 201. 170 Among these thirteen jurisdictions, one jurisdiction (the BOP) reported unlimited showers because the showers were located within the cells. In addition, West Virginia, indicated in March 2015 that procedures require three showers a week but normal operations typically permit up to five showers a week. 171 See Boudin, Stutz & Littman, supra note 92. That report was published as part of a symposium, and discussion of the findings came from David Fathi, An Endangered Necessity: A Response to Prison Visitation Policies: A Fifty-State Survey, 32 YALE LAW & POLICY REVIEW 205 (2013-2014); Philip M. Genty, Taking Stock and Moving Forward to Improve Prison Visitation Practices: A Response to Prison Visitation Policies: A Fifty-State Survey, 32 YALE LAW & POLICY REVIEW 211 (2013-2014); Giovanna Shay, Visiting Room: A Response to Prison Visitation Policies: A Fifty-State Survey, 32 YALE LAW & POLICY REVIEW 191 (2013-2014); Ashbel T. Wall, II, Why Do They Do It That Way?: A Response to Prison Visitation Policies: A Fifty-State Survey, 32 YALE LAW & POLICY REVIEW 199 (2013-2014). Others have studied the role that visits play in prison management when individuals are detained and in terms of reentry to communities upon release. See Duwe & Clark, supra note 152; Mohr, supra note 152. 172 Liman 2013 Administrative Segregation Policies, supra note 72, at 18-20. For example, at the time:
ASCA-Liman National Survey Segregation revised distribution August 31, 2015
85

Connecticut, New Jersey, Tennessee, and Washington limit visitors, for some kinds of segregation, to ‘immediate family’ or ‘relatives.’ Oregon limits an inmate to two people on the visitation list at any given time, while Mississippi limits an inmate to ten visitors. Two states have special provisions for visits between inmates and their children. In Oregon, an inmate’s children are exempt from the total of the two listed visitors permitted, a set whose composition can change at six-month intervals. In New Hampshire, inmates who give birth are allowed two additional visits per week with their newborn children for a period of time after the birth.
Id. at 19; see also Connecticut, Northern Correctional Institution Administrative Segregation Program Description; New Jersey, ACSU Administrative Segregation Inmate Handbook; Tennessee, DOC 506.16(VI)(E)(1); Washington, DOC 320.260(III)(A)(2); Oregon, OAR 291-127-0260(6); Mississippi, SOP 19-01-01; New Hampshire, PPD 7.09(IV)(A)(2). 173 Twelve of those states required that, “for inmates in administrative segregation, advance permission for personal visits be requested from the warden, superintendent, or other correctional officer. Those policies typically do not provide guidelines for making such decisions.” Liman 2013 Administrative Segregation Policies, supra note 72, at 20. 174 Liman 2013 Administrative Segregation Policies, supra note 72; see also Boudin, Stutz & Littman, supra note 92. 175 This information was updated on July 30, 2015 by email from South Dakota’s Department of Corrections, which explained: “As of the time we completed the survey it was our intent and design to not allow visits for level 1 Restrictive Housing offenders. However, in practice, that was never implemented. All Restrictive Housing offenders have been allowed a minimum of one visit/week. Our policy is being changed to reflect this practice.” South Dakota also reported that “prisoners at the highest level can receive the same visit privileges as the general population, which is seven days per week, for three hour periods each of those days.” It further explained that “offenders could have more than one visit each day (during their 3 hour visit period) should multiple parties choose to visit at different times. We do not limit the number of immediate family members on the list and each visitor could come twice per week during the daily visit periods offered.” 176 Jurisdictions that responded that they permitted 1 visit per week are listed as permitting 4 visits per month. Likewise, jurisdictions that indicated they permitted 4-5 monthly visits, depending on the number of weeks in the month, are listed as providing 4 visits per month. 177 Mississippi indicated that prisoner could receive 1 visit each quarter of the year, and therefore we rounded the number to 90 days. 178 Ohio explained in March of 2015: “We chose only to highlight one prison, because restrictive housing is spread throughout all the prisons and all of them have different allowances. . . . Once again, it is important to note there is substantial variation in this regard as well. It is all based on the capabilities of the prison where the inmate is housed.” 179 Arizona added, in its clarifications in March of 2015: “Visits are a little bit different. Max custody is 1 visit per week for 2 hours. You have to call and make an appointment, sometimes you can’t get an appointment because there aren’t any available. In restrictive status housing area, in first 2 steps you can’t get any visits. In the 3rd step you can have 1 visit. About 60 inmates in it, most have ever had is 80. New program.”
ASCA-Liman National Survey Segregation revised distribution August 31, 2015
86

180 The high costs of phone calls from prison have been criticized as one of the reasons it is difficult for prisoners to keep in touch with families. “Talking to a brother, son or father behind bars can incur an upfront fee as high as $4.99; per-minute charges may reach $0.89. Americans at liberty, even if they don’t have Skype, can easily get unlimited domestic calls for $9.99 a month. That would buy one six-minute call from a state prison in Georgia to a neighboring state.” Cell Phones: Why Does It Cost So Much for Prisoners To Keep in Touch with Their Families?, ECONOMIST, May 25, 2013, available at http://www.economist.com/news/united-states/21578411-why-does-it-cost-so-much-prisoners-keep-touch-their-families-cell-phones. In response, the Federal Communications Commission enacted rules, effective in February of 2014, to reform the Inmate Calling Service rates. These rules establish new rate caps of $0.25 per minute for collect calls and $0.21 per minute for debit or pre-paid calls; the result would be that, for a fifteen minute call, the price was $3.75 for a collect call and $3.15 for a debit or a pre-paid call. Inmate Telephone Service, FEDERAL COMMUNICATIONS COMMISSION (March 5, 2014), available at https://www.fcc.gov/guides/inmate-telephone-service. 181 Texas, which reported it permitted one call per 90 days, also stated that it was limited to 5 minutes. 182 In Oklahoma, prisoners could place a 15-minute phone call by requesting to do so from unit staff. In step 1, they only could have a legal and religious number, with social numbers increasing after step one. 183 Jurisdictions that responded that they permitted 1 phone call per week are listed as permitting 4 phone calls per month. 184 The reported method was to make calls during recreation periods. 185 The survey did not ask questions about how social correspondence was monitored. The responses indicated that legal correspondence was opened in the presence of the inmate. The survey also did not ask about prisoner access to email. 186 That jurisdiction was Mississippi, responding that a “lawyer can visit an inmate if the inmate has a case or pending case against MDOC or a facility.” It is unclear how lawyers assisting on prisoner petitions seeking to overturn convictions or sentences would be classified under this approach. 187 According to the 2013 Liman Report,
Seventeen jurisdictions do not specify whether visits are contact or non-contact. Twenty-two states bar contact visits for all or part of the administrative segregation population. . . . Eleven states permit personal contact visits for inmates in administrative segregation. Ten of those states authorize the warden or designee to determine whether the visit is contact or non-contact.
Liman 2013 Administrative Segregation Policies, supra note 72, at 19 (citing Alabama, AR 303(V)(C); Federal Bureau of Prisons, P5217.01(5)(a)(10) (“inmates may be provided non-contact visits, through the use of videoconferencing or other technology”); Delaware, DOC Policy 4.3(VI)(D); Georgia, SOP IIB09-0001(VI)(E)(5); Idaho, SOP 319.02.01.001(18); Kansas, IMPP 20-101 (III)(B); Kentucky, CPP 10.2(II)(I)(6), 16.1(II)(G)(2); Massachusetts, 103 CMR 421.20(7); Maryland, DOC.100.0002(18)(F)(12); Montana, MSP 3.5.1(III)(G)(2)(l); New Hampshire, PPD 7.09 & PPD 7.49(IV)(Q); North Dakota, 5A-20(H)(2); Ohio, AR 55-SPC-
ASCA-Liman National Survey Segregation revised distribution August 31, 2015
87
02(VI)(A)(14); Oklahoma, OP-040204(V)(A)(12); Rhode Island, 12.02-2(III)(E)(2); West Virginia, PD 326.00(V)(B)(18); Arizona, DO 911.05.1.3.1; California, Cal. Code Regs. tit. 15 § 3343(f)(SHU only); Colorado, AR 650-03(IV)(F)(1)(j); Connecticut, Northern Correctional Institution Administrative Segregation Program Description; Hawaii, Maximum Control Unit Functions; Illinois, Ill. Admin. Code tit. 20, § 505.80; Maine, DOC 15.1(VI)(E)(2)(C); Michigan, PD 05.03.140(CC); Minnesota, DD 301.087(E)(11); Mississippi, SOP 19-01-01; Missouri, IS21-1.2(III)(E)(10)(a); Nebraska, AR 210.01(J) (intensive management only); New Jersey, ACSU Administrative Segregation Inmate Handbook; New Mexico, CD-143005(D)(5)(A); North Carolina, C.1215; New York, 7 NYCRR 1704.7(d); Oregon, OAR 291-127-0260(6); Pennsylvania, DC-ADM 802(§3)(A)(2)(d); Rhode Island, 15.11-3 DOC (III)(D) (Category C inmates); South Dakota, DOC Policy 1.3.D.4 & 1.5.D.1; Virginia, OP 861.3(V)(D)(16); Vermont, DOC 410.06 (Phase I, “where facility design allows”); Washington, DOC 320.260(III)(A)(2); Wyoming, P&P 5.400(IV)(K)(1)(iv); Alaska, DOC 810.02(VII)(C)(2); California, Cal. Code Regs. tit. 15 § 3343(f) (unless SHU); Florida, Fla. Admin. Code r. 33-602.220(5)(i); Indiana, DOC Policy 02-01-111(IX)(E); Iowa, IO-HO-05(IV)(H)(2)(o)(ii); Kentucky, CPP 16.1; Nebraska, AR 210.01(J)(unless intensive management/SMU); Nevada, AR 507(4)(E); Tennessee, DOC Policy 506.16(Procedures)(E)(1) & 507.01.1; Vermont, DOC 410.06 (Phase II, at facilities with non-contact capability); Wisconsin, Wis. Admin. Code DOC §§ 309.09(4) & DOC 309.11(1)). 188 Nebraska reported that it offered a program focused on the life of Malcolm X, which was administered at the Omaha Correctional Center in collaboration with the Nebraska Department of Correctional Services and the University of Nebraska Omaha. Transformation Project Helping People Change, UNIVERSITY OF NEBRASKA FOUNDATION (February 14, 2011), available at https://nufoundation.org/-/article-transformation-project-helping-people-change. The 12-week program related to 6 areas called “stability domains”: education, housing, positive social networks, physical health, substance abuse issues, and employment. Id. Each week, prisoners learn practical skills like how to set and reach goals, how to write resumes, and how to budget their money. In the overall description of the many jurisdictions, information about Wyoming was updated on July 20, 2015. 189 These data were specific to the facility that houses the largest number of prisoners in administrative segregation. 190 In the 2014 Senate Hearing, the President of the AFSCME Texas Correctional Employees, Local 3807, submitted a statement calling for changes in the use of administrative segregation as a way to improve the situation of both staff and inmates. Reassessing Solitary Confinement II – The Human Rights, Fiscal, and Public Safety Consequences: Hearing Before the Senate Judiciary Committee’s Subcommittee on the Constitution, Civil Rights and Human Rights, 113th Cong. (2014) (testimony of Lance Lowry, President, AFSCME Local 3807 Texas Correctional Employees), available at http://solitarywatch.com/wp-content/uploads/2014/02/Lance-Lowry-Senate-Hearing-Submission.pdf. 191 Wisconsin used the daily form; the quote comes from South Dakota’s step-down program policy. 192 Of the 30 jurisdictions that reported having prisoners on death row, 2 were not included in the subsequent analysis for how those death row prisoners are housed. North Carolina did not answer this question, and Utah was excluded because it provided 2 conflicting responses. 193 Two states (North Carolina and Tennessee) that have death penalties did not respond to this question; as part of an ongoing project to learn more about the housing of death-sentenced inmates, the Liman Program learned that North Carolina houses its death-sentenced inmates separately from general
ASCA-Liman National Survey Segregation revised distribution August 31, 2015
88

population but in a fashion comparable to that of general population. Additional information can be found at: Death Row and Death Watch, NORTH CAROLINA DEPARTMENT OF PUBLIC SAFETY (February 25, 2014), available at https://www.ncdps.gov/Index2.cfm?a=000003%2C002240%2C002327. 194 Note that 37 jurisdictions provided information about data tracking, but because jurisdictions were asked to “check all that apply” and not every jurisdiction provided information for every data category, answers to individual questions do not always sum to 37. 195 The 3 were Florida, Massachusetts, and Mississippi. 196 In this number, we included Alaska, which answered “Frequent reviews,” and Kansas, which answered “Review process.” 197 Appendix D provides the questions asked. 198 This information was updated in light of an email on August 7, 2015 from Missouri’s Department of Corrections, which also noted its plans to “reduce the use of administrative segregation” through a “gradual” process “to ensure safety of staff and offenders.”
ASCA-Liman National Survey Segregation revised distribution August 31, 2015
89