time motion analysis of international rugby. riaan
TRANSCRIPT
Time motion analysis of international rugby.
RIAAN SCHOEMAN
In fulfillment of the degree
MAGISTER ARTIUM (SPORT SCIENCE)
In the
Faculty of Humanities
(Department of Exercise and Sport Sciences)
At the
University of the Free State
Study Leader: Dr F.F. Coetzee
Bloemfontein
November 2010

Time motion analysis of International rugby
i
ACKNOWLEDGEMENTS
• I would like to thank Dr Derik Coetzee for all his help and motivation to
finish this degree.
• I would also want to extend a word of thanks to Mr Willie Maree for the
data collection from ProZone.
• Thank you to Miss Maryn Viljoen for the statistical analysis of the data.
• To my parents who always stand by me, help me and love me. I
appreciate it and I will always be thankful for everything you have done
for me.
• I would also thank Miss Ilse van Dyk who helped to linguistically
correct the document.

Time motion analysis of International rugby
ii
TABLE OF CONTENT
List of tables v List of figures vii Declaration viii 1. CHAPTER 1 – Introduction and problem statement 1
1.1. Background………………………………………………………………1 1.2. Formulation of problem…………………………………………………2
1.3. Primary objective……………………………………………………......3
2. CHAPTER 2 – Literature review 4 2.1. Description of time motion analysis……………………………………4
2.2. Description of rugby union……………………………………………...6
2.3. Physical capacities of rugby players…………………………………..8
2.3.1 Anthropometry……………………………………………......11
2.3.2 Maximal oxygen uptake……………………………………...14
2.3.3 Anaerobic performance……………………………………...16
2.3.4 Muscle strength and power………………………………….17
2.3.5 Speed………………………………………………………….18
2.3.6 Seasonal variations in physiological and anthropometric
characteristics………………………………………………...24
2.3.7 Positional profiling……………………………………………25

Time motion analysis of International rugby
iii
2.4. Components of importance for rugby fitness………………………..27
2.4.1 Distance covered…………………………………………….30
2.4.2 High-intensity distance covered…………………………….33
2.4.2.1 Utility movements…………………………………..39
2.4.2.2 Rucking and mauling……………………………….39
2.4.2.3 Tackling……………………………………………....40
2.4.2.4 Scrummaging………………………………………..40
2.4.3 Percentage work rate/ratio at high-intensity……………....41
2.4.4 Work-to-rest ratios…………………………………………...42
2.4.5 Implications for fitness training……………………………..45
2.5. Differences between levels of competitions………………………….48
2.6. Variables that affect player characteristics and match activities…..50
2.6.1. Magnitude of the game………………………………………51
2.6.2. Law variations………………………………………………...51 2.6.3 Game structure……………………………………………….53
2.6.4 Weather conditions…………………………………………..53
2.6.5. Home and away games……………………………………..53
2.6.6. Competition structure………………………………………..55
3. CHAPTER 3 – Methodology 56
3.1. Method…………………………………………………………………...56
3.2. Subjects……………………………………………………………….....56
3.3. Protocol…………………………………………………………………..56
3.4. Equipment…………………………………………………………….....57
3.5. Procedure………………………………………………………………..57
3.6. Statistical analysis………………………………………………………57

Time motion analysis of International rugby
iv
4. CHAPTER 4 – Results 58 4.1. Introduction………………………………………………………………58
4.2. Results…………………………………………………………………...58
5. CHAPTER 5 – Discussion 67
5.1. Introduction………………………………………………………………67
5.2. Discussion……………………………………………………………….67
5.2.1 Home and away games……………………………………67
5.2.2 Distances covered………………………………………….68
5.2.3 High intensity distance covered…………………………..69
5.2.4 The percentage work rate at high intensity……………...69
5.2.5 Correlation of variables with winning and losing………..70
5.2.5.1 Team correlation with winning and losing………..70
5.2.5.2 Positional correlation with winning and losing…...70
5.3. Overview…………………………………………………………………71
5.4. Recommendations……………………………………………………...72
6. CHAPTER 6 – Summary and conclusions 73
6.1. Introduction………………………………………………………………73
6.2. Summary…………………………………………………………………73
6.3. Conclusion……………………………………………………………….74
6.4. Limitations………………………………………………………………..74
6.5. Practical applications…………………………………………………...75
REFERENCES 76 APPENDICES 85
Time motion analysis of International rugby
v
LIST OF TABLES Table 1: Measures of match participation…………………………………..11
Table 2: Anthropometric characteristics of rugby players…………………13
Table 3: Maximal oxygen uptake (VO2 max) of rugby union players………16
Table 4: Percentage sprints involving ball possession…………………….20
Table 5: Seasonal variations in physical capacities of rugby players…...25
Table 6: The effects on player stature and mass, (NZ players only)
(mean changes with 90% confidence limits)…….………………..27
Table 7: Distances covered by positional groups, (mean ± sxÅ) ………..35
Table 8: Number of match activities for 1995 and 2004, (predicted
values n ± standard deviation)……………………………………...36
Table 9: Effects on the number of match activities, (mean changes with
90% confidence limits)………………………….…….……………..41
Table 10: Analysis of repeated high-intensity activity observed...………….44
Table 11: Effects on points and penalty activities, (mean changes
with 90% confidence limits).…………………..…………………….50
Table 12: Super 12 home advantage estimates …………….……………….55
Table 13: Percentage of home and away games won or lost..................….58
Time motion analysis of International rugby
vi
Table 14: Summary of all positions for the distance covered, high intensity
distance covered and percentage work rate at high intensity for
winning and losing teams……………………………………………60
Table 15: Team averages of losing and winning teams…………….……….61
Table 16: Standard deviation and means for losing teams………………….62
Table 17: Standard deviation and means for winning teams………………..63
Table 18: Pearson correlation coefficients…………………………………….64 Table 19: Values of all variables between winning and losing……………...65
Table 20: Components won versus the score………………………………...66

Time motion analysis of International rugby
vii
LIST OF FIGURES
Figure 1: Rugby positions…………………………………………………………7
Figure 2: The percentage of sprints performed in offensive and defensive
play for Super12 forwards and backs………………………………..22
Figure 3: The percentage of sprints commenced from different starting
speed for Super12 forwards and backs…………………..…………22
Figure 4: The percentage of sprints performed in relation to the proximity of
the opposition for Super12 forwards and backs……………………23
Figure 5: The percentage of sprints involving a change of direction for
Super12 forwards and backs…………………………………………23
Figure 6: Distance travelled for ‘running work’ over each 10-min period of
match-play……………………………………………………………...32
Figure 7: Time spent performing work activities during each 10- min period of
match-play……………………………………………………………...32
Figure 8: Comparisons of total match time with player match time………….37
Figure 9: Comparisons of mean body mass of forwards and backs………...37
Figure 10: Frequency of scrums since 1975 – 2005…………………………...38
Figure 11: Comparisons of line outs won on own throw from 1975 to 2005……………………………………………………………………..38
Figure 12: Freqeuncy of rucks and mauls from 1975 to 2005…………………39
Time motion analysis of International rugby
viii
DECLARATION
I, Riaan Schoeman, hereby declare that the work on which this dissertation is
based is my original work (except where acknowledgements indicate otherwise)
and that neither the whole work nor any part of it has been, is being, or is to be
submitted for another degree in this or any other university.
No part of this dissertation may be reproduced, stored in a retrieval system, or
transmitted in any form or means without prior permission in writing from the
author or the University of the Free State.
____________________________
(Signature)
____________________________
(Date)

Time motion analysis of International rugby Chapter 1
1
CHAPTER 1 Introduction and problem statement
1.1 Background
Time motion analysis is an effective method of quantifying the demands of rugby
and provides a conceptual framework for the specific physical preparation of
players (Deutsch, Kearney, & Rehrer, 2002:160-166). Now more than ever,
players need coaching in weaknesses and strengths to create an even more
conditioned individual to perform in the professional era. It is no longer an opinion
that the game of rugby has changed over the last 20 years, it is a fact, and the
game today is quicker, more demanding and a lot more entertaining.
Calculating the frequency, mean duration and total time spent in activities is
fundamental in time motion analysis. Another measure of interest is the distance
covered during a game (McLean, 1992:285-296). Detailed information on the
movements in a game provides comprehensive assessment of the demands of
competition and assists in developing specific training regimes.
Recent research on Super 12 Rugby quantified the proportions of work activities
into discrete movements (Deutsch, et al., 2002:160-166). Previous investigators
have not examined the total time, frequency and mean duration of movements of
Super 12 players in competition. (Hughes & Blunt, 1998:184-190) advises that
this lack of data on elite players and rule modifications since the publication of
most previous studies make a comprehensive time motion analysis of elite rugby
timely.
The methodology of establishing the physiological requirements of rugby
competition warrants careful consideration because estimating distance covered
and monitoring heart rate during competition pose logistical difficulties for
investigators. Detailed descriptive analysis of the occurrence of these activities

Time motion analysis of International rugby Chapter 1
2
during competition will assist coaches and conditioning staff in the prescription of
training for forwards and backs. Furthermore, quantifying movement patterns
over an entire game may provide insight into any fatigue-related changes in
performance between the first and second half.
These trends have been driven by recent advances in physical preparation and
highlight the need for a detailed analysis of contemporary rugby at the elite level.
Therefore; it must be argued whether there is a correlation between the
movement patterns, High Intensity distance covered or distances of jogging and
walking, to the success and winning ratio of a team.
1.2 Formulation of problem
Calculating the frequency, mean duration and total time spent in activities are
fundamental in time motion analysis (McLean, 1992:285-296). Involvement in
professional rugby league competition requires intermittent bouts of complex
high-intensity movements interspersed with periods of low-intensity activity
(Brewer & Davis, 1995:129-135). The extent of these changes has, however,
never been quantified. Van den Berg (2007:62-64) states: “What is even more
important is that their impact on the playing of the game has not been evaluated”.
The question must be asked: “Which variable correlate the highest with success”.
All possible research is needed to provide adequate information to players in
assisting them to perform well. Unfortunately, authors of previous studies did not
analyze the whole game but only certain aspects of the game totaling only 35
minutes out of the 80 minutes.

Time motion analysis of International rugby Chapter 1
3
1.3 Primary objective
This research will attempt to identify statistics in the game of rugby that
discriminate between winning and losing teams, and provide a meaningful body
of data to determine winning and losing components that jeopardize matches at
senior international level through specific movement patterns that was provided
by time motion analysis. The main focus will be on the distance covered, high-
intensity distance covered, and the percentage work rate/ratio at high-intensity
and which of these variables correlates the highest with success.
The purpose of this study is:
1. To determine the total distance covered, high – intensity distance covered
and the percentage work rate/ ratio high intensity of the different positions
(props, locks, hookers, loose forwards, inside backs and outside backs in
an international game of rugby.
2. To determine if there are significant differences (p < 0.05) between these
variables and the different positions.
3. To determine if there are significant differences (p < 0.05) in distance
covered, high – intensity distance covered and the percentage work rate/
ratio at high intensity of the different positions (props, locks, hookers,
loose forwards, inside backs and outside backs) between the winning and
losing teams.
4. To determine which of these variables correlates the highest with success.

Time motion analysis of International rugby Chapter 2
4
CHAPTER 2 Literature review 2.1 Description of time motion analysis
Time motion analysis involves video recording match play that is later analyzed
by the researcher with the use of computer program software that can track
several different movement categories. Video recording is optimal for complex
movement pattern analysis as it can be slowed down or repeated as needed
(Roberts, Trewartha, Higgitt, El-abd & Stokes, 2008:825-833). Individuals are
normally filmed throughout an entire game providing a continuous recording of
the frequencies, mean and total durations in each activity and allows for work
rate and percent game calculations.
In rugby, however, the frequent bouts of physical contact make physiological
data especially difficult to collect given the intrusive nature of blood sampling and
the problems associated with players carrying instrumentation. Therefore, one of
the most effective methods with which to quantify activity in rugby union is time –
motion analysis. This technique can be used by the researcher to quantify the
type, duration, and frequency of discrete movements making up the intermittent
activity patterns in team sports. In addition to using time – motion data to improve
training specificity, there is also a need to accurately quantify match demands for
the purposes of designing more specific exercise protocols that allow the
investigation of issues specific to rugby union (Roberts; et al., 2008:825-833).
Traditionally, time–motion analysis data have been presented in terms of mode,
frequency, and duration of activity. These activities are most often classified as
standing, walking, jogging, cruising, sprinting, and static intense activity
(Deutsch, Maw, Jenkins, & Reaburn, 1998:160-166; Duthie, Pyne, & Hooper,
2003:973-991; McLean, 1992:285-296).
Time motion analysis of International rugby Chapter 2
5
Time motion analysis is a time-consuming process inherently prone to
measurement error. This is because observations are influenced by an
observer’s knowledge, perceived seriousness of competition, focus of attention,
state of arousal and priming for anticipated events (McKenzie, Holmyard &
Docherty, 1989:101-113). Researchers using time-motion analysis have typically
reported the reliability of their methods, although none have reported the Typical
Error of Measurement (TEM) that is a mandatory requirement in other
physiological tests (Hopkins, 2000:1-15). Reliability is an assessment of the
consistency of a measure and is usually determined by testing and then retesting
individuals under the same conditions. In one time-motion analysis report, inter-
tester reliability was established by analyzing 5 minutes of footage twice (r =0.98-
0.99). (Docherty, Wenger & Neary, 1988:269-277).
Rugby analysts have used the repeated measurement method for a single
individual to identify within-observer reliability, reporting a standard deviation of
1.3m for distance travelled during the game; and 0.09 seconds for the duration of
activity (McLean, 1992:285-296). Increasing the data on elite rugby players’
movement patterns is essential for improved knowledge of the demands of the
game.
The most recent time motion analysis study completed was by Roberts et al.,
(2008:825-833) on elite English rugby match play (n=29). This study
implemented a new system involving 5 stationary cameras that covered different
areas of the field. The data was then reconstructed into a two dimensional plane
where player movement was recognized and measured by a specific analysis
program based on speed of movement. The purpose of the study was to assess
the physical demands of the match specific to position but in a more accurate
and reliable way than in previous studies. This is the first study to concentrate on
changes in high intensity running through out an entire match with focus on
distances covered. Results showed that the backs covered more total distance
during a match as a result of more distance covered walking and high intensity

Time motion analysis of International rugby Chapter 2
6
running than forwards. The whole match was separated into 10 minute intervals
and compared for distances traveled in order to observe a possible fatigue factor.
The first ten minutes was shown to cover more total distance than the 5th and
7th ten minute interval however the extra distance in the first ten minutes was
completed at a lower intensity therefore not a factor of fatigue. In summary, male
rugby time motion analysis studies all suggest significant variance between
forwards and backs and a contribution from all three energy systems, with the
majority of studies suggesting that the anaerobic systems played a more
predominant role. Generally, backs covered more distance in a game, had longer
rest periods and spend more time sprinting. Forwards performed more work
activities due to intense non-running exertion and had shorter periods of
recovery.
2.2 Description of rugby union
Since rugby union became professional in 1995, the science examining the sport
and its participants have developed rapidly to meet the increased demand for
knowledge on the requirements of the game and the characteristics of the
players. Rugby is played throughout the world, with the International Rugby
Board encompassing 92 national unions. The game is played over two 40-minute
halves separated by a break no longer than 10 minutes. There are no stoppages,
except in the event of an injury. Rugby is a field-based team sport eliciting a
variety of physiological responses as a result of repeated high intensity sprints
and a high frequency of contact. The physiological demands of rugby union, like
other football codes, are complex when compared with individual sports (e.g.
running, cycling, swimming), (Reilly, 1997:83-101). Detailed assessment of the
demands of rugby are lacking despite investigations on the movement patterns
during match play, physiological measurements taken during a match or
simulated match play, and the assessment of physiological capacities of elite
players.

Time motion analysis of International rugby Chapter 2
7
Rugby is one of the most popular team sports in the world today. In spite of the
popularity of the sport, very few researchers have until now focused on the
characteristics of a competitive rugby match (Nicholas, 1997:375-396).
Professional rugby union is an arena where the players have to exhibit not only
skill but also a fitness level that is above normal for the general population. Each
player in the team can be seen as performing a different role and therefore has
different requirements for fitness and training levels.
Two teams contest play, each with 15 players on the field at one time, with the
exception of players being sent off for misconduct. Each player has a designated
position and number outlined by the International Rugby Board; (Also shown in
figure 1), (1) loose head prop; (2) hooker; (3) tight head prop; (4) left lock; (5)
right lock; (6) left flanker; (7) right flanker; (8) number eight; (9) scrum half; (10)
fly half; (11) left wing; (12) left centre; (13) right centre; (14) right wing; (15)
fullback.
Figure 1: Rugby positions
Time motion analysis of International rugby Chapter 2
8
According to Spamer, Pienaar & Van der Merwe (1998:61-75) different activities
and movements of a rugby game can be divided into two categories, namely
organized and general play. Line-outs, scrums, place and drop kicks are among
other activities that are placed under the organizational play category. Facets
that fall under the category of general play include broken play and tackling.
Tackling is also regarded as a critical component for the success in the game of
rugby. Rugby players are required to have well-developed physical performance
and anthropometric qualities, combined with a wide range of offensive and
defensive skills.
The different standards of competition have similar game-specific skills and
physical demands during a match; there is however variation within a match
according to standard.
2.3. Physical capacities of rugby players
Rugby players have a diverse range of physical attributes. A distinct physique will
naturally orientate a player towards a particular position over others. This makes
rugby an atypical sport when compared with a number of other team sports
where homogeneity of physique and physical performance attributes are more
common (Quarrie, Handcock. & Toomey, 1996:53).
The implementation of field and laboratory testing allows for the examination of
adaptations to training, assessment of training programmes, evaluation of player
qualities, talent identification, prescription of training, and prediction of
performance (Van der Field, 1975:14). Such data also compliment information
gathered from game analysis.
Since becoming a professional sport in 1995, the game of rugby union has
changed and become more “open” with more sprints and fewer scrums (McLean,
1992:285-296). These trends have been driven by recent advances in physical
Time motion analysis of International rugby Chapter 2
9
preparation and highlight the need for a detailed analysis of contemporary rugby
at the elite level. Despite the international popularity of rugby, it is clear that there
is a lack of understanding of the physiological requirements of contemporary
rugby.
In the professional era of rugby, forwards and backs have had their traditionally
very different roles, blurred by recent changes in the emphasis of the game that
focus on the importance of ball retention and repeated recycling of the ball.
Although there remain obvious position-specific jobs for each player position,
there is a shift towards a blend of roles. Backs’ traditional requirements of speed,
direction change at pace, adept handling skills and complicated set move
execution are unchanged. There is however an additional need for strength in
securing the ball in broken play, and backing up of forwards in this role. The
forwards’ short duration/high intensity competition for the ball control in contact
situations must now also incorporate more running with the ball in open play in
conjunction with more adept handling skills. An attempt to define each position’s
physical output in terms of type, duration, intensity of activity and the relative
recovery times in between has been made and documented but recent relevant
studies specific to rugby union are lacking (Deutsch, et al., 1998:561). Therefore
Deutsch et al., (1998:561) showed that forwards as a group show higher overall
exercise intensity during a game in comparison to the backs. The backs however
tended to work for short periods at high intensities, with longer periods of rest.
Team positions can also be classified according to the specific individual position
played (i.e. prop, hooker, lock, loose forward, scrumhalf, fly half, centre, wing,
and fullback), or according to subgroups reflecting positional commonality (i.e.
front row, locks, loose forwards, inside backs, and outside backs) (Meir, Newton,
Curtis, Fardell, & Butler, 2001:450-458).
More athletic forwards and fast, physical wingers are replacing the traditional,
heavy forwards and the smaller, faster wings. Even with this crossover of roles,

Time motion analysis of International rugby Chapter 2
10
there is still a relative clear difference in the breakdown of the type, duration and
intensity of physical activity between forwards and backs, and even within these
two broad groupings. A prop’s role and body type is considerably different from a
lock’s, as a winger’s is to a scrum half. So although training must address the
player’s common roles, there is a clear logic that there should be more emphasis
on position-specific fitness for the individual roles of each position if peak
performance is to be attained.
According to Roberts, Stokes; & Trewartha (2006:386-397) time-motion analysis
has been used to assess movement patterns in a variety of team sports,
including rugby union. However, there is little objective data available on the
physical demands of elite rugby. Activities were categorized based on movement
speeds as standing, walking, jogging, medium-intensity running (low-intensity
activity), and high-intensity running, sprinting, and static exertion such as
scrummaging, rucking, mauling, and tackling (high-intensity activity).
The game is intermittent in nature, requiring players to compete in a challenging
contest, comprising intense bouts of sprinting and tackling, separated by short
bouts of lower-intensity activity (recovery) (Gabbett, 2005:961-976). As a result
of the physical demands of the game, the physiological qualities of players are
highly developed with players requiring high levels of aerobic fitness, speed,
muscular power and agility (Gabbett, 2005:961-976).
Quarrie & Hopkins (2007:895-903) indicates the measures of match participation
under good conditions for 1995 (the last year prior to professionalism) and 2004
(Predicted values ± standard deviation), (Table 1).

Time motion analysis of International rugby Chapter 2
11
Table 1: Measures of match participation
1995 2004 Total match time (min) 83.7 ± 1.8 85.5 ± 3.6 Time ball in play (min) 28.6 ± 2.2 34.5 ± 1.8
Mean time per player (min) 79.4 ± 2.6 64.3 ± 3.5 Number of players 31.5 ± 1.2 40.1 ± 2.5
Time motion studies have shown that rugby players perform different match-play
activities during competition depending on playing position (Meir, Colla, &
Mulligan, 2001:42-46), with forwards being involved in significantly more physical
collisions and tackles than backs (Gissane, White, Kerr; & Jennings, 2001:137-
146). It is also recognized that the ratio of high-intensity activity is higher for
forwards (1:7 to 1:10) than backs (1:12 to 1:28), with forwards covering a greater
distance during a match (9929 vs. 8458 m) (Meir et al., 2001:42-46). These
findings demonstrate that in rugby a wide range of skills and physiological
demands exist for different playing positions.
2.3.1 Anthropometry Nicholas (1997:375-396) reported that rugby players have unique anthropometric
and physiological attributes which depend on positional role and the playing
standard. These have important implications for team selection and highlight the
necessity for individualized training programs and fitness attainment targets. The
forwards are heavier but have a lower percentage of body fat than two decades
ago (Olds; 2001:253-262).
Somatotypic descriptions of French, Italian and South African rugby players have
identified forwards as being generally more endo-mesomorphic than backs
(Boennec, Prevost & Ginet, 1980:309-318). Rigg & Reilly (1987:186-191)
reported that the most consistent anthropometric differences between forwards
and backs were in terms of body size (height and body mass), rather than type of
physique (measured by somatotype).
Time motion analysis of International rugby Chapter 2
12
A summary of the anthropometric characteristics of rugby players in other reports
is given in table 2 (Quarrie, Handcock & Waller, 1995:263-270). As can be seen,
most evaluations of the anthropometric characteristics of rugby players are
descriptions of one or two teams from a given grade, largely precluding useful
comparisons across grades.

Time motion analysis of International rugby Chapter 2
13
Table 2: Anthropometric characteristics of rugby players
Country and authors Position n Height (cm) Mass (kg) Endo Meso Ecto
Australia Withers, Craig and Forwards & Backs 16 2.7 (0.7) 6.0 (0.8) 2.0 (0.7)
Norton France
Boennec, Prevost and Forwards 14 3 6 1 Ginet Backs 8 2.5 5 2.5 Italy
Casagrande and Forwards 15 184.3 (9.2) 96.4
(16.9) 3.5 (1.2) 6.1 (1.0) 1.0 (1.0) Viviani Backs 13 180.4 (3.2) 81.3 (8.0) 2.6 (0.6) 4.9 (1.3) 1.0 (0.9) Japan
Ueno, Watai and Forwards 44 176.5 (5.9) 80.6 (8.5) Ishii
South Africa
Smit, Daehne and Forwards 27 188.0 (5.3) 96.2
(11.5) 3.8 6.1 1.6 Burger Backs 20 178.5 (6.8) 78.2 (8.9)
Jardine, Wiggins, Forwards 15 187.5 (8.3) 98.0 (8.7) Myburgh and Noakes
England Reilly and Hardiker Forwards & Backs 28 3.6 (0.7) 5.4 (1.0) 2.1 (0.9)
Rigg and Reilly Forwards (1st class) 14 185.3 (5.2) 91.5 (5.8) Forwards (2nd class) 13 178.2 (3.2) 81.9 (7.2) Backs (1st class) 10 177.4 (5.0) 78.9 (5.0) Backs (2nd class) 11 176.8 (4.6) 75.4 (6.7) Total 48 179.8 (4.6) 82.6 (6.3) 2.5 5 2
Holmyard and Forwards (international) 9 184 (11) 100.3 (10.4)
Hazeldine Backs (international) 9 175 (2) 83.0 (5.2) United States
Maud Forwards 8 180.7 (8.7) 87.7 (7.7) Backs 7 178.4 (7.3) 80.5 (6.1)
Maud and Shultz Forwards 10 187.3 (7.8) 94.4
(10.4) Backs 10 174.9 (4.8) 78.2 (5.8)

Time motion analysis of International rugby Chapter 2
14
2.3.2 Maximal oxygen uptake
Maximal oxygen uptake (VO2max) has been proposed as an indicator of aerobic
fitness in rugby players (Reid & Williams, 1974:96-99). A high VO2max facilitates
the repetition of high-intensity efforts, and in soccer is positively related to the
distance covered, level of work intensity, number of sprints, and involvements
with the ball (Helgerud, Engen & Wisloff, 2001:1925-1931).
VO2max values can be expressed absolutely as litres per minute (L/min) when
total power output is important, or relative to body mass per minute (mL/kg/min)
for activities where body mass should be considered. An alternative method is to
use the logarithms of the power function ratio standard (i.e. mL/kg/min) (Nevill,
Ramsbotton & Williams, 1992:110-117).
Given the variation in body mass across positions in rugby, it is suggested that
researchers present these ratios to allow for accurate comparison. The forwards
are taller and heavier players, with higher fat percentages, which could explain
their lower peak VO2 per kilogram. This is particularly the case in rugby given the
large range of body mass between forwards and backs. Recent studies on
aerobic performance in elite players have used the multi-stage shuttle run as an
indication of VO2max. [Using the multi-stage shuttle run test, 94 senior ‘A’ male
rugby players were assessed for predicted VO2max (Quarrie; et al., 1996:53-56).]
The forwards, hookers had the highest score (58.7+- 15.2mL/kg/min), followed by
the locks (55.1 +- 15.2mL/kg/min), loose forwards (55.1+- 15.2mL/kg/min), and
props (50.8+- 15.2mL/kg/min). For the backs, the inside backs (62.5+-
16.9mL/kg/min) achieved the highest level, compared with the midfield backs
(59.8+- 16.9mL/kg/min) and the outside backs (57.6+- 16.9mL/kg/min). These
results indicate backs typically possess greater levels of endurance fitness than
forwards. The absolute values for VO2max for forwards are greater than 5.0 L/min.
These levels indicate the capability for a very high aerobic power production.
Time motion analysis of International rugby Chapter 2
15
This characteristic assists rugby forwards during repeated intense efforts
involving scrummaging, rucking and mauling and explosive running (Jardine,
Wiggins & Myburgh, 1988:529-532). This is especially the case in rugby where
training generally does not include extensive steady-state exercise, rather
players are required to perform frequent maximal intermittent efforts that stress
the anaerobic energy systems and produce lactate levels in excess of 14 mmol/L
(Duthie; et al., 2003:973-991).
Similar to heart rate, oxygen consumption was higher during the long compared
with the medium and short work-to-rest durations (approximately 68%, 60% and
55% VO2max, respectively). This contrasts with the findings of Christmass,
Dawson; & Arthur (1999:436-447), who reported lower % VO2max values for the
long (65%) than the short work-to-rest trial (71%). These authors suggested that
there was an extra oxygen cost during short work-to-rest durations, possibly due
to more frequent transfers on and off the moving treadmill belt.
Bogdanis, Nevill, Boobis, & Lakomy; (1996:876-884) noted that aerobic
metabolism contributed substantially to adenosine triphosphate re-synthesis
during high-intensity exercise without a dramatic decline in power output.
Although the protocol of Bogdanis et al., (1996:876-884) consisted of a series of
sprints, lasting much less than 40 min in duration, their results do demonstrate
how aerobic metabolism can contribute to sprint performance of longer durations.
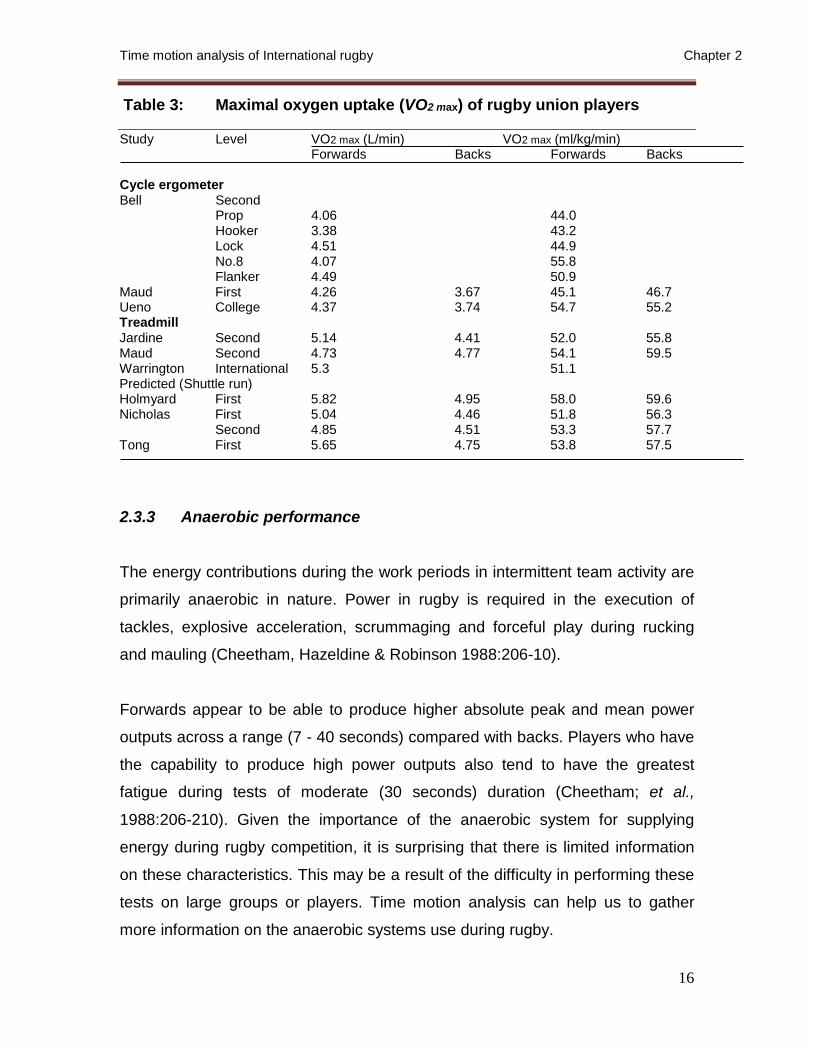
In Table 3, Duthie et al., (2003:973-991) compared previous research to indicate
a trend for forwards to have superior or absolute VO2max values compared with
backs. When expressed relative to body mass, this trend was reversed with the
backs showing higher values.
Time motion analysis of International rugby Chapter 2
16
Table 3: Maximal oxygen uptake (VO2 max) of rugby union players Study Level VO2 max (L/min) VO2 max (ml/kg/min) Forwards Backs Forwards Backs Cycle ergometer Bell Second Prop 4.06 44.0 Hooker 3.38 43.2 Lock 4.51 44.9 No.8 4.07 55.8 Flanker 4.49 50.9 Maud First 4.26 3.67 45.1 46.7 Ueno College 4.37 3.74 54.7 55.2 Treadmill Jardine Second 5.14 4.41 52.0 55.8 Maud Second 4.73 4.77 54.1 59.5 Warrington International 5.3 51.1 Predicted (Shuttle run) Holmyard First 5.82 4.95 58.0 59.6 Nicholas First 5.04 4.46 51.8 56.3 Second 4.85 4.51 53.3 57.7 Tong First 5.65 4.75 53.8 57.5
2.3.3 Anaerobic performance
The energy contributions during the work periods in intermittent team activity are
primarily anaerobic in nature. Power in rugby is required in the execution of
tackles, explosive acceleration, scrummaging and forceful play during rucking
and mauling (Cheetham, Hazeldine & Robinson 1988:206-10).
Forwards appear to be able to produce higher absolute peak and mean power
outputs across a range (7 - 40 seconds) compared with backs. Players who have
the capability to produce high power outputs also tend to have the greatest
fatigue during tests of moderate (30 seconds) duration (Cheetham; et al.,
1988:206-210). Given the importance of the anaerobic system for supplying
energy during rugby competition, it is surprising that there is limited information
on these characteristics. This may be a result of the difficulty in performing these
tests on large groups or players. Time motion analysis can help us to gather
more information on the anaerobic systems use during rugby.

Time motion analysis of International rugby Chapter 2
17
When , according to McLean (1992:285-296) the ball is in open play, the average
running pace of players central to the action ranges from 5 to 8 m/s-1. This
together with scrum, lineout, ruck and maul is classified as high-intensity
exercise. The intensity of work is measured by timing the work : rest ratios
(W:RRs) throughout a game. The mean duration of the work is 19 seconds and
the most frequent W: RRs are in range of 1:1 to 1:1.9. On average, a scrum,
lineout, ruck or maul occurs every 33s. The ball is in play for an average of 29
min during a scheduled time of play of 80 min.
McLean (1992:285-296) reported that the running speed, duration, blood lactate
levels, physical confrontation and, most particularly, the density of work as
illustrated by the work: rest ratios indicate that the game places greater demands
on anaerobic glygolysis than previous reported. This has implications for the
physical conditioning of rugby union players.
2.3.4 Muscle strength and power
Strength is the maximal force produced by a muscle or muscles at a given
speed. Power is the product of force (strength) and velocity (speed); (Knuttgen &
Kraemer, 1987:1-10). Rugby performance requires high levels of muscular
strength and power for excellence, particularly for the forwards in scrums, rucks
and mauls. For example, the mean pack force during scrummaging ranges from
6210 - 9090N (600-1000kg); (Mayes & Nuttall, 1995:13-14).
Given that muscle strength and power is required during the contact situations in
rugby, forwards should possess greater strength than backs (Reilly, 1997:83-
101). The notion that forwards require more strength and backs require speed
was supported by Miller, Quievre & Gajer; (1996:494-495), who found that
international forwards produced greater force at low isokinetic speeds compared
to backs. In contrast, the backs produced greater force at the higher speeds and
their results were similar to those of international sprinters.
Time motion analysis of International rugby Chapter 2
18
The ability to generate high muscular power is an important attribute of rugby
league players. Players are required to have high muscular power to perform the
tackling, lifting, pushing, and pulling tasks that occur during a match (Meir; et al.,
2001:450-458). In addition, high muscular power is required to provide fast play-
the-ball speed and leg drive in tackles (Gabbett, 2005:400-408).
2.3.5 Speed
Speed and acceleration are essential requirements, as players are often required
to accelerate to make a position nearby or sprint over an extended distance.
Backs achieve similar sprint times to track sprinters over distances of 15 and
35m. Rugby players typically sprint between 10 and 20m. (Docherty; et al.,
1988:269-277). First class backs and half-backs were the fastest over 40m,
while front row forwards and second row forwards were the slowest. These
results indicate that speed is a discriminating factor between backs and forwards,
highlighting the need for specialized sprint training programmes (Rimmer &
Slievert, 1996:111).
Specific speed training is a regular component in the training of elite rugby
players. Time motion analysis has demonstrated that rugby backs can perform a
large number of sprints within a game, with an average duration of 3 seconds
and cover greater distance at a sprinting speed compared with the forwards
(Deutsch; et al., 1998:561-570). While the forwards are primarily engaged in non-
running intense activity, the backs are typically walking, standing or waiting for
the ball to be delivered from the contest (Docherty; et al., 1988:269-277). Time
motion analysis has provided a basis for rugby sprint training. This component of
rugby is critical to both the forwards and the backs. By providing a more objective
assessment of the sprints that occur in the game, greater knowledge on the
demands can be developed and training programs planned accordingly.
Time motion analysis of International rugby Chapter 2
19
Rugby players need to move quickly to position themselves in attack and
defense. However, time-motion studies have shown that rugby players are rarely
required to sprint distances more than 40 m in a single bout of intense activity
(Meir; et al., 2001:450-458). When in defense there are fewer sprinting efforts in
comparison with attack. Defense involves more continuous activity of moving up
to the advantage line then shuffling backwards. Speed is a priority in attack as
the player attempt to get over the advantage line. Most sprinting efforts in attack
do not involve a player receiving or passing the ball. The majority of sprinting
efforts are performed as support play or running decoy lines, along with
recovering in defense.
A runner who has the ability to pass while running at a slightly slower pace could
be more effective than an individual running slightly faster who is carrying the ball
in such a way that his opponents see that he cannot pass the ball (Brown,
1999:50,70-73).
Another important factor when examining rugby-specific sprinting is the type of
sprint commonly performed in a competitive game. Brown (1999:50,70-73)
reported that rugby players perform intensive efforts lasting 5 – 45 seconds. It
was not made clear, however, what proportion of these efforts were sprints.
Presumably, some of the longer efforts would include scrummages, rucks and
mauls. Sayers (2000:26-27) reported that sprints performed during a field sport
are rarely more than 30 m and that most of the time players cover less than 10 m
at a time. It is accepted that speed is important for performance in rugby, but
trying to quantify who is fast at short distances is different from determining who
can achieve the greatest maximum speed.
Docherty; et al., (1988:269-277) examined the results of a time analysis of
international rugby games and reported that props performed about 20 sprints
(10 ± 1.5 sprints in 40 min, every second 5-min period was observed) per game
for a mean time of 1.75s per run, while centres sprinted 62 times (31.1 ± 2.4) for

Time motion analysis of International rugby Chapter 2
20
a mean time of 2.3s per run. During these sprints, a player can cover between 10
and 20 m. Since that time, the laws of rugby have been changed to improve the
flow of the game.
An analysis by Deutsch; et al., (1998:561-570) of elite rugby players in under-19
competition reported that the forwards sprinted a mean of 4-6 times a game
(props 4 ± 1, back row 6 ± 2) for about 3 s (props 2.8 ± 0.0 seconds, back row
2.3 ± 0.6 seconds) per sprint, while centres sprinted 12 ± 3 times per game for
2.8 ± 0.4 s. This apparent decrease in sprinting can be explained by the methods
of the assessments. Deutsch; et al., (1998:561-570) defined sprinting as the
players’ running speed. Maximum accelerations over short distances might not
produce peak sprinting speed and would therefore not be considered sprints.
Although it is widely accepted that the rules changes have resulted in a more
open game with more running, no other recent motion analysis of the game could
be found.
Mero, Komi; & Gregor (1992:376-392) concluded that if the distances covered by
the players in a rugby game are typically under 30 m, it is done at maximum
effort.
In Table 4, Duthie; et al., (2003:973-991) indicated the percentage of sprints
involving ball possession and the subsequent involvement in play.
Table 4: Percentage sprints involving ball possession Play involvement Ball possession
Yes No
Ball received 0 17
Ball passed 1 0
Both 0 9
Neither 6 67

Time motion analysis of International rugby Chapter 2
21
In a study from Duthie; et al., (2003:973-991) 28 players were assessed
performing a total of 503 sprints. The 16 forwards performed a total of 215
sprints, with the mean ± SD sprints per game being 14 ± 6. The 12 backs
performed 288 sprints, with a mean frequency of 19 ± 7 sprints per game. The
mean duration of individual sprinting efforts was 2.50 ± 1.57 seconds for the
forwards and 3.08 ± 1.64 seconds for the backs.
Figure 2, (p 22) demonstrates that both forwards and backs performed more
sprints in offensive play in comparison with defensive play. The difference was
greater for the backs (~45%) compared with the forwards (~30%). Table 4, (p 23)
provides an analysis of players’ activity while sprinting. The majority (67%) of
sprints did not involve any contact with the ball. Of the remaining sprints,
receiving the ball was most common along with receiving and then passing.
Figure 3, (p 22) show that the forwards performed most sprints from a standing
start, with very few (7%) from a striding start. The backs had a more even
distribution between standing, walking and jogging starts, with only 14% of
sprints performed from a striding start. When a forward sprinted the opposition
were in close proximity (<5m) most often (46%; Figure 4) (p 23). The opposite
was the case for the backs who had only 20% of sprints performed when the
opposition was in close proximity. The majority of sprints performed by the backs
were when the opposition was near (5 to 15 metres).
Figure 5, (p 23) provides a description of the percentage of sprints involving a
change of direction. Sprints not involving a change of direction (forwards 92%,
backs 78%) were excluded from the figure. The backs performed more sprints
with a change of direction compared with the forwards. Of the sprints involving a
change of direction, a greater amount involved changes of less than 90 degrees.
It is important to note that these sprints represented a small amount of the total
sprints performed by player per game.

Time motion analysis of International rugby Chapter 2
22
Figure 2: The percentage of sprints performed in offensive and
defensive play for Super 12 forwards and backs
Figure 3: The percentage of sprints commenced from different starting
speed for Super 12 forwards and backs
0
10
20
30
40
50
60
70
80
Offensive Defensive
Forwards
Backs
0
5
10
15
20
25
30
35
40
Stand Walk Jog Stride
Forwatds
Backs

Time motion analysis of International rugby Chapter 2
23
Figure 4: The percentage of sprints performed in relation to the
proximity of the opposition for Super 12 forwards and backs
Figure 5: The percentage of sprints involving a change of direction for
Super 12 forwards and backs
2.3.6 Seasonal variations in physiological and anthropometric characteristics
05
101520253035404550
Close (<5m) Near (5-15m) Far (>15m)
Forwards
Backs
0
1
2
3
4
5
6
7
Left (<90 deg) Left (>90 deg) Right (<90 deg) Right (>90 deg)
Forwards
Backs
Time motion analysis of International rugby Chapter 2
24
Changes in physiological and anthropometrical characteristics over the duration
of a season have been detailed. Within a season, different dietary, conditioning
and resistance-training strategies elicit variations in the physical status of
players. National level rugby players may exhibit a marked reduction in body fat
and an increase in aerobic power during the pre-season (Tong & Mayes,
1995:507). Within a competitive season, the changes are less noticeable, with
slight improvements in speed and reduction in anaerobic threshold (Campi,
Cuglielmini & Guerzoni, 1992:149-154).
The players also have high competition, training and travel demands that can
affect physical well-being. Australian and New Zealand Super 14 players are
regularly required to travel to South Africa and perform at moderate altitude. At
this altitude, cognitive performance is maintained, yet physical performance is
impaired for 48 hours, as measured by the multi-stage shuttle run (Weston,
Mackenzie & Tufts, 2001:298-302).
Previous research done by Brady (1995:499) has investigated seasonal changes
in parameters in professional footballers; there is a paucity of research with part-
time, semi-professional players. The de-conditioning apparent in all fitness
parameters in the off-season, in conjunction with progressive improvement in
most players from post pre-season to mid-season, would support these
parameters as sport-specific fitness requirements. According to Brady (1995:499)
such improvements suggest that the short-term demands of playing and training
in the first half of the season develop fitness and these trends are similar to those
for professional players.
Gabbett (2005:675-680) reported increases in maximal aerobic power and
muscular power and reductions in skinfold thickness were observed during the
early phases of the season when training loads were the highest. However,
Time motion analysis of International rugby Chapter 2
25
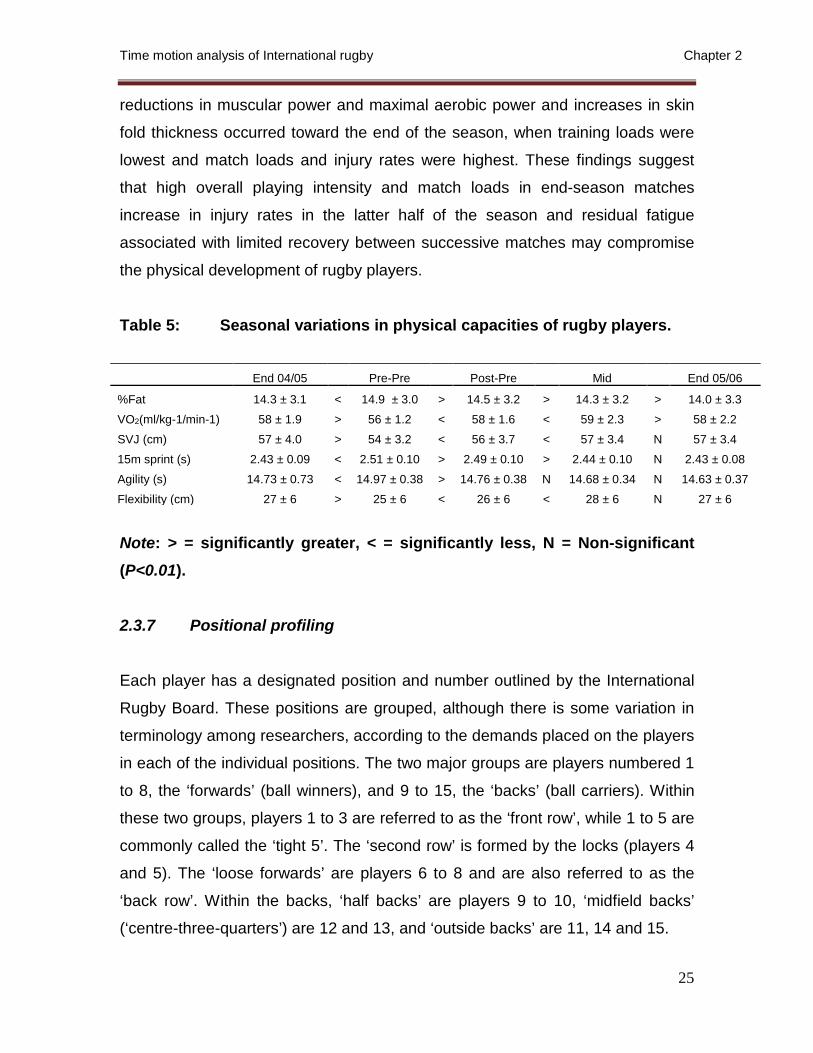
reductions in muscular power and maximal aerobic power and increases in skin
fold thickness occurred toward the end of the season, when training loads were
lowest and match loads and injury rates were highest. These findings suggest
that high overall playing intensity and match loads in end-season matches
increase in injury rates in the latter half of the season and residual fatigue
associated with limited recovery between successive matches may compromise
the physical development of rugby players.
Table 5: Seasonal variations in physical capacities of rugby players.
End 04/05 Pre-Pre Post-Pre Mid End 05/06
%Fat 14.3 ± 3.1 < 14.9 ± 3.0 > 14.5 ± 3.2 > 14.3 ± 3.2 > 14.0 ± 3.3 VO2(ml/kg-1/min-1) 58 ± 1.9 > 56 ± 1.2 < 58 ± 1.6 < 59 ± 2.3 > 58 ± 2.2 SVJ (cm) 57 ± 4.0 > 54 ± 3.2 < 56 ± 3.7 < 57 ± 3.4 N 57 ± 3.4 15m sprint (s) 2.43 ± 0.09 < 2.51 ± 0.10 > 2.49 ± 0.10 > 2.44 ± 0.10 N 2.43 ± 0.08 Agility (s) 14.73 ± 0.73 < 14.97 ± 0.38 > 14.76 ± 0.38 N 14.68 ± 0.34 N 14.63 ± 0.37 Flexibility (cm) 27 ± 6 > 25 ± 6 < 26 ± 6 < 28 ± 6 N 27 ± 6
Note: > = significantly greater, < = significantly less, N = Non-significant (P<0.01).
2.3.7 Positional profiling
Each player has a designated position and number outlined by the International
Rugby Board. These positions are grouped, although there is some variation in
terminology among researchers, according to the demands placed on the players
in each of the individual positions. The two major groups are players numbered 1
to 8, the ‘forwards’ (ball winners), and 9 to 15, the ‘backs’ (ball carriers). Within
these two groups, players 1 to 3 are referred to as the ‘front row’, while 1 to 5 are
commonly called the ‘tight 5’. The ‘second row’ is formed by the locks (players 4
and 5). The ‘loose forwards’ are players 6 to 8 and are also referred to as the
‘back row’. Within the backs, ‘half backs’ are players 9 to 10, ‘midfield backs’
(‘centre-three-quarters’) are 12 and 13, and ‘outside backs’ are 11, 14 and 15.

Time motion analysis of International rugby Chapter 2
26
Each positional group’s broad physical requirements, skills and tasks can be
identified. Quarrie; et al., (1996:53-60) concluded that front-row positions
demand strength and power as the players are required to gain possession of the
ball, are in continual close contact with opposition, and have limited opportunities
to run with the ball. The locks are generally tall, with a large body mass and
power an additional advantage. The loose forwards require strength and power
as a requirement of players in these positions is to gain and retain possession of
the ball. It is a prerequisite for the loose forwards to be powerful and mobile in
open play, have excellent speed, acceleration and endurance. A good level of
endurance is required by the half backs as they control the possession of the ball
obtained by the forwards. Good speed is also an important attribute for the half
backs, as they need to accelerate away from the approaching defenders. Midfield
backs require strength, speed and power as they have a high frequency of
contact with the opposition. Outside backs require considerable speed to out-
manoeuvre their opponents. They perform a large amount of support running,
chasing down kicks and covering in defense.
Roberts; et al., (2006:386-397) defined positional groups as forwards and backs.
Backs covered more distance than forwards over the course of the match
(6256m vs. 5852m) and covered greater distances during walking (2315m vs.
1969m) and high-intensity running (467m vs. 329m). Forwards spent more total
time performing high-intensity activity than backs (9:40 min:s vs. 3:10 min:s) due
to a longer time spent in static exertion (8:25 min:s vs. 1:16 min:s). Backs spent
more time in high-intensity running (0:58 min:s vs. 1:22 min:s) and sprinting (0:18
min:s vs. 0:33 min:s). Despite no difference in the total number of discrete
activities performed by forwards and backs, forwards performed more periods of
high-intensity activity (139 vs. 87) and for longer mean durations (3.8 seconds vs.
2.5 seconds). The development of physical performance standards for individual
playing positions and positional playing groups would allow coaches to identify
Time motion analysis of International rugby Chapter 2
27
player weaknesses and develop specific training programmes for players
according to their position (Meir, 1993:27-31).
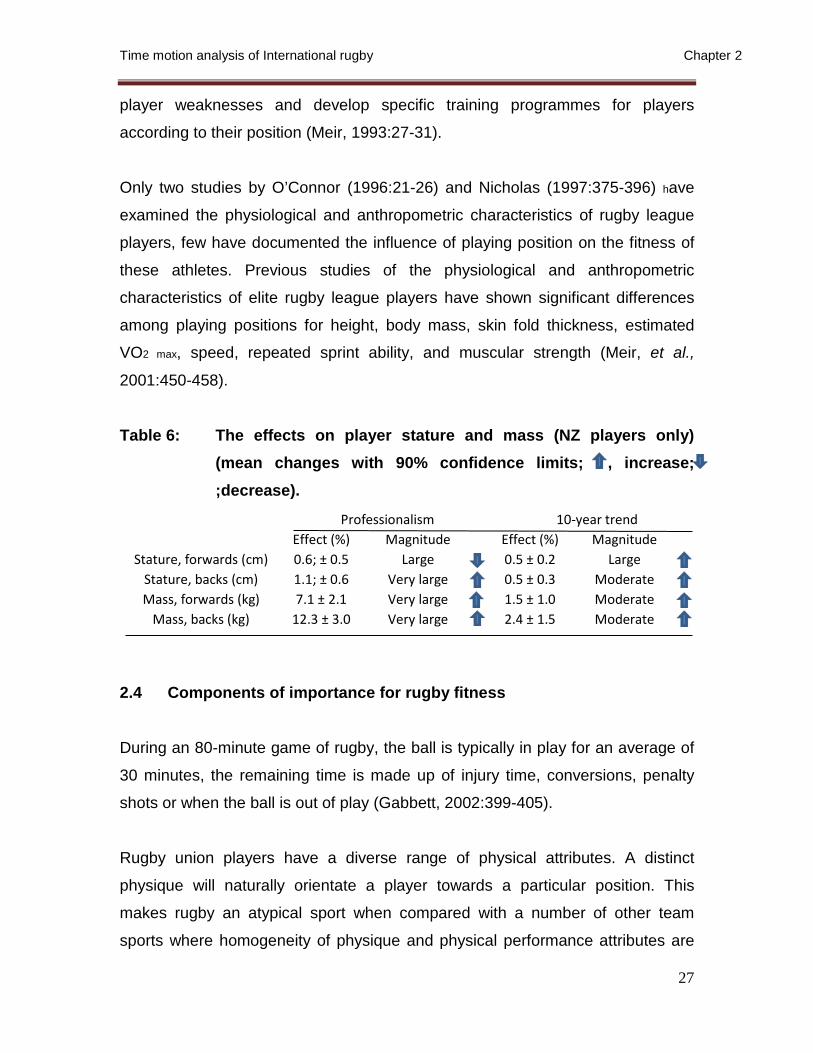
Only two studies by O’Connor (1996:21-26) and Nicholas (1997:375-396) have
examined the physiological and anthropometric characteristics of rugby league
players, few have documented the influence of playing position on the fitness of
these athletes. Previous studies of the physiological and anthropometric
characteristics of elite rugby league players have shown significant differences
among playing positions for height, body mass, skin fold thickness, estimated
VO2 max, speed, repeated sprint ability, and muscular strength (Meir, et al.,
2001:450-458).
Table 6: The effects on player stature and mass (NZ players only) (mean changes with 90% confidence limits; , increase; ;decrease).
Professionalism 10-year trend Effect (%) Magnitude Effect (%) Magnitude
Stature, forwards (cm) 0.6; ± 0.5 Large 0.5 ± 0.2 Large Stature, backs (cm) 1.1; ± 0.6 Very large 0.5 ± 0.3 Moderate Mass, forwards (kg) 7.1 ± 2.1 Very large 1.5 ± 1.0 Moderate
Mass, backs (kg) 12.3 ± 3.0 Very large 2.4 ± 1.5 Moderate
2.4 Components of importance for rugby fitness
During an 80-minute game of rugby, the ball is typically in play for an average of
30 minutes, the remaining time is made up of injury time, conversions, penalty
shots or when the ball is out of play (Gabbett, 2002:399-405).
Rugby union players have a diverse range of physical attributes. A distinct
physique will naturally orientate a player towards a particular position. This
makes rugby an atypical sport when compared with a number of other team
sports where homogeneity of physique and physical performance attributes are
Time motion analysis of International rugby Chapter 2
28
more common. Rugby union involves periods of high-intensity activity
interspersed with periods of incomplete recovery, and players require qualities
such as endurance, speed, agility, and power (Gabbett, 2002:399-405). This implies that the game is intermittent in nature, requiring players to compete
in a challenging contest, comprising intense bouts of sprinting and tackling,
separated by short bouts of lower-intensity activity (recovery) (Gabbett,
2005:961-976). Previous studies done by Deutsch; et al., (1998:561-570),
categorized activities based on movement speeds as standing, walking, jogging,
medium-intensity running (low-intensity activity), and high-intensity running,
sprinting, and static exertion such as scrummaging, rucking, mauling and tackling
(high-intensity activity). All of these components must be exercised to produce
the elite rugby player.
The relative times spent standing still, walking and jogging, running, sprinting,
shuffling, and engaged in intense static activity were analyzed, for props and
centres (Docherty, et al., 1988:269-277). The authors concluded that as only 5-
10% of a match was spent performing high-intensity work, the creatine
phosphate system was of major importance during intensive work bouts, the
aerobic system was important for other movements, and the anaerobic glycolytic
system was of little importance during rugby match-play (Docherty, et al.,
1988:269-277).
The movement classification system was based on that originally documented in
the soccer literature (Reilly & Thomas, 1976:87-89) and recently modified for use
in rugby (Deutsch et al., 1998:561-570), (Docherty et al., 1988:269-277). Each
movement was coded as one of six speeds of locomotion (standing still, walking,
jogging, cruising, sprinting, and utility), three states of non-running intensive
exertion (rucking/mauling, tackling, and scrummaging), and three discrete
activities (kicking, jumping and passing). These codes are further explained by
the following operational definitions:

Time motion analysis of International rugby Chapter 2
29
Standing still:
Standing or lying on the ground without being involved in pushing or any other
game activities. This can include small movements when such movements are
not purposeful (e.g. stumbling back and forth, turning sideways, etc.) (Deutsch et
al., 1998:561-570).
Walking:
Walking forwards or backwards slowly with purpose. One foot is in contact with
the ground at all times (e.g. walking to a scrum following a breakdown in play)
(Deutsch et al., 1998:561-570).
Jogging:
Running forwards and backwards slowly to change field position, but with no
particular haste or arm drive (e.g. jogging down-field to a lineout) (Deutsch et al.,
1998:561-570).
Cruising:
Running with manifest purpose and effort, accelerating with long strides, yet not
at maximal effort (3/4 pace) (Deutsch et al., 1998:561-570), (Docherty et al.,
1988:269-277). (E.g. running into a back line to receive the ball).
Sprinting:
Running with maximal effort. This is discernible from cruising by arm and head
movements (Deutsch et al., 1998:561-570).
Utility:

Time motion analysis of International rugby Chapter 2
30
Shuffling sideways or backwards to change field position. Usually a defensive or
repositioning movement. This does not include aimlessly walking slowly
backwards (Deutsch et al., 1998:561-570).
Jumping:
Jumping in a lineout or to catch a ball in play (Deutsch et al., 1998:561-570).
Rucking / mauling:
Attached to an active ruck or maul. Once the ball exits the ruck or maul, or the
referee calls the end of the play, the player is no longer considered to be
engaged in rucking/ mauling, and is deemed to be standing still (Deutsch et al.,
1998:561-570).
Scrummaging:
Attached to an active scrum. As above, once the ball exits or the play is stopped,
the scrum is no longer active (Deutsch et al., 1998:561-570).
2.4.1 Distance covered
The distance covered during the game includes: walking, jogging, running, high-
speed running and sprints. Walking in rugby can be considered as the rest phase
and the time passing between set phases, walking back to your position after a
high-intensity bout or walking to a scrum or lineout. Jogging can also be found
between set phases or when moving back to your position either after the ball
has gone dead or whiles the game is still underway. Running, high-speed
running and sprints are while the game is underway to get to rucks and mauls,
running with the ball, chasing a ball or when defending. The sum of all these
activities will be the “distance covered” (Deutsch, et al., 2002:160-166).
Early estimations on the distance covered during a rugby match indicated that a
centre covered 5800m, of which 2200m was walking, 1600m jogging and 2000m
Time motion analysis of International rugby Chapter 2
31
sprinting (Morton, 1978:4-9). Deutsch; et al., (1998:561-570) monitored six
players during four under-19 matches between different levels of play. Although
backs had a lower overall exertion based on heart rate, they covered the greatest
distance, with props and locks covering 4400 ± 398m, back row 4080 ± 363m,
inside backs 5530 ± 337m, and outside backs 5750 ± 405m, respectively. Within
elite under-19 colt’s rugby, forwards spent a larger percentage of time standing
still (46%) compared with the backs (39%), and covered a shorter distance in all
gait movements except jogging (Deutsch, et al., 1998:561-570).
The majority of recovery was passive (stationary) for forwards and active
(walking or jogging) for backs. While the forwards are primarily engaged in non-
running intense activity, the backs are typically walking, standing or static while
waiting for the ball to be delivered from the contest. The backs (253 ± 45m) cover
greater distance at sprinting speed compared with the forwards (94 ± 27m), and
complete more backwards and sideways (utility) movements (backs 72 ± 7,
forwards 22 ± 4). The mean distance of individual sprints was similar for both the
forwards and the backs (17m ± 2m and 21m ± 3m, respectively). Props and locks
covered the greatest distance at a low-intensity pace, indicating more continuous
activity and generally greater involvement for these players given their proximity
to the contest (Deutsch; et al., 1998:561-570).
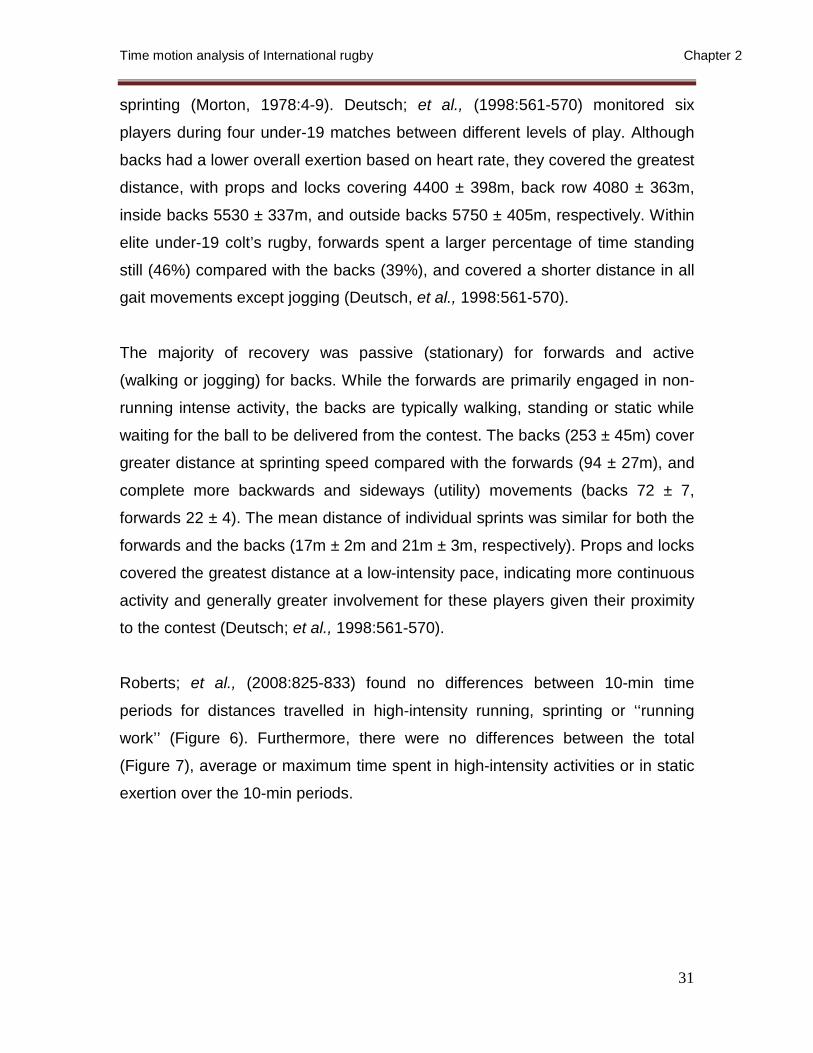
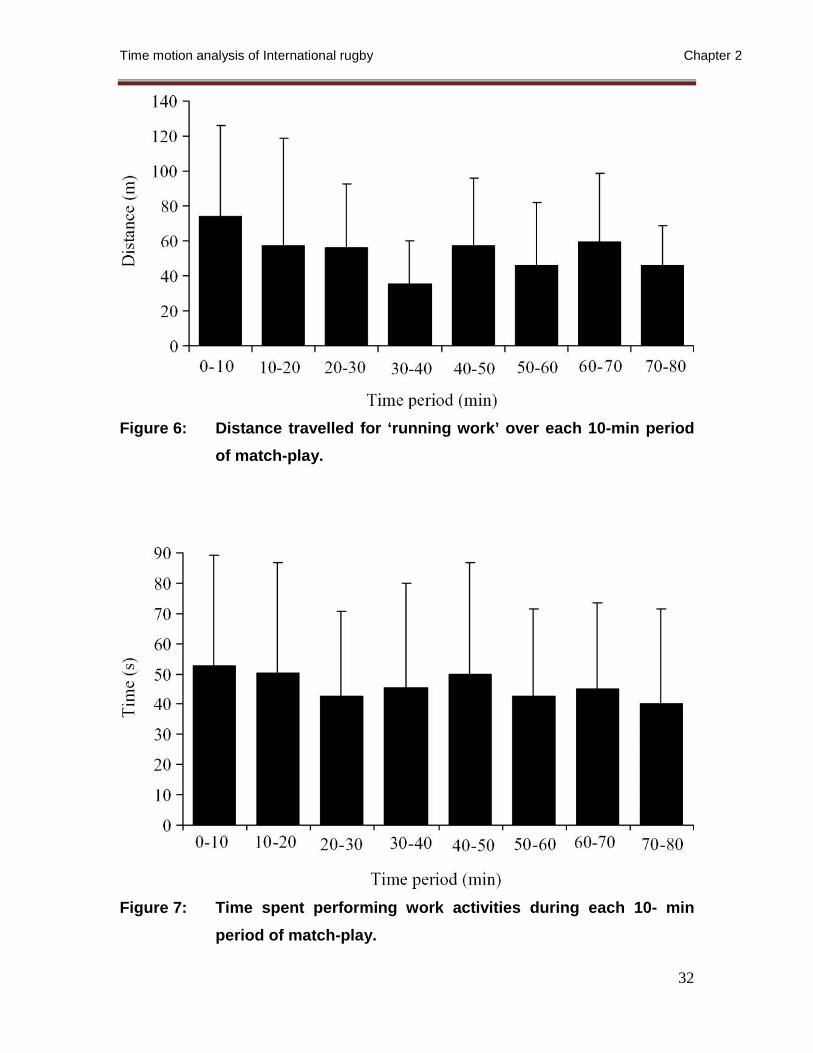
Roberts; et al., (2008:825-833) found no differences between 10-min time
periods for distances travelled in high-intensity running, sprinting or ‘‘running
work’’ (Figure 6). Furthermore, there were no differences between the total
(Figure 7), average or maximum time spent in high-intensity activities or in static
exertion over the 10-min periods.
Time motion analysis of International rugby Chapter 2
32
Figure 6: Distance travelled for ‘running work’ over each 10-min period
of match-play.
Figure 7: Time spent performing work activities during each 10- min
period of match-play.
Time motion analysis of International rugby Chapter 2
33
2.4.2 High-intensity distance covered
The high-intensity distance covered is represented by the distance covered
during running, high-speed running and sprints. The high-intensity distance
covered can be regarded as the actual playing intensity, because most activities
are performed during this stage.
Outside backs are engaged in more sprints during a game than front row
forwards (Figure 2, p 22, shows the percentage of sprints performed in offensive
and defensive play for Super12 forwards and backs). As a result, outside backs
spent
significantly more total time sprinting than front row forwards. An overall
difference between forwards and backs were also observed. Mean sprint
duration was longer for outside backs than for all other positional groups, which
contributed to significantly longer mean sprint duration for backs than for
forwards (Deutsch, et al., 1998:561-570).
Time-motion analysis of first-class cricket fielding revealed a lower proportion of
high-intensity activity than observed in team invasion sports such as soccer and
hockey. This was due to large periods of rest involving walking or stationary
activity. Despite this, players covered a large estimated distance during a day of
first-class cricket. The current data upholds the previous views that cricket is
undemanding (Rudkin & O’Donoghue, 2008:604-607).
According to Deutsch; et al., (2002:160-166) during a rugby competition, 85% of
the game time is typically spent in low-intensity activities, and 15% in high-
intensity activities This distribution of high- and low-intensity activity appears
unchanged in studies conducted between 1978 and 1998 despite casual
observation that the overall intensity of rugby has increased. The high-intensity
activity is made up of 6% running and 9% tackling, pushing and competing for
the ball (Docherty; et al., 1988:269-277). These periods of high-intensity activity

Time motion analysis of International rugby Chapter 2
34
place considerable demands on anaerobic metabolism, with two-thirds of rest
periods greater in duration than the preceding high-intensity effort (Deutsch; et
al., 1998:561-570).
During game stoppages, players switch to low-intensity activity. For players close
to the ball, high-intensity exercise recommences upon the continuation of play
(McLean, 1992:285-296). Morton (1978:4-9) reported a back will have the ball in
hand for no more than 60 seconds and suggested that much of their contribution
involves covering in defence, acting as a support player, or running decoy lines
to distract the opposition. Early research by Morton (1978:4-9) reported 135
activity periods during international and regional matches, with 56% of activities
lasting less than 10 seconds, 85% lasting less than 15 seconds, and only 5%
lasting longer than 30 seconds. Similarly, in an analysis of 1986 Five Nations
games there were 180 separate actions with 96 stoppages (Menchinelli,
Morandini, & De Angelis, 1992:196-197). 70% of actions were 4-10 seconds in
duration with single actions for forwards and centre three-quarters lasting 7
seconds. The mean duration of recovery periods has been reported to be 33
seconds during international matches with the majority of rest periods less than
40 seconds (Menchinelli; et al., 1992:196-197).
Despite an overall lower exertion, backs covered significantly greater total
distances (5640 m) than forwards (4240 m; p < 0.01), with the greatest difference
being evident between the outside backs and back row forwards (5750 and 4080
m, respectively; Table 7, p 35).

Time motion analysis of International rugby Chapter 2
35
Table 7: Distances covered by positional groups (mean ± sxÅ ) (Deutsch, et al. 1998:561-570).
Total distance Props and Inside Outside Activity locks Back row Backs Backs Total distance (m) Walking 1000 ± 130 992 ± 100 1740 ± 100 1660 ± 142 Jogging 3050 ± 193 2940 ± 156 2600 ± 347 2110 ± 271 Cruising 363 ± 102 368 ± 36 565 ± 57 514 ± 103 Sprinting 94 ± 24 94 ± 30 208 ± 52 297 ± 37 Utility 118 ± 43 154 ± 35 418 ± 70 442 ± 58 Total distance 4400 ± 398 4080 ± 363 5530 ± 337 5750 ± 405 Maximum distance (m) Walking 55.5 ± 7.6 68.7 ± 6.8 77.6 ± 6.1 63.5 ± 13.0 Jogging 65.3 ± 8.7 62.9 ± 4.0 56.5 ± 4.6 63.8 ± 3.6 Cruising 27.2 ± 5.3 23.4 ± 2.9 28.3 ± 3.9 25.3 ± 3.3 Sprinting 29.0 ± 6.9 17.0 ± 6.0 24.2 ± 3.7 27.1 ± 4.1 Utility 10.3 ± 3.0 19.7 ± 8.3 12.6 ± 1.6 16.0 ± 2.6 Average distance (m) Walking 14.0 ± 1.8 13.1 ± 0.6 13.6 ± 1.3 22.4 ± 1.1 Jogging 21.8 ± 1.7 19.4 ± 1.2 16.3 ± 1.0 20.6 ± 1.4 Cruising 13.5 ± 1.6 11.2 ± 0.7 12.9 ± 0.8 11.3 ± 1.0 Sprinting 19.8 ± 1.0 14.5 ± 3.7 18.8 ± 2.7 23.6 ± 1.2 Utility 6.0 ± 3.3 6.2 ± 2.1 5.4 ± 0.9 8.0 ± 1.3
The activities of scrummaging, rucking and mauling, lineouts and tackles are
critical components in the game of rugby. On average, first-class forwards spend
8 minutes in intense static activity scrummaging during the game, and 5 minutes
in rucks and mauls; representing 15% of the total time (Treadwell, 1988:282-
287). Forward players carry the ball into contact on more occasions than backs
and spend considerably more time in rucks and mauls than backs.
Time motion analysis of International rugby Chapter 2
36
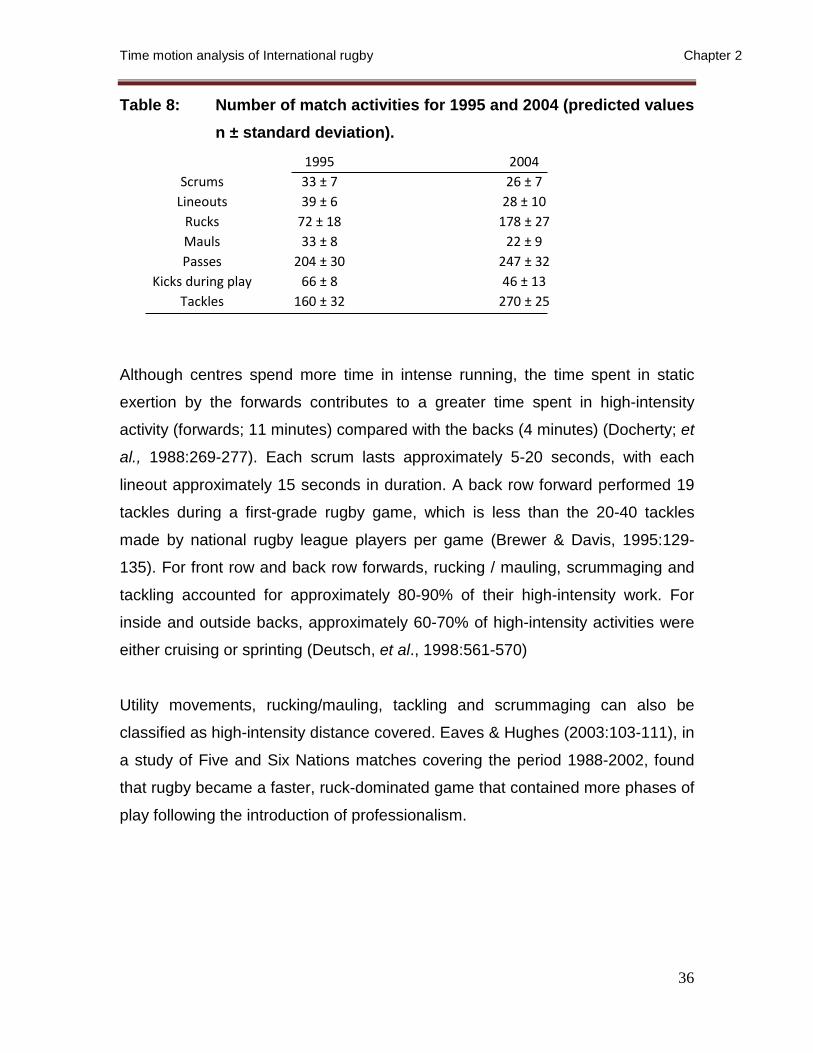
Table 8: Number of match activities for 1995 and 2004 (predicted values n ± standard deviation).
1995 2004 Scrums 33 ± 7 26 ± 7
Lineouts 39 ± 6 28 ± 10 Rucks 72 ± 18 178 ± 27 Mauls 33 ± 8 22 ± 9 Passes 204 ± 30 247 ± 32
Kicks during play 66 ± 8 46 ± 13 Tackles 160 ± 32 270 ± 25
Although centres spend more time in intense running, the time spent in static
exertion by the forwards contributes to a greater time spent in high-intensity
activity (forwards; 11 minutes) compared with the backs (4 minutes) (Docherty; et
al., 1988:269-277). Each scrum lasts approximately 5-20 seconds, with each
lineout approximately 15 seconds in duration. A back row forward performed 19
tackles during a first-grade rugby game, which is less than the 20-40 tackles
made by national rugby league players per game (Brewer & Davis, 1995:129-
135). For front row and back row forwards, rucking / mauling, scrummaging and
tackling accounted for approximately 80-90% of their high-intensity work. For
inside and outside backs, approximately 60-70% of high-intensity activities were
either cruising or sprinting (Deutsch, et al., 1998:561-570)
Utility movements, rucking/mauling, tackling and scrummaging can also be
classified as high-intensity distance covered. Eaves & Hughes (2003:103-111), in
a study of Five and Six Nations matches covering the period 1988-2002, found
that rugby became a faster, ruck-dominated game that contained more phases of
play following the introduction of professionalism.

Time motion analysis of International rugby Chapter 2
37
Figure 8: Comparisons of total match time with player match time
Figure 9: Comparisons of mean body mass of forwards and backs
55
60
65
70
75
80
85
90
95
1975 1980 1985 1990 1995 2000 2005
Tim
e Total
Mean per player
60
70
80
90
100
110
120
1975 1980 1985 1990 1995 2000 2005
Mas
s
Fowards
Backs
Time motion analysis of International rugby Chapter 2
38
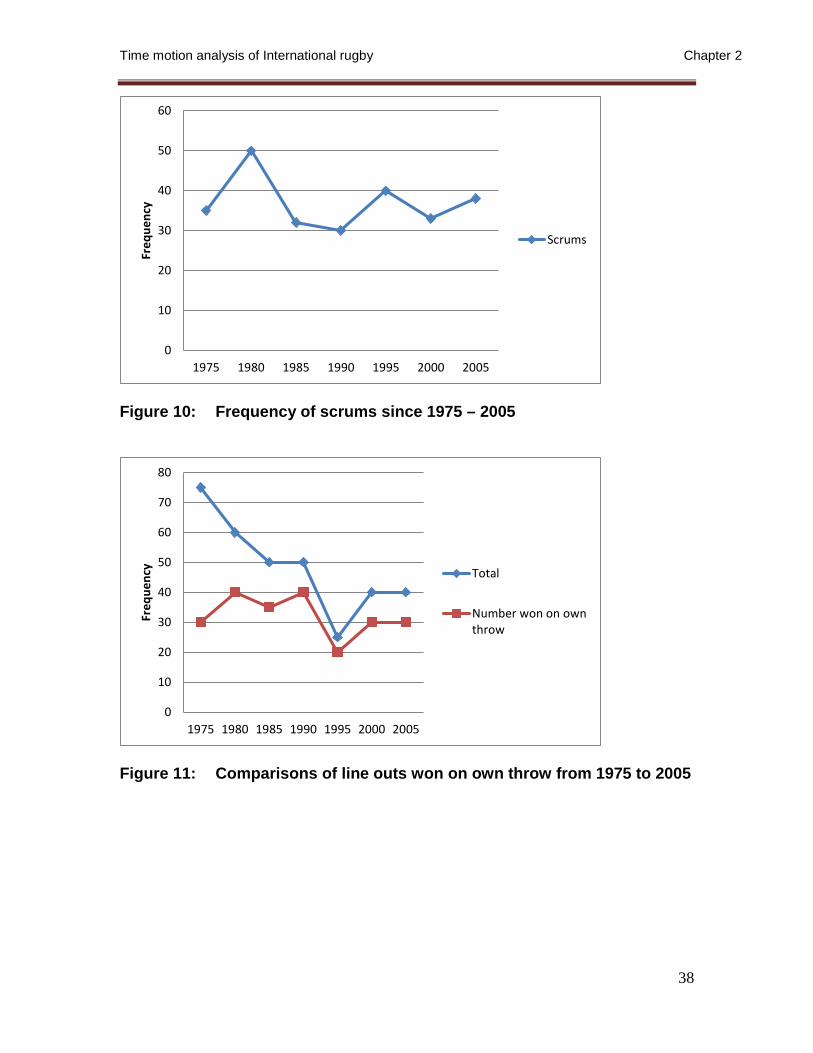
Figure 10: Frequency of scrums since 1975 – 2005
Figure 11: Comparisons of line outs won on own throw from 1975 to 2005
0
10
20
30
40
50
60
1975 1980 1985 1990 1995 2000 2005
Freq
uenc
y
Scrums
0
10
20
30
40
50
60
70
80
1975 1980 1985 1990 1995 2000 2005
Freq
uenc
y Total
Number won on ownthrow
Time motion analysis of International rugby Chapter 2
39
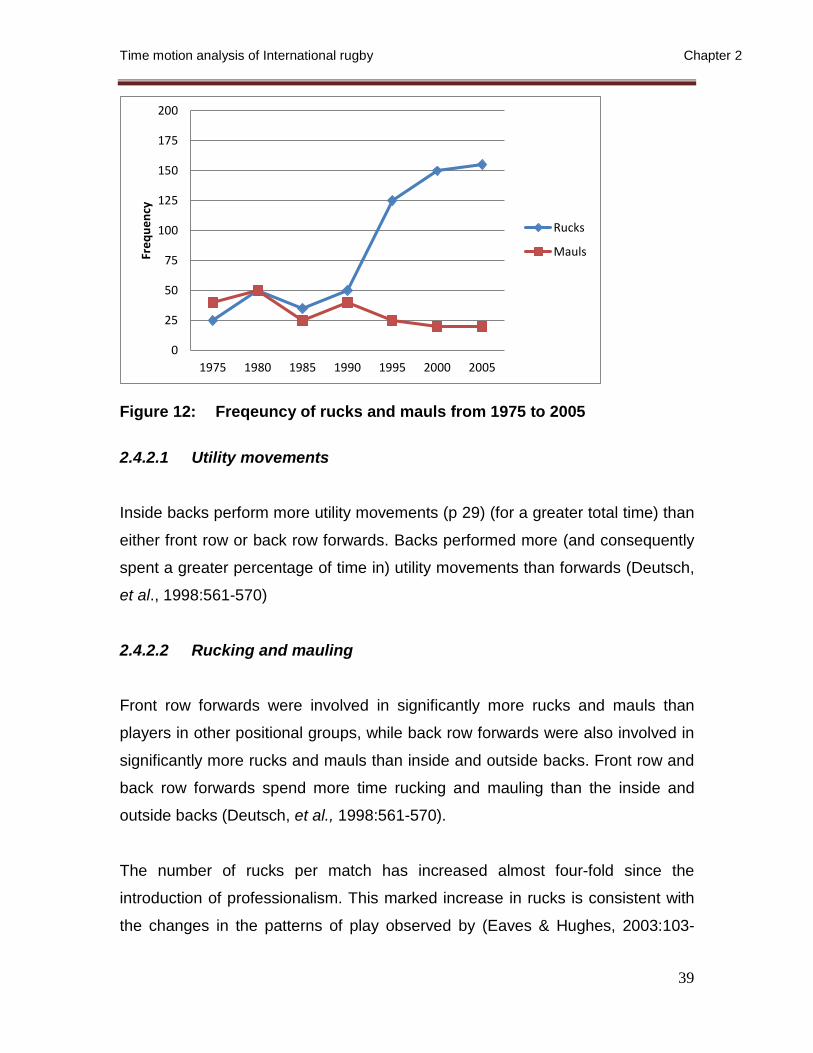
Figure 12: Freqeuncy of rucks and mauls from 1975 to 2005
2.4.2.1 Utility movements
Inside backs perform more utility movements (p 29) (for a greater total time) than
either front row or back row forwards. Backs performed more (and consequently
spent a greater percentage of time in) utility movements than forwards (Deutsch,
et al., 1998:561-570)
2.4.2.2 Rucking and mauling
Front row forwards were involved in significantly more rucks and mauls than
players in other positional groups, while back row forwards were also involved in
significantly more rucks and mauls than inside and outside backs. Front row and
back row forwards spend more time rucking and mauling than the inside and
outside backs (Deutsch, et al., 1998:561-570).
The number of rucks per match has increased almost four-fold since the
introduction of professionalism. This marked increase in rucks is consistent with
the changes in the patterns of play observed by (Eaves & Hughes, 2003:103-
0
25
50
75
100
125
150
175
200
1975 1980 1985 1990 1995 2000 2005
Freq
uenc
y
Rucks
Mauls

Time motion analysis of International rugby Chapter 2
40
111) The number of mauls per match has decreased during the same period,
which also is in line with the patterns observed by (Eaves, Hughes & Lamb,
2005:58-86). Both of these changes are likely to be related to the introduction of
the use-it-or-lose-it law in 1994. This law increased the risk of losing possession
in mauls and made the option of a ruck preferable to that of a maul for the team
in possession of the ball.
2.4.2.3 Tackling
Back row forwards and inside backs are involved in more tackles than front row
forwards, while back row forwards also performed more tackles than outside
backs. There is no trend for forwards to perform more tackles than backs;
tackling seemed to be more a function of specific positional group (Deutsch, et
al., 1998:561-570).
While the number of tackles per match was already showing an upward trend,
there was a large increase following the introduction of professionalism. The
authors believed that this increase was a further consequence of the use-it-or-
lose-it law. This led to players deliberately taking the tackle (Quarrie & Hopkins,
2007:895-903).
2.4.2.4 Scrummaging
There are no differences between front row forwards and back row forwards for
any scrummaging variables (Deutsch; et al., 1998:561-570).
Time motion analysis of International rugby Chapter 2
41
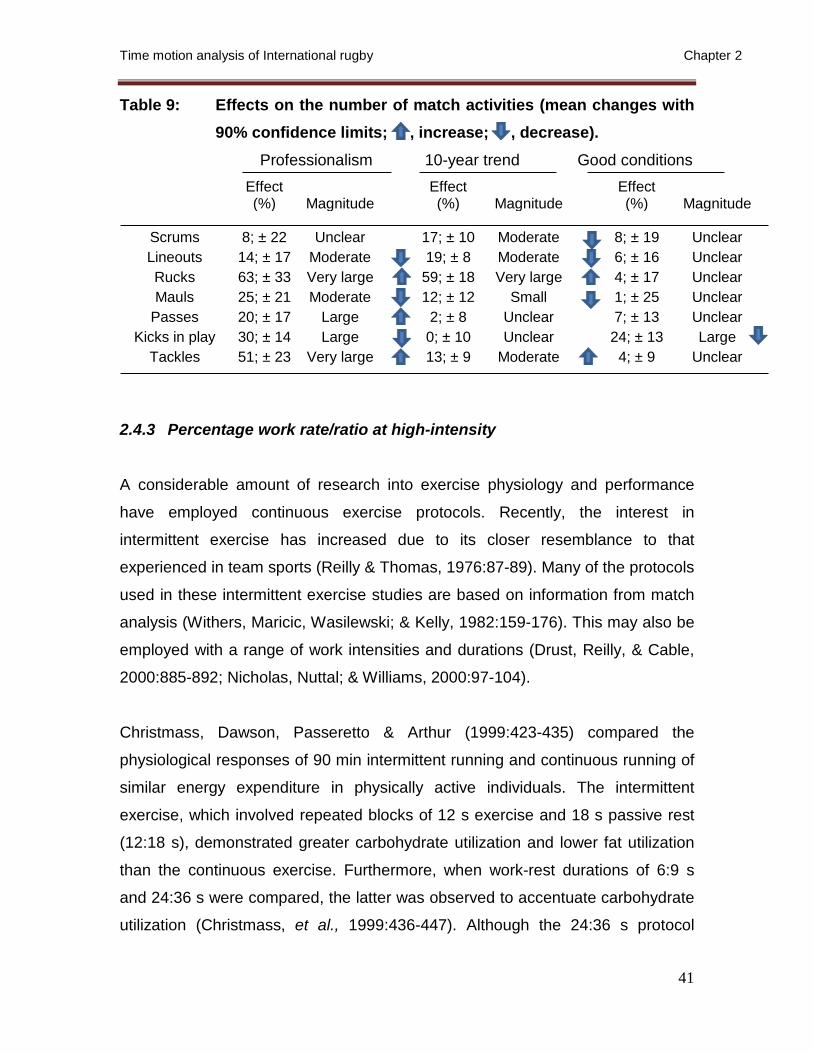
Table 9: Effects on the number of match activities (mean changes with 90% confidence limits; , increase; , decrease).
Professionalism 10-year trend Good conditions
Effect (%) Magnitude
Effect (%) Magnitude
Effect (%) Magnitude
Scrums 8; ± 22 Unclear 17; ± 10 Moderate
8; ± 19 Unclear
Lineouts 14; ± 17 Moderate 19; ± 8 Moderate 6; ± 16 Unclear Rucks 63; ± 33 Very large 59; ± 18 Very large 4; ± 17 Unclear Mauls 25; ± 21 Moderate 12; ± 12 Small 1; ± 25 Unclear
Passes 20; ± 17 Large 2; ± 8 Unclear 7; ± 13 Unclear Kicks in play 30; ± 14 Large 0; ± 10 Unclear 24; ± 13 Large
Tackles 51; ± 23 Very large 13; ± 9 Moderate 4; ± 9 Unclear
2.4.3 Percentage work rate/ratio at high-intensity
A considerable amount of research into exercise physiology and performance
have employed continuous exercise protocols. Recently, the interest in
intermittent exercise has increased due to its closer resemblance to that
experienced in team sports (Reilly & Thomas, 1976:87-89). Many of the protocols
used in these intermittent exercise studies are based on information from match
analysis (Withers, Maricic, Wasilewski; & Kelly, 1982:159-176). This may also be
employed with a range of work intensities and durations (Drust, Reilly, & Cable,
2000:885-892; Nicholas, Nuttal; & Williams, 2000:97-104).
Christmass, Dawson, Passeretto & Arthur (1999:423-435) compared the
physiological responses of 90 min intermittent running and continuous running of
similar energy expenditure in physically active individuals. The intermittent
exercise, which involved repeated blocks of 12 s exercise and 18 s passive rest
(12:18 s), demonstrated greater carbohydrate utilization and lower fat utilization
than the continuous exercise. Furthermore, when work-rest durations of 6:9 s
and 24:36 s were compared, the latter was observed to accentuate carbohydrate
utilization (Christmass, et al., 1999:436-447). Although the 24:36 s protocol

Time motion analysis of International rugby Chapter 2
42
employed by Christmass; et al., (1999:436-447) may not truly represent a work-
rest duration in many team sports competitions, it is relatively close to that
undertaken in a range of training scenarios for sports. An examination of the
underlying physiological responses during different work-rest durations and a
demonstration of the effects on performance will be of use to athletes and
coaches alike.
Of particular interest would be the possible interaction of metabolic substrate
utilization and the incidence of overtraining. For example, increased
carbohydrate metabolism, such as that observed during periods of intense
training, has been suggested to contribute to mechanisms underpinning
overtraining (Petibois, Cazorla, Poortmans; & Deleris, 2002:867-878).
Consequently, a comparison of the physiological and metabolic responses of
different potential training practices (work-rest durations) may aid coaches in
planning appropriate training sessions and in avoiding negative training
adaptations.
Despite running speed and total exercise time (and therefore total work done)
during each protocol being matched, heart rate tended to be higher during the
long and medium work-rest trails than the short work-rest trial. This finding
suggests that the medium and long work-rest trials were physiologically more
demanding (Boyle, Mahoney & Wallace, 1994:235-241).
2.4.4 Work-to-rest ratio
Many of the protocols used in these intermittent exercise studies are based on
information from match analysis and may employ a range of work intensities and
durations (Drust; et al., 2000:885-892). Rugby union involves periods of high-
intensity activity interspersed with periods of incomplete recovery, and players
require qualities such as endurance, speed, agility, and power (Gabbett,
2002:399-405).

Time motion analysis of International rugby Chapter 2
43
Christmass, et al; (1999:423-435) compared the physiological responses of 90
min intermittent running and continuous running of similar energy expenditure in
physically active individuals. The intermittent exercise, which involved repeated
blocks of 12 s exercise and 18 s passive rest (12:18 s), demonstrated greater
carbohydrate utilization and lower fat utilization than the continuous exercise.
Furthermore, when work-to-rest durations of 6:9 s and 24:36 s were compared,
the latter was observed to accentuate carbohydrate utilization. In the study of
Christmass; et al., (1999:423-435) the main finding was that 40 min of
intermittent exercise involving long and medium work-to-rest durations elicits
greater physiological strain and carbohydrate utilization than the same duration
of intermittent exercise with a short work-to-rest duration. Furthermore,
performance duration was related to plasma glucose concentration and heart
rate post intermittent exercise.
Despite running speed and total exercise time (and therefore total work done)
during each protocol being matched, heart rate tended to be higher during the
long and medium work-to-rest trials than the short work-to-rest trial. This finding
suggests that medium and long work-to-rest trials were physiologically more
demanding.
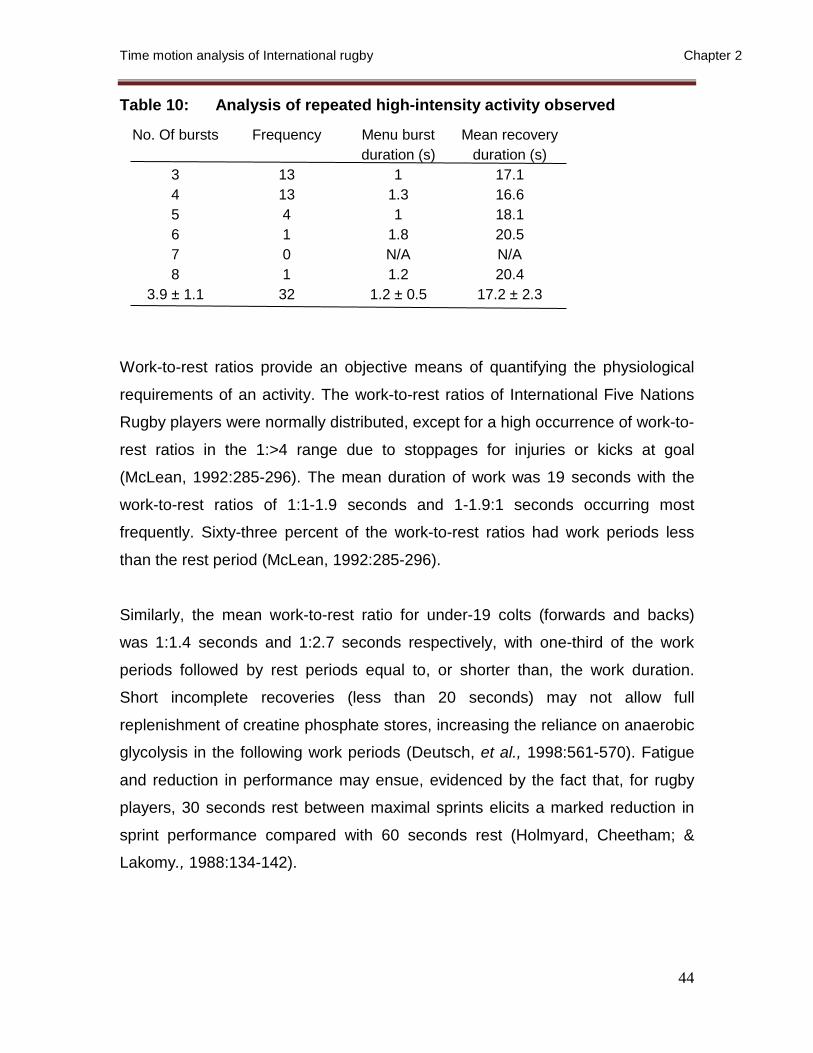
Time motion analysis of International rugby Chapter 2
44
Table 10: Analysis of repeated high-intensity activity observed
No. Of bursts Frequency Menu burst Mean recovery duration (s) duration (s)
3 13 1 17.1 4 13 1.3 16.6 5 4 1 18.1 6 1 1.8 20.5 7 0 N/A N/A 8 1 1.2 20.4
3.9 ± 1.1 32 1.2 ± 0.5 17.2 ± 2.3
Work-to-rest ratios provide an objective means of quantifying the physiological
requirements of an activity. The work-to-rest ratios of International Five Nations
Rugby players were normally distributed, except for a high occurrence of work-to-
rest ratios in the 1:>4 range due to stoppages for injuries or kicks at goal
(McLean, 1992:285-296). The mean duration of work was 19 seconds with the
work-to-rest ratios of 1:1-1.9 seconds and 1-1.9:1 seconds occurring most
frequently. Sixty-three percent of the work-to-rest ratios had work periods less
than the rest period (McLean, 1992:285-296).
Similarly, the mean work-to-rest ratio for under-19 colts (forwards and backs)
was 1:1.4 seconds and 1:2.7 seconds respectively, with one-third of the work
periods followed by rest periods equal to, or shorter than, the work duration.
Short incomplete recoveries (less than 20 seconds) may not allow full
replenishment of creatine phosphate stores, increasing the reliance on anaerobic
glycolysis in the following work periods (Deutsch, et al., 1998:561-570). Fatigue
and reduction in performance may ensue, evidenced by the fact that, for rugby
players, 30 seconds rest between maximal sprints elicits a marked reduction in
sprint performance compared with 60 seconds rest (Holmyard, Cheetham; &
Lakomy., 1988:134-142).
Time motion analysis of International rugby Chapter 2
45
Front row and back row forwards performed more high-intensity work than inside
and outside backs, as the result of performing work more frequently. This
difference is reinforced by overall differences between backs and forwards for
both variables. Although there is no difference in mean work duration between
groups, front row and back row forwards have significantly longer maximum work
periods during play than inside and outside backs. The mean rest period was
significantly longer for inside and outside backs than for front row and back row
forwards. Front row and back row forwards has significantly shorter maximum
rest periods than inside and outside backs, which is reinforced by the overall
backs versus forwards difference (p < 0.0125; Table 1) (Deutsch; et al.,
1998:561-570). As a result of a shorter mean rest period, the inside and outside
backs has a significantly lower mean work-to-rest ratio than front row and back
row forwards, which is again confirmed at the forwards versus backs level of
comparison (Deutsch; et al., 1998:561-570).
2.4.5 Implications for fitness training
Work-to-rest ratio data for backs in the previous studies (mean work of 5
seconds, mean rest of 80 – 110 seconds) indicates that the creatine phosphate
system likely plays an important role in these positions (Balsom, Seyer, Sjodin; &
Ekblom., 1992:528-533). While not statistically significant, the difference in mean
rest period between inside and outside backs (-25s) has important physiological
implications.
Despite a slightly longer mean sprint distance, the greater opportunity for outside
backs to recover should be reflected in the design of fitness training sessions.
With approximately 30% of work-to-rest periods being less than 1:7, however,
there are still likely to be periods of play when the incomplete replenishment of
creatine phosphate stores would result in an increased dependence on the
anaerobic glycolytic pathway, in all positions. However, to develop maximal
speed/ power, it may be necessary to incorporate some training in which
Time motion analysis of International rugby Chapter 2
46
adequate recovery is provided between high-intensity sprints to allow the
replenishment of creatine phosphate, particularly in outside backs.
In time-motion analysis, movement patterns, distance covered, average
velocities, levels of exertion and work-to-rest ratios can be established by
quantifying the time spent in different activities. The information obtained from
these analyses allows coaches to structure training programmes specific to the
requirements of the game, and facilitates more effective training and improved
performance (Deutsch, et al., 1998:561-570).
Results from Roberts; et al., (2006:386-397) showed that in elite rugby union,
high-intensity activity completed by backs was more sporadic and predominantly
running based, whereas high-intensity activity performed by forwards was more
frequent and static exertion based. Therefore, it is possible to identify position-
specific performance parameters when developing programmes and protocols.
On the other hand, work-to-rest ratio data from forwards indicate that the creatine
phosphate system may play a less significant role in energy provision in this
group. While the mean work period for forwards was also 5s, the mean rest
period of approximately 30-40s would in most cases result in only partial
replenishment of creatine phosphate stores (Gaitanos, Casey, Hultman; &
Sjoholm., 1993:712-719). Despite the similarities in mean work period between
positional groups, the higher work rates characteristic of forwards’ play was once
again evidenced by the significantly longer maximum work periods. While
forwards are often required to perform work bouts of approximately 20-25s, the
corresponding figure for backs is only about half as long (12-14s). Although some
non-significant differences were evident when comparing front and back row
forwards, in practical terms these are less likely to impact on physiological
consequences than the larger discrepancies noted between the inside and
outside backs.

Time motion analysis of International rugby Chapter 2
47
During intermittent, high-intensity sports such as rugby, anaerobic glycolysis
represents an important source of energy for the repeated performance of high-
intensity activities, as evidenced by the work-to-rest ratios in previous studies.
The creatine phosphate system, when fully replenished, has been shown to
contribute very little to work bouts of longer than 10s (Hultman, Greenhaft, Ren;
& Soderland., 1991:347-353). When average work periods are approximately 5s,
anaerobic glycolysis can be expected to contribute up to 50% of the energy
required. Although the mean work duration in all positions are approximately 5s,
forwards could expect to complete at least one work period lasting over 20s in
duration. Furthermore, work-to-rest ratios determinate that over 20% of forwards’
work bouts are followed by rest periods of equal or lesser duration. The
implication of this finding is that forwards will have to rely almost solely on
anaerobic glycolysis and aerobic sources for the latter parts of these periods of
play, and may be more likely to experience fatigue as a result of hydrogen ion
accumulation (Deutsch, et al., 1998:561-570; Docherty, et al., 1988:269-277;
McLean, 1992:285-296). In backs, fatigue resistance is less likely to be a limiting
factor, as these players perform shorter periods of maximum work (- 10
seconds), and approximately 90% of work periods were followed by equal or
longer rest periods. It has been shown that performance during repeated sprints
of 5 – 6 seconds duration can be maintained when separated by passive
recovery periods of 120 seconds (Balsom, et al., 1992:528-533).
Greater professionalism in rugby has increased the interest in sport science
aspects of training and competition. Studies have investigated the seasonal
variation in performance, effects of specific tactics, influence of climate and the
consequences of acute altitude exposure (Duthie; et al., 2003:973-991). Further
research in these areas, coupled with more comprehensive studies of the
physical characteristics of players, fitness requirements and movement patterns
of rugby, will contribute to the development of more effective conditioning
programmes (Duthie; et al., 2003:973-991)
Time motion analysis of International rugby Chapter 2
48
2.5. Differences between levels of competitions
Two studies have investigated the movement pattern differences among various
levels of competition (Docherty, et al., 1988:269-277). During Super 12 games,
the premier Southern Hemisphere rugby competition, the total work (time spent
cruising, sprinting, tackling, jumping, rucking / mauling, and scrummaging) for
forwards (10 minutes) and backs (4 minutes) was similar to forwards and backs
of club level (10 and 4 minutes, respectively) (Deutsch; et al., 2002:160-166).
The number of work efforts per game for Super 12 forwards (122 ± 18) and
backs (47 ± 9) was similar to first-division players (forwards 118 ± 23, backs 55 ±
11).
The mean work period for Super 12 forwards and backs were 5.1 and 4.7
seconds, respectively. The average rest period (inactive, walking, jogging,
shuffling sideways or backwards) ranged from 34 seconds for first-division
forwards to 100 seconds for Super 12 backs. During club and international-level
games, differences were found in the time spent in running activities with centres
of international standard spending more time per game in non-running intense
activity (5.4%) than club centres (1.8%) (Docherty; et al., 1988:269-277). Super
12 backs spent more time in utility movements (backwards and sideways
walking, and jogging) when compared with the club backs (3.7 ± 2.0% and 2.3 ±
1.0%, respectively) (Deutsch, et al., 2002:160-166). Overall, there appears to be
only minor differences in movement patterns of players between international-
and club-level rugby. It is possible that the game speed between these levels of
competition is not apparent from the time-motion analysis data collected.
There has been a marked change in the body mass of elite rugby players over
the last three decades. Differences in body mass also occur across different
levels of competition. New Zealand senior A forwards (98.5 ± 11.5kg) were
significantly heavier than their senior B equivalents (88.1 ± 10.2kg), and as

Time motion analysis of International rugby Chapter 2
49
expected, senior players had substantially greater body mass compared with
colt-level players. Increased professionalism in the physical preparation is a likely
cause of the increased body mass of rugby players, with this increase greater in
the forwards (Olds, 2001:253-262).
Differences in stature among the various positional groups in rugby are unclear.
Recent literature has demonstrated that county and international forwards and
backs have similar stature. Conversely others have shown that both first- and
second-class forwards are markedly taller than backs in the same level (Tong,
Bell; & Ball, 2001:289-297). At higher levels, there is a clearer distinction in
stature between forwards and backs. The positional demands of rugby require
certain characteristics and this is particularly evident for the lock position in which
the overall jump height achieved during the lineout is crucial to success. Locks
have similar relative vertical jump performance to other forwards and are inferior
when compared with the backs (Maud, 1983:16-23).
A recent study examining frequencies of match activities in international matches
played in the northern hemisphere found a decrease in scrum frequency over
time (from 1988-1992 to 2000-2002) but no significant effect for the change from
the pre-professional to the professional era (Eaves; et al., 2005:58-86). Players
in the professional era spend more time in organized team practices, and the
rewards available to those players who are able to obtain professional contracts
mean that the development of skills receives greater focus than previously.

Time motion analysis of International rugby Chapter 2
50
Table 11: Effects on points and penalty activities (mean changes with 90% confidence limits; , increase; , decrease)
2.6. Variables that affect player characteristics and match activities
The changes in match activities and player characteristics observed are probably
due to several factors, including law changes, developments in match analysis
and tactics, modifications to player training and equipment technology. Eaves &
Hughes (2003:103-111) reported that ball-in-play time increased by a mean of 4
min and 45 s following the introduction of professionalism. They observed a
similar pattern, with predicted ball-in-play time in good conditions increasing by 5
min and 54 s between 1995 and 2004. The increase in ball-in-play time is related
to the decrease in numbers of scrums and lineout’s. Scrums are restarts in play
after minor infringements, and lineout’s are restarts when the ball travels over the
sidelines. This increase in effective playing time has been offset to some extent
for individual players through the introduction of three law changes to the sport:
the ability to substitute players for tactical purposes in 1997, the “blood-bin” that
allows players who have bleeding wounds to be temporarily replaced, and the
introduction of red and yellow cards in 2000.
Professionalism 10-year trend Good conditions Effect Magnitude Effect Magnitude Effect Magnitude
Points scored 31; ± 40 Moderate 9.1; ± 20 Unclear 62; ± 57 Large Tries scored 72; ± 104 Large 1; ± 32 Unclear 78; ± 100 Large
Conversions 45; ± 125 Unclear 9; ± 48 Unclear 73; ± 144 Unclear Penalties awarded 1; ± 25 Unclear 5; ± 13 Unclear 10; ± 19 Unclear
Penalties attempted 10 ± 37 Unclear 6; ± 22 Unclear 30; ± 52 Unclear Penalties successful 8; ± 50 Unclear 17; ± 33 Unclear 11; ± 53 Unclear
Goals successful (%) 8; ± 27 Unclear 13; ± 18 Moderate 16; ± 20 Moderate
Time motion analysis of International rugby Chapter 2
51
There was a rapid decrease in mean time spent on the field per player following
the introduction of substitutes, and there was a corresponding increase in the
number of players taking part in each match. Analysis of the effect of
environmental conditions indicates that teams make more substitutions in
matches played in better conditions (Eaves & Hughes, 2003:103-111).
According to Eaves & Hughes (2003:103-111) the following variables will play a
important role on the distances and intensities of the game:
2.6.1 Magnitude of the game
In most finals the ball will rather be kicked for touch or take the penalty for goal
rather than running the ball. These are all situation specific. Finals are always
close affairs.
2.6.2 Law variations
In rugby, changes in the rules have made the play ‘more open’, faster and more
attractive to spectators. For example, there is greater policing of the breakdown
by referees in an attempt to ensure that the ball is quickly recycled and play
continues (Hughes & Blunt, 1998:184-190). Because coaches and players seek
a competitive advantage with respect to other teams and individual players, they
tend to interpret and apply the laws in a manner that provides them with the
maximum benefit. Thus law changes might or might not yield outcomes that were
aligned with the intention of the law makers when the change was made (Hughes
& Blunt, 1998:184-190).
The new Experimental Law Variations (ELV’s) has given rugby new life. There
are less kicking and more running of the ball. The ball is much longer in play thus
increasing fitness required by players.

Time motion analysis of International rugby Chapter 2
52
Analysis can also be conducted to quantify important game structures to indicate
what effect law changes have had on the game. A significant change in the game
from the 1991 to 1995 World Cup occurred in the number of second phase
possessions, which rose 44% from 48 to 69 per match. The term second phase
is possibly an inaccurate term, as the researchers are actually referring to all
phases beyond the first. This type of possession can simply be called “phase
play”, that is, all phases emanating from rucks and mauls rather than from the
possession platform. In any case, the increase in phase play possession appears
to be a positive outcome of the “use it or lose it law” the IRB implemented in
1994. The use it or lose it law discourages teams from letting play end in a maul
or collapsed maul with the ball in their possession, by ruling that in this situation
the ensuing scrum will be awarded to the opposition (Quarrie & Hopkins,
2007:895-903).
Carter & Potter (1996:187) analyzed time elapsed when ball is not in play during
the 80 min of running time per match. Such analysis provides useful information
for Rugby’s administrators, identifying which areas of the game lead to the
greatest amount of wasted time. The wasted time during stoppages in play
occurs mainly during preparation for 25 set pieces (scrums, lineouts and kickoffs)
and shots at goal. Carter & Potter (1996:187) reported that in three matches
during the 1995 World Cup, preparation for shots at goal took over twenty
minutes, with the greatest amount of time wasted being 26 min 46 sec during the
match between New Zealand and Scotland. Such information may have led to
the introduction of the rule giving goal kickers a maximum of 1 min to take their
shot at goal.
International Rugby Board (IRB) analysis has since shown that the average “ball
in play” time per game has dramatically increased over the last 15 years. In 1991
it was 25 minutes, and has gradually increased through to an all time high in
2003 of 34 minutes (Williams, Hughes & O’Donoghue, 2005:1-11).

Time motion analysis of International rugby Chapter 2
53
2.6.3 Game structure
The structure of play has also improved with teams having a set plan and
definitive roles for each player. Few studies have detailed the movements of
players during rugby either under the new or traditional rules and there is a need
for further analysis on the current game at the elite level (Hughes & Clarke,
1994:180). Some teams play much more with their forwards and try to create
more rucks and mauls that can continue for 30 – 60 sec. This will place a bigger
demand on the fitness of the forwards than that of the backs.
2.6.4 Weather conditions
The weather can be a determining factor especially when playing in the rain.
Kicks and handling errors are much more prominent, thus decreasing playing
time. Games played in the rain are also low scoring games due the constraints of
not being able to run the ball that often.
2.6.5 Home and away games
Courneya & Carron (1992:13-27) were the first researchers to synthesize the
results of 16 studies and results indicating that home advantage definitely exists,
yet varied significantly ranging from 52.3% in basketball to 69% in soccer. They
also defined home advantage as “the term used to describe the consistent
finding that home teams in sport competitions win over 50% of the games played
under a balanced home and away schedule”.
The problem that has been of much debate has been to find the causes
associated with this home advantage effect. Traditionally the causes of the home
advantage were established under four subheadings: 1: Crowd support – in
terms of size and density; 2: Familiarity with local conditions – associated with
differing levels of intimacy with arena/ground facilities; 3: Travel factors – based
Time motion analysis of International rugby Chapter 2
54
on the assumption that visiting teams experience greater fatigue and disruptions
in preparation and routines; 4: Rule factor – Might extend special privileges
explicitly favoring the home team (Courneya & Carron, 1992:13-27).
Clark (2005:375-385) indicated that the percentage of wins by the home team
depends as much on the closeness of the competition and the variability of the
results as on the home advantage. In teams equal in ability, only a small home
advantage will result in the home team winning. If teams were wide apart in
ability, home advantage would not overcome large ability differences.
Morton (2006:495-499) evaluated home advantage both for national (Super 12)
and international (Tri-nations) rugby teams from South Africa , Australia and New
Zealand, over a five-year period 2000-2004 using linear modeling. These home
advantages were examined for statistical and practical significance, variability
between teams, stability over time, and for inter-correlation. The data revealed
that the overall home advantage in elite rugby union has a mean of +6.7 points,
and that this changes little from year to year. Closer examination revealed a high
degree of variability. Different teams can and do have different home
advantages, which ranges from a low of -0.7 to a high of +28.3 points in any one
year (Table 12).

Time motion analysis of International rugby Chapter 2
55
Table 12: Super 12 home advantage estimates
Team 2000 2001 2002 2003 2004 Mean
Blues -8.6 1.3 7.0 8.8 0.0 1.7
Brumbies 5.8 18.0 -8.5 22.9 18.4 11.3
Bulls 18.7 -3.5 -8.1 -7.6 14.4 2.8
Cats 30.6 1.9 17.8 14.7 6.7 14.3
Chiefs 6.5 12.4 -5.0 7.8 -0.7 4.2
Crusaders 9.3 9.0 20.5 5.9 1.6 9.3
Highlanders 16.4 21.4 -5.6 18.2 14.2 12.9
Hurricanes 11.8 0.9 -9.8 2.6 13.7 3.8
Reds 9.5 0.9 15.7 4.7 14.6 12.7
Sharks -4.1 3.5 31.2 -5.3 -7.5 3.6
Stormers -3.2 -1.2 -4.3 -9.0 -3.6 -4.3
Waratahs 4.3 28.3 6.9 -3.2 16.0 10.5
Common 8.3 7.7 4.7 5.1 7.3 6.7
2.6.6. Competition structure
The “Bonus point” determines the end of the game in many situations. Teams will
continue play even after the sirens gone if there is the possibility for a bonus
point. Games can continue well after the 40 or 80 minutes of play.

Time motion analysis of International rugby Chapter 3
56
CHAPTER 3 – Methodology
3.1 Method An empirical design was used during this study to determine if time motion
analysis can be implemented as a variable in identifying rugby success to
determine which variable in Time motion analysis correlates the highest with
success and to determine if there are significant differences (P< 0.05) between
positions in the different components in the Time motion analysis. Determination
of the most important parameters included distance covered, high intensity
distance covered and percentage work rate at high intensity.
3.2 Subjects The participants varied from Super 14 level (Bulls, Sharks, Lions, Brumbies,
Crusaders, Stormers and Waratahs) to international test playing nations,
including South Africa, New Zealand and Australia.
Players from each of the positional groups were studied: Front rows (players
1,3), Locks (players 4,5), Loose forwards (players 2,6,7,8), Inside backs (players
9,10,12,13), and Outside backs (players 11,14,15). A total of (n=36) front rows
were evaluated, (n=36) locks, (n=72) loose forwards, (n=72) inside backs and
(n=54) outside backs.
3.3 Protocol Time motion analysis was conducted on 18 games played during the 2005-2007
Super 14 competition, Tri-nations and International tours. Data was supplied by
the ProZone Company to the South African Rugby Union and management
team. The study did not involve any verbal or physical contact with the players,
as data were collected with informed consent via the Springbok teams’ analyzer
and the ProZone analysis system.

Time motion analysis of International rugby Chapter 3
57
3.4 Equipment ProZone is an English company that offers a system for analyzing football
matches. ProZone’s match analysis consists of four parts: Animation, Game
Analysis, Fitness and Statistics. In the animation part, an animation with players
represented by circles gives an overview of the movements of the teams as a
whole and of the individual players. In all four parts a large number of numerical
and visual data is presented about the game. Distance covered by each player,
passes made and work intensity are examples of statistics that the system
provides.
3.5 Procedure To obtain data about the game, ProZone uses eight cameras placed around the
stadium in combination with manual operators. Computer vision technology is
used to capture the movements of the players and the ball, but a lot of manual
work is required, not only to register all the events that happen during the game,
such as free kicks, corners and passes, but also to aid the automatic tracking
(Mylvaganam, Ramsay & De Craca, 2002:334).
3.6 Statistical analysis Data was captured electronically by the researcher in Microsoft Excel (Microsoft
Office 2007). Any further analysis was done by a biostatistician using SAS
Version 9.1.3. Means and standard deviations were calculated for numerical data
of distance, high-intensity distance and percentage work rate at high intensity.
Mean values between winning and losing sides and home and away games were
compared using the t-test procedure. A significance level of 0.05 is used
throughout. Correlation analysis was performed and the Pearson’s correlation
coefficient was calculated.
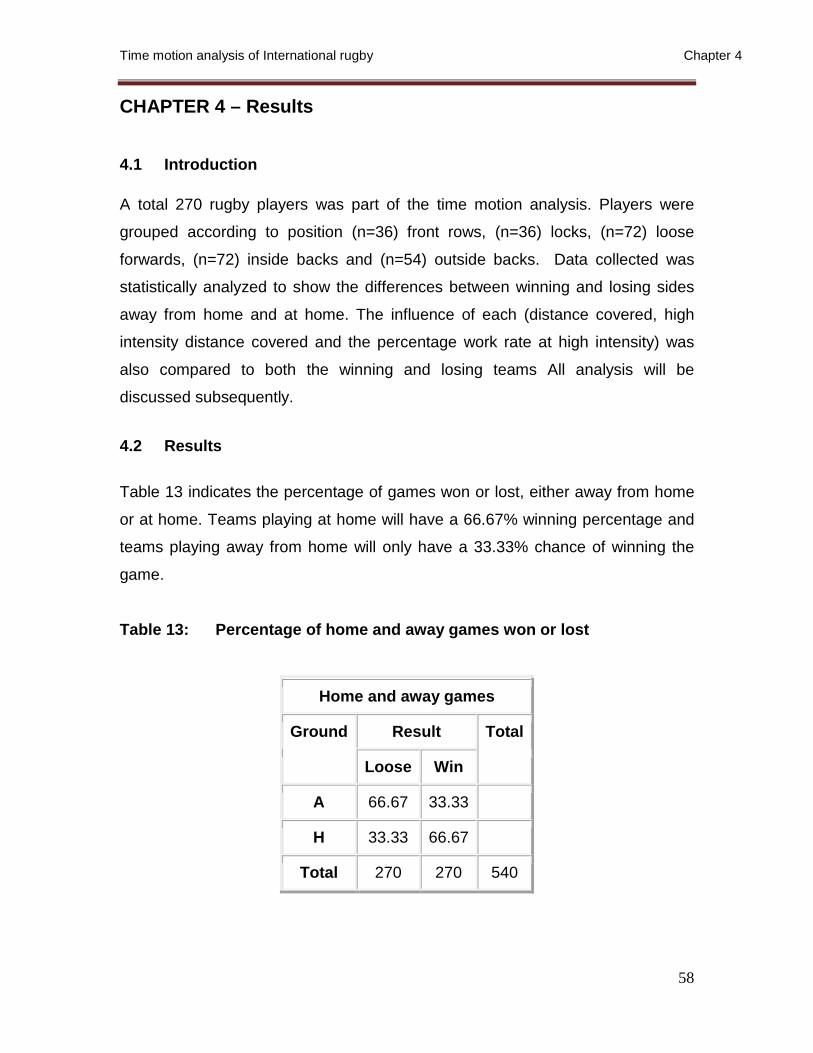
Time motion analysis of International rugby Chapter 4
58
CHAPTER 4 – Results
4.1 Introduction A total 270 rugby players was part of the time motion analysis. Players were
grouped according to position (n=36) front rows, (n=36) locks, (n=72) loose
forwards, (n=72) inside backs and (n=54) outside backs. Data collected was
statistically analyzed to show the differences between winning and losing sides
away from home and at home. The influence of each (distance covered, high
intensity distance covered and the percentage work rate at high intensity) was
also compared to both the winning and losing teams All analysis will be
discussed subsequently.
4.2 Results Table 13 indicates the percentage of games won or lost, either away from home
or at home. Teams playing at home will have a 66.67% winning percentage and
teams playing away from home will only have a 33.33% chance of winning the
game.
Table 13: Percentage of home and away games won or lost
Home and away games
Ground Result Total
Loose Win
A 66.67 33.33
H 33.33 66.67
Total 270 270 540

Time motion analysis of International rugby Chapter 4
59
Table 14 illustrates the distance covered, high intensity distance covered and
percentage work rate at high intensity for winning and losing teams. During the
games analyzed only the locks from the winning teams were unable to cover
more distance than the losing teams (5958.2m vs. 6263.1m). All other positions
(Front rows, loose forwards, inside backs, outside backs) from the winning teams
covered more distance. All the positions (Front rows, locks, loose forwards,
inside backs, and outside backs) from the winning teams were unable to achieve
a higher percentage work rate at high intensity than that of the losing teams.
Table 14 also indicates that losing teams also had a higher average percentage
of work rates than winning teams (19 ± 5 vs. 18 ± 5).
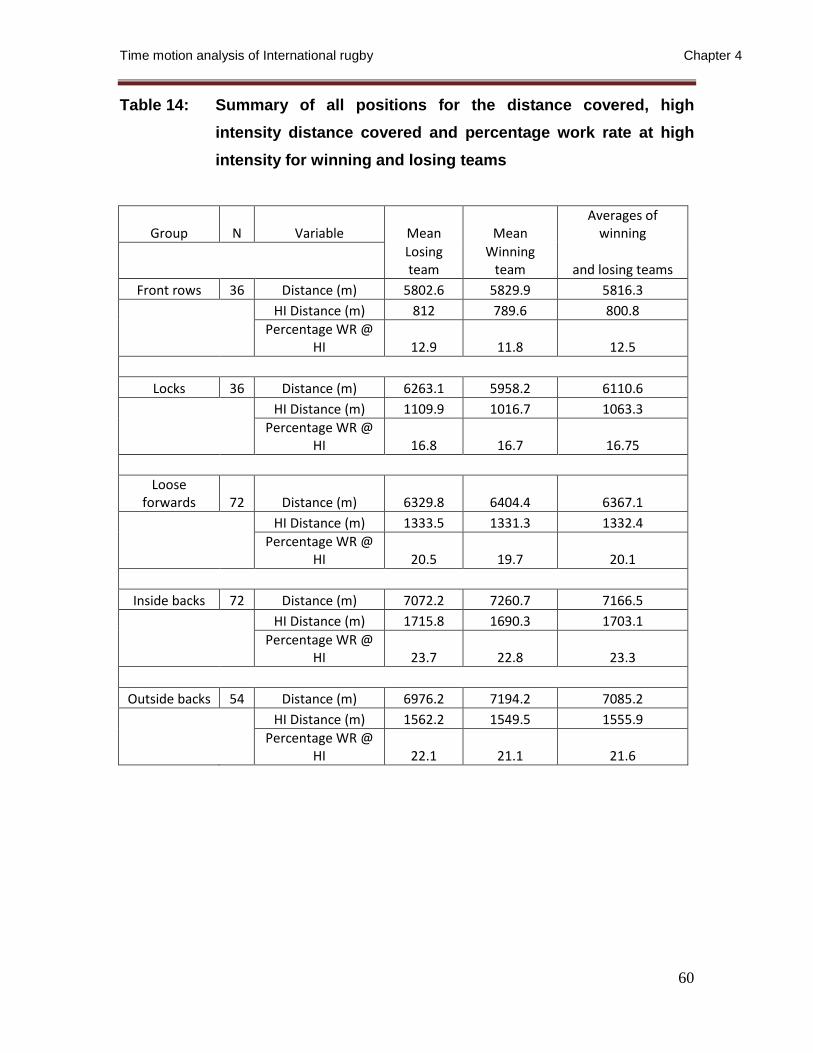
Time motion analysis of International rugby Chapter 4
60
Table 14: Summary of all positions for the distance covered, high intensity distance covered and percentage work rate at high intensity for winning and losing teams
Group N Variable Mean Mean Averages of
winning
Losing team
Winning team and losing teams
Front rows 36 Distance (m) 5802.6 5829.9 5816.3 HI Distance (m) 812 789.6 800.8
Percentage WR @
HI 12.9 11.8 12.5
Locks 36 Distance (m) 6263.1 5958.2 6110.6 HI Distance (m) 1109.9 1016.7 1063.3
Percentage WR @
HI 16.8 16.7 16.75
Loose forwards 72 Distance (m) 6329.8 6404.4 6367.1
HI Distance (m) 1333.5 1331.3 1332.4
Percentage WR @
HI 20.5 19.7 20.1
Inside backs 72 Distance (m) 7072.2 7260.7 7166.5 HI Distance (m) 1715.8 1690.3 1703.1
Percentage WR @
HI 23.7 22.8 23.3
Outside backs 54 Distance (m) 6976.2 7194.2 7085.2 HI Distance (m) 1562.2 1549.5 1555.9
Percentage WR @
HI 22.1 21.1 21.6
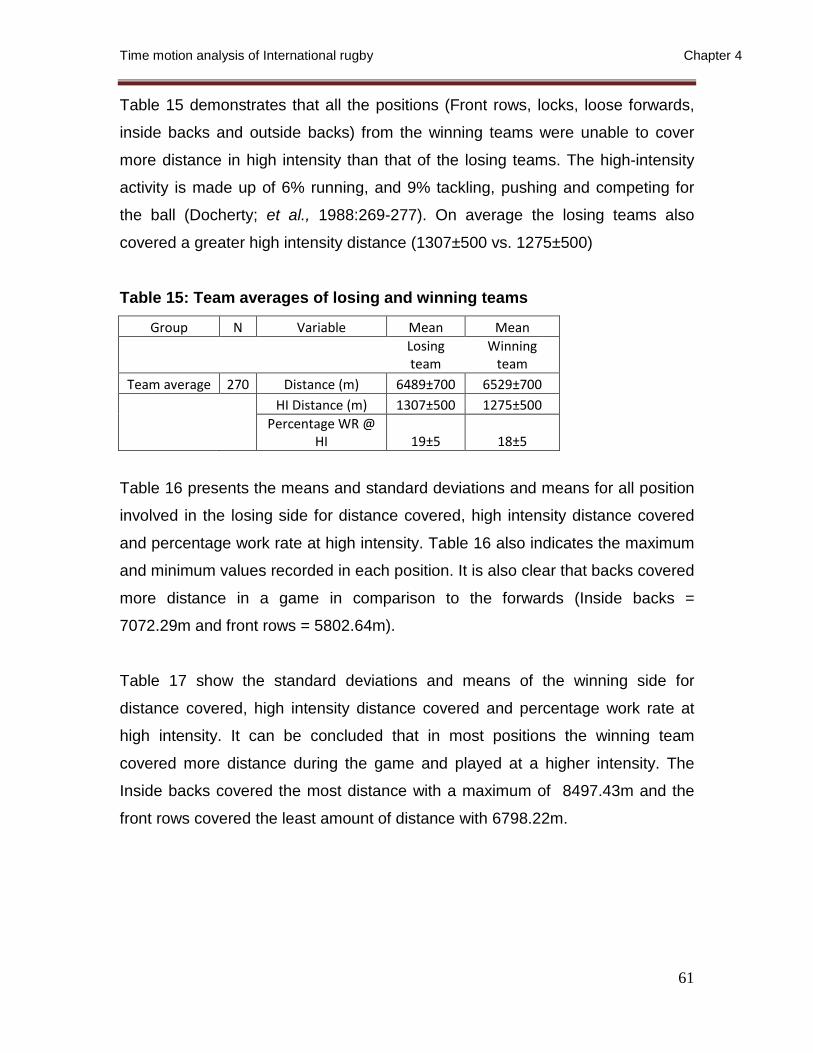
Time motion analysis of International rugby Chapter 4
61
Table 15 demonstrates that all the positions (Front rows, locks, loose forwards,
inside backs and outside backs) from the winning teams were unable to cover
more distance in high intensity than that of the losing teams. The high-intensity
activity is made up of 6% running, and 9% tackling, pushing and competing for
the ball (Docherty; et al., 1988:269-277). On average the losing teams also
covered a greater high intensity distance (1307±500 vs. 1275±500)
Table 15: Team averages of losing and winning teams
Group N Variable Mean Mean
Losing team
Winning team
Team average 270 Distance (m) 6489±700 6529±700 HI Distance (m) 1307±500 1275±500
Percentage WR @
HI 19±5 18±5
Table 16 presents the means and standard deviations and means for all position
involved in the losing side for distance covered, high intensity distance covered
and percentage work rate at high intensity. Table 16 also indicates the maximum
and minimum values recorded in each position. It is also clear that backs covered
more distance in a game in comparison to the forwards (Inside backs =
7072.29m and front rows = 5802.64m).
Table 17 show the standard deviations and means of the winning side for
distance covered, high intensity distance covered and percentage work rate at
high intensity. It can be concluded that in most positions the winning team
covered more distance during the game and played at a higher intensity. The
Inside backs covered the most distance with a maximum of 8497.43m and the
front rows covered the least amount of distance with 6798.22m.

Time motion analysis of International rugby Chapter 4
62
Table 16: Standard deviation and means for losing teams
Result N Obs
Variable Mean Std Dev Minimum Maximum
Front row
36 Distance (m) 5802.64 698.0329 3229.98 6798.22 HI Dist (m) 812.0986 287.8291 290.49 1479.52 Perc WR HI 12.91156 4.118145 4.24 21.76
Inside backs
72 Distance (m) 7072.29 677.9053 4375.54 8497.43
HI Dist (m) 1715.85 396.4054 776.37 3063.21 Perc WR HI 23.72636 4.393132 10.13235 38.96
Locks 36 Distance (m) 6263.13 498.5196 5085.71 7277.14
HI Dist (m) 1109.94 305.9056 749.65 2320.76 Perc WR HI 16.83098 4.58602 8.14 31.89
Loose forwards
72 Distance (m) 6329.81 485.2042 4444.83 7682.68
HI Dist (m) 1333.51 317.7267 655.95 2113.57 Perc WR HI 20.52674 4.377938 8.747686 29.77
Outside backs
54 Distance (m) 6976.29 715.9704 5330.93 8126.42
HI Dist (m) 1562.21 347.039 750 2257.65 Perc WR HI 22.12272 3.592787 12.97 30.034459

Time motion analysis of International rugby Chapter 4
63
Table 17: Standard deviation and means for winning teams
Result N Obs
Variable Mean Std Dev Minimum Maximum
Front rows
36 Distance (m) 5829.93 547.3744 4533.61 6846.33
HI Dist (m) 789.6025 318.4123 285.34 1450.71 Perc WR HI 11.88468 4.891471 5.44 23.56
Inside backs
72 Distance (m) 7260.76 586.9603 4550.66 8813.97
HI Dist (m) 1690.39 325.7852 1117.99 2460.72 Perc WR HI 22.8672 3.602171 14.65187 32.56
Locks 36 Distance (m) 5958.21 679.7972 4176.41 6948.42
HI Dist (m) 1016.75 242.5886 500.53 1499.94 Perc WR HI 16.75524 3.365647 9.82 23.14
Loose forwards
72 Distance (m) 6404.44 421.0528 5229.04 7254.99
HI Dist (m) 1331.32 276.8351 722.77 2233.95 Perc WR HI 19.75467 3.770731 11.83 30.8
Outside backs
54 Distance (m) 7194.27 523.0664 6125.08 8549.1
HI Dist (m) 1549.5 254.7495 950.29 2112.05 Perc WR HI 21.11886 2.871532 15.07 28.722166
Table 18 indicates the Pearson correlation coefficients between the three
variables (distance covered, high intensity distance covered and percentage
work rate at high intensity) and winning and losing, front rows, locks, loose
forwards, inside backs and outside backs.

Time motion analysis of International rugby Chapter 4
64
Table 18: Pearson correlation coefficients
Distance HI Distance % Work rate Winning 0.67 0.62 0.54
Losing 0.54 0.56 0.53
Front rows 0.022 -0.037 -0.11
Locks -0.25 -0.17 -0.01
Loose forwards 0.08 -0.003 -0.09
Inside backs 0.15 -0.035 -0.10
Outside backs 0.17 -0.021 -0.15
Table 19 compares the values of all variables with winning and losing. All
positional groups were assessed. Four of the five positional groups won the
distance covered. Not one of the groups was able to cover more high intensity
distance or had a higher percentage work rate at high intensity.
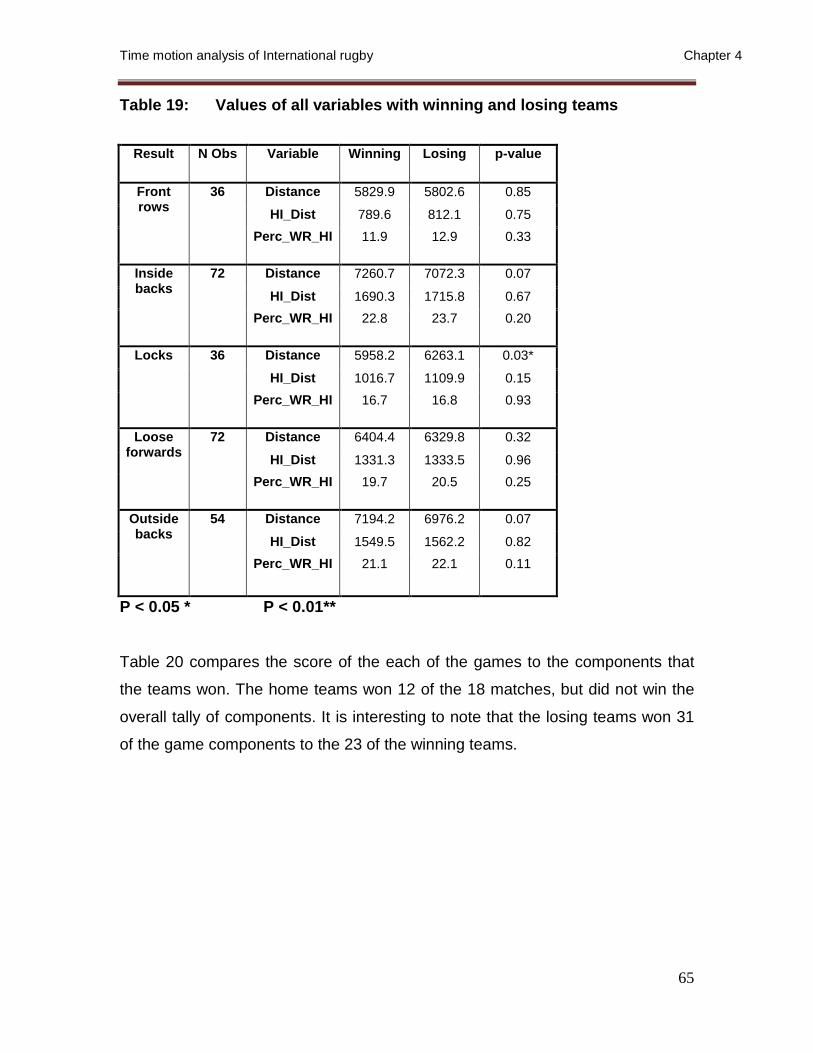
Time motion analysis of International rugby Chapter 4
65
Table 19: Values of all variables with winning and losing teams
Result N Obs Variable Winning Losing p-value
Front rows
36 Distance 5829.9 5802.6 0.85
HI_Dist 789.6 812.1 0.75 Perc_WR_HI 11.9 12.9 0.33
Inside backs
72 Distance 7260.7 7072.3 0.07
HI_Dist 1690.3 1715.8 0.67 Perc_WR_HI 22.8 23.7 0.20
Locks 36 Distance 5958.2 6263.1 0.03*
HI_Dist 1016.7 1109.9 0.15 Perc_WR_HI 16.7 16.8 0.93
Loose forwards
72 Distance 6404.4 6329.8 0.32
HI_Dist 1331.3 1333.5 0.96 Perc_WR_HI 19.7 20.5 0.25
Outside backs
54 Distance 7194.2 6976.2 0.07
HI_Dist 1549.5 1562.2 0.82 Perc_WR_HI 21.1 22.1 0.11
P < 0.05 * P < 0.01**
Table 20 compares the score of the each of the games to the components that
the teams won. The home teams won 12 of the 18 matches, but did not win the
overall tally of components. It is interesting to note that the losing teams won 31
of the game components to the 23 of the winning teams.
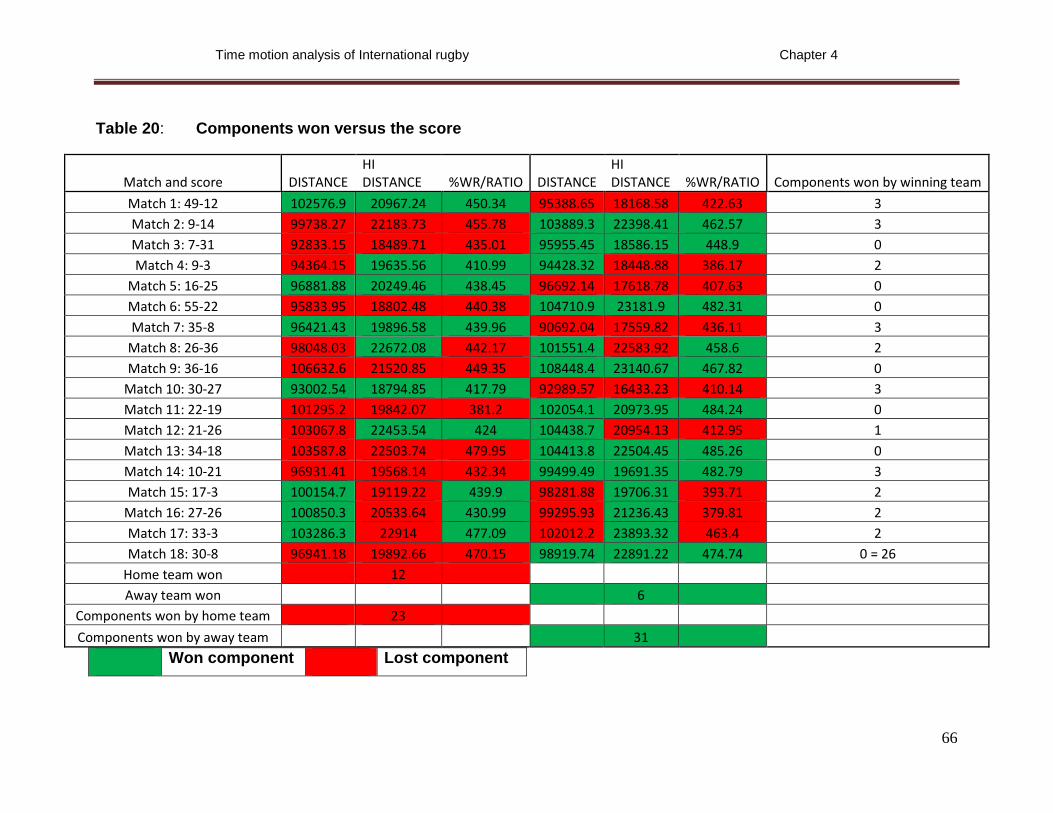
Time motion analysis of International rugby Chapter 4
66
Table 20: Components won versus the score
Won component Lost component
Match and score DISTANCE HI DISTANCE %WR/RATIO DISTANCE
HI DISTANCE %WR/RATIO Components won by winning team
Match 1: 49-12 102576.9 20967.24 450.34 95388.65 18168.58 422.63 3 Match 2: 9-14 99738.27 22183.73 455.78 103889.3 22398.41 462.57 3 Match 3: 7-31 92833.15 18489.71 435.01 95955.45 18586.15 448.9 0 Match 4: 9-3 94364.15 19635.56 410.99 94428.32 18448.88 386.17 2
Match 5: 16-25 96881.88 20249.46 438.45 96692.14 17618.78 407.63 0 Match 6: 55-22 95833.95 18802.48 440.38 104710.9 23181.9 482.31 0 Match 7: 35-8 96421.43 19896.58 439.96 90692.04 17559.82 436.11 3
Match 8: 26-36 98048.03 22672.08 442.17 101551.4 22583.92 458.6 2 Match 9: 36-16 106632.6 21520.85 449.35 108448.4 23140.67 467.82 0
Match 10: 30-27 93002.54 18794.85 417.79 92989.57 16433.23 410.14 3 Match 11: 22-19 101295.2 19842.07 381.2 102054.1 20973.95 484.24 0 Match 12: 21-26 103067.8 22453.54 424 104438.7 20954.13 412.95 1 Match 13: 34-18 103587.8 22503.74 479.95 104413.8 22504.45 485.26 0 Match 14: 10-21 96931.41 19568.14 432.34 99499.49 19691.35 482.79 3 Match 15: 17-3 100154.7 19119.22 439.9 98281.88 19706.31 393.71 2
Match 16: 27-26 100850.3 20533.64 430.99 99295.93 21236.43 379.81 2 Match 17: 33-3 103286.3 22914 477.09 102012.2 23893.32 463.4 2 Match 18: 30-8 96941.18 19892.66 470.15 98919.74 22891.22 474.74 0 = 26
Home team won 12 Away team won 6
Components won by home team 23 Components won by away team 31
Time motion analysis of International rugby Chapter 5
67
CHAPTER 5 – Discussion 5.1 Introduction The study set out to determine if time motion analysis can be implemented as a
variable in identifying rugby success, to determine which variable in time motion
analysis correlates the highest with success and to determine if there are
significant differences (P< 0.05) between positions in the different components in
the time motion analysis. This chapter will comprise and discuss results obtained
through this investigation, as well as the comparison with research already done
on this subject.
5.2 Discussion 5.2.1 Home and away games The results of this study showed that 66.67% of all home games are won. The
data shows a significant difference between home and away games (p<0.0001).
The results of this study also supports the findings of Courneya and Carron
(1992: 13-27) who showed 52.3% home win records in basketball and up to 69%
in soccer. They also describe home advantage as having a higher than 50% win
record at home, which the sides in this study also achieved. During this study, no
variables such as crowd size or dynamics were taken into account but purely the
physiological attributes of the teams, yet there is some evidence to support that
teams performed worse at home. In Table 20, p 66, it shows that teams playing
away from home performed much better physiologically, but still lost the game.
Reasons for this can be attributed to travel times and weather (Courneya &
Carron, 1992:13-27). Losing teams had to play harder to overcome the home
advantage.

Time motion analysis of International rugby Chapter 5
68
5.2.2 Distances covered
The distances that were covered by teams were compared in Table 16 (p 62), 17
(p 63) and 20 (p 66). Of the 18 games that were played, 12 were won by the
home team. Only 7 of the 12 winning teams were able to cover greater distances
than the losing teams. Early estimations on the distance covered during a rugby
match indicated that a centre covered 5800m, of which 2200m was walking,
1600m jogging and 2000m sprinting (Morton, 1978:4-9). The average distance by
the inside backs during this study was 7300m which is greater than what Morton
estimated. This increase can be that it is no longer an opinion that the game of
rugby has changed over the last 20 years, and the game today is quicker, more
demanding and a lot more entertaining (Deutsch; et al., 2002:160-166). The team
averages indicates that the winning team covers a greater distance than losing
team averages (6529±700 vs. 6489±700).
Deutsch; et al., (1998: 561-570) monitored six players during four under-19
matches between different teams. Although backs had a lower overall exertion
based on heart rate, they covered the greatest distance, with props and locks
covering 4400 ± 398m, back row 4080 ± 363m, inside backs 5530 ± 337m, and
outside backs 5750 ± 405m, respectively. This study showed average distances
ranging from 5829.9m (front rows) and 7260.7m (outside backs). The distances
covered between positional groups of both winning and losing teams showed no
significant difference. By comparing the distance covered by inside backs, the
winning team covered more distance than their losing opponents (7187.4m vs
7056.2m) but no significant difference was found p=0.398. The distance covered
by front rows varied from 5914.2m when the game was lost to 6110.1m when the
game was won. However, only the distance covered by the locks (p= 0.03)
showed a significant difference between the winning and losing teams. Locks
had a decrease in distance from winning a game to losing (winning = 6258.9m,
losing = 6326.9).
Time motion analysis of International rugby Chapter 5
69
This can be due to the fact that forwards spent a larger percentage of time
standing still (46%) compared with the backs (39%), and covered a shorter
distance in all gait movements except jogging (Deutsch; et al., 1998:561-570).
5.2.3 High intensity distance covered
There were no significant difference between the high intensity distance covered
between winning and losing teams. In fact the losing teams covered a greater
distance in high intensity (1307m vs. 1275m). It must be noted that the difference
is only 32m in an 80min game of rugby. When the winning and losing teams are
compared, there are some differences between playing positions. Only seven of
the 12 winning teams managed to win the high intensity distance covered at
home. When comparing the positional groups to winning or losing games
played, only the outside backs showed a significant difference when playing at
home, but in only one variable (percentage work rate at high intensity),
(p=0.0281). This study also supports the findings of other studies done. Deutsch;
et al., (1998:561-570) found that outside backs are engaged in more sprints
during a game than front row forwards. The results of this study also supports the
findings of Deutsch; et al., (1998:561-570), which also showed that outside backs
spent more total time sprinting than front row forwards (1549.5m vs. 789.6m).
5.2.4 The percentage work rate at high intensity
The percentage work rate at high intensity also showed no significant differences
between playing positions or winning and losing teams (Table 19). Team
averages show that the losing teams had a higher percentage work rate at high
intensity than that of the winning teams (19% ± 5 vs. 18% ± 5). Within the
winning and losing teams, the forwards had a lower work rate than that of the
backs and can be due to higher distances performed in high intensity and not just
the involvement in high activity actions like scrumming or rucking. (Front row
11.88%, locks 16.75%, loose forwards 19.75%, inside backs 22.88%, outside
Time motion analysis of International rugby Chapter 5
70
backs 21.11%). In contrast to this finding Holmyard; et al., (1988:134-142) found
that front row and back row forwards performed more high-intensity work than
inside and outside backs, as the result of performing work more frequently.
Another study by Docherty, et al., (1988:269-277) declared that centres spend
more time in intense running and that the time spent in static exertion by the
forwards contributes to a greater time spent in high-intensity activity (forwards; 11
minutes) compared with the backs (4 minutes) (Docherty; et al., 1988:269-277).
5.2.5 Correlation of variables with winning and losing
5.2.5.1 Team correlation with winning and losing.
The aim of this study was also to determine which of these variables correlates
the highest with success. The mean values of the teams (distance covered, high
intensity distance covered and percentage work rate at high intensity) were
compared to winning and losing. When correlating the variables to winning
games, a correlation of great practical value was found between distances
covered (r = 0.67), high intensity distance covered (r=0.62) and percentage work
rate at high intensity (r = 0.54) by the teams.
5.2.5.2 Positional correlation with winning and losing
Teams playing at home or away from home showed no correlation with winning
or losing in any of the five positional groups or variables (front rows r= 0.022,
locks r= 0.17, loose forwards r= 0.08, inside backs r=0.15, outside backs r= -
0.25).

Time motion analysis of International rugby Chapter 5
71
5.3 Overview A thorough understanding of the physical demands of rugby via information on
player work rates is required so that optimal training and preparation strategies
can be constructed. As shown in the present review, an ever-increasing number
of scientific investigations based on motion analysis techniques are providing
important information on elite rugby play. These investigations have identified the
activity profiles and physical requirements of elite rugby as well as the demands
of individual playing positions.
In this study, no positional group showed any promise of possible correlations
between the variables applicable in winning and losing a game. However, team
averages show moderate correlations with distance covered, high intensity
distance covered and percentage work rate at high intensity.
Fitness for rugby will remain an important component for any team who wishes to
play well or win. Time motion analysis will remain a useful tool to investigate
rugby and any other sport for determining the demands of the sport.
Home and away games remain the biggest challenge to overcome with a 66.67%
winning home record for most Super rugby, Tri-nations and International games.
Fitness trainers and coaches alike have to spend time on increasing the skill and
fitness levels of players and leave no stone unturned. Despite a slightly longer
mean sprint distance, the greater opportunity for outside backs to recover should
be reflected in the design of fitness training sessions. With approximately 30% of
work-to-rest periods being less than 1:7, however, there are still likely to be
periods of play when the incomplete replenishment of creatine phosphate stores
would result in an increased dependence on the anaerobic glycolytic pathway, in
all positions (Balsom; et al., 1992:528-533).
Time motion analysis of International rugby Chapter 5
72
However, to develop maximal speed/ power, it may be necessary to incorporate
training in which adequate recovery is provided between high-intensity sprints to
allow the replenishment of creatine phosphate, particularly in outside backs. In
time-motion analysis, movement patterns, distance covered, average velocities,
levels of exertion and work-to-rest ratios can be established by quantifying the
time spent in different activities. The information obtained from these analyses
allows coaches to structure training programmes specific to the requirements of
the game, and facilitates more effective training and improved performance
(Deutsch; et al., 1998:561-570).
The attention to detail in the conditioning programs of teams will assure that
every possible influence on the winning or losing of a game are minimized.
5.4 Recommendations
There are; possibilities to link fitness data to work rate assessments and to
determine the effects of training interventions on match performance.
Furthermore, conducting research into how these technologies are actually being
put into use within coaching contexts would be pertinent, as there is little
appreciation about how effectively and efficiently they are being translated and
adopted by practitioners to prepare and develop members of their squad.

Time motion analysis of International rugby Chapter 6
73
CHAPTER 6 – Summary and conclusion 6.1 Introduction This chapter will discuss the trends seen in the analyzed data and conclude the
findings of this study. It will also discuss further recommendations concerning
this particular subject matter.
6.2 Summary The questions subsequently answered were firstly if time motion analysis can be
implemented as a variable in identifying rugby success, to determine which
variable in time motion analysis correlates the highest with success and to
determine if there are significant differences (p< 0.05) between positions in the
different components in the time motion analysis. Answers to this research
regarding these questions provide groundbreaking results – not only towards the
scientific literature but also for implementation:
• Rugby consists of many different components like skills (passing, kicking
and catching), fitness (aerobic, anaerobic, endurance, speed, agility,
strength and power) and game phases (scrums, line outs, rucks and
mauls). It will be impossible to recognize one or two specific components
that influenced the result, especially in professional rugby.
• Distances covered, high intensity distance covered and percentage work
rate at high intensity correlate with the success of the team. (Distance
covered by winning teams, r = 0.67 and losing teams, r = 0.54), (High
intensity distance covered by winning teams, r = 0.62 and losing teams, r
= 0.56) (Percentage work rate at high intensity by winning teams, r = 0.54
and losing teams, r = 0.53). These variables for the team seem to be of
practical value in the outcome of the game. These variables may also be
influenced during play. The game plan, weather conditions and

Time motion analysis of International rugby Chapter 6
74
competition structure may be some reasons for different distances
covered.
• No assumption can be made that one specific positional group or variable
will influence success. 6.3 Conclusion The following conclusions can be obtained from this study
6.3.1 Time motion analysis is an effective method of quantifying the demands of
rugby and provides a conceptual framework for the specific physical
preparation of players.
6.3.2 The results of this study showed no significant difference (p < 0.05)
between the variables (distance covered, high intensity distance covered
and percentage work rate at high intensity) in the winning and losing team.
6.3.3 Correlation between all the variables (distance covered, high intensity
distance covered and percentage work rate at high intensity) and winning
show practical implications. 6.4 Limitations
Time motion systems that are used in sport today are very expensive and are
also limited to the data that each can record. No club or rugby province can
currently afford the expenses of a system like ProZone. Therefore, quality data
are very difficult to find or would be very expensive.
Time motion analysis of International rugby Chapter 6
75
6.5 Practical Applications
It is recommended to do research on the differences between winning and losing
games in regards to the skill or structure of a team.

Time motion analysis of International rugby Chapter 6
76
REFERENCES
Balsom, P.D, Seger, J.Y, Sjodin, B, & Ekblom, B. 1992. Maximal-intensity intermittent
exercises: Effect of recovery duration. International Journal of Sports Medicine, 13: 528-
533.
Boennec, P, Prevost, M. & Ginet, L. 1980. Somatotype de sportif de haut niveau.
Resultats dans huit disciplines differentes. Medecine du Sport. 54:309-318.
Bogdanis, G.C, Neville, M.E, Boobis, L.H & Lakomy, H.K. 1996. Contribution of
phosphocreatine and aerobic metabolism to energy supply during repeated sprint
exercise. Journal of applied physiology. 80:876-884.
Boyle, M.A, Mahoney, C.A. & Wallace, W. 1994. The competitive demands of elite male
field hockey. Journal of sports medicine and physical fitness. 34:235-241.
Brady, 1995. Short-term demands of of playing and traing in the first half of the season.
[abstract]. Journal of sports science. 13:499.
Brewer, J. & Davis, J. 1995. Applied physiology of rugby league. Sports medicine. 20:
129-135.
Brown, D. 1999. Tackling sport specific training. Rugby special ultra fit: 50, 70-73.
Campi, S, Cuglielmini, C. & Guerzoni, P. 1992. Variations in energy-producing muscle
metabolism during the competitive season in 60 elite rugby players. Sports Medicine. 33
(3): 149-54.
Time motion analysis of International rugby Chapter 6
77
Carter, A. & Potter, G. 1996. The 1995 rugby world cup finals. Where does all the time
go? Paper presented at the third world conference of notational analysis of sport,
Antalya, Turkey. 187.
Cheetham. M.E, Hazeldine, R.J. & Robinson, A. 1988. Power Output of rugby forwards.
Science and Football. London: E and FN Spon. 206-210.
Christmass, M.A., Dawson, B. & Arthur, P.G. 1999. Effect of work and recovery duration
on skeletal muscle oxygenation and fuel use during sustained intermittent exercise.
European Journal of applied Physiology. 80:436-447.
Christmass, M.M, Dawson, B, Passeretto, P & Arthur, P.G. 1999. A comparison of
skeletal muscle oxygenation and fuel use in sustained continuous and intermittent
exercise. European journal apllied physiology. 80:423-435.
Clarke, S.R. 2005. Home advantage in the Australian football league. Journal of sports
science. 23:375-385.
Courneya, K.S. & Carron, A.V. 1992. The home advantage in sport competitions: A
literature review. Journal of sport and exercise physiology. 14:13-27.
Deutsch, M.U., Kearney, G.A., & Rehrer, N.J. 2002. A comparison of competition work
rates in elite club and Super 12 rugby. In: W. Spinks, T. Reilly, & A. Murphy (Eds.),
Science and football IV. Cambridge University Press. 160-166.
Deutsch, M.U, Maw, G.J, Jenkins, D. & Reaburn, 1998. Heart rate, blood lactate and
kinematic data of elite colts rugby union players during competition. Journal of Sports
Science. 16: 561-570.
Docherty, D, Wenger, H.A. & Neary, P. 1988. Time motion analysis related to
physiological demands of rugby. Journal of Human Movement Studies. 14: 269-277.

Time motion analysis of International rugby Chapter 6
78
Drust, B, Reilly, T. & Cable, N.T. 2000. Physiological responses to laboratory-based
soccer-specific intermittent and continuous exercise. Journal of sports science. 18:885-
892.
Duthie, G, Pyne, D. & Hooper, S. 2003. Applied physiology and game analysis of rugby
union. Sports Medicine. 33:973-991.
Eaves, S. & Hughes, M. 2003. Patterns of play of international rugby union teams
before and after the introduction of professional status. International journal of
performance analysis in sport. 3:103-111.
Eaves, S, Hughes, M. & Lamb, K.L. 2005. The consequences of the introduction of
professional playing status om game action variables in international northern
hemisphere rugby union football. International journal of performance analysis in sport.
5:58-86.
Gabbett, T.J. 2002: Influence of physiological characteristics on selection in a semi-
professional rugby league team: a case study. Journal of Sports Sciences, 20, 399-405.
Gabbett, T.J. 2005. Science of rugby league football: a review. Journal of Sport
Sciences. 23:961-976.
Gabbett, T.J. 2005. Changes in physiological and anthropometric characteristics of
rugby league players during a competitive season. Journal of strength conditioning.
19(2):400-408.
Gabbett, T.J. 2005. A comparison of physiological and anthropometric characteristics
among playing positions in junior rugby league players. British journal of sports
medicine. 39:675-680.

Time motion analysis of International rugby Chapter 6
79
Gaitanos, G.C, Casey, W, Hultman B.L. & Sjoholm, B. 1993. Human muscle
metabolism during intermittent maximal exercise. Journal of Applied Physiology, 75:
712-719.
Gissane, C., White, J., Kerr, K. & Jennings, D. 2001. Physical collisions in professional
super league rugby, the demands on different player positions. Cleveland Medical
Journal. 4:137-146.
Helgerud, J, Engen, L.C. & Wisloff, U. 2001. Aerobic endurance training improves
soccer performance. Medical Science and Sports Exercise, 33 (11):1925-31.
Holmyard, D.J, Cheetham, M.E. & Lakomy, H.K.A. 1988. Effect of recovery duration on
performance during multiple treadmill sprints. In: Reilly T, Lees A, Davids K, et al,
editors. Science and football. London: E and FN Spon. 134-142.
Hopkins, W.G. 2000. Measures of reliability in sports medicine and science. Sports
Medicine. 30 (1): 1-15.
Hultman, E, Greenhaff, P, Ren, J.M. & Soderlund, K. 1991. Energy metabolism and
fatigue during intense muscle contraction. Biomechanical Society Transactions, 19:
347-353.
Hughes, M. & Blunt, R. 1998. Work rate of rugby union referees. In: Hughes, M &
Tavares, F, editors. IV World congress of notational analysis in sport; 1998 Sep 22-25;
Porto. Porto: Centre for team sport studies, Faculty of sport sciences and physical
education, 184-190.
Hughes, M. & Clarke, A. 1994. Computerised notation analysis of rugby union to
examine the effects of law changes upon the patterns of play by international teams
[abstract]. Journal of sport science. 12:180.

Time motion analysis of International rugby Chapter 6
80
IRB, 2003b. Annual analysis of rugby union. International Rugby Board.
Jardine, M.A, Wiggins, T.M. & Myburgh, K.H. 1988. Physiological characteristics of
rugby players. South African Medical Journal, 73: 529-532.
Knuttgen. HG & Kraemer. WJ. 1987. Terminology and measurement in exercise
performance. Journal of Applied Sport Sciences 1: 1-10
Maud, P.J. 1983. Physiological and anthropometric parameters that describe a rugby
union team. British journal of sports medicine. 17(1):16-23.
Mayes. R. & Nuttall. F.E. 1995. A comparison of the physiological characteristics of
senior and under 21 elite rugby union players [abstract]. Journal of Sports Science.
13:13-14.
McKenzie, A.D, Holmyard, D.J. & Docherty, D. 1989. Quantitative analysis of rugby:
factors associated with success in contact. Journal of Human Movement Studies.
17:101-13.
McLean, D.A. 1992. Analysis of the physical demands of international rugby union.
Journal of Sports Science. 10: 285-96.
Meir, R. 1993. Seasonal changes in estimates of body composition in professional
rugby league: implications for training. Sport health. 11:27-31.
Meir. R, Newton. R, Curtis. E, Fardell. M & Butler, B. 2001. Physical fitness qualities of
professional rugby league football players: determination of positional differences.
Journal of strength conditioning.15:450-458.
Time motion analysis of International rugby Chapter 6
81
Meir, R, Colla, P, & Mulligan, C. 2001. Impact of the 10-meter rule change on
professional rugby league: implications for training. Strength conditioning Journal.
23:42-46.
Menchinelli, C, Morandini, C. & De Angelis, M. 1992. A functional model of rugby:
determination of the characteristics of sports performance [abstract]. Journal of Sports
Science. 10: 196-7.
Mero, A, P, Komi, & Gregor, R.J. 1992. Biomechanics of sprint running. Sports
medicine, 13:376-392.
Miller, C, Quievre, J. & Gajer, B. 1996. Characteristics of force/ velocity relationships
and mechanical power output in the French national rugby team. In: Marconnet P, First
annual congress, Frontiers in sport science, 12: 494-495.
Morton, A.R. 1978. Applying physiological principles to rugby training. Sports Coach.
2:4-9.
Morton, R.H. 2006. Home advantage in southern hemisphere rugby union: national and
international. Journal of Sport science, 24 (5):495-499
Mylvaganam, R, Ramsay, N. & De Craca, F. 2002. Sports analysis system and method.
International application published under the Patent Coorporation treaty. 334.
Nevill, A.M, Ramsbotton, R. & Williams, C. 1992. Scaling physiological measurements
for individuals of different body size. European Journal of Applied Physiology, 65: 110-
117.
Nicholas, C.W, 1997. Anthropometric and physiological characteristics of rugby union
football players. Journal of Sports medicine. 6:375-396.

Time motion analysis of International rugby Chapter 6
82
Nicholas, C.W, Nuttal, F.E. & Williams, C. 2000. The Loughborough intermittent shuttle
test: A field test that simulates the activity pattern in soccer. Journal of sports science.
18:97-104.
O’Connor, D. 1996. Physiological characteristics of professional rugby league players.
Stregth conditioning coach. 4:21-26.
Olds, T. 2001. The evolution of physique in male rugby union players in the twentieth
century. Journal of Sport Science. 19:253-262.
Petibois, C, Cazorla, G, Poortmans, J.R. & Deleris, G. 2002. Biomechanical aspects of
overtraining in endurance sports: A review. Sport medicine. 32:867-878.
Quarrie. K.L, Handcock, P. & Toomey. M.J. 1996. The New Zealand rugby injury and
performance project. British Journal of Sports Medicine, 30: 53-60.
Quarrie. K.L, Handcock, P. & Waller, A.E. 1995. The New Zealand rugby injury and
performance project. III. Anthropometric and physical performance characteristics of
players. British Journal of Sports Medicine. 29:263-270.
Quarrie, K.L. & Hopkins, W.G. 2007. Changes in player characteristics and match
activities in Bledisloe Cup rugby union from 1972 to 2004. Journal of Sports Sciences.
25(8):895-903.
Reid, R.M. & Williams, R. 1974. A concept of fitness and its measurement in relation to
rugby football. British Journal of Sports Medicine, 8:96-99.
Reilly, T. 1997. The physiology of rugby union football. Biol Sport. 12(2): 83-101.
Reilly, T. & Thomas, V. 1976. A motion analysis of work rat in different positional roles
in professional football match-play. Journal of human movement studies. 2:87-89.

Time motion analysis of International rugby Chapter 6
83
Rigg, P. & Reilly, T. 1987. A fitness profile and anthropometric analysis of first and
second class rugby union players. In: Reilly T, Lees A, Davids K & Murphy WJ, eds.
Science and football. London: E and FN Spon, 186-191.
Rimmer, E.F. & Slievert, G.G. 1996. The effects of pliometric intervention programme
on sprint performance. In: National Conference of Coaching, Wellington. New Zealand.
Sports Medicine and Sport Science New Zealand, 11(12): 111.
Roberts, S., Stokes, K., Trewartha, G. 2006. A comparison of time-motion analysis
methods for field-based sports. International Journal of Sports Physiology and
Performance. 1:386-397.
Roberts, S, Trewartha, G, Higgitt, R.J, El-abd, J. & Stokes, K.A. 2008. The physical
demands of elite English rugby union. Journal of sports sciences. 26(8):825-833.
Rudkin, S.T & O’Donoghue, P.G. 2008. Time-motion analysis of first-class cricket
fielding. Journal of science and medicine in sport. 11:604-607.
Sayers, M. 2000. Running techniques for field sport players. Sports coach. 2:26-27.
Spamer, E.J, Pienaar, A.E. & Van Der Merwe, C.A. 1998. The effect of an age-specific
rugby development program on the performance skill of talented young players. South
African Journal of Sport, Physical Education and Recreation. 21:61-75.
Tong, R.J, Bell, W. & Ball, G. 2001. Reliability of power output measurements during
repeated treadmill sprinting in rugby players. Journal of sports science. 19:289-297.
Tong, R.J. & Mayes, R. 1995. The effect of pre-season training on the physiological
characteristics of international rugby union players. [abstract]. Journal of sports science
13:507.
Time motion analysis of International rugby Chapter 6
84
Treadwell, P.J. 1988. Computer-aided match analysis of selected ball games (soccer
and rugby union). In: Reilly, T & Lees, A & Davids K, editors. Science and football.
London: E and FN Spon, 282-287.
Van den Berg, C. 2007. Tri-nations 2007: South African review. SA Rugby, Oct, 125:
62-64.
Van der Field, G. 1975. Fitness testing for rugby players. Australian Journal of Sports
Medicine, 14:14.
Weston, A.R, Mackenzie, G. & Tufts, A. 2001. Optimal time of arrival for performance at
moderate altitude (1700m). Medical Science and Sports Exercise. 33(2): 298-302.
Williams. J.,Hughes. M & O’Donoghue. P. 2005. The effect of rule changes on match
and ball in play time in rugby union. International journal of performance analysis in
sport. 5 (3):1-11
Withers, R.T, Maricic, Z, Wasilewski, S. & Kelly, L. 1982. Match analysis of Australian
professional soccer players. Journal of human movement studies. 8:159-176.

Time motion analysis of International rugby Appendix A
1
MATCH 1
TEAM A Score 49 12 Score TEAM B
No Time Distance HI Dist % WR @ HI
% WR @ HI HI Dist Distance Time No
1 3844 4273.02 507.33 11.87 11.41 368.38 3229.98 3135 1
2 5714 6516.76 1223.39 18.77 16.65 706.39 4241.59 3839 2
3 3834 4157.19 488.34 11.75 5.51 290.49 5269.6 5714 3
4 5041 5508.23 951.96 17.28 12.04 358.93 2980.66 3129 4
5 5232 6025.7 1095.27 18.18 14.81 919.72 6209.54 5714 5
6 5714 6286.59 1259.51 20.03 17.99 828.98 4609.17 3868 6
7 4404 5190.8 1119.56 21.57 24.88 1564.34 6286.63 5714 7
8 5714 7254.99 1509.1 20.8 15.7 969.64 6175.16 5714 8
9 5178 6653.44 1218.74 18.32 27.43 1478.91 5391.27 4169 9
10 4777 6375.5 1395.47 21.89 20.77 1142.3 5499.69 4825 10
11 5503 6835.46 1330.81 19.47 20.22 447.48 2212.78 1555 11
12 5666 7264.39 1926.94 26.53 19.31 1189.96 6162.25 5714 12
13 5714 6942 1346.31 19.39 24.69 1830.47 7413.63 5714 13
14 4772 6482 1561.2 24.09 12.97 765.28 5899.18 5714 14
15 5714 7785.72 1563.65 20.08 23.29 1505.36 6462.3 5714 15
16 1906 2236.01 573.11 25.63 12.12 225.63 1861.67 1891 16
17 0 0 0 0 23.71 676.08 2851.71 2640 17
18 1218 1595.01 516.88 32.41 17.2 447.48 2601.74 2634 18
19 1338 1635.75 531.52 32.49 29.44 672.38 2283.93 1890 19
20 557 601.25 123.62 20.56 30.99 604.13 1949.69 1567 20
21 969 1376.3 361.83 26.29 21.47 228.5 1064.14 924 21
22 1243 1580.78 362.7 22.94 20.03 947.75 4732.34 4181 22
3821 4662.586 953.056 20.47 19.2104545 825.845 4335.848 3907
WON WON WON LOST LOST LOST
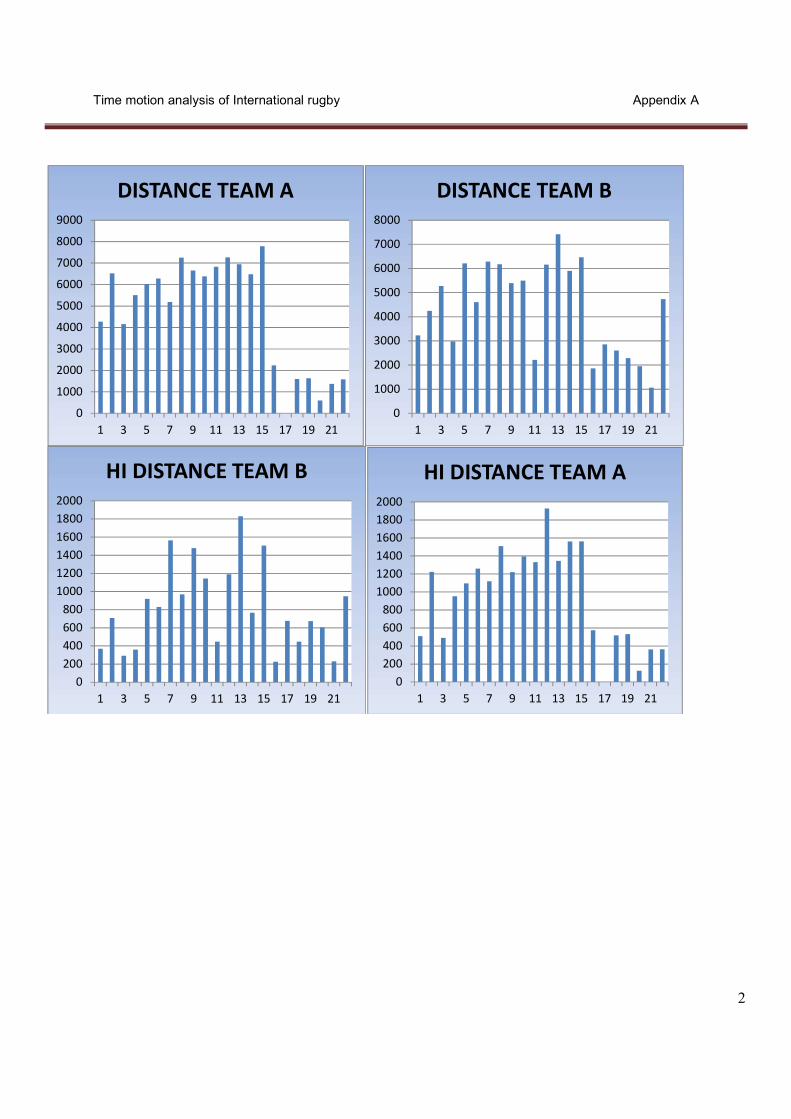
Time motion analysis of International rugby Appendix A
2
0
1000
2000
3000
4000
5000
6000
7000
8000
9000
1 3 5 7 9 11 13 15 17 19 21
DISTANCE TEAM A
0
1000
2000
3000
4000
5000
6000
7000
8000
1 3 5 7 9 11 13 15 17 19 21
DISTANCE TEAM B
0200400600800
100012001400160018002000
1 3 5 7 9 11 13 15 17 19 21
HI DISTANCE TEAM B
0200400600800
100012001400160018002000
1 3 5 7 9 11 13 15 17 19 21
HI DISTANCE TEAM A

Time motion analysis of International rugby Appendix A
3
MATCH 1
Winning Team Losing Team
No Time Distance HI Distance
% WR @ HI
% WR @ HI
HI Distance Distance Time No
Props 1 3844 4273.02 507.33 11.87 11.41 368.38 3229.98 3135 1
3 3834 4157.19 488.34 11.75 5.51 290.49 5269.6 5714 3
3839 4215.105 497.835 11.81 8.46 329.435 4249.79 4425
Locks 4 5041 5508.23 951.96 17.28 12.04 358.93 2980.66 3129 4
5 5232 6025.7 1095.27 18.18 14.81 919.72 6209.54 5714 5
5137 5766.965 1023.62 17.73 13.425 639.325 4595.1 4422
2 5714 6516.76 1223.39 18.77 16.65 706.39 4241.59 3839 2
Loosies 6 5714 6286.59 1259.51 20.03 17.99 828.98 4609.17 3868 6
7 4404 5190.8 1119.56 21.57 24.88 1564.34 6286.63 5714 7
8 5714 7254.99 1509.1 20.8 15.7 969.64 6175.16 5714 8
5387 6312.285 1277.89 20.39 19.5233333 1120.99 5690.32 5099
Inside Backs 9 5178 6653.44 1218.74 18.32 27.43 1478.91 5391.27 4169 9
10 4777 6375.5 1395.47 21.89 20.77 1142.3 5499.69 4825 10
12 5666 7264.39 1926.94 26.53 19.31 1189.96 6162.25 5714 12
13 5714 6942 1346.31 19.39 24.69 1830.47 7413.63 5714 13
5334 6808.833 1471.87 21.5325 23.05 1410.41 6116.71 5106
Outside Backs 11 5503 6835.46 1330.81 19.47 20.22 447.48 2212.78 1555 11
14 4772 6482 1561.2 24.09 12.97 765.28 5899.18 5714 14
15 5714 7785.72 1563.65 20.08 23.29 1505.36 6462.3 5714 15
5330 7034.393 1485.22 21.213333 18.8266667 906.04 4858.087 4328

Time motion analysis of International rugby Appendix A
4
MATCH 2
TEAM A Score 9 14 Score TEAM B
No
Time
Distance
HI Distance
% WR @ HI
% WR @ HI
HI Distance Distance Time No
1 5409 6268.81 1040.31 16.6 16.72 722.9 4322.97 3512 1
2 4146 5468.16 1226.33 22.43 23.83 1431.8 6008.56 4790 2
3 2073 2511.83 279.25 11.12 16.54 1063.22 6426.37 5409 3
4 5409 6539.55 1111.47 17 19.29 1221.59 6331.32 4819 4
5 5409 6719.57 1136.28 16.91 16.86 1033.72 6129.64 5409 5
6 3334 4444.83 1121.23 25.23 15.63 473.66 3029.52 2728 6
7 5409 6458.1 1191.94 18.46 19.36 1376.59 7112.29 5409 7
8 2728 3432 887.06 25.85 23.32 1575.44 6757.14 5409 8
9 3621 4801.51 1179.76 24.57 30.43 1897.81 6236.88 4288 9
10 5409 6562.55 1360.56 20.73 23.33 1667.38 7146.89 5409 10
11 5409 7203.5 1674.98 23.25 18.75 1215.17 6479.59 5020 11
12 5409 6641.48 1610.02 24.24 20.84 1414.07 6784.47 5409 12
13 4298 6278.35 1567.27 24.96 21.9 1579.28 7212.01 5409 13
14 5409 7055.81 1745.42 24.74 15.07 266.01 1765.65 1535 14
15 5409 7518.81 1757.96 23.38 24.23 2009.04 8290.3 5409 15
16 1356 1473 319.61 21.7 14.3 87.91 614.81 619 16
17 0 0 0 0 18.76 373.97 1993.08 1938 17
18 2116 2721.88 791.62 29.08 15.57 96.09 617.1 620 18
19 2681 3392.01 810.28 23.89 27.1 879.84 3246.49 2681 19
20 1793 2595.05 974.68 37.56 36.08 562.91 1560.32 1139 20
21 1164 1651.44 397.7 24.08 25.38 1360.95 5361.92 3891 21
22 0 0 0 0 19.28 89.06 461.95 395 22
3545 4533.56 1008.3513
6 20.717272
7 21.02590
9 1018.109
5 4722.2 3693 ###
LOST LOST LOST WON WON WON

Time motion analysis of International rugby Appendix A
5
0
1000
2000
3000
4000
5000
6000
7000
8000
1 3 5 7 9 11 13 15 17 19 21
DISTANCE TEAM A
0
1000
2000
3000
4000
5000
6000
7000
8000
9000
1 3 5 7 9 11 13 15 17 19 21
DISTANCE TEAM B
0
200
400
600
800
1000
1200
1400
1600
1800
2000
1 3 5 7 9 11 13 15 17 19 21
HI DISTANCE TEAM B
0
200
400
600
800
1000
1200
1400
1600
1800
2000
1 3 5 7 9 11 13 15 17 19 21
HI DISTANCE TEAM A

Time motion analysis of International rugby Appendix A
6
MATCH 2 Losing Team Winning Team
No Time Distance HI Distance
% WR @ HI
% WR @ HI
HI Distance Distance Time No
Props 1 5409 6268.81 1040.31 16.6 16.72 722.9 4322.97 3512 1
3 2073 2511.83 279.25 11.12 16.54 1063.22 6426.37 5409 3
3741 4390.32 659.78 13.86 16.63 893.06 5374.67 4460.5
Locks 4 5409 6539.55 1111.47 17 19.29 1221.59 6331.32 4819 4
5 5409 6719.57 1136.28 16.91 16.86 1033.72 6129.64 5409 5
5409 6629.56 1123.875 16.955 18.075 1127.655 6230.48 5114
2 4146 5468.16 1226.33 22.43 23.83 1431.8 6008.56 4790 2
Loosies 6 3334 4444.83 1121.23 25.23 15.63 473.66 3029.52 2728 6
7 5409 6458.1 1191.94 18.46 19.36 1376.59 7112.29 5409 7
8 2728 3432 887.06 25.85 23.32 1575.44 6757.14 5409 8
3904.3 4950.77 1106.64 22.04 19.4366667 1141.89667 5632.98 4515.3
In Backs 9 3621 4801.51 1179.76 24.57 30.43 1897.81 6236.88 4288 9
10 5409 6562.55 1360.56 20.73 23.33 1667.38 7146.89 5409 10
12 5409 6641.48 1610.02 24.24 20.84 1414.07 6784.47 5409 12
13 4298 6278.35 1567.27 24.96 21.9 1579.28 7212.01 5409 13
4684.3 6070.97 1429.4025 23.625 24.125 1639.635 6845.06 5128.8
Out Backs 11 5409 7203.5 1674.98 23.25 18.75 1215.17 6479.59 5020 11
14 5409 7055.81 1745.42 24.74 15.07 266.01 1765.65 1535 14
15 5409 7518.81 1757.96 23.38 24.23 2009.04 8290.3 5409 15
5409 7259.37 1726.12 23.79 19.35 1163.40667 5511.85 3988
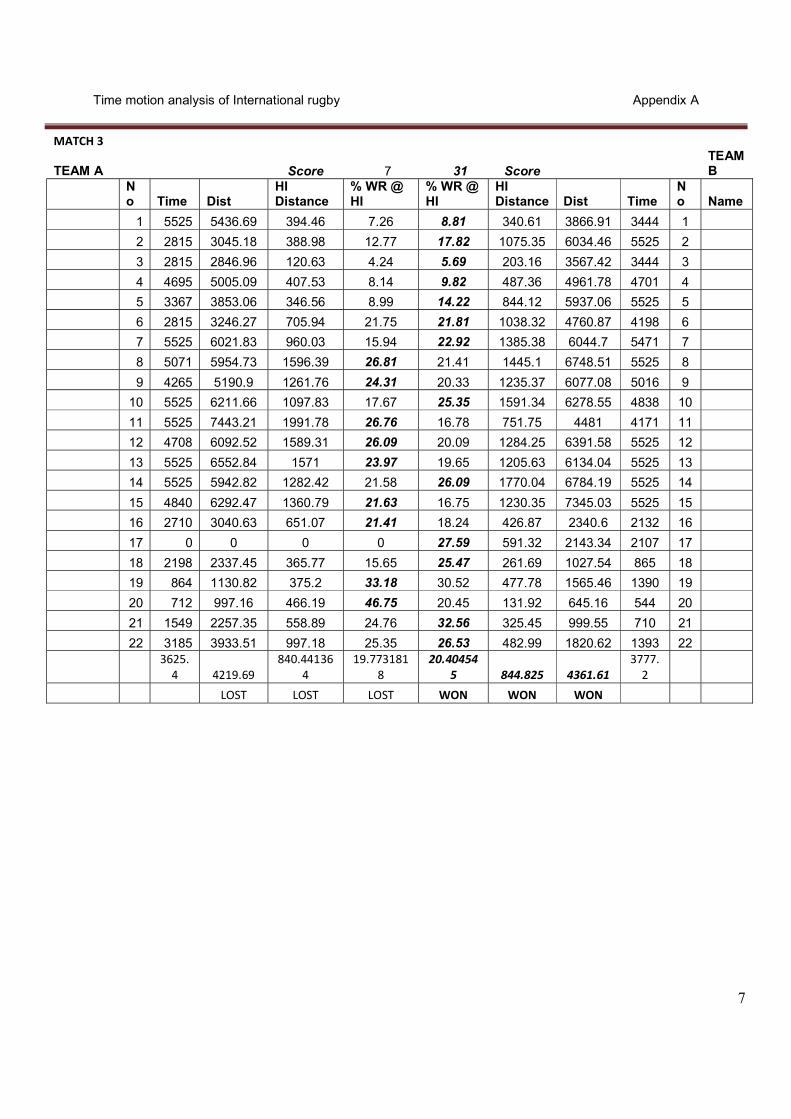
Time motion analysis of International rugby Appendix A
7
MATCH 3
TEAM A Score 7 31 Score TEAM B
No Time Dist
HI Distance
% WR @ HI
% WR @ HI
HI Distance Dist Time
No Name
1 5525 5436.69 394.46 7.26 8.81 340.61 3866.91 3444 1
2 2815 3045.18 388.98 12.77 17.82 1075.35 6034.46 5525 2
3 2815 2846.96 120.63 4.24 5.69 203.16 3567.42 3444 3
4 4695 5005.09 407.53 8.14 9.82 487.36 4961.78 4701 4
5 3367 3853.06 346.56 8.99 14.22 844.12 5937.06 5525 5
6 2815 3246.27 705.94 21.75 21.81 1038.32 4760.87 4198 6
7 5525 6021.83 960.03 15.94 22.92 1385.38 6044.7 5471 7
8 5071 5954.73 1596.39 26.81 21.41 1445.1 6748.51 5525 8
9 4265 5190.9 1261.76 24.31 20.33 1235.37 6077.08 5016 9
10 5525 6211.66 1097.83 17.67 25.35 1591.34 6278.55 4838 10
11 5525 7443.21 1991.78 26.76 16.78 751.75 4481 4171 11
12 4708 6092.52 1589.31 26.09 20.09 1284.25 6391.58 5525 12
13 5525 6552.84 1571 23.97 19.65 1205.63 6134.04 5525 13
14 5525 5942.82 1282.42 21.58 26.09 1770.04 6784.19 5525 14
15 4840 6292.47 1360.79 21.63 16.75 1230.35 7345.03 5525 15
16 2710 3040.63 651.07 21.41 18.24 426.87 2340.6 2132 16
17 0 0 0 0 27.59 591.32 2143.34 2107 17
18 2198 2337.45 365.77 15.65 25.47 261.69 1027.54 865 18
19 864 1130.82 375.2 33.18 30.52 477.78 1565.46 1390 19
20 712 997.16 466.19 46.75 20.45 131.92 645.16 544 20
21 1549 2257.35 558.89 24.76 32.56 325.45 999.55 710 21
22 3185 3933.51 997.18 25.35 26.53 482.99 1820.62 1393 22
3625.
4 4219.69 840.44136
4 19.773181
8 20.40454
5 844.825 4361.61 3777.
2
LOST LOST LOST WON WON WON

Time motion analysis of International rugby Appendix A
8
0
1000
2000
3000
4000
5000
6000
7000
8000
1 3 5 7 9 11 13 15 17 19 21
DISTANCE TEAM A
0
1000
2000
3000
4000
5000
6000
7000
8000
1 3 5 7 9 11 13 15 17 19 21
DISTANCE TEAM B
0
200
400
600
800
1000
1200
1400
1600
1800
2000
1 3 5 7 9 11 13 15 17 19 21
HI DISTANCE TEAM B
0
200
400
600
800
1000
1200
1400
1600
1800
2000
1 3 5 7 9 11 13 15 17 19 21
HI DISTANCE TEAM A

Time motion analysis of International rugby Appendix A
9
MATCH 3 Losing Team Winning Team
No Time Distance HI Distance
% WR @ HI
% WR @ HI
HI Distance Distance Time No
Props 1 5525 5436.69 394.46 7.26 8.81 340.61 3866.91 3444 1
3 2815 2846.96 120.63 4.24 5.69 203.16 3567.42 3444 3
4170 4141.83 257.545 5.75 7.25 271.885 3717.17 3444
Locks 4 4695 5005.09 407.53 8.14 9.82 487.36 4961.78 4701 4
5 3367 3853.06 346.56 8.99 14.22 844.12 5937.06 5525 5
4031 4429.08 377.045 8.565 12.02 665.74 5449.42 5113
2 2815 3045.18 388.98 12.77 17.82 1075.35 6034.46 5525 2
Loosies 6 2815 3246.27 705.94 21.75 21.81 1038.32 4760.87 4198 6
7 5525 6021.83 960.03 15.94 22.92 1385.38 6044.7 5471 7
8 5071 5954.73 1596.39 26.81 21.41 1445.1 6748.51 5525 8
4056.5 4567 912.835 19.31 22.0466667 1289.6 5851.36 5064.7
In Backs 9 4265 5190.9 1261.76 24.31 20.33 1235.37 6077.08 5016 9
10 5525 6211.66 1097.83 17.67 25.35 1591.34 6278.55 4838 10
12 4708 6092.52 1589.31 26.09 20.09 1284.25 6391.58 5525 12
13 5525 6552.84 1571 23.97 19.65 1205.63 6134.04 5525 13
5005.8 6011.98 1379.975 23.01 21.355 1329.1475 6220.31 5226
Out Backs 11 5525 7443.21 1991.78 26.76 16.78 751.75 4481 4171 11
14 5525 5942.82 1282.42 21.58 26.09 1770.04 6784.19 5525 14
15 4840 6292.47 1360.79 21.63 16.75 1230.35 7345.03 5525 15
5296.7 6559.5 1544.9967 23.323333 19.8733333 1250.71333 6203.41 5073.7

Time motion analysis of International rugby Appendix A
10
MATCH 4
TEAM A Score 9 3 Score TEAM B
No Time Dist
HI Distance
% WR @ HI
% WR @ HI
HI Distance Dist
Time
No
1 5552 5204.73 371.39 7.14 11.81 698.48 5913.12 5541 1
2 3597 3703.43 512.85 13.85 17.66 1014.97 5748.33 5552 2
3 3444 3287.34 202.26 6.15 6.47 335.7 5188.99 5217 3
4 4063 4251.23 500.53 11.77 16.3 782.45 4799.79 4647 4
5 5552 5943.5 837.9 14.1 22.74 782.8 3442.09 3150 5
6 5552 6125.51 1395.67 22.78 20.82 1264.31 6071.57 5552 6
7 5552 6114.95 843.38 13.79 21.84 1304.08 5972.25 5552 7
8 5552 5989.41 1037.95 17.33 20.71 1296.03 6258.45 5552 8
9 4210 5725.98 1864.15 32.56 27.24 1766.2 6484 5216 9
10 5552 6745.05 1700.79 25.22 23.42 1585.71 6771.53 5552 10
11 5552 7174.24 1888.5 26.32 21.95 1413.86 6442.28 5552 11
12 5552 7069.82 1772.96 25.08 19.95 1182 5924.33 5552 12
13 5552 7609.84 2271.08 29.84 20.19 1350.61 6688.92 5552 13
14 2708 3517.36 786.56 22.36 18.65 1164.56 6243.15 5552 14
15 4253 4934.89 1059.45 21.47 18.31 1430.46 7813.78 5552 15
16 1977 2367.86 610.69 25.79 0 0 0 0 16
17 0 0 0 0 22.17 83.57 376.94 365 17
18 1535 1812.61 476.44 26.28 20.09 539.38 2684.61 2416 18
19 0 0 0 0 28.84 320.8 1112.2 933 19
20 1364 1779.46 466.96 26.24 27.01 132.91 491.99 353 20
21 2844 3174.74 590.48 18.6 0 0 0 0 21
22 1329 1832.2 445.57 24.32 0 0 0 0 22
3695.
1 4289.28 892.5254
5 18.68136
4 17.553181
8 838.58545
5 4292.2 3789
LOST WON WON LOST LOST WON
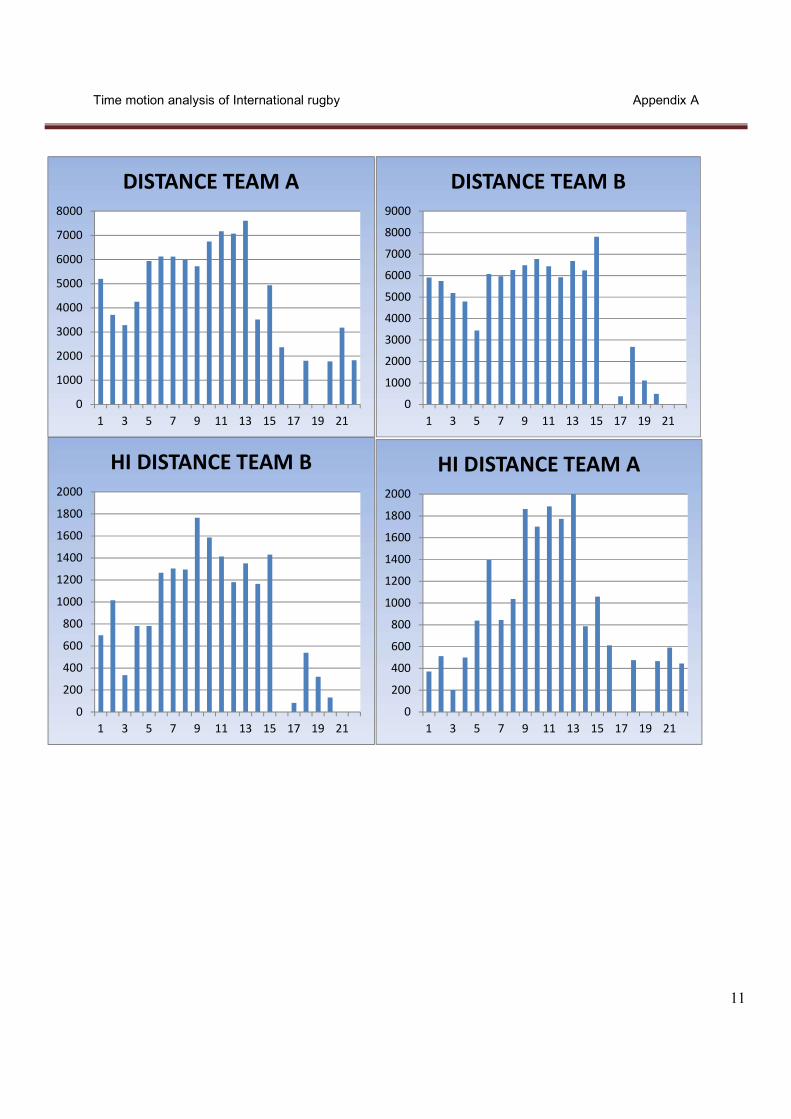
Time motion analysis of International rugby Appendix A
11
0
1000
2000
3000
4000
5000
6000
7000
8000
1 3 5 7 9 11 13 15 17 19 21
DISTANCE TEAM A
0
1000
2000
3000
4000
5000
6000
7000
8000
9000
1 3 5 7 9 11 13 15 17 19 21
DISTANCE TEAM B
0
200
400
600
800
1000
1200
1400
1600
1800
2000
1 3 5 7 9 11 13 15 17 19 21
HI DISTANCE TEAM B
0
200
400
600
800
1000
1200
1400
1600
1800
2000
1 3 5 7 9 11 13 15 17 19 21
HI DISTANCE TEAM A
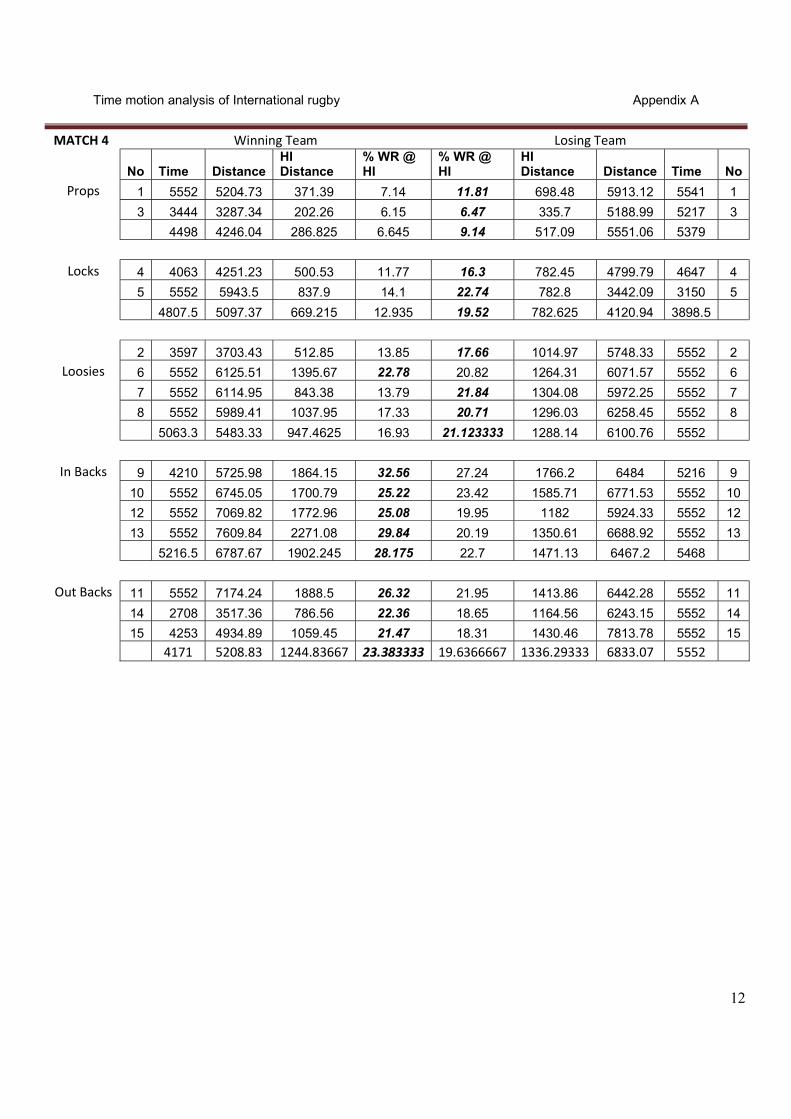
Time motion analysis of International rugby Appendix A
12
MATCH 4 Winning Team Losing Team
No Time Distance HI Distance
% WR @ HI
% WR @ HI
HI Distance Distance Time No
Props 1 5552 5204.73 371.39 7.14 11.81 698.48 5913.12 5541 1
3 3444 3287.34 202.26 6.15 6.47 335.7 5188.99 5217 3
4498 4246.04 286.825 6.645 9.14 517.09 5551.06 5379
Locks 4 4063 4251.23 500.53 11.77 16.3 782.45 4799.79 4647 4
5 5552 5943.5 837.9 14.1 22.74 782.8 3442.09 3150 5
4807.5 5097.37 669.215 12.935 19.52 782.625 4120.94 3898.5
2 3597 3703.43 512.85 13.85 17.66 1014.97 5748.33 5552 2
Loosies 6 5552 6125.51 1395.67 22.78 20.82 1264.31 6071.57 5552 6
7 5552 6114.95 843.38 13.79 21.84 1304.08 5972.25 5552 7
8 5552 5989.41 1037.95 17.33 20.71 1296.03 6258.45 5552 8
5063.3 5483.33 947.4625 16.93 21.123333 1288.14 6100.76 5552
In Backs 9 4210 5725.98 1864.15 32.56 27.24 1766.2 6484 5216 9
10 5552 6745.05 1700.79 25.22 23.42 1585.71 6771.53 5552 10
12 5552 7069.82 1772.96 25.08 19.95 1182 5924.33 5552 12
13 5552 7609.84 2271.08 29.84 20.19 1350.61 6688.92 5552 13
5216.5 6787.67 1902.245 28.175 22.7 1471.13 6467.2 5468
Out Backs 11 5552 7174.24 1888.5 26.32 21.95 1413.86 6442.28 5552 11
14 2708 3517.36 786.56 22.36 18.65 1164.56 6243.15 5552 14
15 4253 4934.89 1059.45 21.47 18.31 1430.46 7813.78 5552 15
4171 5208.83 1244.83667 23.383333 19.6366667 1336.29333 6833.07 5552
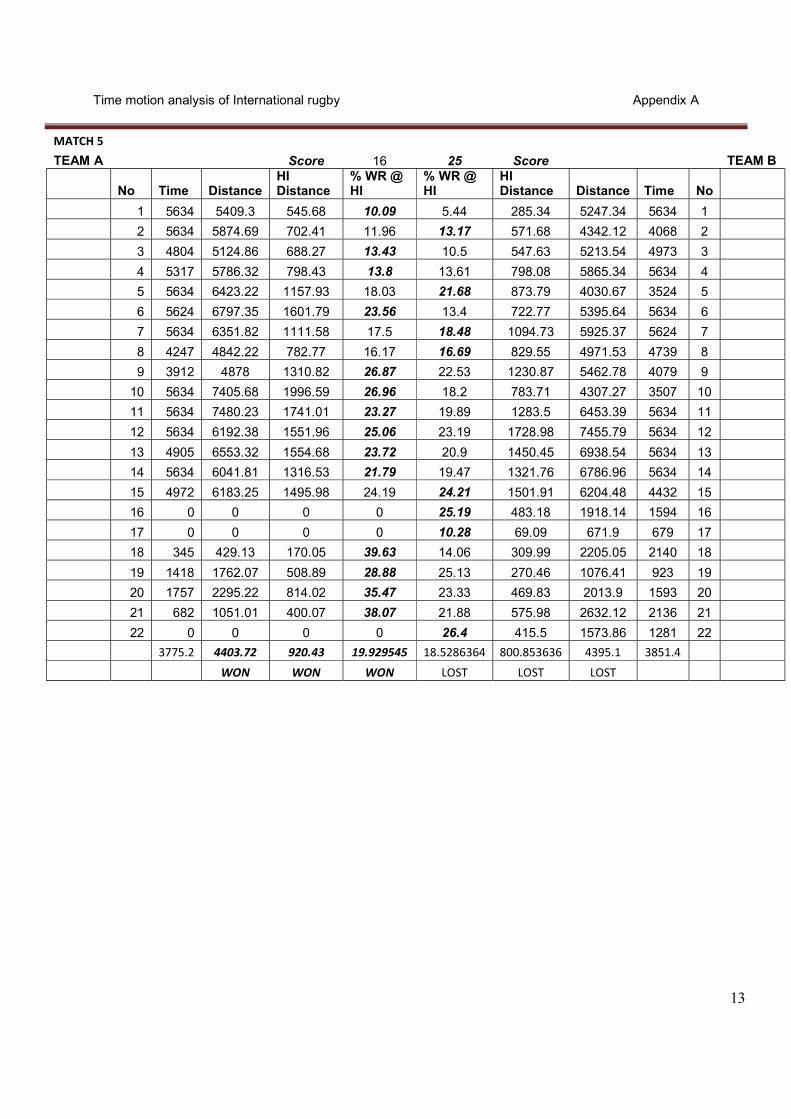
Time motion analysis of International rugby Appendix A
13
MATCH 5
TEAM A Score 16 25 Score TEAM B
No Time Distance HI Distance
% WR @ HI
% WR @ HI
HI Distance Distance Time No
1 5634 5409.3 545.68 10.09 5.44 285.34 5247.34 5634 1
2 5634 5874.69 702.41 11.96 13.17 571.68 4342.12 4068 2
3 4804 5124.86 688.27 13.43 10.5 547.63 5213.54 4973 3
4 5317 5786.32 798.43 13.8 13.61 798.08 5865.34 5634 4
5 5634 6423.22 1157.93 18.03 21.68 873.79 4030.67 3524 5
6 5624 6797.35 1601.79 23.56 13.4 722.77 5395.64 5634 6
7 5634 6351.82 1111.58 17.5 18.48 1094.73 5925.37 5624 7
8 4247 4842.22 782.77 16.17 16.69 829.55 4971.53 4739 8
9 3912 4878 1310.82 26.87 22.53 1230.87 5462.78 4079 9
10 5634 7405.68 1996.59 26.96 18.2 783.71 4307.27 3507 10
11 5634 7480.23 1741.01 23.27 19.89 1283.5 6453.39 5634 11
12 5634 6192.38 1551.96 25.06 23.19 1728.98 7455.79 5634 12
13 4905 6553.32 1554.68 23.72 20.9 1450.45 6938.54 5634 13
14 5634 6041.81 1316.53 21.79 19.47 1321.76 6786.96 5634 14
15 4972 6183.25 1495.98 24.19 24.21 1501.91 6204.48 4432 15
16 0 0 0 0 25.19 483.18 1918.14 1594 16
17 0 0 0 0 10.28 69.09 671.9 679 17
18 345 429.13 170.05 39.63 14.06 309.99 2205.05 2140 18
19 1418 1762.07 508.89 28.88 25.13 270.46 1076.41 923 19
20 1757 2295.22 814.02 35.47 23.33 469.83 2013.9 1593 20
21 682 1051.01 400.07 38.07 21.88 575.98 2632.12 2136 21
22 0 0 0 0 26.4 415.5 1573.86 1281 22
3775.2 4403.72 920.43 19.929545 18.5286364 800.853636 4395.1 3851.4
WON WON WON LOST LOST LOST
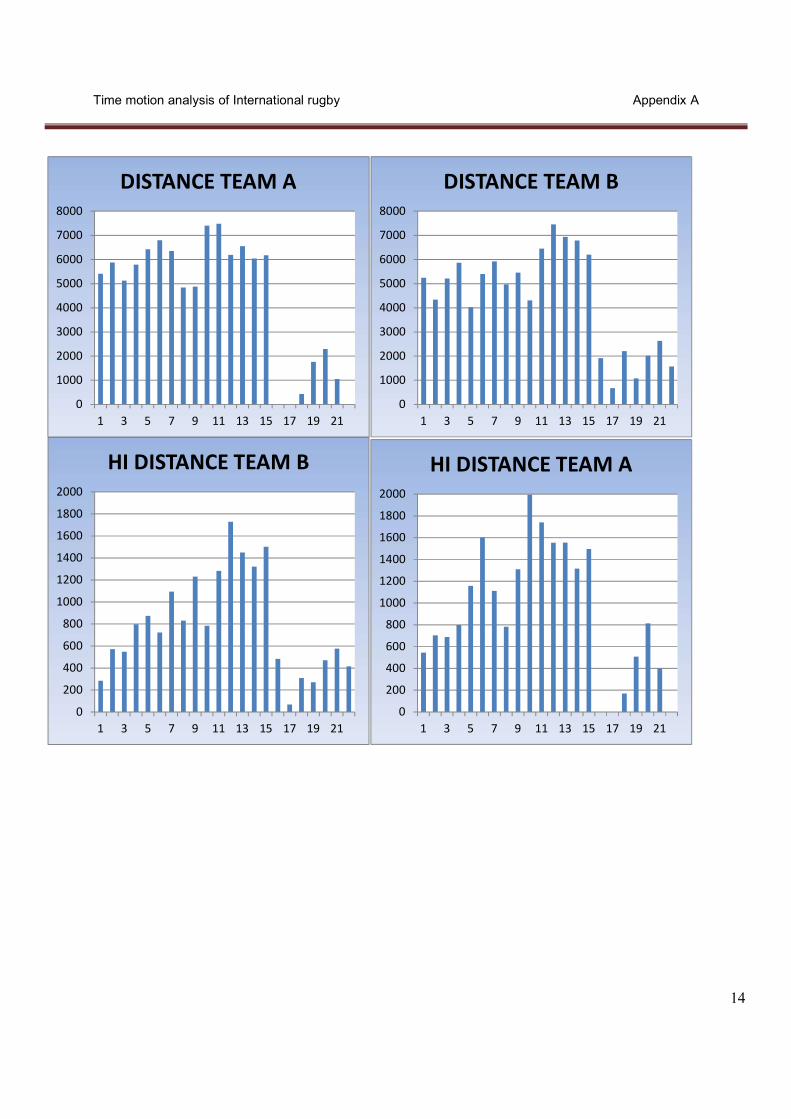
Time motion analysis of International rugby Appendix A
14
0
1000
2000
3000
4000
5000
6000
7000
8000
1 3 5 7 9 11 13 15 17 19 21
DISTANCE TEAM A
0
1000
2000
3000
4000
5000
6000
7000
8000
1 3 5 7 9 11 13 15 17 19 21
DISTANCE TEAM B
0
200
400
600
800
1000
1200
1400
1600
1800
2000
1 3 5 7 9 11 13 15 17 19 21
HI DISTANCE TEAM B
0
200
400
600
800
1000
1200
1400
1600
1800
2000
1 3 5 7 9 11 13 15 17 19 21
HI DISTANCE TEAM A

Time motion analysis of International rugby Appendix A
15
MATCH 5 Losing Team Winning Team
No Time Distance HI Distance
% WR @ HI
% WR @ HI
HI Distance Distance Time No
Props 1 5634 5409.3 545.68 10.09 5.44 285.34 5247.34 5634 1
3 4804 5124.86 688.27 13.43 10.5 547.63 5213.54 4973 3
5219 5267.08 616.975 11.76 7.97 416.485 5230.44 5303.5
Locks 4 5317 5786.32 798.43 13.8 13.61 798.08 5865.34 5634 4
5 5634 6423.22 1157.93 18.03 21.68 873.79 4030.67 3524 5
5475.5 6104.77 978.18 15.915 17.645 835.935 4948.01 4579
2 5634 5874.69 702.41 11.96 13.17 571.68 4342.12 4068 2
Loosies 6 5624 6797.35 1601.79 23.56 13.4 722.77 5395.64 5634 6
7 5634 6351.82 1111.58 17.5 18.48 1094.73 5925.37 5624 7
8 4247 4842.22 782.77 16.17 16.69 829.55 4971.53 4739 8
5284.8 5966.52 1049.63 17.29 16.19 882.35 5430.85 5332.3
In Backs 9 3912 4878 1310.82 26.87 22.53 1230.87 5462.78 4079 9
10 5634 7405.68 1996.59 26.96 18.2 783.71 4307.27 3507 10
12 5634 6192.38 1551.96 25.06 23.19 1728.98 7455.79 5634 12
13 4905 6553.32 1554.68 23.72 20.9 1450.45 6938.54 5634 13
5021.3 6257.35 1603.5125 25.6525 21.205 1298.5025 6041.1 4713.5
Out Backs 11 5634 7480.23 1741.01 23.27 19.89 1283.5 6453.39 5634 11
14 5634 6041.81 1316.53 21.79 19.47 1321.76 6786.96 5634 14
15 4972 6183.25 1495.98 24.19 24.21 1501.91 6204.48 4432 15
5413.3 6568.43 1517.84 23.083333 21.19 1369.05667 6481.61 5233.3
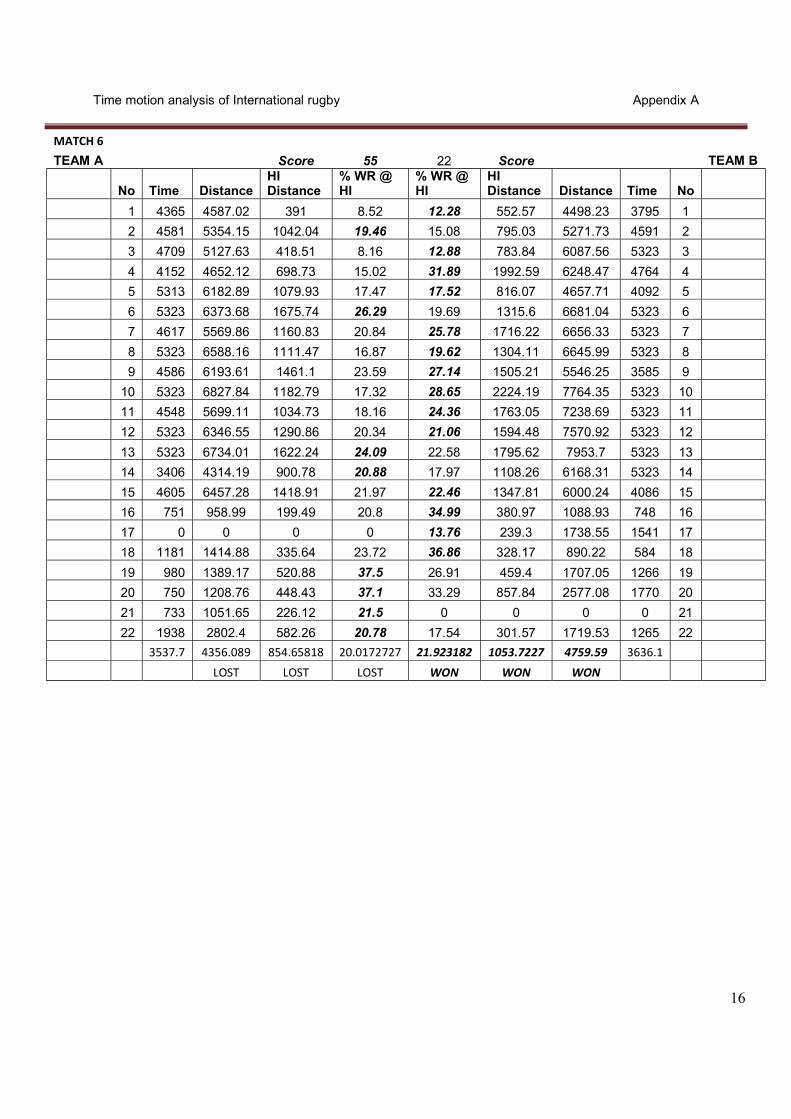
Time motion analysis of International rugby Appendix A
16
MATCH 6
TEAM A Score 55 22 Score TEAM B
No Time Distance HI Distance
% WR @ HI
% WR @ HI
HI Distance Distance Time No
1 4365 4587.02 391 8.52 12.28 552.57 4498.23 3795 1
2 4581 5354.15 1042.04 19.46 15.08 795.03 5271.73 4591 2
3 4709 5127.63 418.51 8.16 12.88 783.84 6087.56 5323 3
4 4152 4652.12 698.73 15.02 31.89 1992.59 6248.47 4764 4
5 5313 6182.89 1079.93 17.47 17.52 816.07 4657.71 4092 5
6 5323 6373.68 1675.74 26.29 19.69 1315.6 6681.04 5323 6
7 4617 5569.86 1160.83 20.84 25.78 1716.22 6656.33 5323 7
8 5323 6588.16 1111.47 16.87 19.62 1304.11 6645.99 5323 8
9 4586 6193.61 1461.1 23.59 27.14 1505.21 5546.25 3585 9
10 5323 6827.84 1182.79 17.32 28.65 2224.19 7764.35 5323 10
11 4548 5699.11 1034.73 18.16 24.36 1763.05 7238.69 5323 11
12 5323 6346.55 1290.86 20.34 21.06 1594.48 7570.92 5323 12
13 5323 6734.01 1622.24 24.09 22.58 1795.62 7953.7 5323 13
14 3406 4314.19 900.78 20.88 17.97 1108.26 6168.31 5323 14
15 4605 6457.28 1418.91 21.97 22.46 1347.81 6000.24 4086 15
16 751 958.99 199.49 20.8 34.99 380.97 1088.93 748 16
17 0 0 0 0 13.76 239.3 1738.55 1541 17
18 1181 1414.88 335.64 23.72 36.86 328.17 890.22 584 18
19 980 1389.17 520.88 37.5 26.91 459.4 1707.05 1266 19
20 750 1208.76 448.43 37.1 33.29 857.84 2577.08 1770 20
21 733 1051.65 226.12 21.5 0 0 0 0 21
22 1938 2802.4 582.26 20.78 17.54 301.57 1719.53 1265 22
3537.7 4356.089 854.65818 20.0172727 21.923182 1053.7227 4759.59 3636.1
LOST LOST LOST WON WON WON
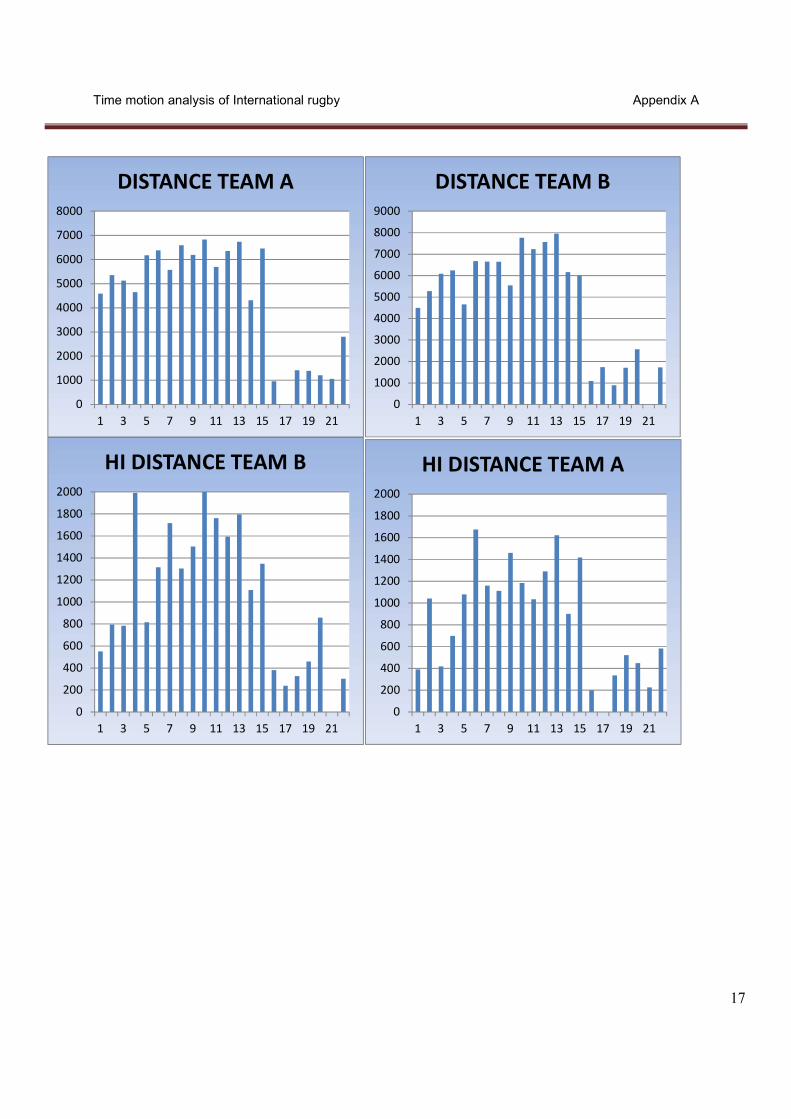
Time motion analysis of International rugby Appendix A
17
0
1000
2000
3000
4000
5000
6000
7000
8000
1 3 5 7 9 11 13 15 17 19 21
DISTANCE TEAM A
0
1000
2000
3000
4000
5000
6000
7000
8000
9000
1 3 5 7 9 11 13 15 17 19 21
DISTANCE TEAM B
0
200
400
600
800
1000
1200
1400
1600
1800
2000
1 3 5 7 9 11 13 15 17 19 21
HI DISTANCE TEAM B
0
200
400
600
800
1000
1200
1400
1600
1800
2000
1 3 5 7 9 11 13 15 17 19 21
HI DISTANCE TEAM A

Time motion analysis of International rugby Appendix A
18
MATCH 6 Winning Team Losing Team
No Time Distance HI Distance
% WR @ HI
% WR @ HI
HI Distance Distance Time No
Props 1 4365 4587.02 391 8.52 12.28 552.57 4498.23 3795 1
3 4709 5127.63 418.51 8.16 12.88 783.84 6087.56 5323 3
4537 4857.325 404.755 8.34 12.58 668.205 5292.9 4559
Locks 4 4152 4652.12 698.73 15.02 31.89 1992.59 6248.47 4764 4
5 5313 6182.89 1079.93 17.47 17.52 816.07 4657.71 4092 5
4732.5 5417.505 889.33 16.245 24.705 1404.33 5453.09 4428
2 4581 5354.15 1042.04 19.46 15.08 795.03 5271.73 4591 2
Loosies 6 5323 6373.68 1675.74 26.29 19.69 1315.6 6681.04 5323 6
7 4617 5569.86 1160.83 20.84 25.78 1716.22 6656.33 5323 7
8 5323 6588.16 1111.47 16.87 19.62 1304.11 6645.99 5323 8
4961 5971.463 1247.52 20.865 21.696667 1445.31 6661.12 5323
In Backs 9 4586 6193.61 1461.1 23.59 27.14 1505.21 5546.25 3585 9
10 5323 6827.84 1182.79 17.32 28.65 2224.19 7764.35 5323 10
12 5323 6346.55 1290.86 20.34 21.06 1594.48 7570.92 5323 12
13 5323 6734.01 1622.24 24.09 22.58 1795.62 7953.7 5323 13
5138.8 6525.503 1389.2475 21.335 24.8575 1779.875 7208.81 4888.5
Out
Backs 11 4548 5699.11 1034.73 18.16 24.36 1763.05 7238.69 5323 11
14 3406 4314.19 900.78 20.88 17.97 1108.26 6168.31 5323 14
15 4605 6457.28 1418.91 21.97 22.46 1347.81 6000.24 4086 15
4186.3 5490.193 1118.14 20.3366667 21.596667 1406.37333 6469.08 4910.7

Time motion analysis of International rugby Appendix A
19
MATCH 7
TEAM A Score 35 8 Score TEAM B
No Time Distance HI Distance
% WR @ HI
% WR @ HI
HI Distance Distance Time No Name
1 3884 3824.99 447.7 11.7 16.02 675.19 4213.65 4272 1
2 3695 4082.04 928.63 22.75 15.25 685.29 4493.15 4574 2
3 5769 5682.4 651.81 11.47 9.19 476.06 5182.19 5871 3
4 4346 4176.41 771.2 18.47 15.71 584.13 3718.4 4131 4
5 5871 5442.16 577.88 10.62 15.23 902.39 5923.32 5871 5
6 3621 3876.12 858.3 22.14 17.03 1027.01 6031.52 5871 6
7 5871 6156.53 1182.82 19.21 23.05 876.02 3800.67 3399 7
8 5430 5375.59 926.82 17.24 19.74 1130.34 5726.01 5871 8
9 3089 3778.89 1035.6 27.4 26.72 1237.09 4630.17 3964 9
10 5871 7501.09 1950.31 26 18.64 1209.2 6485.72 5871 10
11 5871 6834.49 1285.75 18.81 17.26 1003.46 5814.87 5871 11
12 4147 4608.05 857.35 18.61 20.59 936.09 4547.32 4402 12
13 5871 7851.62 1864.63 23.75 24.12 1606.37 6661.2 5871 13
14 2760 3629.29 574.24 15.82 22.46 1163.49 5180.12 5021 14
15 5871 7812.19 1995.79 25.55 21.67 1435.57 6624.54 5871 15
16 2405 2352.46 393.4 16.72 10.05 125.99 1253.12 1317 16
17 0 0 0 0 17.58 284.85 1620.07 1506 17
18 1556 1618.28 443.77 27.42 18.35 339.73 1850.89 1763 18
19 2257 2187.48 535.97 24.5 21.09 435.44 2064.94 1947 19
20 2787 3443.93 1128.86 32.78 33.62 601.07 1787.63 1301 20
21 3111 3795.83 848.98 22.37 28.74 516.68 1797.65 1526 21
22 1786 2391.59 636.77 26.63 24 308.36 1284.89 868 22
3903.1 4382.79 904.39 19.998182 19.8231818 798.173636 4122.37 3953
WON WON WON LOST LOST LOST

Time motion analysis of International rugby Appendix A
20
0
1000
2000
3000
4000
5000
6000
7000
8000
9000
1 3 5 7 9 11 13 15 17 19 21
DISTANCE TEAM A
0
1000
2000
3000
4000
5000
6000
7000
1 3 5 7 9 11 13 15 17 19 21
DISTANCE TEAM B
0
200
400
600
800
1000
1200
1400
1600
1800
2000
1 3 5 7 9 11 13 15 17 19 21
HI DISTANCE TEAM B
0
200
400
600
800
1000
1200
1400
1600
1800
2000
1 3 5 7 9 11 13 15 17 19 21
HI DISTANCE TEAM A
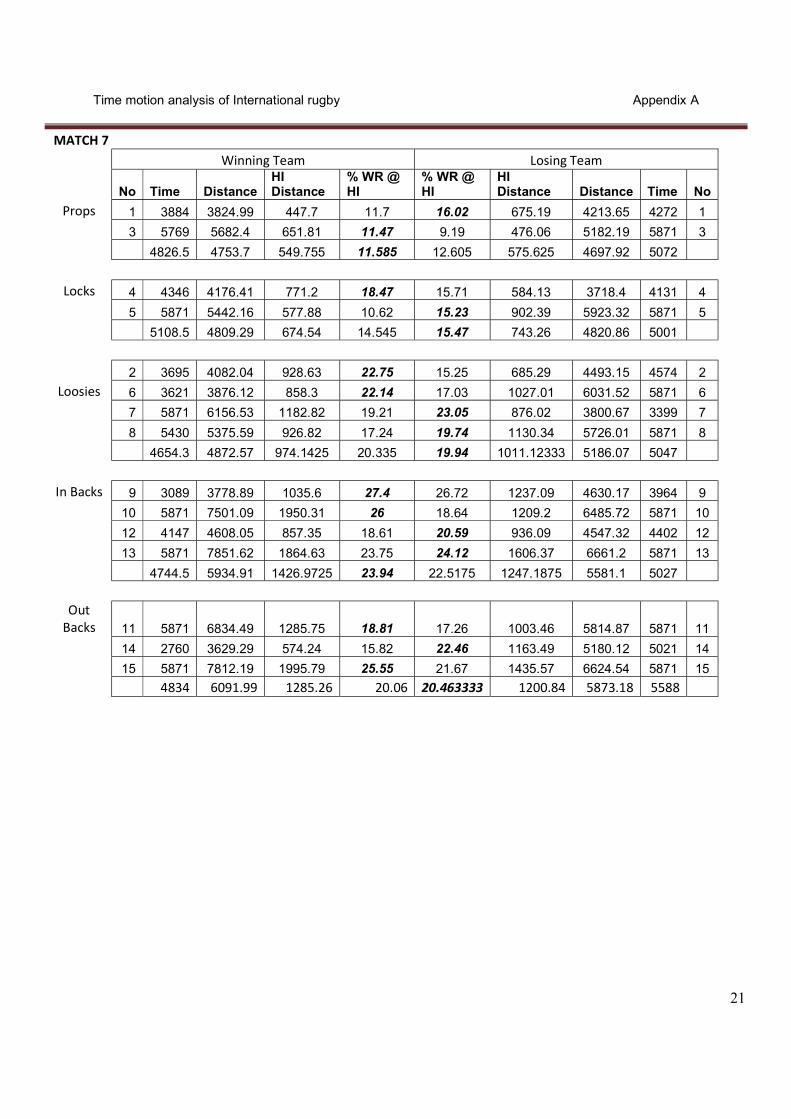
Time motion analysis of International rugby Appendix A
21
MATCH 7 Winning Team Losing Team
No Time Distance HI Distance
% WR @ HI
% WR @ HI
HI Distance Distance Time No
Props 1 3884 3824.99 447.7 11.7 16.02 675.19 4213.65 4272 1
3 5769 5682.4 651.81 11.47 9.19 476.06 5182.19 5871 3
4826.5 4753.7 549.755 11.585 12.605 575.625 4697.92 5072
Locks 4 4346 4176.41 771.2 18.47 15.71 584.13 3718.4 4131 4
5 5871 5442.16 577.88 10.62 15.23 902.39 5923.32 5871 5
5108.5 4809.29 674.54 14.545 15.47 743.26 4820.86 5001
2 3695 4082.04 928.63 22.75 15.25 685.29 4493.15 4574 2
Loosies 6 3621 3876.12 858.3 22.14 17.03 1027.01 6031.52 5871 6
7 5871 6156.53 1182.82 19.21 23.05 876.02 3800.67 3399 7
8 5430 5375.59 926.82 17.24 19.74 1130.34 5726.01 5871 8
4654.3 4872.57 974.1425 20.335 19.94 1011.12333 5186.07 5047
In Backs 9 3089 3778.89 1035.6 27.4 26.72 1237.09 4630.17 3964 9
10 5871 7501.09 1950.31 26 18.64 1209.2 6485.72 5871 10
12 4147 4608.05 857.35 18.61 20.59 936.09 4547.32 4402 12
13 5871 7851.62 1864.63 23.75 24.12 1606.37 6661.2 5871 13
4744.5 5934.91 1426.9725 23.94 22.5175 1247.1875 5581.1 5027
Out
Backs 11 5871 6834.49 1285.75 18.81 17.26 1003.46 5814.87 5871 11
14 2760 3629.29 574.24 15.82 22.46 1163.49 5180.12 5021 14
15 5871 7812.19 1995.79 25.55 21.67 1435.57 6624.54 5871 15
4834 6091.99 1285.26 20.06 20.463333 1200.84 5873.18 5588
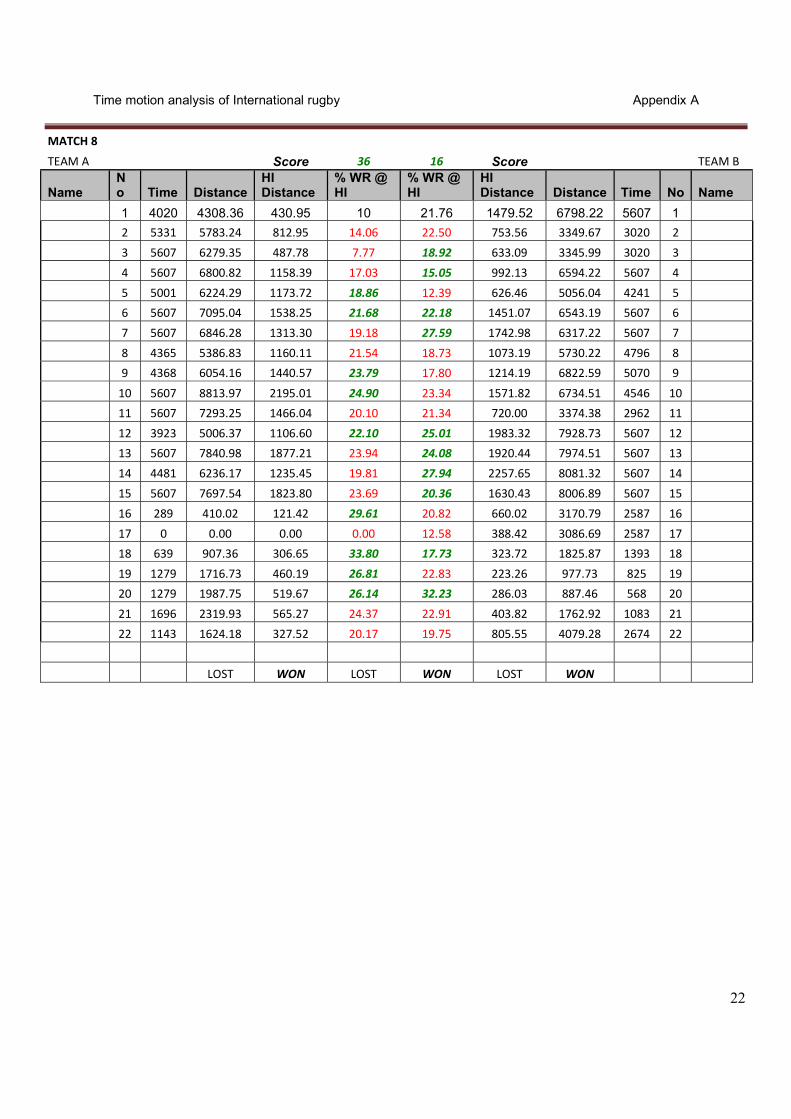
Time motion analysis of International rugby Appendix A
22
MATCH 8
TEAM A Score 36 16 Score TEAM B
Name No Time Distance
HI Distance
% WR @ HI
% WR @ HI
HI Distance Distance Time No Name
1 4020 4308.36 430.95 10 21.76 1479.52 6798.22 5607 1
2 5331 5783.24 812.95 14.06 22.50 753.56 3349.67 3020 2
3 5607 6279.35 487.78 7.77 18.92 633.09 3345.99 3020 3
4 5607 6800.82 1158.39 17.03 15.05 992.13 6594.22 5607 4
5 5001 6224.29 1173.72 18.86 12.39 626.46 5056.04 4241 5
6 5607 7095.04 1538.25 21.68 22.18 1451.07 6543.19 5607 6
7 5607 6846.28 1313.30 19.18 27.59 1742.98 6317.22 5607 7
8 4365 5386.83 1160.11 21.54 18.73 1073.19 5730.22 4796 8
9 4368 6054.16 1440.57 23.79 17.80 1214.19 6822.59 5070 9
10 5607 8813.97 2195.01 24.90 23.34 1571.82 6734.51 4546 10
11 5607 7293.25 1466.04 20.10 21.34 720.00 3374.38 2962 11
12 3923 5006.37 1106.60 22.10 25.01 1983.32 7928.73 5607 12
13 5607 7840.98 1877.21 23.94 24.08 1920.44 7974.51 5607 13
14 4481 6236.17 1235.45 19.81 27.94 2257.65 8081.32 5607 14
15 5607 7697.54 1823.80 23.69 20.36 1630.43 8006.89 5607 15
16 289 410.02 121.42 29.61 20.82 660.02 3170.79 2587 16
17 0 0.00 0.00 0.00 12.58 388.42 3086.69 2587 17
18 639 907.36 306.65 33.80 17.73 323.72 1825.87 1393 18
19 1279 1716.73 460.19 26.81 22.83 223.26 977.73 825 19
20 1279 1987.75 519.67 26.14 32.23 286.03 887.46 568 20
21 1696 2319.93 565.27 24.37 22.91 403.82 1762.92 1083 21
22 1143 1624.18 327.52 20.17 19.75 805.55 4079.28 2674 22
LOST WON LOST WON LOST WON

Time motion analysis of International rugby Appendix A
23
0100020003000400050006000700080009000
10000
1 3 5 7 9 11 13 15 17 19 21
DISTANCE TEAM A
0
1000
2000
3000
4000
5000
6000
7000
8000
9000
1 3 5 7 9 11 13 15 17 19 21
DISTANCE TEAM B
0
200
400
600
800
1000
1200
1400
1600
1800
2000
1 3 5 7 9 11 13 15 17 19 21
HI DISTANCE TEAM A
0
200
400
600
800
1000
1200
1400
1600
1800
2000
1 3 5 7 9 11 13 15 17 19 21
HI DISTANCE TEAM B

Time motion analysis of International rugby Appendix A
24
MATCH 8 Losing Team Winning Team
No Time Distance HI Distance
% WR @ HI
% WR @ HI
HI Distance Distance Time No
Props 1 5607 6798.22 1479.52 21.76 10.00 430.95 4308.36 4020 1 3 3020 3345.99 633.09 18.92 7.77 487.78 6279.35 5607 3 5072.11 1056.31 20.34 8.89 459.37 5293.86
Locks 4 5607 6594.22 992.13 15.05 17.03 1158.39 6800.82 5607 4 5 4241 5056.04 626.46 12.39 18.86 1173.72 6224.29 5001 5 5825.13 809.30 13.72 17.95 1166.06 6512.56 2 3020 3349.67 753.56 22.50 14.06 812.95 5783.24 5331 2
Loosies 6 5607 6543.19 1451.07 22.18 21.68 1538.25 7095.04 5607 6 7 5607 6317.22 1742.98 27.59 19.18 1313.30 6846.28 5607 7 8 4796 5730.22 1073.19 18.73 21.54 1160.11 5386.83 4365 8 5485.08 1255.20 22.75 19.12 1206.15 6277.85
In Backs 9 5070 6822.59 1214.19 17.80 23.79 1440.57 6054.16 4368 9 10 4546 6734.51 1571.82 23.34 24.90 2195.01 8813.97 5607 10 12 5607 7928.73 1983.32 25.01 22.10 1106.60 5006.37 3923 12 13 5607 7974.51 1920.44 24.08 23.94 1877.21 7840.98 5607 13 7365.09 1672.44 22.56 23.68 1654.85 6928.87 4876.3
Out Backs 11 2962 3374.38 720.00 21.34 20.10 1466.04 7293.25 5607 11
14 5607 8081.32 2257.65 27.94 19.81 1235.45 6236.17 4481 14 15 5607 8006.89 1630.43 20.36 23.69 1823.80 7697.54 5607 15 6487.53 1536.03 23.21 21.20 1508.43 7075.65
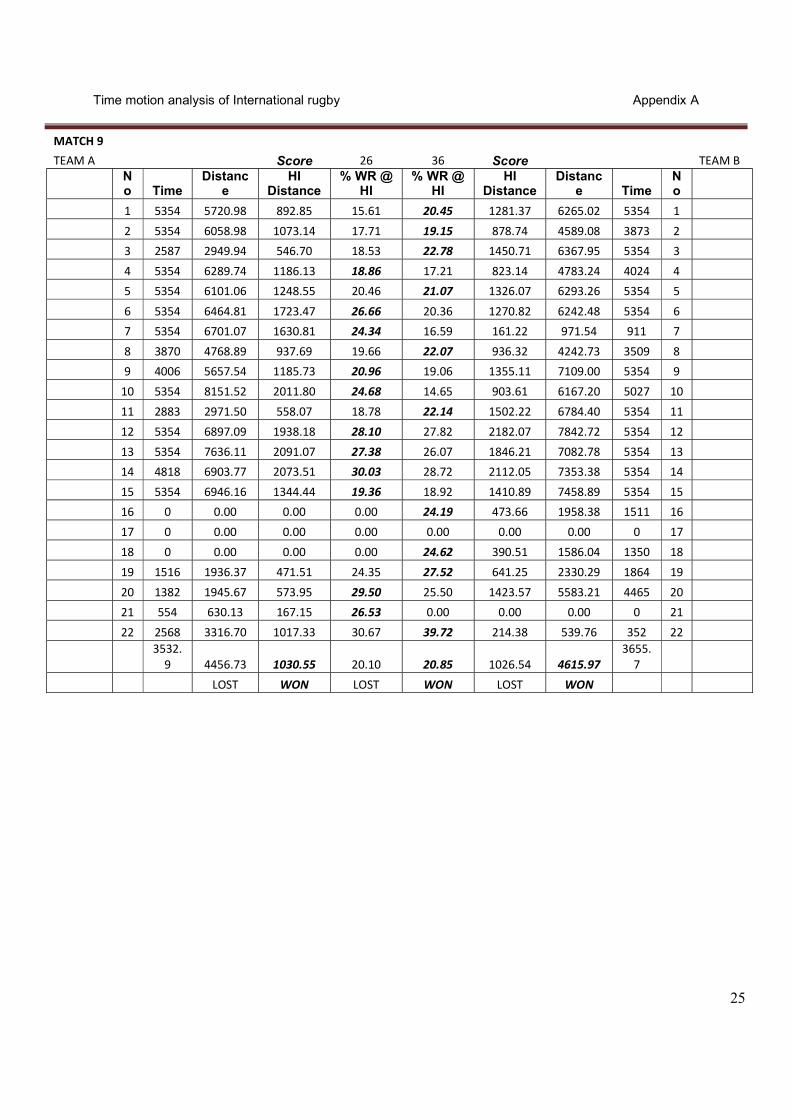
Time motion analysis of International rugby Appendix A
25
MATCH 9 TEAM A Score 26 36 Score TEAM B
No Time
Distance
HI Distance
% WR @ HI
% WR @ HI
HI Distance
Distance Time
No
1 5354 5720.98 892.85 15.61 20.45 1281.37 6265.02 5354 1
2 5354 6058.98 1073.14 17.71 19.15 878.74 4589.08 3873 2
3 2587 2949.94 546.70 18.53 22.78 1450.71 6367.95 5354 3
4 5354 6289.74 1186.13 18.86 17.21 823.14 4783.24 4024 4
5 5354 6101.06 1248.55 20.46 21.07 1326.07 6293.26 5354 5
6 5354 6464.81 1723.47 26.66 20.36 1270.82 6242.48 5354 6
7 5354 6701.07 1630.81 24.34 16.59 161.22 971.54 911 7
8 3870 4768.89 937.69 19.66 22.07 936.32 4242.73 3509 8
9 4006 5657.54 1185.73 20.96 19.06 1355.11 7109.00 5354 9
10 5354 8151.52 2011.80 24.68 14.65 903.61 6167.20 5027 10
11 2883 2971.50 558.07 18.78 22.14 1502.22 6784.40 5354 11
12 5354 6897.09 1938.18 28.10 27.82 2182.07 7842.72 5354 12
13 5354 7636.11 2091.07 27.38 26.07 1846.21 7082.78 5354 13
14 4818 6903.77 2073.51 30.03 28.72 2112.05 7353.38 5354 14
15 5354 6946.16 1344.44 19.36 18.92 1410.89 7458.89 5354 15
16 0 0.00 0.00 0.00 24.19 473.66 1958.38 1511 16
17 0 0.00 0.00 0.00 0.00 0.00 0.00 0 17
18 0 0.00 0.00 0.00 24.62 390.51 1586.04 1350 18
19 1516 1936.37 471.51 24.35 27.52 641.25 2330.29 1864 19
20 1382 1945.67 573.95 29.50 25.50 1423.57 5583.21 4465 20
21 554 630.13 167.15 26.53 0.00 0.00 0.00 0 21
22 2568 3316.70 1017.33 30.67 39.72 214.38 539.76 352 22
3532.
9 4456.73 1030.55 20.10 20.85 1026.54 4615.97 3655.
7
LOST WON LOST WON LOST WON

Time motion analysis of International rugby Appendix A
26
0,00
1000,00
2000,00
3000,00
4000,00
5000,00
6000,00
7000,00
8000,00
9000,00
1 3 5 7 9 11 13 15 17 19 21
DISTANCE TEAM A
0,00
1000,00
2000,00
3000,00
4000,00
5000,00
6000,00
7000,00
8000,00
9000,00
1 3 5 7 9 11 13 15 17 19 21
DISTANCE TEAM B
0,00
200,00
400,00
600,00
800,00
1000,00
1200,00
1400,00
1600,00
1800,00
2000,00
1 3 5 7 9 11 13 15 17 19 21
HI DISTANCE TEAM A
0,00
200,00
400,00
600,00
800,00
1000,00
1200,00
1400,00
1600,00
1800,00
2000,00
1 3 5 7 9 11 13 15 17 19 21
HI DISTANCE TEAM B
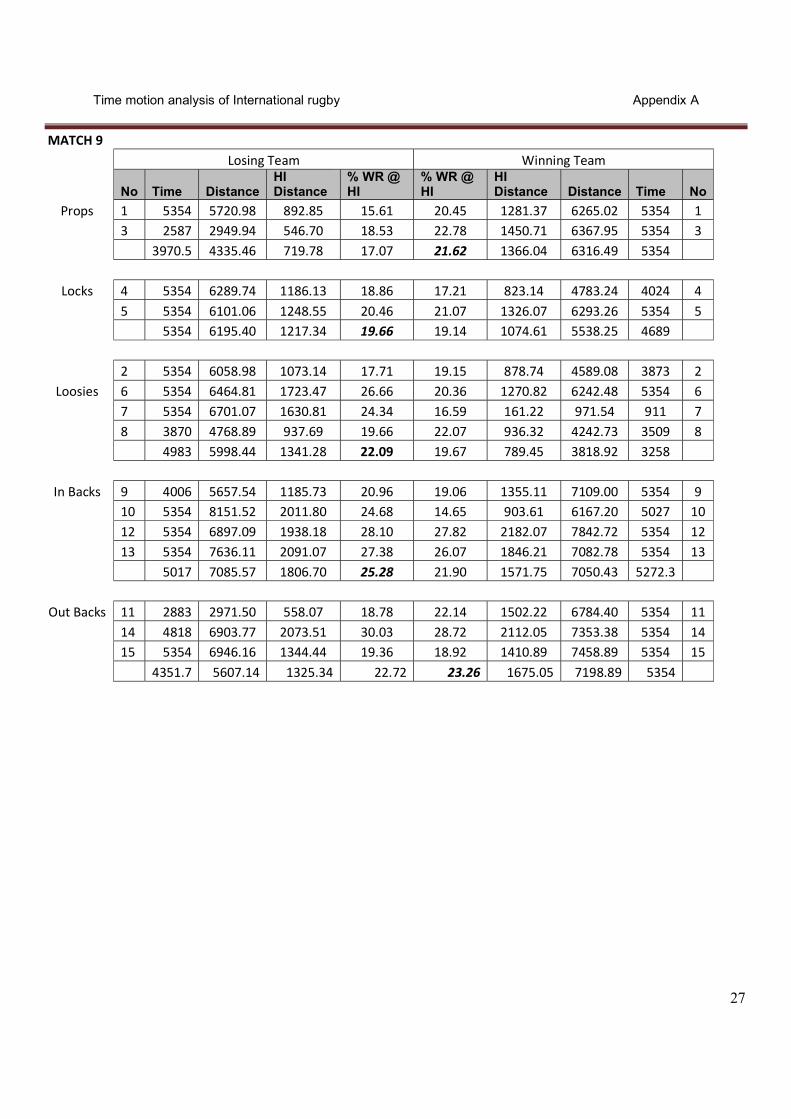
Time motion analysis of International rugby Appendix A
27
MATCH 9 Losing Team Winning Team
No Time Distance HI Distance
% WR @ HI
% WR @ HI
HI Distance Distance Time No
Props 1 5354 5720.98 892.85 15.61 20.45 1281.37 6265.02 5354 1 3 2587 2949.94 546.70 18.53 22.78 1450.71 6367.95 5354 3 3970.5 4335.46 719.78 17.07 21.62 1366.04 6316.49 5354
Locks 4 5354 6289.74 1186.13 18.86 17.21 823.14 4783.24 4024 4 5 5354 6101.06 1248.55 20.46 21.07 1326.07 6293.26 5354 5 5354 6195.40 1217.34 19.66 19.14 1074.61 5538.25 4689 2 5354 6058.98 1073.14 17.71 19.15 878.74 4589.08 3873 2
Loosies 6 5354 6464.81 1723.47 26.66 20.36 1270.82 6242.48 5354 6 7 5354 6701.07 1630.81 24.34 16.59 161.22 971.54 911 7 8 3870 4768.89 937.69 19.66 22.07 936.32 4242.73 3509 8 4983 5998.44 1341.28 22.09 19.67 789.45 3818.92 3258
In Backs 9 4006 5657.54 1185.73 20.96 19.06 1355.11 7109.00 5354 9 10 5354 8151.52 2011.80 24.68 14.65 903.61 6167.20 5027 10 12 5354 6897.09 1938.18 28.10 27.82 2182.07 7842.72 5354 12 13 5354 7636.11 2091.07 27.38 26.07 1846.21 7082.78 5354 13 5017 7085.57 1806.70 25.28 21.90 1571.75 7050.43 5272.3
Out Backs 11 2883 2971.50 558.07 18.78 22.14 1502.22 6784.40 5354 11 14 4818 6903.77 2073.51 30.03 28.72 2112.05 7353.38 5354 14 15 5354 6946.16 1344.44 19.36 18.92 1410.89 7458.89 5354 15 4351.7 5607.14 1325.34 22.72 23.26 1675.05 7198.89 5354

Time motion analysis of International rugby Appendix A
28
MATCH 10 TEAM A Score 30 27 Score TEAM B
No Time
Distance
HI Distance
% WR @ HI
% WR @ HI
HI Distance
Distance Time
No
1 4338 4456.35 617.72 13.86 17.64 1037.25 5879.60 5462 1
2 3599 3890.89 659.69 16.95 17.02 726.56 4269.95 3862 2
3 5462 5355.30 679.84 12.69 8.85 413.40 4668.77 5039 3
4 5462 6098.22 1342.04 22.01 14.14 749.65 5302.35 5462 4
5 5462 5592.38 817.11 14.61 18.35 1118.72 6096.96 5462 5
6 3601 4166.74 750.75 18.02 20.19 1222.63 6054.74 5462 6
7 3000 3505.56 761.54 21.72 16.47 724.26 4398.50 3853 7
8 5462 6088.74 1393.37 22.88 8.75 415.76 4752.80 4680 8
9 3266 4550.66 1244.74 27.35 20.97 1321.58 6301.09 5145 9
10 5470 7263.99 1471.63 20.26 10.13 399.64 3944.20 3284 10
11 4552 5285.19 1120.77 21.21 16.58 1174.63 7083.56 5462 11
12 5462 6676.40 1237.00 18.53 23.24 1418.09 6101.42 5064 12
13 5462 6969.70 1890.34 27.12 17.73 1117.80 6303.41 5462 13
14 5462 6125.08 950.29 15.51 23.07 1626.53 7050.97 5462 14
15 5469 6937.81 1301.68 18.76 17.91 1171.80 6543.10 5462 15
16 1886 1902.43 385.63 20.27 20.23 355.48 1756.95 1628 16
17 0 0.00 0.00 0.00 12.97 59.66 459.90 430 17
18 1807 1912.71 519.02 27.14 27.35 240.19 878.11 811 18
19 1887 2076.74 370.38 17.83 27.96 496.11 1774.67 1628 19
20 2216 3031.56 949.42 31.32 27.82 103.66 372.56 314 20
21 917 1116.09 331.89 29.74 15.75 376.73 2392.21 2199 21
22 0 0.00 0.00 0.00 27.01 163.10 603.75 430 22
3647.
4 4227.39 854.31 18.99 18.64 746.97 4226.80 3730.
1
WON WON WON LOST LOST LOST

Time motion analysis of International rugby Appendix A
29
0,00
1000,00
2000,00
3000,00
4000,00
5000,00
6000,00
7000,00
8000,00
1 3 5 7 9 11 13 15 17 19 21
DISTANCE TEAM A
0,00
1000,00
2000,00
3000,00
4000,00
5000,00
6000,00
7000,00
8000,00
1 3 5 7 9 11 13 15 17 19 21
DISTANCE TEAM B
0,00200,00400,00600,00800,00
1000,001200,001400,001600,001800,002000,00
1 3 5 7 9 11 13 15 17 19 21
HI DISTANCE TEAM A
0,00
200,00
400,00
600,00
800,00
1000,00
1200,00
1400,00
1600,00
1800,00
1 3 5 7 9 11 13 15 17 19 21
HI DISTANCE TEAM B

Time motion analysis of International rugby Appendix A
30
MATCH 10 Winning Team Losing Team
No Time Distance HI Distance
% WR @ HI
% WR @ HI
HI Distance Distance Time No
Props 1 4338 4456.35 617.72 13.86 17.64 1037.25 5879.60 5462 1 3 5462 5355.30 679.84 12.69 8.85 413.40 4668.77 5039 3 4900 4905.83 648.78 13.28 13.25 725.33 5274.19 5250.5
Locks 4 5462 6098.22 1342.04 22.01 14.14 749.65 5302.35 5462 4 5 5462 5592.38 817.11 14.61 18.35 1118.72 6096.96 5462 5 5462 5845.30 1079.58 18.31 16.24 934.19 5699.66 5462 2 3599 3890.89 659.69 16.95 17.02 726.56 4269.95 3862 2
Loosies 6 3601 4166.74 750.75 18.02 20.19 1222.63 6054.74 5462 6 7 3000 3505.56 761.54 21.72 16.47 724.26 4398.50 3853 7 8 5462 6088.74 1393.37 22.88 8.75 415.76 4752.80 4680 8 3915.5 4412.98 891.34 19.90 15.14 787.55 5068.68 4665
In Backs 9 3266 4550.66 1244.74 27.35 20.97 1321.58 6301.09 5145 9 10 5470 7263.99 1471.63 20.26 10.13 399.64 3944.20 3284 10 12 5462 6676.40 1237.00 18.53 23.24 1418.09 6101.42 5064 12 13 5462 6969.70 1890.34 27.12 17.73 1117.80 6303.41 5462 13 4915 6365.19 1460.93 23.32 18.02 1064.28 5662.53 4738.8
Out Backs 11 4552 5285.19 1120.77 21.21 16.58 1174.63 7083.56 5462 11 14 5462 6125.08 950.29 15.51 23.07 1626.53 7050.97 5462 14
15 5469 6937.81 1301.68 18.76 17.91 1171.80 6543.10 5462 15 5161 6116.03 1124.25 18.49 19.19 1324.32 6892.54 5462
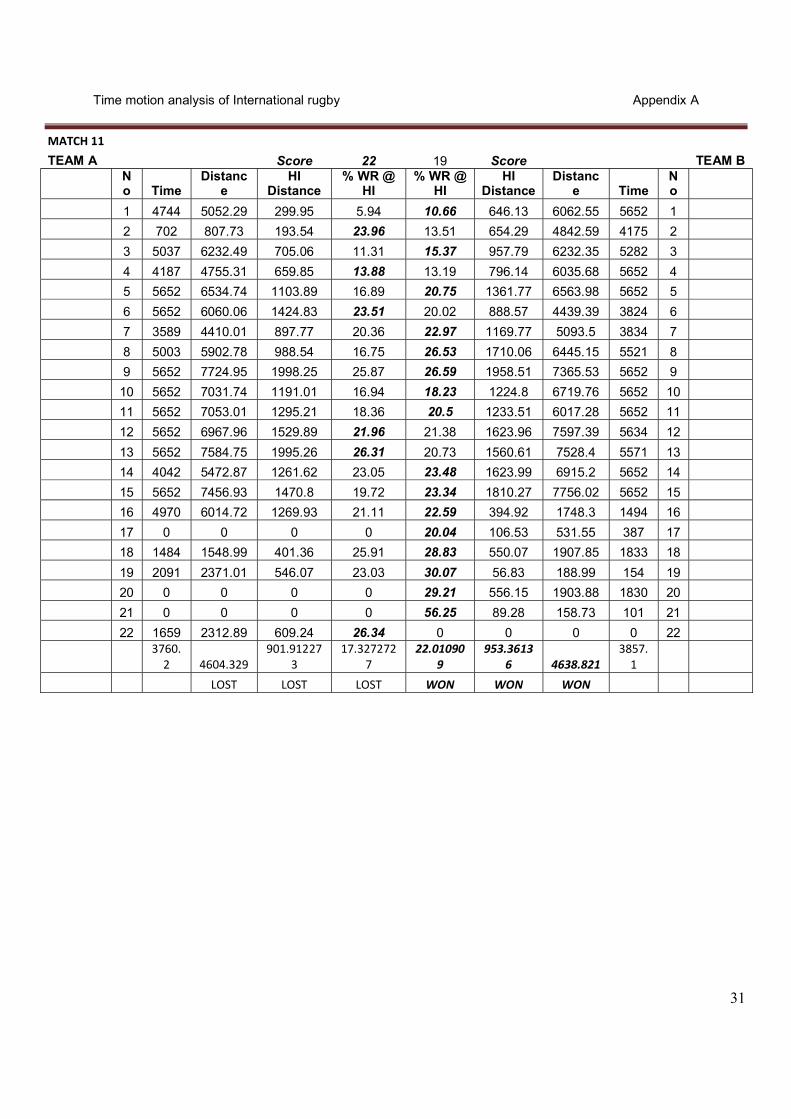
Time motion analysis of International rugby Appendix A
31
MATCH 11
TEAM A Score 22 19 Score TEAM B
No Time
Distance
HI Distance
% WR @ HI
% WR @ HI
HI Distance
Distance Time
No
1 4744 5052.29 299.95 5.94 10.66 646.13 6062.55 5652 1
2 702 807.73 193.54 23.96 13.51 654.29 4842.59 4175 2
3 5037 6232.49 705.06 11.31 15.37 957.79 6232.35 5282 3
4 4187 4755.31 659.85 13.88 13.19 796.14 6035.68 5652 4
5 5652 6534.74 1103.89 16.89 20.75 1361.77 6563.98 5652 5
6 5652 6060.06 1424.83 23.51 20.02 888.57 4439.39 3824 6
7 3589 4410.01 897.77 20.36 22.97 1169.77 5093.5 3834 7
8 5003 5902.78 988.54 16.75 26.53 1710.06 6445.15 5521 8
9 5652 7724.95 1998.25 25.87 26.59 1958.51 7365.53 5652 9
10 5652 7031.74 1191.01 16.94 18.23 1224.8 6719.76 5652 10
11 5652 7053.01 1295.21 18.36 20.5 1233.51 6017.28 5652 11
12 5652 6967.96 1529.89 21.96 21.38 1623.96 7597.39 5634 12
13 5652 7584.75 1995.26 26.31 20.73 1560.61 7528.4 5571 13
14 4042 5472.87 1261.62 23.05 23.48 1623.99 6915.2 5652 14
15 5652 7456.93 1470.8 19.72 23.34 1810.27 7756.02 5652 15
16 4970 6014.72 1269.93 21.11 22.59 394.92 1748.3 1494 16
17 0 0 0 0 20.04 106.53 531.55 387 17
18 1484 1548.99 401.36 25.91 28.83 550.07 1907.85 1833 18
19 2091 2371.01 546.07 23.03 30.07 56.83 188.99 154 19
20 0 0 0 0 29.21 556.15 1903.88 1830 20
21 0 0 0 0 56.25 89.28 158.73 101 21
22 1659 2312.89 609.24 26.34 0 0 0 0 22
3760.
2 4604.329 901.91227
3 17.327272
7 22.01090
9 953.3613
6 4638.821 3857.
1
LOST LOST LOST WON WON WON

Time motion analysis of International rugby Appendix A
32
0
1000
2000
3000
4000
5000
6000
7000
8000
9000
1 3 5 7 9 11 13 15 17 19 21
DISTANCE TEAM A
0
1000
2000
3000
4000
5000
6000
7000
8000
9000
1 3 5 7 9 11 13 15 17 19 21
DISTANCE TEAM B
0
200
400
600
800
1000
1200
1400
1600
1800
2000
1 3 5 7 9 11 13 15 17 19 21
HI DISTANCE TEAM B
0
200
400
600
800
1000
1200
1400
1600
1800
2000
1 3 5 7 9 11 13 15 17 19 21
HI DISTANCE TEAM A

Time motion analysis of International rugby Appendix A
33
MATCH 11 Winning Team Losing Team
No Time Distance HI Distance
% WR @ HI
% WR @ HI
HI Distance Distance Time No
Props 1 4744 5052.29 299.95 5.94 10.66 646.13 6062.55 5652 1
3 5037 6232.49 705.06 11.31 15.37 957.79 6232.35 5282 3
4890.5 5642.39 502.505 8.625 13.015 801.96 6147.45 5467
Locks 4 4187 4755.31 659.85 13.88 13.19 796.14 6035.68 5652 4
5 5652 6534.74 1103.89 16.89 20.75 1361.77 6563.98 5652 5
4919.5 5645.025 881.87 15.385 16.97 1078.955 6299.83 5652
2 702 807.73 193.54 23.96 13.51 654.29 4842.59 4175 2
Loosies 6 5652 6060.06 1424.83 23.51 20.02 888.57 4439.39 3824 6
7 3589 4410.01 897.77 20.36 22.97 1169.77 5093.5 3834 7
8 5003 5902.78 988.54 16.75 26.53 1710.06 6445.15 5521 8
3736.5 4295.145 876.17 21.145 23.173333 1256.13333 5326.013 4393
In Backs 9 5652 7724.95 1998.25 25.87 26.59 1958.51 7365.53 5652 9
10 5652 7031.74 1191.01 16.94 18.23 1224.8 6719.76 5652 10
12 5652 6967.96 1529.89 21.96 21.38 1623.96 7597.39 5634 12
13 5652 7584.75 1995.26 26.31 20.73 1560.61 7528.4 5571 13
5652 7327.35 1678.6025 22.77 21.7325 1591.97 7302.77 5627.3
Out Backs 11 5652 7053.01 1295.21 18.36 20.5 1233.51 6017.28 5652 11
14 4042 5472.87 1261.62 23.05 23.48 1623.99 6915.2 5652 14
15 5652 7456.93 1470.8 19.72 23.34 1810.27 7756.02 5652 15
5115.3 6660.937 1342.54333 20.3766667 22.44 1555.92333 6896.167 5652

Time motion analysis of International rugby Appendix A
34
MATCH 12
TEAM A Score 21 26 Score TEAM B
No Time
Distance
HI Distance
% WR @ HI
% WR @ HI
HI Distance
Distance Time
No
1 4438 5291.76 826.59 15.62 7.37 453.91 6155.78 5433 1
2 5433 6723.8 1239.63 18.44 16.43 713.5 4343.01 3580 2
3 4802 5720.86 846.73 14.8 17.95 1228.66 6846.33 5433 3
4 4609 5085.71 777.25 15.28 22.79 1499.94 6581.25 5433 4
5 5433 6549.4 1153.6 17.61 14.93 548.17 3670.38 3060 5
6 5433 6261.46 1702.01 27.18 18.09 1154.57 6383.34 5433 6
7 5433 6589.4 1583.5 24.03 24.69 1726.4 6993.68 5433 7
8 3713 4639.53 932.74 20.1 20.85 1311.07 6288.64 5433 8
9 5433 7882.68 2221.23 28.18 23.23 1514.71 6521.18 4798 9
10 3736 5154.72 950.36 18.44 18.14 1321.88 7286.69 5423 10
11 5433 7590.23 1566.54 20.64 18.75 1183.38 6311.07 5433 11
12 5423 7150.07 1490.06 20.84 22.74 1424.25 6263.13 4758 12
13 5433 7651.94 2064.29 26.98 21.97 1657.92 7546.7 5433 13
14 4621 6675.51 1671.59 25.04 23.36 1684.42 7211.47 5433 14
15 5433 7632.73 1689.18 22.13 21.97 1586.81 7221.5 4757 15
16 0 0 0 0 13.08 268.44 2052.49 1900 16
17 0 0 0 0 0 0 0 0 17
18 876 1482.86 462.17 31.17 19.62 579.56 2953.36 2399 18
19 1098 1370.6 314.83 22.97 0 0 0 0 19
20 0 0 0 0 31.87 340.28 1067.64 666 20
21 876 1326.73 395.8 29.83 28.63 404.64 1413.41 833 21
22 1755 2287.76 565.44 24.72 26.49 351.62 1327.6 720 22
3609.
6 4684.898 1020.615
5 19.27272
7 18.770454
5 952.46045
5 4747.211 3717.
8
LOST WON WON LOST LOST WON

Time motion analysis of International rugby Appendix A
35
0
1000
2000
3000
4000
5000
6000
7000
8000
9000
1 3 5 7 9 11 13 15 17 19 21
DISTANCE TEAM A
0
1000
2000
3000
4000
5000
6000
7000
8000
1 3 5 7 9 11 13 15 17 19 21
DISTANCE TEAM B
0
200
400
600
800
1000
1200
1400
1600
1800
2000
1 3 5 7 9 11 13 15 17 19 21
HI DISTANCE TEAM B
0
200
400
600
800
1000
1200
1400
1600
1800
2000
1 3 5 7 9 11 13 15 17 19 21
HI DISTANCE TEAM A

Time motion analysis of International rugby Appendix A
36
MATCH 12 Losing Team Winning Team
No Time Distance HI Distance
% WR @ HI
% WR @ HI
HI Distance Distance Time No
Props 1 4438 5291.76 826.59 15.62 7.37 453.91 6155.78 5433 1
3 4802 5720.86 846.73 14.8 17.95 1228.66 6846.33 5433 3
4620 5506.31 836.66 15.21 12.66 841.285 6501.055 5433
Locks 4 4609 5085.71 777.25 15.28 22.79 1499.94 6581.25 5433 4
5 5433 6549.4 1153.6 17.61 14.93 548.17 3670.38 3060 5
5021 5817.555 965.425 16.445 18.86 1024.055 5125.815 4246.5
2 5433 6723.8 1239.63 18.44 16.43 713.5 4343.01 3580 2
Loosies 6 5433 6261.46 1702.01 27.18 18.09 1154.57 6383.34 5433 6
7 5433 6589.4 1583.5 24.03 24.69 1726.4 6993.68 5433 7
8 3713 4639.53 932.74 20.1 20.85 1311.07 6288.64 5433 8
5003 6053.548 1364.47 22.4375 21.21 1397.34667 6555.22 5433
In Backs 9 5433 7882.68 2221.23 28.18 23.23 1514.71 6521.18 4798 9
10 3736 5154.72 950.36 18.44 18.14 1321.88 7286.69 5423 10
12 5423 7150.07 1490.06 20.84 22.74 1424.25 6263.13 4758 12
13 5433 7651.94 2064.29 26.98 21.97 1657.92 7546.7 5433 13
5006.3 6959.853 1681.485 23.61 21.52 1479.69 6904.425 5103
Out Backs 11 5433 7590.23 1566.54 20.64 18.75 1183.38 6311.07 5433 11
14 4621 6675.51 1671.59 25.04 23.36 1684.42 7211.47 5433 14
15 5433 7632.73 1689.18 22.13 21.97 1586.81 7221.5 4757 15
5162.3 7299.49 1642.43667 22.603333 21.36 1484.87 6914.68 5207.7

Time motion analysis of International rugby Appendix A
37
MATCH 13
TEAM A Score 34 18 Score TEAM B
No Time
Distance
HI Distance
% WR @ HI
% WR @ HI
HI Distance
Distance Time
No
1 4664 5337.6 893.22 16.73 17.59 1158.12 6582.7 5447 1
2 4348 5477.83 1193.16 21.78 22.85 594.27 2600.44 2083 2
3 5447 6506.3 857.49 13.18 14.84 975.6 6572.42 5447 3
4 3307 4025.22 931.61 23.14 13.74 777.25 5655.29 4755 4
5 5447 6352.44 1189.37 18.72 20.24 1398.97 6911.66 5447 5
6 4667 5914.78 1821.99 30.8 15.16 950.42 6271.11 5447 6
7 5447 6447.69 1241.61 19.26 25.01 1697.46 6786.24 5447 7
8 4354 5148.67 823.43 15.99 19.71 966.72 4904.76 4203 8
9 5447 7301.87 1894.16 25.94 29.29 2076.78 7089.26 4934 9
10 5447 7128.51 1232.1 17.28 22.84 1600.08 7005.8 5447 10
11 3702 4570.69 1127.15 24.66 23.53 1750.19 7437.82 5031 11
12 5447 7906.13 2027.38 25.64 26.3 1296 4928.52 3673 12
13 5447 8003.59 2025.33 25.31 19.24 1299.26 6751.35 5447 13
14 5447 7117.13 1411.81 19.84 27.74 2196.77 7920.4 5447 14
15 5447 7622.89 1710.24 22.44 15.8 1037.12 6565.45 5447 15
16 1147 1362.95 434.29 31.86 21.68 886.82 4090.1 3406 16
17 0 0 0 0 0 0 0 0 17
18 2181 2327.41 340.27 14.62 21.44 180.67 842.65 708 18
19 800 1108.69 411.96 37.16 24.98 375.59 1503.78 1258 19
20 1135 1501.54 385.64 25.68 41.06 319.41 777.91 549 20
21 454 682.26 205 30.05 29.28 740.1 2527.55 1787 21
22 1333 1743.6 346.53 19.87 32.94 226.85 688.6 451 22
3687 4708.536 1022.8972
7 21.815909
1 22.05727
3 1022.929
5 4746.08 3721
LOST LOST LOST WON WON WON

Time motion analysis of International rugby Appendix A
38
0
1000
2000
3000
4000
5000
6000
7000
8000
9000
1 3 5 7 9 11 13 15 17 19 21
DISTANCE TEAM A
0
1000
2000
3000
4000
5000
6000
7000
8000
9000
1 3 5 7 9 11 13 15 17 19 21
DISTANCE TEAM B
0
200
400
600
800
1000
1200
1400
1600
1800
2000
1 3 5 7 9 11 13 15 17 19 21
HI DISTANCE TEAM B
0
200
400
600
800
1000
1200
1400
1600
1800
2000
1 3 5 7 9 11 13 15 17 19 21
HI DISTANCE TEAM A
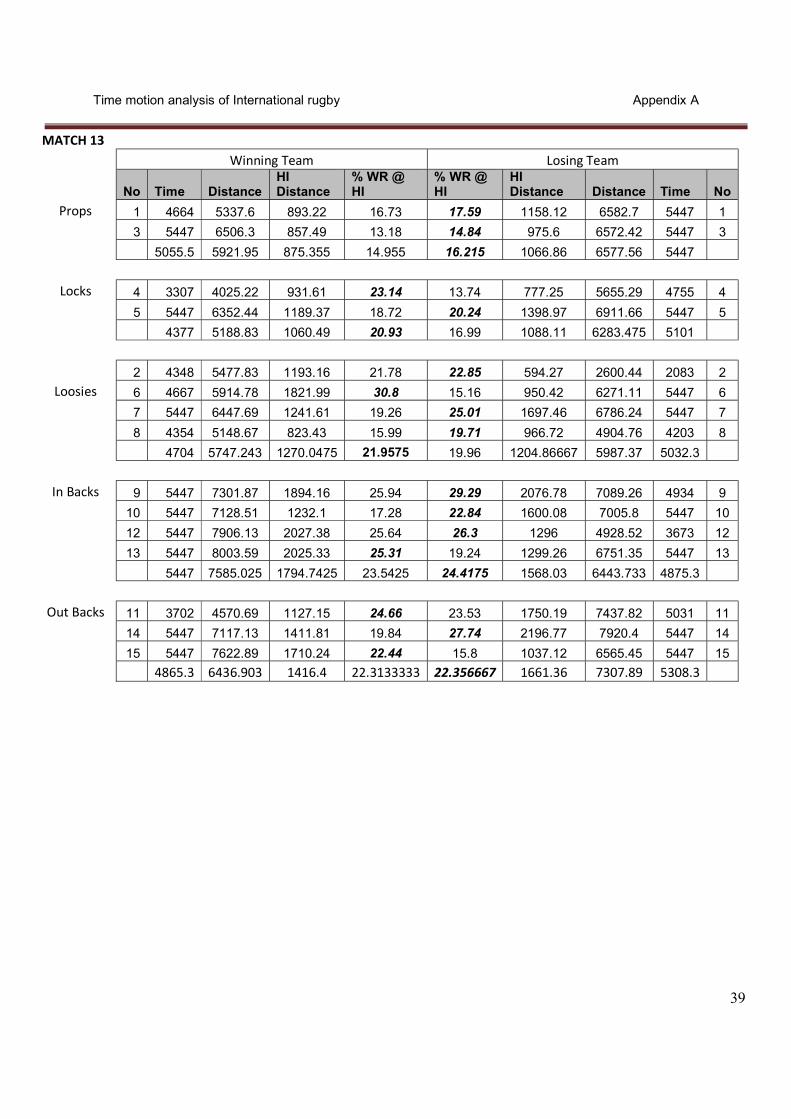
Time motion analysis of International rugby Appendix A
39
MATCH 13 Winning Team Losing Team
No Time Distance HI Distance
% WR @ HI
% WR @ HI
HI Distance Distance Time No
Props 1 4664 5337.6 893.22 16.73 17.59 1158.12 6582.7 5447 1
3 5447 6506.3 857.49 13.18 14.84 975.6 6572.42 5447 3
5055.5 5921.95 875.355 14.955 16.215 1066.86 6577.56 5447
Locks 4 3307 4025.22 931.61 23.14 13.74 777.25 5655.29 4755 4
5 5447 6352.44 1189.37 18.72 20.24 1398.97 6911.66 5447 5
4377 5188.83 1060.49 20.93 16.99 1088.11 6283.475 5101
2 4348 5477.83 1193.16 21.78 22.85 594.27 2600.44 2083 2
Loosies 6 4667 5914.78 1821.99 30.8 15.16 950.42 6271.11 5447 6
7 5447 6447.69 1241.61 19.26 25.01 1697.46 6786.24 5447 7
8 4354 5148.67 823.43 15.99 19.71 966.72 4904.76 4203 8
4704 5747.243 1270.0475 21.9575 19.96 1204.86667 5987.37 5032.3
In Backs 9 5447 7301.87 1894.16 25.94 29.29 2076.78 7089.26 4934 9
10 5447 7128.51 1232.1 17.28 22.84 1600.08 7005.8 5447 10
12 5447 7906.13 2027.38 25.64 26.3 1296 4928.52 3673 12
13 5447 8003.59 2025.33 25.31 19.24 1299.26 6751.35 5447 13
5447 7585.025 1794.7425 23.5425 24.4175 1568.03 6443.733 4875.3
Out Backs 11 3702 4570.69 1127.15 24.66 23.53 1750.19 7437.82 5031 11
14 5447 7117.13 1411.81 19.84 27.74 2196.77 7920.4 5447 14
15 5447 7622.89 1710.24 22.44 15.8 1037.12 6565.45 5447 15
4865.3 6436.903 1416.4 22.3133333 22.356667 1661.36 7307.89 5308.3
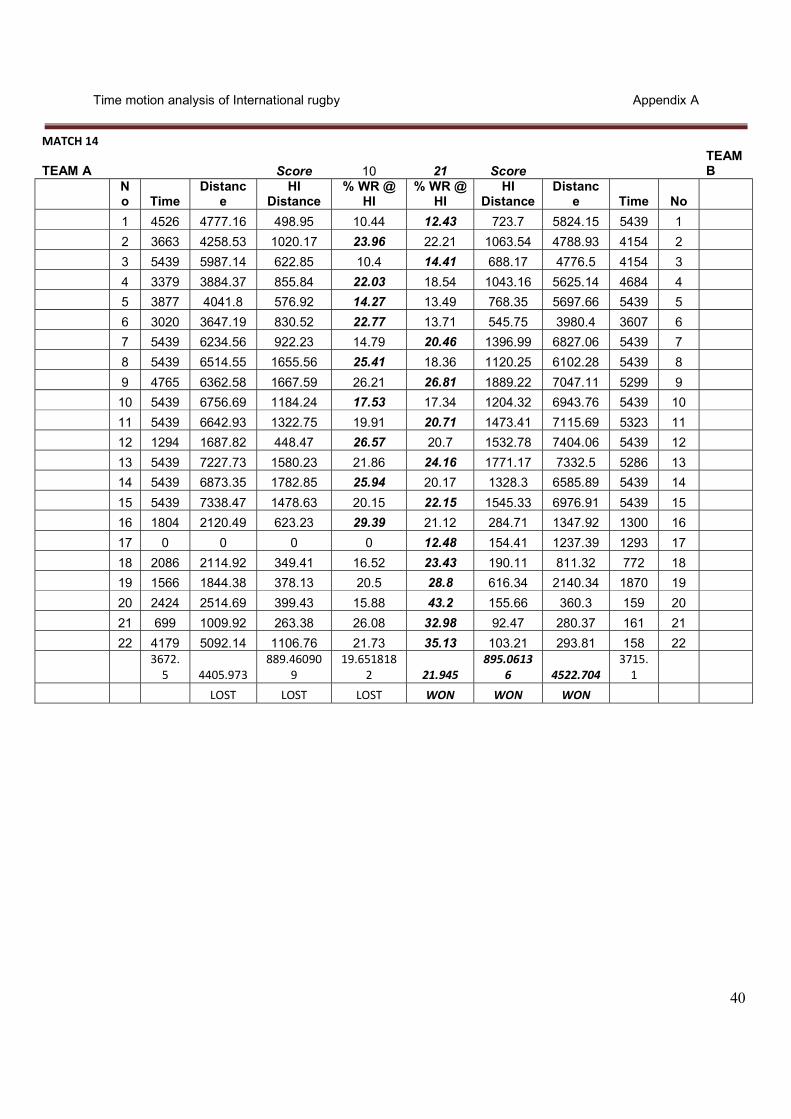
Time motion analysis of International rugby Appendix A
40
MATCH 14
TEAM A Score 10 21 Score TEAM B
No Time
Distance
HI Distance
% WR @ HI
% WR @ HI
HI Distance
Distance Time No
1 4526 4777.16 498.95 10.44 12.43 723.7 5824.15 5439 1
2 3663 4258.53 1020.17 23.96 22.21 1063.54 4788.93 4154 2
3 5439 5987.14 622.85 10.4 14.41 688.17 4776.5 4154 3
4 3379 3884.37 855.84 22.03 18.54 1043.16 5625.14 4684 4
5 3877 4041.8 576.92 14.27 13.49 768.35 5697.66 5439 5
6 3020 3647.19 830.52 22.77 13.71 545.75 3980.4 3607 6
7 5439 6234.56 922.23 14.79 20.46 1396.99 6827.06 5439 7
8 5439 6514.55 1655.56 25.41 18.36 1120.25 6102.28 5439 8
9 4765 6362.58 1667.59 26.21 26.81 1889.22 7047.11 5299 9
10 5439 6756.69 1184.24 17.53 17.34 1204.32 6943.76 5439 10
11 5439 6642.93 1322.75 19.91 20.71 1473.41 7115.69 5323 11
12 1294 1687.82 448.47 26.57 20.7 1532.78 7404.06 5439 12
13 5439 7227.73 1580.23 21.86 24.16 1771.17 7332.5 5286 13
14 5439 6873.35 1782.85 25.94 20.17 1328.3 6585.89 5439 14
15 5439 7338.47 1478.63 20.15 22.15 1545.33 6976.91 5439 15
16 1804 2120.49 623.23 29.39 21.12 284.71 1347.92 1300 16
17 0 0 0 0 12.48 154.41 1237.39 1293 17
18 2086 2114.92 349.41 16.52 23.43 190.11 811.32 772 18
19 1566 1844.38 378.13 20.5 28.8 616.34 2140.34 1870 19
20 2424 2514.69 399.43 15.88 43.2 155.66 360.3 159 20
21 699 1009.92 263.38 26.08 32.98 92.47 280.37 161 21
22 4179 5092.14 1106.76 21.73 35.13 103.21 293.81 158 22
3672.
5 4405.973 889.46090
9 19.651818
2 21.945 895.0613
6 4522.704 3715.
1
LOST LOST LOST WON WON WON
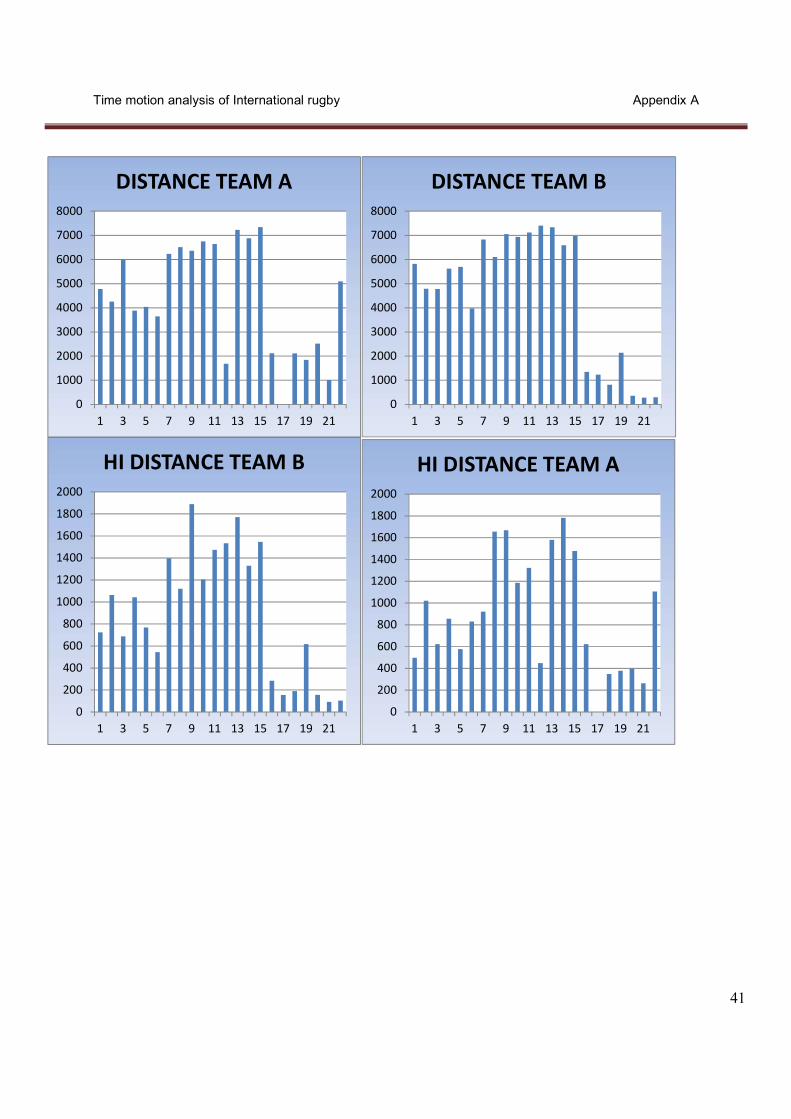
Time motion analysis of International rugby Appendix A
41
0
1000
2000
3000
4000
5000
6000
7000
8000
1 3 5 7 9 11 13 15 17 19 21
DISTANCE TEAM A
0
1000
2000
3000
4000
5000
6000
7000
8000
1 3 5 7 9 11 13 15 17 19 21
DISTANCE TEAM B
0
200
400
600
800
1000
1200
1400
1600
1800
2000
1 3 5 7 9 11 13 15 17 19 21
HI DISTANCE TEAM B
0
200
400
600
800
1000
1200
1400
1600
1800
2000
1 3 5 7 9 11 13 15 17 19 21
HI DISTANCE TEAM A
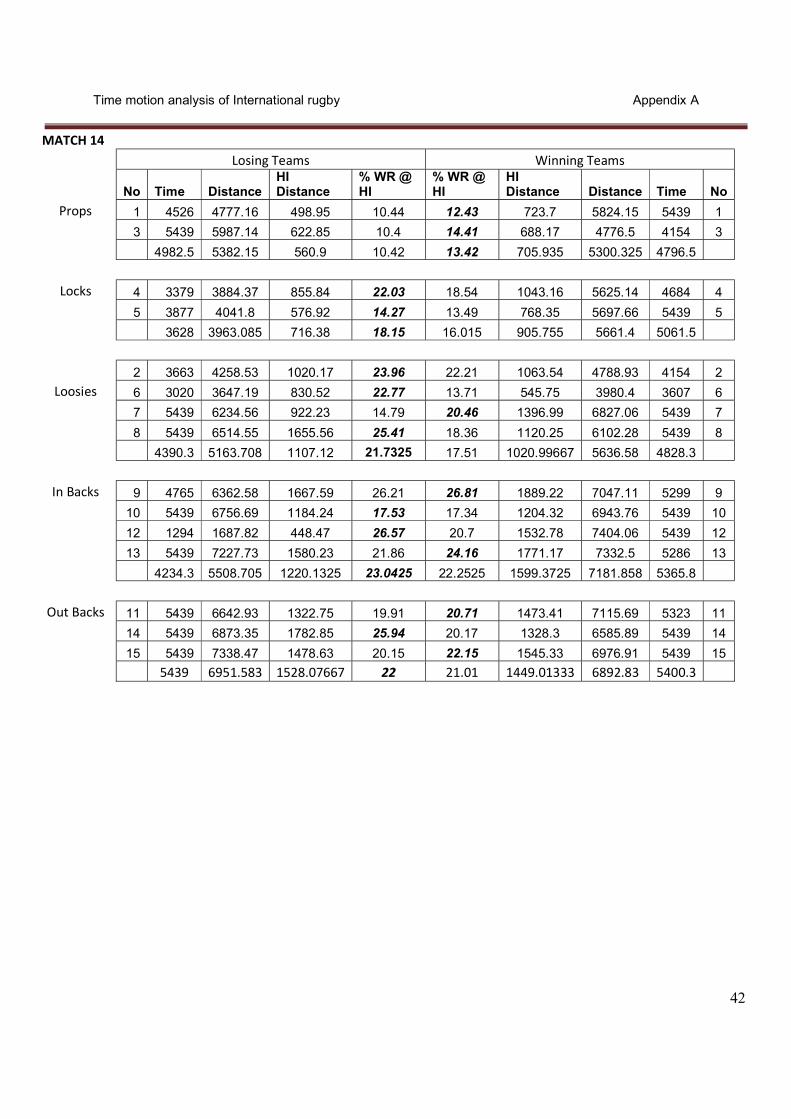
Time motion analysis of International rugby Appendix A
42
MATCH 14 Losing Teams Winning Teams
No Time Distance HI Distance
% WR @ HI
% WR @ HI
HI Distance Distance Time No
Props 1 4526 4777.16 498.95 10.44 12.43 723.7 5824.15 5439 1
3 5439 5987.14 622.85 10.4 14.41 688.17 4776.5 4154 3
4982.5 5382.15 560.9 10.42 13.42 705.935 5300.325 4796.5
Locks 4 3379 3884.37 855.84 22.03 18.54 1043.16 5625.14 4684 4
5 3877 4041.8 576.92 14.27 13.49 768.35 5697.66 5439 5
3628 3963.085 716.38 18.15 16.015 905.755 5661.4 5061.5
2 3663 4258.53 1020.17 23.96 22.21 1063.54 4788.93 4154 2
Loosies 6 3020 3647.19 830.52 22.77 13.71 545.75 3980.4 3607 6
7 5439 6234.56 922.23 14.79 20.46 1396.99 6827.06 5439 7
8 5439 6514.55 1655.56 25.41 18.36 1120.25 6102.28 5439 8
4390.3 5163.708 1107.12 21.7325 17.51 1020.99667 5636.58 4828.3
In Backs 9 4765 6362.58 1667.59 26.21 26.81 1889.22 7047.11 5299 9
10 5439 6756.69 1184.24 17.53 17.34 1204.32 6943.76 5439 10
12 1294 1687.82 448.47 26.57 20.7 1532.78 7404.06 5439 12
13 5439 7227.73 1580.23 21.86 24.16 1771.17 7332.5 5286 13
4234.3 5508.705 1220.1325 23.0425 22.2525 1599.3725 7181.858 5365.8
Out Backs 11 5439 6642.93 1322.75 19.91 20.71 1473.41 7115.69 5323 11
14 5439 6873.35 1782.85 25.94 20.17 1328.3 6585.89 5439 14
15 5439 7338.47 1478.63 20.15 22.15 1545.33 6976.91 5439 15
5439 6951.583 1528.07667 22 21.01 1449.01333 6892.83 5400.3

Time motion analysis of International rugby Appendix A
43
MATCH 15
TEAM A Score 17 3 Score TEAM B
No Time Distance HI
Distance % WR @
HI % WR @
HI HI
Distance Distance Time No
1 4713 4889.81 433.05 8.86 9.02 401.83 4456.04 3949 1
2 4044 4571.7 793.73 17.36 18.31 1172.47 6402.25 5484 2
3 4819 5417.65 433.02 7.99 19.01 1150.67 6051.46 5484 3
4 5484 6080.46 1052.25 17.31 17.79 939.45 5279.61 4542 4
5 4043 4456.24 538.83 12.09 14.29 860.99 6024.38 5484 5
6 4393 5229.04 1085.02 20.75 20.28 1000.37 4933.38 4260 6
7 5484 6217.62 939.66 15.11 22.83 1062.65 4654.59 3951 7
8 4678 5116.19 605.02 11.83 16.96 1039.56 6129.98 5484 8
9 5297 7210.06 1541.17 21.38 23.03 1595.47 6929.15 5484 9
10 4337 5639.77 1101.85 19.54 20.49 1536.69 7499.84 5484 10
11 5484 8089.62 1953.42 24.15 14.07 750 5330.93 5454 11
12 4828 6539.4 1721.19 26.32 23.06 1585.48 6875.97 5484 12
13 5474 7599.03 1714.44 22.56 20.49 1365.83 6666.18 5484 13
14 5484 6764.31 1255.03 18.55 26.67 1888.54 7082.19 5484 14
15 5474 7353.04 1485.12 20.2 21.96 1682.42 7660.95 5484 15
16 1469 1678.25 532.65 31.74 33.4 667.97 1999.7 1566 16
17 0 0 0 0 16.12 261.1 1619.88 1559 17
18 1468 1549.08 260.9 16.84 25.99 389.01 1496.93 1233 18
19 1118 1292.45 372.42 28.82 29.94 355.81 1188.47 960 19
20 818 1138.82 342.44 30.07 0 0 0 0 20
21 212 403.25 166.61 41.32 0 0 0 0 21
22 1881 2918.91 791.4 27.11 0 0 0 0 22
3681.9 4552.486 869.055455 19.995455 17.8959091 895.74136 4467.358 3741.5
WON LOST WON LOST WON LOST

Time motion analysis of International rugby Appendix A
44
0
1000
2000
3000
4000
5000
6000
7000
8000
9000
1 3 5 7 9 11 13 15 17 19 21
DISTANCE TEAM A
0
1000
2000
3000
4000
5000
6000
7000
8000
9000
1 3 5 7 9 11 13 15 17 19 21
DISTANCE TEAM B
0
200
400
600
800
1000
1200
1400
1600
1800
2000
1 3 5 7 9 11 13 15 17 19 21
HI DISTANCE TEAM B
0
200
400
600
800
1000
1200
1400
1600
1800
2000
1 3 5 7 9 11 13 15 17 19 21
HI DISTANCE TEAM A

Time motion analysis of International rugby Appendix A
45
MATCH 15 Winning Team Losing Team
No Time Distance HI Distance
% WR @ HI
% WR @ HI
HI Distance Distance Time No
Props 1 4713 4889.81 433.05 8.86 9.02 401.83 4456.04 3949 1
3 4819 5417.65 433.02 7.99 19.01 1150.67 6051.46 5484 3
4766 5153.73 433.035 8.425 14.015 776.25 5253.75 4716.5
Locks 4 5484 6080.46 1052.25 17.31 17.79 939.45 5279.61 4542 4
5 4043 4456.24 538.83 12.09 14.29 860.99 6024.38 5484 5
4763.5 5268.35 795.54 14.7 16.04 900.22 5651.995 5013
2 4044 4571.7 793.73 17.36 18.31 1172.47 6402.25 5484 2
Loosies 6 4393 5229.04 1085.02 20.75 20.28 1000.37 4933.38 4260 6
7 5484 6217.62 939.66 15.11 22.83 1062.65 4654.59 3951 7
8 4678 5116.19 605.02 11.83 16.96 1039.56 6129.98 5484 8
4649.8 5283.638 855.8575 16.2625 20.023333 1034.19333 5239.317 4565
In Backs 9 5297 7210.06 1541.17 21.38 23.03 1595.47 6929.15 5484 9
10 4337 5639.77 1101.85 19.54 20.49 1536.69 7499.84 5484 10
12 4828 6539.4 1721.19 26.32 23.06 1585.48 6875.97 5484 12
13 5474 7599.03 1714.44 22.56 20.49 1365.83 6666.18 5484 13
4984 6747.065 1519.6625 22.45 21.7675 1520.8675 6992.785 5484
Out
Backs 11 5484 8089.62 1953.42 24.15 14.07 750 5330.93 5454 11
14 5484 6764.31 1255.03 18.55 26.67 1888.54 7082.19 5484 14
15 5474 7353.04 1485.12 20.2 21.96 1682.42 7660.95 5484 15
5480.7 7402.323 1564.52333 20.966667 20.9 1440.32 6691.357 5474

Time motion analysis of International rugby Appendix A
46
MATCH 16
TEAM A Score 27 26 Score TEAM B
No Time
Distance
HI Distance
% WR @ HI
% WR @ HI
HI Distance
Distance Time
No
1 4671 5580.83 1314.57 23.56 13.9 878.58 6322.28 5653 1
2 4762 5436.42 1137.8 20.93 12.52 702.53 5610.08 5653 2
3 5653 5638.61 536.96 9.52 10.35 354.52 3425.02 2801 3
4 2576 3175.22 512.3 16.13 18.75 1183.61 6312.17 5653 4
5 5653 6056.33 776.27 12.82 23.13 1184.37 5120.57 4047 5
6 3934 5200.9 1260.82 24.24 22.92 1411.09 6157.64 5653 6
7 5653 6532.3 1185.07 18.14 20.53 1281.48 6241.44 5653 7
8 3751 4646.58 722.26 15.54 21.29 1059.51 4977.31 4207 8
9 5653 6996.63 1516.51 21.67 29.87 2135.08 7148.65 5653 9
10 5653 7256.24 1391.95 19.18 26.16 1896.79 7251.38 5653 10
11 5653 6882.99 1480.34 21.51 24.56 1712.38 6972.7 5653 11
12 1770 2562.01 691.43 26.99 20.85 1427.19 6844 5653 12
13 5653 7574.06 1803.12 23.81 24.64 1667.2 6767.01 5653 13
14 5653 7428.1 1876.23 25.26 25.32 1676.82 6622.27 5653 14
15 4346 5508.79 1175.33 21.34 18.67 1446.43 7745.41 5653 15
16 1928 1627.1 259.79 15.97 0 0 0 0 16
17 0 0 0 0 17.12 450.42 2631.02 2867 17
18 3077 2838.08 366.22 12.9 31.6 483.32 1529.55 1478 18
19 1754 1767.16 502.31 28.42 17.63 285.11 1617.43 1635 19
20 1927 1747.44 461.01 26.38 0 0 0 0 20
21 1325 1668.23 350.91 21.03 0 0 0 0 21
22 3902 4726.28 1212.44 25.65 0 0 0 0 22
3861.
2 4584.105 933.34727
3 19.59045
5 17.26409
1 965.2922
7 4513.451 3857.
8
WON LOST WON LOST WON LOST

Time motion analysis of International rugby Appendix A
47
0
1000
2000
3000
4000
5000
6000
7000
8000
1 3 5 7 9 11 13 15 17 19 21
DISTANCE TEAM A
0
1000
2000
3000
4000
5000
6000
7000
8000
9000
1 3 5 7 9 11 13 15 17 19 21
DISTANCE TEAM B
0
200
400
600
800
1000
1200
1400
1600
1800
2000
1 3 5 7 9 11 13 15 17 19 21
HI DISTANCE TEAM B
0
200
400
600
800
1000
1200
1400
1600
1800
2000
1 3 5 7 9 11 13 15 17 19 21
HI DISTANCE TEAM A

Time motion analysis of International rugby Appendix A
48
MATCH 16 Winning Team Losing Team
No Time Distance HI Distance
% WR @ HI
% WR @ HI
HI Distance Distance Time No
Props 1 4671 5580.83 1314.57 23.56 13.9 878.58 6322.28 5653 1
3 5653 5638.61 536.96 9.52 10.35 354.52 3425.02 2801 3
5162 5609.72 925.765 16.54 12.125 616.55 4873.65 4227
Locks 4 2576 3175.22 512.3 16.13 18.75 1183.61 6312.17 5653 4
5 5653 6056.33 776.27 12.82 23.13 1184.37 5120.57 4047 5
4114.5 4615.775 644.285 14.475 20.94 1183.99 5716.37 4850
2 4762 5436.42 1137.8 20.93 12.52 702.53 5610.08 5653 2
Loosies 6 3934 5200.9 1260.82 24.24 22.92 1411.09 6157.64 5653 6
7 5653 6532.3 1185.07 18.14 20.53 1281.48 6241.44 5653 7
8 3751 4646.58 722.26 15.54 21.29 1059.51 4977.31 4207 8
4525 5454.05 1076.4875 19.7125 21.58 1250.69333 5792.13 5171
In Backs 9 5653 6996.63 1516.51 21.67 29.87 2135.08 7148.65 5653 9
10 5653 7256.24 1391.95 19.18 26.16 1896.79 7251.38 5653 10
12 1770 2562.01 691.43 26.99 20.85 1427.19 6844 5653 12
13 5653 7574.06 1803.12 23.81 24.64 1667.2 6767.01 5653 13
4682.3 6097.235 1350.7525 22.9125 25.38 1781.565 7002.76 5653
Out Backs 11 5653 6882.99 1480.34 21.51 24.56 1712.38 6972.7 5653 11
14 5653 7428.1 1876.23 25.26 25.32 1676.82 6622.27 5653 14
15 4346 5508.79 1175.33 21.34 18.67 1446.43 7745.41 5653 15
5217.3 6606.627 1510.63333 22.7033333 22.85 1611.87667 7113.46 5653

Time motion analysis of International rugby Appendix A
49
MATCH 17 TEAM
A Score 33 3 Score TEAM B
No Time Distance HI Distance % WR @
HI % WR @
HI HI
Distance Distance Time No
1 5340 6334.36 1348.53 21.29 13.09 804.83 6146.24 5340 1
2 4249 5241.6 1203.67 22.96 15.25 952.15 6244.72 5340 2
3 4508 4533.61 456 10.06 10.15 355.07 3497.95 3142 3
4 3822 4654.31 970.96 20.86 23.89 785.44 3288.36 2496 4
5 5340 6312.99 1099.89 17.42 9.95 565.45 5683.1 4978 5
6 5340 6874.45 1938.02 28.19 29.77 2113.57 7100.1 5340 6
7 2234 2900.94 710.28 24.48 19.33 1221.59 6320.35 5340 7
8 3825 4558.93 742.14 16.28 26.27 1239.45 4718.84 3637 8
9 5340 7546.09 1907.87 25.28 38.96 3063.21 7863.23 5340 9
10 5340 7505.19 1516.05 20.2 23.12 1011.84 4375.54 3218 10
11 4191 5395.99 1211.69 22.46 21.7 1196.13 5511.11 4552 11
12 5340 7556.88 1916.72 25.36 27.33 2145.01 7849.93 5340 12
13 5340 7839.91 1886.79 24.07 27.12 2003.54 7387.63 5340 13
14 5340 7615.56 1828.09 24 27.76 1565.72 5640.7 4430 14
15 4730 6650.82 1272.7 19.14 24.28 1894.06 7800.1 5340 15
16 1132 1488.28 476.7 32.03 0 0 0 0 16
17 0 0 0 0 7.51 188.93 2516.84 2244 17
18 1544 1891.75 376.54 19.9 38.38 568.07 1479.96 983 18
19 1544 1947.11 406.38 20.87 22.97 916.34 3988.78 3267 19
20 3112 3877.71 902.71 23.28 28.44 842.94 2963.84 2155 20
21 638 911.98 284.21 31.16 0 0 0 0 21
22 1164 1647.81 458.06 27.8 28.13 459.98 1634.91 929 22
3609.7 4694.83 1041.54545 21.685909 21.0636364 1086.06 4636.92 3579.6 WON LOST WON LOST WON LOST

Time motion analysis of International rugby Appendix A
50
0
1000
2000
3000
4000
5000
6000
7000
8000
9000
1 3 5 7 9 11 13 15 17 19 21
DISTANCE TEAM A
0
1000
2000
3000
4000
5000
6000
7000
8000
9000
1 3 5 7 9 11 13 15 17 19 21
DISTANCE TEAM B
0
200
400
600
800
1000
1200
1400
1600
1800
2000
1 3 5 7 9 11 13 15 17 19 21
HI DISTANCE TEAM B
0
200
400
600
800
1000
1200
1400
1600
1800
2000
1 3 5 7 9 11 13 15 17 19 21
HI DISTANCE TEAM A
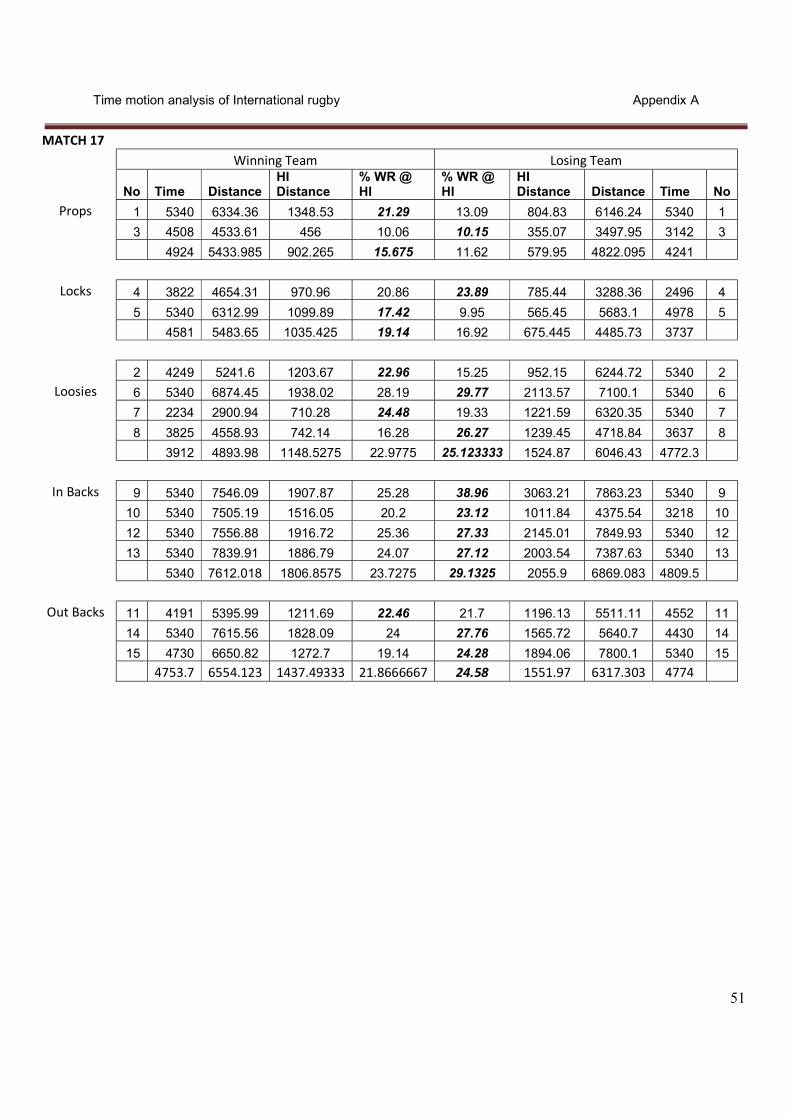
Time motion analysis of International rugby Appendix A
51
MATCH 17 Winning Team Losing Team
No Time Distance HI Distance
% WR @ HI
% WR @ HI
HI Distance Distance Time No
Props 1 5340 6334.36 1348.53 21.29 13.09 804.83 6146.24 5340 1
3 4508 4533.61 456 10.06 10.15 355.07 3497.95 3142 3
4924 5433.985 902.265 15.675 11.62 579.95 4822.095 4241
Locks 4 3822 4654.31 970.96 20.86 23.89 785.44 3288.36 2496 4
5 5340 6312.99 1099.89 17.42 9.95 565.45 5683.1 4978 5
4581 5483.65 1035.425 19.14 16.92 675.445 4485.73 3737
2 4249 5241.6 1203.67 22.96 15.25 952.15 6244.72 5340 2
Loosies 6 5340 6874.45 1938.02 28.19 29.77 2113.57 7100.1 5340 6
7 2234 2900.94 710.28 24.48 19.33 1221.59 6320.35 5340 7
8 3825 4558.93 742.14 16.28 26.27 1239.45 4718.84 3637 8
3912 4893.98 1148.5275 22.9775 25.123333 1524.87 6046.43 4772.3
In Backs 9 5340 7546.09 1907.87 25.28 38.96 3063.21 7863.23 5340 9
10 5340 7505.19 1516.05 20.2 23.12 1011.84 4375.54 3218 10
12 5340 7556.88 1916.72 25.36 27.33 2145.01 7849.93 5340 12
13 5340 7839.91 1886.79 24.07 27.12 2003.54 7387.63 5340 13
5340 7612.018 1806.8575 23.7275 29.1325 2055.9 6869.083 4809.5
Out Backs 11 4191 5395.99 1211.69 22.46 21.7 1196.13 5511.11 4552 11
14 5340 7615.56 1828.09 24 27.76 1565.72 5640.7 4430 14
15 4730 6650.82 1272.7 19.14 24.28 1894.06 7800.1 5340 15
4753.7 6554.123 1437.49333 21.8666667 24.58 1551.97 6317.303 4774
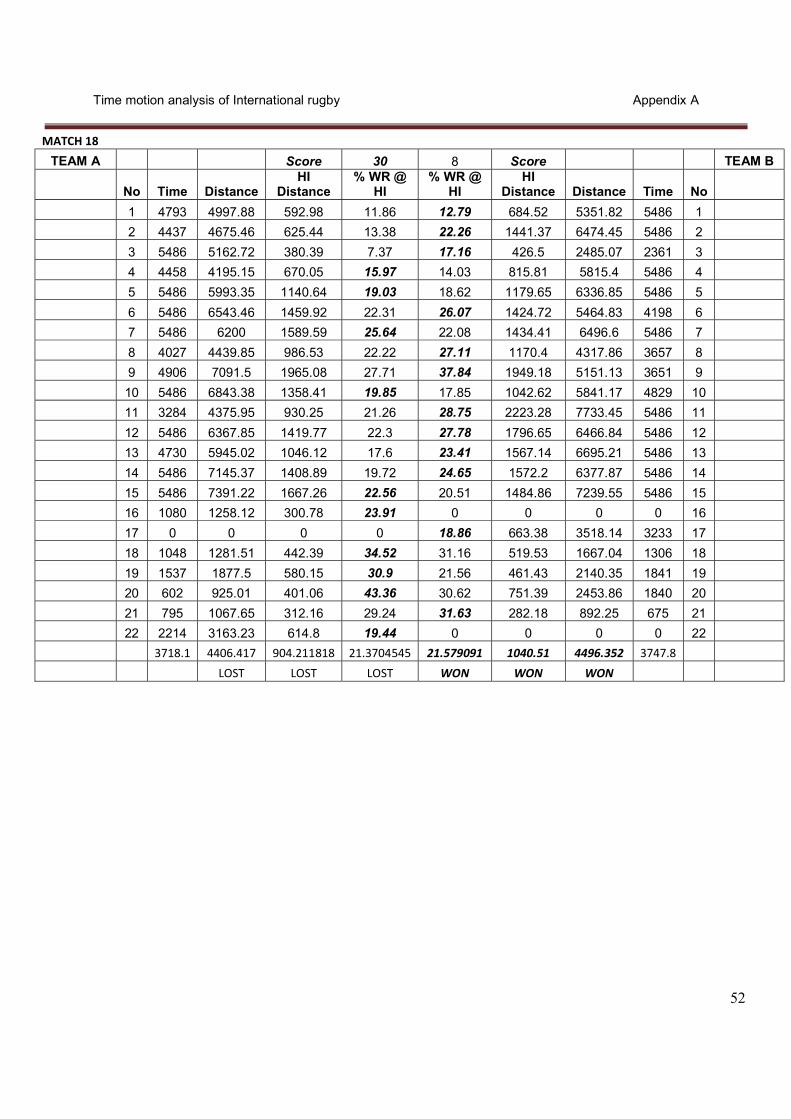
Time motion analysis of International rugby Appendix A
52
MATCH 18
TEAM A Score 30 8 Score TEAM B
No Time Distance HI
Distance % WR @
HI % WR @
HI HI
Distance Distance Time No
1 4793 4997.88 592.98 11.86 12.79 684.52 5351.82 5486 1
2 4437 4675.46 625.44 13.38 22.26 1441.37 6474.45 5486 2
3 5486 5162.72 380.39 7.37 17.16 426.5 2485.07 2361 3
4 4458 4195.15 670.05 15.97 14.03 815.81 5815.4 5486 4
5 5486 5993.35 1140.64 19.03 18.62 1179.65 6336.85 5486 5
6 5486 6543.46 1459.92 22.31 26.07 1424.72 5464.83 4198 6
7 5486 6200 1589.59 25.64 22.08 1434.41 6496.6 5486 7
8 4027 4439.85 986.53 22.22 27.11 1170.4 4317.86 3657 8
9 4906 7091.5 1965.08 27.71 37.84 1949.18 5151.13 3651 9
10 5486 6843.38 1358.41 19.85 17.85 1042.62 5841.17 4829 10
11 3284 4375.95 930.25 21.26 28.75 2223.28 7733.45 5486 11
12 5486 6367.85 1419.77 22.3 27.78 1796.65 6466.84 5486 12
13 4730 5945.02 1046.12 17.6 23.41 1567.14 6695.21 5486 13
14 5486 7145.37 1408.89 19.72 24.65 1572.2 6377.87 5486 14
15 5486 7391.22 1667.26 22.56 20.51 1484.86 7239.55 5486 15
16 1080 1258.12 300.78 23.91 0 0 0 0 16
17 0 0 0 0 18.86 663.38 3518.14 3233 17
18 1048 1281.51 442.39 34.52 31.16 519.53 1667.04 1306 18
19 1537 1877.5 580.15 30.9 21.56 461.43 2140.35 1841 19
20 602 925.01 401.06 43.36 30.62 751.39 2453.86 1840 20
21 795 1067.65 312.16 29.24 31.63 282.18 892.25 675 21
22 2214 3163.23 614.8 19.44 0 0 0 0 22
3718.1 4406.417 904.211818 21.3704545 21.579091 1040.51 4496.352 3747.8
LOST LOST LOST WON WON WON

Time motion analysis of International rugby Appendix A
53
0
1000
2000
3000
4000
5000
6000
7000
8000
1 3 5 7 9 11 13 15 17 19 21
DISTANCE TEAM A
0
1000
2000
3000
4000
5000
6000
7000
8000
9000
1 3 5 7 9 11 13 15 17 19 21
DISTANCE TEAM B
0
200
400
600
800
1000
1200
1400
1600
1800
2000
1 3 5 7 9 11 13 15 17 19 21
HI DISTANCE TEAM B
0
200
400
600
800
1000
1200
1400
1600
1800
2000
1 3 5 7 9 11 13 15 17 19 21
HI DISTANCE TEAM A

Time motion analysis of International rugby Appendix A
54
MATCH 18 Winning Team Losing Team
No Time Distance HI Distance
% WR @ HI
% WR @ HI
HI Distance Distance Time No
Props 1 4793 4997.88 592.98 11.86 12.79 684.52 5351.82 5486 1
3 5486 5162.72 380.39 7.37 17.16 426.5 2485.07 2361 3
5139.5 5080.3 486.685 9.615 14.975 555.51 3918.445 3923.5
Locks 4 4458 4195.15 670.05 15.97 14.03 815.81 5815.4 5486 4
5 5486 5993.35 1140.64 19.03 18.62 1179.65 6336.85 5486 5
4972 5094.25 905.345 17.5 16.325 997.73 6076.125 5486
2 4437 4675.46 625.44 13.38 22.26 1441.37 6474.45 5486 2
Loosies 6 5486 6543.46 1459.92 22.31 26.07 1424.72 5464.83 4198 6
7 5486 6200 1589.59 25.64 22.08 1434.41 6496.6 5486 7
8 4027 4439.85 986.53 22.22 27.11 1170.4 4317.86 3657 8
4859 5464.693 1165.37 20.8875 25.086667 1343.17667 5426.43 4447
In Backs 9 4906 7091.5 1965.08 27.71 37.84 1949.18 5151.13 3651 9
10 5486 6843.38 1358.41 19.85 17.85 1042.62 5841.17 4829 10
12 5486 6367.85 1419.77 22.3 27.78 1796.65 6466.84 5486 12
13 4730 5945.02 1046.12 17.6 23.41 1567.14 6695.21 5486 13
5152 6561.938 1447.345 21.865 26.72 1588.8975 6038.588 4863
Out Backs 11 3284 4375.95 930.25 21.26 28.75 2223.28 7733.45 5486 11
14 5486 7145.37 1408.89 19.72 24.65 1572.2 6377.87 5486 14
15 5486 7391.22 1667.26 22.56 20.51 1484.86 7239.55 5486 15
4752 6304.18 1335.46667 21.18 24.636667 1760.11333 7116.957 5486
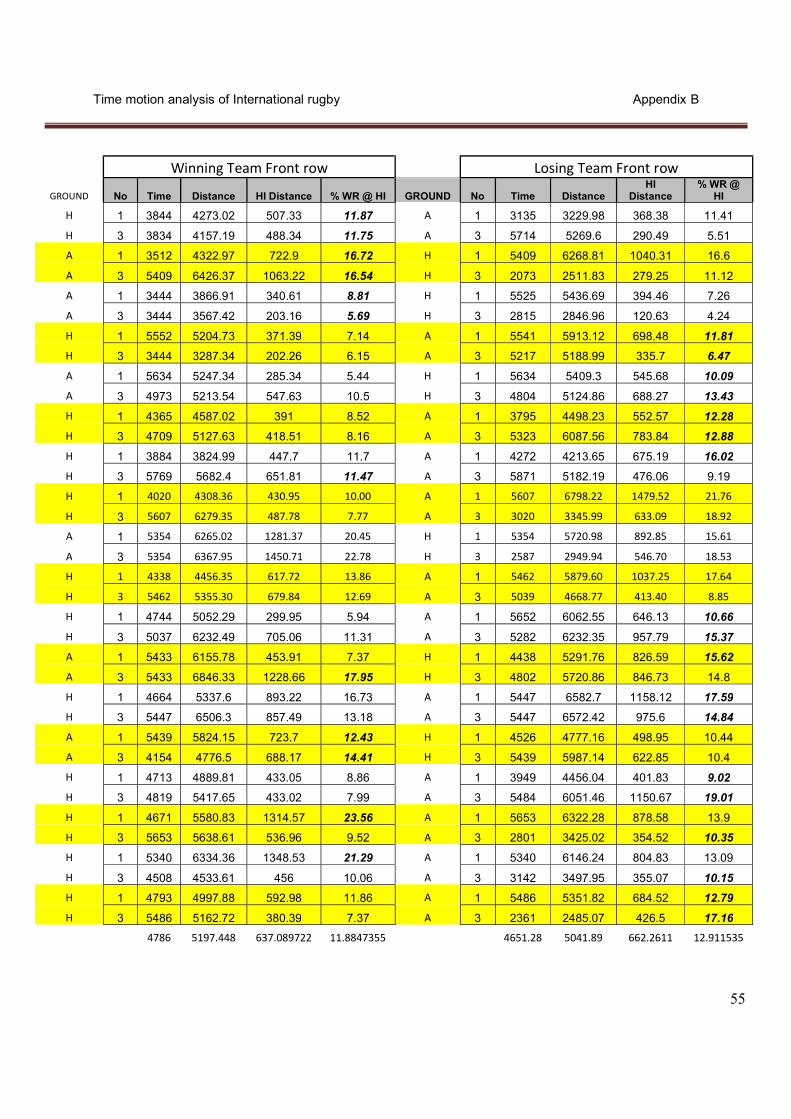
Time motion analysis of International rugby Appendix B
55
Winning Team Front row Losing Team Front row
GROUND No Time Distance HI Distance % WR @ HI GROUND No Time Distance HI
Distance % WR @
HI
H 1 3844 4273.02 507.33 11.87 A 1 3135 3229.98 368.38 11.41
H 3 3834 4157.19 488.34 11.75 A 3 5714 5269.6 290.49 5.51
A 1 3512 4322.97 722.9 16.72 H 1 5409 6268.81 1040.31 16.6
A 3 5409 6426.37 1063.22 16.54 H 3 2073 2511.83 279.25 11.12
A 1 3444 3866.91 340.61 8.81 H 1 5525 5436.69 394.46 7.26
A 3 3444 3567.42 203.16 5.69 H 3 2815 2846.96 120.63 4.24
H 1 5552 5204.73 371.39 7.14 A 1 5541 5913.12 698.48 11.81
H 3 3444 3287.34 202.26 6.15 A 3 5217 5188.99 335.7 6.47
A 1 5634 5247.34 285.34 5.44 H 1 5634 5409.3 545.68 10.09
A 3 4973 5213.54 547.63 10.5 H 3 4804 5124.86 688.27 13.43
H 1 4365 4587.02 391 8.52 A 1 3795 4498.23 552.57 12.28
H 3 4709 5127.63 418.51 8.16 A 3 5323 6087.56 783.84 12.88
H 1 3884 3824.99 447.7 11.7 A 1 4272 4213.65 675.19 16.02
H 3 5769 5682.4 651.81 11.47 A 3 5871 5182.19 476.06 9.19
H 1 4020 4308.36 430.95 10.00 A 1 5607 6798.22 1479.52 21.76
H 3 5607 6279.35 487.78 7.77 A 3 3020 3345.99 633.09 18.92
A 1 5354 6265.02 1281.37 20.45 H 1 5354 5720.98 892.85 15.61
A 3 5354 6367.95 1450.71 22.78 H 3 2587 2949.94 546.70 18.53
H 1 4338 4456.35 617.72 13.86 A 1 5462 5879.60 1037.25 17.64
H 3 5462 5355.30 679.84 12.69 A 3 5039 4668.77 413.40 8.85
H 1 4744 5052.29 299.95 5.94 A 1 5652 6062.55 646.13 10.66
H 3 5037 6232.49 705.06 11.31 A 3 5282 6232.35 957.79 15.37
A 1 5433 6155.78 453.91 7.37 H 1 4438 5291.76 826.59 15.62
A 3 5433 6846.33 1228.66 17.95 H 3 4802 5720.86 846.73 14.8
H 1 4664 5337.6 893.22 16.73 A 1 5447 6582.7 1158.12 17.59
H 3 5447 6506.3 857.49 13.18 A 3 5447 6572.42 975.6 14.84
A 1 5439 5824.15 723.7 12.43 H 1 4526 4777.16 498.95 10.44
A 3 4154 4776.5 688.17 14.41 H 3 5439 5987.14 622.85 10.4
H 1 4713 4889.81 433.05 8.86 A 1 3949 4456.04 401.83 9.02
H 3 4819 5417.65 433.02 7.99 A 3 5484 6051.46 1150.67 19.01
H 1 4671 5580.83 1314.57 23.56 A 1 5653 6322.28 878.58 13.9
H 3 5653 5638.61 536.96 9.52 A 3 2801 3425.02 354.52 10.35
H 1 5340 6334.36 1348.53 21.29 A 1 5340 6146.24 804.83 13.09
H 3 4508 4533.61 456 10.06 A 3 3142 3497.95 355.07 10.15
H 1 4793 4997.88 592.98 11.86 A 1 5486 5351.82 684.52 12.79
H 3 5486 5162.72 380.39 7.37 A 3 2361 2485.07 426.5 17.16
4786 5197.448 637.089722 11.8847355 4651.28 5041.89 662.2611 12.911535

Time motion analysis of International rugby Appendix B
56
Winning Team Locks Losing Team Locks
GROUND No Time
Distance
HI Distance
% WR @ HI
GROUND
No Time
Distance
HI Distance
% WR @ HI
H 4 5041 5508.23 951.96 17.28 A 4 3129 2980.66 358.93 12.04
H 5 5232 6025.7 1095.27 18.18 A 5 5714 6209.54 919.72 14.81
A 4 4819 6331.32 1221.59 19.29 H 4 5409 6539.55 1111.47 17
A 5 5409 6129.64 1033.72 16.86 H 5 5409 6719.57 1136.28 16.91
A 4 4701 4961.78 487.36 9.82 H 4 4695 5005.09 407.53 8.14
A 5 5525 5937.06 844.12 14.22 H 5 3367 3853.06 346.56 8.99
H 4 4063 4251.23 500.53 11.77 A 4 4647 4799.79 782.45 16.3
H 5 5552 5943.5 837.9 14.1 A 5 3150 3442.09 782.8 22.74
A 4 5634 5865.34 798.08 13.61 H 4 5317 5786.32 798.43 13.8
A 5 3524 4030.67 873.79 21.68 H 5 5634 6423.22 1157.93 18.03
H 4 4152 4652.12 698.73 15.02 A 4 4764 6248.47 1992.59 31.89
H 5 5313 6182.89 1079.93 17.47 A 5 4092 4657.71 816.07 17.52
H 4 4346 4176.41 771.2 18.47 A 4 4131 3718.4 584.13 15.71
H 5 5871 5442.16 577.88 10.62 A 5 5871 5923.32 902.39 15.23
H 4 5607 6800.82 1158.39 17.03 A 4 5607 6594.22 992.13 15.05
H 5 5001 6224.29 1173.72 18.86 A 5 4241 5056.04 626.46 12.39
A 4 4024 4783.24 823.14 17.21 H 4 5354 6289.74 1186.13 18.86
A 5 5354 6293.26 1326.07 21.07 H 5 5354 6101.06 1248.55 20.46
H 4 5462 6098.22 1342.04 22.01 A 4 5462 5302.35 749.65 14.14
H 5 5462 5592.38 817.11 14.61 A 5 5462 6096.96 1118.72 18.35
H 4 4187 4755.31 659.85 13.88 A 4 5652 6035.68 796.14 13.19
H 5 5652 6534.74 1103.89 16.89 A 5 5652 6563.98 1361.77 20.75
A 4 5433 6581.25 1499.94 22.79 H 4 4609 5085.71 777.25 15.28
A 5 3060 3670.38 548.17 14.93 H 5 5433 6549.4 1153.6 17.61
H 4 3307 4025.22 931.61 23.14 A 4 4755 5655.29 777.25 13.74
H 5 5447 6352.44 1189.37 18.72 A 5 5447 6911.66 1398.97 20.24
A 4 4684 5625.14 18.54 18.54 H 4 3379 3884.37 855.84 22.03
A 5 5439 5697.66 13.49 13.49 H 5 3877 4041.8 576.92 14.27
H 4 5484 6080.46 1052.25 17.31 A 4 4542 5279.61 939.45 17.79
H 5 4043 4456.24 538.83 12.09 A 5 5484 6024.38 860.99 14.29
H 4 2576 3175.22 512.3 16.13 A 4 5653 6312.17 1183.61 18.75
H 5 5653 6056.33 776.27 12.82 A 5 4047 5120.57 1184.37 23.13
H 4 3822 4654.31 970.96 20.86 A 4 2496 3288.36 785.44 23.89
H 5 5340 6312.99 1099.89 17.42 A 5 4978 5683.1 565.45 9.95
H 4 4458 4195.15 670.05 15.97 A 4 5486 5815.4 815.81 14.03
H 5 5486 5993.35 1140.64 19.03 A 5 5486 6336.85 1179.65 18.62
4837.8 5427.679 864.960555 16.7552311 4827.3 5453.763 923.095277 16.8310982
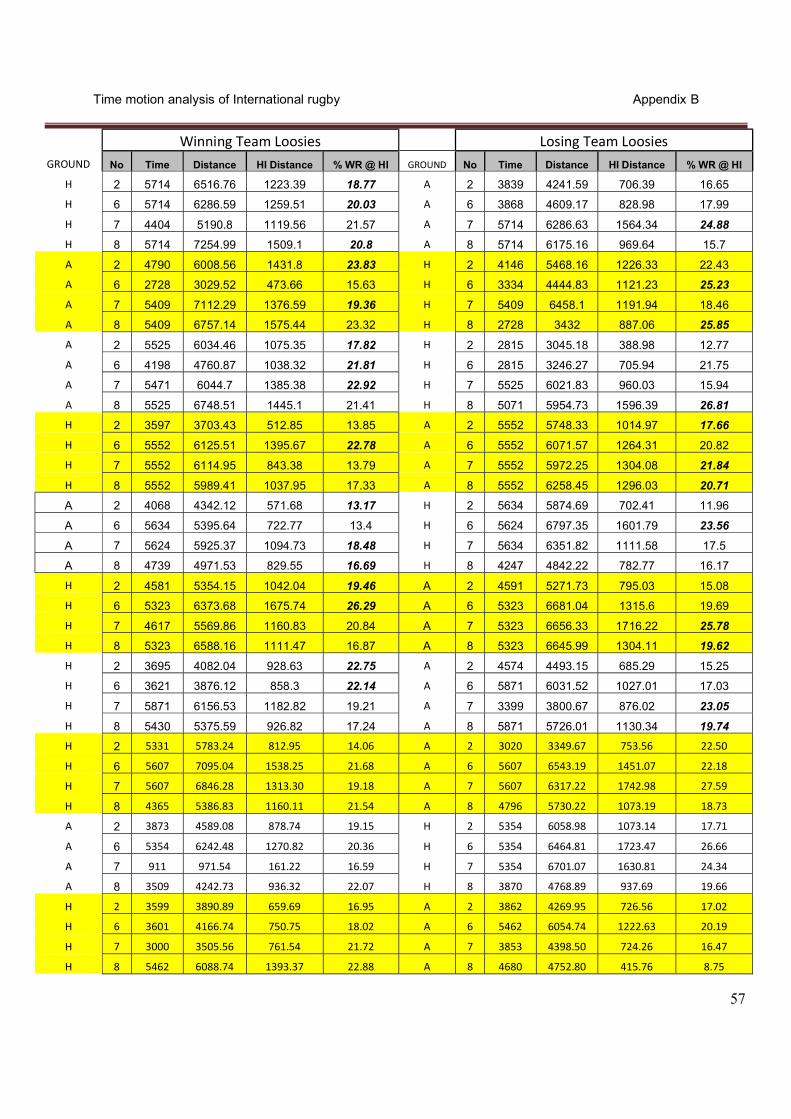
Time motion analysis of International rugby Appendix B
57
Winning Team Loosies Losing Team Loosies GROUND No Time Distance HI Distance % WR @ HI GROUND No Time Distance HI Distance % WR @ HI
H 2 5714 6516.76 1223.39 18.77 A 2 3839 4241.59 706.39 16.65
H 6 5714 6286.59 1259.51 20.03 A 6 3868 4609.17 828.98 17.99
H 7 4404 5190.8 1119.56 21.57 A 7 5714 6286.63 1564.34 24.88
H 8 5714 7254.99 1509.1 20.8 A 8 5714 6175.16 969.64 15.7
A 2 4790 6008.56 1431.8 23.83 H 2 4146 5468.16 1226.33 22.43
A 6 2728 3029.52 473.66 15.63 H 6 3334 4444.83 1121.23 25.23
A 7 5409 7112.29 1376.59 19.36 H 7 5409 6458.1 1191.94 18.46
A 8 5409 6757.14 1575.44 23.32 H 8 2728 3432 887.06 25.85
A 2 5525 6034.46 1075.35 17.82 H 2 2815 3045.18 388.98 12.77
A 6 4198 4760.87 1038.32 21.81 H 6 2815 3246.27 705.94 21.75
A 7 5471 6044.7 1385.38 22.92 H 7 5525 6021.83 960.03 15.94
A 8 5525 6748.51 1445.1 21.41 H 8 5071 5954.73 1596.39 26.81
H 2 3597 3703.43 512.85 13.85 A 2 5552 5748.33 1014.97 17.66
H 6 5552 6125.51 1395.67 22.78 A 6 5552 6071.57 1264.31 20.82
H 7 5552 6114.95 843.38 13.79 A 7 5552 5972.25 1304.08 21.84
H 8 5552 5989.41 1037.95 17.33 A 8 5552 6258.45 1296.03 20.71
A 2 4068 4342.12 571.68 13.17 H 2 5634 5874.69 702.41 11.96
A 6 5634 5395.64 722.77 13.4 H 6 5624 6797.35 1601.79 23.56
A 7 5624 5925.37 1094.73 18.48 H 7 5634 6351.82 1111.58 17.5
A 8 4739 4971.53 829.55 16.69 H 8 4247 4842.22 782.77 16.17
H 2 4581 5354.15 1042.04 19.46 A 2 4591 5271.73 795.03 15.08
H 6 5323 6373.68 1675.74 26.29 A 6 5323 6681.04 1315.6 19.69
H 7 4617 5569.86 1160.83 20.84 A 7 5323 6656.33 1716.22 25.78
H 8 5323 6588.16 1111.47 16.87 A 8 5323 6645.99 1304.11 19.62
H 2 3695 4082.04 928.63 22.75 A 2 4574 4493.15 685.29 15.25
H 6 3621 3876.12 858.3 22.14 A 6 5871 6031.52 1027.01 17.03
H 7 5871 6156.53 1182.82 19.21 A 7 3399 3800.67 876.02 23.05
H 8 5430 5375.59 926.82 17.24 A 8 5871 5726.01 1130.34 19.74
H 2 5331 5783.24 812.95 14.06 A 2 3020 3349.67 753.56 22.50
H 6 5607 7095.04 1538.25 21.68 A 6 5607 6543.19 1451.07 22.18
H 7 5607 6846.28 1313.30 19.18 A 7 5607 6317.22 1742.98 27.59
H 8 4365 5386.83 1160.11 21.54 A 8 4796 5730.22 1073.19 18.73
A 2 3873 4589.08 878.74 19.15 H 2 5354 6058.98 1073.14 17.71
A 6 5354 6242.48 1270.82 20.36 H 6 5354 6464.81 1723.47 26.66
A 7 911 971.54 161.22 16.59 H 7 5354 6701.07 1630.81 24.34
A 8 3509 4242.73 936.32 22.07 H 8 3870 4768.89 937.69 19.66
H 2 3599 3890.89 659.69 16.95 A 2 3862 4269.95 726.56 17.02
H 6 3601 4166.74 750.75 18.02 A 6 5462 6054.74 1222.63 20.19
H 7 3000 3505.56 761.54 21.72 A 7 3853 4398.50 724.26 16.47
H 8 5462 6088.74 1393.37 22.88 A 8 4680 4752.80 415.76 8.75

Time motion analysis of International rugby Appendix B
58
H 2 702 807.73 193.54 23.96 A 2 4175 4842.59 654.29 13.51
H 6 5652 6060.06 1424.83 23.51 A 6 3824 4439.39 888.57 20.02
H 7 3589 4410.01 897.77 20.36 A 7 3834 5093.5 1169.77 22.97
H 8 5003 5902.78 988.54 16.75 A 8 5521 6445.15 1710.06 26.53
A 2 3580 4343.01 713.5 16.43 H 2 5433 6723.8 1239.63 18.44
A 6 5433 6383.34 1154.57 18.09 H 6 5433 6261.46 1702.01 27.18
A 7 5433 6993.68 1726.4 24.69 H 7 5433 6589.4 1583.5 24.03
A 8 5433 6288.64 1311.07 20.85 H 8 3713 4639.53 932.74 20.1
H 2 4348 5477.83 1193.16 21.78 A 2 2083 2600.44 594.27 22.85
H 6 4667 5914.78 1821.99 30.8 A 6 5447 6271.11 950.42 15.16
H 7 5447 6447.69 1241.61 19.26 A 7 5447 6786.24 1697.46 25.01
H 8 4354 5148.67 823.43 15.99 A 8 4203 4904.76 966.72 19.71
A 2 4154 4788.93 1063.54 22.21 H 2 3663 4258.53 1020.17 23.96
A 6 3607 3980.4 545.75 13.71 H 6 3020 3647.19 830.52 22.77
A 7 5439 6827.06 1396.99 20.46 H 7 5439 6234.56 922.23 14.79
A 8 5439 6102.28 1120.25 18.36 H 8 5439 6514.55 1655.56 25.41
H 2 4044 4571.7 793.73 17.36 A 2 5484 6402.25 1172.47 18.31
H 6 4393 5229.04 1085.02 20.75 A 6 4260 4933.38 1000.37 20.28
H 7 5484 6217.62 939.66 15.11 A 7 3951 4654.59 1062.65 22.83
H 8 4678 5116.19 605.02 11.83 A 8 5484 6129.98 1039.56 16.96
H 2 4762 5436.42 1137.8 20.93 A 2 5653 5610.08 702.53 12.52
H 6 3934 5200.9 1260.82 24.24 A 6 5653 6157.64 1411.09 22.92
H 7 5653 6532.3 1185.07 18.14 A 7 5653 6241.44 1281.48 20.53
H 8 3751 4646.58 722.26 15.54 A 8 4207 4977.31 1059.51 21.29
H 2 4249 5241.6 1203.67 22.96 A 2 5340 6244.72 952.15 15.25
H 6 5340 6874.45 1938.02 28.19 A 6 5340 7100.1 2113.57 29.77
H 7 2234 2900.94 710.28 24.48 A 7 5340 6320.35 1221.59 19.33
H 8 3825 4558.93 742.14 16.28 A 8 3637 4718.84 1239.45 26.27
H 2 4437 4675.46 625.44 13.38 A 2 5486 6474.45 1441.37 22.26
H 6 5486 6543.46 1459.92 22.31 A 6 4198 5464.83 1424.72 26.07
H 7 5486 6200 1589.59 25.64 A 7 5486 6496.6 1434.41 22.08
H 8 4027 4439.85 986.53 22.22 A 8 3657 4317.86 1170.4 27.11
4634.1 5371.677 1070.102778 19.7547189 4754.9 5507.131 1136.044028 20.52683849

Time motion analysis of International rugby Appendix B
59
Winning Team Inside Backs Losing Team Inside Backs GROUND No Time Distance HI Distance % WR @ HI GROUND No Time Distance HI Distance % WR @ HI
H 9 5178 6653.44 1218.74 18.32 A 9 4169 5391.27 1478.91 27.43
H 10 4777 6375.5 1395.47 21.89 A 10 4825 5499.69 1142.3 20.77
H 12 5666 7264.39 1926.94 26.53 A 12 5714 6162.25 1189.96 19.31
H 13 5714 6942 1346.31 19.39 A 13 5714 7413.63 1830.47 24.69
A 9 4288 6236.88 1897.81 30.43 H 9 3621 4801.51 1179.76 24.57
A 10 5409 7146.89 1667.38 23.33 H 10 5409 6562.55 1360.56 20.73
A 12 5409 6784.47 1414.07 20.84 H 12 5409 6641.48 1610.02 24.24
A 13 5409 7212.01 1579.28 21.9 H 13 4298 6278.35 1567.27 24.96
A 9 5016 6077.08 1235.37 20.33 H 9 4265 5190.9 1261.76 24.31
A 10 4838 6278.55 1591.34 25.35 H 10 5525 6211.66 1097.83 17.67
A 12 5525 6391.58 1284.25 20.09 H 12 4708 6092.52 1589.31 26.09
A 13 5525 6134.04 1205.63 19.65 H 13 5525 6552.84 1571 23.97
H 9 4210 5725.98 1864.15 32.56 A 9 5216 6484 1766.2 27.24
H 10 5552 6745.05 1700.79 25.22 A 10 5552 6771.53 1585.71 23.42
H 12 5552 7069.82 1772.96 25.08 A 12 5552 5924.33 1182 19.95
H 13 5552 7609.84 2271.08 29.84 A 13 5552 6688.92 1350.61 20.19
A 9 4079 5462.78 1230.87 22.53 H 9 3912 4878 1310.82 26.87
A 10 3507 4307.27 783.71 18.2 H 10 5634 7405.68 1996.59 26.96
A 12 5634 7455.79 1728.98 23.19 H 12 5634 6192.38 1551.96 25.06
A 13 5634 6938.54 1450.45 20.9 H 13 4905 6553.32 1554.68 23.72
H 9 4586 6193.61 1461.1 23.59 A 9 3585 5546.25 1505.21 27.14
H 10 5323 6827.84 1182.79 17.32 A 10 5323 7764.35 2224.19 28.65
H 12 5323 6346.55 1290.86 20.34 A 12 5323 7570.92 1594.48 21.06
H 13 5323 6734.01 1622.24 24.09 A 13 5323 7953.7 1795.62 22.58
H 9 3089 3778.89 1035.6 27.4 A 9 3964 4630.17 1237.09 26.72
H 10 5871 7501.09 1950.31 26 A 10 5871 6485.72 1209.2 18.64
H 12 4147 4608.05 857.35 18.61 A 12 4402 4547.32 936.09 20.59
H 13 5871 7851.62 1864.63 23.75 A 13 5871 6661.2 1606.37 24.12
H 9 4368 6054.16 1440.57 23.79 A 9 5070 6822.59 1214.19 17.80
H 10 5607 8813.97 2195.01 24.90 A 10 4546 6734.51 1571.82 23.34
H 12 3923 5006.37 1106.60 22.10 A 12 5607 7928.73 1983.32 25.01
H 13 5607 7840.98 1877.21 23.94 A 13 5607 7974.51 1920.44 24.08
A 9 5354 7109.00 1355.11 19.06 H 9 4006 5657.54 1185.73 20.96
A 10 5027 6167.20 903.61 14.65 H 10 5354 8151.52 2011.80 24.68
A 12 5354 7842.72 2182.07 27.82 H 12 5354 6897.09 1938.18 28.10
A 13 5354 7082.78 1846.21 26.07 H 13 5354 7636.11 2091.07 27.38
H 9 3266 4550.66 1244.74 27.35 A 9 5145 6301.09 1321.58 20.97
H 10 5470 7263.99 1471.63 20.26 A 10 3284 3944.20 399.64 10.13
H 12 5462 6676.40 1237.00 18.53 A 12 5064 6101.42 1418.09 23.24
H 13 5462 6969.70 1890.34 27.12 A 13 5462 6303.41 1117.80 17.73
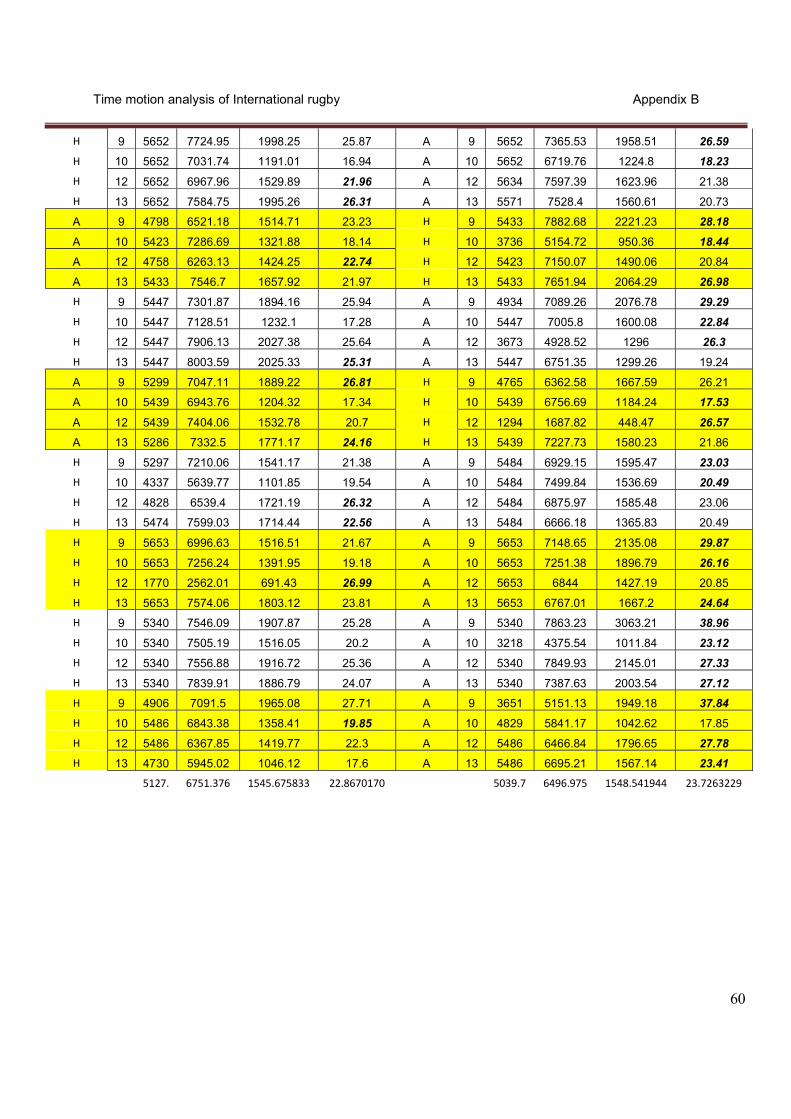
Time motion analysis of International rugby Appendix B
60
H 9 5652 7724.95 1998.25 25.87 A 9 5652 7365.53 1958.51 26.59
H 10 5652 7031.74 1191.01 16.94 A 10 5652 6719.76 1224.8 18.23
H 12 5652 6967.96 1529.89 21.96 A 12 5634 7597.39 1623.96 21.38
H 13 5652 7584.75 1995.26 26.31 A 13 5571 7528.4 1560.61 20.73
A 9 4798 6521.18 1514.71 23.23 H 9 5433 7882.68 2221.23 28.18
A 10 5423 7286.69 1321.88 18.14 H 10 3736 5154.72 950.36 18.44
A 12 4758 6263.13 1424.25 22.74 H 12 5423 7150.07 1490.06 20.84
A 13 5433 7546.7 1657.92 21.97 H 13 5433 7651.94 2064.29 26.98
H 9 5447 7301.87 1894.16 25.94 A 9 4934 7089.26 2076.78 29.29
H 10 5447 7128.51 1232.1 17.28 A 10 5447 7005.8 1600.08 22.84
H 12 5447 7906.13 2027.38 25.64 A 12 3673 4928.52 1296 26.3
H 13 5447 8003.59 2025.33 25.31 A 13 5447 6751.35 1299.26 19.24
A 9 5299 7047.11 1889.22 26.81 H 9 4765 6362.58 1667.59 26.21
A 10 5439 6943.76 1204.32 17.34 H 10 5439 6756.69 1184.24 17.53
A 12 5439 7404.06 1532.78 20.7 H 12 1294 1687.82 448.47 26.57
A 13 5286 7332.5 1771.17 24.16 H 13 5439 7227.73 1580.23 21.86
H 9 5297 7210.06 1541.17 21.38 A 9 5484 6929.15 1595.47 23.03
H 10 4337 5639.77 1101.85 19.54 A 10 5484 7499.84 1536.69 20.49
H 12 4828 6539.4 1721.19 26.32 A 12 5484 6875.97 1585.48 23.06
H 13 5474 7599.03 1714.44 22.56 A 13 5484 6666.18 1365.83 20.49
H 9 5653 6996.63 1516.51 21.67 A 9 5653 7148.65 2135.08 29.87
H 10 5653 7256.24 1391.95 19.18 A 10 5653 7251.38 1896.79 26.16
H 12 1770 2562.01 691.43 26.99 A 12 5653 6844 1427.19 20.85
H 13 5653 7574.06 1803.12 23.81 A 13 5653 6767.01 1667.2 24.64
H 9 5340 7546.09 1907.87 25.28 A 9 5340 7863.23 3063.21 38.96
H 10 5340 7505.19 1516.05 20.2 A 10 3218 4375.54 1011.84 23.12
H 12 5340 7556.88 1916.72 25.36 A 12 5340 7849.93 2145.01 27.33
H 13 5340 7839.91 1886.79 24.07 A 13 5340 7387.63 2003.54 27.12
H 9 4906 7091.5 1965.08 27.71 A 9 3651 5151.13 1949.18 37.84
H 10 5486 6843.38 1358.41 19.85 A 10 4829 5841.17 1042.62 17.85
H 12 5486 6367.85 1419.77 22.3 A 12 5486 6466.84 1796.65 27.78
H 13 4730 5945.02 1046.12 17.6 A 13 5486 6695.21 1567.14 23.41
5127. 6751.376 1545.675833 22.8670170 5039.7 6496.975 1548.541944 23.7263229

Time motion analysis of International rugby Appendix B
61
Winning Team Outside Backs Losing Team Outside Backs GROUND No Time Distance HI Distance % WR @ HI GROUND No Time Distance HI Distance % WR @ HI
H 11 5503 6835.46 1330.81 19.47 A 11 1555 2212.78 447.48 20.22
H 14 4772 6482 1561.2 24.09 A 14 5714 5899.18 765.28 12.97
H 15 5714 7785.72 1563.65 20.08 A 15 5714 6462.3 1505.36 23.29
A 11 5020 6479.59 1215.17 18.75 H 11 5409 7203.5 1674.98 23.25
A 14 1535 1765.65 266.01 15.07 H 14 5409 7055.81 1745.42 24.74
A 15 5409 8290.3 2009.04 24.23 H 15 5409 7518.81 1757.96 23.38
A 11 4171 4481 751.75 16.78 H 11 5525 7443.21 1991.78 26.76
A 14 5525 6784.19 1770.04 26.09 H 14 5525 5942.82 1282.42 21.58
A 15 5525 7345.03 1230.35 16.75 H 15 4840 6292.47 1360.79 21.63
H 11 5552 7174.24 1888.5 26.32 A 11 5552 6442.28 1413.86 21.95
H 14 2708 3517.36 786.56 22.36 A 14 5552 6243.15 1164.56 18.65
H 15 4253 4934.89 1059.45 21.47 A 15 5552 7813.78 1430.46 18.31
A 11 5634 6453.39 1283.5 19.89 H 11 5634 7480.23 1741.01 23.27
A 14 5634 6786.96 1321.76 19.47 H 14 5634 6041.81 1316.53 21.79
A 15 4432 6204.48 1501.91 24.21 H 15 4972 6183.25 1495.98 24.19
H 11 4548 5699.11 1034.73 18.16 A 11 5323 7238.69 1763.05 24.36
H 14 3406 4314.19 900.78 20.88 A 14 5323 6168.31 1108.26 17.97
H 15 4605 6457.28 1418.91 21.97 A 15 4086 6000.24 1347.81 22.46
H 11 5871 6834.49 1285.75 18.81 A 11 5871 5814.87 1003.46 17.26
H 14 2760 3629.29 574.24 15.82 A 14 5021 5180.12 1163.49 22.46
H 15 5871 7812.19 1995.79 25.55 A 15 5871 6624.54 1435.57 21.67
H 11 5607 7293.25 1466.04 20.10 A 11 2962 3374.38 720.00 21.34
H 14 4481 6236.17 1235.45 19.81 A 14 5607 8081.32 2257.65 27.94
H 15 5607 7697.54 1823.80 23.69 A 15 5607 8006.89 1630.43 20.36
A 11 5354 6784.40 1502.22 22.14 H 11 2883 2971.50 558.07 18.78
A 14 5354 7353.38 2112.05 28.72 H 14 4818 6903.77 2073.51 30.03
A 15 5354 7458.89 1410.89 18.92 H 15 5354 6946.16 1344.44 19.36
H 11 4552 5285.19 1120.77 21.21 A 11 5462 7083.56 1174.63 16.58
H 14 5462 6125.08 950.29 15.51 A 14 5462 7050.97 1626.53 23.07
H 15 5469 6937.81 1301.68 18.76 A 15 5462 6543.10 1171.80 17.91
H 11 5652 7053.01 1295.21 18.36 A 11 5652 6017.28 1233.51 20.5
H 14 4042 5472.87 1261.62 23.05 A 14 5652 6915.2 1623.99 23.48
H 15 5652 7456.93 1470.8 19.72 A 15 5652 7756.02 1810.27 23.34
A 11 5433 6311.07 1183.38 18.75 H 11 5433 7590.23 1566.54 20.64
A 14 5433 7211.47 1684.42 23.36 H 14 4621 6675.51 1671.59 25.04
A 15 4757 7221.5 1586.81 21.97 H 15 5433 7632.73 1689.18 22.13
H 11 3702 4570.69 1127.15 24.66 A 11 5031 7437.82 1750.19 23.53
H 14 5447 7117.13 1411.81 19.84 A 14 5447 7920.4 2196.77 27.74
H 15 5447 7622.89 1710.24 22.44 A 15 5447 6565.45 1037.12 15.8
A 11 5323 7115.69 1473.41 20.71 H 11 5439 6642.93 1322.75 19.91
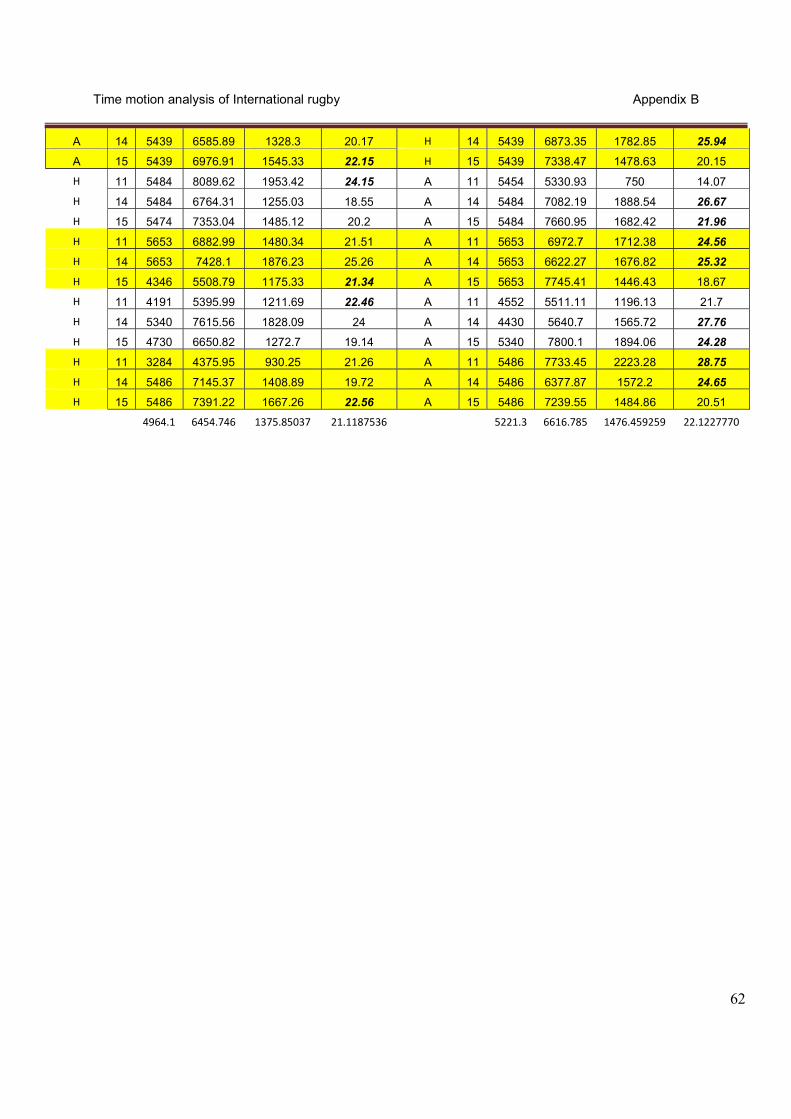
Time motion analysis of International rugby Appendix B
62
A 14 5439 6585.89 1328.3 20.17 H 14 5439 6873.35 1782.85 25.94
A 15 5439 6976.91 1545.33 22.15 H 15 5439 7338.47 1478.63 20.15
H 11 5484 8089.62 1953.42 24.15 A 11 5454 5330.93 750 14.07
H 14 5484 6764.31 1255.03 18.55 A 14 5484 7082.19 1888.54 26.67
H 15 5474 7353.04 1485.12 20.2 A 15 5484 7660.95 1682.42 21.96
H 11 5653 6882.99 1480.34 21.51 A 11 5653 6972.7 1712.38 24.56
H 14 5653 7428.1 1876.23 25.26 A 14 5653 6622.27 1676.82 25.32
H 15 4346 5508.79 1175.33 21.34 A 15 5653 7745.41 1446.43 18.67
H 11 4191 5395.99 1211.69 22.46 A 11 4552 5511.11 1196.13 21.7
H 14 5340 7615.56 1828.09 24 A 14 4430 5640.7 1565.72 27.76
H 15 4730 6650.82 1272.7 19.14 A 15 5340 7800.1 1894.06 24.28
H 11 3284 4375.95 930.25 21.26 A 11 5486 7733.45 2223.28 28.75
H 14 5486 7145.37 1408.89 19.72 A 14 5486 6377.87 1572.2 24.65
H 15 5486 7391.22 1667.26 22.56 A 15 5486 7239.55 1484.86 20.51
4964.1 6454.746 1375.85037 21.1187536 5221.3 6616.785 1476.459259 22.1227770
Time motion analysis of International rugby Abstract
Time motion analysis of international rugby Department of Exercise and Sport Sciences, Faculty of Humanities, University of the Free State, Bloemfontein Abstract This study examined the relationship between the Distance covered, High Intensity
Distance covered, and the Percentage Work Rate at High Intensity and how it correlates
to the score and result of each match. This paper attempted to address deficiencies in
the game of rugby and provide a meaningful body of data to determine winning and
losing components that jeopardize matches at senior international level. Eighteen
matches (Test and Super 14) were used to gather data through the Pro zone time
motion analysis program. Calculating the frequency, mean duration and total time spent
in activities is fundamental in time motion analysis (McLean, 1992:285-96). The extent
of these changes has, however, never been quantified. What is even more important is
that their impact on playing the game has not been evaluated. Teams losing the away
games, even though they won all components, can be due to home team support,
playing conditions, the magnitude of the game, law variations, competition structure and
the team structure played. Time motion analysis is an effective method of quantifying
the demands of rugby and provides a conceptual framework for the specific physical
preparation of players. The results of this study showed no significant difference (p <
0.05) between the variables (distance covered, high intensity distance covered and
percentage work rate at high intensity) in the winning and losing team. The correlation
between all the variables (distance covered, r = 0.67 , high intensity distance covered,
r = 0.62 and percentage work rate at high intensity, r = 0.54) and winning have practical
implications. The information obtained from these analyses allows coaches to structure
training programmes specific to the requirements of the game, and facilitates more
effective training and improved performance.
Keywords: Rugby, Time motion analysis, Distance covered, High Intensity distance
covered, Percentage Work Rate at High Intensity, Work-to-rest ratios.
Time motion analysis of International rugby Abstract
Tydsbewegingsanalise van international rugby Departement van Oefen en Sportwetenskappe, Fakulteit Geesteswetenskappe, Universiteit van die Vrystaat, Bloemfontein Abstrak Hierdie studie het die verhouding tussen die afstand afgelê, hoë intensiteit distansie
afgelê en die persentasie werk teen hoë intensiteit bestudeer en hoe dit korreleer met
die telling van elke wedstryd gespeel. Hierdie verhandeling probeer die tekortkominge in
die spel van rugby aan te spreek deur ‘n betekenisvolle hoeveelheid data te lewer om
vas te stel watter komponente by die wen of verloor van wedstryde die grootste invloed
mag hê en ‘n beduidende effek sal uitoefen op senior international vlak van rugby.
Agtien wedstryde (Toets en Super 14) was gebruik om data in te samel deur gebruik te
maak van die Pro zone tydsbewegingsanalise program. Die berekening van frekwensie,
totale tydsduur en die totale tyd wat in aktiwiteite gespandeer word is fundamenteel in
tydsbewegingsanalise (McLean, 1992:285-96). Die invloed van hierdie veranderlikes
was nog nooit gekwantifiseer nie. Wat selfs belangriker is, is die feit dat die impak van
elk van hierdie veranderlikes op die spel nog nie geevalueer is nie. Verloor spanne wat
weg wedstryde speel kan al die veranderlikes wen, maar nie die wedstryd nie.
Moontlike redes hiervoor kan ondersteuning, wedstryd kondisies, die belang van die
wedstryd, reël veranderinge, kompetisie struktuur en span struktuur wat gespeel word,
wees. Tydsbewegingsanalise is ‘n effektiewe metode om die vereistes van rugby te
kwantifiseer en verskaf ‘n konseptuele raamwerk vir die spesifieke, fisiese voorbereiding
van spelers. Resultate van hierdie studie wys op geen betekenisvolle verskille (p < 0.05)
tussen die veranderlikes (distansie afgelê, hoë intensiteit distansie afgelê en die
persentasie werk teen hoë intensiteit) en die wen en verloor spanne nie. Die korrelasie
tussen al die veranderlikes (distansie afgelê, r = 0.67, hoë intensiteit distansie afgelê, r
= 0.62 en persentasie werk teen hoë intensiteit, r = 0.54) en die wen van ‘n wedstryd
het wel praktiese implikasies. Die inligting wat verkry is vanaf hierdie analises stel
afrigters in staat om hul oefen programme te struktureer volgens die vereistes van die
spel, en fasiliteer meer effektiewe oefensessies en uiteindelik, verbeterde prestasie.

Time motion analysis of International rugby Abstract
Sleutelwoorde: Rugby, Tydsbewegingsanalise, Distansie afgelê, Hoë intensiteit
distansie afgelê, Persentasie werk teen hoë intensiteit, Werk-tot-rus verhoudings.