time scale for cyclostome evolution inferred with a phylogenetic diagnosis of hagfish and
TRANSCRIPT

© 2006 Zoological Society of JapanZOOLOGICAL SCIENCE 23: 1053–1064 (2006)
Time Scale for Cyclostome Evolution Inferred witha Phylogenetic Diagnosis of Hagfish and
Lamprey cDNA Sequences
Shigehiro Kuraku* and Shigeru Kuratani
Laboratory for Evolutionary Morphology, RIKEN Center for Developmental Biology,2-2-3 Minatojima-minami, Chuo-ku, Kobe 650-0047, Japan
The Cyclostomata consists of the two orders Myxiniformes (hagfishes) and Petromyzoniformes (lampreys), and its monophyly has been unequivocally supported by recent molecular phylogenetic studies. Under this updated vertebrate phylogeny, we performed in silico evolutionary analyses using currently available cDNA sequences of cyclostomes. We first calculated the GC-content at four-fold degenerate sites (GC4), which revealed that an extremely high GC-content is shared by all the lamprey species we surveyed, whereas no striking pattern in GC-content was observed in any of the hagfish species surveyed. We then estimated the timing of diversification in cyclostome evo-lution using nucleotide and amino acid sequences. We obtained divergence times of 470–390 mil-lion years ago (Mya) in the Ordovician–Silurian–Devonian Periods for the interordinal split between Myxiniformes and Petromyzoniformes; 90–60 Mya in the Cretaceous–Tertiary Periods for the split between the two hagfish subfamilies, Myxininae and Eptatretinae; 280–220 Mya in the Permian–Tri-assic Periods for the split between the two lamprey subfamilies, Geotriinae and Petromyzoninae; and 30–10 Mya in the Tertiary Period for the split between the two lamprey genera, Petromyzon and Lethenteron. This evolutionary configuration indicates that Myxiniformes and Petromyzoniformes diverged shortly after the common ancestor of cyclostomes split from the future gnathostome lin-eage. Our results also suggest that intra-subfamilial diversification in hagfish and lamprey lineages (especially those distributed in the northern hemisphere) occurred in the Cretaceous or Tertiary Periods.
Key words: cyclostome, hagfish, lamprey, GC-content, synonymous substitution, molecular clock
INTRODUCTION
Extant agnathans, the cyclostomes, comprise the hag-fishes (Hyperotreti; order Myxiniformes) and lampreys (Hyperoartia; order Petromyzoniformes [often misspelled as “Petromyzontiformes”]) (Hardisty and Potter, 1971; Forey and Janvier, 1993; Jørgensen, 1998; see also Ota and Kura-tani, 2006) (Fig. 1). After a long-standing controversy on the phylogenetic positions of hagfishes and lampreys, the mono-phyly of cyclostomes has been unequivocally supported by molecular phylogenetics using a triad of molecules frequently used for reconstruction of species phylogeny, namely, mito-chondrial genes (mtDNA), nuclear ribosomal RNA genes (rDNA), and nuclear protein-coding genes (nuDNA) (Fig. 1; Stock and Whitt, 1992; Mallatt and Sullivan, 1998; Kuraku et al., 1999; Delarbre et al., 2002; Furlong and Holland, 2002; Takezaki et al., 2003; Blair and Hedges, 2005; Delsuc et al., 2006). Therefore, our interest in cyclostome evolution has shifted to the topological and temporal aspects of divergence patterns within this animal group.
The order Myxiniformes is thought to be monophyletic, based on molecular phylogenetic studies using mitochon-drial 16S rDNA (Kuo et al., 2003; Chen et al., 2005). This order is divided into the two subfamilies Myxininae and Eptatretinae, based on morphological features (Fig. 1; Fern-holm, 1998). The subfamily Myxininae consists of four gen-era, Myxine and three genera intrinsic to the southern hemi-sphere (Neomyxine, Nemamyxine, and Notomyxine). The other subfamily, Eptatretinae, consists of three genera, Eptatretus, Paramyxine, and Rubicundus. In contrast, the order Petromyzoniformes is composed of three subfamilies, Mordaciinae, Geotriinae, and Petromyzoninae, in accor-dance with morphology such as dentition (Hubbs and Potter, 1971; Gill et al., 2003). The subfamilies Mordaciinae and Geotriinae are endemic to the southern hemisphere, and each comprises a single genus, Mordacia and Geotria, respectively (Potter and Strahan, 1968). The subfamily Petromyzoninae is composed of at least six genera (Fig. 1; Hardisty and Potter, 1971; Hubbs and Potter, 1971; Potter and Gill, 2003). However, there are few detailed reports of molecular approaches to estimate divergence times in the cyclostome lineage. To address questions regarding the temporal pattern of cyclostome evolution, the accumulating nucleotide and amino acid sequences of hagfishes and lam-preys will provide novel information.
* Corresponding author. Phone: +81-78-306-3064;Fax : +81-78-306-3370;E-mail: [email protected]
doi:10.2108/zsj.23.1053

S. Kuraku and S. Kuratani1054
In this study, we analyzed the GC-content in cDNA sequences of hagfishes and lampreys and calculated the divergence times of several branching points in cyclostome phylogeny using nucleotide and amino acid sequences, based on an updated version of vertebrate phylogeny repre-senting the monophyly of cyclostomes.
MATERIALS AND METHODS
GC4 calculationCurrently available annotated nucleotide sequences (as of
February 15, 2006) were retrieved for each cyclostome species from NCBI Entrez Nucleotide (http://www.ncbi.nlm.nih.gov/entrez/query.fcgi?db=Nucleotide). Redundant sequences were manually removed. To avoid biased gene selection, in which a large propor-tion of the sequence population for one species is occupied by members of a limited number of gene families, cDNAs derived from variable leukocyte receptor genes in the sea lamprey, Petromyzon marinus (accession numbers CK988414-CK988652 in NCBI dbEST; Pancer et al., 2004a), and the inshore hagfish, Eptatretus
burgeri (accession numbers AY964719-AY965612; Pancer et al., 2005), were excluded from our sequence collection. The nucleotide sequences were used to calculate the GC-content at four-fold degenerate sites (GC4) with the Perl script, in which an open read-ing frame is automatically detected with an alignment generated by BLASTX (Altschul et al., 1997). Sequences of mtDNA and nuclear rRNA genes were excluded from this GC calculation.
Molecular phylogenetic tree inferenceSequences that showed significant similarity to a query in a
BLASTP search (Altschul et al., 1997) were retrieved from data-bases: GenBank (release 151), NCBI-refseq (release 06-02-16), SWISSPROT (release 49.0), and PIR (release 80.0). An optimal multiple alignment of these amino acid sequences was constructed using the alignment editor XCED implemented in the MAFFT pro-gram (Katoh et al., 2002) in combination with manual inspection. Molecular phylogenetic trees were inferred by the neighbor-joining method (Saitou and Nei, 1987) with XCED and the maximum-likeli-hood method (Felsenstein, 1981; Kishino et al., 1990) with PAML 3.1 (Yang, 1997), using amino acid sites at which the alignment was
Fig. 1. Taxonomy and molecular phylogeny of cyclostomes. Taxonomic information was based on NCBI Entrez Taxonomy, which is mainly consistent with the classification by Renaud (1997) and Fernholm (1998). Taxonomic ranks are indicated in the top row. References that sug-gest particular phylogenetic relationships are listed near the corresponding nodes in gray shades, with the type of molecule (nuDNA, rDNA, or mtDNA) employed in their analyses. Note that branch lengths do not correspond to evolutionary times. The numbers of nucleotide and amino acid sequences, respectively, found in NCBI Entrez Nucleotide and NCBI Entrez Protein (as of February 15, 2006) are shown in parentheses beside genus names. The hagfish genera Eptatretus and Paramyxine are not monophyletic to each other according to the molecular phyloge-netic tree of the 16S rRNA gene (Kuo et al., 2003; Chen et al., 2005). The lamprey genera Entosphenus, Lampetra, and Lethenteron are not monophyletic to one another according to the molecular phylogenetic tree of the cytochrome b and NADH dehydrogenase 3 genes (Docker et al., 1999; see DISCUSSION for details).

Time Scale for Cyclostome Evolution 1055
unambiguous with no gaps, with among-site rate heterogeneity taken into account (Yang, 1994).
Estimation of number of synonymous and nonsynonymous sub-stitutions per site
Nucleotide sequences were prepared as described above in the procedures for GC4 calculation. By inferring molecular phyloge-netic trees, we selected genes with a homologue present as a sin-gle orthologue in a pair of species in question. Nucleotide sequ-ences of the selected genes were aligned based on an alignment generated for their deduced amino acid sequences. The number of synonymous and nonsynonymous substitutions per site (Ks and Ka, respectively) was calculated with the codon-based maximum-likeli-hood method (Goldman and Yang, 1994). Computation was accom-plished using PAML 3.1 (Yang, 1997).
Amino acid sequence-based divergence time estimationEstimation of divergence times was processed without assum-
ing a global molecular clock, using the MULTIDIVTIME program in which Markov-chain Monte-Carlo (MCMC) procedures for Bayesian analysis are implemented (Kishino et al., 2001). The upper and lower limits of divergence times outside the cyclostomes were pre-set by referring to a set of fossil records (Young, 1962) used by Dickerson (1971), or by referring to molecular dating (Kumar and Hedges, 1998; Blair and Hedges, 2005). To estimate divergence times using mitochondorial genes, we used a modified version of the MULTIDIVTIME program as instructed on the developers’ web page (http://statgen.ncsu.edu/thorne/multidivtime.html). Results were con-firmed with the program R8S, which enables penalized rate smooth-ing (data not shown; Sanderson, 2002, 2003).
RESULTS
GC-content in cyclostome cDNAsGC4 was calculated for cDNA sequences derived from
nuclear protein-coding genes for each cyclostome species. The GC4 of annotated cDNAs exhibited a unimodal distribu-tion, with peaks at 40–60% in hagfish species (Figs. 2A–C) and at 70–90% in lamprey species (Figs. 2D–F). Non-anno-tated abundant cDNAs of Eptatretus burgeri (Suzuki et al., 2004) and Petromyzon marinus (Pancer et al., 2004b) showed similar GC4 distributions to those of annotated cDNAs for hagfish and lamprey species, respectively (Fig. 2G). The results of the GC4 calculation for genera or species with a small number of available cDNAs were as follows: Paramyxine, 41–61% (n=5); Ichthyomyzon, 73–87% (n=7); Entosphenus, 75–83% (n=2); Mordacia mordax, 72–82% (n=3); Geotria australis, 73–90% (n=9).
Estimated number of synonymous substitutionsWe selected genes that existed as single orthologues in
a pair of species in question with more than 600 bp of aligned nucleotide stretches. Estimation of Ks was pro-cessed using the maximum-likelihood method (Goldman and Yang, 1994). The average Ks between the two hagfish genera, Myxine and Eptatretus, was 0.24 (standard devia-tion (SD), 0.11; n=11; Table 1). In contrast, the average Ks
for Petromyzon–Lethenteron and Geotria–Lethenteron pairs was 0.15 (SD, 0.09; n=19; Table 2A) and 1.03 (SD, 0.39; n=2; Table 2B), respectively. Sequence comparison bet-ween a hagfish species and a lamprey species always yielded an apparently saturated Ks (>3; data not shown).
We also estimated the Ks of mitochondrial protein-cod-ing genes in the Myxine–Eptatretus and Petromyzon–Lam-
Fig. 2. Distribution of GC4 for hagfish and lamprey cDNAs. Histo-grams representing the fraction of cDNAs for each GC4 value are shown for three hagfish species, (A) Myxine glutinosa, (B) Eptatre-tus stoutii, and (C) Eptatretus burgeri, and three lamprey species, (D) Petromyzon marinus, (E) Lethenteron japonicum, and (F) Lam-petra fluviatilis. (G) The distributions of GC4 in assembled expressed sequence tags (ESTs) of Eptatretus burgeri and Petromyzon marinus, also shown as histograms. ESTs were retrieved from NCBI dbEST for Eptatretus burgeri (accession num-bers, BJ644497-BJ668380; Suzuki et al., 2004) and Petromyzon marinus (CO542795-CO553159; Pancer et al., 2004b). These ESTs were automatically assembled with Phrap (http://www.phrap.com), so that one cDNA sequence represents one gene. The assembled sequences are available upon request. In analyses using the GC-content of the third positions (GC3), we obtained similar results for all the graphs in this Fig.

S. Kuraku and S. Kuratani1056
Table 1. Estimated numbers of synonymous and non-synonymous substitutions between Myxininae and Eptatretinae.
Gene Name Gene symbols of potential human orthologues
Species Alignedlength (nt) Ks Ka
Myxininae Eptatretinae
blood 5-aminolevulinate synthase ALAS1. ALAS2 Mg Eb 603 0.20 0.01
creatine kinase CKM, CKB, CKMT1, CKMT2 Mg Es 1137 0.30 0.05eukaryotic translation elongation factor 1 gamma EEF1G Mg Eb 630 0.14 0.05guanine nucleotide-binding protein, beta polypeptide 2-like 1 GNB2L1 Mg Eb 900 0.20 0.02
H+-transporting ATP synthase alpha subunit isoform 1 ATP5A1 Mg Eb 1092 0.24 0.01
low molecular mass polypeptide PSMB5, PSMB8 Mg Eb 819 0.02 0.01
ribosomal protein S2 RPS2 Mg Eb 603 0.31 0.00ribosomal protein S3 RPS3 Mg Eb 633 0.23 0.00ribosomal protein S4 RPS4X, RPS4Y1 Mg Eb 714 0.49 0.03
ribosomal protein L5 RPL5 Mg Eb 888 0.23 0.04ribosomal protein L7a RPL7A Mg Eb 723 0.26 0.05
Species names are indicated as abbreviations: Mg, Myxine glutinosa; Eb, Eptatretus burgeri; Es, Eptatretus stoutii.
Table 2. Estimated numbers of synonymous and non-synonymous substitutions between lamprey species.
A, Petromyzon-Lethenteron
Gene Name Gene symbols of potential human orthologuesSpecies Aligned
length (nt) Ks KaPetromyzon Lethenteron
bone morphogenetic protein (BMP) 2/4a BMP2, BMP4 Pm Lj 831 0.19 0.01cytoplasmic actin (LjCA1) ACTB, ACTG1 Pm Lj 1128 0.22 0.00
Dlx1/6 (DlxD) DLX1, DLX6 Pm Lj 804 0.14 0.00enolase-2 ENO1, ENO2, ENO3 Pm Lr 1185 0.12 0.01eukaryotic elongation factor-1 alpha EEF1A1, EEF1A2 Pm Lj 1389 0.07 0.00
eukaryotic translation elongation factor 1 gamma EEF1G Pm Lj 1068 0.10 0.01fructose-bisphosphate aldolase, muscle type (EJM8) ALDOA, ALDOB, ALDOC Pm Lj 1065 0.22 0.02guanine nucleotide binding protein, beta polypeptide 2-like 1GNB2L1 Pm Lj 951 0.12 0.00
HMG 1/2/3 HMGB1, HMGB2, HMGB3 Pm Lf 624 0.10 0.00Ikaros-like transcription factor IKLF1 ZNFN1A1, ZNFN1A2, ZNFN1A3, ZNFN1A4, ZNFN1A5 Pm Lf 1197 0.05 0.02intermediate filament protein type III PRPH, DES, VIM Pm Lf 1419 0.26 0.01
low molecular mass polypeptide (LMPX) PSMB5, PSMB8 Pm Lj 615 0.01 0.00myosin heavy chain (LjMyHC3) MYH9, MYH10, MYH11, MYH14 Pm Lj 786 0.09 0.01Pax2/5/8 PAX2, PAX5, PAX8 Pm Lj 834 0.24 0.00
phosphoglycerate kinase (PGK) PGK1, PGK2 Pm Lr 828 0.22 0.00ribosomal protein S2 RPS2 Pm Lj 603 0.11 0.00ribosomal protein L7a RPL7A Pm Lj 672 0.36 0.01
SH3-domain GRB2-like (endophilin SH3p4) SH3GL1, SH3GL2 Pm Lf 627 0.10 0.00TATA-box binding protein TBP, TBPL1, TBPL2 Pm Lj 867 0.09 0.00
B, Geotria-Lethenteron
Gene Name Gene symbols of potential human orthologuesSpecies Aligned
length (nt) Ks KaPetromyzon Lethenteron
rhodopsin RHO Ga Lj 1059 0.76 0.04red opsin OPN1LW Ga Lj 1044 1.31 0.06
Species names are indicated as abbreviations: Pm, Petromyzon marinus; Lj, Lethenteron japonicum; Lr, Lethenteron reissneri; Lf, Lampetra fluviatilis; Ga, Geotria australis. We treated the genus Lampetra as equally distant from Lethenteron in relation to Petromyzon based on the previous molecular phylogenetic study (Docker et al., 1999).
Table 3. Divergence times and numbers of synonymous substitutions reported for closely related organism pairs.
Taxonomic group Species pairsa Ks Divergence time
Average Method Gene number Reference Mya Reference
Mammalia 1, human-mouse 0.56 ML 11084 RGSPC, 2004 87 Springer et al., 20032, mouse-rat 0.19 ML 11503 RGSPC, 2004 16 Springer et al., 20033, human-pig 0.31 ML 1120 Jørgensen et al., 2005 94 Springer et al., 2003
Amniota 4, human-chicken 1.66 ML 7529 ICGSC, 2004 310 Benton, 1993Sauropsida 5, chicken-turkey 0.12 ML 155 Axelsson et al., 2005 28 Dimcheff et al., 2002
6, chicken-turtle 0.96 ML 56 Kuraku et al., 2006 222–276 Kumar and Hedges, 1998
Teleostei 7, Tetraodon nigroviridis-Fugu rubripes 0.42 PBL 5802 Jaillon et al., 2003 18-30 Crnogorac-Jurcevic et al., 1997
Cephalochordata 8, Branchiostoma belcheri-B. floridae 0.38 ML 14 this studyb 112 Nohara et al., 2005
ML, Calculated with the method of Goldman and Yang (1994); PBL, Calculated with the method by Pamilo and Bianchi (1993) and Li (1993). ICGSC, International Chicken Genome Sequencing Consortium. RGSPC, Rat Genome Sequencing Project Consortium. aNumbers 1–8 in the column of species pairs correspond to those in Fig. 3. bSee Supplemental Table S2.

Time Scale for Cyclostome Evolution 1057
petra pairs for which the sequences were available in public databases (Lee and Kocher, 1995; Rasmussen et al., 1998; Delarbre et al., 2000; Delarbre et al., 2001; Delarbre et al., 2002). The average Ks for the Petromyzon–Lampetra pair was 1.19 (SD, 0.57; n=13; Supplemental Table S1, http://dx. doi.org/10.2108/zsj.23.1053), whereas the Myxine–Eptatre-tus pair yielded an apparently saturated Ks (>2; data not shown). The difference in Ks values between mitochondrial
and nuclear genes (7.9-fold for the Petromyzon–Lampetrapair) was roughly consistent with previous observations in mammals and amphibians (Miyata et al., 1982; Crawford, 2003).
Rough estimation of divergence times based on number of synonymous substitutions
The number of synonymous substitutions per site has been reported for some pairs of chordate species (Table 3). In the present study, to supplement pre-existing data, we preliminarily estimated the Ks between two species of the cephalochordate genus Branchiostoma (Supplemental Table S2, http://dx.doi.org/10.2108/zsj.23.1053). The diver-gence times and Ks values in Table 3, including the data for Branchiostoma, were plotted two-dimensionally in Fig. 3. The overall rate of this putative clock was 2.4×10⁻⁹/site/year (Clock A; Fig. 3A), whereas the rate of the clock for selected species pairs (for details, see legend for Fig. 3) was 1.9×10⁻⁹/site/year (Clock B; Fig. 3B). By applying these clocks tenta-tively to cyclostome taxon pairs, we obtained divergence times of the inter-subfamilial split between Myxininae and Eptatretinae in the hagfish lineage at 93–28 Mya, the inter-generic split between Petromyzon and Lethenteron at 57–15 Mya, and the inter-subfamilial split between Geotriinae and Petromyzoninae in the lamprey lineage at 383–136 Mya (Table 4).
Estimation of divergence times using amino acid sequ-ences
We selected 10 nuclear protein-coding genes with rela-tively long alignment lengths (>150 amino acids; total length, 2947 amino acids; Table 5) in which no gene duplication was detected in major vertebrate lineages, as shown in Fig. 4 for the gene GNB2L1. The upper and lower limits of diver-gence times for branching points outside the cyclostomes were preset as shown in Table 6, and the tree topology shown in Fig. 5 was assumed. By executing the MULTIDIV-TIME program (Kishino et al., 2001), we obtained diver-gence times for Myxiniformes and Petromyzoniformes at 671–391 Mya, Myxininae and Eptatretinae at 162–63 Mya, and Petromyzon and Lethenteron at 30–2 Mya (Table 7).
In addition, the timing of the above branching points was estimated using 12 mitochondrial protein-coding genes that had relatively long alignment lengths (total length, 3320 amino acids). ATP synthase F0 subunit 8 was excluded from this analysis because of its short alignment length. As a result, divergence times were estimated to be 728–459 Mya for the Myxiniformes–Petromyzoniformes split, 72–39 Mya for the Myxininae–Eptatretinae split, and 37–18 Mya for the Petromyzon–Lampetra split (Table 7).
Fig. 3. Divergence times and number of synonymous substitutions per site. (A) The tentative clock calibrated by all of the divergences of species pairs (black circles) in Table 3. (B) The tentative clock calibrated by nodes 3, 5, 6, and 8 in Table 3. In this “Clock B”, nodes 1 and 2 were excluded because of an elevated evolutionary rate in the rodent lineage. Node 4 was excluded because of its unreliably high Ks value (>1). Node 7 was excluded because Ks for this spe-cies pair was estimated with a different method from the others. In both clocks, regression lines indicated as broken lines pass through the origin. For nodes 6 and 7, the intermediate values of estimated ranges of divergence times in Table 3 were used as divergence times in this Fig. Divergences in cyclostomata (e–g) that were dated with these clocks are indicated as open circles.
Table 4. Divergence times estimated with tentative synonymous substitution clocks.
Node (Taxon pair)
Ks
e(Myxininae-Eptatretinae)
0.24±0.11 (n=11)
f(Petromyzon-Lethenteron)
0.14±0.07 (n=19)
g(Geotriinae-Petromyzoninae)
1.03±0.39 (n=2)
Clock A B A B A BEstimated divergence time (Mya) 51±23 65±28 30±15 38±19 219±83 278±105
Clocks A and B correspond to those in Fig. 3. Nodes e-g correspond to those in Fig. 5.

S. Kuraku and S. Kuratani1058
DISCUSSION
GC4 as a reflection of base composition in cyclostome genomes
The GC-content at synonymous sites in a protein-coding gene is expected to positively correlate with the global GC-content of the genomic region where the gene is located (Clay et al., 1996; Musto et al., 1999; Kuraku et al., 2006). Therefore, we focused on GC4 in currently available cDNAs reported for cyclostomes (Fig. 2). Hagfish and lamprey cDNAs show similar levels of heterogeneity in GC-content (Fig. 2). However, there is a striking difference in the level of GC-content between hagfish and lamprey: every lamprey species we analyzed showed a high GC4 (70–90%; Figs.
2A–C), whereas every hagfish species we analyzed showed a relatively moderate GC4 (40–60%; Figs. 2D–F).
Cytogenetic studies have revealed that hagfishes have a relatively moderate number of relatively moderate-sized chromosomes compared to other vertebrates (2n=14–36 in somatic cells), whereas lampreys possess a much greater number of small, dot-like chromosomes (2n=76–178; Potter and Rothwell, 1970; Potter and Robinson, 1971; Robinsonet al., 1975; Nakai et al., 1995; Animal Genome Size Data-base, http://www.genomesize.com). The contrast in chromo-some size, chromosome number, and GC-content between hagfishes and lampreys is reminiscent of the intra-genomic difference between macrochromosomes and microchromo-somes seen in sauropsids (Burt, 2002; Kuraku et al., 2006).
Table 5. Genes on nuDNA used for amino acid-based estimation of divergence times.
Gene name Gene symbols of a human ortholog
Speciesa Alignedlength (aa)Myxiniformes Petromyzoniformes
DNA-directed RNA polymerase II largest subunit POLR2A Eb Lr 595DNA-directed RNA polymerase III largest subunit POLR3A Eb Lr 493eukaryotic translation elongation factor 1 gamma EEF1G Mg, Eb Pm, Lj 275guanine nucleotide binding protein, beta polypeptide 2-like 1 GNB2L1 Mg, Eb Pm, Lj 299H+-transporting ATP synthase alpha subunit isoform 1 ATP5A1 Mg, Eb Pm 332ribosomal protein S2 RPS2 Mg, Eb Pm, Lj 201ribosomal protein S3 RPS3 Mg, Eb Pm, Lj 190ribosomal protein L5 RPL5 Mg, Eb Pm, Lj 165ribosomal protein L7A RPL7A Mg, Eb Pm, Lj 241triosephosphate isomerase TPI1 Eb Lr 206
aSpecies names: Mg, Myxine glutinosa; Eb, Eptatretus burgeri; Pm, Petromyzon marinus; Lj, Lethenteron japonicum; Lr, Lethenteron reissneri.
Fig. 4. Molecular phylogenetic tree of a gua-nine nucleotide-binding protein, beta polypep-tide 2-like 1 (GNB2L1) protein. The tree was inferred with the neighbor-joining method using 300 amino acid residues and assuming among-site rate heterogeneity (shape parameter α=0.64; see MATERIALS AND METHODS for details). The maximum-likelihood method yielded similar tree topologies, although they are not statistically significant. For amino acid-based divergence time estimation, we selected 10 genes with no gene duplication, as shown in this tree.
Table 6. Divergence times for constrained nodes.
Node a b c Reference
Constraint set Min Max Min Max Min Max
I 300 300 400 400 500 500 Dickerson, 1971
II 310 310 415 485 489 639Kumar and Hedges, 1998
III 310 370 425 495 605 742 Blair and Hedges, 2005
Max, Upper limit of divergence time. Min, lower limit of divergence time. Letters indicating nodes (a–c) correspond to those in Fig. 5.

Time Scale for Cyclostome Evolution 1059
Further investigation will be required to understand the puta-tive relationships among these genomic features.
Ks as a tool to standardize evolutionary distancesThe number of synonymous substitutions per site in a
protein-coding region serves as an ideal standard for evolu-tionary distance when comparing closely related species, as long as the gene in question has evolved in a neutral man-ner (Miyata and Yasunaga, 1980; Perler et al., 1980). In this study, we estimated Ks with the maximum-likelihood method (Goldman and Yang, 1994) because this method is expected to produce relatively appropriate estimates, even in species with highly biased base compositions, such as lampreys (Fig. 2). For all the genes analyzed in this study, Ks was larger than Ka, indicating that these genes have evolved neutrally without experiencing positive selection. In selecting pairs of cyclostome species for Ks estimation, we treated the lamprey genus Lampetra as having the same distance the genus Lethenteron has from Petromyzon. This is based on a previous phylogenetic study using the cyto-chrome b and NADH dehydrogenase subunit 3 (ND3) genes (Docker et al., 1999), which is consistent with the classifica-tion by Potter (1980), who formerly considered that the three subgenera, Entosphenus, Lethenteron, and Lampetra, com-pose the single genus Lampetra. Despite the small number of genes sampled, similar Ks values were consistently obtained for Petromyzon–Lampetra and Petromyzon–Lethenteron pairs (Table 2). In contrast to inter-generic and inter-subfamilial comparisons in cyclostomes, our prelimi-
nary Ks estimates between two tunicate species in the same genus (Ciona intestinalis and C. savignyi) and two amphioxus species in the same genus (Branchiostoma belcheri and B. floridae) yielded relatively larger Ks values (see Supplemental Table S2, http://dx.doi.org/10.2108/zsj.23. 1053 for Branchiostoma; Ks>3 for Ciona; data not shown), despite their close taxonomic distances.
Theoretically, the Ks value is determined by the time that has elapsed since the divergence of two species in ques-tion, as long as neutrality holds. This feature of Ks is useful in judging orthology between genes (especially members of a gene family prone to gene duplications) of closely related species. If this idea is tentatively applied to previous cross-species comparisons in lamprey studies, for example, orthology between L. japonicum Hox6w and L. fluviatilisHoxL6 is again confirmed with an extremely low Ks value (Ks=0.039), a reasonable estimate for intrasubfamilial com-parison, as suggested previously (Takio et al., 2004).
Methodological aspects of molecular datingProposing a constant rate of nucleotide and amino acid
substitutions was one of the milestones for molecular dating of divergence times (“molecular clock”; Zuckerkandl and Pauling, 1962, 1965; also see Donoghue et al., 2003; Bro-mham and Penny, 2003; and Kumar, 2005, for review). As shown in Fig. 3, the numbers of synonymous substitutions per site and divergence times behave in a clock-like man-ner, at least within the chordates, indicating that this may serve as a rough molecular clock for species pairs with an unsaturated Ks. However, this clock was calibrated by branching points in different lineages outside the cyclos-tomes (Table 3), because no branching point with a known divergence time was available within cyclostomes. In addi-tion, variation of evolutionary rate among lineages, such as rate elevation in rodents (Kikuno et al., 1985; Wu and Li, 1985; Rat Genome Sequencing Project Consortium, 2004), may confuse divergence time estimation. Therefore, our results need to be verified by refinement of this silent clock with reexamination of divergence times and estimation of Ks
for more pairs of organisms.We utilized amino acid sequences to obtain more robust
estimates. Especially in our Ks analysis, synonymous substi-tutions between Myxiniformes and Petromyzoniformes were apparently saturated (data not shown), suggesting that this split would need to be dated with amino acid sequences rather than nucleotide sequences. However, as exemplified in Fig. 4, phylogenetic trees including cyclostome species often show a high degree of rate heterogeneity because of the accelerated evolutionary rate in hagfishes. To minimize the undesirable influence of this rate heterogeneity on diver-gence time estimation, we employed a non-parametric
Fig. 5. A tree topology preset for divergence time estimation. Let-ters at nodes correspond to those in Tables 6 and 7.
Table 7. Divergence times estimated with amino acid sequences.
Molecule type Genes on nuDNA (n=10) Genes on mtDNA (n=12)
Node c d e f c d e f
Constraint set I 500± 0 432±41 88±25 11± 9 500± 0 478±19 44±5 21±3Constraint set II 629± 9 524±53 107±30 14±11 629± 8 602±24 55±6 27±4Constraint set III 730±11 612±59 127±35 17±13 725±15 698±30 65±7 32±5
Letters indicating nodes (c–f) correspond to those in Fig. 5. For details of constraint sets (I–III), see Table 5. Divergence times are shown with standard errors representing 95% confidence intervals.

S. Kuraku and S. Kuratani1060
molecular dating method that does not assume rate con-stancy (Kishino et al., 2001; Thorne and Kishino, 2002; see also Hasegawa et al., 2003). Moreover, we paid close atten-tion to the orthologous/paralogous relationships of multiple members of gene families between hagfishes, lampreys, and gnathostomes, because putative genome duplications in early vertebrate evolution (Ohno, 1970; McLysaght et al., 2002) often confuse orthology identification; Kuraku et al.(1999) provided an example in the enolase gene family. In addition, inclusion of genes prone to gene duplications may also result in misleading estimates of divergence time, pos-sibly because of an accelerated evolutionary rate caused by neofunctionalization or subfunctionalization of duplicates. For these reasons, we deliberately selected genes for which no gene duplication was detected in major vertebrate lin-eages (Table 5).
As calibration points outside the cyclostomes, we used three sets of divergence time constraints (Table 6). One of the three constraint sets was based on the fossil records used by Dickerson (1971) (constraint set I), whereas the other two were based on previous studies using molecular data (constraint set II, Kumar and Hedges, 1998; constraint set III, Blair and Hedges, 2005). However, these molecular studies included genes that underwent duplication events early in vertebrate evolution and do not represent a 1:1 rela-tionship between a cyclostome gene and a gnathostome counterpart (e.g., bone morphogenetic protein (BMP) 2/4, enolase-2). Although fossil records inherently tend to yield more recent divergence times because of potential incom-plete fossil sampling in more ancient eras, it is possible that inappropriate gene selection might have yielded much more ancient estimates in these studies (constraint sets II and III) compared with commonly accepted fossil records (constraint set I). This discrepancy emphasizes again that precision in gene selection cannot be sacrificed, even in the name of high-throughput analysis using large data sets. For this rea-son, we summarize our results below, along a temporal axis based on the fossil records.
Temporal reconstruction of cyclostome phylogenyThe monophyly of cyclostomes has resulted in a dispute
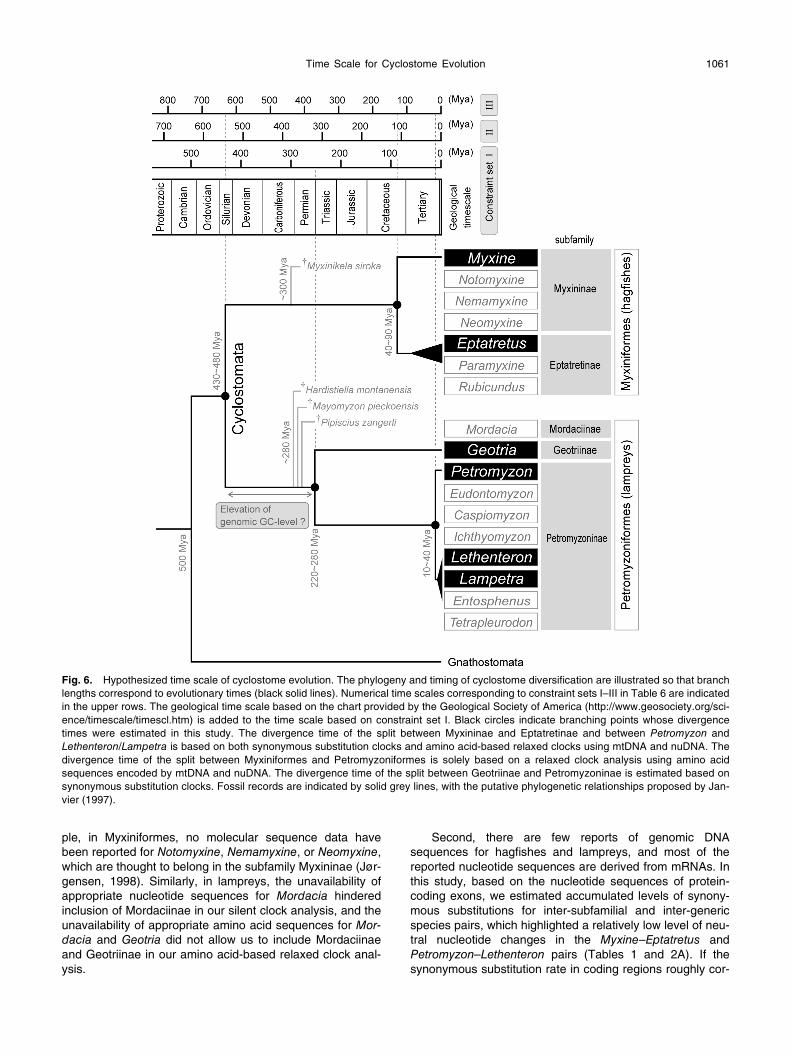
over when hagfishes and lampreys split from each other in the cyclostome lineage. To answer this question, our analy-ses using mitochondrial and nuclear genes consistently showed that Myxiniformes and Petromyzoniformes diverged from each other 30–110 million years after the cyclostome lineage split from the future gnathostome lineage (Table 7). When calibration by fossil records was applied, this Myxini-formes–Petromyzoniformes split dated back to 470–390 Mya in the Ordovician–Silurian–Devonian Periods (Fig. 6), when fossil agnathans are thought to have diversified (Forey and Janvier, 1993; Janvier, 1996). Although we still do not know the precise branching pattern among these agna-thans, hagfishes and lampreys represent two distinct agnathan groups that diverged early in vertebrate evolution and have survived thereafter for more than 400 million years. Our results indicate that, although both groups are classified as cyclostomes, the distance between hagfishes and lampreys is similar to that between humans and carti-laginous fishes, in terms of the geological time that has elapsed since their divergence.
Later in the hagfish lineage, our molecular dating with amino acid-based relaxed clocks and synonymous substitu-tion clocks indicated that there was no branching of extant taxa until the two hagfish subfamilies, Myxininae and Eptatretinae, split from each other 90–60 Mya in the Creta-ceous–Tertiary Periods (Fig. 6). However, there is a paleon-tological report of a fossil species, Myxinikela siroka, from the Carboniferous fauna (~300 Mya) that is regarded as a putative outgroup of extant hagfishes (Bardack, 1991). In our divergence time estimate using relaxed molecular clocks, even when we tentatively constrained the upper limit of the divergence time of the Myxininae–Eptatretinae split to 300 Mya, we obtained an identical result (data not shown), suggesting that this fossil species, Myxinikela siroka, actu-ally is an outgroup of extant hagfishes (Fig. 6).
All the three subfamilies (Mordaciinae, Geotriinae, and Petromyzoninae) in the lamprey lineage are thought to have diverged from one another in a considerably short period of time (Conlon et al., 2001; Gill et al., 2003), as indicated by ambiguous phylogenetic relationships between these three taxa in recent molecular studies (Baldwin et al., 1988; Silveret al., 2004; Takahashi et al., 2006). Our synonymous sub-stitution clock indicates that the Geotriinae–Petromyzoninae split occurred in the Permian–Triassic Periods (280–220 Mya; Fig. 6). Although this estimate needs to be reinforced with more robust analyses using amino acid sequences, this divergence time may coincide with the break-up of Gond-wana (inhabited by species in Mordaciinae and Geotriinae) from Laurasia (inhabited by species in Petromyzoninae). Later, in the lineage of Petromyzoninae, an inter-generic split between Petromyzon and Lethenteron/Lampetra occurred 30–10 Mya in the Tertiary Period (Fig. 6). This result is consistent with the rough estimate by Docker et al.(1999), who simply assumed that a 2% divergence in mtDNA sequence corresponds to one million years (Brownet al., 1979). To further confirm phylogenetic relationships in Petromyzoninae, reported previously based on morphologi-cal features (Gill et al., 2003), molecular sequence data from other genera need to be included. Fossils of the lampreys Hardistiella montanensis, Mayomyzon pieckoensis, and Pipiscius zangerli were found in the Carboniferous fauna (~280 Mya) and have been treated as outgroups of all extant lampreys (Bardack and Zangerl, 1971; Bardack and Rich-ardson, 1977; Janvier and Lund, 1983). In nuDNA-based and mtDNA-based analyses using relaxed molecular clocks, adding these paleontological data did not produce any sub-stantial differences in results (data not shown), indicating that these fossil lampreys should still be regarded as out-groups of all extant lamprey species in Petromyzoniformes (Fig. 6).
PerspectivesThanks to the efforts of researchers in various fields of
biology (e.g., Kuratani et al., 2002), nucleotide and amino acid sequences of hagfishes and lampreys are accumulating in public databases. However, information at the molecular level is still far from satisfactory for cyclostomes (Fig. 1), in two aspects. First, in terms of the coverage of species diver-sity, there is a paucity of molecular data for southern hemi-sphere species, and these data are crucial for inferences of phylogenetic relationships and divergence times. For exam-
Time Scale for Cyclostome Evolution 1061
ple, in Myxiniformes, no molecular sequence data have been reported for Notomyxine, Nemamyxine, or Neomyxine, which are thought to belong in the subfamily Myxininae (Jør-gensen, 1998). Similarly, in lampreys, the unavailability of appropriate nucleotide sequences for Mordacia hindered inclusion of Mordaciinae in our silent clock analysis, and the unavailability of appropriate amino acid sequences for Mor-dacia and Geotria did not allow us to include Mordaciinae and Geotriinae in our amino acid-based relaxed clock anal-ysis.
Second, there are few reports of genomic DNA sequences for hagfishes and lampreys, and most of the reported nucleotide sequences are derived from mRNAs. In this study, based on the nucleotide sequences of protein-coding exons, we estimated accumulated levels of synony-mous substitutions for inter-subfamilial and inter-generic species pairs, which highlighted a relatively low level of neu-tral nucleotide changes in the Myxine–Eptatretus and Petromyzon–Lethenteron pairs (Tables 1 and 2A). If the synonymous substitution rate in coding regions roughly cor-
Fig. 6. Hypothesized time scale of cyclostome evolution. The phylogeny and timing of cyclostome diversification are illustrated so that branch lengths correspond to evolutionary times (black solid lines). Numerical time scales corresponding to constraint sets I–III in Table 6 are indicated in the upper rows. The geological time scale based on the chart provided by the Geological Society of America (http://www.geosociety.org/sci-ence/timescale/timescl.htm) is added to the time scale based on constraint set I. Black circles indicate branching points whose divergence times were estimated in this study. The divergence time of the split between Myxininae and Eptatretinae and between Petromyzon and Lethenteron/Lampetra is based on both synonymous substitution clocks and amino acid-based relaxed clocks using mtDNA and nuDNA. The divergence time of the split between Myxiniformes and Petromyzoniformes is solely based on a relaxed clock analysis using amino acid sequences encoded by mtDNA and nuDNA. The divergence time of the split between Geotriinae and Petromyzoninae is estimated based on synonymous substitution clocks. Fossil records are indicated by solid grey lines, with the putative phylogenetic relationships proposed by Jan-vier (1997).

S. Kuraku and S. Kuratani1062
responds to the neutral substitution rate in intergenic or intronic regions without regulatory functions, our estimates imply that these taxon pairs might be too phylogenetically close to discern potentially functional sequences, such as cis-regulatory elements or non-coding genes.
This principle is referred to as “phylogenetic footprinting” (Gumucio et al., 1992; see also Zhang and Gerstein, 2003, for review), and selecting multiple species with appropriate levels of nucleotide substitution facilitates an efficient in sil-ico detection of potentially functional genomic sequences (Uchikawa et al., 2003; Johnson et al., 2004; Kusakabe, 2005). In this context, using lampreys as an example, com-parison of non-coding genomic sequences among multiple species in Petromyzoninae alone will not provide a sufficient level of resolution to highlight functional fractions. Instead, judging from the almost saturated Ks level between Geotrii-nae and Petromyzoninae (Table 2B), inclusion of southern hemisphere lampreys (Mordacia or Geotria) would be highly promising in comparisons with species in the northern hemi-sphere subfamily Petromyzoninae, such as Petromyzon marinus, whose genome sequencing project is now under-way.
Despite the scarcity of sequence information, we atte-mpted to overview the general features of base composition and evolutionary distance in cyclostomes, and obtained results that will serve as standards for future evolutionary and genomic studies of cyclostomes. We propose that, in any taxa, this sort of succinct evolutionary analysis should be a prerequisite for any biological studies involving multi-species comparisons. Even if the amount of available sequence information is limited, general trends embedded in sequence information can be extracted in light of the theo-ries of molecular evolution.
ACKNOWLEDGMENTS
We are very grateful to Kazutaka Katoh for computational advice and to Kinya Ota, David McCauley, and Yoichi Matsuda for insightful discussion. This work was supported by Grants-in-Aid from the Ministry of Education, Culture, Sports, Science, and Tech-nology, Japan.
REFERENCES
Altschul SF, Madden TL, Schaffer AA, Zhang J, Zhang Z, Miller W, Lipman DJ (1997) Gapped BLAST and PSI-BLAST: a new gen-eration of protein database search programs. Nucleic Acids Res 25: 3389–3402
Axelsson E, Webster MT, Smith NG, Burt DW, Ellegren H (2005) Comparison of the chicken and turkey genomes reveals a higher rate of nucleotide divergence on microchromosomes than macrochromosomes. Genome Res 15: 120–125
Baldwin J, Mortimer K, Patak A (1988) Evolutionary relationships among lamprey families: amino acid composition analysis of lactate dehydrogenase. Biochem Syst Ecol 16: 351–353
Bardack D (1991) First fossil hagfish (Myxinoidea): a record from the Pennsylvanian of Illinois. Science 254: 701–703
Bardack D, Richardson ES (1977) New agnathous fishes from the Pennsylvanian of Illinois. Fieldiana Geol 33: 489–510
Bardack D, Zangerl R (1971) Lampreys in the fossil record. In “The Biology of Lampreys” Ed by MW Hardisty, IC Potter, Academic Press, London & New York, pp 67–84
Benton MJ (1993) The Fossil Record 2. 1st ed, Palaeontological Association, Royal Society (Great Britain), Linnean Society of London, Chapman and Hall, London
Blair JE, Hedges SB (2005) Molecular phylogeny and divergence times of deuterostome animals. Mol Biol Evol 22: 2275–2284
Bromham L, Penny D (2003) The modern molecular clock. Nat Rev Genet 4: 216–224
Brown WM, George M Jr, Wilson AC (1979) Rapid evolution of ani-mal mitochondrial DNA. Proc Natl Acad Sci USA 76: 1967–1971
Burt DW (2002) Origin and evolution of avian microchromosomes. Cytogenet Genome Res 96: 97–112
Chen Y, Chang H, Mok H (2005) Phylogenetic position of Eptatretus chinensis (Myxinidae: Myxiniformes) inferred by 16S rRNA gene sequence and morphology. Zool Stud 44: 111–118
Clay O, Caccio S, Zoubak S, Mouchiroud D, Bernardi G (1996) Human coding and noncoding DNA: compositional correlations. Mol Phylogenet Evol 5: 2–12
Conlon JM, Wang Y, Potter IC (2001) The structure of Mordacia mordax insulin supports the monophyly of the Petromyzonti-formes and an ancient divergence of Mordaciidae and Geotri-idae. Comp Biochem Physiol B Biochem Mol Biol 129: 65–71
Crawford AJ (2003) Relative rates of nucleotide substitution in frogs. J Mol Evol 57: 636–641
Crnogorac-Jurcevic T, Brown JR, Lehrach H, Schalkwyk LC (1997) Tetraodon fluviatilis, a new puffer fish model for genome stud-ies. Genomics 41: 177–184
Delarbre C, Escriva H, Gallut C, Barriel V, Kourilsky P, Janvier P, Laudet V, Gachelin G (2000) The complete nucleotide sequ-ence of the mitochondrial DNA of the agnathan Lampetra fluvi-atilis: bearings on the phylogeny of cyclostomes. Mol Biol Evol 17: 519–529
Delarbre C, Rasmussen AS, Arnason U, Gachelin G (2001) The complete mitochondrial genome of the hagfish Myxine gluti-nosa: unique features of the control region. J Mol Evol 53: 634–641
Delarbre C, Gallut C, Barriel V, Janvier P, Gachelin G (2002) Com-plete mitochondrial DNA of the hagfish, Eptatretus burgeri: the comparative analysis of mitochondrial DNA sequences strongly supports the cyclostome monophyly. Mol Phylogenet Evol 22: 184–192
Delsuc F, Brinkmann H, Chourrout D, Philippe H (2006) Tunicates and not cephalochordates are the closest living relatives of ver-tebrates. Nature 439: 965–968
Dickerson RE (1971) The structures of cytochrome c and the rates of molecular evolution. J Mol Evol 1: 26–45
Dimcheff DE, Drovetski SV, Mindell DP (2002) Phylogeny of Tetra-oninae and other galliform birds using mitochondrial 12S and ND2 genes. Mol Phylogenet Evol 24: 203–215
Docker MF, Youson JH, Beamish RJ, Devlin RH (1999) Phylogeny of the lamprey genus Lampetra inferred from mitochondrial cytochrome b and ND3 gene sequences. Can J Fish Aquat Sci 56: 2340–2349
Donoghue PCJ, Smith MP, Sansom IJ (2003) The origin and early evolution of chordates: molecular clocks and the fossil record. In “Telling the Evolutionary Time” Ed by PCJ Donoghue, MP Smith, Taylor & Francis, London, pp 190–223
Felsenstein J (1981) Evolutionary trees from DNA sequences: a maximum likelihood approach. J Mol Evol 17: 368–376
Fernholm B (1998) Hagfish systematics. In “The Biology of Hag-fishes” Ed by JM Jørgensen, JP Lomholt, RE Weber, H Malte, Chapman & Hall, London, pp 33–44
Forey P, Janvier P (1993) Agnathans and the origin of jawed verte-brates. Nature 361: 129–134
Furlong RF, Holland PWH (2002) Bayesian phylogenetic analysis supports monophyly of ambulacraria and of cyclostomes. Zool Sci 19: 593–599
Gill HS, Renaud CB, Chapleau F, Mayden RL, Potter IC (2003) Phy-logeny of living parasitic lampreys (Petromyzontiformes) based on morphological data. Copeia 4: 687–703

Time Scale for Cyclostome Evolution 1063
Goldman N, Yang Z (1994) A codon-based model of nucleotide sub-stitution for protein-coding DNA sequences. Mol Biol Evol 11: 725–736
Gumucio DL, Heilstedt-Williamson H, Gray TA, Tarle SA, Shelton DA, Tagle DA, Slightom JL, Goodman M, Collins FS (1992) Phylogenetic footprinting reveals a nuclear protein which binds to silencer sequences in the human gamma and epsilon globin genes. Mol Cell Biol 12: 4919–4929
Hardisty MW, Potter IC (1971) The Biology of Lampreys. Academic Press, London & New York
Hasegawa M, Thorne JL, Kishino H (2003) Time scale of eutherian evolution estimated without assuming a constant rate of molec-ular evolution. Genes Genet Syst 78: 267–283
Hubbs CL, Potter IC (1971) Distribution, phylogeny, and taxonomy. In “The Biology of Lampreys” Ed by MW Hardisty, IC Potter, Academic Press, London & New York, pp 1–66
International Chicken Genome Sequencing Consortium (ICGSC) (2004) Sequence and comparative analysis of the chicken genome provide unique perspectives on vertebrate evolution. Nature 432: 695–716
Jaillon O, Aury JM, Brunet F, Petit JL, Stange-Thomann N, Mauceli E, Bouneau L, Fischer C, Ozouf-Costaz C, Bernot A et al.(2004) Genome duplication in the teleost fish Tetraodon nigroviridis reveals the early vertebrate proto-karyotype. Nature 431: 946–957
Janke A, Arnason U (1997) The complete mitochondrial genome of Alligator mississippiensis and the separation between recent archosauria (birds and crocodiles). Mol Biol Evol 14: 1266–1272
Janvier P, Lund R (1983) Hardistiella montanensis n. gen. et sp. (Petromyzontida) from the Lower Carboniferous of Montana, with remarks on the affinities of the lampreys. J Vert Paleont 2: 407–413
Janvier P (1996) The dawn of the vertebrates: characters versus common ascent in the rise of current vertebrate phylogenies. Paleontology 39: 259–287
Janvier P (1997) The Tree of Life Project (URL: http://tolweb.org/Hyperoartia/14831)
Johnson DS, Davidson B, Brown CD, Smith WC, Sidow A (2004) Noncoding regulatory sequences of Ciona exhibit strong corre-spondence between evolutionary constraint and functional importance. Genome Res 14: 2448–2456
Jørgensen JM (1998) The Biology of Hagfishes. 1st ed, Chapman and Hall, London
Jørgensen FG, Hobolth A, Hornshoj H, Bendixen C, Fredholm M, Schierup MH (2005) Comparative analysis of protein coding sequences from human, mouse and the domesticated pig. BMC Biol 3: 2
Katoh K, Misawa K, Kuma K, Miyata T (2002) MAFFT: a novel method for rapid multiple sequence alignment based on fast Fourier transform. Nucleic Acids Res 30: 3059–3066
Kikuno R, Hayashida H, Miyata T (1985) Rapid rate of rodent evolu-tion. Proc Jpn Acad 61: 153–156
Kishino H, Miyata T, Hasegawa M (1990) Maximum likelihood infer-ence of protein phylogeny and the origin of chloroplasts. J Mol Evol 30: 151–160
Kishino H, Thorne JL, Bruno WJ (2001) Performance of a diver-gence-time estimation method under a probabilistic model of rate evolution. Mol Biol Evol 18: 352–361
Kumar S (2005) Molecular clocks: four decades of evolution. Nat Genet Rev 6: 654–662
Kumar S, Hedges SB (1998) A molecular timescale for vertebrate evolution. Nature 392: 917–920
Kuo CH, Huang S, Lee SC (2003) Phylogeny of hagfish based on the mitochondrial 16S rRNA gene. Mol Phylogenet Evol 28: 448–457
Kuraku S, Hoshiyama D, Katoh K, Suga H, Miyata T (1999) Mono-
phyly of lampreys and hagfishes supported by nuclear DNA-coded genes. J Mol Evol 49: 729–735
Kuraku S, Ishijima J, Nishida-Umehara C, Agata K, Kuratani S, Matsuda Y (2006) cDNA-based gene mapping and GC3 profil-ing in soft-shelled turtle suggest chromosome size-dependent GC bias shared by sauropsids. Chromosome Res 14: 187–202
Kuratani S, Kuraku S, Murakami Y (2002) Lamprey as an evo-devo model: lessons from comparative embryology and molecular phylogenetics. Genesis 34: 175–183
Kusakabe T (2005) Decoding cis-regulatory systems in ascidians. Zool Sci 22: 129–146
Lee WJ, Kocher TD (1995) Complete sequence of a sea lamprey (Petromyzon marinus) mitochondrial genome: early establish-ment of the vertebrate genome organization. Genetics 139: 873–887
Mallatt J, Sullivan J (1998) 28S and 18S rDNA sequences support the monophyly of lampreys and hagfishes. Mol Biol Evol 15: 1706–1718
McLysaght A, Hokamp K, Wolfe KH (2002) Extensive genomic duplication during early chordate evolution. Nat Genet 31: 200–204
Miyata T, Yasunaga T (1980) Molecular evolution of mRNA: a method for estimating evolutionary rates of synonymous and amino acid substitutions from homologous nucleotide sequ-ences and its application. J Mol Evol 16: 23–36
Miyata T, Hayashida H, Kikuno R, Hasegawa M, Kobayashi M, Koike K (1982) Molecular clock of silent substitution: at least six-fold preponderance of silent changes in mitochondrial genes over those in nuclear genes. J Mol Evol 19: 28–35
Musto H, Romero H, Zavala A, Bernardi G (1999) Compositional correlations in the chicken genome. J Mol Evol 49: 325–329
Nakai Y, Kubota S, Goto Y, Ishibashi T, Davison W, Kohno S (1995) Chromosome elimination in three Baltic, south Pacific and north-east Pacific hagfish species. Chromosome Res 3: 321–330
Nohara M, Nishida M, Manthacitra V, Nishikawa T (2004) Ancient phylogenetic separation between Pacific and Atlantic cephalo-chordates as revealed by mitochondrial genome analysis. Zool Sci 21: 203–210
Ohno S (1970) Evolution by Gene Duplication. Springer-Verlag, Ber-lin
Ota K, Kuratani S (2006) The history of scientific endeavors towards understanding hagfish embryology. Zool Sci 23: 403–418
Pancer Z, Amemiya CT, Ehrhardt GR, Ceitlin J, Gartland GL, Cooper MD (2004a) Somatic diversification of variable lympho-cyte receptors in the agnathan sea lamprey. Nature 430: 174–180
Pancer Z, Mayer WE, Klein J, Cooper MD (2004b) Prototypic T cell receptor and CD4-like coreceptor are expressed by lympho-cytes in the agnathan sea lamprey. Proc Natl Acad Sci USA 101: 13273–13278
Pancer Z, Saha NR, Kasamatsu J, Suzuki T, Amemiya CT, Kasahara M, Cooper MD (2005) Variable lymphocyte receptors in hagfish. Proc Natl Acad Sci USA 102: 9224–9229
Perler F, Efstratiadis A, Lomedico P, Gilbert W, Kolodner R, Dodgson J (1980) The evolution of genes: the chicken preproin-sulin gene. Cell 20: 555–566
Potter IC (1980) The Petromyzoniformes with particular reference to paired species. Can J Fish Aquat Sci 37: 1595–1615
Potter IC, Gill HS (2003) Adaptive radiation of lampreys. J Great Lakes Res 29: 95–112
Potter IC, Robinson ES (1971) The chromosomes. In “The Biology of Lampreys” Ed by MW Hardisty, IC Potter, Academic Press, London, pp 279–293
Potter IC, Rothwell B (1970) The mitotic chromosomes of the lam-prey, Petromyzon marinus L. Experientia 26: 429–430
Potter IC, Strahan R (1968) The taxonomy of the lampreys, Geotria

S. Kuraku and S. Kuratani1064
and Mordacia, and their distribution in Australia. Proc Linn Soc Lond 179: 229–240
Rasmussen AS, Janke A, Arnason U (1998) The mitochondrial DNA molecule of the hagfish (Myxine glutinosa) and vertebrate phy-logeny. J Mol Evol 46: 382–388
Rat Genome Sequencing Project Consortium (RGSPC) (2004) Genome sequence of the brown Norway rat yields insights into mammalian evolution. Nature 428: 493–521
Renaud CB (1997) Conservation status of northern hemisphere lampreys (Petromyzontidae). J Appl Ichthyol 13: 143–148
Robinson ES, Potter IC, Atkin NB (1975) The nuclear DNA content of lampreys. Experientia 31: 912–913
Saitou N, Nei M (1987) The neighbor-joining method: a new method for reconstructing phylogenetic trees. Mol Biol Evol 4: 406–425
Sanderson MJ (2002) Estimating absolute rates of molecular evolu-tion and divergence times: a penalized likelihood approach. Mol Biol Evol 19: 101–109
Sanderson MJ (2003) r8s: inferring absolute rates of molecular evo-lution and divergence times in the absence of a molecular clock. Bioinformatics 19: 301–302
Silver MR, Kawauchi H, Nozaki M, Sower SA (2004) Cloning and analysis of the lamprey GnRH-III cDNA from eight species of lamprey representing the three families of Petromyzoniformes. Gen Comp Endocrinol 139: 85–94
Springer MS, Murphy WJ, Eizirik E, O’Brien SJ (2003) Placental mammal diversification and the Cretaceous-Tertiary boundary. Proc Natl Acad Sci USA 100: 1056–1061
Stock DW, Whitt GS (1992) Evidence from 18S ribosomal RNA sequences that lampreys and hagfishes form a natural group. Science 257: 787–789
Suzuki T, Shin IT, Kohara Y, Kasahara M (2004) Transcriptome analysis of hagfish leukocytes: a framework for understanding the immune system of jawless fishes. Dev Comp Immunol 28: 993–1003
Takahashi A, Nakata O, Moriyama S, Nozaki M, Jos JMP, Sower SA, Kawauchi H (2006) Occurrence of two functionally distinct proopiomelanocortin genes in all modern lampreys. Gen Comp Endocrinol 148: 72–78
Takezaki N, Figueroa F, Zaleska-Rutczynska Z, Klein J (2003) Molecular phylogeny of early vertebrates: monophyly of the agnathans as revealed by sequences of 35 genes. Mol Biol Evol 20: 287–292
Takio Y, Pasqualetti M, Kuraku S, Hirano S, Rijli FM, Kuratani S (2004) Evolutionary biology: lamprey Hox genes and the evolu-tion of jaws. Nature 429: 1 p following 262
Thorne JL, Kishino H (2002) Divergence time and evolutionary rate estimation with multilocus data. Syst Biol 51: 689–702
Uchikawa M, Ishida Y, Takemoto T, Kamachi Y, Kondoh H (2003) Functional analysis of chicken Sox2 enhancers highlights an array of diverse regulatory elements that are conserved in mammals. Dev Cell 4: 509–519
Wu CI, Li WH (1985) Evidence for higher rates of nucleotide substi-tution in rodents than in man. Proc Natl Acad Sci USA 82: 1741–1745
Yang Z (1994) Maximum likelihood phylogenetic estimation from DNA sequences with variable rates over sites: approximate methods. J Mol Evol 39: 306–314
Yang Z (1997) PAML: a program package for phylogenetic analysis by maximum likelihood. Comput Appl Biosci 13: 555–556
Young JZ (1962) The Life of Vertebrates. 2nd ed, Oxford Univ Press, Oxford
Zhang Z, Gerstein M (2003) Of mice and men: phylogenetic foot-printing aids the discovery of regulatory elements. J Biol 2: 11
Zuckerkandl E, Pauling L (1962) Molecular disease, evolution and genetic heterogeneity. In “Horizons in Biochemistry” Ed by M Kasha, B Pullman, Academic Press, New York, pp 189–225
Zuckerkandl E, Pauling L (1965) Evolutionary divergence and con-vergence. In “Evolving Genes and Proteins” Ed by V Bryson, HJ Vogel, Academic Press, New York, pp 97–166
(Received May 1, 2006 / Accepted July 4, 2006)