time to recovery and its associated factors of under …
TRANSCRIPT
DEBRE BERHAN UNIVERSITY
COLLEGE OF NATURAL AND COMPUTATIONAL SCIENCE
POST GRADUATE STUDIES
DEPARTMENT OF STATISTICS
TIME TO RECOVERY AND ITS ASSOCIATED FACTORS OF
UNDER-FIVE PNEUMONIA PATIENTSADMITTED TO
PEDIATRIC WARD,DEBRE MARKOS COMPREHENSIVE
SPECIALIZED HOSPITAL, ETHIOPIA
By:
HABITAMU WUDU
A THESIS SUBMITTED TO THE SCHOOL OF GRADUATE STUDIES
OF DEBRE BERHAN UNIVERSITY IN PARTIAL FULFILLMENT OF
THE REQUIREMENTS FOR THE DEGREE OF SCIENCE IN
STATISTICS (BIOSTATISTICS)
JUNE, 2021
DEBRE BERHAN
ETHIOPIA

DEBRE BERHAN UNIVERSITY
COLLEGE OF NATURAL AND COMPUTATIONAL SCIENCE
POST GRADUATE STUDIES
DEPARTMENT OF STATISTICS
TIME TO RECOVERY AND ITS ASSOCIATED FACTORS OF
UNDER-FIVE PNEUMONIA PATIENTSADMITTED TO
PEDIATRIC WARD, DEBRE MARKOS COMPREHENSIVE
SPECIALIZED HOSPITAL, ETHIOPIA
By:
HABITAMU WUDU
A THESIS SUBMITTED TO THE SCHOOL OF GRADUATE STUDIES
OF DEBRE BERHAN UNIVERSITY IN PARTIAL FULFILLMENT OF
THE REQUIREMENTS FOR THE DEGREE OF SCIENCE IN
STATISTICS (BIOSTATISTICS)
ADVISOR: AYELE ADMASU (ASSISTANT PROFESSOR)
JUNE, 2021
DEBRE BERHAN
ETHIOPIA

DECLARATION
I, the undersigned, declare that the thesis is my original work, has not been presented for degrees
in any other University and all sources of materials used for the thesis have been duly
acknowledged.
Name HabitamuWudu
Signature __________
This thesis has been submitted for examination with my approval as a University advisor
AyeleAdmasu(Assistant Professor) __________ __________
Name of advisorSignature Date

APPROVAL SHEET
We, the undersigned member of the broad examiners of the final open defense by
HabitamuWudu have read and evaluated his thesis entitled ―Time to Recovery and Its
Associated Factors of Under-Five Pneumonia Patients Admitted to Pediatric Ward,
Debre Markos Comprehensive Specialized Hospital, Ethiopia‖ and examined the
candidate. This is therefore to certify the thesis has been accepted in partial fulfilment of the
requirement for the degree of master of sciences in statistics with specialization of
biostatistics.
_______________________ _________________ __________
Name of Advisor Signature Date
__________________ _________________ __________
Name of External examiner Signature Date
__________________ _________________ __________
Name of Internal examiner Signature Date
__________________ _________________ __________
Associate Dean, College Res/CS& Postgraduate Signature Date
__________________ _________________ ______
Dean collage of Graduate Studies Signature Date
Final approval and acceptance of the thesis is contingent up on the submission of the thesis of
the final copy of the thesis to the college of graduate studies (CGS) through the department of
graduate committee (DGC) of the candidate‘s
Stamp of CGS Date _______

i
ACKNOWLEDGMENTS
First and foremost, praises and thanks to the almighty God, for His showers of blessings
throughout my life. Also my deepest gratitude goes to AyeleAdmasu (Assistant Professor),
my advisor and instructor, for his constructive comments, encouragement, tireless follow-ups
that make this work a reality, for his valuable advice, professional guidance, useful comments
and suggestions. I am extremely grateful for what he has offered me.
My deepest thanks go to all members of Debre Berhan University, instructors and all
individuals in the Department of Statistics for their moral support and positive attitude when I
needed them during my course study. I am also thankful for all my friends and colleagues
whoever explicitly or implicitly backed my work in whatsoever means.
And finally, I would like to thank heart fully Debre Markos comprehensive specialised
hospital for collecting the data precisely with decent.

ii
TABLE OF CONTENTS
CONTENTS PAGE
ACKNOWLEDGMENTS .......................................................................................................... i
TABLE OF CONTENTS .......................................................................................................... ii
LIST OF TABLES ..................................................................................................................... v
LIST OF FIGURES .................................................................................................................. vi
LIST OF ABBREVAITIONS .................................................................................................. vii
ABSTRACT ............................................................................................................................. viii
1. INTRODUCTION ................................................................................................................. 1
1.1. Background of the Study ................................................................................................. 1
1.2. Statement of the Problem ................................................................................................ 3
1.3. Objectives of The Study .............................................................................................. 4
1.3.1. General Objective of The Study ............................................................................... 4
1.3.2. Specific Objectives ................................................................................................... 4
1.4. Significance of The Study ............................................................................................... 5
1.5. Limitation of The Study .................................................................................................. 5
1.6. Operational Definition..................................................................................................... 5
2. RELATED LITERATURE REVIEW ................................................................................... 6
2.1. An Overview of Pneumonia ............................................................................................ 6
2.2. Survival Time of Under-Five Pneumonia Patients From Related Litertures. ................. 7
2.3. Determinant Factors of The Survival Status of Pneumonia Patients .............................. 7
2.3.1. Socio Demographic and Socio-Economic Factor ..................................................... 7
2.3.2. Clinical (Treatment) Factor .................................................................................... 11
3. DATA AND METHODOLOGY ......................................................................................... 14
3.1. Study Area and Period................................................................................................... 14
3.2. Study Design ................................................................................................................. 14
3.3. Source of Data and Data Collection Procedure ............................................................. 14

iii
3.4. Inclusion and Exclusion Criteria ................................................................................... 15
3.5.Study Variables .............................................................................................................. 15
3.5.1.Response Variables.................................................................................................. 15
3.5.2.Independent Variables ............................................................................................. 15
3.6. Method of Data Analysis............................................................................................... 16
3.7. Survival Data Analysis .................................................................................................. 17
3.7.1. Survival Function ................................................................................................... 18
3.7.2. Hazard Function ..................................................................................................... 18
3.7.3. Median Survival Time ................................................................................................ 18
3.8. Nonparametric Survival Methods ................................................................................. 19
3.9. Semi-Parametric Cox Proportional Hazard Model ....................................................... 19
3.10. Accelerated Failure Time Model................................................................................. 22
3.11. Method of Variable and Model Selection ................................................................... 26
3.11.1. Method of Variable Selection ............................................................................... 26
3.11.2. Method of Model Selection .................................................................................. 26
3.12. Model Assessment....................................................................................................... 27
3.12.1. Proportional Hazard Assumption Checking ......................................................... 27
3.12.2. Checking the Adequacy of Parametric Baselines ................................................. 28
3.12.3. Using Residual Plots ............................................................................................. 29
3.13. Ethical Consideration .................................................................................................. 30
4. STATISTICAL DATA ANALYSIS AND RESULTS ....................................................... 31
4.1. Descriptive Statistics ..................................................................................................... 31
4.2. Non parametric survival analysis .................................................................................. 34
4.2.1. Survival Characteristics of Time to Recovery of Pneumonia Data Set .................. 34
4.2.2. Survival Time-To-Recovery for Different Groups of Predictors ........................... 35
4.2.3. Comparison of Survival time (Long Rank Test) .................................................... 36
4.3. Cox Proportional Hazard Regression Model ................................................................ 38

iv
4.3.1. Uni-variable Analysis of Cox proportional Hazards Model ................................... 38
4.3.2. Multi-variable Analysis of Cox proportional Hazards Model ................................ 38
4.4. Examined Assumptions of Proportional Hazard Model ............................................... 40
4.5. Accelerated Failure Time (AFT) Model ....................................................................... 42
4.5.1.Multivariable Analysis and Model Comparison ...................................................... 42
4.6. Model Diagnosis ........................................................................................................... 43
4.6.1. Checking Adequacy of ParametricBaselines Using Graphical Methods ............... 43
4.6.2. Cox-Snell Residual Plot.......................................................................................... 44
4.7. Results From AFT Model ............................................................................................. 45
5.DISCUSSION,CONCLUSIONS AND RECOMMENDATION ......................................... 47
5.1. Discussion ........................................................................................................................ 47
5.2. Conclusion ..................................................................................................................... 49
5.2. Recommendation ........................................................................................................... 50
REFERENCE ........................................................................................................................... 51
APPENDIXES ......................................................................................................................... 57

v
LIST OF TABLES
Table 3.1: variable description & coding for explanatory variables ........................................ 16
Table 3.2: Graphical checking for goodness of fit for parametric survival models. ............... 29
Table 4.1: Descriptive summary of pneumonia patients at DMCSH ……………………….32
Table 4.2: Median time to recovery and long-rank test by predictors ..................................... 37
Table 4. 3: candidate covariates using backward selection method ........................................ 39
Table 4.4: candidate covariates using forward selection method ............................................ 39
Table 4.5: Final multi-variable Cox Proportional Hazard Modal ........................................... 39
Table 4.6: Test of proportional hazards assumption for pneumonia patient dataset ............... 41
Table 4.7: AIC, BIC and log likelihood of the candidate parametric models ......................... 43
Table 4.8: the likelihood ratio and significance of the Log- logistic AFT model ................... 44
Table 4.9: Summary result of the final Log-logistic AFT model of pneumonia patients ........ 46

vi
LIST OF FIGURES
Figure 4.1: discharge status of sever pneumonia patient‘s data set at DMCSH ...................... 34
Figure 4.2: The K-M plot of survival and hazard function of pneumonia patient‘s data set ... 34
Figure 4.3: K-M survival plot by pneumonia type and danger sign of pneumonia patients.... 35
Figure 4. 4: K-M survival plot by insurance status and treatment type of pneumonia patient36
Figure 4.5: graphical method for PH assumption by pneumonia type .................................... 41
Figure 4.6: Log-logistic baseline distributions plot of pneumonia patient .............................. 44
Figure 4.7: Cox- Snell residuals plots of log-logistic baseline distribution ............................. 44

vii
LIST OF ABBREVAITIONS
AIC Akaike information Criterion
AIDS Acquired Immune Deficiency Syndrome
ARTI Acute Respiratory Tract Infections
BIC Bayesian information Criterion
CAP Community acquired pneumonia.
CHERG Child Health Epidemiology Reference Group
DMCSH Debre Markos comprehensive specialized hospital
HAP hospital acquired pneumonia
IQR Inter Quartile Range
K-M Kaplan-Meier
LMIC Low and middle income countries
PH Proportional hazard
SAM Severe acute malnutrition
SCAP Severe Community Acquired Pneumonia
SSNPR Southern Nations, Nationalities, and Peoples' Region
UNICEF United Nations Children‘s Fund
U5M Under-five children mortality
WHO World Health Organization
AHR adjusted hazard ratio

viii
ABSTRACT
Pneumonia is described as the inflammation of parenchymal structures of the alveoli and the
bronchioles (lungs). In Ethiopia, it is a leading single disease killing under-five childrenand
it continous a Major health problem. The study aimed to identify determinant factors that
affect time to recovery of under- five pneumonia patients at Debre Markos Comprehensive
Specialized Hospital.a hospital based cross-sectional study design was employed at Debre
Markos comprehensive specialized hospital.The data was collected in patient’s chart from
September 2018 to September 2020.Data was entered and analyze using STATA version 14.2
and R 3.4.0 statistical software. The Kaplan Meier survival curve and log rank tests were
used to compare the survival time. Cox proportional hazard model assumption and model
fitness were checked.the parametric AFT models were used to identify factors associated with
the recovery time of Pneumonia patients. All the fitted models were compared by using AIC
and BIC.The log-logistic AFT model was fitted as a final model. Accelerated factor ( ) with
its 95% confidence interval was used and P-value < 0.05 was considered as statistically
significant association. The overall median recovery time was 5 days (95% CI (4-6)). Time
elapsed to seek care ( ; 95% CI (1.237-1.274)), being insured ( =0.904; 95% CI
(0.845-0.967)) and treatment type taken at the time of diagnosis ceftriaxone, ampicillin and
combined ( 0.833; 95% CI (0.810 - 0.92), 0.842; 95% CI (0.759-0.933) and
0.912; 95%CI (0.842- 0.986) respectively) were significant predictors for shorten timing of
recovery. Parents or care takers should take their children to health facility immediately
when they become ill.
Key words:-Pediatrics,Unde-Five,Severe Pneumonia, Time to Recovery

1
1. INTRODUCTION
1.1.Background of the Study
Pneumonia is described as the inflammation of parenchymal structures of the alveoli and the
bronchioles (lungs) (Higgins-Steele et al. 2017).Lung infection is classified by the causative
organism as lobar pneumonia, bronchial pneumonia and acute interstitial pneumonia.
Pneumonia is most commonly classified by where or how it was acquired. Community-
acquired pneumonia (CAP) is an infection that begins outside the hospital and/or diagnosed
within 48 hours after admission to the hospital. Whereas, hospital-acquired pneumonia occurs
in more than 48 hours after admission and without any antecedent signs of infection at the
time of hospital admission (Geleta et al, 2016).It can be caused by bacterial, viral, or parasitic
infection as well as by non-infectious agents and the most severe cases of pneumonia is
caused by bacteria, of which the most important are Streptococcus pneumonia
(pneumococcus) (Aboubaker et al. 2015).
The burden of medical response to pneumonia has significant challenges. Also comorbid
conditions like Malaria, TB, HIV/AIDS and risk factors like danger sign, insurance status,
residence etc. commonly appear in pneumonia patients which leads to define the severity and
risk scores of the disease in which used for clinicians to make care self-site decision as in-
patients or out-patients(Ramirez and Anzueto, 2011).Optimal management of these
comorbidities may increase survival condition and reduce length of hospitalization among
hospitalized patients. Then identifying determinants influencing survival of hospitalized
pneumonia patients is critical for optimal utilization of scare resources, appropriate
management and minimize child mortality (Premnath, Jana et al. 2012).
The mortality rates of children under the age of five years in most developing countries
ranges from 60 to 100 per 1000 live births, one fifth of these deaths are due to pneumonia
(WHO, 2016). The incidence of pneumonia in children under the age of five years is 0.29
episodes per child year, which equates 151.8 million cases annually in developing countries,
a further 4 million cases occur in developed countries. Fifteen countries contribute 74% of
the world's annual pneumonia cases (Rudan I, 2008). And also According to estimates from
the World Health Organization Pneumonia kills about 2,500 children every day and more
than 150 million cases of pneumonia occur in children under-five in each year, of which 20
million cases require hospitalization (Leung, 2016).

2
Morbidity and mortality from pneumonia is greater in low and middle income countries
(LMIC). An estimate from the Child Health Epidemiology Reference Group (CHERG) puts
the total number of pneumonia deaths worldwide in children under-five at 935,000 (Liu et al.,
2016). Sub-Saharan Africa takes the lead in having half of its under-five deaths resulting
from pneumonia compared to other regions. Also, regional disparities exist in the percentage
of under-five deaths resulting from pneumonia with 5% of deaths occurring in developed
regions and 17% of deaths in Sub-Saharan Africa (Liu et al., 2016).The African Region has,
in general, the highest burden of global child mortality. It has about 45% of global under-5
deaths and 50% of worldwide deaths from pneumonia in this age group (World health
statistics, 2007). By contrast, less than 2% of these deaths take place in the European Region
and less than 3% in the Region of the Americas.
According to 2012 central statistical agency report there is high burden of pneumonia in
Ethiopia that is 88 in 1,000 children under age 5 die before their fifth birthday (CSA, 2012).
Acute respiratory infection (ARI), and particularly pneumonia, accounts for 18% of death in
Ethiopia; improving early care is a key strategy for early diagnosis and treatment (UNICEF,
2014). Integrated management of common childhood illness and community case
management are among the program initiatives scaled up nationally to address ARI (Miller et
al., 2014)
It is the leading cause of morbidity and mortality among children below five years of age in
Ethiopia, with an approximately 3,370,000 children experiencing pneumonia every year that
attributes to 18% of all causes of deaths and killing more than 40,000 under five-children
annually, making it the number one cause of death during the postnatal period as well
(Wardlaw et al., 2014).In Ethiopia, pneumonia continues to be the major infant problem and
killer (Andualem et al., 2020).
Several studies were tried to use statistical models like Binary logistic regression model and
multilevel logistic regression models to identify the determining factors of the mortality
status of pneumonia and about the prevalence of the pneumonia. The studywas use time to
recovery as response variable to identify associated factorsof survival time of under-five
pneumonia patients;Survival analysis is a statistical method for data analysis where the
outcome variable of interest is the time to the occurrence of an event. The semi-parametric
and parametric survival models were used to fit the survival time of pneumonia patients.

3
Kaplan Meier curves and log rank test were used to compare the survival experience of
different category of patients, Cox PH model and Accelerating failure time (AFT) models
wereused to fit dataset. Parametric survival models are statistically more powerful than
nonparametric or semi-parametric models (Klein, 2005). A survival analysis helps us to
understand the distribution of failure time which is often described by using Weibull, Log-
logistic and lognormal distributions. Therefore, the aims of this studywere to investigate the
survival time of under-five children hospitalized due to pneumonia and identify associated
factors with under-five children survival time due to pneumoniaobserved at Debre
MarkosComprehensive Specialized Hospital.
1.2.Statement of the Problem
Around the world, significant efforts have been made to minimize pneumonia-related
morbidity and mortality. However, the main difficulty is the increasing duration of stay in the
hospital and the poor response to antibiotic treatments, which has resulted in a decrease in
pneumonia patient survival (Opio, 2018).
In 2016 United Nations Children‘s Fund (UNICEF) reported that there is 1 out of 6 childhood
deaths were due to pneumonia globally in 2015 (UNICEF, 2016). In Sub-Saharan Africa, the
proportion of deaths due to pneumonia in children younger than five year is 17-26 percent
(Black E, et al, 2003). Nearly 50% of pneumonia deaths take place in only six densely
populated and poorest countries: India, Nigeria, Democratic republic of Congo, Pakistan,
Angola and Ethiopia (UNICEF, 2014).In Ethiopia, pneumonia is a leading single disease
killing under five children and it contributes about 18% of all cases (3,370,000) of under five
deaths compared to diseases like diarrhea, AIDS, malaria and measles every year (Walker et
al., 2013; Peterson et al, 2019).
Many studies on the prevalence and risk factors of pneumonia have been conducted using
logistic regression, and some studies have employed the Cox proportional hazards model
with death as the outcome. (Tessema, 2018; Andualem et al., 2020 ; Abate and Tadesse,
2019). .However Logistic regression does not account the censoring observations. Despite the
fact that semi-parametric estimate provides more flexibility, parametric estimate is more
powerful provided the baseline hazard's form is known in advance.(Munda et al., 2012).
Recent studies provide insight on the socio-economic and clinical predictors of mortality and
survival of pneumonia patients (Mitiku, 2019). However, these studies were conducted by
4
using semi-parametric model and not including some set of variables like micronutrient
deficiency, SAM (sever acute malnutrition), types of pneumonia and season of
diagnosis.Time to recovery and its associted factor of under-five children‘s hospitalization
related to severe pneumonia patients is not well known. So, determining associated factors of
recovery time of pneumonia patients whose age is under five years are essential. Therefore,
this study focus the analysis of time to recovery, which factor is significantly affects the
recovery time of under-five pneumonia with appropriate survival model for the dataat Debre
Markos Comprehensive Specialized Hospital, Ethiopia by adding additional variables that
affects the survival status of under-five pneumonia patient like types of pneumonia, sever
acute malnutrition, Micronutrient Deficiency (such as zinc, vitamin D, vitamin A, etc) and
seasons of diagnosis.
Generally, this study has attempted to answer the following basic research questions.
1. What is the median recovery time of under-five pneumonia patients?
2. Which variables are significantly associated with time-to- recovery from pneumonia?
3. How do you compare the survival curves of patients' recovery times across different
levels of covariates?
4. Which predictor has high survival Experience among different level of factors?
1.3. Objectives of The Study
1.3.1.General Objective of The Study
The aim of this study is to identify determinant factors that affecttime to recoveryof
under- five pneumonia patients at Debre Markoscomprehensive specialized Hospital.
1.3.2. Specific Objectives
To estimate survival median survival time.
To assess the effect of predictive factors associated with time to recovery of under-
five pneumonia patients in Debre MarkosComprehensive Specialized hospital.
To compare the survival probabilities of the under-five pneumonia patients with
respect to Different risk factors.

5
1.4. Significance of The Study
The results of this study will beneficial for determining the determinant factors of the
recovery time of under-five pneumonia patients for concerned bodies like pediatrician,
patients for taking service, ministery of health and goverments , it also had great contribution
for the patient and the heath professionals for follow up to reduce the time to recovery from
theirillnes, List out the most predictive factors affecting the recovery time of under-five
pneumonia patients and will provide base-line data for detail and further studies in the future,
and investigate the median time taken of recovering from pneumonia disease.
1.5. Limitation of The Study
Because the study was based on secondary data and was conducted retrospectively by
reviewing patients' charts, some variables, such as parental socio-demographic, socio-
economic, and environmental characteristics, as well as other variables that could be potential
predictors of the outcome variable, were left out. and there were a lot of patients with
insufficient information; limited of published literature on the country related to associated
factors on time to recovery of under-five pneumonia patients.
1.6.Operational Definition
Recovery:children discharged/ declared by the clinician as improved from an illness.
Event: recoveryfrom an illness during the study period.
Survival time:defined as the time starting from the date of admission to recovery as a result
of improvement due to sever pneumonia determined for each participant.
Censored: children referred, died or discharged for any reason without recovery during the
study period.
Paediatric: Children whose age is above 1 months and below 5 years were pediatrics in our
study.
6
2.RELATED LITERATURE REVIEW
2.1.An Overview of Pneumonia
Pneumonia is defined as an inflammation of parenchymal tissues of the lung, such as the
alveoli and the bronchioles(Porth, 2011). It's a lung infection caused by an acute respiratory
tract infection (ARTI).Small air sacs called alveoli fill up with air during normal breathing.
When kids get pneumonia, their alveoli fill up with pus and fluid, making breathing difficult
and uncomfortable. (UNICEF and UNICEF, 2016). The patient's normal growth and
development are affected by longer hospital stays and a longer time to clinical stability
(recover from illness).Additionally,Parents and caregivers waste time caring for their
children, and it has become a significant financial burden for families, communities, and
governments. The increased financial burden may be borne by the government as majority of
the patients come from poor rural families relying on government health care services (Ma,
Gunaratnam et al, 2019).
Pneumonias can be classified based on the type of agent causing the infection, distribution of
the infection and setting in which it occurs (Porth, 2011). The etiologic agents of pneumonia
could be infectious or non-infectious agents. Commonly pneumonias classified as
community-acquired and hospital-acquired (nosocomial) pneumonia. Community-acquired
pneumonia (CAP) is an infection that begins outside the hospital or is diagnosed within 48
hours after admission to the hospital in a person who has not resided in a long term care
facility for 14 days or more before admission(Geleta et al., 2016). Hospital-acquired
pneumonia is pneumonia that occurs more than 48 hours after admission and without any
antecedent signs of infection at the time of hospital admission (Kieninger and Lipsett,
2009).It is also known as a nosocomial infection (from the Greek nosos, meaning disease,
andkomide, care), is an infection that is acquired in a hospital or other health care facility.It
refers to any pneumonia contracted by a patient in a hospital at least 48–72 hours after being
admitted. In related to pneumonia type,HAP can have negative consequences for patients,
including prolonged hospital stay, decreased quality of life and high mortality(Torres et al.,
2017).Despite improvements in prevention, antimicrobial therapy and supportive care (Kalil
et al., 2016).HAP(nosocomial) remains an important cause of morbidity and mortality and the
mortality rate for HAP ranges from 38% than 70% than community acquired pneumonia
(Laessig, 2010).
7
2.2. Survival Time of Under-Five Pneumonia Patients From Related
Litertures.
According to the results of a study conducted at Bushulo Major Health Center, 75.5 percent
of patients recovered from their illnesses(Zinabu et al., 2014).The global, regional, and
national causes of child mortality reports that 73.3 percent of pneumonia patients were
recovered (Li Liu, 2012).In a previous research of hospitalized young Nepalese children with
acute severe pneumonia, the median duration to recovery was reported to be two
days.(Basnet, Sharma et al. 2015).Also, in Taiwan, the mean time to recovery after admission
for patients with pneumonia was 6.4 days (median = 5 days; range = 0 to18 days)(Huang,
Chang et al. 2015).In three university teaching hospitals in Boston-USA, a study on length of
time until a patient hospitalized with pneumonia becomes clinically stable(recover) estimated
the median hospital length of stay at 6 days (C.I, 4-10 days )(Mueller, Zheng et al. 2019),the
study conducted by(Assfaw et al., 2021) shows that the the average time to recovery was 3
days.In 2013, researchers conducted a study in Mulago hospital to compare clinical outcomes
in children suffering from Asthma and Pneumonia, the average duration of hospital stay was
4 days (SD 4.3 days). Children with pneumonia had the longest duration of hospital stay
compared to those with Asthma (Nantanda, Ostergaard et al. 2014).According to a study
conducted in South West part of Ethiopia at Jimma the median duration of hospital stay was
less than 3 days(Bekele, Sinaga et al. 2017),Other study conducted at south west Ethiopia
shows that the median recovery time was 4 days(Abate and Tadesse, 2019). The study
conducted in rural health centre of Gambia reported that the median time of recovery was 4.5
days(Kuti, Adegoke et al. 2014). According to (Wolf, Edwards et al. 2016) and (Gajewska et
al., 2016) the median recovery time from pneumonia was 2.3 days and 10.1 to 8.2 days
respectively.
This shows that the treatment response to pneumonia is still low and patients‘ survival
remains a challenge to health and development in Ethiopia and worldwide.
2.3.Determinant Factors of The Survival Status of Pneumonia Patients
2.3.1.Socio Demographic and Socio-Economic Factor
As we saw different studies, there are several socio-demographic & socio economic factors
that affect the prevalence, mortality status and survival status of under-five pneumonia
8
patients. Such as age of the patient (Opio 2018), ,Breastfeeding status of the patient (Wolf,
Edwards et al. 2015, Opio 2018),Education level of mothers, Smoking habit of parents(Abdel
Mohsen, Amin et al. 2019),sex, residence, sever acute malnutrition (SAM) and seasons of
diagnosis ,health insurance and duration.
Accordingly Age of patients, a birth cohort study in Cape Town, South Africa, indicated that
the majority of the pneumonia burden among children is within the first 2 years of life
(Campbell and Nair, 2015). And the results of their study indicated that severe pneumonia
accounts for the most pneumonia deaths in the first 6 months of life. Similarly, other scholars
around the globe have found that children less than 59 months are most at risk age-group
(Opio 2018).Based on these findings; age remains subject to further assessment to confirm
whether it matters as far as survival time of patients are concerned. This relationship of
increased pneumonia cases in younger ages has also been long-established by the study in
South West Ethiopia, children in the age group 1-11 months were more exposed to
pneumonia than other age groups, Considering age groups included in this study 49.82%, of
patients were from age group 1-11 months, and the death proportion for this age group were
44.68% (Abate, 2018)if patients are postnatal and child age than those patients in neonatal
age group. Accordingly, the risk of dying from pneumonia for postnatal age group and child
age Group patients was less by 91 and 92% respectively.The rate of recovery early from
pneumonia decreased by 6% (AHR; 0.94, 95% CI (0.90-0.98)).Another study also indicated
younger children recover sooner than older ones (Mitiku, 2019), age (2–3-years) (AHR, 1.4,
(95% CI: 1.31–2.22)), and ≥4-years (AHR, 1.32, (95% CI: 1.3–2.32)) as compared to age of
≤1 year were important factors ofrecovery time (Assfaw et al., 2021).This study considered
age as categorical predictor to find its effect on the recovery time of patients.
The survival of sex differences has been inconsistent according to various studies (Ley,
Collard et al. 2011). (Demographic, 2012) found sex has no significant difference Whereas
some studies show sex differences in pneumonia patients found that female sex to confer a
significant survival advantage, other studies have consistently agreed that female patients
have greater risk of dying from pneumonia than male patients (Huang, Chang et al. 2015).It is
therefore debatable whether sex of a patient influences survival time of pneumonia patients or
not in a substantial manner.The estimated acceleration factor for male patient is estimated to
be 0.878 with (95% CI: 0.782, 0.987). This indicates that male patients have less survival
time (time to death) than female patients or in the other way female patients survived 12.2%

9
longer than male patients (Abate and Tadesse, 2019).This study used sex as predictor variable
to find its significant effect on the survival time.
Related to residence, some scholars suggested that both urban and rural residence has its own
impact on survival time of under-five pneumonia (Azab, Sherief et al. 2014).The acceleration
factorsfor patients whose residence was urban were estimated to be 1.158 with (95% CI:
1.010, 1.328).This indicates that patients whose residence was urban had prolonged death
timing than patients from rural residence at 5% level of significance (Abate and Tadesse,
2019).Also Study conducted at Jimma University specialised Hospital reported that among
the children males accounted for 54.2% of the children and children suffering from severe
pneumonia in rural area accounted for 79.4% compared to children in urban area (20.6%)
(Firaol B, 2017).
Exclusive breastfeeding is considered both a preventive and curative strategy among children
younger than two years. WHO, public and private health workers, have consistently
advocated for exclusive breastfeeding at least for the first 6 months of a child‘s life. The
general consensus of many scholars is that, lack of exclusive breastfeeding increases the risk
of both upper and lower respiratory tract illness, increasing risk of development of severe
pneumonia by 1.5 to 2.6 times. Concerning breastfeeding, many scholars agree that exclusive
breastfeeding for the first 6 months of life increases child survival by reducing the length of
hospital stay and also reducing risk of treatment failure (Wolf, Edwards et al. 2015).
Related to age of mothers, (Azab, Sherief et al. 2014, Aftab, Ejaz et al. 2016) show that age
of mothers have significant effect on child pneumonia. Children with teenage mothers were
more likely to have severe CAP compared to those born to older women (P < 0.01). Based on
smoking habit of parents, previous studies have shown that children whose parents smoke
have a higher risk of contracting severe pneumonia and being hospitalized (Perlroth and
Branco 2017).
Related to season of diagnosis, Patients admitted throughout the summer and spring seasons
had a higher risk of dying from CAP than those admitted during other seasons, according to a
study conducted in Hawassa City on under-five-year-old mortality(Tariku T., 2017).
According to study conducted in ten district Hospitals in Malawi classified the season in to
Quarters as July-September, October-Dec, Jan-March and April-June Generally the pattern
of pneumonia cases does not vary between the seasons in Malawi except in January through
10
March and slightly peaks up again in the cool/dry season June and July. January through
March coincides with the rainy season where there is a peak for both malaria and
malnutrition (Ellubey R., 2004). Altitude, annual rainfall, number and nature of the seasons
and average monthly temperatures are the factors listed by CHERG as factors of under-five
pneumonia (Fischer W., 2013). And also other study conducted at southern Israel Hospital
reported that the prevalence of the CAP and nosocomial pneumonia were higher in the spring
and summer season compared to that of winter and autumn (Lieberman D and PorathA,
2005). Seasonality is another possible risk factor identified by (Rudan I, 2008), likely related
to seasonal viruses including influenza. Season of diagnosis, are a predictive (a statistical
significant) predictors for the mortality status (dead/alive) of patient‘s due to pneumonia
(Tessema, 2018). It shows that, the odds of being at risk to death during spring season were
7.54 times more likely than patient‘s diagnosed in winter season.There is less likely to die
from pneumonia,Patients diagnosed at spring season and summer season acceleration factor
were 0.845 and 0.813 with (95% CI: 0.720, 0.991 and 0.683, 0.966) respectively. And p-
values were small (p=0.003 and 0.001) respectively. Patients who were diagnosed at spring
and summer season had less survival time (time to death)than patients who was diagnosed at
autumn season (Tadesse, 2019)and related to SAM Patients who were not suffered severe
acute malnutrition (SAM) had longersurvival time than patients who were suffered severe
acute malnutrition (SAM). (Abate et al 2019, Miller, 2014). the presence of severe acute
malnutrition can increase mortality from pneumonia 15-fold (Mishra Pet al,2016).
Related to time elapsed to seek care (duration), Duration prior to seeking care is an
independent significant predictor for recovery time of pneumonia. Children who presented to
the hospital early (before five days of an illness) recovered sooner than those children
presented lately (Mitiku, 2019).This finding is consistence with a prospective study
conducted in Gambia (Kuti et al., 2014). Andother study shows that, it was found that
Patients who late diagnosis has high probability of being at risk than those admitted before 3
days. The odds of being at risk for patients who diagnosed after a week is 8.71 times than
those patients diagnosed before three days. The odds of being at risk for patients who
diagnosed with 4 to 7 days was also 4.74, which means the risk of dying from pneumonia if
patients diagnosed between these days was 4.74 times than those diagnosed before three
days(Tessema, 2018).In related to health insurance, Previous studies generally show that lack
of health insurance is associated with an increased risk of death in the intensive care unit
(ICU) (Lyon et al., 2011).National health insurance membership is associated with increased

11
access to and utilization of health care (Sarpong et al., 2010) and children were not member
of social health insurance were more exposed than children‘s were member of social health
insurance (Mitiku, 2019).
2.3.2.Clinical (Treatment) Factor
The clinical characteristics associated with survival time of hospitalized pneumonia patients
were; respiratory rate (Basnet, Sharma et al. 2015),baseline condition at admission (Opio
2018), danger signs such as head nodding, abnormal body movement, breathless(Huang,
Chang et al. 2015),baseline comorbidity (like measles, malaria, etc), treatment type among
others,Past history of ARTI(Onyango D et al,.2012).
Inrelated to danger sign on survival time of pneumonia patients, many studies have been
carried out, some of which explains mortality and some are explained length of hospital stay.
For example, studies by (Opio, 2018). Shows that patients with danger sign had short survival
times at all times,generally many scholars agree that danger sign at baseline reduce survival
time which then increases the risk of mortality among pneumonia patients (Wolf, Edwardset
al. 2015). The recovery rate of children who were admitted with danger sign reduced by 39%
than those admitted without danger sign (AHR; 0.61, 95% CI ((0.40-0.94)). (Mitiku, 2019)an
d in related to past history of ART patients many studies have been carried out the effects of
past history of ARTI on the mortality status and prevalence of pneumonia. The study
condacted in western kenia shows that children who had past history of ARTI were 2.77
times more likely to devlop pneumonia compaired to those who had no ARTI(Onyango D et
al,.2012).An other study conducted by(Fentahun A,2019) also indicates children who had
past history of ARTI were 4.11 times more likely to devlop pneumonia compaired to those
who had no ARTI
In related to micronutrient deficiency, In Iran, 43 percent of the 200 children were admitted
to Children's Medical Centre that were diagnosed with radiologic rickets, were also suffering
from bronchopneumonia. Therefore, vitamin D deficiency may be an important factor
predicts pneumonia in children less than 5 years in developing countries.(El Basha, Noussa
Mohsen et al,2014) The role of vitamin A in the growth and development of cells and tissues
(especially in respiratory epithelial cells and lung tissue) is essential. Vitamin Adeficiency is
associated with inflammation and infection in children and the severity of the infection
(Roomaney RA et al, 2016). Zinc deficiency to be associated with increased risk of infection,
12
particularly pneumonia. Similarly, Studies conducted in US & Pakistan reported the
reduction of pneumonia incidence and prevalence among children who received
zincsupplementation (Lassi ZS, Haider BA et al, 2010).astudy conducted by (Fentahun
A,2019) indicates children who had Microneutriant deficiency were 3 times more likely to
devlop pneumonia than children who had no microneutriant deficiency.
On the manner of comorbidity, many scholars have identified significant relationship
between increased mortality and any underlying illness. The common identified
comorbidities are malaria, diarrhea, HIV/AIDs, and TB (Reed, 2015).Comorbidity has
significant effect on the survival status of pneumonia patients. The acceleration factor for
patients suffered comorbidity was estimated to be 0.881 with (95% CI: 0.640, 0.916). This
implies that patients who were not suffered co-morbidity had longer survival time than
patients who were suffered co-morbidity(Abate and Tadesse, 2019, Miller, 2014).but this
study use time to death not time to recovery.Co-morbidity was an independent predictor of
recovery time from sever pneumonia among paediatrics and the rate of recovery among
children admitted with co-morbidity decreased by 55% as compared to those children who
had not co-morbidity at admission (AHR; 0.45, 95% CI ((0.45(0.35-0.58)) (Mitiku, 2019).
And this study did not quantify the impact of Types of pneumonia, Sever Acute malnutrition,
micro nutrient deficiency and season of diagnosis on time to recovery of under-five
pneumonia patients. Therefore, by inserting those variables a survival model were conducted,
which study about the time to recovery of under-five pneumonia patients in Debre Markos
Comprehensive specialized hospital, Ethiopia.
In case of Treatment type, Study conducted at Mozambican reported that children with severe
pneumonia or suspected bacteraemia/sepsis, empirical antimicrobial therapy with parenteral
chloramphenicol or a combination of penicillin plus gentamicin was given. Studies example
(Mitiku, 2019).Shows that, all children who were treated as an inpatient, more than half
(59.66%) received Crystalline penicillin followed by ceftriaxon (33.24%) and only (7.1%) of
children treated by ampicilin withgentamicin. Majority of children (89%) recovered from
their illness and 11% were died. But, Study conducted at Wondo Genet district, Sidama zone
using multivariable logistics regression reported that treatment types taken by pneumonia
patients at hospital levels has not significantly associated with mortality status under-five
children (Teshome A., 2017).There are multiple antibiotics indicated and effective in the
treatment of pneumonia. Administration of the most appropriate antibiotic as a first-line
13
medicine may improve the outcome of pneumonia. In order to effectively treat the disease
while minimizing antimicrobial resistance and virulence, it is important to know which
antibiotics work best for children depending on the severity of the illness (UNICEF, 2014).
According to Recommendations for management of common childhood conditions: Newborn
conditions, pneumonia.there are four types of antibiotics suggested for treatment of
pneumonia are ceftriaxone, ampicillin, crystalline penicillin, and combined of one or more
(WHO, 2012).Thetype of treatment given for sever pneumonia patients had significant effect
on the recovery time of the disease (Don et al., 2010).Of all children who were treated as an
inpatient, more than half (59.66%) received Crystalline penicillin followed by ceftriaxon
(33.24%) and only (7.1%) of children treated by combined. Majority of children (89%)
recovered from their illness and 2.27% were died.
The other associated clinical factors for survival status of pneumonia patients were Nurse-to-
patient ratio (NPRs), it are typically expressed in two ways: the number of nurses working
per shift or over a 24 hour period divided by the number of beds occupied by a patient over
the same time period; or the number of nursing hours per patient bed days (RCN, 2010). A
higher level of nursing staff indicates more nurses for assigned patients. Lower nurse staffing
is defined as fewer nurses (or lower proportion) for the number of assigned patients
(Penyoyer D., 2010). NPRs are easily and cheaply measured but it is a relatively blunt
instrument that can function as one indicator, and can be triangulated with other measurement
approaches to establish safe nurse staffing levels. According to the study conducted at
Europe, the effect of nurse-to-patient ratios on nurse sensitive patient outcomes in acute
specialist units found that a higher level of nurse staffing was associated with a decrease in
the risk of in hospital mortality (Andrea D., 2017). For every increase of one nurse, patients
were 14% less likely to experience in hospital mortality. In addition to nurse patient ratios, it
is also important to incorporate skill mix within a critical care unit particularly when planning
workforce shifts (Penyoyer D., 2010). These studies highlight the need for some agreement,
at an international level, about the most appropriate way to measure nurse staffing levels
(Andrea D., 2017). A study shows that,Acceleration factor for patient nurse ratio was
estimated to be 1.095 with (95% CI: 1.018, 1.177). P-value is small (p=0.015) (Abate and
Tadesse, 2019).Most of the studies listed in the literature used death as their event and the
survival time determined based on the time to death of patients. While this study was used
recovery as theevent and the survival time determined based on the time from date of
admission to hospital discharge.
14
3. DATA AND METHODOLOGY
3.1. Study Area and Period
This study was conducted at Debre MarkosComprehensive Specialised hospital which is the
only Comprehensive Specialised Hospital that is located in the capital city of East Gojam
zone, Debre Markos.It is located in Northwest of Ethiopia 299 kilo meters far from Addis
Ababa. The hospital provides service for children less than 15 years inseparate ward of
paediatrics. In this hospital, children with severe pneumonia wereadmitted in paediatric ward
and further diagnose and treatment provided by paediatricians, generalpractitioners and
nurses. The study was conducted from September 11, 2018 to September 11,2020among
children who were admitted with sever pneumonia.
3.2.Study Design
A hospital based cross-sectional study design was conducted from retrospectively
records.that reviews or visits all under-five aged children cards hospitalized due to
Pneumonia in Debre MarkosComprehensiveSpecialized hospital during study period. The
source of population of this study was all children admitted at thehospital by severe
pneumonia during the studyperiod andthe study population wasall children admitted at the
hospital by severe pneumonia whose charts were available during data collecting.
3.3. Source of Data and Data Collection Procedure
The data was retrospective survival data and itwassecondary data that was recorded on
pediatric registration chart and cards via nurses, laboratory technicians, medical doctors and
clinicians. The hospital‘s registry is used to extract data of under-five pneumonia patients‘
initial date of admission up to date of discharge of patients during the study period, the
pediatric registration chart and the patient‘s identification cards were used to select the
variables in the study by trained clinicians. The completed data collection forms are
examined for completeness and consistency during data management, storage and analysis.
The cards were prepared by Federal Ministry of Health to be uniformly used by clinicians to
early identify and document clinical and laboratory variables. Thus, the data were collected
from patient follow up records based on the variable in the study.

15
3.4. Inclusion and Exclusion Criteria
The inclusion criteria were children whose age were from 1month to 5 years and admitted at
paediatric ward by severe pneumonia during the study period with full information including
in the registration log book or in the patients‘ identification card were considered to be
eligible for the study and Exclusion criteria are children who are admitted at the hospital with
incomplete medical records which are required as predictor.
3.5.Study Variables
Depending on the reviewed literature reviews the variables included in this study are listed as
follows.
3.5.1.Response Variables
The response variable is time to recovery of under-five pneumonia patients in days. The
survival time of outcome of interest (recovery in this study) is the duration of time considered
from the day that the children admitted in the Hospital until recovery occurs.i.e. becoming
normal condition of pneumonia or censored, measured in days.
3.5.2.Independent Variables
Predicting whether an event occurred or not and identifying the variables in making the
prediction is an important step in carrying out the study. The independent variables that are
used in the study are classified as demographic, clinical (treatment), and other variables.
Variables such as age, sex, etc. are considered as demographic variables, Moreover, as some
studies revealed, most independent variables which are included in this study are expected to
show marked differential in the survival time of the under-five pneumonia patients

16
Table 3.1: variable description & coding for explanatory variables
No Variable name Values of the variable and their code Type
1 Place of residence (residence) 0= Rural &1=Urban Categorical
2 Sex of patients (sex) 0=male & 1=female Categorical
3 Age of under-five pneumonia
patients in Month (age).
1-11=0,12-23=1,24-59=2 Categorical
4 Types of pneumonia disease
at diagnosed (ptype)
0=CAP ,1=nosocomial (HAP) Categorical
5 Presence of concomitant
disease(Comorbidity)
0=no &1= yes Categorical
6 Sever acute
malnutrition.(SAM)
0=no &1= yes Categorical
7 Time elapsed to seek care
(duration)
in days Continuous
8 Past history of ARTI (history
ARTI)
0= no 1= yes categorical
9 Treatment types taken at time
of Diagnosis (treatmenttype)
Crystalline penicillin=0, Ceftriaxone=1,
Ampicillin =2 and 3= combined
Categorical
10 Clinical presentation during
admission(danger sign)
0=no & 1= yes Categorical
11 Seasons of diagnosis (season) 0=Atumun,1=Winter,2=Spring & 3=
Summer Categorical
12 Insurance status (insurance) 0= not insured and 1= insured Categorical
13 Micronutrient deficiency like
zinc, vitamin D, vitamin A
etc. (Mdeficiency)
0= no and 1= yes Categorical
3.6. Method of Data Analysis
A statistical analysis is consists of descriptive data analysis and survival model fitting to
make inference by non-parametric Model, semi parametric Cox proportional hazard models
and parametric survival (AFT) accelerated failure time models. All inferences were
conducted at 5% significance level using R version 3.4.0 &STATA 14.2 are statistical
software package uses for analysis.

17
3.7.Survival Data Analysis
Several multivariable statistical models can be used to predict a dependent variable from a set
of independent variables. Since survival time of under -five pneumoniapatients is time to
event data, for this reason the Statistical Model to predict a dependent variable from a set of
independent variables used is Survival analysis.
Survival analysis is a statistical method for data analysis where the outcome variable of
interest is the time to the occurrence of an event(Lemeshow and May, 2008). Survival
analysis is also referred to as "time to event analysis", ―durational analysis‖, ―transition data
analysis‖ or ―event history analysis‖. It is the analysis of the duration for the occurrence or
non-occurrence of an event during the risk period and an individual can only be eligible to
experience an event if there is a period during which they are at ‗risk‘ of experiencing the
event e.g. for an individual to be at risk of getting divorced they have to be married. In this
regression analysis, the dependent variable measures the time to the occurrence of an event of
interest and examines how covariates affect the length of time between consecutive events
(Lemeshow and May, 2008).
Censoring is common in survival analysis and it is considered as an important feature of
survival data. Survival analysis was well suited to for such data which were very common in
medical research. Since studies in medical areas have a special feature that follow up studies
could start at a certain observation time and could end before all experimental units had
experienced an event. Three additional points should be mentioned in connection with the
choice of the model.
Censoring occurs mainly for the following reasons (Kleinbaum and Klein, 2012):
When an individual survives beyond the study period or the individual does not
experience theevent.
Lost to follow-up, that is, an individual may drop out, transfer to other places,etc.
Deaths due to other causes different from that/those specified in thestudy.
The term ―censoring‖, will use in this study to mean in all instance right censoring.
18
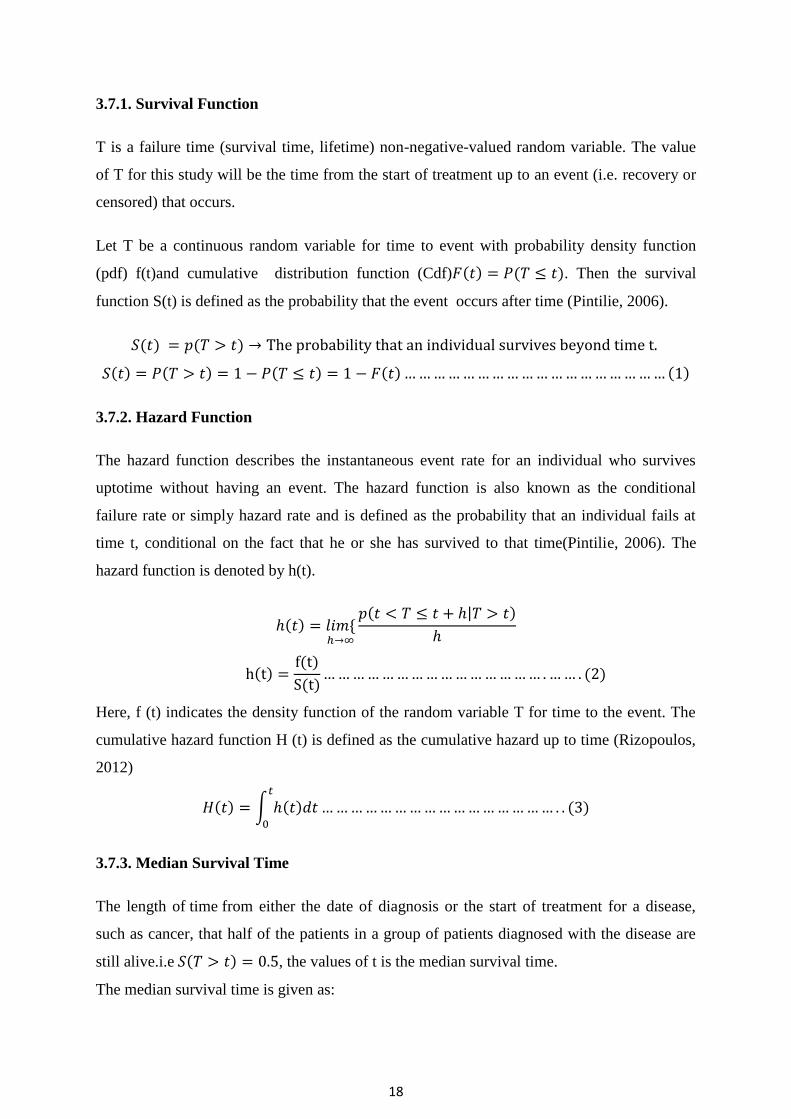
3.7.1. Survival Function
T is a failure time (survival time, lifetime) non-negative-valued random variable. The value
of T for this study will be the time from the start of treatment up to an event (i.e. recovery or
censored) that occurs.
Let T be a continuous random variable for time to event with probability density function
(pdf) f(t)and cumulative distribution function (Cdf) ( ) ( ). Then the survival
function S(t) is defined as the probability that the event occurs after time (Pintilie, 2006).
( ) ( )
( ) ( ) ( ) ( ) ( )
3.7.2. Hazard Function
The hazard function describes the instantaneous event rate for an individual who survives
uptotime without having an event. The hazard function is also known as the conditional
failure rate or simply hazard rate and is defined as the probability that an individual fails at
time t, conditional on the fact that he or she has survived to that time(Pintilie, 2006). The
hazard function is denoted by h(t).
( ) *
( | )
( ) ( )
( ) ( )
Here, f (t) indicates the density function of the random variable T for time to the event. The
cumulative hazard function H (t) is defined as the cumulative hazard up to time (Rizopoulos,
2012)
( ) ∫ ( )
( )
3.7.3. Median Survival Time
The length of time from either the date of diagnosis or the start of treatment for a disease,
such as cancer, that half of the patients in a group of patients diagnosed with the disease are
still alive.i.e ( ) , the values of t is the median survival time.
The median survival time is given as:

19
( ) ( ) ( )
3.8. Nonparametric Survival Methods
Nonparametric analyses are more widely used in situations where there is doubt about the
exact form of distribution orabout how the covariates affect the hazard function. The hazard
and survival functions were instead estimated based on the empirical data, showing change
over time. The estimation of the survival distribution provides estimates of descriptive
statistics such as the median survival time. These methods are said to be non-parametric
methods since they require no assumptions about the distribution of survival time.
Preliminary analysis of the data using nonparametric methods provides insight into the shape
of the survival function for each group and get an idea of whether or not the groups
are proportional, i.e., if the estimated survival functions for two groups are approximately
parallel (do not cross).Nonparametric methods are neither able to handle continuous data nor
multivariable analysis and control for other explanatory variables. Kaplan-Meier survival
analysis is the primary example of the nonparametric approach to event history
analysis(Kaplan and Meier,1958) and the study use long rank test to compare the survival
difference between two or more groups (Collett, 2015).
3.9. Semi-Parametric Cox Proportional Hazard Model
The non-parametric methods like Kaplan-Meier and log-rank tests are useful in the analysis
of a single sample of survival data or in comparing one or more groups of survival time.
However, these methods do not control for covariates. In clinical analysis several prognostic
(explanatory) variables usually influence the survival experience of the patients. The non-
parametric models are unable to estimate the survival experience of the patients controlling
for the explanatory variables and hence, the need to use semi-parametric proportional hazard
models when carrying of survival analysis in the presence of covariates.
Cox proportional hazards (PH) model is one of the mathematical models designed for the
analysis of time until an event. It shows the hazard at time t of an individual given the
covariates. The hazard at the time is a product of baseline hazard function h0(t) which is only
a function of time and exponential to the linear sum of βixi which is a function of time-
independent covariates (David and Hosmer, 1999; Marubini and Valsecchi, 2004). The Cox
Proportional Hazard model is given by;

20
( ) ( ) (∑
) ( ) ( ) ( )
where ( )is the hazard function at a time for a subject with covariate values x1, x2,…
xn and the estimated coefficients of the covariates of β1,β2,… βn.h0(t)is the baseline hazard
function, which is the hazard function for an individual for whom all the variables included in
the model are zero, ( ) is the value of the vectors of the
explanatory/predictor variables for a particular individual, ( ) is a vector of the
estimated coefficients of explanatory/predictor variables .
Although Cox regression is semi-parametric, it is a ―robust‖ model, hence its results always
closely approximate the results for the correct parametric model (Kleinbaum and Klein
2005). The Cox PH model is therefore preferred over parametric event history analysis
models when there is no clear theoretical reason for positing a particular baseline hazard ratio
(David and Hosmer, 1999; Kleinbaum and Klein 2005). The exponential part of the Cox PH
model ensures that the fitted model will always give a non-negative hazard and by definition,
a hazard function is between zero and plus infinity i.e. ( ) , then the hazard
ratio for the two groups is defined as:
( )
( ) ( )
When HR = 1, it implies that the individuals in the two categories are at the same risk of
getting the event, when HR > 1, it implies that the individuals in the first category (X = 1) are
at a high risk of getting the event and if HR < 1, the individuals in the second category (X =
0) are at a high risk of getting the event.
Assumption of cox proportional model
i. The baseline hazard, h0 (t)depends on t, but not on covariates x1,...,xp.
ii. The hazard ratio depends on the covariates, but not on time.
iii. The covariates do not depend on time t.
iv. Proportional hazard which means the hazard ratio is constant over time.
Parameter estimation in cox-PH model
Maximum likelihood estimates of the Cox model parameters are derived by maximizing a
likelihood function usually denoted as L. The likelihood function is a mathematical

21
expression that describes the joint probability of obtaining the data observed on the subjects
in the study as a function of the unknown parameters (the β‘s) in the model being considered.
L is sometimes written notational as L(β) where β denotes the collection of unknown
parameters.
The formula for the Cox model likelihood function is called a ―partial‖ likelihood function
rather than a (complete) likelihood function. The term ―partial‖ likelihood is used because the
likelihood formula considers probabilities only for those subjects who fail, and does not
explicitly consider probabilities for those subjects who are censored. Thus the likelihood for
the Cox model does not consider probabilities for all subjects, and so it is called a ―partial‖
likelihood.
Suppose the survival data is represented by (ti, δi, xi) for i=1, 2…, n where ti the length of
time a subject is observed (survival time), δi an indicator of censoring for the ith individual
and xi a vector of covariates for the ith
individual. The likelihood for right-censored data
includes both the survival and hazard functions is given as:
( ) ∏ ( ))
( ) ( )
The proposed partial likelihood function suggested by (Cox ,1972) avoids the specification of
the baseline hazard function, treating it as a nuisance parameter and removing it from the
estimating equation.
It assumes that there are no tied values among the observed survival times. Suppose we have
m distinct failure times and let X (i) is the vector of covariates at ordered failure time t (i).
We define the Partial Likelihood as
( ) ∏
∑ ( )
( )
Where is the number of deaths, we assume there are no tied so excluded for di=0.
And, „ ( ) is the set of subjects at risk at a time just before ti (ti=0). And the summation in
the denominator is over all subjects in the risk set at time ti denoted by ( ).
Interpretation of a fitted proportional hazard regression model is based on the hazard function
i.e. . Is the maximum partial likelihood estimator of β.

22
The (1-α) 100% confidence interval for the estimated parameter is given as:
( ) ( )
And, for the hazard ratio is obtained as: ( ( ))
We use the partial likelihood ratio test for comparing two models and to test the overall
goodness of fit of the model.
The test statistic is given by:
[ ( ) ( )] ( )
Where ( ) ( )is log-likelihood of the model with and without covariates
respectively
G has a Chi-square distribution with p degrees of freedom. If the value of G is greater than
the Chi-square value with p degrees of freedom, then the null hypothesis will be rejected. The
formulation of the null and alternative hypothesis depends upon the problem of the study.
There are also other tests such as Wald and Score tests which we usually use to test the
significance of individual parameters.
A ( ) for the parameter is the interval with limits
( ) If this
interval does not included zero, this is evidence that the value of is non zero. More
specifically the hypothesis can be tested by calculating the statistic
( ‾ )
which a standard normal distribution. Equivalently
( ‾ ) may be calculated and
compared to a chi-square distribution with one degree of freedom. This procedure is called
the Wald test.
3.10. Accelerated Failure Time Model
Accelerated failure time model is a parametric model that provides an alternative to the
commonly used cox-proportional hazard model (PH). Under AFT models, we Measure direct
effect of the explanatory variables on the survival time in instead of hazards, as we do in the
PH model. This characteristic allows for easier interpretation of the results. For a group of
patients with Covariate (X1,X2……Xp) the model is written mathematically as
( ) ( )[ ] ( )

23
Where s0(t) is the baseline survival function and is an ―acceleration factor‖ that is a ratio
of survival times corresponding to any fixed value of S(t).the acceleration factor is given
according to the formula.
( )
Under an AFT model, the covariate effects are assumed to be constant & multiplicative on
the time scale, that is, the covariate impacts on survival time by a constant factor
(acceleration factor) according to the relation-ship of survival function and hazard function,
the hazard function for an individual with the covariate X1,X2,…..Xp is given by
(
) [
( )] [
( )] ( )
The corresponding log linear form of the AFT model with respect to time is given by
logTi= 𝜇+ 1 1 + 2 2 +,…,+ +𝛿𝜖 ………………………..(19)
Where, μ is intercept, δ is scale parameter and ϵi is the error distribution assumed to have a
particular parametric distribution. This form of model is adopted by most software package
for AFT model.For each distribution of 𝜖 , there is a corresponding distribution for T. the
most common AFT models are Exponential AFT, Weibull AFT, log logistic AFT, and log
normal AFT models (Cox D,1984., lee,et al, 2003, collet, 2003)
Exponential distribution
A useful parametric model employs the exponential distribution. Recall that the exponential
Distribution depends on one parameter, which in this case represents a constant hazard
function. Then, (t) = >0, over the ranges of T where T is still a random variable
representing recovery time, T>0, and t is typical point in the range. The memory less property
of the exponential distribution now relates to the instantaneous failure rate being independent
of t so that the conditional chance of failure in a time interval of specified length is the same
regardless of how long the subject has been observed. A large indicates higher risk and
decreased probability of survival and a small indicates lower risk and increased probability
of survival.
24
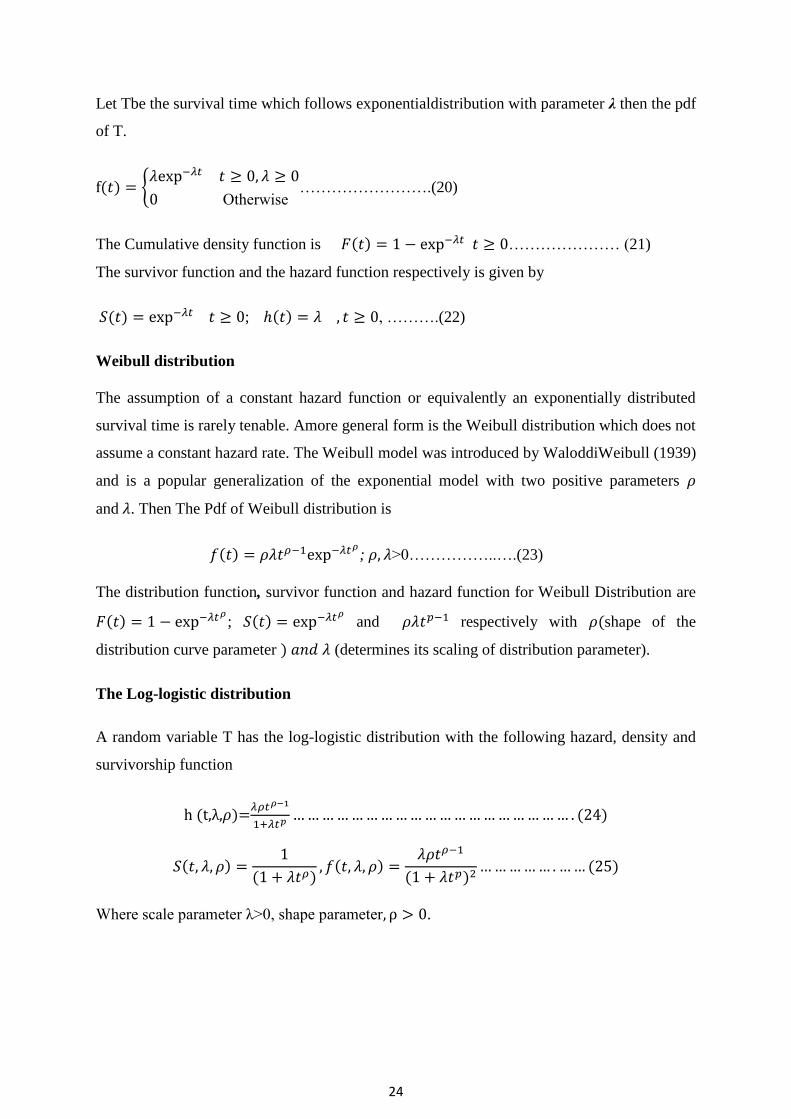
Let Tbe the survival time which follows exponentialdistribution with parameter λ then the pdf
of T.
( ) {
Otherwise …………………….(20)
The Cumulative density function is ( ) ………………… (21)
The survivor function and the hazard function respectively is given by
( ) ; ( ) , ……….(22)
Weibull distribution
The assumption of a constant hazard function or equivalently an exponentially distributed
survival time is rarely tenable. Amore general form is the Weibull distribution which does not
assume a constant hazard rate. The Weibull model was introduced by WaloddiWeibull (1939)
and is a popular generalization of the exponential model with two positive parameters
and . Then The Pdf of Weibull distribution is
( ) ; >0……………..….(23)
The distribution function, survivor function and hazard function for Weibull Distribution are
( ) ; ( )
and respectively with (shape of the
distribution curve parameter ) (determines its scaling of distribution parameter).
The Log-logistic distribution
A random variable T has the log-logistic distribution with the following hazard, density and
survivorship function
( λ )=
( )
( )
( ) ( )
( ) ( )
Where scale parameter λ>0, shape parameter .

25
Log normal distribution
The lognormal distribution is also defined for random variables that take positive values and
so may be used as a model for survival data. Random variables, T, is said to have a lognormal
distribution with parameters µ and ζ, if LogT has a normal distribution with mean µ and
variance ζ.The probability density function of T is given by
( )
√ (
( )
) ………………… (26)
The survivor function of lognormal distribution is
( ) (
)……………………………………. (27)
Where Φ(.)is the standard normal distribution function givenby
( )
√
(
)
The hazard function is ( ) ( )
( )……………………………… (28)
Parameter estimation in AFT model
Accelerated failure time model (AFT) are fitted using the maximum likelihood method. The
likelihood of the n observed survival times t1,t2,……tn is given by
( 𝜇 ) ∏ ( ) ( )
( )
Where fi(ti) and Si(ti) are the density and survival function for the ith
individuals at ti and 𝛿
is the event indicator for the ith
observation. The log likelihood function will be
( 𝜇 ) ∑ 𝛿 ( 𝛿 𝜖 ( ) ( 𝛿 ) 𝜖 )( )
( )
Where ( 𝜇 )
The maximum likelihood estimates of the P+2 unknown parameters 𝜇 are
found by maximizing this function using the Newton –Raphaon procedure, which is the same
26
method used to maximize the partial log likelihood in the cox regression model (cox,1984,
Lee et al.,2003 ,collet,2003).
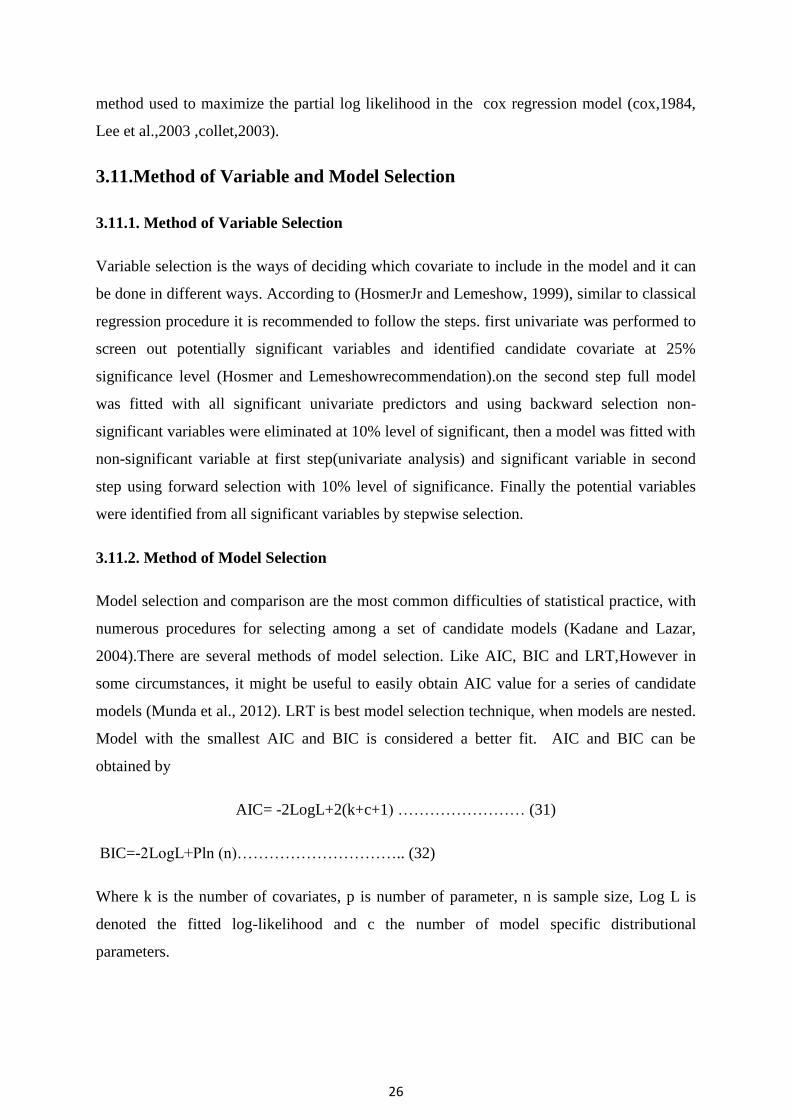
3.11.Method of Variable and Model Selection
3.11.1. Method of Variable Selection
Variable selection is the ways of deciding which covariate to include in the model and it can
be done in different ways. According to (HosmerJr and Lemeshow, 1999), similar to classical
regression procedure it is recommended to follow the steps. first univariate was performed to
screen out potentially significant variables and identified candidate covariate at 25%
significance level (Hosmer and Lemeshowrecommendation).on the second step full model
was fitted with all significant univariate predictors and using backward selection non-
significant variables were eliminated at 10% level of significant, then a model was fitted with
non-significant variable at first step(univariate analysis) and significant variable in second
step using forward selection with 10% level of significance. Finally the potential variables
were identified from all significant variables by stepwise selection.
3.11.2. Method of Model Selection
Model selection and comparison are the most common difficulties of statistical practice, with
numerous procedures for selecting among a set of candidate models (Kadane and Lazar,
2004).There are several methods of model selection. Like AIC, BIC and LRT,However in
some circumstances, it might be useful to easily obtain AIC value for a series of candidate
models (Munda et al., 2012). LRT is best model selection technique, when models are nested.
Model with the smallest AIC and BIC is considered a better fit. AIC and BIC can be
obtained by
AIC= -2LogL+2(k+c+1) …………………… (31)
BIC=-2LogL+Pln (n)………………………….. (32)
Where k is the number of covariates, p is number of parameter, n is sample size, Log L is
denoted the fitted log-likelihood and c the number of model specific distributional
parameters.

27
3.12. Model Assessment
3.12.1. Proportional Hazard Assumption Checking
The main assumption of the Cox PH model is proportional hazards. Proportional hazard
means that the hazard function of the individuals is proportional to the hazard function of the
other individuals; i.e the hazard ratio is constant over time. There are several methods for
varying that a model satisfies the assumptions of proportionality.
Graphicalmethod
We can obtain Cox PH survival function by the relation-ship between hazard function and
survival function.
( ) ( ) ∑ ( )
Where x1,x2…….xp are Explanatory variables. When taking the logarithm twice we can
easily gate
( ( )) ∑
( ) ( )
By plotting estimated ( ( )) versus survival time for two groups we will the parallel
curves if the hazards are proportional. This method dose not woke well for continuous
predictors or categorical predictors that have many levels. Looking at KM curves and
( ( )) is not enough to be certain of proportionality since they are univariable
analysis and do not shows whether hazards will still be proportional. When a model includes
many other predictors, in this case the following two methods are recommended.
Tests based on schoanfeld residuals
The method of checking the assumption of the Cox proportional hazards model is scatter
plots using the Schoenfeld residual (Schoenfeld, 1982). The residuals constructed for each
covariate that are included in the model which are expected to predict the recovery time of
children‘s with sever pneumonia. This overcomes the problem that other residuals depend
heavily on observed survival time and cumulative hazard function. They are computed for
each individual and covariate. It follows that, the Schoenfeld residual for the individual
and covariate is defined as:

28
[ ∑ ( )
( )
∑ ( )
( )]………………………………………………. (35)
Where, is a vector of p fixed covariates for the individual, is the value of
covariate on the individual. Because of that, Schoenfeld residuals are defined only for the
uncensored observations in which -
∑ ( )
( )
∑ ( ) ( )
Andfor each covariate it must sum to zero. In addition, they are
uncorrelated and with expected value zero (Schoenfeld, 1982).
Under the proportional hazard assumption for the respective covariate, a scatter plot of
Schoenfeld residuals against event times is expected to scatter in a nonsystematic way about
the zero line, and the polygon (Lowes‘s curve) connecting the values of the smoothed
residuals should have a zero slope and cross the zero line several times (Klein
&Moeschberger., 2003). If this plot shows some trend the assumption is violated, where as if
the plot demonstrates randomly distributed around the reference line then the assumption is
satisfied.
Adding time dependent covariates in the cox model
If we include time dependent covariate to the model & the coefficient for the time dependent
variables is significantly different from zero, then the predictor is not [proportional. In the
same way can also asses the PH assumption for several predictors simultaneously.
3.12.2.Checking the Adequacy of Parametric Baselines
Graphical approaches (for all distributions listed), as well as Cox-Snell residual plots, are
some of the other ways.(Gray and Pierce, 1985). Parametric models are fit to the event times
and semi parametric models are fit to the ordered event times respectively. In both the cases
we use the AIC to select between parametric models, or to select between semi-parametric
models, but not to select from a mixture of the two. The AIC or likelihood tests allow us to
assess relative model goodness of fit, but not absolute model goodness of fit. Just because the
second model fits better than the first model, it does not mean the second model adequately
describes the data. Thus, wewould like a method, at least a graphical one that lets us assess
the absolute goodness of fit of a parametric model. The Table 3.2 below provides

29
informationregarding graphical check for goodness of fit for the identified parametric model
for survival data (Aaserud et al., 2013; Limpert et al., 2001)
Table 3.2: Graphical checking for goodness of fit for parametric survival models.
Graph Behavior Resulting Distribution
− ( ) versus Straight line through origin Exponential
log [− ( )] versus log Straight line Weibull
Φ−1
(1− ( )) versus log Straight line, where Φ( ) is the CDF Log-normal
log [ ( )
( ) versus log Straight line Log-logistic
3.12.3. Using Residual Plots
There are different types of residuals such as, Cox–Snell residuals, martingale residuals,
deviance residuals, e.t.c.
Although the use of residuals vary and depend on the data and user preferences, the suggested
uses are the following: Cox–Snell residuals are useful in assessing overall model fit.
Martingale residuals are useful in determining the functional form of covariatesto be included
in the model and are occasionally useful in identifying outliers. Deviance residuals are useful
in examining model accuracy and identifying outliers The residual that is widely used in the
analysis of survival data is the Cox-Snell residual, it is a particular example of the general
definition of residuals given by (Cox and Snell, 1968). Martingale residuals ( ) are also
called modified Cox-Snell residuals and, expressed as
( ) ………………………………… (36)
Where 𝛿 for uncensored observations and zero otherwise, and ciare Cox-Snell
residuals. These residuals have similar properties to the error components in other models, in
addition to the properties that its mean is equal to zero under the correct model. In large
samples, the martingale residuals are uncorrelated with one another and have an expected
value of zero. However, the martingale residuals are not symmetrically distributed about
zero. Plot of these residuals versus explanatory variables is used to indicate whether any
particular variable needs to be transformed before incorporating it in the model. In other way
round, martingale residuals are useful in determining the functional form of covariate to be
included in the model. If after plotting the residuals versus explanatory variables, the plot

30
does not show an obvious relationship, then the variable is not important in the model to be
included. Therefore, if most of the points fall horizontally about zero, in the plots of the
martingale residuals versus the values of the independent variables, then the fitted model is
taken as satisfactory. The deviance residuals, which were introduced by (Therneau et al.,
1990), aremuch more symmetrically distributed about zero. The deviance residuals are
martingale residuals that have been transformed to producevalues that are symmetric about
zero when the fitted model is appropriate. The deviance is a statistic that is used to
summarize the extent to which the fit of a model of currentinterest deviates from the saturated
model.
3.13.Ethical Consideration
The Research Ethics Review Board of Debre Brehan University has provided an ethical
clearance for the study. The data was brought from Debre Markos Comprehensive
Specialized Hospital, and to do so the department of statistics asked to write an official co-
operation letter to the Hospital from where data was obtained. The study conducted without
individual informed consent because it relied on retrospective data. In this research, the
information obtained from log book and patients‘ card kept secured.

31
4. STATISTICAL DATA ANALYSIS AND RESULTS
In this section, the researcher presented the results of data analysis, discussion, and
interpretation. The first part presents the summary statistics of covariate considered in this
study. The second part estimates the survival time and also comparing the survival curve in
different groups of variables. The third part was about fitting the model. Finally, the results
wereinterpreted and discussed.
4.1. Descriptive Statistics
Descriptive statistics is the beginning of any statistical analysis before proceeding to more
complicated models. Of 341 patient medical records, 48 were excluded because of
incompleteness, and the remaining 293 were included in the final analysis. Thereforethis
study was included a total of 293 under-five pneumonia patients fulfilling the inclusion
criteria in Debre Markos Comprehensive Specialized Hospital. Summary results for
covariates included in this study are presented in Table 4.1.
As shown in Table 4.1, the total of 293 patients of pneumonia included in the study, 122
(41.64%) of the patients were female and 171(58.36%) were male. Among those patients by
considering sex, the recovery proportion for female is 39.61% which is lower than that of
male patients which is 60.39%. Seeing age groups included in the study total sample of
patients 45.05%, 25.6% and 29.35 of patients were from age group 1-11, 12-23 and 24-59
respectively and the recovery proportion for the age group were 45.89%, 24.15% and 29.95
respectively. Of the total patients 60.07% were from rural area and 39.93% from the urban.
Recovery proportions of patients with residences were 39.61% and 60.39% respectively. Out
of the total patients, 13.99% were in Autumn, 12.67% were in Winter, 50.51% were in Spring
and 22.87% patients were in Summer. The recovery proportions of patients in Autumn,
Winter, Spring and Summer patients were 13.04%, 12.08%, 50.72% and 24.15%
respectively.
As shown in Table 4.1 of total patients 40.96% patients were no Presence of concomitant
disease or Co-morbidity and 59.04% were Presence of concomitant disease or with Co-
morbidity. Recovery proportions among not Presence of concomitant disease or co-morbidity
and with comorbidity were 44.93 % and 55.07 % respectively. Similarly in Sever Acute
Malnutrition (SAM) case, out of the total patients there were 68.94% patients without Sever

32
Acute Malnutrition and 31.06% were with Sever Acute Malnutrition. Recovery proportions
among without Sever Acute Malnutrition and with Sever Acute Malnutrition were 72.46%
and 27.54% respectively. Among under-five aged children included in the study, 30.03%
patients took treatment type crystalline Penicillin, 24.57% patients took treatment type
Ceftriaxone, 13.31% patients took treatment type Ampicillin and 32.08% patients took the
Combination of two and above treatments types. The recovery proportions of patients who
took crystalline Penicillin, Ceftriaxone, Ampicillin and Combination of two or above were
23.19%, 29.95%, 15.94%, and 30.92% respectively.
Among the total patients included in the study 66.21% patients was no micronutrient
deficiencies and 33.79% patients were with micronutrient deficiencies. The recovery
proportion among patients who were no micronutrient deficiencies and patients with
micronutrient deficiencies were 64.25% and 35.75% respectively. Based on insurance status
of under- five aged patients 67.24 % were not member of social health insurance and 32.76%
were member of social health insurance. The recovery proportion of patients who were not
member of social health insurance and member of social insurance were 63.29% and 36.7%
respectively. The mean of Time elapsed to seek care (Duration) included in the study was
4.43 days with standard deviation of 0.145.
Table 4.1: Descriptive summary of pneumonia patients at DMCSH
Variable
Category (codes)
Event (status)
Recovered (%) Censored (%) Total
Sex Male (0) 125 (60.39) 46 (53.49) 171 (58.36)
Female(1) 82 (39.61) 40 (46.51) 122 (41.64)
Age 1-11 (0) 95 (45.89) 37 (43.02) 132 (45.05)
12-23 (1) 50 (24.15) 25 (29.07) 75 (25.6)
24-59 (2) 62(29.95) 24 (27.91) 86 (29.35)
Residence Rural (0) 125 (39.61) 51 (59.3) 176 (60.07)
Urban (1) 82 (60.39) 35 (40.7) 117(39.93)
Danger sign Yes (1) 144 (69.57) 66 (76.74) 210 (71.67)
No (0) 63 (30.43) 20 (23.26) 83 (28.33)
History of ARTI No (0) 121 (58.45) 38 (44.19) 159 (54.27)
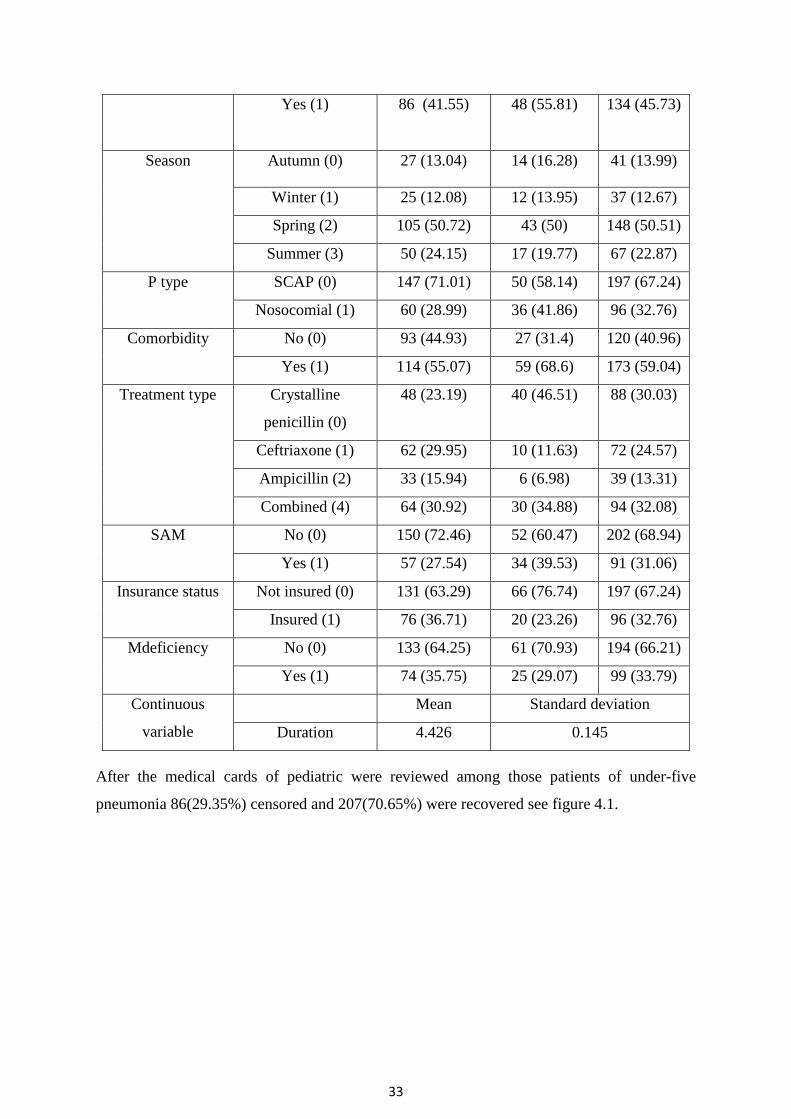
33
Yes (1) 86 (41.55) 48 (55.81) 134 (45.73)
Season Autumn (0) 27 (13.04) 14 (16.28) 41 (13.99)
Winter (1) 25 (12.08) 12 (13.95) 37 (12.67)
Spring (2) 105 (50.72) 43 (50) 148 (50.51)
Summer (3) 50 (24.15) 17 (19.77) 67 (22.87)
P type SCAP (0) 147 (71.01) 50 (58.14) 197 (67.24)
Nosocomial (1) 60 (28.99) 36 (41.86) 96 (32.76)
Comorbidity No (0) 93 (44.93) 27 (31.4) 120 (40.96)
Yes (1) 114 (55.07) 59 (68.6) 173 (59.04)
Treatment type Crystalline
penicillin (0)
48 (23.19) 40 (46.51) 88 (30.03)
Ceftriaxone (1) 62 (29.95) 10 (11.63) 72 (24.57)
Ampicillin (2) 33 (15.94) 6 (6.98) 39 (13.31)
Combined (4) 64 (30.92) 30 (34.88) 94 (32.08)
SAM No (0) 150 (72.46) 52 (60.47) 202 (68.94)
Yes (1) 57 (27.54) 34 (39.53) 91 (31.06)
Insurance status Not insured (0) 131 (63.29) 66 (76.74) 197 (67.24)
Insured (1) 76 (36.71) 20 (23.26) 96 (32.76)
Mdeficiency No (0) 133 (64.25) 61 (70.93) 194 (66.21)
Yes (1) 74 (35.75) 25 (29.07) 99 (33.79)
Continuous
variable
Mean Standard deviation
Duration 4.426 0.145
After the medical cards of pediatric were reviewed among those patients of under-five
pneumonia 86(29.35%) censored and 207(70.65%) were recovered see figure 4.1.

34
Figure 4.1: discharge status of sever pneumonia patient‘s data set at DMCSH
4.2. Non parametric survival analysis
4.2.1. Survival Characteristics of Time to Recovery of Pneumonia Data Set
A patients‟ recover from pneumonia disease before the end of the study was called events
while children‘sdeath due to pneumonia, lost follow up and drop out the study was censored.
A plot of the KM curves to the survival experience of time-to-recovery is shown in figure 4.2.
The estimated value of the survivor function patients decreases at decreasing rate from the
time origin until 10 days, and zero after 23 days and The estimated hazard function illustrated
in Figure 4.2 shows that an increase in the hazard rate has direct relation with the increase in
time.
Figure 4.2:The K-M plot of survival and hazard function of pneumonia patient‘s data set
0.0
00
.25
0.5
00
.75
1.0
0
0 5 10 15 20 25analysis time
survival plot of pneumonia
0.0
00
.25
0.5
00
.75
1.0
0
0 5 10 15 20 25analysis time
hazard plot of pneumonia

35
4.2.2. Survival Time-To-Recovery for Different Groups of Predictors
Descriptive graphs of the survivor function were used for the purpose of comparing the event
experiencing times of two or more groups and the survival quantities of predictors to describe
the survival experience of an individual at specific times. Separate Kaplan-Meier survivor
functions were constructed for different predictors to see for possible existence of differences
in survival experience between the indicated categories. In general, the pattern of one
survivorship function lying above another means the group defined by the upper curve had a
better survival than the group defined by the lower curve. In this case the event is recovery
time, group defined by the lower curve attend normal condition of pneumonia faster (have a
better recovery time/survival experience).
As shown in figure 4.3 the survival Experience of both sever community acquired and
hospital acquired pneumonia patients were similar until 7 days, after this points the survival
experience of Sever community acquired pneumonia patients decline with higher rate than
hospital acquired Pneumonia patients.As shown in figure 4.3until 12 days under-five
pneumonia patients who had not a clinical presentation during admission like impaired
consciousness, abnormal body movement, vomiting everything or danger sign has better
survival Experience than had danger sign.i.ePatients who had a danger sign had a higher
probability of extending their recovery time at a given time than patients who did not have a
danger sign.After 12 days both patients with and without danger sign have similar survival
Experience and the survival Experience of patients with danger sign became zero after 20
days.
Figure 4.3:K-M survival plot by pneumonia typeand danger signof pneumonia patients
0.0
00
.25
0.5
00
.75
1.0
0
0 5 10 15 20 25analysis time
ptype = SCAP ptype = nosocomial
Kaplan-Meier survival estimates
0.0
00
.25
0.5
00
.75
1.0
0
0 5 10 15 20 25analysis time
dangersign = no dangersign = yes
Kaplan-Meier survival estimates

36
As shown in figure 4.4 similarly, until 9 days under-five pneumonia patients who were
insured had better survival Experience than patients who were not insured. And for treatment
types, that treatment type taken at the time of diagnosis was ceftriaxone attained good control
of pneumonia faster than other treatment type. Patients who take ceftriaxone had a
lowerprobability of extending their recovery time at a given time than patients who take other
treatment type.and patients who take crystillinpencilline had higher probability of extending
their recovery time at a given time than patients who take other treatment type.
Figure 4. 4:K-M survival plot by insurance status and treatment type of pneumonia patient.
Figure A1 in Appendix shows that, until 12 days from their admission patients who no
comorbidity hadbetter survival experience than patients who had comorbidity and the
survival time of patients who had no comorbidity became after 20 days. As shown in figure
A2 in appendix shows patients without past history of ARTI had better survival experience
than patients with past history of ARTI from 3 days until 16 days, from the start of follow up
to 3 days and 16-20 days, it had similar survival experience and became 0 after 20 days. The
log rank test also revealed that past history of ARTI had significant difference in survival
time of pneumonia patients (p=0.0175) at 5% level of significance
4.2.3.Comparison of Survival time (Long Rank Test)
The log-rank test was used to compare the survival functions of two or more groups of under-
five pneumonia patients. Log-Rank test was used to compare survival time between
0.0
00
.25
0.5
00
.75
1.0
0
0 5 10 15 20 25analysis time
insurancestatus = not insured insurancestatus = insured
Kaplan-Meier survival estimates
0.0
00
.25
0.5
00
.75
1.0
0
0 5 10 15 20 25analysis time
treatmenttype = Cristyline pencillin treatmenttype = Ceftriaxone
treatmenttype = Ampecillin treatmenttype = Combined
Kaplan-Meier survival estimates
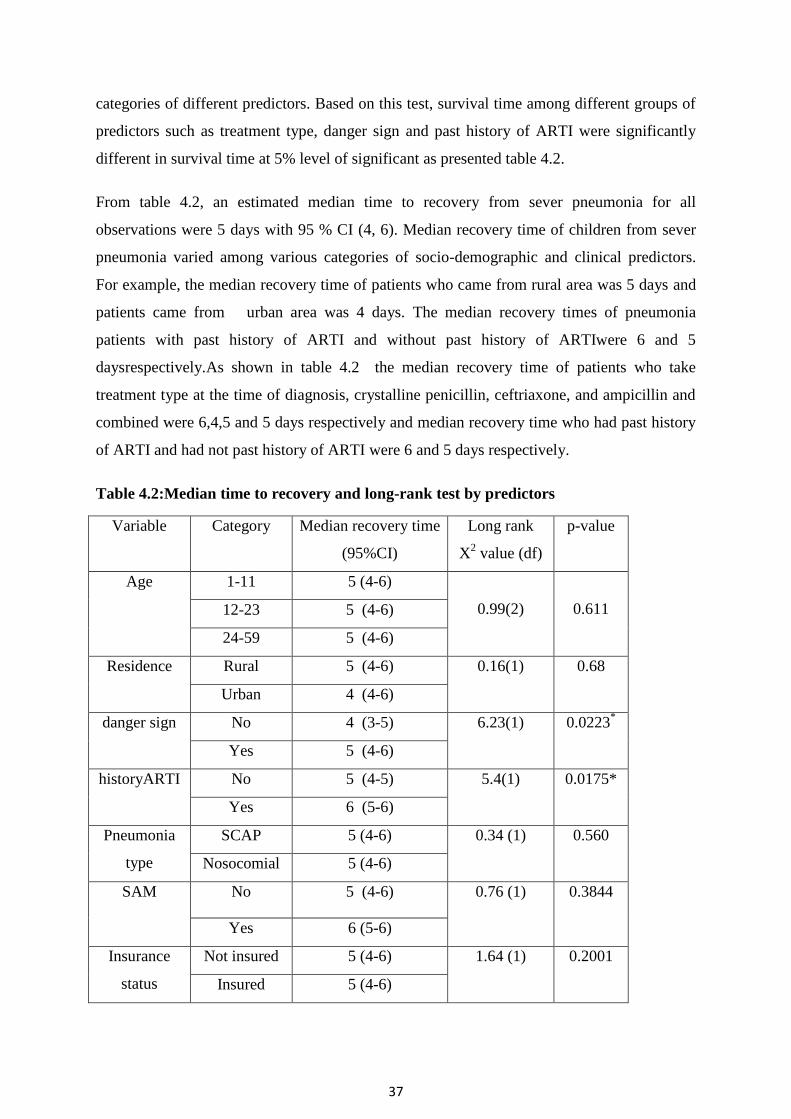
37
categories of different predictors. Based on this test, survival time among different groups of
predictors such as treatment type, danger sign and past history of ARTI were significantly
different in survival time at 5% level of significant as presented table 4.2.
From table 4.2, an estimated median time to recovery from sever pneumonia for all
observations were 5 days with 95 % CI (4, 6). Median recovery time of children from sever
pneumonia varied among various categories of socio-demographic and clinical predictors.
For example, the median recovery time of patients who came from rural area was 5 days and
patients came from urban area was 4 days. The median recovery times of pneumonia
patients with past history of ARTI and without past history of ARTIwere 6 and 5
daysrespectively.As shown in table 4.2 the median recovery time of patients who take
treatment type at the time of diagnosis, crystalline penicillin, ceftriaxone, and ampicillin and
combined were 6,4,5 and 5 days respectively and median recovery time who had past history
of ARTI and had not past history of ARTI were 6 and 5 days respectively.
Table 4.2:Median time to recovery and long-rank test by predictors
Variable Category Median recovery time
(95%CI)
Long rank
X2 value (df)
p-value
Age 1-11 5 (4-6)
0.99(2)
0.611 12-23 5 (4-6)
24-59 5 (4-6)
Residence Rural 5 (4-6) 0.16(1) 0.68
Urban 4 (4-6)
danger sign No 4 (3-5) 6.23(1) 0.0223*
Yes 5 (4-6)
historyARTI No 5 (4-5) 5.4(1) 0.0175*
Yes 6 (5-6)
Pneumonia
type
SCAP 5 (4-6) 0.34 (1)
0.560
Nosocomial 5 (4-6)
SAM No 5 (4-6) 0.76 (1) 0.3844
Yes 6 (5-6)
Insurance
status
Not insured 5 (4-6) 1.64 (1) 0.2001
Insured 5 (4-6)
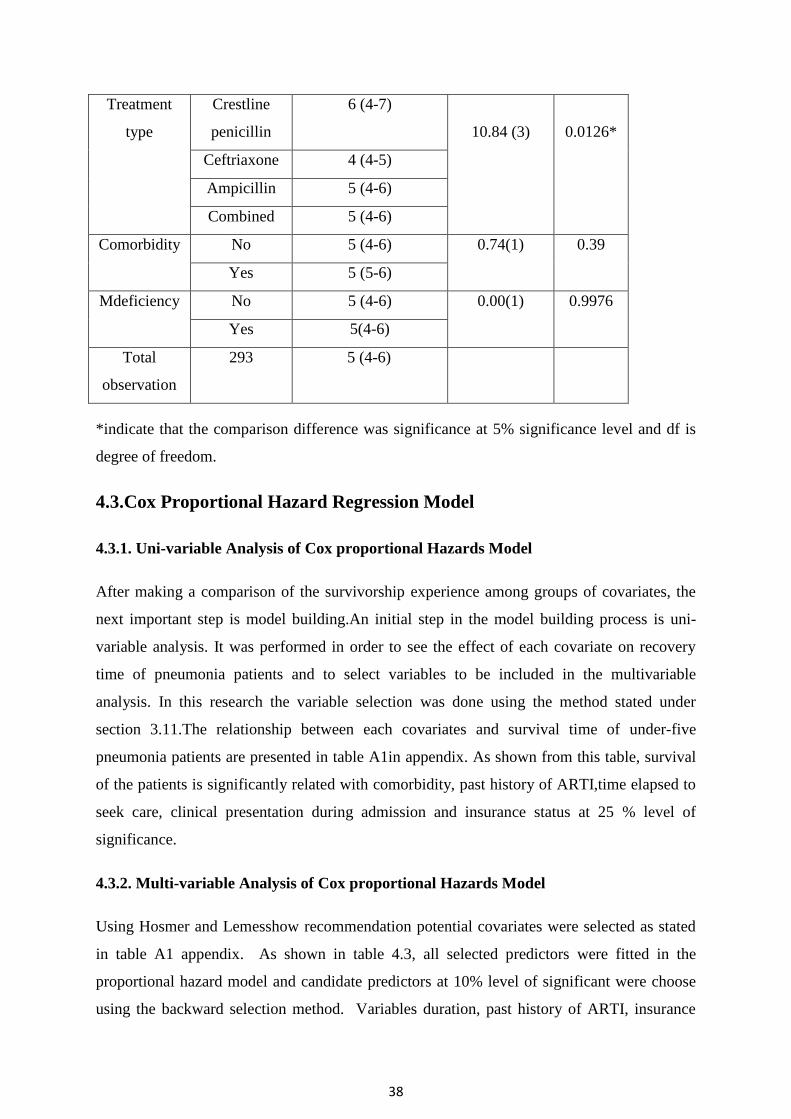
38
Treatment
type
Crestline
penicillin
6 (4-7)
10.84 (3)
0.0126*
Ceftriaxone 4 (4-5)
Ampicillin 5 (4-6)
Combined 5 (4-6)
Comorbidity No 5 (4-6) 0.74(1) 0.39
Yes 5 (5-6)
Mdeficiency No 5 (4-6) 0.00(1) 0.9976
Yes 5(4-6)
Total
observation
293 5 (4-6)
*indicate that the comparison difference was significance at 5% significance level and df is
degree of freedom.
4.3.Cox Proportional Hazard Regression Model
4.3.1. Uni-variable Analysis of Cox proportional Hazards Model
After making a comparison of the survivorship experience among groups of covariates, the
next important step is model building.An initial step in the model building process is uni-
variable analysis. It was performed in order to see the effect of each covariate on recovery
time of pneumonia patients and to select variables to be included in the multivariable
analysis. In this research the variable selection was done using the method stated under
section 3.11.The relationship between each covariates and survival time of under-five
pneumonia patients are presented in table A1in appendix. As shown from this table, survival
of the patients is significantly related with comorbidity, past history of ARTI,time elapsed to
seek care, clinical presentation during admission and insurance status at 25 % level of
significance.
4.3.2. Multi-variable Analysis of Cox proportional Hazards Model
Using Hosmer and Lemesshow recommendation potential covariates were selected as stated
in table A1 appendix. As shown in table 4.3, all selected predictors were fitted in the
proportional hazard model and candidate predictors at 10% level of significant were choose
using the backward selection method. Variables duration, past history of ARTI, insurance
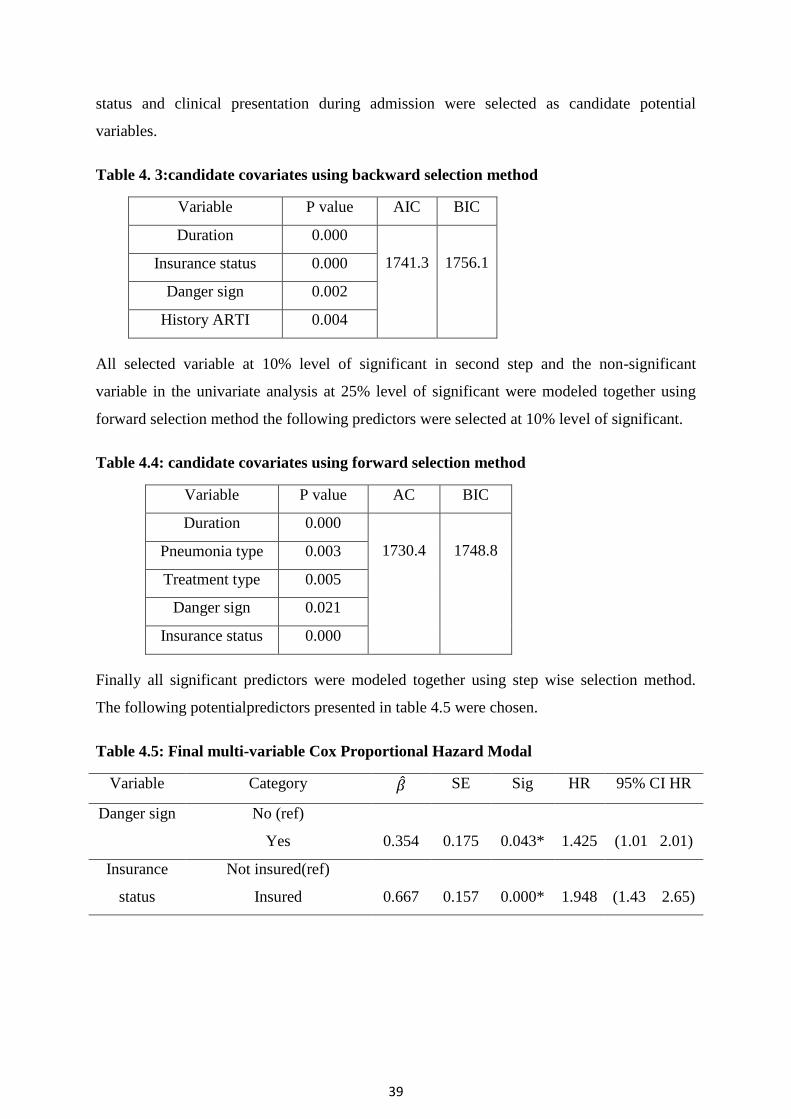
39
status and clinical presentation during admission were selected as candidate potential
variables.
Table 4. 3:candidate covariates using backward selection method
Variable P value AIC BIC
Duration 0.000
1741.3
1756.1 Insurance status 0.000
Danger sign 0.002
History ARTI 0.004
All selected variable at 10% level of significant in second step and the non-significant
variable in the univariate analysis at 25% level of significant were modeled together using
forward selection method the following predictors were selected at 10% level of significant.
Table 4.4: candidate covariates using forward selection method
Variable P value AC BIC
Duration 0.000
1730.4
1748.8 Pneumonia type 0.003
Treatment type 0.005
Danger sign 0.021
Insurance status 0.000
Finally all significant predictors were modeled together using step wise selection method.
The following potentialpredictors presented in table 4.5 were chosen.
Table 4.5: Final multi-variable Cox Proportional Hazard Modal
Variable Category SE Sig HR 95% CI HR
Danger sign No (ref)
Yes 0.354 0.175 0.043* 1.425 (1.01 2.01)
Insurance
status
Not insured(ref)
Insured 0.667 0.157 0.000* 1.948 (1.43 2.65)

40
Pneumonia
type
SCAP(ref)
Nosocomial -0.653 0.173 0.000* 2.475 (0.370 .73)
Treatment
type
Crystalline penicillin (ref)
Ceftriaxone 0.906 0.208 0.000* 2.475 (1.64 3.72)
Ampicillin 0.966 0.250 0.000* 2.627 (1.61 4.29)
Combined 0.657 0.209 0.002* 1.930 (1.28 2.91)
Duration -0.943 0.071 0.000* 0.520 (0.340.45)
AIC= 1717.4BIC=1743.2
SE=Standard error,HR= Hazard Ratio, CI=Confidence Interval, ref. Reference and *
statistical significant at 5% significance level.
Time of elapsed to seek care (duration), insurance status, types of pneumonia, danger sign ,
and Treatment type taken at the time of diagnosis were statistically significant at 5%
significance level and those predictors were selected as the final model. It is best model
compared to the above two models in table 4.3and 4.4since it has the smallest value of AIC.
4.4. Examined Assumptions of Proportional Hazard Model
The adequacy of the model needs to be assessed after the model has been built to the
observed survival data. Then proceed to check the proportionality assumption for each
covariate included in the final model. The proportionality assumption was examined using
global test (Goodness of fit testing approach) by using graphical, Schoenfeld residuals for
different predictors, and time varying covariate added in to Cox-PH model.
Using Graphical Method
using graphical method as shown in figure 4.5 the plots of group of predictor‘s (pneumonia
type) were not parallel this is also an indication of violation of PH assumption
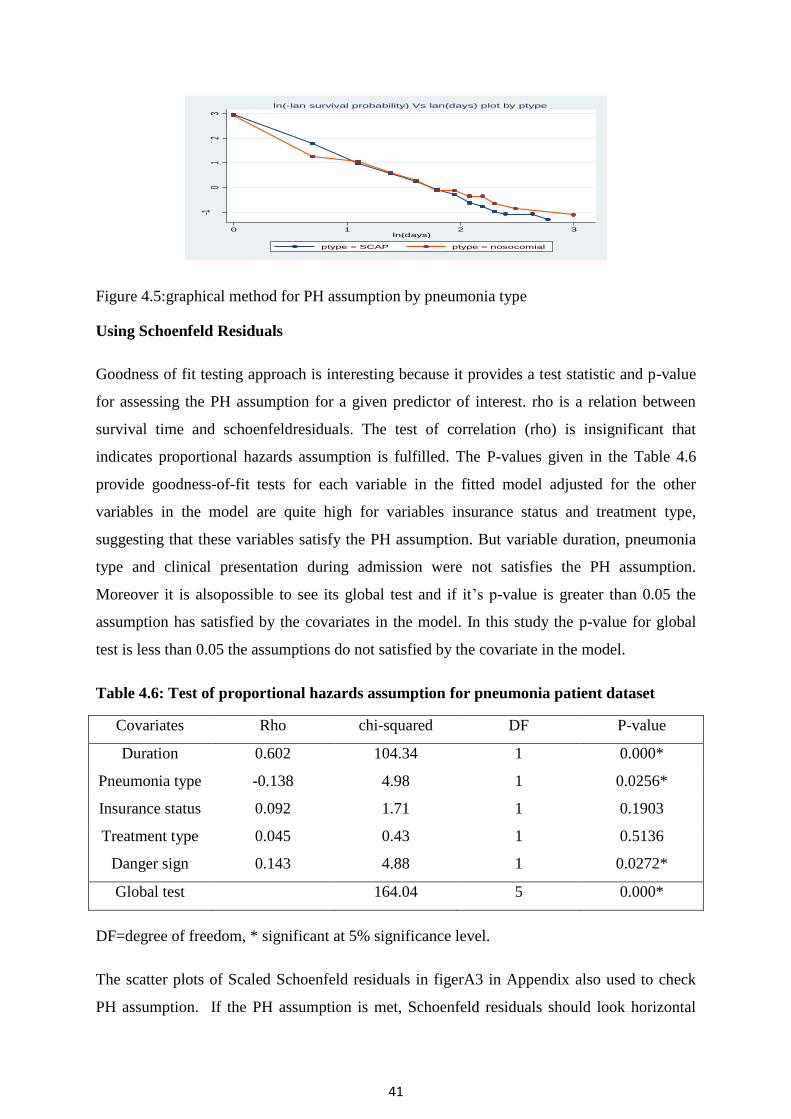
41
Figure 4.5:graphical method for PH assumption by pneumonia type
Using Schoenfeld Residuals
Goodness of fit testing approach is interesting because it provides a test statistic and p-value
for assessing the PH assumption for a given predictor of interest. rho is a relation between
survival time and schoenfeldresiduals. The test of correlation (rho) is insignificant that
indicates proportional hazards assumption is fulfilled. The P-values given in the Table 4.6
provide goodness-of-fit tests for each variable in the fitted model adjusted for the other
variables in the model are quite high for variables insurance status and treatment type,
suggesting that these variables satisfy the PH assumption. But variable duration, pneumonia
type and clinical presentation during admission were not satisfies the PH assumption.
Moreover it is alsopossible to see its global test and if it‘s p-value is greater than 0.05 the
assumption has satisfied by the covariates in the model. In this study the p-value for global
test is less than 0.05 the assumptions do not satisfied by the covariate in the model.
Table 4.6: Test of proportional hazards assumption for pneumonia patient dataset
Covariates Rho chi-squared DF P-value
Duration 0.602 104.34 1 0.000*
Pneumonia type -0.138 4.98 1 0.0256*
Insurance status 0.092 1.71 1 0.1903
Treatment type 0.045 0.43 1 0.5136
Danger sign 0.143 4.88 1 0.0272*
Global test 164.04 5 0.000*
DF=degree of freedom, * significant at 5% significance level.
The scatter plots of Scaled Schoenfeld residuals in figerA3 in Appendix also used to check
PH assumption. If the PH assumption is met, Schoenfeld residuals should look horizontal
-10
12
3
ln[-ln
(Sur
vival
Prob
abilit
y)]
0 1 2 3ln(days)
ptype = SCAP ptype = nosocomial
ln(-lan survival probability) Vs lan(days) plot by ptype

42
since the scaled Schoenfeld residuals would be independent of survival time. The plots of
scaled Schoenfeld residuals against survival time for predictor duration and pneumonia type
were also slightly upward and downward (not horizontal). These also revealed that there is a
violation of the proportional hazard assumption for the predictor duration and pneumonia
type. Thus, we doubt the accuracy of the PH assumption and consider the AFT model for this
data set
By Adding Time Varying Covariate in Cox-PH Model
Another way to test the proportional hazard assumption is to create time-varying covariates
by generating interactions between predictors and a function of survival time. The output in
appendix Table A2 indicates that the p-value of the predictors,duration and danger sign was
less than 0.05, indicating that the proportional hazard assumption was not satisfied and
duration and danger sign were time dependent predictors.
4.5. Accelerated Failure Time (AFT) Model
When PH assumptions were not satisfied, the parametric AFT model should be used instead
of the Cox model (Klein J., 2005). Since the p-value of the goodness of predictorswas
significant for the variable duration, pneumonia type and danger sign. In this case AFT model
is appropriate for the data as discussed in section 3.10. So, the study fitted the data using
accelerated failure time model withExponetial,Weibull, Lognormal and Log-logistic as a
baseline distribution.
4.5.1.Multivariable Analysis and Model Comparison
As discussed in section 3.10, εi is a random variable assumed to have a particular
distribution.Multivariable analysis of exponential, Weibull, log-normal and log-logistic
parametric models were done by using all significant predictors in the final multivariable cox
PH model at 5% level of significance.In all used models of multivariable analysis pneumonia
type, danger sign, duration, insurance status and treatment type were used and model
comparison was done using those predictors.
From table 4.7, we see the value of AIC or BIC of the four parametric models, AIC or BIC
was used to compare the model. The AIC and BIC value of Log-logistic AFT model were
155.58 and 188.70 respectively and they are smallest. This indicates that the log-logistic
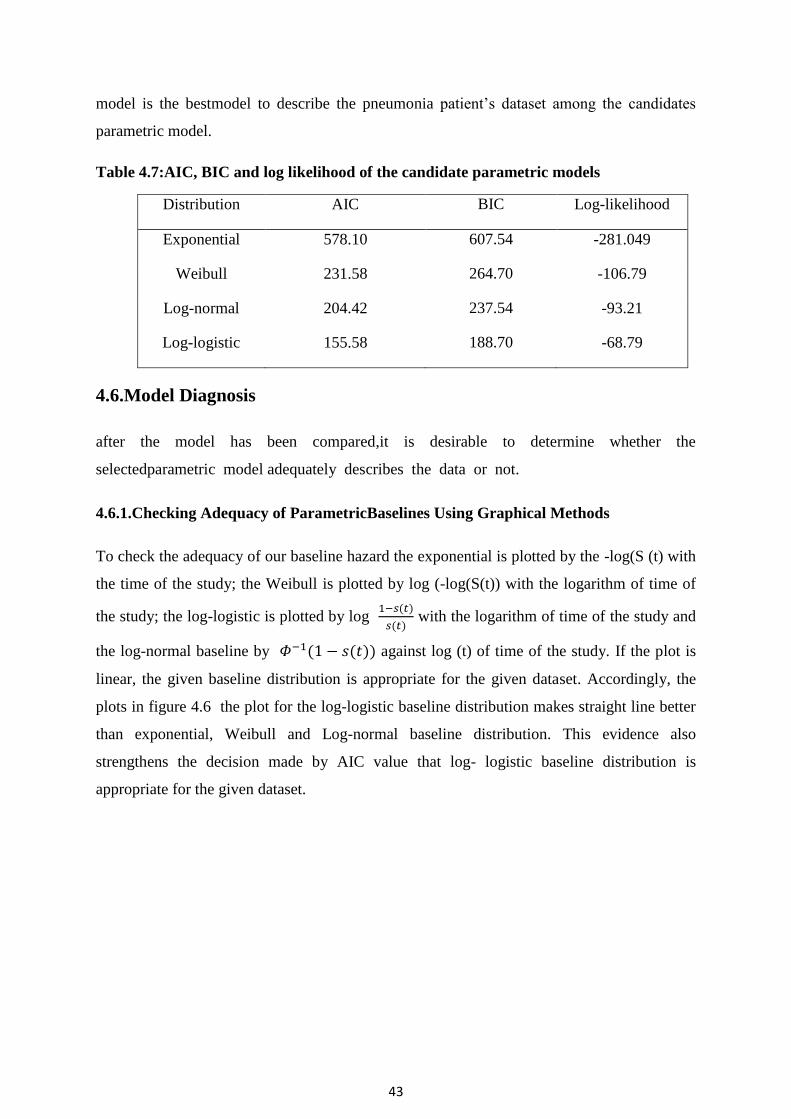
43
model is the bestmodel to describe the pneumonia patient‘s dataset among the candidates
parametric model.
Table 4.7:AIC, BIC and log likelihood of the candidate parametric models
Distribution AIC BIC Log-likelihood
Exponential 578.10 607.54 -281.049
Weibull 231.58 264.70 -106.79
Log-normal 204.42 237.54 -93.21
Log-logistic 155.58 188.70 -68.79
4.6.Model Diagnosis
after the model has been compared,it is desirable to determine whether the
selectedparametric model adequately describes the data or not.
4.6.1.Checking Adequacy of ParametricBaselines Using Graphical Methods
To check the adequacy of our baseline hazard the exponential is plotted by the -log(S (t) with
the time of the study; the Weibull is plotted by log (-log(S(t)) with the logarithm of time of
the study; the log-logistic is plotted by log ( )
( ) with the logarithm of time of the study and
the log-normal baseline by ( ( )) against log (t) of time of the study. If the plot is
linear, the given baseline distribution is appropriate for the given dataset. Accordingly, the
plots in figure 4.6 the plot for the log-logistic baseline distribution makes straight line better
than exponential, Weibull and Log-normal baseline distribution. This evidence also
strengthens the decision made by AIC value that log- logistic baseline distribution is
appropriate for the given dataset.

44
Figure 4.6: Log-logistic baseline distributions plot of pneumonia patient
The likelihood ratio test in Table 4.8 shows that the model is significant and the log
likelihood values of the null model and the full model indicates that the model had a
significant improvement after the covariates were added in the model.
Table 4.8:the likelihood ratio and significance of the Log- logistic AFT model
Loglik(intercept only) Loglik(model) Chisq DF Sig
-273.12 -68.79 408.66 7 0.000
4.6.2. Cox-Snell Residual Plot
The Cox-Snell residuals are one way to investigate how well the model fits the data. The plot
for fitted model of residuals for log-logistic to our data via maximum likelihood estimation
with cumulative hazard functions is given in figure 4.7, If the model fits the data, the plot of
cumulative hazard function of residuals (H) against Cox-Snell residuals should be
approximately a straight line on the line with the unit slope. It suggested that log-logistic AFT
model is appropriate for survival time of under-five pneumonia patient data set as seencox-
snell plots of AFT models in figure A4 in Appendix.
Figure 4.7: Cox- Snell residuals plots of log-logistic baseline distribution
logo
dd
s
logt0 2.99573
-2.91957
4.11595
02
46
810
0 2 4 6 8 10Cox-Snell residual
H Cox-Snell residual

45
Let‘s now look at the martingale-like and deviance residuals. We use the term ―martingale-
like‖ because, although these residuals do not arise naturally from martingale theory for
parametric survival models as they do for the Cox proportional hazards model, they do share
similar form. Martingale residuals take values between −∞ and 1 and therefore are difficult to
interpret. For this reason, deviance residuals are preferred for examining model accuracy and
identifying outliers. The deviance residuals are a rescaling of the martingale-like residuals so
that they are symmetric about zero and thus more like residuals obtained from linear
regression. Plots of either deviance residuals against the linear predictor (that is, the log
relative hazard in PH models) or of deviance residuals against individual predictors can be
useful in identifying aberrant observations and in assessing model fit. Continuing with our
under-five pneumoniapatient data, we plot the deviance and martingale-like residuals
obtained after fitting a log-logistic model: As shown figure A5 in appendix, it shows that the
log-logistic AFT model devianceresidualstoberelativelywellbehaved,
withafewminorearlyexceptions.
4.7. Results From AFT Model
Model diagnostics were presented in section 4.6 suggested that the Log-logistic AFT model
was good fit the under-five pneumonia patient dataset. An acceleration factor greater than one
(positive coefficient) indicates extending the recovery time while an acceleration factor less
than one (negative coefficient) indicates shortenedrecovery time.Time elapsed to seek care,
insurance status and treatment type were significant at 5% significance level.The output of
the final log-logistic AFT model is presented in Table 4.9. This output showedchildren‘s with
sever pneumoniapatients with Treatment type taken at the time of diagnosis:ceftriaxone
Ampicillin and combined and children who were insured were significantly shortenedsurvival
time of children‘s with sever pneumonia while patients with Time elapsed to seek
careprolong the survival time of pneumonia patients in Debre Markos Comprehensive
Specialized Hospital.From table 4.9, the estimated acceleration factor for patients with
treatment type ceftriaxone is 0.883 with (95% CI: 0.810, 0.962).The confidence interval for
the acceleration factor did not include one and P-value is small (p=0.004). This indicates
patients who take treatment type ceftriaxone at the time of diagnosis have less survival time
than patients with treatment type crystalline penicillin. Similarly acceleration factor for
patients with treatment type Ampicillin are estimated to be 0.842 with [95% CI: 0.759, 0.933]
the CI did not include one and P-value is small (p = 0.001). This implied that children

46
whotake treatment type Ampicillinshortened the recovery time by a factor of 0.842compared
to crystalline penicillin.Likewise acceleration factor for patients who take treatment type
combined is estimated to be 0.912 with [95% CI: 0.842, 0.986] the CI did not include one
and P-value is small (p=0.022). As shown in Table 4.9 the estimated acceleration factor for
patients who were insured estimated to be 0.904 with [95% CI (0.845, 0.967)] the confidence
interval for the acceleration factor did not include one and P-value is very small. This
indicates patients who were member of social health insurance (insured) shortenedthe
survival time by factor of 0.904 than patients who were not insured. Similarly the
acceleration factor for time elapsed to seek care is 1.256, the p value is small it indicates that
duration is significant factor for the recovery time of pneumonia patients.it shows that for a
one day increase in time elapsed to seek care (duration) the recovery time of patients from
pneumonia were prolonged by 1.256 times in days.
Table 4.9: Summary result of the final Log-logistic AFT model ofpneumonia patients
Variable Category SE Sig 95% CI ( )
Danger sign No (ref)
Yes 0.005 0.035 0.988 1.001 (0.933 1.072)
Insurance
status
Not insured(ref)
Insured -0.101 0.034 0.003* 0.904 (0.8450.967)
Pneumonia
type
SCAP(ref)
Nosocomial 0.068 0.036 0.056 1.071 (0.998 1.149)
Treatment
type
Crystalline
penicillin(ref)
Ceftriaxone -0.125 0.044 0.004* 0.883 (0.8100.962)
Ampicillin -0.172 0.052 0.001* 0.842 (0.7590.933)
Combined -0.092 0.0402 0.022* 0.912 (0.8420.986)
Duration 0.228 0.0075 0.000* 1.256 (1.237 1.274)
Constant 0.534 0.0502 0.000 1.705 (1.545 1.881)
AIC=155.6BIC=188.7gamma =1/p =0.142
P=Shape parameter, Indicates Acceleration factor; 95%CI( ): 95% confidence interval for
acceleration factor, S.E standard error for the coefficient and * indicatessignificant at 5%
significance leve.

47
5.DISCUSSION,CONCLUSIONS AND RECOMMENDATION
5.1. Discussion
Pneumonia in under- five children is a leading cause of morbidity and mortality in Ethiopia
and other developing countries. Time to recovery and its determinant factors of under-five
pneumonia are important for planning child health care services, for proper management and
prevention strategy of under-five pneumonia.The objective of this study was to identify the
determinant factors of time to recovery of under-five pneumonia patients in Debre Markos
comprehensive specialized hospital. For determining the associated factors of time-to
recovery of under-five pneumonia patients; a total of 293 patients were included in the study
out of those patients 70.65% were recovered from their illness and this study is agreed with
study conducted at Bushulo Major Health Center that is 75.5% by (Zinabu et al., 2014) and
with the Global, regional and national causes of child mortality report that is 73.3% by (Li
Liu, 2012). The average length of stay in the hospital for children with severe pneumonia was
about 4 days. This study agrees with study conducted in Sidama Zone Wondo Genet District
by (Teshome, 2017), children were not insured more exposed than children who were
insured and patients who were taken ceftriaxone, crystalline penicillin and combined had
high proportion of recovery.
In this study nonparametric method, semi-parametric and parametric survival models were
applied. None parametric method is used to compare the difference between each categorical
covariate based on Kaplan-Meier estimation method. The semi-parametric survival analysis
using Cox PH model was fitted and the assumptions cox PH model was checked using
graphical method and schoenfeld residuals and assumptions were violated for Cox PH model.
Then the researcher introduced an alternative model for Cox PH model which is parametric
AFT survival model to fit the pneumonia data in Debre Markos comprehensive specialized
hospital. The researcher used different types of the baseline distributions to fit AFT models
for pneumonia dataset in Debre Markos comprehensive specialized hospital. The baseline
distributions used in this study were Exponential, Weibull, Log-normal and Log-logistic. The
log-logistic AFT model was selected as good AFT model thanWeibull, Exponential and log-
normal model based on comparison criteria with smaller AIC value. The overall median
recovery time from sever pneumonia was 5 days (mean = 5 days; standard deviation=3 days).
This study is almost consistent with the Researchers conducted a study in Uganda,

48
Mulagohospital to compare clinical outcomes in children suffering from Asthma and
Pneumonia, the median duration of hospital stay to recover from pneumonia was 4 days
(Nantanda et al., 2014) and the study conducted in rural health center of Gambia which
reported that the mean time of recovery was 4.5 days(Kuti et al., 2014) and in Taiwan, the
median time to stability/recovery after admission for patients with pneumonia was 5 days
(mean = 6 days; range = 0 to18 days) (Huang, Chang et al. 2015). The finding of this study is
higher than the study done in Vanderbilt (2.3days) and Nepal (2days)(Wolf et al., 2015)
and(Basnet et al. 2015) respectively.This variation might be due to socio-economic in the
study areas and harshness differences. This finding is lower than the study finding in Poland
on trends in hospitalization of children with bacterial pneumonia that reported 10.1 to 8.2
days (Gajewska et al., 2016). This discrepancy might be due to the time difference in which
the studies were conducted. As it was conducted from 2010 to 2011, different things such as
treatment protocol which could reduce hospitalization period have been done after it. Another
possible reason for this inconsistency might be related to differences in treatment and other
practices, health care settings and other socioeconomic factors between areas where the
studies were conducted.
In this study treatment type taken at the time of diagnosis, patient‘s insurance status and time
elapsed to seek care were statistical significant predictors for the survival status of pneumonia
patients. But in different studies for instance study conducted by (Mitiku, 2019) the
predictors age, comorbidity, duration and danger sign were significant predictor for the
survival time of pneumonia patients and study conducted by (Abate and Tadesse, 2019) in
south west Ethiopia the predictors, sex, residence, season of diagnosis and comorbidity were
significant predictors for time to death of pneumonia patients. This difference may be due to
study area, time and socio economic and demographic status of study populations.
In this study the time elapsed to seek care was Also a predictor that had a significant effect in
the time to recovery from Sever pneumonia. Patients who presented to the hospital early
(preceding by one day of an illness) recovered sooner than those children presented late. This
finding is consistence with study conducted by (Mitiku, 2019).This may due to the fact that
as progression of disease increased, the required time to recover from it also increases. it is
significant on a prospective study conducted in Gambia (Kuti et al., 2014).The findings of
this study also showed that the patient‘s insurance status was a significant factor. That is
patients who were insured had shorter survival time than patients were not insured this study

49
is not agree with several studies (Abate and Tadesse, 2019) this difference result may be due
to socio-economic status of patients family, because health insurance uses for low income
country. Since, it protects insured persons from paying high treatment costs in the event of
sickness (Conn and Walford, 1998) andNational health insurance membership is associated
with increased access to and utilization of health care(Sarpong et al., 2010). The other
important predictor which was significantly and strongly associated with recovery time from
sever pneumonia is the Treatment type taken during diagnosis. In this study it was found that
Patients whose treatment type taken at the time of diagnosis were ceftriaxone, Ampicillin and
combined have shorten timing of recovery and had high risk of recovery from pneumonia as
compared with crystalline penicillin. This result agrees with study conducted by (Don et al.,
2010).This may be due to different reasons like, content of treatment type and efficacy of
treatment type. But this variable is not significant in the study conducted by (Mitiku, 2019).
5.2. Conclusion
This study used survival time of under-five pneumonia patients‘ dataset of those patients who
started their pneumonia treatment from 2018-2020 years with the aim of determining
thedeterminant factors of time-to-recovery of under-five pneumonia patients in Debre Markos
Comprehensive specialized hospital. Out of the total 293 under-five pneumonia patients who
started Pneumonia treatments, about 70.65% were recovered at the end of the study. The
estimated median survival time of under- five pneumonia patients was 5 days.
To determine the associated factors of survival time of under-five pneumonia patients, Cox
PH model was used and the PH assumption was checked by graphical, scheonfeld residual
plot and global test. Then AFT model was fitted because the assumption of Cox proportional
model was violated. Different AFT models by using different baseline distributions were
applied. Among them using AIC, Log-logistic AFT model is better fitted survival time of
under-five pneumonia patients‘ dataset than other AFT base line distributions.
The best model to fit the data to explain survival time of children with severe pneumonia
dataset in Debre Markos Comprehensive Specialize Hospital was the Log-logistic AFT
model, which was revealed using the graphical technique and Cox-Snell residuals plots.
In Debre Markos Comprehensive Specialized Hospital, the results of a Log-logistic AFT
model revealed that time elapsed to seek care, treatment type taken at the time of diagnosis,
and insurance status were found to be important predictors of recovery time for under-five
50
pneumonia patients. Patients' treatment types at the time of diagnosis were ceftriaxone,
ampicillin, and combination, and patients who were insured had considerably shorter
recovery times (higher survival experience). While a one-day increase in duration (late
presenter) lengthened the time it took for a child to recover from pneumonia.
5.2. Recommendation
Based on the finding of the study the following recommendations were made for ministry of
health, policy makers, the community at large, Debre Markos comprehensive specialized
Hospital and researcher.
The recovering time from pneumonia was prolonged on children who were not
member of social health insurance (not insured) and on Duration prior to seeking care
of Children who presented to the hospital lately.Caretakers are expected to train their
parents to become members of social health insurance in order to reduce the time it
takes for their children to recover from pneumonia and When their children become
ill, parents or caregivers should take them to a medical facility right away and.
Since ceftriaxone, ampicillin and a combination of these therapies were found to
reduce the time it took to recover from pneumonia when given at the time of
diagnosis, health care professionals should give these therapies at the time of
diagnosis.
Since some determinant factors for pneumonia patients are not included in the study,
the Federal Ministry of Health should create well-designed pediatric registration
charts for all hospitals and health facilities that cover all risk variables for future
research.
51
REFERENCE
Aaserud, S., Kvaløy, J. T. & Lindqvist, B. H. 2013. Residuals and functional form in
accelerated life regression models. Risk Assessment and Evaluation of Predictions.
Springer.
Abate, L. & Tadesse, M. 2019. South West Ethiopia‖. International Journal of Current
Research.
Abdel Mohsen, A., et al. (2019). "Acute Respiratory Tract Infection (ARI) in Children
Under-five Years; Study of Prevalence, Risk Factors and Outcome in Minia
University Children Hospital, Egypt." International Journal of Pediatrics
Akaike, H. (1974) ‗A New Look at the Statistical Model Identification‘, IEEE Transactions
on Automatic Control, 19(6), pp. 716–723. doi: 10.1109/TAC.1974.1100705.
Allison, P. D. (2010). Survival analysis using SAS: a practical guide, Sas Institute.
Andualem, Z., Adane, T., Tigabu, A., Yallew, W. W., Wami, S. D., Dagne, H., Azanaw, J.,
Guyasa, G., Azene, Z. N. & Endalew, M. (2020). Pneumonia among Under-Five
Children in Northwest Ethiopia: Prevalence and Predictors—A Community-Based
Cross-Sectional Study. International journal of pediatrics, 2020.
Ásbjörnsdóttir, K. H., Slyker, J. A., Weiss, N. S., Mbori-Ngacha, D., Maleche-Obimbo, E.,
Wamalwa, D. & John-Stewart, G. 2013. Breastfeeding is associated with decreased
pneumonia incidence among HIV-exposed, uninfected Kenyan infants. AIDS
(London, England), 27, 2809.
assfaw, T., Yenew, C., Alemu, K., Sisay, W. & Geletaw, T. 2021. Time-to-Recovery from
Severe Pneumonia and Its Determinants Among Children Under-Five Admitted to
University of Gondar Comprehensive Specialized Hospital in Ethiopia: A
Retrospective Follow-Up Study; 2015–2020. Pediatric Health, Medicine and
Therapeutics, 12, 189.
Basnet, S., et al. (2015). "Predictors of duration and treatment failure of severe pneumonia
inhospitalized young Nepalese children." PLoS One 10(3).
52
Bekele, F., et al. (2017). "Factors associated with outcomes of severe pneumonia in children
aged 2 months to 59 months at jimma university specialized hospital, southwest
Ethiopia." Current Pediatric Research.
Bartlett, J. G., O'keefe, P., Tally, F. P., Louie, T. J. & Gorbach, S. L. 2009. Bacteriology of
hospital-acquired pneumonia. Archives of internal medicine, 146, 868-871.
Campbell, H. & Nair, H. 2015. Child pneumonia at a time of epidemiological transition. The
Lancet Global Health, 3, e65-e66.
Conn, C. P. & Walford, V. 1998. An introduction to health insurance for low income
countries. London: Institute for Health Sector Development.
Collett,D,2003. Modelling survival data in medical research.second. , London: chapman and
Hall
Collett, D. (2015). Modelling survival data in medical research, CRC press.
Collett,D,2003. Modelling survival data in medical research.second. , London: chapman and
Hall
Cox, D. R. And Snell, E. J. (1968) ‗A General Definition of Residuals‘, Journal of the Royal
Statistical Society: Series B (Methodological), 30(2), pp. 248–265. doi:
10.1111/j.2517-6161.1968.tb00724.x.
CSA. (2012). Central Statistical Agency ,Addis Ababa, Ethiopia. Measure DHS, ICF Macro
Calverton, Maryland, USA. Ethiopia Demographic and Health Survey.
Crighton, E. J., Elliott, S. J., Moineddin, R., Kanaroglou, P. & Upshur, R. 2007. A spatial
analysis of the determinants of pneumonia and influenza hospitalizations in Ontario
(1992–2001). Social science & medicine, 64, 1636-1650.
David, W. And L. Hosmer (1999). Applied survival analysis: regression modeling of time to
event data, Wiley-Interscience.
Driscoll, A., Grant, M. J., Carroll, D., Dalton, S., Deaton, C., Jones, I., Lehwaldt, D., Mckee,
G., Munyombwe, T. & Astin, F. 2018. The effect of nurse-to-patient ratios on nurse-

53
sensitive patient outcomes in acute specialist units: a systematic review and meta-
analysis. European Journal of Cardiovascular Nursing, 17, 6-22.
Geleta, D., et al. (2016). "Determinants of community acquired pneumonia among children in
Kersa District, Southwest Ethiopia: facility based case control study." J Pediatr
Neonatal Care 5(2): 00179.
Higgins-Steele, A., et al. (2017). "Ending Preventable Child Deaths from Pneumonia and
Diarrhoea in Afghanistan: An Analysis of Intervention Coverage Scenarios Using the
Lives Saved Tool." Journal of tropical medicine 2017
Hosmer, D. (1999) ‗Hosmer D.W., Lemeshow S. Applied Survival Analysis.pdf‘.Huang, C.-
Y. et al. (2015). "Risk factors of progressive community-acquired pneumonia
inhospitalized children: A prospective study." Journal of Microbiology, Immunology
and Infection48(1): 36-42.
Kadane, J. B. & Lazar, N. A. 2004. Methods and criteria for model selection. Journal of the
American statistical Association, 99, 279-290.
Kieninger, A. N. & Lipsett, P. A. (2009). Hospital-acquired pneumonia: pathophysiology,
diagnosis, and treatment. Surgical Clinics of North America, 89, 439-461.
Kleinbaum, D. G. and M. Klein (2005). "Competing risks survival analysis." Survival
Analysis: A self-learning text: 391-461.
Kuti, B. P., Adegoke, S. A., Oyelami, O. A. & Ota, M. O. 2014. Predictors of prolonged
hospitalisation in childhood pneumonia in a rural health centre. South African Journal
of Child Health, 8, 11-15.
Lee, E, Wang, J.(2003). Statistical model for survival analysis. 3rd. ed. Wiley, New
York,2003.
Lemeshow, S. And S. May (2008). Applied survival analysis: regression modeling of time-to-
event data, Wiley.
Liu, L., Oza, S., Hogan, D., Chu, Y., Perin, J., Zhu, J., Lawn, J. E., Cousens, S., Mathers, C.
& Black, R. E. (2016). Global, regional, and national causes of under-5 mortality in

54
2000–15: an updated systematic analysis with implications for the Sustainable
Development Goals. The Lancet, 388, 3027-3035.
Leung, D. T. (2016) Prevention and Control of Childhood Pneumonia and Diarrhoea. .
Paediatric clinics, 63(1), 67-79.
Ma, C., Gunaratnam, L. C., Ericson, A., Conroy, A. L., Namasopo, S., Opoka, R. O. &
Hawkes, M. T. 2019. Handheld point-of-care lactate measurement at admission
predicts mortality in Ugandan children hospitalized with pneumonia: a prospective
cohort study. The American journal of tropical medicine and hygiene, 100, 37-42.
Mcallister, D. A., Liu, L., Shi, T., Chu, Y., Reed, C., Burrows, J., Adeloye, D., Rudan, I.,
Black, R. E. & Campbell, H. (2019). Global, regional, and national estimates of
pneumonia morbidity and mortality in children younger than 5 years between 2000
and 2015: a systematic analysis. The Lancet Global Health, 7, e47-e57.
Mengist, B., Tesfa, M. & Kassie, B. (2020). Time to recovery and predictors of severe
community-acquired pneumonia among pediatric patients in Debre Markos referral
hospital, North West Ethiopia: A retrospective follow-up study. PloS one, 15,
e0239655.
Miller, N., Amouzou, A., Tafesse, M. Amd Hazel E. (2014) Integrated Community Case
management of common childhood illness in Ethiopia: implementation strength and
quality of care. The American journal of tropical medicine and hygiene, 91(2), 424-
434.
Mitiku, B. M. (2019). Time To Recovery And Its Predictors Among Severe Community
Acquired Pneumonia Patients Admitted To Pediatric Ward, Debre-markos Referral
Hospital, North West Ethiopia, Retrospective Follow-up Study, 2019.
Musa, U. K. (2018). Assessment of House to House Inspection Manual in the Control of
Sanitation
Nantanda, R., Ostergaard, M. S., Ndeezi, G. & Tumwine, J. K. 2014. Clinical Outcomes Of
Children With Acute Asthma And Pneumonia In Mulago Hospital, Uganda: A
Prospective Study. Bmc Pediatrics, 14, 1-10.

55
Nuru, A. N. (2019). Endocervical Microbial Pattern, Antibiotic Sensitivity and Complications
Seen With Septic Abortion at Kenyatta National Hospital in 2018. University of
Nairobi.
Opio, J. H. (2018). Survival of Children Aged Less Than Two Years with Pneumonia in
Mulago Hospital Kampala, Uganda, Makerere University.
Pires, S. M., Fischer-Walker, C. L., Lanata, C. F., Devleesschauwer, B., Hall, A. J., Kirk, M.
D., Duarte, A. S., Black, R. E. & Angulo, F. J. (2015). Aetiology-specific estimates of
the global and regional incidence and mortality of diarrhoeal diseases commonly
transmitted through food. PloS one, 10, e0142927.
Porth, C. (2011). Essentials of pathophysiology: concepts of altered health states, Lippincott
Williams & Wilkins.
Pradhan, S. M., Rao, A. P., Pattanshetty, S. M. & Nilima, A. (2016). Knowledge and
perception regarding childhood pneumonia among mothers of under-five children in
rural areas of Udupi Taluk, Karnataka: A cross-sectional study. Indian Journal of
Health Sciences and Biomedical Research (Kleu), 9, 35.
Reed, R. A. (2015). An investigation into the role of HIV exposure status in infectious
disease mortality in children in Western Cape, University of Cape Town.
Requejo, J. H., Bryce, J., Barros, A. J., Berman, P., Bhutta, Z., Chopra, M., Daelmans, B., De
Francisco, A., Lawn, J. & Maliqi, B. (2015). Countdown to 2015 and beyond:
fulfilling the health agenda for women and children. The Lancet, 385, 466-476.
Rizopoulos, D. (2012). Joint models for longitudinal and time-to-event data: With
applications in R, CRC press.
Rudan, I., Boschi-Pinto, C., Biloglav, Z., Mulholland, K. & Campbell, H.(2008).
Epidemiology and etiology of childhood pneumonia. Bulletin of the world health
organization, 86, 408-416B.
Schoenfeld, D. (1982). "Partial residuals for the proportional hazards regression model."
Biometrika 69(1): 239-241.

56
Shibre, G. (2015). Assessment of the prevalence and associated factors of pneumonia in
children 2 to 59 months old, Debreberhan district, North East Ethiopia. M. Sc.
Dissertation. Addis Ababa University, Ethiopia.
Teshome A. (2017). Prevalence of pneumonia and factors associated among children 2-59
months old in Wondo Genet district, SNNPR, Ethiopia . Curr Pediatr Res , 21 (1): 19-
25.
Tessema, T. (2018). Modelling Under-Five Mortality among Hospitalized Pneumonia
Patients in Hawassa City, Ethiopia: A Cross-Classified Multilevel Analysis. Annals of
Data Science, 5, 111-132.
Therneau, T. M., et al. (1990). "Martingale-based residuals for survival models." Biometrika
77(1): 147-160.
UNICEF (2014). Pneumonia and Diarrhea Progress Report. International Vaccine Access
UNICEF. (2016) United Nations Children‘s Fund United Nations Children‘s Fund.
UNICEF & UNICEF, W. (2016). Ending child deaths from pneumonia and diarrhoea. World
Health Organization Press.
Walker, C. L. F., Rudan, I., Liu, L., Nair, H., Theodoratou, E., Bhutta, Z. A., O'brien, K. L.,
Campbell, H. & Black, R. E. (2013). Global burden of childhood pneumonia and
diarrhoea. The Lancet, 381, 1405-1416.
Wardlaw, T., You, D., Hug, L., Amouzou, A. & Newby, H.(2014). UNICEF Report:
enormous progress in child survival but greater focus on newborns urgently needed.
Reproductive health, 11, 1-4.
WHO. (2016). Pneumonia. http://www.who.int/ mediacentre/ factsheets/fs331/en/.
Wolf, R. B., Edwards, K., Grijalva, C. G., Self, W. H., Zhu, Y., Chappell, J., Bramley, A. M.,
Jain, S. & Williams, D. J.(2015). Time to clinical stability among children
hospitalized with pneumonia. Journal of hospital medicine, 10, 380-383.

57
APPENDIXES
Kaplan Meier survival time plot of under-five pneumonia Patients atDebre Markos
comprehensive specialized hospitalby Different Covariates
Figure A1: KM survival plots of under-five pneumonia patients by comorbidity
Figure A2:KM survival plots for historyARTI and Mdeficiencyof pneumonia patients
0.00
0.25
0.50
0.75
1.00
0 5 10 15 20 25analysis time
coomorbidiy = no coomorbidiy = yes
Kaplan-Meier survival estimates
0.00
0.25
0.50
0.75
1.00
0 5 10 15 20 25analysis time
historyARTI = no historyARTI = yes
Kaplan-Meier survival estimates
0.00
0.25
0.50
0.75
1.00
0 5 10 15 20 25analysis time
Mdeficiency = no Mdeficiency = yes
Kaplan-Meier survival estimates

58
Table A1: Univariate Analysis of Cox Proportional Hazards model
Variables Category SE Sig HR 95% CI for HR
Danger sign No(ref)
Yes -0.27 0.15 0.076* 0.760 (0.565 1.029)
Insurance status No(ref)
Yes 0.178 0.145 0.218* 1.195 (0.899 1.589)
pneumonia
type
SCAP(ref)
Nosocomial -0.100 0.154 0.517 0.904 (0.667 1.244)
Treatment type Crystalline
penicillin(ref)
Ceftriaxone 0.524 0.226 0.260 1.690 (0.999 2.46)
Ampicillin 0.402 0.250 0.620 1.490 (.958 2.332)
Combined 0.208 0.189 0.307 1.231 (.848 1.786)
Age 1-11(ref)
12-23 -0.13 0.175 0.607 0.878 (0.624 1.237)
24-59 0.0397 0.163 0.619 1.04 (0.756 1.431)
Season Autumn(ref)
Winter -0.302 0.270 0.264 0.712 (0.434 1.256)
Spring -0.125 0.214 0.751 0.933 (0.579 1.341)
Summer -0.095 0.234 0.611 0.885 (0.573 1.439)
historyARTI No (ref)
Yes -0.192 0.140 0.125* 0.804 (0.609 1.062)
Comorbidity No (ref)
Yes -0.108 0.139 0.118* 0.803 (0.610 1.057)
Residence Rural (ref)
Urban 0.0521 0.142 0.471 1.108 (0.837 1.467)
SAM No (ref)
Yes -0.120 0.153 0.367 0.868 (0.639 1.179)
Micro-neutral
deficiency
No (ref)
Yes 0.013 0.145 0.927 1.013 (0.762 1.347)
Sex Male (ref)
Female -0.0137 0.142 0.467 0.901 (0.682 0.192)
Duration -0.762 0.061 0.000* 0.466 (0.414 0.525)

59
* indicates statistical significant at 25% level of significance, ref if reference, SE is standard
error
Test of proportional hazards assumption by Scaled Schoenfeld residuals
Figure A3:the scaled Schoenfeld residuals plot by duration and pneumonia type
Table A2: time dependent predictors for examining PH assumption
Parameter Level P value
time*duration Continuous 0.000
time*danger sign No
Yes 0.011

60
Assessing over all goodness of model fit for the four AFT modelsusing cumulative
hazard Vs cox snell residual plot
FigureA4: Cox Snell residual plots for four AFT models of pneumonia patient‘sdata set
FigureA5: Deviance and martingale-like residualsof log-logistic AFT model
01
23
45
0 .5 1 1.5 2Cox-Snell residual (Exponential)
H Cox-Snell residual
05
10
15
20
0 5 10 15 20Cox-Snell residual (Weibull)
H Cox-Snell residual
05
10
15
0 5 10 15Cox-Snell residual (Log-Normal)
H Cox-Snell residual
02
46
81
0
0 2 4 6 8 10Cox-Snell residual
H Cox-Snell residual
-8-6
-4-2
02
ma
rtin
gale
-lik
e r
esid
ua
l
0 1 2 3 4Linear prediction
-4-2
02
4
devia
nce r
esid
ual
0 1 2 3 4Linear prediction