timing of the brain events underlying access to ... · 1 timing of the brain events underlying...
TRANSCRIPT
1
Timing of the brain events
underlying access to consciousness
during the attentional blink
Claire Sergent1, Sylvain Baillet2 and Stanislas Dehaene1
1. Institut National de la Santé et de la Recherche Médicale Unité 562,
Service Hospitalier Frédéric Joliot, Commissariat à l’Energie Atomique, Orsay, France
4, place du Général Leclerc, 91401 Orsay Cedex, FRANCE
2. Cognitive Neuroscience and Brain Imaging Laboratory, CNRS UPR 640-LENA
Hôpital de la Salpêtrière, 47, boulevard de l’Hôpital 75651 Paris Cedex 13 FRANCE
Correspondence should be addressed to CS : [email protected]
2
Abstract
In the Attentional Blink paradigm, identical visual stimuli can sometimes be fully perceived,
and sometimes not detected at all. This paradigm thus provides an optimal situation to study
the fate of non-conscious stimuli and the differences between conscious and non-conscious
processing. We correlated behavioral visibility ratings and recordings of event-related
potentials to study the temporal dynamics of access to consciousness. Intact early potentials
(P1 and N1) were evoked by not-seen words, suggesting that these brain events are not the
primary correlates of conscious perception. However, we observed a sudden bifurcation
starting around 270 ms, with a cascade of brain events exclusively evoked by seen words.
Thus, we suggest that the transition towards access to consciousness relates to the optional
triggering of a late wave of activation, which spreads through a distributed network of cortical
association areas including prefrontal cortex as an essential node.

3
INTRODUCTION
A central question in the study of conscious perception relates to the neural basis of
conscious access: what are the neural processes that allow stimulus information to be
available for explicit report? Imaging studies have shown that conscious access is
accompanied both by increased activity in perceptual areas 1-5 and by the specific involvement
of a largely distributed fronto-parietal network with increased functional connectivity 1, 6-8.
Which of those observed effects correspond to the primary correlates of conscious access?
According to some authors, the difference between conscious and non-conscious processing
primarily resides in different levels of activation in early stimulus-specific areas 4, 9. The
involvement of a parieto-frontal network would only be a consequence of this initial
difference at an early sensory stage.
However, the consistent finding that activity in a parieto-frontal network is associated
with conscious access suggests that conscious and non-conscious processing might reflect two
different modes of processing. The “global neuronal workspace model” 10 proposes that
conscious access is achieved once incoming stimulus information reaches a “global
workspace” 11 of broadly distributed areas, within which active recurrent interactions allow
amplification, maintenance and broadcasting of the information extracted. A parieto-frontal
network would play a central role in this amplification mechanism.
This model predicts the existence of a discontinuous threshold for conscious access 12-
14, a phenomenon generally observed for non-linear auto-amplified systems 15, 16. Following
an initial bottom-up wave of sensory processing, there should be a precise moment at which a
bifurcation in neural activity occurs, based on the optional triggering of reverberant activity
within the global workspace 12, 14.
4
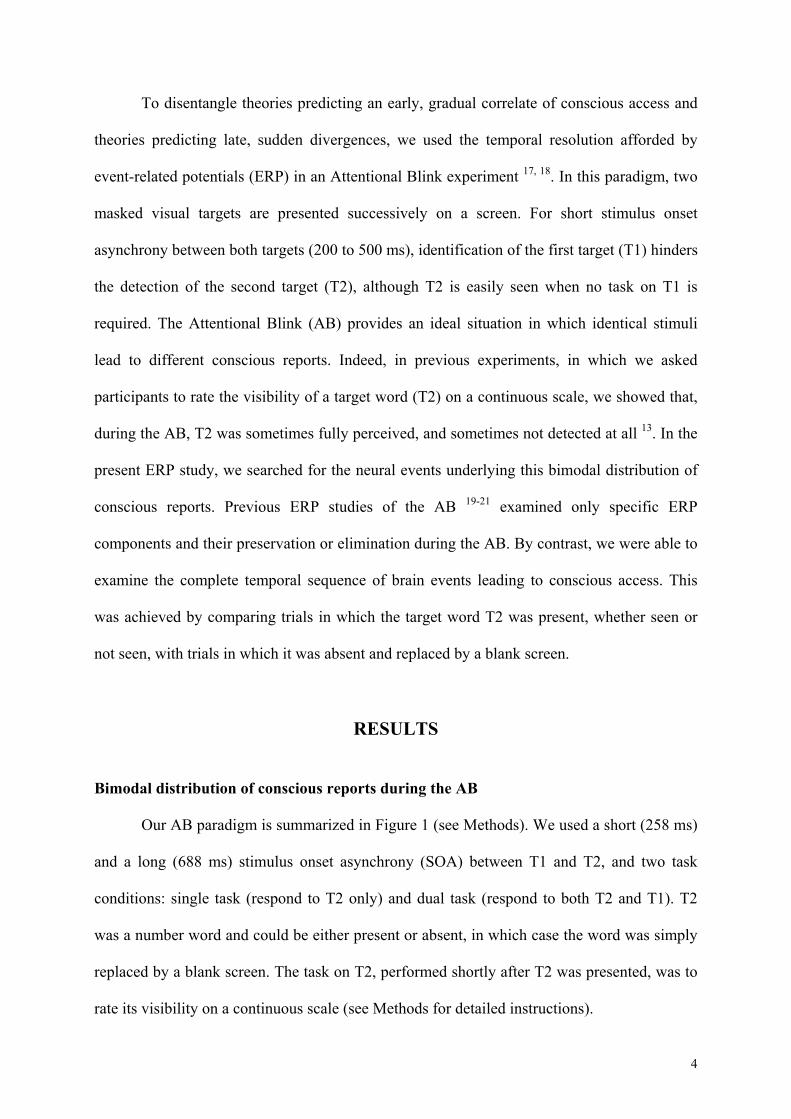
To disentangle theories predicting an early, gradual correlate of conscious access and
theories predicting late, sudden divergences, we used the temporal resolution afforded by
event-related potentials (ERP) in an Attentional Blink experiment 17, 18. In this paradigm, two
masked visual targets are presented successively on a screen. For short stimulus onset
asynchrony between both targets (200 to 500 ms), identification of the first target (T1) hinders
the detection of the second target (T2), although T2 is easily seen when no task on T1 is
required. The Attentional Blink (AB) provides an ideal situation in which identical stimuli
lead to different conscious reports. Indeed, in previous experiments, in which we asked
participants to rate the visibility of a target word (T2) on a continuous scale, we showed that,
during the AB, T2 was sometimes fully perceived, and sometimes not detected at all 13. In the
present ERP study, we searched for the neural events underlying this bimodal distribution of
conscious reports. Previous ERP studies of the AB 19-21 examined only specific ERP
components and their preservation or elimination during the AB. By contrast, we were able to
examine the complete temporal sequence of brain events leading to conscious access. This
was achieved by comparing trials in which the target word T2 was present, whether seen or
not seen, with trials in which it was absent and replaced by a blank screen.
RESULTS
Bimodal distribution of conscious reports during the AB
Our AB paradigm is summarized in Figure 1 (see Methods). We used a short (258 ms)
and a long (688 ms) stimulus onset asynchrony (SOA) between T1 and T2, and two task
conditions: single task (respond to T2 only) and dual task (respond to both T2 and T1). T2
was a number word and could be either present or absent, in which case the word was simply
replaced by a blank screen. The task on T2, performed shortly after T2 was presented, was to
rate its visibility on a continuous scale (see Methods for detailed instructions).
5
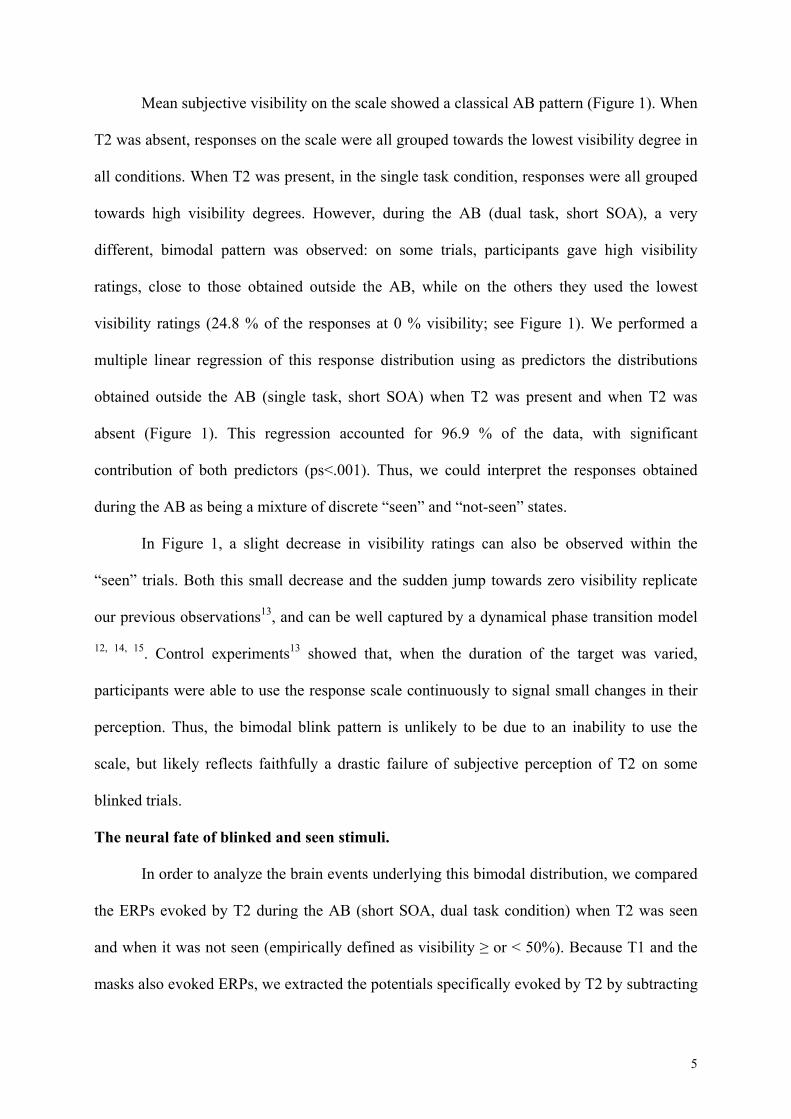
Mean subjective visibility on the scale showed a classical AB pattern (Figure 1). When
T2 was absent, responses on the scale were all grouped towards the lowest visibility degree in
all conditions. When T2 was present, in the single task condition, responses were all grouped
towards high visibility degrees. However, during the AB (dual task, short SOA), a very
different, bimodal pattern was observed: on some trials, participants gave high visibility
ratings, close to those obtained outside the AB, while on the others they used the lowest
visibility ratings (24.8 % of the responses at 0 % visibility; see Figure 1). We performed a
multiple linear regression of this response distribution using as predictors the distributions
obtained outside the AB (single task, short SOA) when T2 was present and when T2 was
absent (Figure 1). This regression accounted for 96.9 % of the data, with significant
contribution of both predictors (ps<.001). Thus, we could interpret the responses obtained
during the AB as being a mixture of discrete “seen” and “not-seen” states.
In Figure 1, a slight decrease in visibility ratings can also be observed within the
“seen” trials. Both this small decrease and the sudden jump towards zero visibility replicate
our previous observations13, and can be well captured by a dynamical phase transition model
12, 14, 15. Control experiments13 showed that, when the duration of the target was varied,
participants were able to use the response scale continuously to signal small changes in their
perception. Thus, the bimodal blink pattern is unlikely to be due to an inability to use the
scale, but likely reflects faithfully a drastic failure of subjective perception of T2 on some
blinked trials.
The neural fate of blinked and seen stimuli.
In order to analyze the brain events underlying this bimodal distribution, we compared
the ERPs evoked by T2 during the AB (short SOA, dual task condition) when T2 was seen
and when it was not seen (empirically defined as visibility ≥ or < 50%). Because T1 and the
masks also evoked ERPs, we extracted the potentials specifically evoked by T2 by subtracting

6
the ERPs evoked when T2 was absent and replaced by a blank screen (see Supplementary
Figure 1). The Supplementary video shows the complete sequence of events evoked by seen
and not-seen T2s (see also figures 2-5 and Table 1). We observed no significant difference in
the early visual P1 and N1 waves (96 and 180 ms) evoked by seen and not-seen T2s, neither
in amplitude nor in topography (Figure 2). Then, the ERPs evoked by seen and not-seen
words showed a cascade of successive bifurcations. A first difference was observed around
170 ms, with a slightly stronger positivity over central electrodes for seen T2s. Then, a major
divergence occurred around 270 ms, when seen T2s evoked a strong left-lateralized posterior
negativity (N2, 276 ms) followed by a more anterior negativity (N3, 300 ms) which was
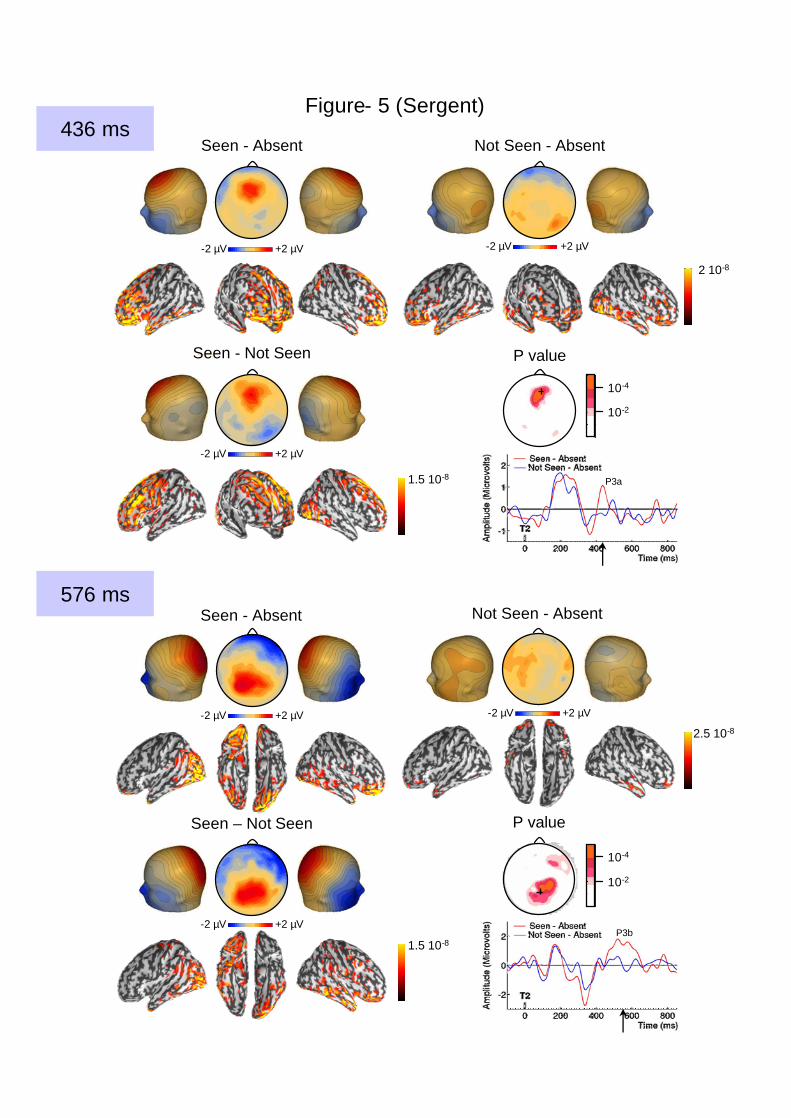
absent for not-seen T2s (Figure 3). Two subsequent waveforms (P3a, 436 ms; late P3b, 576
ms) were also present exclusively when T2 was seen (Figure 5).
Interestingly, however, processing of not-seen T2s did not abruptly stop at the time
when ERPs evoked by seen T2s began to diverge. Even after the main bifurcation around
270 ms, some waveforms still showed reduced but significant activity for not-seen T2s. While
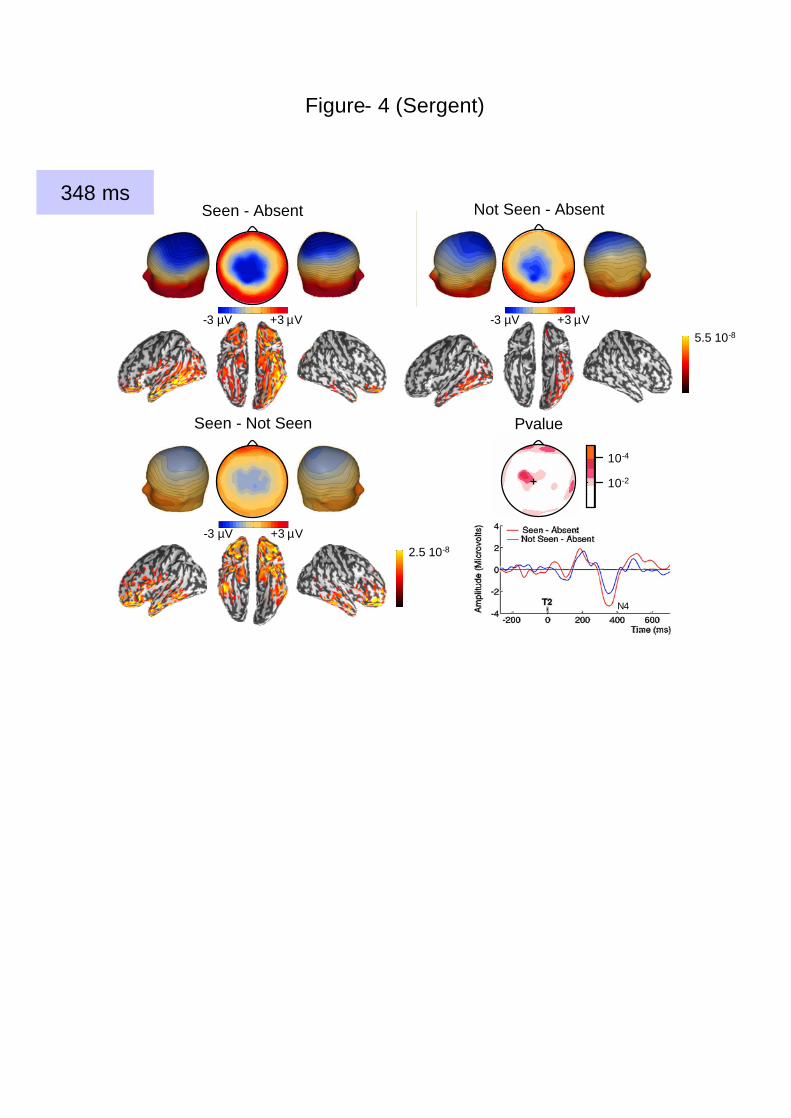
seen T2s evoked a central negativity (N4, 348 ms), this wave was also present when T2 was
not seen, with a similar topography but reduced intensity (Figure 4). Similarly, a central
positivity (early P3b, around 480 ms) was found to be transiently evoked by both seen and
not-seen T2s (significant only for 8 samples, i.e. 32 ms).
Although our primary goal was to study the temporal dynamics of access to
consciousness, our high-density ERPs recordings allowed some tentative inferences about the
cerebral localization of the underlying generators. A model of distributed cortical sources (see
Methods) allowed us to display, at each time step, the putative distribution of activity on the
inflated cortical surface (Figures 2-5) and to reconstruct the temporal profile of activation of
“reconstructed sources” at various cortical locations (Figure 6). Up to about 200 ms,
activation unfolded identically for seen and not-seen T2s over the right occipital, then the

7
bilateral occipito-temporal regions (Figure 2). Activation then expanded anteriorily into the
left temporal lobe and inferior frontal regions, where we observed a surge of activation and a
progressive divergence between seen and not-seen T2s, culminating by about 300 ms.
Elevated and durable activations (lasting ~200 to 300 ms) were then observed in bilateral
dorsolateral prefrontal, ventral prefrontal and anterior cingulate regions, and, to a lesser
extent, inferior parietal cortex, specifically when T2 was seen. Finally, in the late part of the
epoch, fronto-parietal activity remained in the right hemisphere while we observed a late left-
lateralized reactivation in posterior cortices.
Discontinuous jump in neural events correlating with the bimodal conscious report
The above analysis suggests the existence of a sudden late divergence between non-
conscious and conscious processing. However, could this apparent discontinuity be due to our
use of a binary division between seen and not-seen trials? We investigated this issue by
further subdividing the trials into four categories of visibility ratings, capable of identifying
both discrete jumps and continuous changes in event-related potentials as a function of
visibility (Figure 7; see also Methods).
The results confirmed that the ERPs evoked by T2 started to show significant changes
as a function of visibility from around 270 ms onwards. By contrast, early P1 and N1 waves
(96 and 180 ms) were not significantly affected. This was particularly notable for the strong
N1 wave, which was entirely unchanged whether T2 visibility was rated with the highest or
the lowest scores on the scale.
The intensity of the N2 wave (276 ms) decreased continuously with reduced T2
visibility. By contrast, the N3, P3a and late P3b waves again showed a discrete character: they
were only present when T2 visibility was above 50%, while below 50% visibility, T2 evoked
no significant activity in comparison to T2-absent trials (all Fs(1,12) < 1). These waves thus
8
showed an abrupt discontinuity around 50% visibility, matching the discontinuity observed in
response distributions on the scale.
This analysis also confirmed that the N4 wave (348 ms) was reduced but not
suppressed with reduced visibility, thus confirming that non-conscious processing went on
after conscious and non-conscious processing had diverged.
Causes of the blink: ERPs evoked by T1 processing during dual task
Why is the same T2 sometimes perceived and sometimes not seen? Two-stages
models of the AB postulate that, during the AB, T2 processing is denied access to a second
processing stage which has a limited capacity and is being used to process T1 22. To
investigate which neural events correspond to this second stage and might cause the AB, we
contrasted the ERPs evoked by T1 when participants did or did not perform the T1 task.
Although this contrast affected even the earliest ERPs evoked by T1 (P1, N1), its main effect
was to generate or strongly enhance a sequence of N2, P3a and P3b waveforms strikingly
similar to those evoked by seen versus not-seen T2s (Figure 8a). The contrast between “task
on T1” and “no task on T1” revealed a strong left-lateralized posterior negativity (N2,
F(1,15)=47.86; p<.0001), an anterior positivity (P3a, F(1,15)=47.81; p<.0001) and a posterior
positivity (P3b, F(1,15)=47.86; p<.0001). Thus, the presence of the T1 task, which causes the
blink, seemed to affect principally the same processing stages, indexed by the N2, P3a and
P3b waveforms, that were also found to be involved in conscious access to T2.
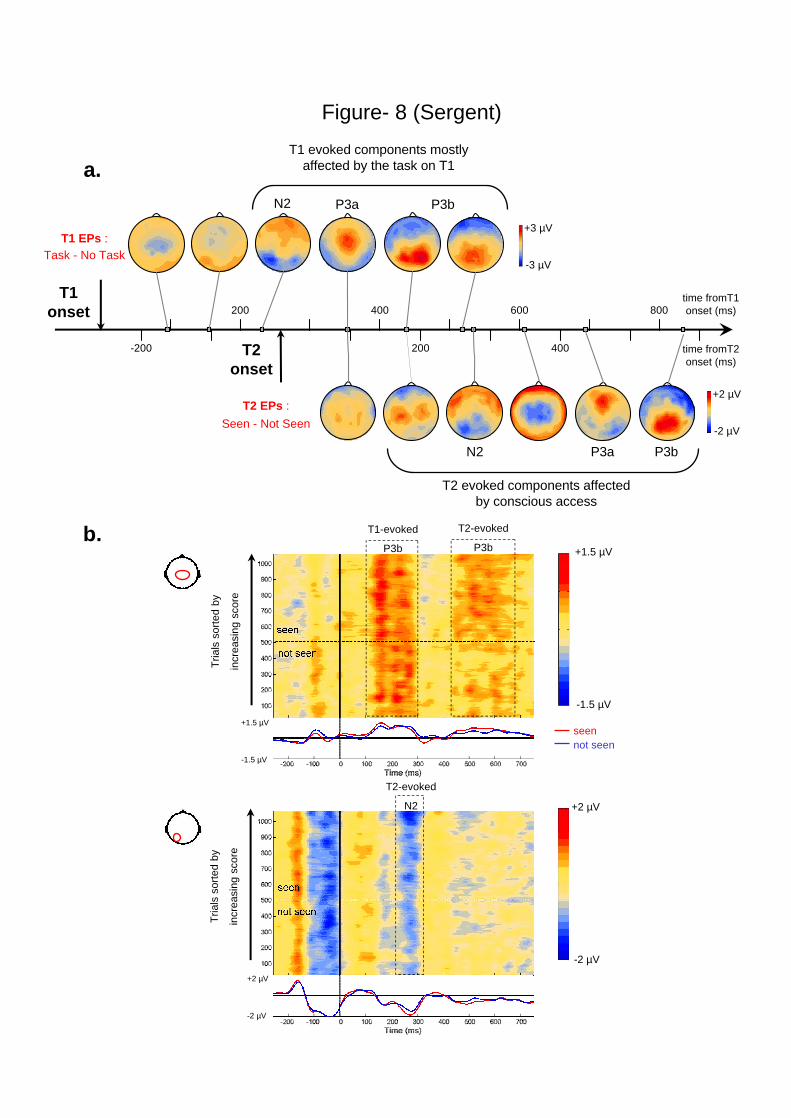
Figure 8a illustrates the temporal relation between the ERPs induced by the task on
T1, and those evoked by T2. The early T2-induced waveforms (P1 and N1), which were not
affected by the blink, coincided with the P3a and early P3b evoked by the task on T1, thus
indicating that these waveforms index non-conflicting processing stages, which can proceed
in parallel. However, the divergence between seen and not-seen T2s at 270-300 ms coincided
in time with the end of the late P3b evoked by the T1 task. Those results suggest that the entry
9
of T2 into a stage of processing indexed by N2 competes with the processes indexed by the
late P3b evoked by T1, thus leading to a “collision” between the streams of T1 and T2
processing.
Figure 8b shows the trial-by-trial relation between those components as a function of
T2 visibility. It can be observed that, when T2 is seen, the T1-evoked P3b seems to reach its
peak earlier in time, and to then decrease at a faster rate. This was confirmed by a direct
comparison of T1-evoked P3b amplitude over an early time window (100-200 ms following
T2), which indicated that the P3b was more intense over this early time period on trials where
T2 would later be seen (t(1087) = 3.4; p < .001). Conversely, over a later time window (204-
300 ms following T2) the P3b amplitude was slightly greater on trials where T2 would later
be missed (t(1087) = 2.2; p < .05). Thus, it may be suggested that trial-to-trial variability in
the duration and/or difficulty of the T1 task creates fluctuations in the amplitude and duration
of the T1-evoked P3b, thus affecting the severity of the collision between T1 and T2, and
occasionally denying conscious access to T2.
DISCUSSION
We used the attentional blink to compare the dynamics of brain activity during
conscious and non-conscious processing of identical visual stimuli. Behaviorally, we
observed a bimodal distribution of visibility scores, thus replicating our earlier results 12, 13
and suggesting the existence of a sharp bifurcation between conscious and non-conscious
processing. ERPs confirmed a sharp, sudden divergence between those two behaviorally
defined states. Previous ERP experiments have studied the effect of the AB on specific ERP
waves, for instance by comparing frequent versus infrequent T2 targets 19-21, 23. In the present
study, we used a more global subtraction (T2 present versus T2 absent), which allowed us to
extract the complete cascade of events evoked by T2, whether seen or not seen.

10
Gradual changes in perception versus discrete access to consciousness.
Some authors reject the categorical distinction between conscious and non-conscious
processing, claiming that the underlying neuronal reality might consist only in a continuum of
activation strengths in multiple areas 4, 24. Our results argue against this view by
distinguishing different classes of neural events with contrasting dynamical properties (see
Figure 7). Early visual events were essentially unaffected by the attentional blink. However,
three ERP events showed an all-or-none response, inasmuch as they were simply absent when
the word was not seen : the N3 (300 ms), the P3a (440 ms), and the late P3b (580 ms). Other
ERP events showed a more graded pattern, with clear activity on not-seen trials, but which
was more intense on seen trials: the P170 (170 ms), N2 (270 ms), and N4 (350 ms). Thus,
while a gradual reduction in the intensity of some waves (e.g. N2, N4) seem to account for a
gradual change in the perception of the target word, as reflected mainly in the variability of
visibility ratings within the seen trials, other waves (N3, P3a, P3b) exhibit a bimodal character
that correlates with the availability of this information for conscious report. We suggest that,
however detailed or degraded, the reportability of T2 information depends crucially on the
optional triggering of a cascade of distinct late events. Thus, gradual reduction in perception
and discrete access to consciousness seem to rely on different neural mechanisms.
Our data appear consistent with a two-stage model of the AB 22, according to which
T2, when blinked, receives normal perceptual processing (P1, N1), but is prevented from
accessing a second capacity-limited stage which is already engaged by T1 processing. Our
results help characterize the transition towards second-stage processing in space and time.
Indeed, this transition seems to correspond to an intermediate period of fast dynamical
divergence (170-300 ms after T2), following which most waveforms acquire their bimodal
character (being either present or absent) which is ultimately reflected in behavioral
subjective reports.

11
Putative cortical origin of the divergence between conscious and non-conscious
processing.
Can the present recordings be used to specify which brain areas are concerned by this
second stage? We emphasize that the ERP methodology cannot unambiguously license
inferences about brain localization. Nevertheless, high-density recordings do provide some
indicative evidence about localization, which was extracted here by using a model of
distributed cortical sources. This source model indicates that seen words initially gain an edge
over not-seen words within left temporal and inferior frontal regions (~300 ms), followed by
an intense spread of activation to lateral prefrontal and anterior cingulate cortices (~440 ms),
and finally extending again to posterior regions (~580 ms).
Consistent with these results, two recent MEG studies of normal word reading indicate
that, shortly after initial occipito-temporal processing, word-induced activation 25 and word
repetition effects 26 can be observed in the left inferior Rolandic cortex about 200-250 ms
after the stimulus, preceding a rapid expansion of activity to a large extent of the left and right
temporal lobes25, 26. Furthermore, compatible with our putative generators, previous studies of
the AB, using both fMRI 7 and MEG 27, have observed both anterior cingulate and lateral
prefrontal and parietal regions to be active on seen relative to blinked trials. In particular,
using spectral methods, Gross et al. 27 observed a synchronization of brain activity in the beta
frequency band (13-18 Hz) across distributed frontal, parietal, cingulate and anterior temporal
regions, in the same time window where we observed the P3a and P3b (about 500 ms post-
stimulus). This synchronization was considerably reduced on blinked trials, and was thought
to index synchronous target detection, visual attention and working memory processes.
Indeed, the P3 component is classically thought to reflect updating of working memory 28, and
its disappearance on blinked trials has been observed here and in several previous studies of
the AB using more restricted subtractions 20, 21, 29. Intracranial studies 30 further confirm that
12
the P3 relates to activation of a widespread cerebral network, dominated by associative
parietal and frontal areas.
Overall, our results are consistent with models that attribute an important role to
distributed prefrontal, parietal and cingulate activity in relation to conscious perception, as
also observed in various paradigms such as binocular rivalry 31, inattentional blindness 32,
change blindness 8 or masking 1. The role of these regions is consistent with recent
simulations of a “global neuronal workspace”, according to which suprathreshold stimuli gain
access to consciousness by mobilizing multiple distant associative areas including prefrontal,
parietal and anterior cingulate nodes, which in turn send top-down amplification signals to
stimulus-encoding processors in visual regions 12, 14. The reverberant activation would be
reflected in EEG by both the scalp P3 and high-frequency synchronization 12, 14.
Causes of the blink : a scenario for the competition between two targets
So far, few imaging studies have investigated the neural causes of the AB 23, 33. Using
fMRI, Marois et al 33 showed that increasing the attentional demands of the T1 task, which
increased the attentional blink, yielded stronger activation in the right intraparietal sulcus, the
anterior cingulate and right frontal cortex. This suggests that the capacity-limited stage
responsible for the AB involves a network of parietal and frontal areas. In the present study,
we directly investigated the effect of the principal parameter determining the AB, i.e. the
presence or absence of a task on T1. The presence of a task on T1 particularly affected the
N2, P3a and P3b components evoked by T1, namely, the same components that were also
found to correlate with conscious access to T2. This observation supports the idea that these
components index a capacity-limited stage capable of processing only one task at a time. It is
consistent with previous ERP results showing a reciprocal relationship between the size of the
P3 waves evoked by two concurrent tasks 34.
13
Based on an analysis of the temporal coincidence of these components (Figure 8a), we
further suggest that the AB is caused by a competition between the neural processes
underlying the P3b wave evoked by T1 and those underlying the N2 wave evoked by T2.
Depending on stochastic variations in the strength or duration of the P3b wave evoked by T1,
T2 would either succeed or fail to enter second-stage processing. Both stochastic variations in
the AB 12 and the role of N2-P3 competition 35, 36 were predicted by previous computational
models of the AB. Direct evidence for this mechanism was obtained in our analysis of single-
trial signal strength, which indicates that the dynamical time course of the P3b evoked by T1
correlates with the subsequent visibility of T2 (Figure 8b).
Early visual events and consciousness
Our results indicate that early visual processing, indexed by the P1 and N1 waves, is
essentially unchanged on trials where subjects ultimately report no conscious access to T2.
This observation fits with previous research showing that the early visual P1 and N1 waves
evoked by a probe flash concomitant to the presentation of T2 (a letter) are preserved during
the AB 20. However, this previous experiment did not assess consciousness of the flash, and
did not measure ERPs to T2 itself. Our results, based on direct recordings of T2-evoked
activity and a fine assessment of T2 visibility, confirm that large changes in conscious
reportability need not be accompanied by any detectable change in early visual processing.
This conclusion contrasts with another study 9 showing that, for identical low-contrast
grating patches presented at the subject’s threshold, the evoked P1 wave was larger when the
patch was detected than when it was missed. While differences were also observed in later
components (N2, P3), they were assumed to be merely reflecting the consequences of this
initial difference. Thus, the authors concluded that the P1 is the primary correlate of
consciousness, and that later waves do not contribute directly to conscious perception 9. Our
results are inconsistent with this model, and suggest a different interpretation. When visual
14
stimuli are degraded and close to threshold, as in this previous study 9, stochastic variations in
P1 amplitude might be sufficient to occasionally prevent conscious access. However, in the
AB paradigm, where the stimuli are highly contrasted and undegraded, our results show that
they can generate strong P1 and N1 components in the absence of conscious report, and
indicate that only the late components correlate with conscious access.
An alternative interpretation of the diverging results is that the neural correlates of the
conscious perception of simple grating patches reside in early visual processing (e.g.
extrastriate cortex), whereas consciousness of more complex stimuli such as words resides in
higher-level areas. However, we consider this interpretation unlikely. Although T2 was a
word, our subjects were merely asked to detect the presence of any stimulus at the time of T2
presentation, which was clearly signaled by a display of surrounding squares (see Figure 1).
Furthermore, shortly afterwards, subjects were given the opportunity to report any degree of
perception of T2. If subjects had any feeling of having seen T2, they were told to use a non-
zero visibility rating (see Methods). In spite of these methodological precautions, subjects
frequently used the zero-visibility category during the blink. The fact that even in this case the
P1 and N1 were unaffected strongly suggests that early visual processing is not sufficient, by
itself, to create a conscious percept.
This conclusion is corroborated by many observations of visual processing of non-
conscious stimuli in occipito-temporal cortex during masking 1, 37, neglect 6, blink 7, 38, or
inattention 8. Electrophysiological recordings in the macaque V1 area confirm that early
visual activation can be fully preserved on trials in which the animal reports no perception 39,
40. Only in a second phase (> 100 ms) are differential activations of V1 observed for seen
versus not-seen trials 39, presumably due to top-down inputs from other areas. Such late
amplification likely contributes to observations of correlation of V1 activity with
consciousness using non-time-resolved methods such as fMRI 41.

15
Extent of non-conscious processing
The present study also allowed us to probe the temporal extent of non-conscious word
processing during the AB. Not-seen T2s evoked several late waveforms including a robust,
though reduced, central negativity (N4, ~350 ms) and a weak, central positivity (early P3b, ~
480 ms). Thus, activity evoked by not-seen T2s can still occurs long after the bifurcation
between conscious and non-conscious processing (~200-300 ms). Similarly, using a more
restricted subtraction, Vogel and colleagues19, 20 have shown that the N400 wave evoked by
semantic mismatch is completely unaffected by the AB.
Those findings suggest an important qualification of the two-stage model: processing
of stimuli that are denied access to the second stage is not abruptly stopped at the time of the
bottleneck, but can continue for a long time within the left temporal lobe. Thus, conscious and
non-conscious processing can proceed along partially distinct and parallel anatomical
pathways, and their time courses may overlap. The results also argue against the idea of a
monotonous increase in activation strength for seen stimuli, ultimately leading to conscious
reportability 9. In fact, the processing of seen and not-seen targets seems to differ more in
terms of the topography of activation (suggestive of the involvement of a parieto-fronto-
cingulate network) than in terms of its mere strength or timing.
Acknowledgments: We thank Christoph Michel for helping us in the analysis of
topographical differences, and Mariano Sigman for helping us generate the movie. We thank
P. Coiron, J-P. Changeux, M. Sigman, V. Izard and three anonymous referees for very useful
comments. We are also grateful to R.M Leahy, J.C. Mosher, F. Darvas and D. Pantazis from
the BrainStorm and BrainSuite projects. This study was supported by INSERM and a
centennial fellowship from the Mc Donnell Foundation to S. Dehaene.

16
METHODS
Participants
Sixteen right-handed native French speakers took part in the experiment (7 women and
9 men; mean age : 24, ranging from 18 to 36). All had normal or corrected-to-normal vision.
Design and procedure
The stimuli were presented on a black background at the center of the computer screen
(70 Hz refresh) using Expe6 software 42. Each trial consisted in a simple sequence containing
five items : T1, followed by a mask, and T2 (which could be present or absent) followed by
two successive masks (see Figure 1). T1, T2 and the masks were each presented for 43 ms,
and separated by blank screens lasting 43 ms. T1 was presented either 516 ms or 860 ms after
the beginning of the trial (which started with the onset of a fixation cross). The SOA between
T1 and T2 could be either short (258 ms) or long (688 ms). A central fixation cross was
presented during the intervals. Targets and masks were strings of four uppercase letters
presented in white and subtending 4° × 1° of visual angle. T1 was either “XOOX” or
“OXXO”. When T2 was present, it was a French number word : “DEUX”, “CINQ”, “SEPT”
or “HUIT”. Four white squares (0.5° × 0.5° each), presented simultaneously with T2,
surrounded the zone where the number word was presented. In the “T2 absent” trials, the four
squares were presented on an empty screen. The masks were consonant-strings, randomly
generated using all consonants except Q, T and X.
In different blocks of trials, participants either performed only the subjective visibility
rating on T2 (single task condition) or performed also a discrimination task on T1 (dual task
condition). In both conditions, the subjective visibility judgement was performed on a
continuous scale presented 715 ms after T2 onset (i.e. 500 ms after the offset of the last
17
mask). This scale was materialized by a horizontal bar (26° × 2°), presented at the center of
the screen, labeled “not seen” at left and “maximal visibility” at right. Participants moved a
cursor on the scale by pressing two designated keys on the computer keyboard, then validated
their choice by pressing the space bar. The cursor, a vertical rectangle (1.2° × 2°), could take
21 contiguous positions on the scale by steps of 5% visibility. Its initial position was random.
At the beginning of the experiment, participants were instructed to use the scale to rate the
visibility of T2 as finely as possible without time pressure. They were told that the left end of
the scale should be used only when they were sure that they had not seen T2. If subjects had
any feeling of having seen T2, even if they were not sure, they were told to shift the cursor
away from the left extremity. They were told to use the right extremity only for crisply visible
T2s, and any intermediate locations to estimate the extent to which their perception of T2 was
degraded relative to this maximal visibility level. Previous results have established the
reliability of this procedure to measure small changes in subjective perception with small
changes in the duration of masked words using pattern masking 13.
In the dual-task condition only, once the participant had evaluated T2 visibility, they
reported whether the central letters of T1 were “OO” (T1 = “XOOX”) or “XX” (T1 =
“OXXO”).
After a short training, each participant performed a single-task and a dual-task session.
The order of the sessions was counterbalanced across participants. In the single-task session,
participants performed 32 trials per SOA × T2-presence condition. In the dual-task session,
participants performed 96 trials in the critical blink condition (T2 present at short SOA) and
48 trials in the other SOA × T2-presence conditions. Trials with an incorrect response to T1
(11% ± 5) were discarded from subsequent behavioral and ERP analysis. ‘False positive
trials’, i.e. T2 absent trials where subjective visibility was above 50%, were discarded from
the ERP analysis (less than 2% of the T2 absent trials in each condition).

18
ERP methods
ERPs were sampled at 250 Hz with a 128-electrode geodesic sensor net referenced to
the vertex. We rejected voltage exceeding ± 200 µV, transients exceeding ± 100 µV, or
electro-oculogram activity exceeding ± 70 µV. The remaining trials were averaged in
synchrony with T2 onset (or T1 onset for T1 evoked ERPs), digitally transformed to an
average reference, band-pass filtered (0.5-20 Hz) and corrected for baseline over a 250 ms
window during fixation at the beginning of the trial.
ERP analysis
Seen versus not-seen T2s. We identified time windows in which groups of electrodes
showed a significant difference between present and seen T2s (visibility ≥ 50%) and absent
T2s, as defined by sample-by-sample t-tests with a criterion of p < .05 for at least 10
consecutive samples (40 ms) on at least 10 electrodes. To then expand the analysis to compare
all three conditions (T2 present and seen, T2 present and not seen, T2 absent) and to assess
lateralization effects with a higher sensitivity, Analysis of Variance testing all possible
contrasts were performed using mean voltage over the periods and groups of electrodes
defined in the seen versus absent contrast (with an exception for the P170 wave which was
identified directly on the seen versus not-seen contrast). For bilateral waves, we separated left
and right symmetrical groups of electrodes. Note that, in the ANOVAs testing the seen versus
absent contrast, main effects were expected to be significant, as the time windows and
electrode groups were defined based on this contrast.
Four categories of visibility. For each participant, we further computed the medians of the
response distribution within the “seen” trials (visibility ≥ 50%)), and within the “not-seen”
trials (visibility < 50%)). Within each “seen” and “not-seen” categories, we distinguished
trials in which T2 received high visibility scores (above median) and low visibility scores

19
(below median). We had to discard from this analysis three participants, for whom one of the
four categories contained less than 6% of trials. For the other 13 participants, median
visibility was around 77% visibility ± 11% within the “seen” trials, and around 10% visibility
± 10% within the “not-seen” trials. The time windows and electrode groups defined in the
previous analysis (“seen versus not-seen T2s”) were used for the ANOVAs testing all possible
contrasts in this analysis.
Causes of the blink: ERPs evoked by T1 during dual task. We contrasted the ERPs evoked
by T1 when participants did or did not perform a task on T1 (dual versus single task), at short
SOA in the T2-absent condition. The different time windows and electrode groups for the
analysis were defined on the dual versus single task contrast (same criterion as above), except
for the P1 and N1 waves evoked by T1, which were clearly identifiable on the non-subtracted
ERPs.
Causes of the blink: trial-by-trial analysis. For all 16 participants, and trial by trial we
computed the mean voltage over a group of electrodes capturing the T1-evoked P3b (as
defined in the “dual versus single task” analysis) and over a group of electrodes, on the left of
the scalp, capturing the T2-evoked N2 (as defined in the “seen versus not-seen T2” analysis).
Note that electrodes belonging both to the P3b and N2 groups were discarded from the P3b
electrode group, to minimize contamination. Trial-by-trial voltages for both electrode groups
were plotted as a function of T2 visibility on the scale (Figure 8b). Using unpaired t-tests, we
then compared the T1-evoked P3b in the trials where T2 would later be seen or not seen. This
comparison was made over an early time window (358-458 ms following T1; i.e. 100-200 ms
following T2) and over a late time window (462-558 ms following T1; i.e. 204-300 ms
following T2).
Differences in topographies. The statistical tool used to assess differences in topographies
was kindly provided by Christoph Michel, who helped us conduct this analysis. Voltage maps
20
were first normalized for global field power. The dissimilarity between two conditions was
then computed as the root mean square of the differences between those two conditions at
each electrode site (Global Map Dissimilarity 43). Statistical significance of the dissimilarity
for each sample was tested using bootstrap based on 8000 random permutations of both
conditions within subjects. Topographies obtained in two conditions were considered as
significantly different if they differed at p < .05 over more than 10 consecutive samples.
Source modeling.
Cortical current density mapping was obtained using a distributed model consisting of
10,000 current dipoles. Dipole locations and orientations were constrained to the cortical
mantle of a generic brain model built from the standard brain of the Montreal Neurological
Institute, and warped to the standard geometry of the EEG sensor net using the BrainSuite
software package (http://brainsuite.usc.edu/). The warping procedure and all subsequent
source analysis and surface visualization were processed with the BrainStorm software
package (http://neuroimage.usc.edu/brainstorm). EEG forward modeling was computed
with an extension of the overlapping-spheres analytical model 44. Cortical current maps were
computed from the EEG time series using a linear inverse estimator (weighted minimum-
norm current estimate (WMNE) ; see 45 for a review).

21
Figures and Table legend
Table 1. This table summarizes the statistical results obtained for the different waveforms in
the various contrasts Not-Seen versus Absent, Seen versus Absent and Seen versus Not-Seen
during the AB (NS : not significant).
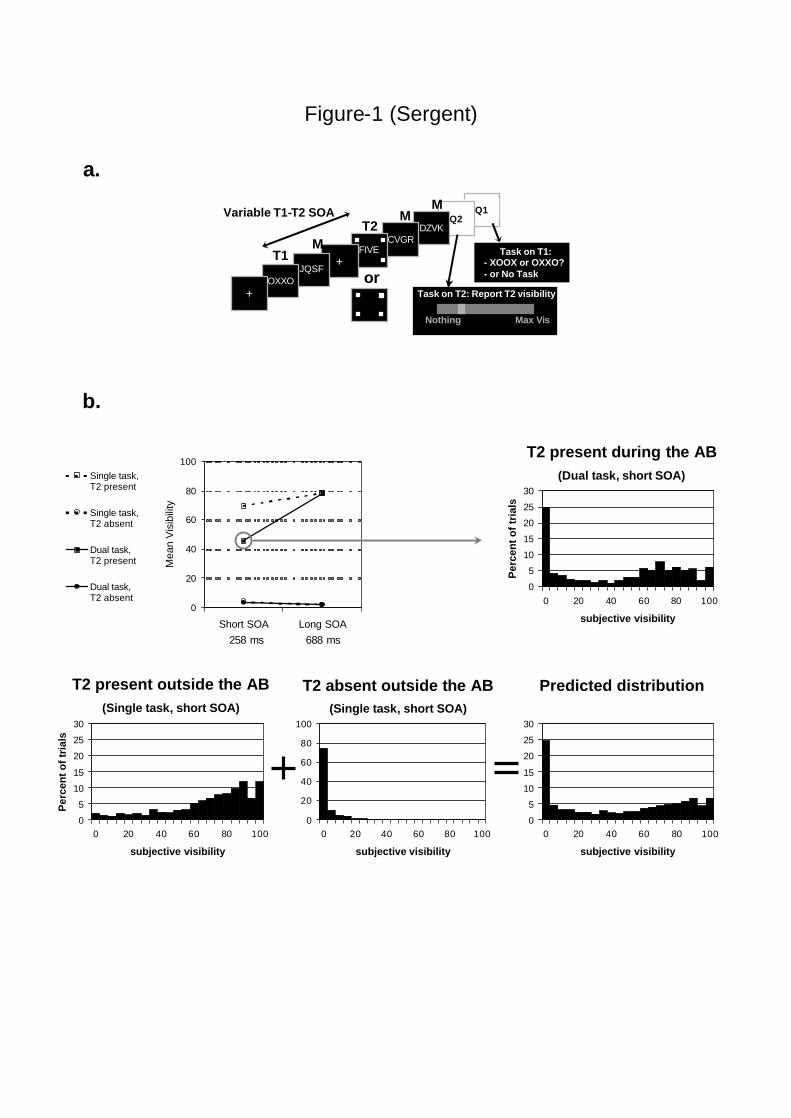
Figure 1. Experimental protocol and behavioral results recorded during the ERP session.
a. Each trial consisted in a simple sequence containing five items: T1, followed by a mask
(M), and T2 (which could be present or absent) followed by two successive masks. The SOA
between T1 and T2 could be either short (258 ms) or long (688 ms). Presentation of T2 was
signaled by 4 surrounding squares. When T2 was absent, the four squares were presented on a
blank screen. Each trial ended with a question on T2 (Q2: visibility scale) and, in the dual task
condition, a question on T1 (Q1). In the actual experiment, T2, when present, was a French
number word. b. The top left graph shows mean subjective visibility of T2 on the scale in the
various experimental conditions. When T2 was present, mean visibility rating on T2 followed
a classical AB pattern : mean visibility dropped drastically at short T1-T2 SOA only when
participants had to perform a task on T1 (task by SOA interaction : F(1,15) = 62.5; p < .0001).
Response distribution on the scale in the critical blink condition (top right graph) showed a
bimodal pattern. A combination of the response distributions observed for T2 present and T2
absent outside the AB predicted a response distribution that accounted for 97% of the
variance in the observed response distribution during the AB (bottom row).
Figure 2. Preservation of initial visual processing steps during the AB. Voltage scalp maps
evoked by T2 during the AB (dual task, short SOA) are represented for the seen minus absent,
not-seen minus absent and seen minus not-seen contrasts, at different time points after T2

22
onset (96 ms : top row; 180 ms : bottom rows). Below each voltage map, a cortical current
map accounting for the observed topography is represented on a smoothed version of the
standardized cortex (see Methods) in three different views: left view, ventral view (middle
image) and right view. Activations are expressed in current density unit (A.m), with a
threshold at 50% of the maximal current density indicated on the scale. The P1 wave (peaking
at 96 ms) and N2 wave (peaking at 180 ms) were preserved when T2 was not-seen. However,
at 180 ms there was already a significant difference between seen and not-seen T2s over
central electrodes. Electrode sites where the seen minus not-seen difference was significant at
p ≤ 10-2 (t-test for the 180 ms sample) are represented on the “P value” scalp map. The graph
below this map shows the time-course of the voltage recorded at a left central electrode site
(indicated by a cross on the ‘P value’ map). The arrow on the time axis indicates 180 ms.
Figure 3. First major divergence between conscious and non-conscious processing during
the AB. The N2 wave peaking at 276 ms (top rows) showed a major divergence between seen
and not-seen T2s. This divergence was abrupt and sudden, as can been seen on the time-
course of the voltage recorded at a left posterior electrode site (indicated by a cross on the ‘P
value’ map). The arrow on the time axis indicates 276 ms. The following N3 wave peaking at
300 ms (bottom rows) was exclusively evoked by seen T2s. This can been seen also on the
time-course of the voltage recorded at a central electrode site (indicated by a cross on the ‘P
value’ map). The arrow on the time axis indicates 300 ms. Below each voltage map, a cortical
current map accounting for the observed topography is represented on a smoothed version of
the standardized cortex (see Methods) in three different views: left view, ventral view (middle
image) and right view. Activations are expressed in current density unit (A.m), with a
threshold at 50% of the maximal current density indicated on the scale.
23
Figure 4. Reduced amplitude of a late central negativity on non-conscious trials during
the AB. Both seen and not-seen T2s evoked a central negativity peaking at 348 ms, but the
amplitude of this wave was reduced for not-seen T2s. This can been seen also on the time-
course of the voltage recorded at a central electrode site (indicated by a cross on the ‘P value’
map). The arrow on the time axis indicates 348 ms. Below each voltage map, a cortical
current map accounting for the observed topography is represented on a smoothed version of
the standardized cortex (see Methods) in three different views: left view, ventral view (middle
image) and right view. Activations are expressed in current density unit (A.m), with a
threshold at 50% of the maximal current density indicated on the scale.
Figure 5. Late positive complex exclusively evoked by seen T2s during the AB. A late
frontal positivity peaking at 436 ms (P3a, top rows) and a late parietal positivity peaking at
576 ms (parietal P3b, bottom rows) were exclusively evoked by seen T2s. The first was
relatively brief whereas the second was more sustained, as illustrated in the time-courses of
the voltage recorded at frontal (top) and parietal (bottom) electrode sites. Below each voltage
map, a cortical current map accounting for the observed topography is represented on a
smoothed version of the standardized cortex (see Methods). For the P3a wave (436 ms), the
middle image is a frontal view which reveals, among other activations, an activation in the
anterior cingulate when T2 was seen. For the late P3b wave (576 ms), the middle image
corresponds to a ventral view. Activations are expressed in current density unit (A.m), with a
threshold at 50% of the maximal current density indicated on the scale.
Figure 6. Bifurcation in the cortical activity evoked by seen and not-seen T2s.
The graphs on the right show the time courses of reconstructed cortical activation obtained at
four different sites when T2 was seen and when T2 was not seen during the AB. The various

24
selected sources are circled in black on activation maps (left), reconstructed for the seen
minus not-seen contrast, at 300 and 436 ms after T2. Activations are expressed in current
density units (A.m). Color maps are thresholded at 50% of the activation maximum.
Activation at a middle temporal site on the left increased similarly for seen and not-seen T2s
from ~ 180 to 200 ms, at which point both activation curves started to diverge. From 200 ms
onwards, activation was observed in inferior frontal, dorsolateral prefrontal and cingulate sites
only when T2 was seen. Note that the time course of the reconstructed cingulate activity for
seen T2s closely matches the time course of the P3a wave that was exclusively observed for
seen T2s.
Figure 7. Neural events underlying gradual visibility reduction versus discontinuous
conscious access.
This figure shows voltage maps obtained during the AB when further subdividing the trials
into four categories of visibility (in lines). These voltage maps are shown at various times
following T2 onset (in columns). The subdivision of the scale is illustrated on the response
distribution obtained during the AB, represented on the right, with 100% visibility at the top,
0% visibility at the bottom (reproduced from Figure 1). Gray lines indicate the separation
between the four different trial categories used in this analysis, from the lowest visibility
scores (category 1) to the highest visibility scores (category 4). (Note that separations within
the seen and not-seen categories varied across participants, see Methods) Histograms at the
bottom represent, for each ERP wave, the mean amplitude obtained in the various visibility
categories. Mean amplitude for each ERP wave was calculated using the electrodes and time
windows identified in the previous “seen versus not-seen” analysis. Below each histogram are
indicated the statistical significance of the main effect of visibility category. There was no
significant effect of visibility on the P1 and N1 waves. Conversely, the amplitude of the N2
25
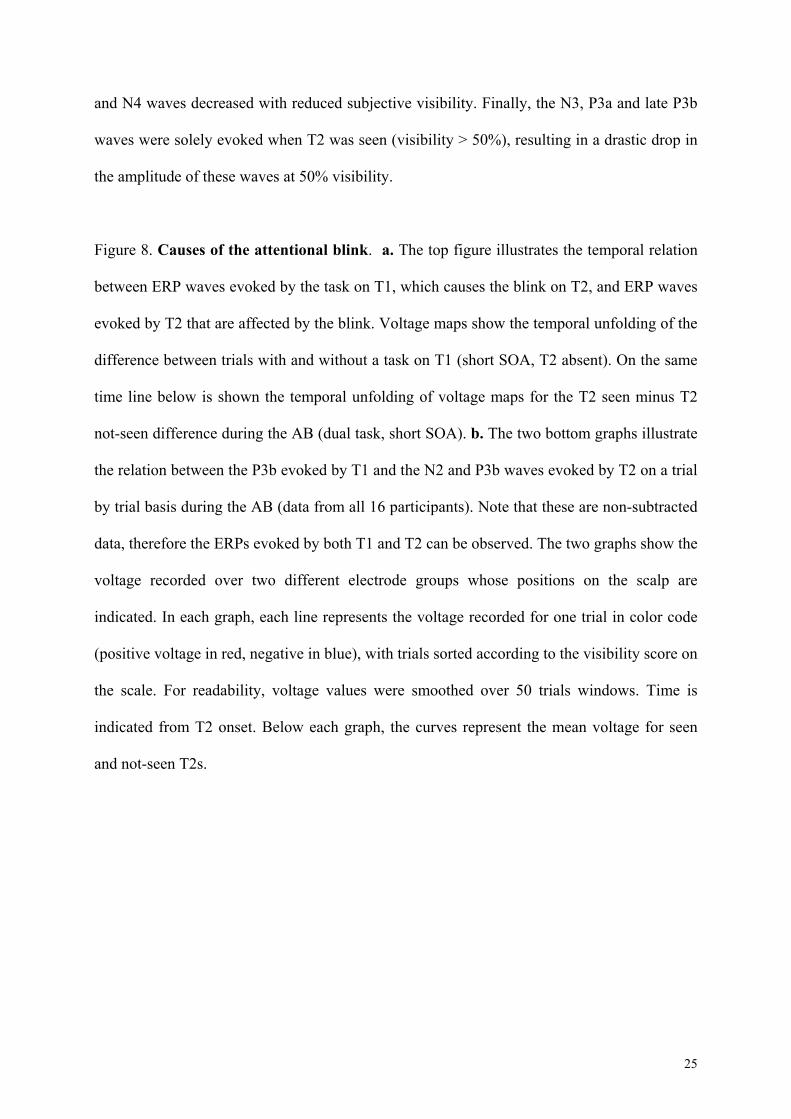
and N4 waves decreased with reduced subjective visibility. Finally, the N3, P3a and late P3b
waves were solely evoked when T2 was seen (visibility > 50%), resulting in a drastic drop in
the amplitude of these waves at 50% visibility.
Figure 8. Causes of the attentional blink. a. The top figure illustrates the temporal relation
between ERP waves evoked by the task on T1, which causes the blink on T2, and ERP waves
evoked by T2 that are affected by the blink. Voltage maps show the temporal unfolding of the
difference between trials with and without a task on T1 (short SOA, T2 absent). On the same
time line below is shown the temporal unfolding of voltage maps for the T2 seen minus T2
not-seen difference during the AB (dual task, short SOA). b. The two bottom graphs illustrate
the relation between the P3b evoked by T1 and the N2 and P3b waves evoked by T2 on a trial
by trial basis during the AB (data from all 16 participants). Note that these are non-subtracted
data, therefore the ERPs evoked by both T1 and T2 can be observed. The two graphs show the
voltage recorded over two different electrode groups whose positions on the scalp are
indicated. In each graph, each line represents the voltage recorded for one trial in color code
(positive voltage in red, negative in blue), with trials sorted according to the visibility score on
the scale. For readability, voltage values were smoothed over 50 trials windows. Time is
indicated from T2 onset. Below each graph, the curves represent the mean voltage for seen
and not-seen T2s.
26
References
1. Dehaene, S. et al. Cerebral mechanisms of word masking and unconscious repetition priming. Nat Neurosci 4, 752-8 (2001).
2. Moutoussis, K. & Zeki, S. The relationship between cortical activation and perception investigated with invisible stimuli. Proc Natl Acad Sci U S A 99, 9527-32 (2002).
3. Grill-Spector, K., Kushnir, T., Hendler, T. & Malach, R. The dynamics of object-selective activation correlate with recognition performance in humans. Nat Neurosci 3, 837-43 (2000).
4. Bar, M. et al. Cortical mechanisms specific to explicit visual object recognition. Neuron 29, 529-35 (2001).
5. Shulman, G. L., Ollinger, J. M., Linenweber, M., Petersen, S. E. & Corbetta, M. Multiple neural correlates of detection in the human brain. Proc Natl Acad Sci U S A 98, 313-8 (2001).
6. Vuilleumier, P. et al. Neural fate of seen and unseen faces in visuospatial neglect: a combined event-related functional MRI and event-related potential study. Proc Natl Acad Sci U S A 98, 3495-500 (2001).
7. Marois, R., Yi, D. J. & Chun, M. M. The neural fate of consciously perceived and missed events in the attentional blink. Neuron 41, 465-72 (2004).
8. Beck, D. M., Rees, G., Frith, C. D. & Lavie, N. Neural correlates of change detection and change blindness. Nat Neurosci 4, 645-50 (2001).
9. Pins, D. & Ffytche, D. The neural correlates of conscious vision. Cereb Cortex 13, 461-74 (2003). 10. Dehaene, S., Kerszberg, M. & Changeux, J. P. A neuronal model of a global workspace in effortful
cognitive tasks. Proc Natl Acad Sci U S A 95, 14529-34 (1998). 11. Baars, B. J. A cognitive theory of consciousness (Cambridge University Press, Cambridge, Mass.,
1989). 12. Dehaene, S., Sergent, C. & Changeux, J. P. A neuronal network model linking subjective reports and
objective physiological data during conscious perception. Proc Natl Acad Sci U S A 100, 8520-8525 (2003).
13. Sergent, C. & Dehaene, S. Is consciousness a gradual phenomenon? Evidence for an all-or-none bifurcation during the Attentional Blink. Psychol Sci 15, 720-728 (2004).
14. Dehaene, S. & Changeux, J. P. Ongoing spontaneous activity controls access to consciousness: a neuronal model for inattentional blindness. PLoS Biol 3, e141 (2005).
15. Thom, R. Stabilité structurelle et Morphogénèse (InterEditions, Paris, 1972). 16. Saunders, P. T. An introduction to catastrophe theory (Cambridge University Press, Cambridge, Mass.,
1980). 17. Broadbent, D. E. & Broadbent, M. H. From detection to identification: response to multiple targets in
rapid serial visual presentation. Percept Psychophys 42, 105-13 (1987). 18. Raymond, J. E., Shapiro, K. L. & Arnell, K. M. Temporary suppression of visual processing in an
RSVP task: an attentional blink? J Exp Psychol Hum Percept Perform 18, 849-60 (1992). 19. Luck, S. J., Vogel, E. K. & Shapiro, K. L. Word meanings can be accessed but not reported during the
attentional blink. Nature 383, 616-8 (1996). 20. Vogel, E. K., Luck, S. J. & Shapiro, K. L. Electrophysiological evidence for a postperceptual locus of
suppression during the attentional blink. J Exp Psychol Hum Percept Perform 24, 1656-74 (1998). 21. Kranczioch, C., Debener, S. & Engel, A. K. Event-related potential correlates of the attentional blink
phenomenon. Brain Res Cogn Brain Res 17, 177-87 (2003). 22. Chun, M. M. & Potter, M. C. A two-stage model for multiple target detection in rapid serial visual
presentation. J Exp Psychol Hum Percept Perform 21, 109-27 (1995). 23. McArthur, G., Budd, T. & Michie, P. The attentional blink and P300. Neuroreport 10, 3691-5 (1999). 24. Farah, M. J. The cognitive neuroscience of vision (Blackwell, Oxford, 2000). 25. Pammer, K. et al. Visual word recognition: the first half second. Neuroimage 22, 1819-25 (2004). 26. Marinkovic, K. et al. Spatiotemporal dynamics of modality-specific and supramodal word processing.
Neuron 38, 487-97 (2003). 27. Gross, J. et al. Modulation of long-range neural synchrony reflects temporal limitations of visual
attention in humans. Proc Natl Acad Sci U S A 101, 13050-5 (2004). 28. Spencer, K. M., Dien, J. & Donchin, E. Spatiotemporal analysis of the late ERP responses to deviant
stimuli. Psychophysiology 38, 343-58 (2001). 29. Vogel, E. K. & Luck, S. J. Delayed working memory consolidation during the attentional blink.
Psychon Bull Rev 9, 739-43 (2002).
27
30. Halgren, E., Marinkovic, K. & Chauvel, P. Generators of the late cognitive potentials in auditory and visual oddball tasks. Electroencephalogr Clin Neurophysiol 106, 156-64 (1998).
31. Lumer, E. D., Friston, K. J. & Rees, G. Neural correlates of perceptual rivalry in the human brain. Science 280, 1930-1934 (1998).
32. Rees, G., Russell, C., Frith, C. D. & Driver, J. Inattentional blindness versus inattentional amnesia for fixated but ignored words. Science 286, 2504-7 (1999).
33. Marois, R., Chun, M. M. & Gore, J. C. Neural correlates of the attentional blink. Neuron 28, 299-308 (2000).
34. Wickens, C., Kramer, A., Vanasse, L. & Donchin, E. Performance of concurrent tasks: a psychophysiological analysis of the reciprocity of information-processing resources. Science 221, 1080-2 (1983).
35. Taylor, J. G. Breakthrough to awareness: a preliminary neural network model of conscious and unconscious perception in word processing. Biol Cybern 75, 59-72 (1996).
36. Fragopanagos, N. F., Kockelkoren, S. & Taylor, J. G. A neurodynamic model of the attentional blink. Cognitive Brain Research (In Press).
37. Devlin, J. T., Jamison, H. L., Matthews, P. M. & Gonnerman, L. M. Morphology and the internal structure of words. Proc Natl Acad Sci U S A 101, 14984-8 (2004).
38. Kranczioch, C., Debener, S., Schwarzbach, J., Goebel, R. & Engel, A. K. Neural correlates of conscious perception in the attentional blink. Neuroimage 24, 704-14 (2005).
39. Super, H., Spekreijse, H. & Lamme, V. A. Two distinct modes of sensory processing observed in monkey primary visual cortex (V1). Nat Neurosci 4, 304-10 (2001).
40. Lamme, V. A., Zipser, K. & Spekreijse, H. Masking interrupts figure-ground signals in V1. J Cogn Neurosci 14, 1044-53 (2002).
41. Ress, D. & Heeger, D. J. Neuronal correlates of perception in early visual cortex. Nat Neurosci 6, 414-20 (2003).
42. Pallier, C., Dupoux, E. & Jeannin, X. Expe5: an expandable programming language for on-line psychological experiments. Behavior Research, Methods, Instruments and Computers 29, 322-327 (1997).
43. Lehmann, D. & Skrandies, W. Reference-free identification of components of checkerboard-evoked multichannel potential fields. Electroencephalogr Clin Neurophysiol 48, 609-21 (1980).
44. Huang, M. X., Mosher, J. C. & Leahy, R. M. A sensor-weighted overlapping-sphere head model and exhaustive head model comparison for MEG. Phys Med Biol 44, 423-40 (1999).
45. Baillet, S., Mosher, J. C. & Leahy, R. M. Electromagnetic Brain Mapping. IEEE Signal Processing Magazine 18, 14-30 (2001).
Variable T1-T2 SOA Q1Q2
DZVKCVGR
FIVE+
JQSFOXXO
+
T1
T2M
or
Task on T1: - XOOX or OXXO?- or No Task
Nothing Max Vis
Task on T2: Report T2 visibility
MM
Figure-1 (Sergent)
0
5
10
15
20
25
30
0 20 40 60 80 100
subjective visibility
Perc
ent o
f tria
ls
T2 present during the AB(Dual task, short SOA)
0
5
10
15
20
25
30
0 20 40 60 80 100
subjective visibility
Perc
ent o
f tria
ls
0
20
40
60
80
100
0 20 40 60 80 100
subjective visibility
Perc
ent o
f tria
ls
0
5
10
15
20
25
30
0 20 40 60 80 100
subjective visibility
Perc
ent o
f tria
ls
0
20
40
60
80
100
Short SOA Long SOA
Mea
n V
isib
ility
Single task,T2 present
Single task,T2 absent
Dual task,T2 present
Dual task,T2 absent
688 ms258 ms
T2 present outside the AB(Single task, short SOA)
T2 absent outside the AB(Single task, short SOA)
Predicted distribution
a.
b.

Figure- 2 (Sergent)
-2 µV +2 µV -2 µV +2 µV
-4 µV +4 µV-4 µV +4 µV
-2 µV +2 µV
Seen - Absent Not Seen - Absent
180 msSeen - Absent Not Seen - Absent
Seen - Not Seen
96 ms
10-2
10-4
P value
2.5 10-8
6.0 10-8
2 10-8
N4
P170

P1
N1 N2
276 msFigure- 3 (Sergent)
Seen - Absent Not Seen - Absent
Seen - Not Seen Pvalue
-3 µV +3 µV -3 µV +3 µV
-3 µV +3 µV
Seen - Absent
Seen - Not Seen
300 msNot Seen - Absent
Pvalue
-3 µV +3 µV -3 µV +3 µV
-2 µV +2 µV
10-2
10-4
10-2
10-4
2.5 10-8
3.5 10-8
4.5 10-8
2.5 10-8
N2
N3
N4
348 ms
Pvalue
-3 µV +3 µV -3 µV +3 µV
-3 µV +3 µV
Seen - Not Seen
Seen - Absent
10-2
10-4
Not Seen - Absent
5.5 10-8
2.5 10-8
N4
Figure- 4 (Sergent)
P3b
P3a
Figure- 5 (Sergent)436 ms
576 ms
P value
-2 µV +2 µV
-2 µV +2 µV -2 µV +2 µV
-2 µV +2 µV
-2 µV +2 µV
-2 µV +2 µV
Seen - Absent
Seen - Not Seen
Seen - Absent Not Seen - Absent
Seen – Not Seen P value
Not Seen - Absent
10-2
10-4
10-2
10-4
1.5 10-8
2 10-8
2.5 10-8
1.5 10-8

t = 300 ms
t = 436 ms
t = 436 ms
Figure- 6 (Sergent)
2.5 10-8
1.5 10-8
1.5 10-8

** p < .01
* p < .05
NS not significant
Not SeenHigh Score
P1
96 ms
Figure- 7 (Sergent)
SeenHigh Score
N1
180 ms
N2
276 ms
N3
300 ms
N4
348 ms
P3a
436 ms
Late P3b
576 ms
SeenLow Score
-2 µV +2 µV
Not SeenLow Score
-4 µV +4 µV -3 µV +3 µV-3 µV +3 µV-3 µV +3 µV -3 µV +3 µV -3 µV +3 µV
1
2
3
4
not seen
T1 onset
N2
+3 µV
-3 µV
+2 µV
-2 µV
200 400 600 800
-200 200 400
T1 evoked components mostlyaffected by the task on T1
T2 evoked components affectedby conscious access
T2 EPs :Seen - Not Seen
T1 EPs :Task - No Task
time fromT1 onset (ms)
time fromT2 onset (ms)
Tria
ls s
orte
dby
incr
easi
ngsc
ore
Tria
ls s
orte
dby
incr
easi
ngsc
ore
-1.5 µV
+1.5 µV
-2 µV
+2 µV
T2 onset
P3a P3b
N2 P3a P3b
T1-evoked
P3b
T2-evoked
P3b
T2-evoked
N2
-1.5 µV
+1.5 µV
-2 µV
+2 µV
seen
Figure- 8 (Sergent)
a.
b.

Table- 1 (Sergent) Not-Seen versus Absent Seen versus Absent Seen versus Not-Seen
P1
(peak at 96 ms)
Main effect of T2 presence :
F(1,15) = 22.6; p < .001
Main effect of T2 presence :
F(1,15) = 12.2; p < .005
No significant effects of visibility, or
electrodes side, or visibility by side
interaction : all Fs(1,15) < 1
N1
(peak at 180 ms)
Main effect of T2 presence :
F(1,15) = 53.0; p < .0001
Main effect of T2 presence :
F(1,15) = 57.0; p < .0001
No significant effects of visibility, or
electrodes side, or visibility by electrode
side interaction : all Fs(1,15) < 3
P170
(peak at 170 ms)
F(1,15)=8.50; p<.05
+/-45 9 51; GoF = 88.5%
N2
(peak at 276 ms)
Main effect of T2 presence :
F(1,15) = 5.9; p < .05
Main effect of T2 presence :
F(1,15) = 29.4; p < .0001
Main effect of visibility : F(1,15) = 32.7; p <
.0001; Visibility by electrodes side
interaction : F(1,15) = 4.5; p < .05
N3
(peak at 300 ms)
NS, F(1,15) < 2
F(1,15) = 34.7; p < .0001
F(1,15) = 25.2; p < .001
N4
(peak at 348 ms)
F(1,15) = 71.9; p < .0001 F(1,15) = 99.0; p < .0001 F(1,15) = 16.2; p < .005
P3a
(peak at 436 ms)
NS, F(1,15) < 1 F(1,15) = 17.7; p < .001
F(1,15) = 24.0; p < .001
Early P3b
(peak at 480 ms)
F(1,15) = 13.2; p < .005 F(1,15) = 18.0; p < .001 NS, F(1,15) < 4
Late P3b
(peak at 576 ms)
NS, F(1,15) < 1 F(1,15) = 8.5; p < .05 F(1,15) = 12.2; p < .005