timken
TRANSCRIPT
2 0 0 2 I A N N U A L R E P O R T
Tr a n s f o r m a t i o n D e l i v e r sS t r o n g Ye a r – W i n n i n g F u t u r e
+ T O R R I N G T O N
T W O G R E A T N A M E S =O N E G R E A T C O M P A N Y

About the cover …
The Timken Company has
transformed, putting the pieces in
place for a firm foundation of
increased profitability, innovation,
customer centricity and cost competi-
tiveness. Completing the Torrington
acquisition has given us the additional
resources to build upon that foundation
to increase dramatically our value to
customers and shareholders.
While we will capture $80 million annually in
synergies by 2005, this acquisition is really
about profitability and growth … based on
acquiring a similar, successful company with
a complementary product offering. The new
Timken Company is a global leader in three
complementary product and service lines:
tapered roller bearings, needle roller
bearings and alloy steels. We become a
$3.6 billion company with operations in
29 countries and still headquartered in
Canton, Ohio.
The year 2002 has positioned us
for an explosion of innova-
tion and value creation.
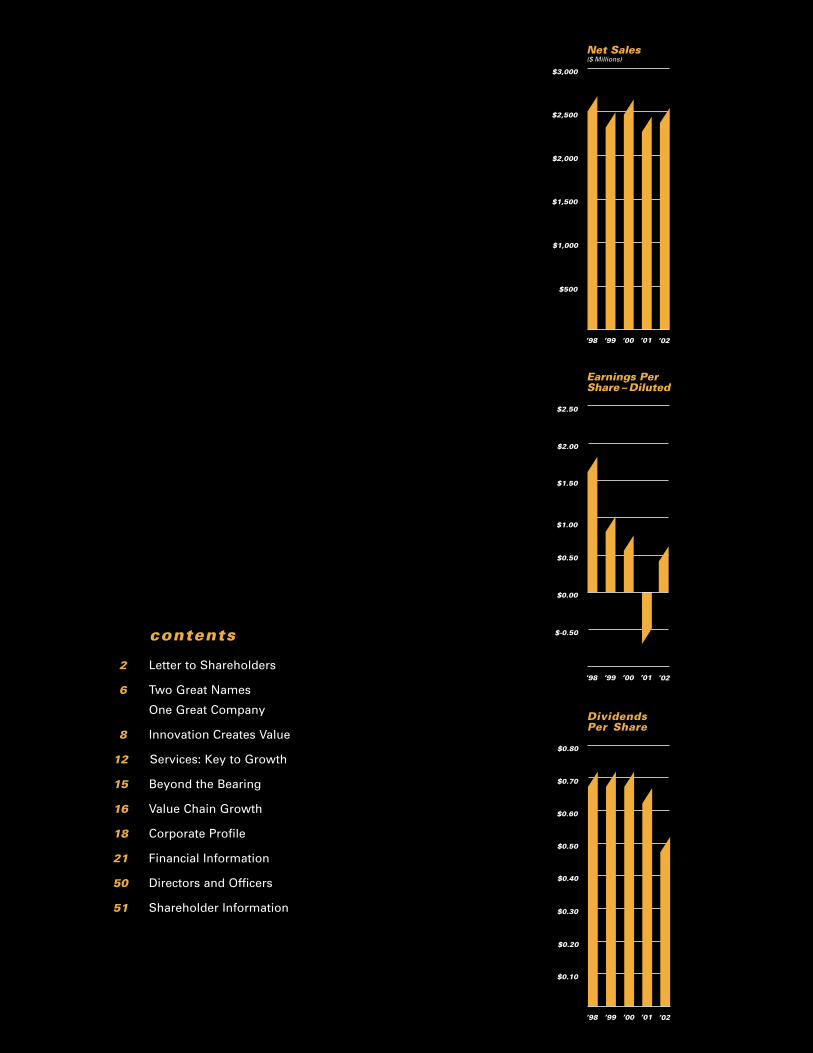
’98 ’99 ’00 ’01
$3,000
$2,500
$1,500
$500
$2,000
$1,000
Net Sales($ Millions)
’02
’98 ’99 ’00 ’01
$0.80
$0.50
$0.30
$0.10
$0.40
$0.20
DividendsPer Share
’02
$0.60
$0.70
contents
2 Letter to Shareholders
6 Two Great Names
One Great Company
8 Innovation Creates Value
12 Services: Key to Growth
15 Beyond the Bearing
16 Value Chain Growth
18 Corporate Profile
21 Financial Information
50 Directors and Officers
51 Shareholder Information
’98 ’99 ’00 ’01
$2.00
$0.50
$-0.50
Earnings PerShare – Diluted
’02
$1.00
$1.50
$0.00
$2.50
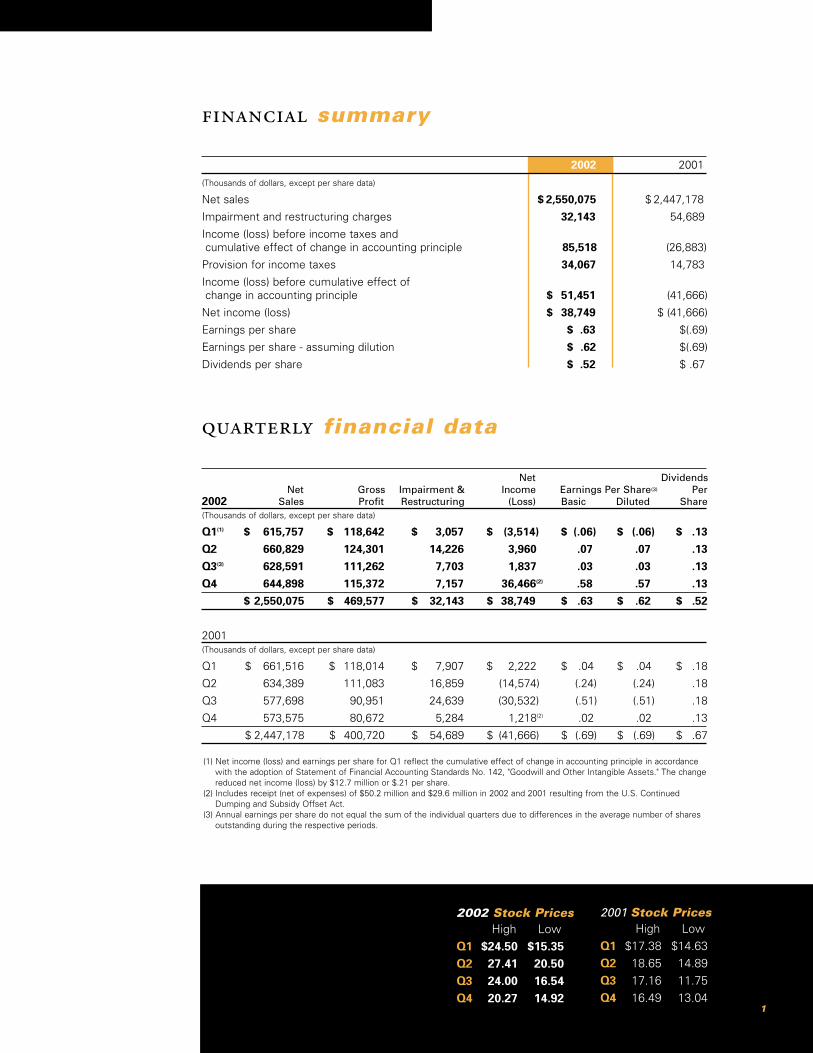
2002 2001
(Thousands of dollars, except per share data)
Net sales $ 2,550,075 $ 2,447,178
Impairment and restructuring charges 32,143 54,689
Income (loss) before income taxes andcumulative effect of change in accounting principle 85,518 (26,883)
Provision for income taxes 34,067 14,783
Income (loss) before cumulative effect ofchange in accounting principle $ 51,451 (41,666)
Net income (loss) $ 38,749 $ (41,666)
Earnings per share $ .63 $(.69)
Earnings per share - assuming dilution $ .62 $(.69)
Dividends per share $ .52 $ .67
financial summary
2002 Stock PricesHigh Low
Q1 $24.50 $15.35Q2 27.41 20.50Q3 24.00 16.54Q4 20.27 14.92
2001 Stock PricesHigh Low
Q1 $17.38 $14.63
Q2 18.65 14.89
Q3 17.16 11.75
Q4 16.49 13.04
(1) Net income (loss) and earnings per share for Q1 reflect the cumulative effect of change in accounting principle in accordance with the adoption of Statement of Financial Accounting Standards No. 142, "Goodwill and Other Intangible Assets." The changereduced net income (loss) by $12.7 million or $.21 per share.
(2) Includes receipt (net of expenses) of $50.2 million and $29.6 million in 2002 and 2001 resulting from the U.S. Continued Dumping and Subsidy Offset Act.
(3) Annual earnings per share do not equal the sum of the individual quarters due to differences in the average number of shares outstanding during the respective periods.
Net DividendsNet Gross Impairment & Income Earnings Per Share(3) Per
2002 Sales Profit Restructuring (Loss) Basic Diluted Share(Thousands of dollars, except per share data)
Q1(1) $ 615,757 $ 118,642 $ 3,057 $ (3,514) $ (.06) $ (.06) $ .13
Q2 660,829 124,301 14,226 3,960 .07 .07 .13
Q3(3) 628,591 111,262 7,703 1,837 .03 .03 .13
Q4 644,898 115,372 7,157 36,466(2) .58 .57 .13
$ 2,550,075 $ 469,577 $ 32,143 $ 38,749 $ .63 $ .62 $ .52
2001 (Thousands of dollars, except per share data)
Q1 $ 661,516 $ 118,014 $ 7,907 $ 2,222 $ .04 $ .04 $ .18
Q2 634,389 111,083 16,859 (14,574) (.24) (.24) .18
Q3 577,698 90,951 24,639 (30,532) (.51) (.51) .18
Q4 573,575 80,672 5,284 1,218(2) .02 .02 .13
$ 2,447,178 $ 400,720 $ 54,689 $ (41,666) $ (.69) $ (.69) $ .67
quarterly financial data
1
In 2002, our three-year-old transformation delivered for The Timken Company, and the company
delivered for shareholders and customers. That delivery included both improved financial results for
the year and a stronger foundation for future success.
Evidence continues to support the conclusion that we were wise to launch the transformation
in late 1999 – just as the long manufacturing recession was setting in but before it exacted its
worst tolls. The transformation has been aggressive and its purpose clear: make our company
more profitable and better able to grow, by making it more global, more innovative and more
customer-centric – and reducing its asset intensity.
In late 2002 and early 2003, we took another large step toward profitable growth with the
$840 million acquisition of The Torrington Company. The deal, which closed on February 18,
2003 increases company sales by nearly
50%, outstanding shares by about 35%, and is
expected to increase 2003 earnings per share by at least 10%. In the years ahead,
we expect even greater benefits. We financed the $700 million cash component of the
acquisition principally through a public offering of 12.65 million Timken common shares
and an offering of $250 million seven-year senior unsecured notes. In addition, we issued
9.4 million Timken common shares valued at $140 million to Ingersoll-Rand. (You can learn
more about the acquisition beginning on page 6.)
During 2002, amid sluggish markets, the company achieved impressive earnings
improvement. Net income was $53.3 million or $.87 per diluted share, excluding restruc-
turing and reorganization charges. That was up from $.01 in 2001. Including those
special charges, net income was $38.7 million. The result for investors? Our share price
increase reflected a strong recovery from 2001 and, combined with the 52-cent dividend,
resulted in a return for shareholders of 21.4% – well above the S&P 500 whose shares
averaged a loss of 22.1%. Among investors, The Timken Company has a well-known
philosophy of paying dividends and providing shareholders with a return on which
they can rely, regardless of the ups and downs of economic and business cyclicality. In
February of 2003, we paid our 323rd consecutive quarterly dividend.
Historically, a major Timken Company strength has been the strategy of maintaining a solid
balance sheet. It reflects our base philosophy – manage successfully for the long term,
leverage our core knowledge by investing in related businesses that we know
and can grow with superior quality products and services, and generate good returns
for shareholders.
You could see that philosophy at work in 2002. Cash flow from determined, aggressive cost
control actions enabled us to bring down net debt to $379 million at year-end 2002 versus
$464 million a year earlier. This was no easy task, given the economic and market softness that
presented major challenges throughout the year. Our emphasis on cost controls lowered our
ratio of selling and administrative expenses to sales to 13.7% from 14.7% in 2001.
We also kept tight reins on capital spending, keeping it aligned with the wobbling economy and
about 10% lower than 2001’s $102 million level. Importantly, combined with strong gains in produc-
tivity, that still enabled us to continue making the kind of investments that successfully support
our growth-oriented transformation strategy. Examples include investing in our automotive plants to
Tr a n s f o r m a t i o n D e l i v e r s
2
To Our Shareholders

support the introduction of new products for new automotive platforms, acquiring Glunt Industries to
strengthen our growing service business, and initiating a joint venture facility in China
that will provide a more competitive source for certain standard bearing products.
Our continuing emphasis on cash generation and increasing sales produced $206 million in net cash flow
from operations. A major contributor to cash flow – and for that matter the entire company’s financial
performance – was our alloy steel business. It continues to do what few other domestic steel compa-
nies have been able to accomplish: remain consistently profitable. The investments made in our steel
business over the last 15 years are now providing a strong competitive advantage. That translates
into an ability to advance technology, increase productivity to bring additional value to customers and
shareholders – and increase market penetration. Our precision steel components business, begun eight
years ago from our base alloy steel business, also had a strong year, continuing its international
expansion, including new operations in Brazil.
Three years ago, when we announced the transformation with its ambitious growth goals, we also set
equally aggressive and clear cost reduction goals. A watershed was formulating and launching a new
manufacturing strategy in April 2001. Its intent was to create a global network of focused factories,
improve productivity, increase the range and effectiveness of services provided to customers, and
reduce costs by $80 million annually by the end of 2002. We hit that savings target and achieved our
productivity and customer service goals. In doing so, we established a solid foundation for continuing
to compete more successfully in all market conditions. As previously announced, we expect to reduce
costs by an additional $40 million by the end of 2004.
Punctuating this manufacturing strategy in 2002 was closing our
bearing plant in Duston, England and selling our tooling plant
in Ashland, Ohio. Both actions lowered asset intensity. In
the case of Duston, the closure eliminated a facility
that no longer could compete globally, especially
with the added pressures of currency exchange
rates. Selling the Ashland facility removed from
the company a non-core business and generated
funds to invest elsewhere.
CoLinx, an e-business alliance formed three
years ago with three other manufacturing
companies to improve service to distributors in
North America, served as still another example of
lowering asset intensity and simultaneously
improving customer service. In 2002, we sold assets
from two of our North American regional service centers
to CoLinx Logistics.
Throughout 2002, the 18,000 Timken associates delivered on all
counts, and we commend them. A prime example is sales. Persistently soft
industrial markets notwithstanding, sales in 2002 were $2.55 billion, up 4% from 2001. Keys were:
• bolstering our ability to serve a strong automotive market with value-adding products, including
new integrated wheel hub units and fuel efficient bearings.
• adding market share at the expense of competitors, and
• offering expanded services, ranging from maintenance of heavy industrial mill equipment to
increased e-business opportunities for customers and distributors.
3
Timken invested $53 million
in 2002 for research and
development. Chairman
W.R. Timken, Jr. and Gina
Elkins, principal research
engineer, are at one of the
company's wheel bearing
performance testing
machines in Canton, Ohio.
This testing capability
is instrumental in devel-
oping value-adding,
integrated bearing
assemblies.
Another transformation priority is increasing innovation for customers in ways that bring them extra
value. 2002 was a banner year in that respect as well. The company introduced:
• Products that enhance brake performance and fuel economy on the Ford Expedition sport
utility vehicle.
• Package bearings that enhance maneuverability and brake performance on the Dodge Ram pickup.
• Fuel efficient bearings for drivelines on the Mercedes-Benz E-Class sedan.
• A variety of new products beyond bearings, including single-point lubricators that ensure proper
and regular grease delivery into machinery, improving maintenance and reducing costs.
(You can learn more about these and other innovations beginning on page 8.)
Underlying those innovations is our ongoing commitment to advancing technology. Once again, we
invested heavily in R&D. That included dedicating our new technology center in Colmar, France and
preparing to move our technology center in Bangalore, India to a new and larger facility. Colmar
provides access to major European design centers. Bangalore has become a major technology
development center for many leading companies which are attracted by its large number
of graduate engineers and low cost structure – and in a nation which offers the promise
of significant economic growth. Together, the new centers join our existing facilities
in supporting the transformation priorities of becoming a more global company
and better serving customers everywhere.
Our 2002 success was all the more impressive when keeping in mind
that many key associates successfully performed a demanding
dual role: continuing to drive business performance while
simultaneously planning for our acquisition of Torrington. The
acquisition, the company’s largest-ever, brings two great and
respected names into a single enterprise with a broader range of
innovative and complementary product lines. Combined, we offer a
greater variety of custom engineered solutions for more customers in more
locations. Moreover, we bought a company in an industry that we know
intimately, and this bodes well for a quick, effective integration.
Over the years, along with advancing technology and serving customers in a superior
fashion, another major foundation stone for success has always been our company’s core
values. In a year marked by many companies experiencing accounting irregularities, conflicts of
interest and questionable business judgments, it was comforting to know that Timken associates
worldwide continued to observe and work by our company’s core values. Chief among them requires
working to the highest level of ethics and integrity. Timken associates have done so for more than
100 years – and will keep doing so as we pursue growth aggressively. This core value has its roots in
the words of founder Henry Timken who once said, "Above all, don’t set your name to anything you will
ever have cause to be ashamed of." This strongly grounded commitment was reflected in President
Bush’s nomination of Chairman W.R. "Tim" Timken, Jr. to chair the board of directors of the Securities
Investor Protection Corporation. Congress created the SIPC to provide protection for investors against
losses that result from broker-dealer failures and to promote investor confidence in the nation’s
securities markets. He will continue full-time service as the company’s chairman.
Is our transformation complete? Our associates are skillfully executing the new manufacturing stra-
tegy. They are successfully reducing costs and improving customer service. Certainly, the Torrington
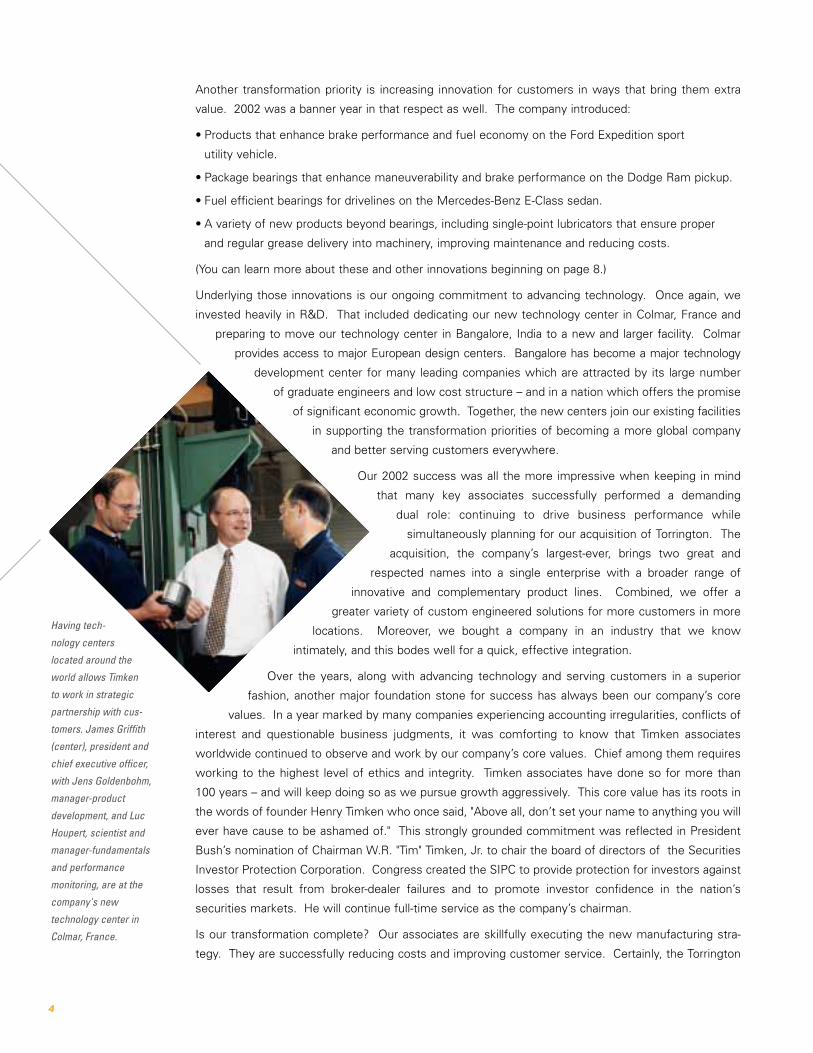
Having tech-
nology centers
located around the
world allows Timken
to work in strategic
partnership with cus-
tomers. James Griffith
(center), president and
chief executive officer,
with Jens Goldenbohm,
manager-product
development, and Luc
Houpert, scientist and
manager-fundamentals
and performance
monitoring, are at the
company's new
technology center in
Colmar, France.
4
W.R. Timken, Jr.
acquisition stands to make Timken more global by enabling us to provide a broader range of
products and services to more customers in more locations. But the transformation is far from
over. We still have opportunities to speed the pace of innovation, become even more customer-
centric and further lower cost and asset intensity. Our associates will continue driving to fully
seize those opportunities.
Meanwhile, other matters also have required our close
attention. Two years ago, Congress passed the Continued
Dumping and Subsidy Offset Act that required that tariffs
collected on unfairly priced imports be directed to the
industries harmed, but only when dumping continues after
an anti-dumping order is issued. Enforcement of this trade
law in 2002 resulted in Timken receiving a $54 million
payment – which we will use for more investment to remain
competitive.
Lower stock market returns and lower interest rates
reduced asset values and presented a challenge for pension
funding. The company contributed about $106 million to
the fund, about $54 million of it with three million Timken
common shares. Heading into 2003, we have built into our
business plan the ability to handle the need for any additional
contributions to our pension plans. Our confidence grows from our determination
to generate strong cash flow and to maintain a strong balance sheet.
Last year, we continued our carefully planned senior management succession.
Jim Griffith, who had been serving as president and COO, was elected president
and CEO. Since being named president more than three years ago, Jim has
driven our successful transformation and developed an outstanding management
team. Ward J. Timken, Jr., corporate vice president – office of the chairman,
was elected to our board. He is spearheading the integration of Torrington. Clay
LaForce retired from our board on which he had been serving since 1994. We
deeply appreciate his many contributions. We have nominated to join our board
General Joseph Ralston, USAF, Retired. He will stand for election at the April 15
board meeting.
As 2003 dawned, the U.S. and global economies continued to be surrounded by a
ring of question marks. Uncertainties included the level and pace of economic recov-
ery, currency exchange rates, enforcement of trade laws and possible military
actions. Nonetheless, our company’s 2002 performance gives us great confidence
that our transformation has put us on the track for sustained success. Our acquisition
of Torrington presents us with even more opportunities to achieve greater profitability.
Bill J. BowlingJames W. Griffith
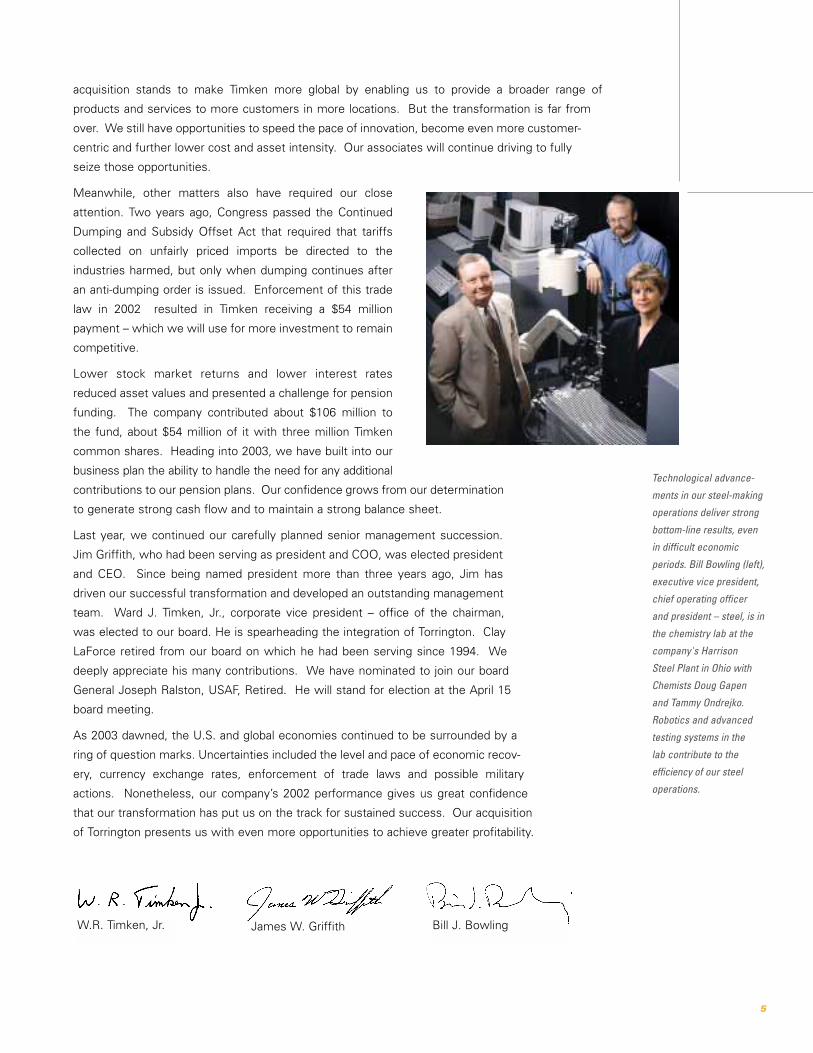
Technological advance-
ments in our steel-making
operations deliver strong
bottom-line results, even
in difficult economic
periods. Bill Bowling (left),
executive vice president,
chief operating officer
and president – steel, is in
the chemistry lab at the
company's Harrison
Steel Plant in Ohio with
Chemists Doug Gapen
and Tammy Ondrejko.
Robotics and advanced
testing systems in the
lab contribute to the
efficiency of our steel
operations.
5
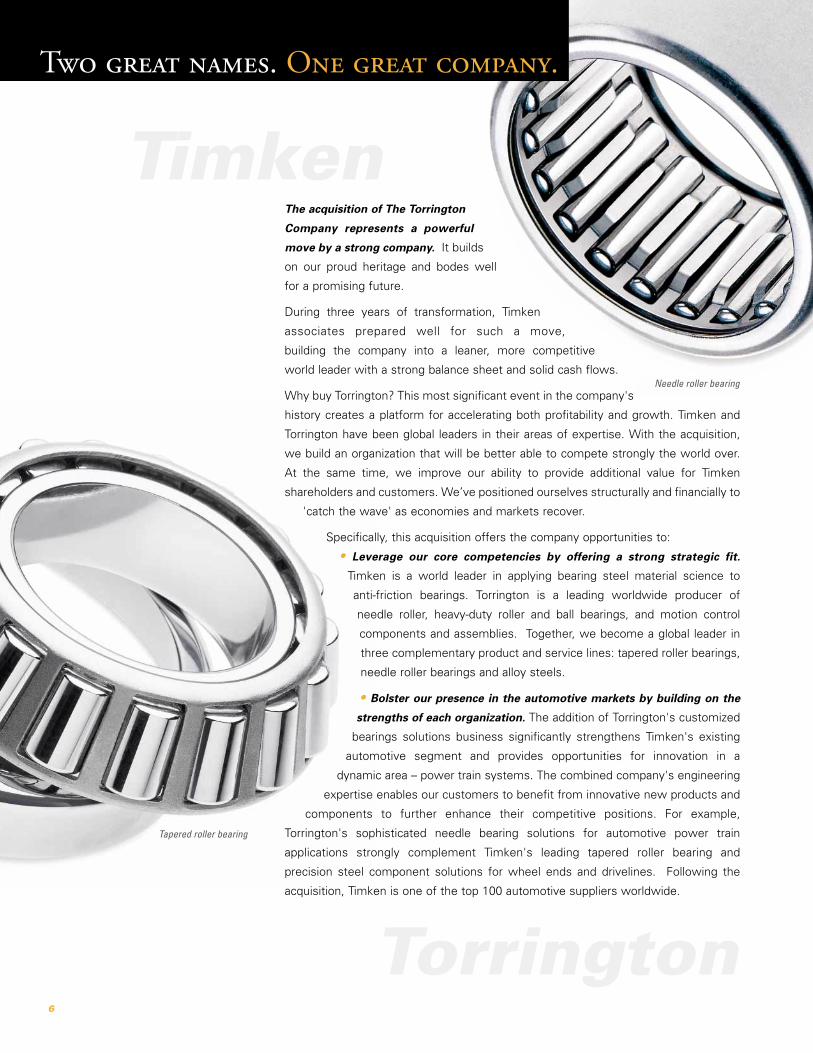
The acquisition of The Torrington
Company represents a powerful
move by a strong company. It builds
on our proud heritage and bodes well
for a promising future.
During three years of transformation, Timken
associates prepared well for such a move,
building the company into a leaner, more competitive
world leader with a strong balance sheet and solid cash flows.
Why buy Torrington? This most significant event in the company's
history creates a platform for accelerating both profitability and growth. Timken and
Torrington have been global leaders in their areas of expertise. With the acquisition,
we build an organization that will be better able to compete strongly the world over.
At the same time, we improve our ability to provide additional value for Timken
shareholders and customers. We’ve positioned ourselves structurally and financially to
'catch the wave' as economies and markets recover.
Specifically, this acquisition offers the company opportunities to:
• Leverage our core competencies by offering a strong strategic fit.
Timken is a world leader in applying bearing steel material science to
anti-friction bearings. Torrington is a leading worldwide producer of
needle roller, heavy-duty roller and ball bearings, and motion control
components and assemblies. Together, we become a global leader in
three complementary product and service lines: tapered roller bearings,
needle roller bearings and alloy steels.
• Bolster our presence in the automotive markets by building on the
strengths of each organization. The addition of Torrington's customized
bearings solutions business significantly strengthens Timken's existing
automotive segment and provides opportunities for innovation in a
dynamic area – power train systems. The combined company's engineering
expertise enables our customers to benefit from innovative new products and
components to further enhance their competitive positions. For example,
Torrington's sophisticated needle bearing solutions for automotive power train
applications strongly complement Timken's leading tapered roller bearing and
precision steel component solutions for wheel ends and drivelines. Following the
acquisition, Timken is one of the top 100 automotive suppliers worldwide.
6
Timken
Torrington
Needle roller bearing
Tapered roller bearing
Two great names. One great company.

Torrington At A Glance
The Acquisition:
• $840 million in cash and stock to parent Ingersoll-RandCompany Limited.
• Of that, $700 million in cash;$140 million in Timken shares.
• Public stock offering of 12.65 million shares to paydown debt on the cash payment.
• Expected to be accretive toearnings per share by at least10% in 2003.
• $80 million in annual cost savings by end of 2005, with$20 million of that in the firstyear after completing theacquisition.
2002 Torrington Sales:
• $1.2 billion
Products:
• World leader in needle roller bearing technology.
• Heavy-duty roller bearings(spherical and cylindrical roller bearings).
• Ball bearings.
• Motion control componentsand assemblies.
• Customized engineering solutions.
• Brands: Torrington, Kilian,Fafnir, Nadella, IRB.
Associates:
• 10,000 associates worldwide.
• Known for engineering expertise and strong productdevelopment.
Operations:
• More than 50 offices and 25 manufacturing plants inNorth and South America,Europe and Asia.
• Joint venture operations around the world.
7
• Improve service to industrial customers by offering
a broader line of engineered products and services. The
acquisition enables us to bring our expanded product and
service offerings to new markets and leverage our geographic
presence to provide more products and services to our distribu-
tion network. For other industries, the acquisition creates the
opportunity for Timken to provide a broadened base of technology,
market and applications knowledge for customers and distributors globally.
One important result is more integrated engineering solutions for new
original equipment designs and the opening up of new market segments.
• Create an even more competitive global presence. Although Torrington is
U.S.-based, it has operations and affiliations in Asia, Europe and around the
world, which strengthen our own global operations. Having manufacturing,
engineering, sales and marketing close to our customers, wherever in the
world they are, strengthens our ability to serve them.
• Build upon the reputation of our Timken technologists. The research,
engineering and product development knowledge and experience of the
experts at Torrington are a strong match for our organization. The result is a
fiercely competitive global team.
Timken and Torrington are very similar in heritage, brand promise and market
approach, which will facilitate integration. Both companies were founded on a
patented innovation – Timken, the tapered roller bearing, and Torrington, the
needle roller bearing. And both companies, through more than 100 years in
business, have built strong traditions of quality, technology and innovation.
A key to capitalizing on the value of Torrington is to fully integrate it into
Timken – to move ahead as one operating enterprise. We believe we have put
the resources in place to achieve that. And while we are pursuing cost savings
through synergies, this acquisition is really about growing the company
profitably. The knowledge and operational base at Torrington is central to
that growth. We welcome the great capabilities of the Torrington associates,
whom we highly respect.
With the acquisition, we all join the same team. We'll become one integrated
organization, poised for enhanced profitability and growth. It's an exciting
prospect.
W.R. Timken, Jr. James W. Griffith
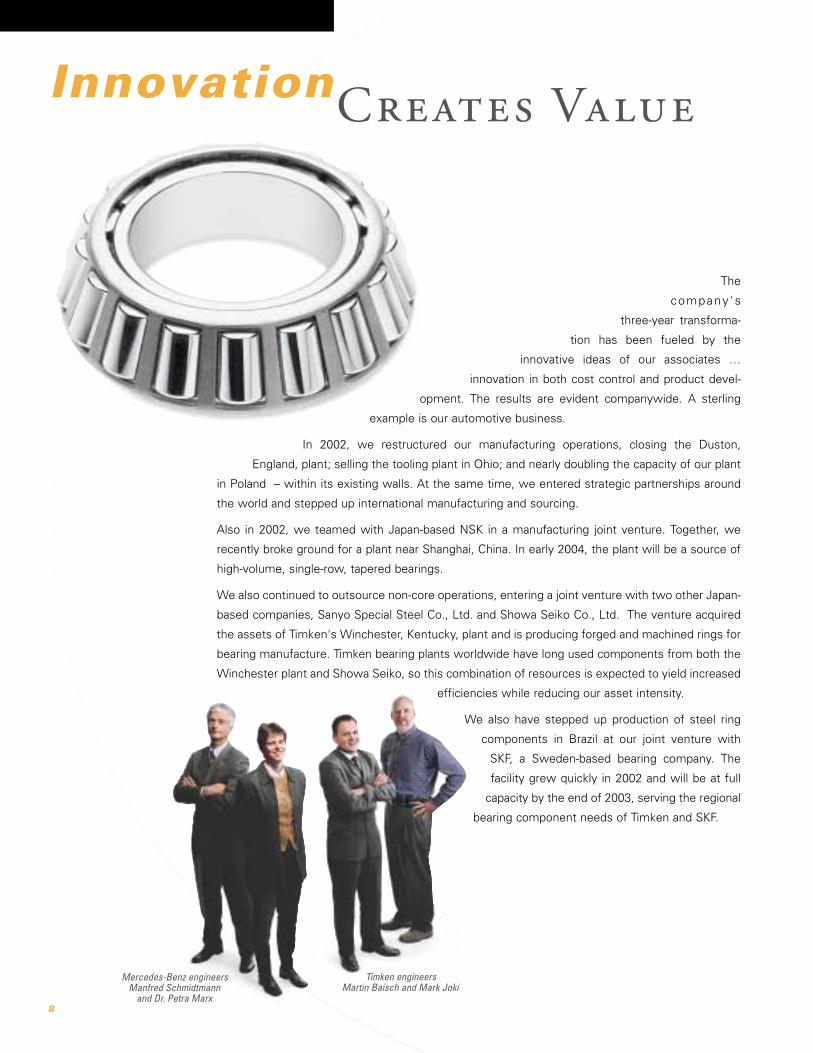
The
company 's
three-year transforma-
tion has been fueled by the
innovative ideas of our associates …
innovation in both cost control and product devel-
opment. The results are evident companywide. A sterling
example is our automotive business.
In 2002, we restructured our manufacturing operations, closing the Duston,
England, plant; selling the tooling plant in Ohio; and nearly doubling the capacity of our plant
in Poland – within its existing walls. At the same time, we entered strategic partnerships around
the world and stepped up international manufacturing and sourcing.
Also in 2002, we teamed with Japan-based NSK in a manufacturing joint venture. Together, we
recently broke ground for a plant near Shanghai, China. In early 2004, the plant will be a source of
high-volume, single-row, tapered bearings.
We also continued to outsource non-core operations, entering a joint venture with two other Japan-
based companies, Sanyo Special Steel Co., Ltd. and Showa Seiko Co., Ltd. The venture acquired
the assets of Timken's Winchester, Kentucky, plant and is producing forged and machined rings for
bearing manufacture. Timken bearing plants worldwide have long used components from both the
Winchester plant and Showa Seiko, so this combination of resources is expected to yield increased
efficiencies while reducing our asset intensity.
We also have stepped up production of steel ring
components in Brazil at our joint venture with
SKF, a Sweden-based bearing company. The
facility grew quickly in 2002 and will be at full
capacity by the end of 2003, serving the regional
bearing component needs of Timken and SKF.
8
InnovationCreates Value
Mercedes-Benz engineers Manfred Schmidtmann
and Dr. Petra Marx
Timken engineers Martin Baisch and Mark Joki
Well into this restructuring, automotive
demand began to increase. Despite our changing
manufacturing base, we were able to leverage the increased
demand into new sales, including seven new product platforms for
2004 to 2006 model years worth more than $280 million total.
"There was no shortcut to this success," says Karl Kimmerling, president – automotive. "Our
associates worked hard to expedite the transition and continue to seek additional sources of
supply. The result is an automotive business with a lower break-even point. We are better
positioned to maintain profitability when demand is low but can capitalize on strong demand,
as in 2002."
PRODUCT DEVELOPMENT YIELDS SUCCESS Just as cost competitiveness fed our automotive success, our ability to innovate new, forward-
integrated products continues to bring value to customers.
Timken bearings, steel and components are found in winning race cars around the world. The
race track has long been a proving ground for Timken products. In 2002, we launched the new
RacePacTM wheel bearing assembly, which is a pre-set package, ready to race for NASCAR teams.
Designed with tapered roller bearings, seals and precisely ground
spacers and hubs, RacePac assemblies contribute to increased
performance and safety. And that innovation translates into
improved products on roads and highways as well.
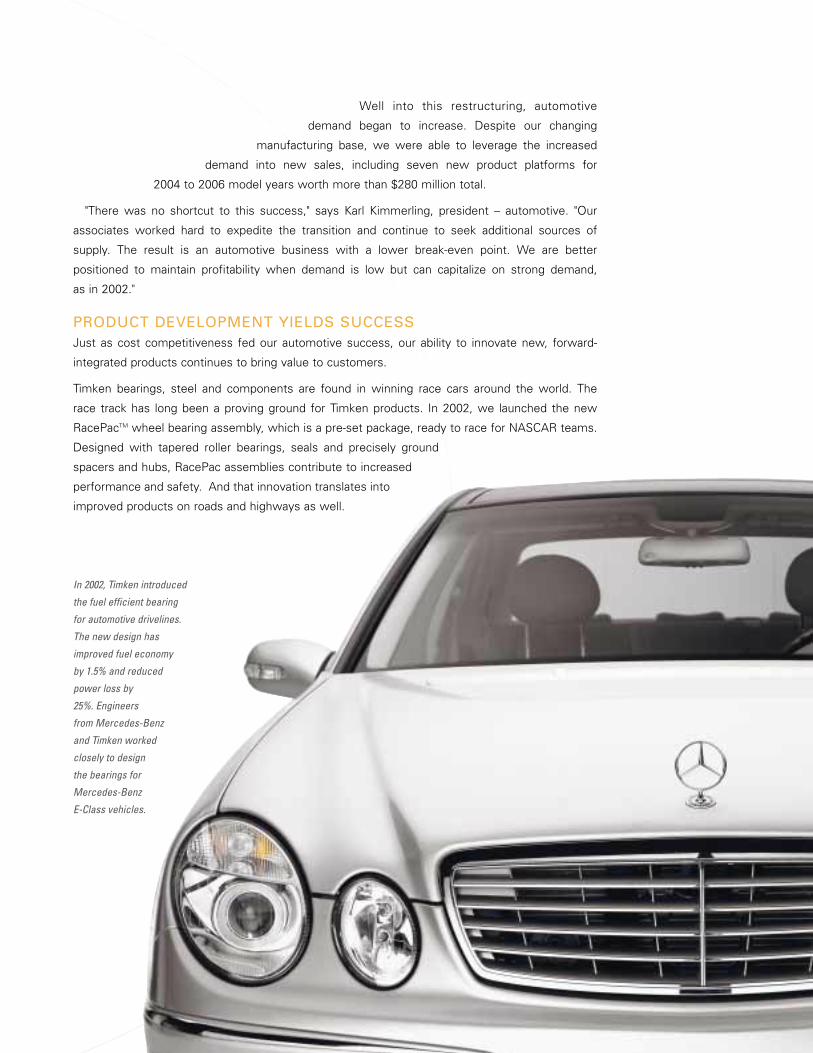
In 2002, Timken introduced
the fuel efficient bearing
for automotive drivelines.
The new design has
improved fuel economy
by 1.5% and reduced
power loss by
25%. Engineers
from Mercedes-Benz
and Timken worked
closely to design
the bearings for
Mercedes-Benz
E-Class vehicles.

Timken engineers developed a new inte-
grated bearing and hub package for
Continental Teves' brake system that is
used on all four wheels of the 2003 model year
Ford Expedition and Lincoln Navigator sport
utility vehicles. The bearing and hub assembly
in this application, which is made at our
Lincolnton, North Carolina, plant, contains
a Timken® SENSOR-PACTM package bearing
mated to a drive hub. We are supplying a similar
integrated hub and package-bearing unit for the
2002 model year Dodge Ram 1500 series pickup
truck. This single integrated unit is pre-sealed and pre-lubricated and can be bolted directly
onto the wheel knuckle of light trucks and sport utility vehicles. By offering these
integrated components, we can reduce system costs and improve reliability for
our customers – and their customers enjoy improved durability, ride, handling and
fuel economy.
Our presence in the automotive replacement market is also growing at a fast pace,
with a 14% increase in 2002 U.S. sales. Certainly, winning new original
equipment platforms feeds this growth and creates long-term demand for our
integrated bearing and hub packages, but so does growing our line of related
products, including bearings of all
types, kits, seals and greases.
Offering a broader line meets our
customers' needs to work with fewer, more value-adding suppliers. As a result, we
won a five-year contract worth $10 million annually to supply the Parts Plus marketing
group for its North American distributor network, serving automotive parts stores,
dealers and fleets for automotive, agriculture, construction and motorcycle applications.
STRENGTHENING THE FOUNDATION IN INDUSTRIAL By contrast to the automotive sector, 2002 was a tough year for industrial markets.
Demand was down, but our manufacturing transformation laid the foundation for good
performance, even in poor market conditions, and prepared us for even greater growth as
markets rebound.
Operating as a stronger global company, we were able to leverage our resources
to win new business. For example, we won the bearing business from U.S.
rolling mill supplier Tippins in 2001. Then, in 2002 we won the replacement
bearing business of its customer Kunming Iron and Steel Company (KISCO) in
China. That achievement came as a result of a strong, integrated effort from
sales and application engineers in China, the U.S. and France and manufactur-
ing operations in Romania. Working as one global company brings value to both
our customers and shareholders.
10
Timken associates
around the world are
working together to
win new business in
emerging markets.
In 2002, Timken sales
engineer Jason Wang
led the team that
worked with KISCO
steel mill in China
to secure its replace-
ment bearing
business.

11
New product development opened
up even more opportunities. Long known for
high performance bearings that can endure extreme
conditions, Timken developed the DuraSpexxTM power rating
series bearings. This new line enhances performance in demanding
rolling mill, gear drive and energy applications. The product
offers equipment designers an option to double bearing life
while maintenance engineers can potentially lengthen service
intervals and, thus, lower overall costs.
Similarly, we developed a unique bearing with integrated flex pins
and gearing to meet the needs of the wind energy market. The
product more evenly distributes the forces within a wind turbine
transmission, extending gear and bearing life. We also developed a crossed
roller bearing for the British Royal Navy's new Type 45 destroyers to provide
a stable, rotating base for its innovative radar system.
VALUE OF E-BUSINESS EXTENDEDE-business strategies also continue to create efficiencies. Early in 2002, we
marked the first anniversary of the launch of The Timken Stores at
PTplace.com and Endorsia.com. Both are online distributor shopping malls
developed as part of ventures of Timken and other manufacturers of premi-
um-brand industrial components. Today, nearly half of North American distributor orders are being
taken electronically. And, we've continued to enhance the sites to bring additional value: extending
access to industrial distributors around the world; connecting our light- and heavy-duty automotive dis-
tributors; launching a bearing inventory exchange site for distributors; and expanding the product
offering to include repair services. We also launched the TimkenStore.com site for original equipment
manufacturers to offer them specialized services.
But perhaps the most significant strategy related to e-business was more fully capitalizing on the
logistics component of CoLinx, our PTplace.com joint venture. Timken sold the assets from
two of its regional service centers in Ontario, Canada, and Reno, Nevada, to CoLinx. We're
achieving savings and efficiencies by aggregating shipments and leveraging common
warehouse operations.
Outside the U.S., we made additional moves to realize logistics efficiencies. The Les Ulis,
France distribution center was closed and integrated into our European Distribution
Center in Strasbourg, France. And logistics operations in Daventry, England, are
doing the same.
We moved our distribution center in São Paulo closer to Brazil's major
highways to facilitate quicker movement of industrial, automotive and
rail goods within and outside the country. The move also
creates space at our São Paulo plant for additional
manufacturing operations to serve the country's
growing number of automotive original
equipment manufacturers.
Sharon Jordan, bearing operations coordinator
logistics

One of the strongest growth opportunities for the industrial
business lies in services – from repair and refurbishment of bearings
and related products to marketing our engineering knowledge. As a result,
the company continues to develop service programs for all sectors, from
rolling mill to rail and power plant to process industries.
"At the heart is Timken Industrial Services, which in 2002 increased business
by 25%," says Michael Arnold, president – industrial. "We work closely with
industrial distributors and end users globally to offer services such as bearing repair and
reclamation, component repair, on-site training, mill maintenance, diagnostic services, and
now, chock and roll repairs. Providing these services helps us build a stronger relationship with
customers and often leads to increased product sales as well."
To facilitate the rapid growth of our industrial services, we acquired an additional equipment
repair facility in Niles, Ohio. The 60,000 square-foot plant specializes in the repair and rebuild of
processing components commonly found in heavy industrial mill applications. It joins our other
facilities in Ohio, Indiana, Brazil and Romania in providing these services.
We've long been a leader in repairing large bearings for steel and mining applications, but most
customers replace rather than repair bearings smaller than eight inches outside diameter. So, we
introduced a service to economically repair bearings between three and eight inches, which
particularly benefits customers in industries such as pellet mills, and aggregate and food processing.
Our service to the customer doesn't end with bearing repair. Our bearing experts offer on-site
maintenance training to help further extend the bearing life, reduce maintenance costs and
improve equipment reliability. Customers who complete advanced training and pass a
rigorous audit of their maintenance areas can earn the "Timken bearing certified"
designation, which indicates a world-class maintenance operation. Timken
also offers a complete maintenance program for those customers
who want to outsource that operation.
Another service expansion is in the global rail industry,
where we now have capabilities to recondition axle
boxes, housings, and cylindrical and spherical
bearing boxes. And, we opened a bearing
reconditioning operation at a customer
facility, MRS Logistica S.R., one of
Brazil's largest railroad companies.
This new bearing service unit
reconditions railroad bearings
used in various types of freight wagons
for MRS and other Brazilian rail lines.
Services: Key to Growth
Our bearing experts offer
on-site maintenance
training to help customers
extend bearing life,
reduce maintenance
costs and improve equip-
ment reliability. The
maintenance team at PPL
Montana has earned the
"Timken bearing certified"
designation, reserved for
world-class maintenance
operations. The more than
2,200 megawatt coal-fired
power generation facility
in Colstrip, Montana, has
improved uptime and
maintenance costs since
beginning training.
12

13
Jeff Calvin, Timken service engineering
managerHank Coffin, PPL Montana maintenance supervisor

This year we also launched Timken Technical Services. The offering leverages the
expertise of scientists and engineers in our global research and development
organization to bring customers greater value. We can solve customers'
toughest application challenges by offering a range of work from applications
testing to prototype development. More than 100 years of friction
management and materials knowledge has become our newest service
business.
QUALITY AND SPEED, A WINNING COMBINATION
Seventy-five years ago, our New Hampshire aero-
space and super precision operations were
established. Associates there capped the anniversary celebration with the
landing of a Black Hawk military helicopter, courtesy of Sikorsky Aircraft
Corp., a longtime Timken customer. Timken ball, cylindrical and
tapered bearings are used in several applications on Black Hawks,
including gearboxes, transmissions and landing gear.
As with the whole of The Timken Company, the aerospace
and super precision division has grown increasingly
nimble in meeting customer needs. The past year
marked the winning of new business from Honeywell.
The customer was on a tight production schedule for its
new AS900 jet engine. Honeywell presented us with an
exciting and demanding challenge – engineering and producing
five complex jet engine ball and straight roller bearings in just 10
weeks. We worked tirelessly and met that challenge.
THE POWER OF BRANDOur industrial distribution network has long been a strong contributor
to company performance. To achieve greater profitable growth, though,
it's taking a lesson from the smaller, but rapidly growing automotive
aftermarket – by introducing a broader line of products to meet
distributor needs. In fact, we more fully integrated our industrial
and automotive distribution activities to realize greater synergies
in logistics and e-business, and capitalize on brand extension to
fuel growth.
branding
The Timken brand is our
most valuable asset, built
on more than 100 years of
innovation, performance,
quality and integrity.
14
Dave Pierman, productdevelopment specialist
Craig Darragh, senior product technologist
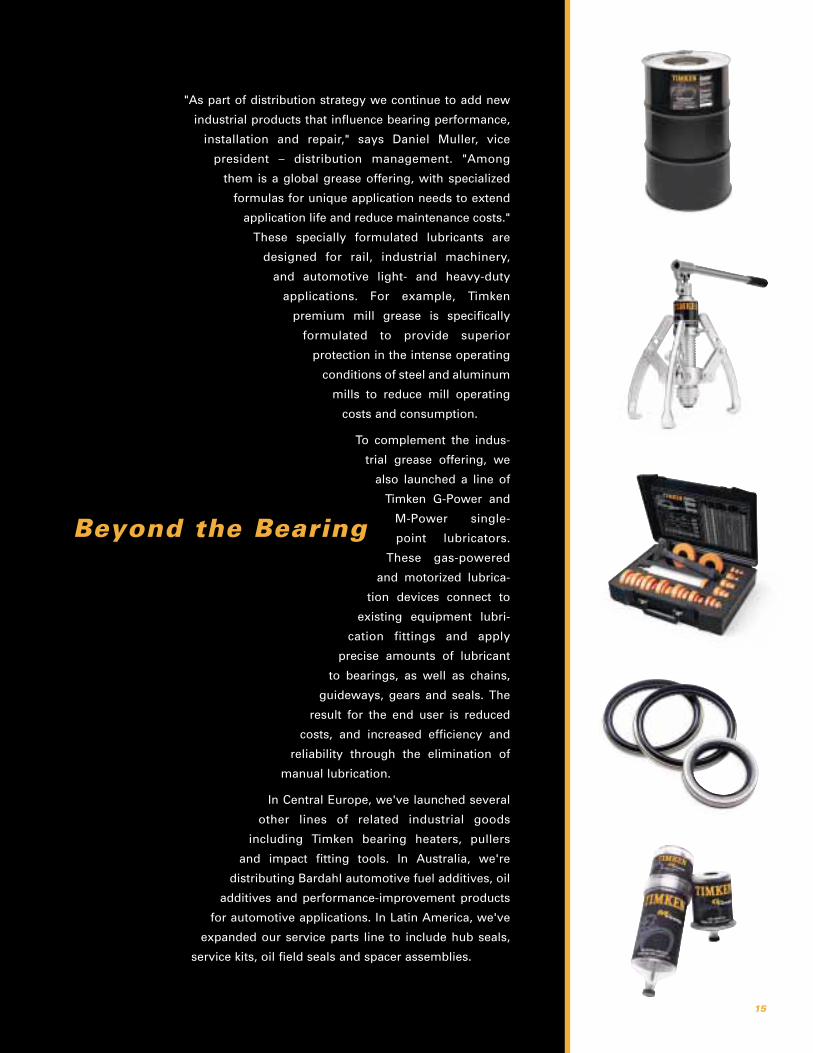
"As part of distribution strategy we continue to add new
industrial products that influence bearing performance,
installation and repair," says Daniel Muller, vice
president – distribution management. "Among
them is a global grease offering, with specialized
formulas for unique application needs to extend
application life and reduce maintenance costs."
These specially formulated lubricants are
designed for rail, industrial machinery,
and automotive light- and heavy-duty
applications. For example, Timken
premium mill grease is specifically
formulated to provide superior
protection in the intense operating
conditions of steel and aluminum
mills to reduce mill operating
costs and consumption.
To complement the indus-
trial grease offering, we
also launched a line of
Timken G-Power and
M-Power single-
point lubricators.
These gas-powered
and motorized lubrica-
tion devices connect to
existing equipment lubri-
cation fittings and apply
precise amounts of lubricant
to bearings, as well as chains,
guideways, gears and seals. The
result for the end user is reduced
costs, and increased efficiency and
reliability through the elimination of
manual lubrication.
In Central Europe, we've launched several
other lines of related industrial goods
including Timken bearing heaters, pullers
and impact fitting tools. In Australia, we're
distributing Bardahl automotive fuel additives, oil
additives and performance-improvement products
for automotive applications. In Latin America, we've
expanded our service parts line to include hub seals,
service kits, oil field seals and spacer assemblies.
15
Beyond the Bearing

16
The company's steel business is a model for the industry and a strong contributor to our financial
performance. Ten years of strategic investment and rationalization have created technologically
advanced and highly productive operations that deliver real value to customers. The year 2002
marked success in our core markets and geographic expansion that resulted in an increase in sales
and market penetration.
"Capital investments are not the sole key," says Bill Bowling, executive vice
president, chief operating officer and president – steel. "We also have honed
our product line to focus on niche areas in which we're most
competitive. We have our plants operating at peak
efficiency through continuous improvement
activities and advanced training for our
workforce. Energy utilization per ton has
improved and labor productivity is better than
ever. We've worked aggressively to reduce
inventories. These are all internally driven
improvements, and they are sustainable over the
long term."
New product development also contributed to sales growth. Industrial and automotive customers
who require highly machinable steels benefited from a newly developed grade of steel. It offers
customers reduced waste and improved machining in their operations.
Timken is also leveraging a technology license agreement with Sumitomo Metal Industries of Japan
to make a proprietary grade of steel that replaces leaded steels. The product meets the required
machinability properties for automotive crankshafts. We'll be working with Honda of America
Manufacturing to offer a supply of this steel, which previously hasn't been
available in the U.S.
"New technology isn't limited to steel products," says Ray Fryan,
director – steel process improvement. "We are now selling laser ultra-
sonic technology to other steel manufacturers." It features a gauging
system that enables more efficient manufacturing of seamless steel
tubing. That technology was developed as a result of a 1999 grant from
the U.S. Department of Energy. The laser-based measuring system
helps ensure that steel tubes are produced with a more uniform wall.
The strongest growth in our steel business has come from precision
steel components. The year marked a number of milestones. We worked
with General Motors to create our most sophisticated components to
date – finished clutch races. For many years, we've supplied GM with the
preform components that they finish into clutch races. But, when GM
required more product than it could finish alone, the company turned to Timken.
We upgraded our St. Clair operation in Ohio to accommodate the new process,
increased output by 15 percent and won the contract to supply GM.
We also began developing the capabilities to produce precision components for automotive drive-
line applications at our bearing manufacturing plant in Brazil. With the growing original equipment
Value Chain Growth
Timken-finished clutch
races are included in a
General Motors transmis-
sion used in a variety of
popular trucks and sport
utility vehicles including
the Chevrolet Silverado,
Suburban and Cadillac
Escalade. Timken also
supplies tapered roller
bearings, steel and semi-
finished components for
those vehicles.
(from left)
Tom Stone, plant
manager, worked with
account manager Tim
Haubenstricker, project
manager Rick Morris and
chief engineer Mark
Moldovan to implement
new manufacturing
capabilities at our
St. Clair plant to
supply GM.

17
market in Brazil, the
move brings us clos-
er to key customers.
This expansion com-
plements our joint
venture with SKF
in Brazil, which
produces steel
rings for bearing
manufacture in our
Timken facilities.
The broadest geographic expansion
for components came in Europe as we
capitalized on the 2001 acquisition of a France-
based precision component maker. We now have a solid
manufacturing base to better serve current automotive
customers in Europe and win new business in both industrial
and automotive markets.
An example of our success in the region was winning the contract to be the sole
supplier to FormFlo Limited of Cheltenham, England, for precision steel components used in a range
of manual transmissions. The three-year agreement covers the supply of five precision components
that FormFlo manufactures into synchronizer sleeves, which enable the smooth changing of gears.
COMPANY ENGAGED IN LEAN SIX SIGMA Timken associates built a strong infrastructure for Lean Six Sigma in 2002. The effort is focused on
understanding our customers' needs and ensuring that our business systems deliver value-adding
products and services – efficiently. While the year was dedicated primarily to building skills,
positioning people and selecting projects, the initiative has already delivered results. For example,
roll stand changeovers at the Harrison Steel Plant in Ohio were reduced from 30.7 minutes to
20.7 minutes, reducing costs and increasing productivity. Associates achieved the savings through
a change in the process, the addition of sensing technology and better integration between mill
operators and maintainers.
Across the world, productivity in our bearing plants rose 10 percent in 2002. With Lean Six Sigma
well underway, the company is positioned to realize aggressive improvement goals.
Another such continuous improvement initiative fueled growth in our India operations. The India
Technology Center in Bangalore has expanded in size and scope. The center's 130 associates
perform research and development, customer engineering, information technology support and,
most recently, key corporate services, such as accounts payable. Given the strong performance of
our team in India and their solid integration with our global operations, the facility has grown to the
point where it plans relocation to a larger site.
With elements of the transformation completed and the Lean Six Sigma infrastructure in place, the
company is poised for more success around the globe.
Subhasish Pal, e-business team leader
18
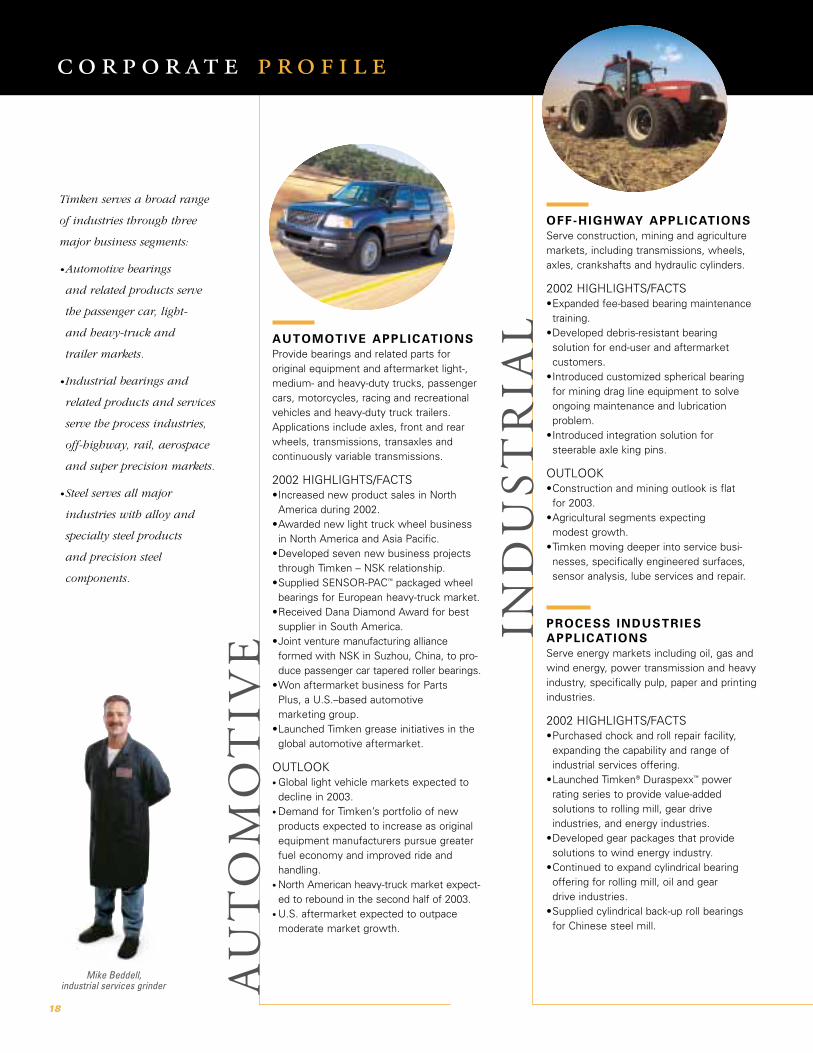
AUTOMOTIVE APPLICATIONSProvide bearings and related parts for original equipment and aftermarket light-,medium- and heavy-duty trucks, passengercars, motorcycles, racing and recreationalvehicles and heavy-duty truck trailers.Applications include axles, front and rearwheels, transmissions, transaxles and continuously variable transmissions.
2002 HIGHLIGHTS/FACTS•Increased new product sales in North
America during 2002.•Awarded new light truck wheel business
in North America and Asia Pacific. •Developed seven new business projects
through Timken – NSK relationship.•Supplied SENSOR-PAC™ packaged wheel
bearings for European heavy-truck market. •Received Dana Diamond Award for best
supplier in South America.•Joint venture manufacturing alliance
formed with NSK in Suzhou, China, to pro-duce passenger car tapered roller bearings.
•Won aftermarket business for Parts Plus, a U.S.–based automotive marketing group.
•Launched Timken grease initiatives in theglobal automotive aftermarket.
OUTLOOK• Global light vehicle markets expected to
decline in 2003.• Demand for Timken’s portfolio of new
products expected to increase as originalequipment manufacturers pursue greaterfuel economy and improved ride and handling.
• North American heavy-truck market expect-ed to rebound in the second half of 2003.
• U.S. aftermarket expected to outpacemoderate market growth.
OFF-HIGHWAY APPLICATIONSServe construction, mining and agriculturemarkets, including transmissions, wheels,axles, crankshafts and hydraulic cylinders.
2002 HIGHLIGHTS/FACTS•Expanded fee-based bearing maintenance
training.•Developed debris-resistant bearing
solution for end-user and aftermarket customers.
•Introduced customized spherical bearingfor mining drag line equipment to solve ongoing maintenance and lubrication problem.
•Introduced integration solution for steerable axle king pins.
OUTLOOK•Construction and mining outlook is flat
for 2003. •Agricultural segments expecting
modest growth. •Timken moving deeper into service busi-
nesses, specifically engineered surfaces,sensor analysis, lube services and repair.
PROCESS INDUSTRIESAPPLICATIONS Serve energy markets including oil, gas andwind energy, power transmission and heavyindustry, specifically pulp, paper and printingindustries.
2002 HIGHLIGHTS/FACTS•Purchased chock and roll repair facility,
expanding the capability and range ofindustrial services offering.
•Launched Timken® Duraspexx™ power rating series to provide value-added solutions to rolling mill, gear drive industries, and energy industries.
•Developed gear packages that providesolutions to wind energy industry.
•Continued to expand cylindrical bearingoffering for rolling mill, oil and gear drive industries.
•Supplied cylindrical back-up roll bearingsfor Chinese steel mill.
Timken serves a broad range
of industries through three
major business segments:
•Automotive bearings
and related products serve
the passenger car, light-
and heavy-truck and
trailer markets.
•Industrial bearings and
related products and services
serve the process industries,
off-highway, rail, aerospace
and super precision markets.
•Steel serves all major
industries with alloy and
specialty steel products
and precision steel
components.
IND
US
TR
IAL
AU
TO
MO
TIV
E
c o r p o r at e p r o f i l e
Mike Beddell, industrial services grinder
19
•Launched Timken grease initiatives forrolling mill applications in North America.
•Introduced line of single-point lubricators.
OUTLOOK•Continue to leverage e-business
investment. •Maintenance service business will be a
factor in aftermarket growth.•Logistics will be strengthened regionally
and globally.
AEROSPACE & SUPERPRECISION APPLICATIONS Supply bearings, new and refurbished components and precision assemblies toaerospace, medical, dental, robotics, semiconductor and space flight industries.Aerospace applications include aircraft and helicopter engines, gearboxes, transmis-sions, landing wheels, flight and fuel controls. Super precision applicationsinclude robotic equipment, X-ray machines,medical instruments and other industrialassemblies. Dental applications includehandpiece components, assemblies and repairs.
2002 HIGHLIGHTS/FACTS•Greater penetration in military helicopter
engines and gearboxes offset the downturn in commercial aerospace.
•Growth in medical industry was the resultof improved value to customers throughlower costs and improved performance.
•Continued to expand dental handpiecerepair and parts distribution in the U.S.,Europe and Asia.
OUTLOOK•Aerospace commercial market downturn
likely will continue through 2003. •Military business projected to be steady
or growing. •Increase expected in aerospace bearing
reconditioning market.•Steady growth in dental business
expected. •Super precision industrial business
recovery is contingent on the rebound of industrial markets.
OUTLOOK•Modest improvement expected in
2003 markets. •Continued growth expected in global
rolling mill segment. •Expect further growth throughout
emerging markets.•Emphasize flex pin and gear package
components.
DISTRIBUTION MANAGEMENTResponsible for material handling, customer delivery and industrial e-businessworldwide. Fulfills original equipment andaftermarket distribution for a full range ofbearing and service parts products.
2002 HIGHLIGHTS/FACTS•Combined Toronto and Reno regional
service centers into CoLinx joint venturefacilities in same locations.
•Installed distribution logistics system inEuropean aftermarket operations.
•Created an aircraft landing wheel distributor specialist program to promotesafety and facilitate increased levels oftechnical support.
•Expanded usage of The Timken Store on Endorsia.com to distributors in Europe and Asia.
•Created The Timken Store at PTplace.comfor North American automotive light- andheavy-duty distributors, plus industrial distributors in Canada and Mexico.
•Implemented online bearing repair status function.
•Introduced TimkenStore.com for original equipment customers.
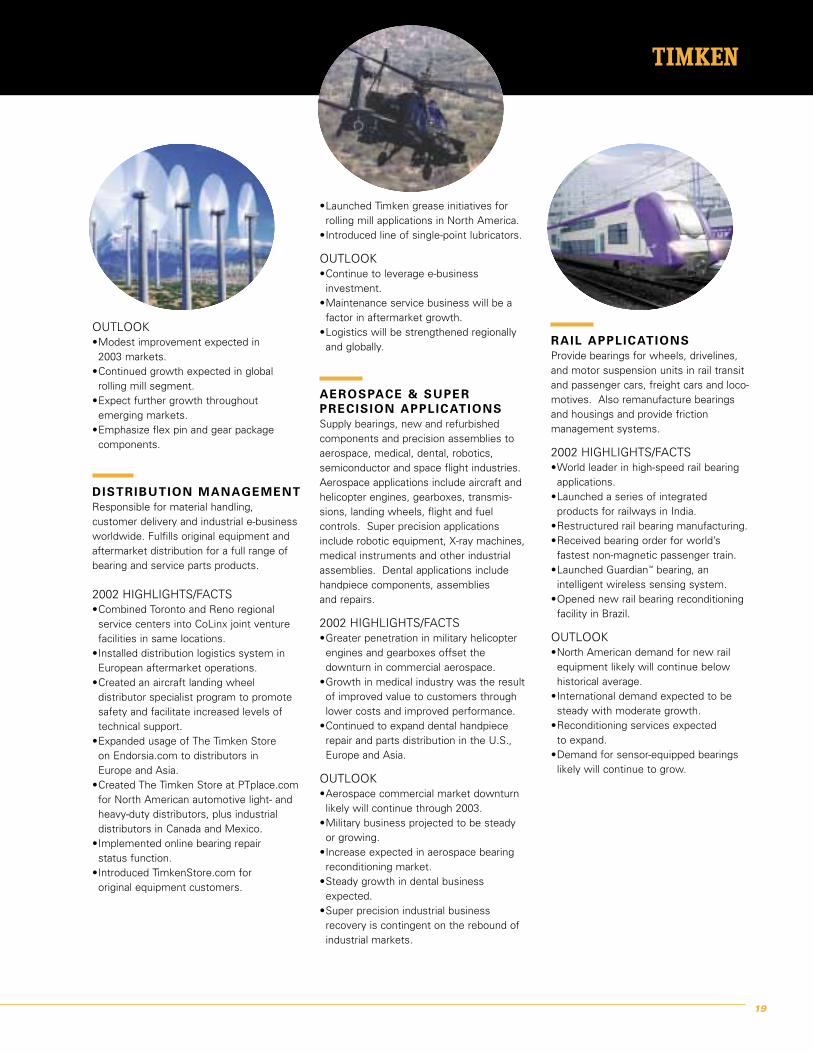
RAIL APPLICATIONS Provide bearings for wheels, drivelines,and motor suspension units in rail transitand passenger cars, freight cars and loco-motives. Also remanufacture bearings and housings and provide friction management systems.
2002 HIGHLIGHTS/FACTS•World leader in high-speed rail bearing
applications.•Launched a series of integrated
products for railways in India.•Restructured rail bearing manufacturing. •Received bearing order for world’s
fastest non-magnetic passenger train.•Launched Guardian™ bearing, an
intelligent wireless sensing system. •Opened new rail bearing reconditioning
facility in Brazil.
OUTLOOK•North American demand for new rail
equipment likely will continue below historical average.
•International demand expected to besteady with moderate growth.
•Reconditioning services expected to expand.
•Demand for sensor-equipped bearingslikely will continue to grow.
20
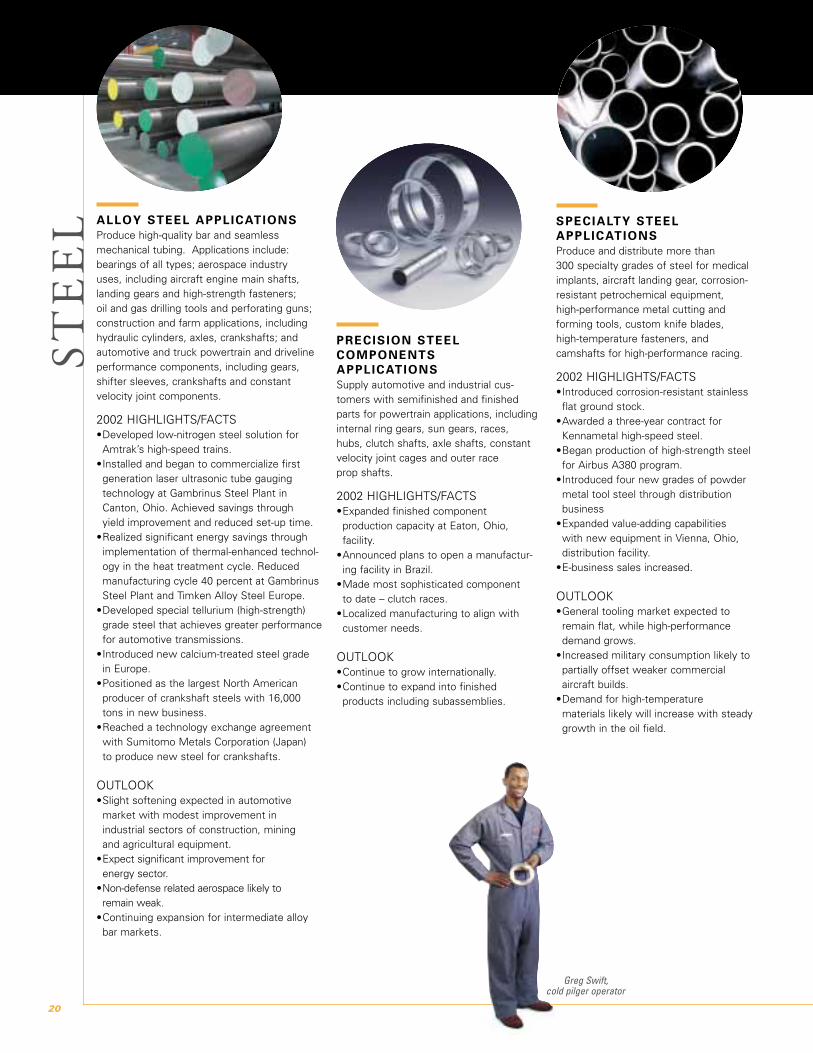
SPECIALTY STEELAPPLICATIONS Produce and distribute more than 300 specialty grades of steel for medicalimplants, aircraft landing gear, corrosion-resistant petrochemical equipment, high-performance metal cutting and forming tools, custom knife blades, high-temperature fasteners, and camshafts for high-performance racing.
2002 HIGHLIGHTS/FACTS•Introduced corrosion-resistant stainless
flat ground stock.•Awarded a three-year contract for
Kennametal high-speed steel.•Began production of high-strength steel
for Airbus A380 program.•Introduced four new grades of powder
metal tool steel through distribution business
•Expanded value-adding capabilities with new equipment in Vienna, Ohio, distribution facility.
•E-business sales increased.
OUTLOOK•General tooling market expected to
remain flat, while high-performancedemand grows.
•Increased military consumption likely to partially offset weaker commercial aircraft builds.
•Demand for high-temperature materials likely will increase with steadygrowth in the oil field.
PRECISION STEELCOMPONENTSAPPLICATIONS Supply automotive and industrial cus-tomers with semifinished and finishedparts for powertrain applications, includinginternal ring gears, sun gears, races, hubs, clutch shafts, axle shafts, constantvelocity joint cages and outer race prop shafts.
2002 HIGHLIGHTS/FACTS•Expanded finished component
production capacity at Eaton, Ohio, facility.
•Announced plans to open a manufactur-ing facility in Brazil.
•Made most sophisticated component to date – clutch races.
•Localized manufacturing to align with customer needs.
OUTLOOK•Continue to grow internationally. •Continue to expand into finished
products including subassemblies.
ALLOY STEEL APPLICATIONS Produce high-quality bar and seamlessmechanical tubing. Applications include: bearings of all types; aerospace industry uses, including aircraft engine main shafts,landing gears and high-strength fasteners; oil and gas drilling tools and perforating guns;construction and farm applications, includinghydraulic cylinders, axles, crankshafts; andautomotive and truck powertrain and drivelineperformance components, including gears,shifter sleeves, crankshafts and constant velocity joint components.
2002 HIGHLIGHTS/FACTS•Developed low-nitrogen steel solution for
Amtrak’s high-speed trains.•Installed and began to commercialize first
generation laser ultrasonic tube gauging technology at Gambrinus Steel Plant inCanton, Ohio. Achieved savings through yield improvement and reduced set-up time.
•Realized significant energy savings throughimplementation of thermal-enhanced technol-ogy in the heat treatment cycle. Reducedmanufacturing cycle 40 percent at GambrinusSteel Plant and Timken Alloy Steel Europe.
•Developed special tellurium (high-strength)grade steel that achieves greater performancefor automotive transmissions.
•Introduced new calcium-treated steel grade in Europe.
•Positioned as the largest North American producer of crankshaft steels with 16,000tons in new business.
•Reached a technology exchange agreementwith Sumitomo Metals Corporation (Japan) to produce new steel for crankshafts.
OUTLOOK•Slight softening expected in automotive
market with modest improvement in industrial sectors of construction, mining and agricultural equipment.
•Expect significant improvement for energy sector.
•Non-defense related aerospace likely to remain weak.
•Continuing expansion for intermediate alloybar markets.
ST
EE
L
Greg Swift, cold pilger operator

contents
22 Consolidated Statement of Operations
Management’s Discussion and Analysis of the Statement of Operations
26 Consolidated Balance Sheet
Management’s Discussion and Analysis of the Balance Sheet
28 Consolidated Statement of Cash Flows
29 Management’s Discussion and Analysis of the Statement of Cash Flows
Management’s Discussion and Analysis of Other Information
32 Consolidated Statement of Shareholders’ Equity
33 Notes to Consolidated Financial Statements
Significant Accounting Policies
35 Comprehensive Loss
Acquisitions
Earnings Per Share
36 Impairment and Restructuring Charges
38 Change in Method of Accounting
39 Contingencies
40 Financing Arrangements
41 Financial Instruments
Stock Compensation Plans
42 Retirement and Postretirement Benefit Plans
43 Research and Development
44 Subsequent Event - Acquisition
Segment Information
46 Income Taxes
47 Report of Independent Auditors
Forward-Looking Statements
48 Summary of Operations and Other Comparative Data
50 Directors and Officers
51 Shareholder Information
21
i n f o r m at i o nFinancial
Year Ended December 31
2002 2001 2000
(Thousands of dollars, except per share data)
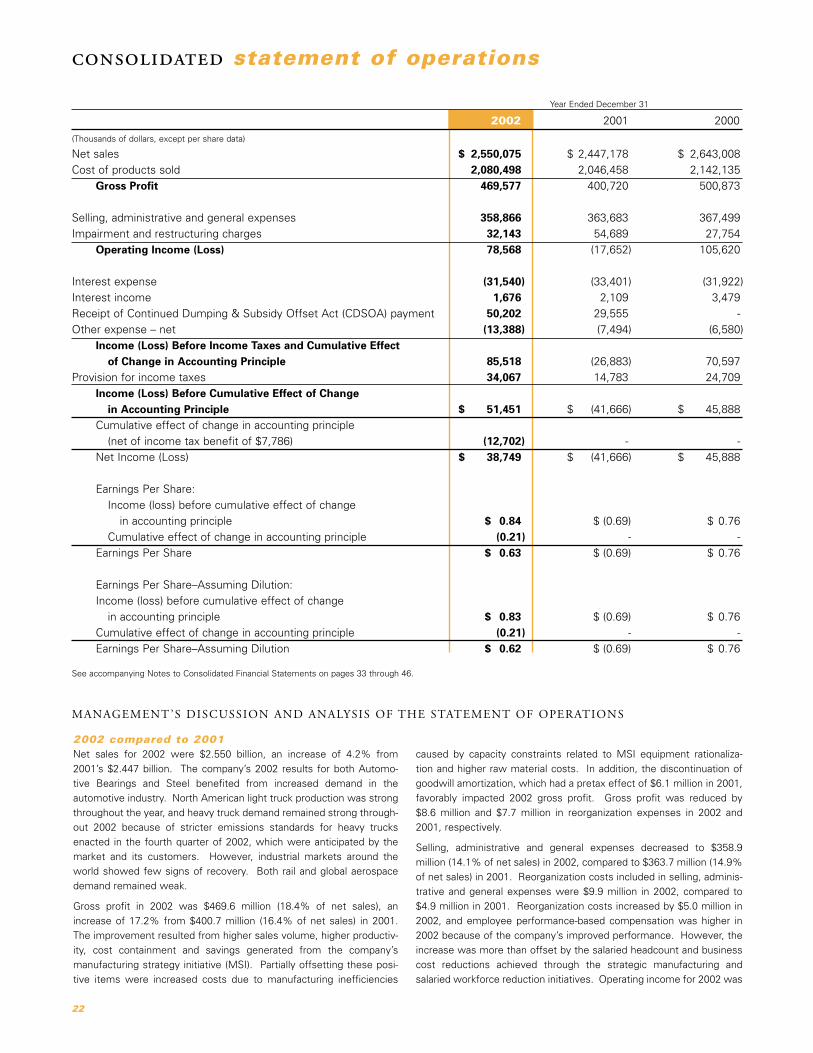
Net sales $ 2,550,075 $ 2,447,178 $ 2,643,008Cost of products sold 2,080,498 2,046,458 2,142,135
Gross Profit 469,577 400,720 500,873
Selling, administrative and general expenses 358,866 363,683 367,499Impairment and restructuring charges 32,143 54,689 27,754
Operating Income (Loss) 78,568 (17,652) 105,620
Interest expense (31,540) (33,401) (31,922)Interest income 1,676 2,109 3,479Receipt of Continued Dumping & Subsidy Offset Act (CDSOA) payment 50,202 29,555 -Other expense – net (13,388) (7,494) (6,580)
Income (Loss) Before Income Taxes and Cumulative Effectof Change in Accounting Principle 85,518 (26,883) 70,597
Provision for income taxes 34,067 14,783 24,709Income (Loss) Before Cumulative Effect of Change
in Accounting Principle $ 51,451 $ (41,666) $ 45,888Cumulative effect of change in accounting principle
(net of income tax benefit of $7,786) (12,702) - -Net Income (Loss) $ 38,749 $ (41,666) $ 45,888
Earnings Per Share:Income (loss) before cumulative effect of change
in accounting principle $ 0.84 $ (0.69) $ 0.76Cumulative effect of change in accounting principle (0.21) - -
Earnings Per Share $ 0.63 $ (0.69) $ 0.76
Earnings Per Share–Assuming Dilution:Income (loss) before cumulative effect of change
in accounting principle $ 0.83 $ (0.69) $ 0.76Cumulative effect of change in accounting principle (0.21) - -Earnings Per Share–Assuming Dilution $ 0.62 $ (0.69) $ 0.76
See accompanying Notes to Consolidated Financial Statements on pages 33 through 46.
MANAGEMENT ’S DISCUSSION AND ANALYSIS OF THE STATEMENT OF OPERATIONS
consolidated statement of operations
caused by capacity constraints related to MSI equipment rationaliza-tion and higher raw material costs. In addition, the discontinuation of goodwill amortization, which had a pretax effect of $6.1 million in 2001,favorably impacted 2002 gross profit. Gross profit was reduced by $8.6 million and $7.7 million in reorganization expenses in 2002 and2001, respectively.
Selling, administrative and general expenses decreased to $358.9 million (14.1% of net sales) in 2002, compared to $363.7 million (14.9%of net sales) in 2001. Reorganization costs included in selling, adminis-trative and general expenses were $9.9 million in 2002, compared to$4.9 million in 2001. Reorganization costs increased by $5.0 million in2002, and employee performance-based compensation was higher in2002 because of the company’s improved performance. However, theincrease was more than offset by the salaried headcount and businesscost reductions achieved through the strategic manufacturing andsalaried workforce reduction initiatives. Operating income for 2002 was
2002 compared to 2001Net sales for 2002 were $2.550 billion, an increase of 4.2% from 2001’s $2.447 billion. The company’s 2002 results for both Automo-tive Bearings and Steel benefited from increased demand in the automotive industry. North American light truck production was strongthroughout the year, and heavy truck demand remained strong through-out 2002 because of stricter emissions standards for heavy trucksenacted in the fourth quarter of 2002, which were anticipated by themarket and its customers. However, industrial markets around theworld showed few signs of recovery. Both rail and global aerospacedemand remained weak.
Gross profit in 2002 was $469.6 million (18.4% of net sales), anincrease of 17.2% from $400.7 million (16.4% of net sales) in 2001.The improvement resulted from higher sales volume, higher productiv-ity, cost containment and savings generated from the company’s manufacturing strategy initiative (MSI). Partially offsetting these posi-tive items were increased costs due to manufacturing inefficiencies
22

From the announcement in April 2001 through the end of 2002, 1,824 associates left the company as a result of actions taken throughMSI and the salaried workforce reduction initiatives. Of that number,1,304 people were primarily associates from the Duston and Columbusplants, as well as associates included in the worldwide salaried workforce reduction program for whom severance has been paid. Inaddition, 99 associates left the company as a result of selling theAshland plant. The remaining 421 associates retired or voluntarily leftthe company, and their positions have been eliminated. For additionalinformation regarding impairment and restructuring, please refer to footnote 5 in the notes to consolidated financial statements.
The company received gross amounts of approximately $54 million and$31 million in 2002 and 2001, respectively, from the U.S. TreasuryDepartment under the U.S. Continued Dumping and Subsidy Offset Act(CDSOA), which requires that tariffs collected on dumped imports bedirected to the industries harmed. CDSOA payments for 2002 and2001, net of expenses, were $50.2 million and $29.6 million. InSeptember 2002, the World Trade Organization (WTO) ruled that suchpayments violate international trade rules. The U.S. TradeRepresentative appealed this ruling; however, the WTO upheld the ruling on January 16, 2003. The company continues to believe the U.S.law is appropriate and justified; however, the company may not receivepayments under the CDSOA in 2003 or future years, and the companycannot predict the amount of any such payments.
Other expense increased in 2002 primarily as a result of the decrease inincome from gains on sales of properties from 2001. Foreign currencytranslation losses related to non-hyperinflationary economies totaled$1.3 million in 2002, compared to $0.4 million in 2001. The company’ssubsidiary in Romania is considered to operate in a highly inflationaryeconomy. In 2002, the company recorded unrealized exchange lossesof $0.9 million related to the translation of Timken Romania’s financialstatements, compared to $2.3 million in 2001.
The 2002 effective tax rate was higher than the statutory tax rate as a result of taxes paid to state and local jurisdictions, withholding taxeson foreign remittances, additional taxes on foreign income and theaggregate effect of other permanently non-deductible expenses.Although the company recorded a loss before income taxes for 2001, a consolidated tax provision was recorded because the company generated income in certain jurisdictions where taxes must be providedand, in other jurisdictions, losses which were not available to reduceoverall tax expense.
The 2002 income before cumulative effect of change in accounting principle was $51.4 million, compared to a loss in 2001 of $41.7 millionfor the reasons as described above. The diluted earnings per share forincome before cumulative effect of change in accounting principle was$0.83, compared to a loss of $0.69 per diluted share in 2001.
In accordance with the adoption of Statement of Financial AccountingStandards (SFAS) No. 142, "Goodwill and Other Intangible Assets," thecompany recorded a transitional impairment loss of $12.7 million, net ofan income tax benefit of $7.8 million, which relates to the SpecialtySteel business. This transitional impairment loss was recorded as anon-cash charge and is reflected as the cumulative effect of a change inaccounting principle.
Net income for 2002 was $38.7 million compared to a net loss of $41.7 million in 2001. The 2002 diluted earnings per share was $0.62,as compared to a loss of $0.69 per diluted share in 2001.
$78.6 million compared to a loss of $17.6 million in 2001. In 2002, thecompany recorded $32.1 million in restructuring costs and $18.5 millionin reorganization costs, compared to $54.7 million in restructuring costsand $12.6 million in reorganization costs in 2001.
In December 2002, the company completed the second phase of the strategic global refocusing of its manufacturing operationsannounced in April 2001 to enable the company to more profitably execute its business strategies. MSI included: creating focused factories for each product line or component; reducing fixed costs;increasing production at the company’s lower-cost plants; and implementing more efficient, higher product quality manufacturingprocesses to continue to improve product quality and productivity. Aspart of MSI in 2001, the company announced its intention to close bearing plants in Columbus, Ohio, and Duston, England; to sell a toolingplant in Ashland, Ohio; and reduce employment by approximately 1,500by the end of 2002. In August 2001, the company announced andimplemented additional cost-saving actions by reducing capital spending, delaying or scaling back certain projects and reducing salariedemployment. The reductions affected approximately 300 salaried associates concentrated in North America and Western Europe andwere in addition to the 1,500 previously announced. These additionalsalaried associates exited the company by the end of 2001.
Manufacturing operations at the Columbus and Duston bearing plantsceased in November 2001 and September 2002, respectively.Additionally, on June 30, 2002, the company sold its Ashland plant.
As a result of MSI and the salaried workforce reduction, the companyhas targeted an annualized pretax rate of savings of approximately $120 million by the end of 2004. Attributable to MSI and the salariedworkforce reduction, the company achieved an estimated annual pretaxsavings rate of $80 million through December 31, 2002.
To implement the MSI and salaried workforce initiatives during 2001 and2002, the company expected to take approximately $100-$110 million inrestructuring, impairment and reorganization charges by December 31,2002. In total for 2001 and 2002, the company actually incurred $107.4 million in cumulative restructuring, impairment and reorganiza-tion charges related to the MSI and salaried workforce reduction programs. MSI-related charges were completed in 2002. For the yearended December 31, 2002, the company incurred $50.6 million inrestructuring and reorganization charges. A breakdown of theseexpenses is as follows (in millions of dollars):
Impairment expense $ 17.9Severance expense 3.5Curtailment expense 6.7Exit costs 4.0Reorganization expense:
Cost of products sold 8.6Selling, administrative and general expenses 9.9
Total expenses $ 50.6
The $17.9 million in impairment expense and $4.0 million in exit costsare related to the Duston and Columbus plant closures. The severanceand curtailment expenses incurred during 2002 primarily related to thesalaried workforce reduction in Automotive, Industrial and corporatefunctions, as well as certain Ashland plant associates. Also, in late 2002, the Steel Business reduced its salaried workforce. These Steel associates exited the company prior to December 31, 2002, and theirpositions have been eliminated.
23
MANAGEMENT ’S DISCUSSION AND ANALYSIS OF THE STATEMENT OF OPERATIONS (CONTINUED)

On June 27, 2002, the company announced an agreement with twoJapan-based companies, Sanyo Special Steel Co., Ltd. and Showa SeikoCo., Ltd., to form a joint venture, Advanced Green Components, LLC, tosupply forged and machined rings for bearing manufacture. The jointventure acquired the assets of the company’s Winchester, Kentuckyplant and commenced operations on November 1, 2002.
Industrial BearingsThe Industrial Bearings Business provides products for general industrial, rail, aerospace and super precision applications as well as foremerging markets in China, India and Central and Eastern Europe.Industrial’s 2002 net sales of $883.5 million were flat compared to netsales of $882.3 million in 2001. Soft markets and reduced demand created challenges for Industrial throughout 2002. Although generalindustrial demand strengthened modestly in 2002, this strength wasoffset by weaker demand from aerospace and rail customers. Raildemand is expected to remain depressed, and aerospace demandshows no near-term signs of improvement as customers reduce buildrates. Industrial markets are showing limited signs of modest recovery.Excluding $18.0 million in restructuring and reorganization charges andthe $39.4 million allocated portion of the CDSOA payment, net ofexpenses, EBIT for Industrial was $51.5 million in 2002. Excluding$33.5 million in restructuring and reorganization charges, the $27.0 million allocated portion of the CDSOA payment, net of expens-es, and $4.8 million in goodwill amortization, 2001 Industrial EBIT was$43.4 million. Including these special charges, CDSOA payments in2002 and 2001 and goodwill amortization, EBIT for Industrial was $72.9 million, compared to $32.1 million in 2001. The EBIT improve-ment, despite relatively flat volumes, resulted from: the improved salesmix; efficiency improvements from MSI and the salaried cost reductioninitiative; discontinuation of goodwill amortization; and aggressive business cost control. This improvement was tempered by weakeneddemand in aerospace and super precision, which resulted in additionalcosts associated with surplus capacity, reduced work schedules andredundancy costs as operations were slowed. Industrial’s selling,administrative and general expenses in 2002 were lower than 2001.This decrease was primarily due to salaried workforce reductions, which more than offset the increase in employee performance-basedcompensation.
SteelSteel net sales, including intersegment sales, increased 2.2% to $981.3 million in 2002, compared to $960.4 million in 2001. Sales to automotive and general industrial customers in 2002 increased19.2% and 18.8%, respectively, compared to 2001. However, sales toother customers continued to be sluggish. Aerospace sales decreased11.1%, compared to 2001. Additionally, sales to oil country and steelservice center customers continued to be depressed. The companyexpects a slight softening in automotive markets with modest improve-ment in construction, mining and agriculture sectors. Although thecompany expects significant improvement for the energy sector, non-defense aerospace is expected to remain weak. Excluding Steel’sportion of restructuring charges and reorganization charges of $3.8 million, Steel’s 2002 EBIT more than doubled to $32.5 million, compared to 2001 EBIT of $13.4 million, which excluded $2.7 million inrestructuring and reorganization charges and $1.2 million in goodwillamortization. Including these special charges, Steel’s 2002 EBIT was$28.7 million, compared to $9.3 million in 2001. The EBIT increase
MANAGEMENT ’S DISCUSSION AND ANALYSIS OF THE STATEMENT OF OPERATIONS (CONTINUED)
24
On October 16, 2002, the company announced an agreement withIngersoll-Rand Company Limited to acquire its Engineered Solutionsbusiness, including certain operating assets and its subsidiary, TheTorrington Company, a leading worldwide producer of needle roller,heavy-duty roller and ball bearings, and motion control components andassemblies, for cash and stock valued at approximately $840 million.Under terms of the agreement, Ingersoll-Rand received $700 million incash, subject to post-closing adjustments, and $140 million worth of thecompany’s common stock.
Automotive BearingsThe Automotive Bearings segment manufactures and distributes products for passenger cars, light- and heavy-duty trucks and trailers.Automotive Bearings’ sales for 2002 increased 11.9% to $840.8 millionfrom $751.0 million in 2001. Widespread incentive programs on light-trucks and changing environmental regulations on heavy trucksdrove North American demand in 2002. North American light-truck production was up 8.4% from 2001, medium- and heavy-duty truck production was up 1.9% and trailer production was down approximately11% from 2001 levels. Seven new vehicle platform launches in 2002increased sales by $67.6 million. The European automotive market wasweak in 2002 and is not expected to show signs of improvement in2003. The global automotive industry is expected to soften in 2003.However, this will not be uniform in all areas of the world. In NorthAmerica, light truck production is projected to be flat from 2002’s strong levels, and medium and heavy truck production is projected to be greater than 10%. Excluding $28.7 million in restructuring and reorganization charges and the $10.8 million allocated portion of the CDSOA payment, net of expenses, Automotive’s EBIT was $32.6 million in 2002. Excluding $31.0 million in restructuring and reorganization charges and the $2.5 million allocated portion of theCDSOA payment, net of expenses, 2001 Automotive’s EBIT was a lossof $11.4 million. Including these special charges and CDSOA paymentsin 2002 and 2001, Automotive’s EBIT was $14.7 million, compared to aloss of $39.9 million in 2001. The improvement in EBIT resulted from:increased sales volume; increased savings enhanced by the manufac-turing strategy and salaried cost reduction initiatives; aggressive business cost control; and a LIFO liquidation. These increases morethan offset the adverse impact of operating inefficiencies resulting fromcapacity constraints caused by equipment rationalization related to MSIand costs incurred to meet higher-than-expected customer demand.Automotive’s selling, administrative and general expenses were lowerthan a year ago, primarily due to salaried workforce and business cost reductions. Despite an increase in reorganization charges andemployee performance-based compensation, Automotive was able toachieve significant cost savings in 2002.
On April 8, 2002, the company announced an agreement with NSK Ltd. to form a joint venture to build a plant near Shanghai, China to manufacture certain tapered roller bearing product lines. Production isscheduled to start early in 2004. Ownership of this joint venture,Timken-NSK Bearings (Suzhou) Co. Ltd., is divided evenly between NSKLtd. and the company.

resulted from continued cost-control actions and improved productivity.In 2002, Steel reduced operating costs through a combination of pricereductions, product substitution and lower consumption. Althoughscrap and alloy costs in 2002 increased 8.1% from 2001 levels, electricity and natural gas costs were lower and contributed to theimproved EBIT performance. Additionally, 2002 labor productivityincreased compared to 2001 as a result of efficiency improvements andincreased production levels. In 2002, plant capacity utilization wasbetween 70% and 80%, varying by business and product, which wasslightly better than 2001. Steel’s selling, administrative and generalexpenses in 2002 were slightly higher than 2001 primarily due to theincrease in employee performance-based compensation, which was partially offset by savings associated with the salaried workforcereductions.
2001 compared to 2000Net sales of $2.4 billion decreased 7.4% from $2.6 billion in 2000.Continuing weakness in industrial demand and the U.S. manufacturingrecession contributed to the decreased sales and profits for 2001. Thestrong U.S. dollar continued to hurt business competitiveness in globalmarkets. The company experienced declining demand in key sectors,including North American heavy-duty truck and rail, as well as inventorybalancing in the North American light-truck and SUV market. Globally,demand for industrial products decreased in 2001. Aerospace andsuper precision sales increased modestly over 2000 levels. Sales ofsteel products in all markets except aerospace were significantly lower.Gross profit in 2001 was $400.7 million, or 16.4% of net sales, downfrom $500.9 million, or 19.0% of net sales. The impact of the lowersales volume, fueled by weakened automotive and industrial productdemand as well as reduced operating levels to control inventory,reduced profitability in 2001, compared to 2000. In 2001, gross profitincluded $7.7 million in reorganization costs compared to $4.1 million in2000. In 2001, the economic downturn resulted in a reduction of 777 positions, and the company’s restructuring efforts led to an addi-tional 762 reductions. The operating loss of 2001 was $17.6 million,compared to income of $105.6 million in 2000. In 2001, the companyrecorded restructuring costs of $54.7 million and $12.6 million of reorganization costs, compared to $27.8 million in restructuring costsand $11.1 million in reorganization costs in 2000. Selling, administrativeand general expenses decreased to $363.7 million, or 14.9% of netsales, in 2001, compared to $367.5 million, or 13.9% of net sales, in2000. This decrease was primarily caused by reduced compensationexpense.
During 2001, the company had two active cost-reduction programs: an efficiency initiative announced in March 2000 and concluded duringthe first quarter of 2001, and the strategic manufacturing initiativeannounced in April 2001 to enable the company to more profitably execute business strategies. The efficiency initiative announced inMarch 2000 concluded during the first quarter of 2001, with totalcharges of $49.4 million, or $10.5 million in 2001, recorded for impairment, restructuring and reorganization. Of the $49.4 million totalcharges recorded between March 2000 and March 2001, $20.7 millionwere impairment expenses, $13.0 million related to restructuringexpenses and $15.7 million were reorganization expenses. Total payments of $13.0 million were disbursed as of December 31, 2001.Estimated savings related to this program realized through the end
of 2001 approximated $26 million before taxes. During 2001, 106 positions were eliminated due to the efficiency initiative. Combinedwith positions eliminated during 2000, the total elimination from this initiative was 694 positions.
In August 2001, the company announced additional cost-saving actionsunder the strategic manufacturing initiative. The company took steps tofurther reduce capital spending, delay or scale back certain projects andreduce salaried employment. The reductions affected about 300 salaried associates concentrated in North America and WesternEurope. These associates exited the company by the end of 2001.From the announcement of the strategic manufacturing initiative in April2001 through the end of 2001, 856 associates left the company. Of thatnumber, 618 people were from the Duston, and Columbus plants,Canadian Timken Ltd. and salaried associates included in the worldwidesalaried workforce reduction for whom severance has been paid. Theremaining 238 associates retired or voluntarily left the company by theend of the year, and their positions have been eliminated.
From the strategic manufacturing initiative, the company had achievedestimated annualized pretax savings of $21.0 million as of the end of2001. The charges incurred for this initiative through December 31,2001 totaled $56.8 million. Of that amount, $15.1 million were curtailment charges, $1.5 million were related to impaired assets, $30.8 million were severance expenses, $1.4 million were exit costsand the remaining $8.0 million were reorganization charges classified ascost of products sold ($4.1 million) and selling, administrative and general expenses ($3.9 million). The curtailment charges of $15.1 million were for the pension and postretirement benefits relatedto the shutdown of the Columbus plant. The $30.8 million of severancecosts and $1.4 million in exit costs were related to the shutdown of the Columbus and Duston plants as well as reductions in the salariedworkforce.
The company received a gross payment of $31.0 million from the U.S.Treasury Department under the CDSOA in the fourth quarter of 2001.This payment, net of expenses, was $29.6 million, and is reflected as aseparate component on the consolidated statement of operations.Foreign currency translation losses related to non-hyperinflationaryeconomies totaled $0.9 million in 2001, compared to income of $2.6 million in 2000. The increase in translation losses is related to thecontinued weakening of European currencies against a strong U.S. dollar and the devaluation of the Brazilian real during 2001. The company’s subsidiary in Romania is considered to operate in a highlyinflationary economy. In 2001, the company recorded unrealizedexchange losses of $2.3 million related to the translation of TimkenRomania’s financial statements, compared to $4.0 million in 2000. Theexpense was impacted by the strength of the U.S. dollar. Although thecompany recorded a loss before income taxes for the twelve monthsended December 31, 2001, a consolidated tax provision was recordedas a result of generating income in certain jurisdictions where taxesmust be provided and losses in other jurisdictions, which are not available to reduce overall tax expense.
25
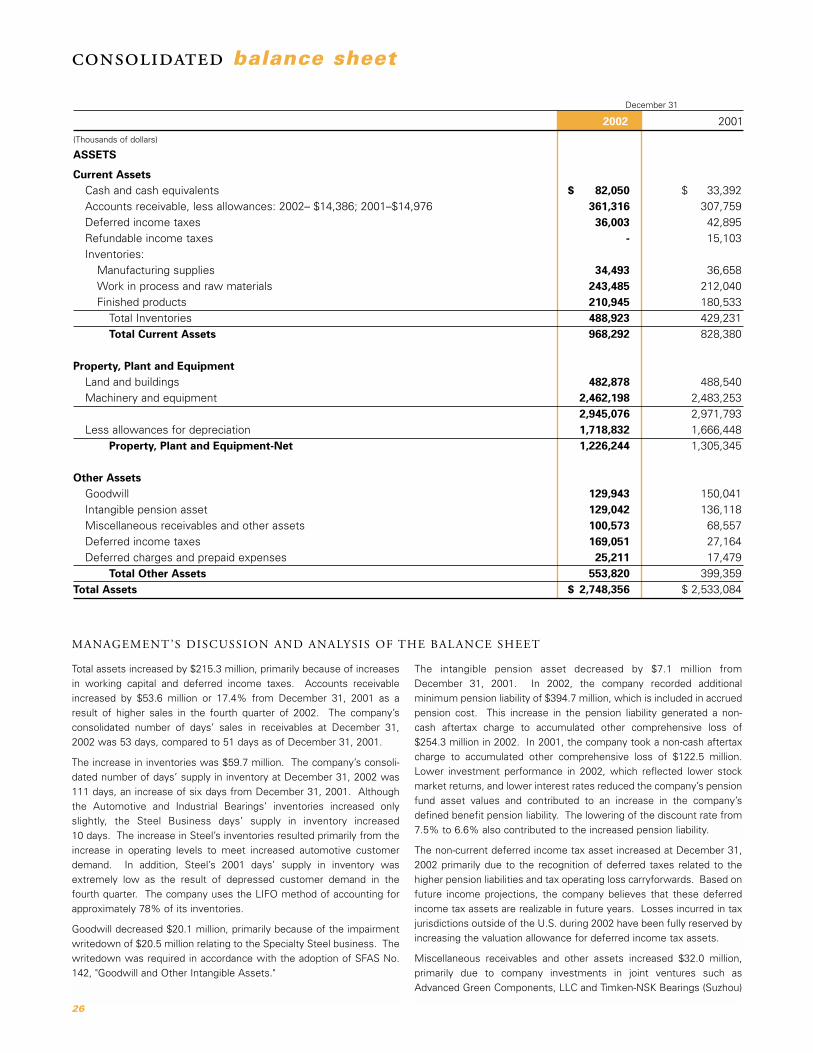
December 31
2002 2001
(Thousands of dollars)
ASSETS
Current AssetsCash and cash equivalents $ 82,050 $ 33,392Accounts receivable, less allowances: 2002– $14,386; 2001–$14,976 361,316 307,759Deferred income taxes 36,003 42,895Refundable income taxes - 15,103Inventories:
Manufacturing supplies 34,493 36,658Work in process and raw materials 243,485 212,040Finished products 210,945 180,533
Total Inventories 488,923 429,231Total Current Assets 968,292 828,380
Property, Plant and EquipmentLand and buildings 482,878 488,540Machinery and equipment 2,462,198 2,483,253
2,945,076 2,971,793Less allowances for depreciation 1,718,832 1,666,448
Property, Plant and Equipment-Net 1,226,244 1,305,345
Other AssetsGoodwill 129,943 150,041Intangible pension asset 129,042 136,118Miscellaneous receivables and other assets 100,573 68,557Deferred income taxes 169,051 27,164Deferred charges and prepaid expenses 25,211 17,479
Total Other Assets 553,820 399,359Total Assets $ 2,748,356 $ 2,533,084
Total assets increased by $215.3 million, primarily because of increasesin working capital and deferred income taxes. Accounts receivableincreased by $53.6 million or 17.4% from December 31, 2001 as a result of higher sales in the fourth quarter of 2002. The company’s consolidated number of days’ sales in receivables at December 31,2002 was 53 days, compared to 51 days as of December 31, 2001.
The increase in inventories was $59.7 million. The company’s consoli-dated number of days’ supply in inventory at December 31, 2002 was111 days, an increase of six days from December 31, 2001. Althoughthe Automotive and Industrial Bearings’ inventories increased onlyslightly, the Steel Business days’ supply in inventory increased 10 days. The increase in Steel’s inventories resulted primarily from theincrease in operating levels to meet increased automotive customerdemand. In addition, Steel’s 2001 days’ supply in inventory wasextremely low as the result of depressed customer demand in thefourth quarter. The company uses the LIFO method of accounting forapproximately 78% of its inventories.
Goodwill decreased $20.1 million, primarily because of the impairmentwritedown of $20.5 million relating to the Specialty Steel business. Thewritedown was required in accordance with the adoption of SFAS No.142, "Goodwill and Other Intangible Assets."
The intangible pension asset decreased by $7.1 million from December 31, 2001. In 2002, the company recorded additional minimum pension liability of $394.7 million, which is included in accruedpension cost. This increase in the pension liability generated a non-cash aftertax charge to accumulated other comprehensive loss of$254.3 million in 2002. In 2001, the company took a non-cash aftertaxcharge to accumulated other comprehensive loss of $122.5 million.Lower investment performance in 2002, which reflected lower stockmarket returns, and lower interest rates reduced the company’s pensionfund asset values and contributed to an increase in the company’sdefined benefit pension liability. The lowering of the discount rate from7.5% to 6.6% also contributed to the increased pension liability.
The non-current deferred income tax asset increased at December 31,2002 primarily due to the recognition of deferred taxes related to thehigher pension liabilities and tax operating loss carryforwards. Based onfuture income projections, the company believes that these deferred income tax assets are realizable in future years. Losses incurred in taxjurisdictions outside of the U.S. during 2002 have been fully reserved byincreasing the valuation allowance for deferred income tax assets.
Miscellaneous receivables and other assets increased $32.0 million, primarily due to company investments in joint ventures such asAdvanced Green Components, LLC and Timken-NSK Bearings (Suzhou)
MANAGEMENT ’S DISCUSSION AND ANALYSIS OF THE BALANCE SHEET
consolidated balance sheet
26
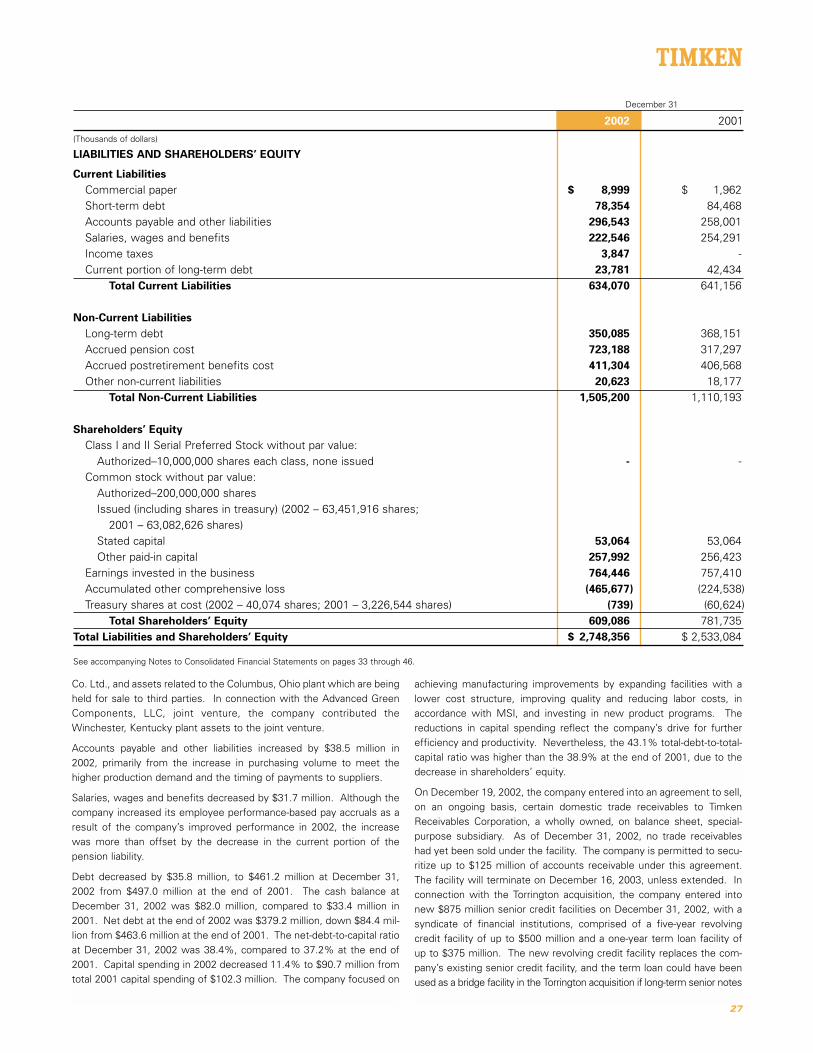
December 31
2002 2001
(Thousands of dollars)
LIABILITIES AND SHAREHOLDERS’ EQUITY
Current LiabilitiesCommercial paper $ 8,999 $ 1,962Short-term debt 78,354 84,468Accounts payable and other liabilities 296,543 258,001Salaries, wages and benefits 222,546 254,291Income taxes 3,847 -Current portion of long-term debt 23,781 42,434
Total Current Liabilities 634,070 641,156
Non-Current LiabilitiesLong-term debt 350,085 368,151Accrued pension cost 723,188 317,297Accrued postretirement benefits cost 411,304 406,568Other non-current liabilities 20,623 18,177
Total Non-Current Liabilities 1,505,200 1,110,193
Shareholders’ EquityClass I and II Serial Preferred Stock without par value:
Authorized–10,000,000 shares each class, none issued - -Common stock without par value:
Authorized–200,000,000 sharesIssued (including shares in treasury) (2002 – 63,451,916 shares;
2001 – 63,082,626 shares)Stated capital 53,064 53,064Other paid-in capital 257,992 256,423
Earnings invested in the business 764,446 757,410Accumulated other comprehensive loss (465,677) (224,538)Treasury shares at cost (2002 – 40,074 shares; 2001 – 3,226,544 shares) (739) (60,624)
Total Shareholders’ Equity 609,086 781,735Total Liabilities and Shareholders’ Equity $ 2,748,356 $ 2,533,084
See accompanying Notes to Consolidated Financial Statements on pages 33 through 46.
Co. Ltd., and assets related to the Columbus, Ohio plant which are beingheld for sale to third parties. In connection with the Advanced GreenComponents, LLC, joint venture, the company contributed theWinchester, Kentucky plant assets to the joint venture.
Accounts payable and other liabilities increased by $38.5 million in 2002, primarily from the increase in purchasing volume to meet the higher production demand and the timing of payments to suppliers.
Salaries, wages and benefits decreased by $31.7 million. Although thecompany increased its employee performance-based pay accruals as aresult of the company’s improved performance in 2002, the increasewas more than offset by the decrease in the current portion of the pension liability.
Debt decreased by $35.8 million, to $461.2 million at December 31,2002 from $497.0 million at the end of 2001. The cash balance atDecember 31, 2002 was $82.0 million, compared to $33.4 million in2001. Net debt at the end of 2002 was $379.2 million, down $84.4 mil-lion from $463.6 million at the end of 2001. The net-debt-to-capital ratioat December 31, 2002 was 38.4%, compared to 37.2% at the end of2001. Capital spending in 2002 decreased 11.4% to $90.7 million fromtotal 2001 capital spending of $102.3 million. The company focused on
achieving manufacturing improvements by expanding facilities with a lower cost structure, improving quality and reducing labor costs, in accordance with MSI, and investing in new product programs. Thereductions in capital spending reflect the company’s drive for furtherefficiency and productivity. Nevertheless, the 43.1% total-debt-to-total-capital ratio was higher than the 38.9% at the end of 2001, due to thedecrease in shareholders’ equity.
On December 19, 2002, the company entered into an agreement to sell,on an ongoing basis, certain domestic trade receivables to Timken Receivables Corporation, a wholly owned, on balance sheet, special- purpose subsidiary. As of December 31, 2002, no trade receivables had yet been sold under the facility. The company is permitted to secu-ritize up to $125 million of accounts receivable under this agreement.The facility will terminate on December 16, 2003, unless extended. In connection with the Torrington acquisition, the company entered intonew $875 million senior credit facilities on December 31, 2002, with asyndicate of financial institutions, comprised of a five-year revolvingcredit facility of up to $500 million and a one-year term loan facility of up to $375 million. The new revolving credit facility replaces the com-pany’s existing senior credit facility, and the term loan could have beenused as a bridge facility in the Torrington acquisition if long-term senior notes
27

Year Ended December 31
2002 2001 2000
(Thousands of dollars)
CASH PROVIDED (USED)
Operating ActivitiesNet income (loss) $ 38,749 $ (41,666) $ 45,888Adjustments to reconcile net income (loss) to net cash
provided by operating activities:Cumulative effect of change in accounting principle 12,702 - -Depreciation and amortization 146,535 152,467 151,047Loss (gain) on disposals of property, plant and equipment 5,904 (2,233) 3,982Deferred income tax provision 17,250 23,013 10,585Common stock issued in lieu of cash to benefit plans 5,217 1,441 1,303Impairment and restructuring charges (13,564) 41,832 16,813Changes in operating assets and liabilities:
Accounts receivable (43,679) 44,803 (22,536)Inventories (50,611) 51,247 (52,566)Other assets (3,198) (16,897) (172)Accounts payable and accrued expenses 80,761 (72,483) 4,046Foreign currency translation loss (gain) 10,037 (3,886) (1,296)Net Cash Provided by Operating Activities 206,103 177,638 157,094
Investing ActivitiesPurchases of property, plant and equipment–net (85,277) (90,501) (159,157)Proceeds from disposals of property, plant and equipment 12,616 6,357 2,669Acquisitions (6,751) (12,957) -
Net Cash Used by Investing Activities (79,412) (97,101) (156,488)
Financing ActivitiesCash dividends paid to shareholders (31,713) (40,166) (43,562)Purchases of treasury shares - (2,931) (24,149)Proceeds from issuance of long-term debt - 80,766 3,478Payments on long-term debt (37,296) (2,176) (3,595)Short-term debt activity–net (11,498) (90,980) 70,865
Net Cash (Used) Provided by Financing Activities (80,507) (55,487) 3,037Effect of exchange rate changes on cash 2,474 (2,585) (622)
Increase In Cash and Cash Equivalents 48,658 22,465 3,021Cash and cash equivalents at beginning of year 33,392 10,927 7,906
Cash and Cash Equivalents at End of Year $ 82,050 $ 33,392 $ 10,927
See accompanying Notes to Consolidated Financial Statements on pages 33 through 46.
paid IR $700 million in cash, subject to post-closing purchase priceadjustments, and issued $140 million of its common stock (9,395,973shares) to Ingersoll-Rand Company, a subsidiary of IR. To finance thecash portion of the transaction the company utilized, in addition to cashon hand: $180 million, net of underwriting discounts and commissions,from a public offering of 12,650,000 shares of common stock at $14.90per share; $246.9 million, net of underwriting discounts and commis-sions, from a public offering of $250 million of 5.75% senior unsecurednotes due 2010; $125 million from its accounts receivable facility; andapproximately $86 million from its new senior credit facility.
In connection with the closing of the Torrington acquisition and the funding of its new senior credit facility, the company terminated its thenexisting $300 million revolving credit agreement. In addition, the company did not utilize the $375 million one-year term loan facility that was a part of the new senior credit facility.
MANAGEMENT ’S DISCUSSION AND ANALYSIS OF THE BALANCE SHEET (CONTINUED)
consolidated statement of cash flows
28
had not been issued prior to closing the Torrington acquisition. Proceeds of the new senior credit facility must be used to repay any amountsoutstanding under the existing credit facility, and the existing credit facility must be terminated. As of December 31, 2002, the company had$291.0 million available through its then existing $300.0 million seniorcredit facility. The company’s then existing revolving credit facility andits new senior credit facility contain covenants requiring the company tocomply with a maximum debt-to-capital ratio and a minimum fixedcharge coverage ratio, and the new senior credit facility also requires thecompany to maintain a minimum consolidated net worth amount. Thecompany is currently in compliance with the terms of these covenants.
Effective February 16, 2003, the company acquired IR’s EngineeredSolutions business, which is comprised of certain operating assets and subsidiaries, including The Torrington Company. The company

On October 17, 2002, Standard & Poor’s Rating Services (S&P)announced that it placed its rating with respect to the company on CreditWatch with negative implications. Additionally, Moody’s InvestorsService (Moody’s) announced that it had placed the company’s debt rating under review for possible downgrade. These announcementswere in response to the company’s announcement that it had reached an agreement with Ingersoll-Rand to purchase Torrington. OnFebruary 12, 2003, S&P and Moody’s announced that each had loweredits respective ratings on the company’s outstanding debt, with a stableoutlook. The company believes that it has structured the financing ofthe Torrington acquisition in a manner that will enable it to maintain aninvestment grade rating, although the company cannot assure that therating agencies will agree with its view. Ratings reflect the view of theapplicable rating agency at the time a rating is issued, and any explana-tion of the significance of a rating may be obtained only from the ratingagency itself. A credit rating is not a recommendation to buy, sell orhold securities. Further downgradings would result in an increase in theinterest rate on the new senior credit facility, and could materiallyadversely affect the company’s future ability to obtain funding or couldmaterially increase the cost of any additional funding.
Following the Torrington acquisition, to the extent possible, the company intends to continue its efforts to reduce debt. The companyexpects to satisfy any cash requirements in excess of cash generatedfrom operating activities through drawings under the new revolving credit facility and the accounts receivable facility.
The company’s contractual debt obligations and contractual commit-ments outstanding as of December 31, 2002 are as follows (in millions):
29
MANAGEMENT ’S DISCUSSION AND ANALYSIS OF THE BALANCE SHEET (CONTINUED)
Payments Due by PeriodLessthan 1-3 4-5 After 5
Total 1 year years years years
Long-term debt $ 373.9 $ 23.8 $ 8.4 $ 103.6 $238.1
Commercial paper $ 9.0 $ 9.0 - - -
Other lines of credit $ 78.4 $ 78.4 - - -
Operating leases $ 50.2 $ 12.1 $ 14.9 $ 7.0 $ 16.2
Supply agreement $ 25.9 $ 8.5 $ 12.8 $ 4.6 $ -
The company’s capital lease obligations are immaterial. The company is the guarantor of $27.5 million in debt for Pel Technologies, LLC, an equity investment of the company. The company is the guarantor for asubsidiary’s operating lease of its warehouse facility. This obligation is$16.8 million at December 31, 2002. In connection with the Ashlandplant sale, the company entered into a four-year supply agreement.
Shareholders’ equity decreased $172.6 million in 2002 from 2001. Thecompany recognized $38.7 million in net income, issuances of commonstock of $61.4 million resulting from the stock contribution to the pension plan and other stock transactions, and a positive non-cash foreign currency translation adjustment of $14.0 million. However,these increases were more than offset by the minimum pension liability adjustment of $254.3 million and the payment of $31.7 millionin dividends. On September 10, 2002, the company issued 3 millionshares of its common stock to The Timken Company CollectiveInvestment Trust for Retirement Trusts (Trust) as a contribution to certain company-sponsored pension plans. The value of the 3 million shares of common stock contributed to the Trust wasapproximately $54.5 million, which consisted of 2,766,955 shares of the company’s treasury stock and 233,045 shares issued from authorized common stock.
Cash and cash equivalents increased $48.6 million in 2002. Net cashprovided by operations in 2002 was $206.1 million, compared to $177.6million in 2001, due solely to the impact of the increased CDSOA pay-ment received in 2002. Cash generated from income in 2002 was usedto fund working capital changes, MSI, capital expenditures, and toreduce debt. The increase in accounts receivable used $43.7 million incash in 2002. The increase in inventories required $50.6 million of cashin 2002. Although other assets increased significantly in 2002, the cashflow effect was minimal as the increase related to the contribution ofassets from property, plant and equipment invested in the AdvancedGreen Components, LLC joint venture as well as Columbus plant assetsfor sale, which are classified in 2002 as assets "held for sale." Cash wasprovided by an $80.8 million increase in accounts payable and accruedexpenses due primarily to the increases in amounts reserved for
employee performance-based compensation due to the company’simproved performance in 2002, and amounts payable to suppliers.
Purchases of property, plant and equipment-net were $85.3 million in2002, compared to $90.5 million in 2001.
During 2002, the company did not purchase any shares of its commonstock under the company’s 2000 common stock purchase plan. Thisplan authorizes the company to buy up to 4 million shares of commonstock in the open market or in privately negotiated transactions, whichare to be held as treasury shares and used for specified purposes. Thecompany may exercise this authorization until December 31, 2006. Thecompany does not expect to be active in repurchasing shares in thenear-term. Under the company’s new revolving credit facility, only $20 million in common shares may be repurchased in any one year.
MANAGEMENT ’S DISCUSSION AND ANALYSIS OF THE STATEMENT OF CASH FLOWS
disposed of other than by sale. Adoption of SFAS No. 144 did not have any effect on the company’s financial position or results of operations.
In June 2002, the FASB issued SFAS No. 146, "Accounting for CostsAssociated with Exit or Disposal Activities," which addresses financialaccounting and reporting for costs associated with exit or disposal activities and nullifies Emerging Issues Task Force (EITF) Issue
MANAGEMENT ’S DISCUSSION AND ANALYSIS OF OTHER INFORMATION
Recent Accounting PronouncementsIn October 2001, the Financial Accounting Standards Board (FASB)issued Statement of Financial Accounting Standards (SFAS) No. 144,"Accounting for Impairment or Disposal of Long-Lived Assets." SFASNo. 144 supersedes SFAS No. 121, "Accounting for the Impairment ofLong-Lived Assets and for Long-Lived Assets to Be Disposed Of."SFAS No. 144 retains the existing requirements for long-lived assets tobe held and used, but it establishes one accounting model for long-livedassets to be disposed of by sale and revises guidance for assets to be
shipping point, except for certain exported goods, for which it occurswhen the goods reach their destination. Selling prices are fixed, basedon purchase orders or contractual arrangements. Write-offs ofaccounts receivable historically have been low.
As noted above, it is the company’s policy to recognize restructuringcosts in accordance with EITF 94-3 and the SEC Staff AccountingBulletin No. 100, "Restructuring and Impairment Charges." Detailedcontemporaneous documentation is maintained and updated on amonthly basis to ensure that accruals are properly supported. If management determines that there is a change in the estimate, theaccruals are adjusted to reflect this change.
The company sponsors a number of defined benefit pension plans,which cover most associates, except for those at certain international locations who are covered by government plans. The company also sponsors several unfunded postretirement plans that provide healthcare and life insurance benefits for eligible retirees and dependents. The measurement of liabilities related to these plans is based on man-agement’s assumptions related to future events, including return onpension plan assets, rate of compensation increases and health carecost trend rates. The discount rate is determined using a model thatmatches corporate bond securities against projected future pensionand postretirement disbursements. Actual pension plan asset perfor-mance either reduces or increases net actuarial gains or losses in thecurrent year, which ultimately affects net income in subsequent years.
For expense purposes in 2002, the company applied a discount rate of7.5% and an expected rate of return of 9.5% for the company’s pen-sion plan assets. For 2003 expense, the company reduced the discountrate to 6.6%. Also, the assumption for expected rate of return on planassets was changed from 9.5% to 8.75% for 2003. This change, alongwith the lower discount rate, will result in an increase in 2003 pretaxpension expense of approximately $25 million. A 0.25% reduction inthe discount rate would increase pension expense by approximately $6 million for 2003. A 0.25% reduction in the expected rate of returnwould increase pension expense by approximately $3.4 million for 2003.
For measurement purposes, the company assumed a weighted-average annual rate of increase in the per capita cost (health care costtrend rate) for medical benefits of 9.0% for 2003, declining gradually to6.0% in 2006 and thereafter for pre-age 65 benefits; 6.0% for post-age 65 benefits for all years; and 15.0% for 2003, declining gradually to6.0% in 2014 and thereafter for prescription drug benefits. Theassumed health care cost trend rate has a significant effect on theamounts reported. A one-percentage-point increase in the assumedhealth care cost trend rate would have increased the 2002 total serviceand interest cost components by $2.1 million and would have increasedthe postretirement benefit obligation by $32.0 million. A one-percent-age-point decrease would provide corresponding reductions of $1.9 million and $28.6 million, respectively.
SFAS No. 109, "Accounting for Income Taxes," requires that a valuationallowance be established when it is more likely than not that all or a portion of a deferred tax asset will not be realized. The company estimates actual current tax due and assesses temporary differencesresulting from the treatment of items for tax and accounting purposes.These differences result in deferred tax assets and liabilities that are
MANAGEMENT ’S DISCUSSION AND ANALYSIS OF OTHER INFORMATION (CONTINUED)
No. 94-3, "Liability Recognition for Certain Employee TerminationBenefits and Other Costs to Exit an Activity (including Certain CostsIncurred in a Restructuring)." SFAS No. 146 requires that a liability for acost associated with an exit or disposal activity be recognized and mea-sured initially at fair value only when the liability is incurred. Under EITFIssue No. 94-3, a liability for an exit cost was recognized at the date ofan entity’s commitment to an exit plan. SFAS No. 146 is effective forexit and disposal activities that are initiated after December 31, 2002.SFAS No. 146 has no effect on charges recorded for exit activitiesbegun prior to this date. As such, the company continues to recognizerestructuring costs in connection with MSI in accordance with EITFIssue No. 94-3. The company does not expect the adoption of thisstatement to have a material effect on our financial position or resultsof operations.
In November 2002, the FASB issued Interpretation No. 45, "Guarantor’sAccounting and Disclosure Requirements for Guarantees, IncludingIndirect Guarantees of Indebtedness of Others" (the Interpretation).The Interpretation’s disclosure requirements are effective for financialstatements of interim or annual periods ending after December 15,2002. The initial recognition and initial measurement provisions areapplicable on a prospective basis to guarantees issued or modified afterDecember 31, 2002. The Interpretation requires certain guarantees to be recorded at fair value. The guarantor’s previous accounting forguarantees issued prior to the date of initial application should not berevised or restated.
On January 17, 2003, the FASB issued Interpretation No. 46,"Consolidation of Variable Interest Entities." In general, a variable interest entity is a corporation, partnership, trust or any other legalstructure used for business purposes that either (a) does not have equity investors with voting rights or (b) has equity investors who donot provide sufficient financial resources for the entity to support its activities. Interpretation 46 requires a variable interest entity to be consolidated by a company if that company is subject to a majority ofthe risk of loss from the variable interest entity’s activities or entitled toreceive a majority of the entity’s residual returns or both. The consoli-dation requirements of Interpretation 46 apply immediately to variableinterest entities created after January 31, 2003. The consolidationrequirements apply to pre-existing entities in the first fiscal year or interim period beginning after June 15, 2003. Certain of the disclosurerequirements apply in all financial statements issued after January 31,2003, regardless of when the variable interest entity was established.The company is currently evaluating the impact of Interpretation 46 onthe financial position of the company.
Critical Accounting Policies and EstimatesThe company’s financial statements are prepared in accordance withaccounting principles generally accepted in the United States. Thepreparation of these financial statements requires management tomake estimates and assumptions that affect the reported amounts ofassets and liabilities at the date of the financial statements and thereported amounts of revenues and expenses during the periods presented. The following paragraphs include a discussion of some critical areas that require a higher degree of judgment, estimates andcomplexity.
The company’s revenue recognition policy is to recognize revenuewhen title passes to the customer. This occurs generally at the
30
In November 2002, the U.S. government initiated additional consulta-tions with U.S. steel consumers and international producers to discusspotential exemptions from the increased tariffs. Moreover, while thePresident’s decision to implement a Section 201 remedy is not appeal-able to U.S. courts, foreign governments and other countries mayappeal, and some have appealed to the World Trade Organization(WTO). The European Union, Japan and other countries are currentlyprosecuting these appeals. These dispute settlement proceedings atthe WTO and further appeals to the Appellate Body of the WTO generally take 15 to 24 months. Additionally, a number of affectedcountries have imposed or threatened to impose various retaliatory tariffs on U.S. steel or other products or have sought various productexemptions from the imposition of the tariffs.
On July 30, 2002, the board of directors elected James W. Griffith chiefexecutive officer. He assumed primary and executive responsibility forthe strategy and performance of the company. He continues to serveas president and as a director.
In January 2003, the board of directors elected Sallie B. Bailey seniorvice president – finance and controller. She continues to serve as anofficer of the company.
On January 31, 2003, the board of directors declared a quarterly cashdividend of $0.13 per share, payable on March 4, 2003 to shareholdersof record as of February 14, 2003. This is the 323rd consecutive dividend paid on the common stock of the company.
The company continues to protect the environment and comply withenvironmental protection laws. Additionally, it has invested in pollutioncontrol equipment and updated plant operational practices. The com-pany is committed to implementing a documented environmental management system worldwide and to becoming certified under theISO 14001 standard to meet or exceed customer requirements. By theend of 2002, eleven of the company’s plants had obtained ISO 14001 certification. Six additional plants are on schedule to be certified by July 2003. The company believes it has established adequate reservesto cover its environmental expenses and has a well-established environmental compliance audit program, which includes a proactiveapproach to bringing its domestic and international units to higher standards of environmental performance. This program measures performance against local laws, as well as standards that have beenestablished for all units worldwide. It is difficult to assess the possibleeffect of compliance with future requirements that differ from existingones. As previously reported, the company is unsure of the futurefinancial impact to the company that could result from the UnitedStates Environmental Protection Agency’s (EPA’s) final rules to tightenthe National Ambient Air Quality Standards for fine particulate and ozone.
The company and certain of its U.S. subsidiaries have been designatedas potentially responsible parties by the United States EPA for siteinvestigation and remediation at certain sites under the ComprehensiveEnvironmental Response, Compensation and Liability Act (Superfund).The claims for remediation have been asserted against numerous otherentities, which are believed to be financially solvent and are expectedto fulfill their proportionate share of the obligation. Managementbelieves any ultimate liability with respect to all pending actions will notmaterially affect the company’s operations, cash flows or consolidatedfinancial position.
included within the balance sheet. Based on known and projectedearnings information and prudent tax planning strategies, the companythen assesses the likelihood that the deferred tax assets will be recovered. To the extent that the company believes recovery is not likely, a valuation allowance is established. In the event that the company determines the realizability of deferred tax assets in the futureis in excess of the net recorded amount, an adjustment to the deferredtax asset would increase income in the period in which such determi-nation was made. Likewise, if the company determines that it is unlikely that all or part of the net deferred tax asset will be realized inthe future, an adjustment to the deferred tax asset would be chargedto expense in the period in which such determination was made. Netdeferred tax assets relate primarily to pension and postretirement benefits, which the company believes will result in future tax benefits.Significant management judgment is required in determining the provision for income taxes, deferred tax assets and liabilities, and any valuation allowance recorded against net deferred tax assets.Historically, actual results have not differed significantly from thosedetermined using the estimates described above.
Other MattersChanges in short-term interest rates related to three separate fundingsources impact the company’s earnings. These sources are commer-cial paper issued in the United States, floating rate tax-exempt U.S.municipal bonds with a weekly reset mode, and short-term bank borrowings at international subsidiaries. If the market rates for short-term borrowings increased by 1% around the globe, the impactwould be an increase in interest expense of $1.3 million with a corresponding decrease in income before taxes of the same amount.The amount was determined by considering the impact of hypotheticalinterest rates on the company’s borrowing cost, year-end debt balancesby category and an estimated impact on the tax-exempt municipalbonds’ interest rates.
Fluctuations in the value of the U.S. dollar compared to foreign curren-cies, predominately in European countries, also impact the company’searnings. The greatest risk relates to products shipped between thecompany’s European operations and the United States. Foreign currency forward contracts and options are used to hedge these intracompany transactions. Additionally, hedges are used to coverthird-party purchases of product and equipment. As of December 31,2002, there were $72.1 million hedges in place. A uniform 10% weak-ening of the dollar against all currencies would have resulted in achange of $6.5 million on these hedges. In addition to the direct impactof the hedged amounts, changes in exchange rates also affect the volume of sales or foreign currency sales price as competitors’ products become more or less attractive.
On March 5, 2002, pursuant to Section 201 of the U.S. Trade Act of1974, President Bush signed a proclamation imposing increased tariffsfor a three-year period on imports of hot-rolled and cold-finished steelbar imports, in response to the ITC finding that the U.S. steel industrywas being injured as a result of excessive imports by international competitors. The remedy for these product categories is three years oftariffs at 30%, 24% and 18%. Rulings adverse to the United States orsubstantial political pressures could, however, result in the Presidentchanging the remedy, granting substantial exemptions from the remedy, or terminating the remedy entirely prior to the end of the three-year period.
31

Common Stock Earnings AccumulatedOther Invested Other
Stated Paid-In in the Comprehensive TreasuryTotal Capital Capital Business Loss Stock
(Thousands of dollars, except share data)
Year Ended December 31, 2000Balance at January 1, 2000 $1,045,981 $ 53,064 $ 258,287 $ 836,916 $ (64,134) $ (38,152)
Net income 45,888 45,888Foreign currency translation adjustments
(net of income tax of $1,137) (21,293) (21,293)Minimum pension liability adjustment
(net of income tax of $301) 514 514Total comprehensive income 25,109Dividends–$0.72 per share (43,562) (43,562)Purchase of 1,354,000 shares for treasury (24,149) (24,149)
Issuance of 123,068 shares from treasury(1) 1,303 (1,414) 2,717
Balance at December 31, 2000 $1,004,682 $ 53,064 $ 256,873 $ 839,242 $ (84,913) $ (59,584)
Year Ended December 31, 2001Net loss (41,666) (41,666)Foreign currency translation adjustments
(net of income tax of $963) (15,914) (15,914)Minimum pension liability adjustment
(net of income tax of $61,892) (122,520) (122,520)Cumulative effect of change in
method of accounting (34) (34)Change in fair value of derivative
financial instruments (1,560) (1,560)Reclassification adjustments –
contract settlements 403 403Total comprehensive loss (181,291)Dividends–$0.67 per share (40,166) (40,166)Purchase of 206,300 shares for treasury (2,931) (2,931)
Issuance of 97,225 shares from treasury(1) 1,441 (450) 1,891
Balance at December 31, 2001 $ 781,735 $ 53,064 $ 256,423 $ 757,410 $ (224,538) $ (60,624)
Year Ended December 31, 2002Net income 38,749 38,749Foreign currency translation adjustments
(net of income tax of $2,843) 14,050 14,050Minimum pension liability adjustment
(net of income tax of $147,303) (254,318) (254,318)Change in fair value of derivative
financial instruments (2,230) (2,230)Reclassification adjustments –
contract settlements 1,359 1,359Total comprehensive loss (202,390)Dividends – $0.52 per share (31,713) (31,713)
Issuance of 3,186,470 shares from treasury(1) 57,747 (2,138) 59,885
Issuance of 369,290 shares from authorized(1) 3,707 3,707
Balance at December 31, 2002 $ 609,086 $ 53,064 $ 257,992 $ 764,446 $ (465,677) $ (739)
(1) Share activity was in conjunction with employee benefit and stock option plans. See accompanying Notes to Consolidated Financial Statements on pages 33 through 46.
consolidated statement of shareholders’ equity
32
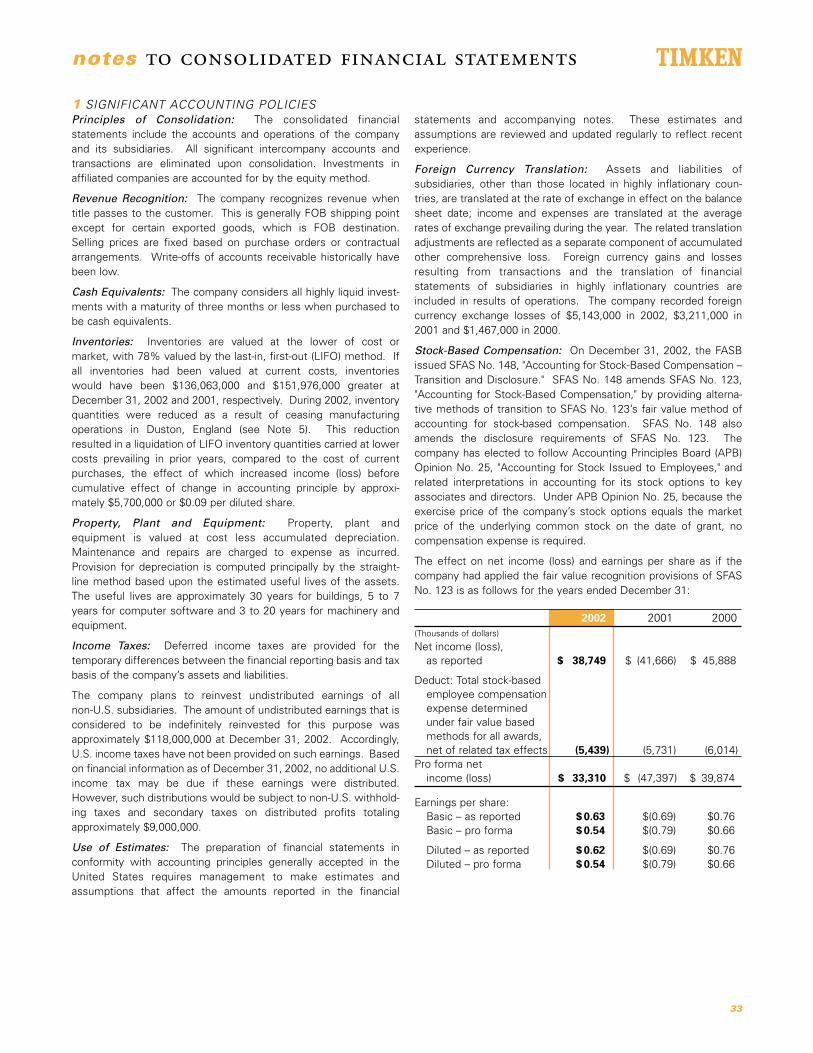
statements and accompanying notes. These estimates andassumptions are reviewed and updated regularly to reflect recentexperience.
Foreign Currency Translation: Assets and liabilities of subsidiaries, other than those located in highly inflationary coun-tries, are translated at the rate of exchange in effect on the balancesheet date; income and expenses are translated at the averagerates of exchange prevailing during the year. The related translationadjustments are reflected as a separate component of accumulatedother comprehensive loss. Foreign currency gains and lossesresulting from transactions and the translation of financial statements of subsidiaries in highly inflationary countries are included in results of operations. The company recorded foreigncurrency exchange losses of $5,143,000 in 2002, $3,211,000 in2001 and $1,467,000 in 2000.
Stock-Based Compensation: On December 31, 2002, the FASBissued SFAS No. 148, "Accounting for Stock-Based Compensation –Transition and Disclosure." SFAS No. 148 amends SFAS No. 123,"Accounting for Stock-Based Compensation," by providing alterna-tive methods of transition to SFAS No. 123’s fair value method ofaccounting for stock-based compensation. SFAS No. 148 alsoamends the disclosure requirements of SFAS No. 123. The company has elected to follow Accounting Principles Board (APB)Opinion No. 25, "Accounting for Stock Issued to Employees," andrelated interpretations in accounting for its stock options to keyassociates and directors. Under APB Opinion No. 25, because theexercise price of the company’s stock options equals the marketprice of the underlying common stock on the date of grant, no compensation expense is required.
The effect on net income (loss) and earnings per share as if thecompany had applied the fair value recognition provisions of SFASNo. 123 is as follows for the years ended December 31:
200 2002 2001 2000(Thousands of dollars)
Net income (loss), as reported $ 38,749 $ (41,666) $ 45,888
Deduct: Total stock-based employee compensation expense determined under fair value based methods for all awards, net of related tax effects (5,439) (5,731) (6,014)
Pro forma net income (loss) $ 33,310 $ (47,397) $ 39,874
Earnings per share:Basic – as reported $ 0.63 $(0.69) $0.76Basic – pro forma $ 0.54 $(0.79) $0.66
Diluted – as reported $ 0.62 $(0.69) $0.76Diluted – pro forma $ 0.54 $(0.79) $0.66
1 SIGNIFICANT ACCOUNTING POLICIES Principles of Consolidation: The consolidated financial statements include the accounts and operations of the companyand its subsidiaries. All significant intercompany accounts andtransactions are eliminated upon consolidation. Investments in affiliated companies are accounted for by the equity method.
Revenue Recognition: The company recognizes revenue whentitle passes to the customer. This is generally FOB shipping pointexcept for certain exported goods, which is FOB destination.Selling prices are fixed based on purchase orders or contractualarrangements. Write-offs of accounts receivable historically havebeen low.
Cash Equivalents: The company considers all highly liquid invest-ments with a maturity of three months or less when purchased tobe cash equivalents.
Inventories: Inventories are valued at the lower of cost or market, with 78% valued by the last-in, first-out (LIFO) method. Ifall inventories had been valued at current costs, inventories would have been $136,063,000 and $151,976,000 greater atDecember 31, 2002 and 2001, respectively. During 2002, inventoryquantities were reduced as a result of ceasing manufacturing operations in Duston, England (see Note 5). This reduction resulted in a liquidation of LIFO inventory quantities carried at lowercosts prevailing in prior years, compared to the cost of current purchases, the effect of which increased income (loss) beforecumulative effect of change in accounting principle by approxi-mately $5,700,000 or $0.09 per diluted share.
Property, Plant and Equipment: Property, plant and equipment is valued at cost less accumulated depreciation.Maintenance and repairs are charged to expense as incurred.Provision for depreciation is computed principally by the straight-line method based upon the estimated useful lives of the assets.The useful lives are approximately 30 years for buildings, 5 to 7years for computer software and 3 to 20 years for machinery andequipment.
Income Taxes: Deferred income taxes are provided for the temporary differences between the financial reporting basis and taxbasis of the company’s assets and liabilities.
The company plans to reinvest undistributed earnings of all non-U.S. subsidiaries. The amount of undistributed earnings that isconsidered to be indefinitely reinvested for this purpose wasapproximately $118,000,000 at December 31, 2002. Accordingly,U.S. income taxes have not been provided on such earnings. Basedon financial information as of December 31, 2002, no additional U.S.income tax may be due if these earnings were distributed.However, such distributions would be subject to non-U.S. withhold-ing taxes and secondary taxes on distributed profits totaling approximately $9,000,000.
Use of Estimates: The preparation of financial statements in conformity with accounting principles generally accepted in theUnited States requires management to make estimates and assumptions that affect the amounts reported in the financial
notes to consolidated financial statements
33
34
that a liability for a cost associated with an exit or disposal activitybe recognized and measured initially at fair value only when the liability is incurred. Under EITF Issue No. 94-3, a liability for an exitcost was recognized at the date of an entity’s commitment to anexit plan. SFAS No. 146 is effective for exit and disposal activitiesthat are initiated after December 31, 2002. SFAS No. 146 has noeffect on charges recorded for exit activities begun prior to thisdate. As such, the company continued to recognize restructuringcosts in connection with the manufacturing strategy initiative (MSI)in accordance with EITF Issue No. 94-3. The company does notexpect the adoption of this statement to have a material effect onour financial position or results of operations.
In November 2002, the FASB issued Interpretation No. 45,"Guarantor’s Accounting and Disclosure Requirements forGuarantees, Including Indirect Guarantees of Indebtedness ofOthers" (the Interpretation). The Interpretation’s disclosure require-ments are effective for financial statements of interim or annualperiods ending after December 15, 2002. The initial recognitionand initial measurement provisions are applicable on a prospectivebasis to guarantees issued or modified after December 31, 2002.The Interpretation requires certain guarantees to be recorded at fair value. The guarantor’s previous accounting for guaranteesissued prior to the date of initial application should not be revisedor restated.
In January 2003, the FASB issued Interpretation No. 46,"Consolidation of Variable Interest Entities." In general, a variableinterest entity is a corporation, partnership, trust or any other legalstructure used for business purposes that either (a) does not haveequity investors with voting rights or (b) has equity investors who do not provide sufficient financial resources for the entity tosupport its activities. Interpretation 46 requires a variable interestentity to be consolidated by a company if that company is subjectto a majority of the risk of loss from the variable interest entity’s activities or entitled to receive a majority of the entity’sresidual returns or both. The consolidation requirements ofInterpretation 46 apply immediately to variable interest entities created after January 31, 2003. The consolidation requirementsapply to pre-existing entities in the first fiscal year or interim period beginning after June 15, 2003. Certain of the disclosure requirements apply in all financial statements issued after January 31, 2003, regardless of when the variable interest entitywas established. The company is currently evaluating the impactof Interpretation 46 on the financial statements of the company.
Reclassifications: The CDSOA payments and certain minoramounts reported in the 2001 financial statements have beenreclassified to conform to the 2002 presentation.
1 SIGNIFICANT ACCOUNTING POLICIES (CONTINUED)
Earnings Per Share: Earnings per share are computed by dividingnet income (loss) by the weighted-average number of commonshares outstanding during the year. Earnings per share - assumingdilution are computed by dividing net income (loss) by the weighted-average number of common shares outstanding adjustedfor the dilutive impact of potential common shares for options.
Derivative Instruments: In 2001, the company adopted SFAS No. 133, "Accounting for Derivative Instruments and HedgingActivities," as amended. The statement required the company torecognize all derivatives on the balance sheet at fair value.Derivatives that are not designated as hedges must be adjusted to fair value through earnings. If the derivative is designated andqualifies as a hedge, depending on the nature of the hedge,changes in the fair value of the derivatives are either offset againstthe change in fair value of the hedged assets, liabilities, or firm commitments through earnings or recognized in other comprehen-sive income (loss) until the hedged item is recognized in earnings.Certain of the company’s holdings of forward foreign exchange contracts have been deemed derivatives pursuant to the criteriaestablished in SFAS No. 133, of which the company has designat-ed certain of those derivatives as hedges. The critical terms, suchas the notional amount and timing of the forward contract and forecasted transaction, coincide resulting in no hedge ineffective-ness. The adoption of SFAS No. 133 did not have a significanteffect on the company’s financial position or results of operations.
Recent Accounting Pronouncements In October 2001, theFinancial Accounting Standards Board (FASB) issued Statement ofFinancial Accounting Standards (SFAS) No. 144, "Accounting forImpairment or Disposal of Long-Lived Assets." SFAS No. 144supersedes SFAS No. 121, "Accounting for the Impairment of Long-Lived Assets and for Long-Lived Assets to Be Disposed Of."SFAS No. 144 retains the existing requirements for long-livedassets to be held and used, but it establishes one accounting modelfor long-lived assets to be disposed of by sale and revises guidancefor assets to be disposed of other than by sale. Adoption of SFASNo. 144 did not have an effect on the company’s financial positionor results of operations.
In June 2002, the FASB issued SFAS No. 146, "Accounting for Costs Associated with Exit or Disposal Activities," which addressesfinancial accounting and reporting for costs associated with exit ordisposal activities and nullifies Emerging Issues Task Force (EITF)Issue No. 94-3, "Liability Recognition for Certain EmployeeTermination Benefits and Other Costs to Exit an Activity (includingCertain Costs Incurred in a Restructuring)." SFAS No. 146 requires
notes to consolidated financial statements
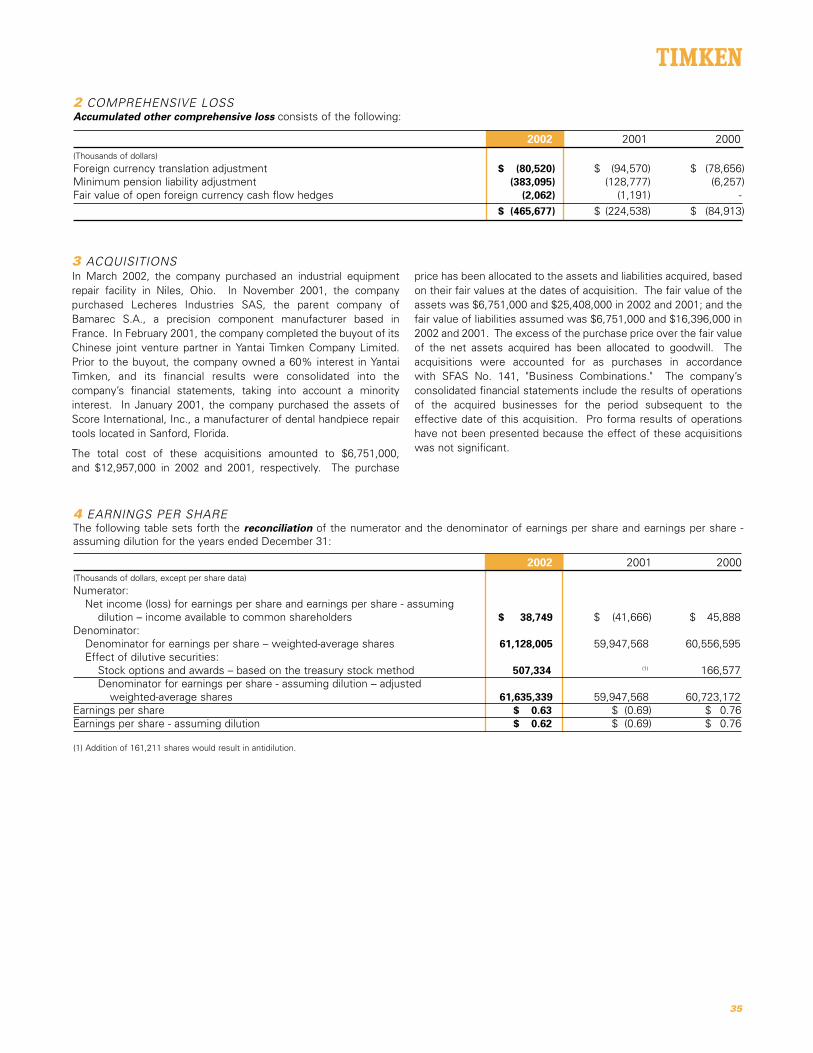
35
4 EARNINGS PER SHAREThe following table sets forth the reconciliation of the numerator and the denominator of earnings per share and earnings per share -assuming dilution for the years ended December 31:
2002 2001 2000(Thousands of dollars, except per share data)
Numerator:Net income (loss) for earnings per share and earnings per share - assuming
dilution – income available to common shareholders $ 38,749 $ (41,666) $ 45,888Denominator:
Denominator for earnings per share – weighted-average shares 61,128,005 59,947,568 60,556,595Effect of dilutive securities:
Stock options and awards – based on the treasury stock method 507,334 (1) 166,577Denominator for earnings per share - assuming dilution – adjusted
weighted-average shares 61,635,339 59,947,568 60,723,172Earnings per share $ 0.63 $ (0.69) $ 0.76Earnings per share - assuming dilution $ 0.62 $ (0.69) $ 0.76
(1) Addition of 161,211 shares would result in antidilution.
price has been allocated to the assets and liabilities acquired, basedon their fair values at the dates of acquisition. The fair value of theassets was $6,751,000 and $25,408,000 in 2002 and 2001; and thefair value of liabilities assumed was $6,751,000 and $16,396,000 in2002 and 2001. The excess of the purchase price over the fair valueof the net assets acquired has been allocated to goodwill. Theacquisitions were accounted for as purchases in accordance with SFAS No. 141, "Business Combinations." The company’s consolidated financial statements include the results of operationsof the acquired businesses for the period subsequent to the effective date of this acquisition. Pro forma results of operationshave not been presented because the effect of these acquisitionswas not significant.
3 ACQUISITIONSIn March 2002, the company purchased an industrial equipmentrepair facility in Niles, Ohio. In November 2001, the company purchased Lecheres Industries SAS, the parent company ofBamarec S.A., a precision component manufacturer based inFrance. In February 2001, the company completed the buyout of itsChinese joint venture partner in Yantai Timken Company Limited.Prior to the buyout, the company owned a 60% interest in Yantai Timken, and its financial results were consolidated into the company’s financial statements, taking into account a minority interest. In January 2001, the company purchased the assets ofScore International, Inc., a manufacturer of dental handpiece repairtools located in Sanford, Florida.
The total cost of these acquisitions amounted to $6,751,000, and $12,957,000 in 2002 and 2001, respectively. The purchase
2 COMPREHENSIVE LOSSAccumulated other comprehensive loss consists of the following:
2002 2001 2000(Thousands of dollars)
Foreign currency translation adjustment $ (80,520) $ (94,570) $ (78,656)Minimum pension liability adjustment (383,095) (128,777) (6,257)Fair value of open foreign currency cash flow hedges (2,062) (1,191) -
$ (465,677) $ (224,538) $ (84,913)
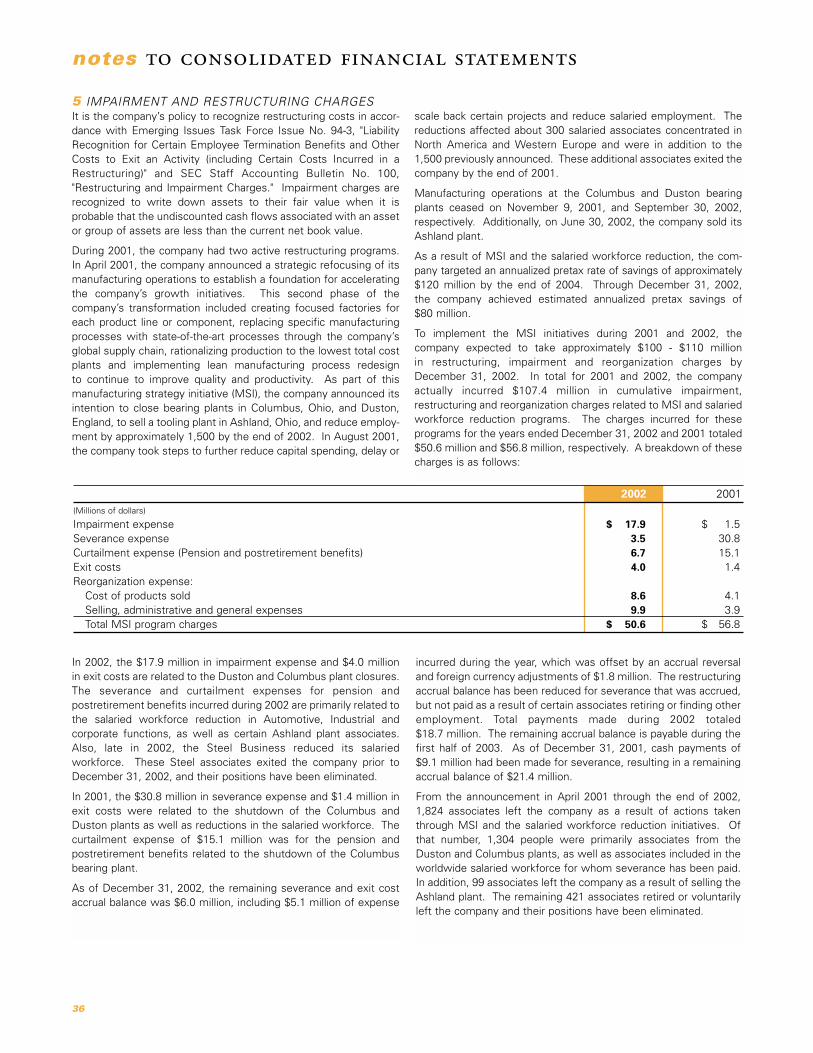
2002 20022001(Millions of dollars)
Impairment expense $ 17.9 $ 1.5Severance expense 3.5 30.8Curtailment expense (Pension and postretirement benefits) 6.7 15.1Exit costs 4.0 1.4Reorganization expense:
Cost of products sold 8.6 4.1Selling, administrative and general expenses 9.9 3.9Total MSI program charges $ 50.6 $ 56.8
36
notes to consolidated financial statements
In 2002, the $17.9 million in impairment expense and $4.0 million in exit costs are related to the Duston and Columbus plant closures.The severance and curtailment expenses for pension and postretirement benefits incurred during 2002 are primarily related tothe salaried workforce reduction in Automotive, Industrial and corporate functions, as well as certain Ashland plant associates.Also, late in 2002, the Steel Business reduced its salaried workforce. These Steel associates exited the company prior toDecember 31, 2002, and their positions have been eliminated.
In 2001, the $30.8 million in severance expense and $1.4 million inexit costs were related to the shutdown of the Columbus andDuston plants as well as reductions in the salaried workforce. Thecurtailment expense of $15.1 million was for the pension andpostretirement benefits related to the shutdown of the Columbusbearing plant.
As of December 31, 2002, the remaining severance and exit costaccrual balance was $6.0 million, including $5.1 million of expense
incurred during the year, which was offset by an accrual reversaland foreign currency adjustments of $1.8 million. The restructuringaccrual balance has been reduced for severance that was accrued,but not paid as a result of certain associates retiring or finding otheremployment. Total payments made during 2002 totaled $18.7 million. The remaining accrual balance is payable during thefirst half of 2003. As of December 31, 2001, cash payments of $9.1 million had been made for severance, resulting in a remainingaccrual balance of $21.4 million.
From the announcement in April 2001 through the end of 2002,1,824 associates left the company as a result of actions takenthrough MSI and the salaried workforce reduction initiatives. Ofthat number, 1,304 people were primarily associates from theDuston and Columbus plants, as well as associates included in theworldwide salaried workforce for whom severance has been paid.In addition, 99 associates left the company as a result of selling theAshland plant. The remaining 421 associates retired or voluntarilyleft the company and their positions have been eliminated.
5 IMPAIRMENT AND RESTRUCTURING CHARGESIt is the company’s policy to recognize restructuring costs in accor-dance with Emerging Issues Task Force Issue No. 94-3, "LiabilityRecognition for Certain Employee Termination Benefits and OtherCosts to Exit an Activity (including Certain Costs Incurred in aRestructuring)" and SEC Staff Accounting Bulletin No. 100,"Restructuring and Impairment Charges." Impairment charges arerecognized to write down assets to their fair value when it is probable that the undiscounted cash flows associated with an assetor group of assets are less than the current net book value.
During 2001, the company had two active restructuring programs.In April 2001, the company announced a strategic refocusing of itsmanufacturing operations to establish a foundation for acceleratingthe company’s growth initiatives. This second phase of the company’s transformation included creating focused factories foreach product line or component, replacing specific manufacturingprocesses with state-of-the-art processes through the company’sglobal supply chain, rationalizing production to the lowest total costplants and implementing lean manufacturing process redesign to continue to improve quality and productivity. As part of this manufacturing strategy initiative (MSI), the company announced itsintention to close bearing plants in Columbus, Ohio, and Duston,England, to sell a tooling plant in Ashland, Ohio, and reduce employ-ment by approximately 1,500 by the end of 2002. In August 2001,the company took steps to further reduce capital spending, delay or
scale back certain projects and reduce salaried employment. Thereductions affected about 300 salaried associates concentrated inNorth America and Western Europe and were in addition to the1,500 previously announced. These additional associates exited thecompany by the end of 2001.
Manufacturing operations at the Columbus and Duston bearingplants ceased on November 9, 2001, and September 30, 2002,respectively. Additionally, on June 30, 2002, the company sold itsAshland plant.
As a result of MSI and the salaried workforce reduction, the com-pany targeted an annualized pretax rate of savings of approximately$120 million by the end of 2004. Through December 31, 2002, the company achieved estimated annualized pretax savings of $80 million.
To implement the MSI initiatives during 2001 and 2002, the company expected to take approximately $100 - $110 million in restructuring, impairment and reorganization charges byDecember 31, 2002. In total for 2001 and 2002, the company actually incurred $107.4 million in cumulative impairment, restructuring and reorganization charges related to MSI and salariedworkforce reduction programs. The charges incurred for these programs for the years ended December 31, 2002 and 2001 totaled$50.6 million and $56.8 million, respectively. A breakdown of thesecharges is as follows:
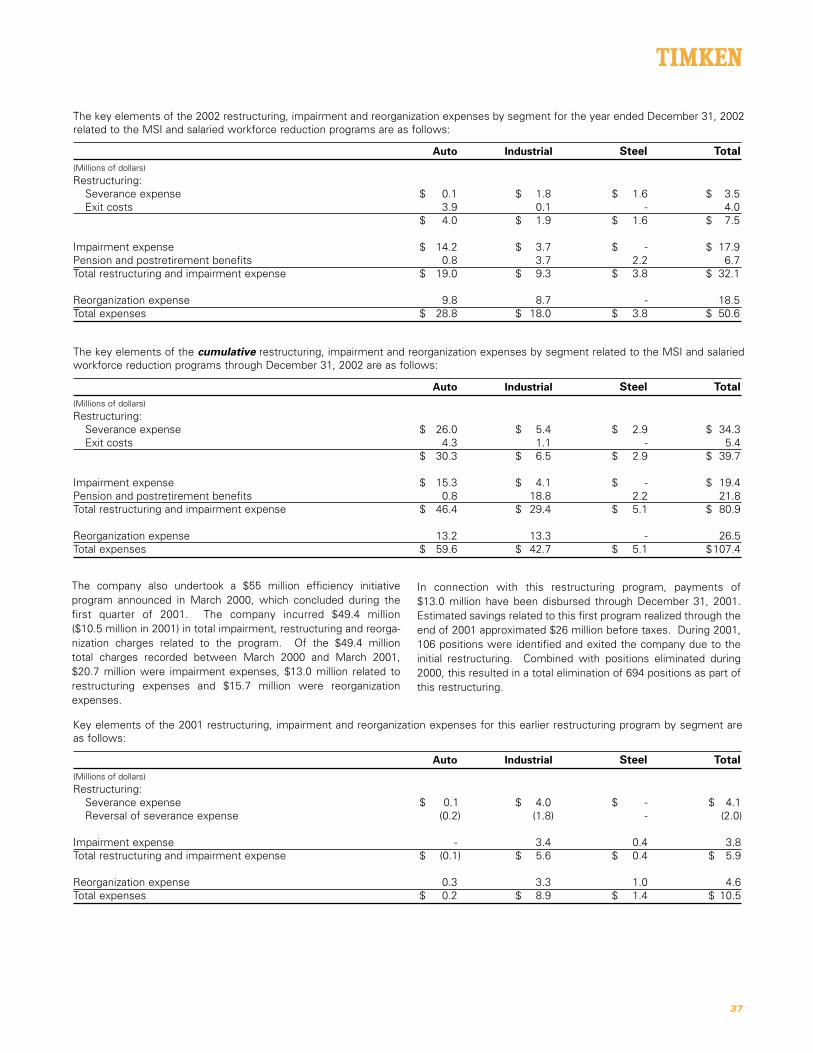
37
The key elements of the 2002 restructuring, impairment and reorganization expenses by segment for the year ended December 31, 2002related to the MSI and salaried workforce reduction programs are as follows:
Auto Industrial Steel Total(Millions of dollars)
Restructuring:Severance expense $ 0.1 $ 1.8 $ 1.6 $ 3.5Exit costs 3.9 0.1 - 4.0
$ 4.0 $ 1.9 $ 1.6 $ 7.5
Impairment expense $ 14.2 $ 3.7 $ - $ 17.9Pension and postretirement benefits 0.8 3.7 2.2 6.7Total restructuring and impairment expense $ 19.0 $ 9.3 $ 3.8 $ 32.1
Reorganization expense 9.8 8.7 - 18.5Total expenses $ 28.8 $ 18.0 $ 3.8 $ 50.6
The key elements of the cumulative restructuring, impairment and reorganization expenses by segment related to the MSI and salariedworkforce reduction programs through December 31, 2002 are as follows:
Auto Industrial Steel Total(Millions of dollars)
Restructuring:Severance expense $ 26.0 $ 5.4 $ 2.9 $ 34.3Exit costs 4.3 1.1 - 5.4
$ 30.3 $ 6.5 $ 2.9 $ 39.7
Impairment expense $ 15.3 $ 4.1 $ - $ 19.4Pension and postretirement benefits 0.8 18.8 2.2 21.8Total restructuring and impairment expense $ 46.4 $ 29.4 $ 5.1 $ 80.9
Reorganization expense 13.2 13.3 - 26.5Total expenses $ 59.6 $ 42.7 $ 5.1 $107.4
Key elements of the 2001 restructuring, impairment and reorganization expenses for this earlier restructuring program by segment are as follows:
Auto Industrial Steel Total(Millions of dollars)
Restructuring:Severance expense $ 0.1 $ 4.0 $ - $ 4.1Reversal of severance expense (0.2) (1.8) - (2.0)
Impairment expense - 3.4 0.4 3.8Total restructuring and impairment expense $ (0.1) $ 5.6 $ 0.4 $ 5.9
Reorganization expense 0.3 3.3 1.0 4.6Total expenses $ 0.2 $ 8.9 $ 1.4 $ 10.5
The company also undertook a $55 million efficiency initiative program announced in March 2000, which concluded during thefirst quarter of 2001. The company incurred $49.4 million ($10.5 million in 2001) in total impairment, restructuring and reorga-nization charges related to the program. Of the $49.4 million total charges recorded between March 2000 and March 2001,$20.7 million were impairment expenses, $13.0 million related torestructuring expenses and $15.7 million were reorganizationexpenses.
In connection with this restructuring program, payments of $13.0 million have been disbursed through December 31, 2001.Estimated savings related to this first program realized through theend of 2001 approximated $26 million before taxes. During 2001,106 positions were identified and exited the company due to theinitial restructuring. Combined with positions eliminated during2000, this resulted in a total elimination of 694 positions as part ofthis restructuring.

2001 2000(Thousands of dollars, except per share data)
Reported net (loss) income $(41,666) $ 45,888 Add back: goodwill amortization, net of income taxes
of 2001-$1,278; 2000-$1,339 4,782 5,010Add back: amortization of indefinite lived intangible assets,
net of income taxes of 2001-$28; 2000-$11 45 18
Adjusted net (loss) income $ (36,839) $ 50,916
Reported earnings per share – basic and diluted $ (0.69) $ 0.76Add back: goodwill amortization, net of income taxes 0.08 0.08Add back: amortization of indefinite lived intangible assets, net of income taxes - -
Adjusted earnings per share – basic and diluted $ (0.61) $ 0.84
38
notes to consolidated financial statements
of each of its five reporting units using discounted cash flows and validation with various market-comparable approaches. Thecompany completed the required transitional goodwill impairmentanalysis for SFAS No. 142 adoption purposes in the third quarter of2002 and recorded a $12.7 million impairment loss, net of tax benefits of $7.8 million, relating to its Specialty Steel business,which was treated as a cumulative effect of a change in account-ing principle.
SFAS No. 142 does not permit restatement of previously issuedfinancial statements. The following table sets forth reported operating results for the company for the preceding two years, andwhat net income and earnings per share would have been hadSFAS No. 142 been applied in all years ended as of December 31(with goodwill amortization ceasing on January 1, 2000):
6 CHANGE IN METHOD OF ACCOUNTINGEffective January 2002, the company adopted SFAS No. 142,"Goodwill and Other Intangible Assets." In accordance with SFASNo. 142, goodwill and indefinite lived intangible assets are nolonger amortized but are reviewed at least annually for impairment.The application of the nonamortization provisions resulted in anincrease in annual pretax income of $6.1 million. Intangible assetsthat are separable and have a definite life continue to be amortizedover the estimated useful lives. Changes in the estimated usefullives of identifiable intangible assets did not result in a materialchange to net income.
As part of the adoption, the company evaluated the impairment ofindefinite lived intangible assets and determined that none wereimpaired based on estimations in market value. Prior to testinggoodwill for impairment, the company determined the fair value
Changes in the carrying amount of goodwill for the year ended December 31, 2002 are as follows:
Beginning EndingBalance Impairment Other Balance
(Thousands of dollars)
Goodwill:Automotive $ 1,577 $ - $ 56 $ 1,633Industrial 120,426 - (986) 119,440Steel 28,038 (20,488) 1,320 8,870
$ 150,041 $ (20,488) $ 390 $129,943
Indefinite lived intangible assets are immaterial.

The following table displays intangible assets as of December 31:
2002 2001
Gross Net Gross Net Carrying Accumulated Carrying Carrying Accumulated CarryingAmount Amortization Amount Amount Amortization Amount
Intangible assets subject to amortization:Industrial trademarks $ 712 $ 213 $ 499 $ 532 $ 289 $ 243Industrial land use rights 4,484 905 3,579 4,484 798 3,686Industrial know-how transfer 417 341 76 417 341 76
$ 5,613 $ 1,459 $ 4,154 $ 5,433 $ 1,428 $ 4,005
Intangible assets not subject to amortization:Goodwill $ 129,943 $ - $ 129,943 $197,329 $ 47,288 $150,041Automotive land use rights 112 - 112 108 - 108Industrial license agreements 951 - 951 1,042 97 945
$ 131,006 - $ 131,006 $198,479 $ 47,385 $151,094Total intangible assets $ 136,619 $ 1,459 $ 135,160 $203,912 $ 48,813 $155,099
Amortization expense for intangible assets was approximately $288,000 and $273,000 for the years ended December 31, 2002 and 2001,and is estimated to be approximately $342,000 annually for the next five years.
39
$23,500,000 letter of credit was guaranteed by the company tosecure payment on Ohio Water Development Authority revenuebonds held by Pel, as well as a guarantee for a $4,000,000 bankloan. In case of default by Pel on either obligation, the companyagrees to pay existing balances due as of the date of default. Theletter of credit expires on July 22, 2006. The bank loan obligationexpires on the earlier of March 27, 2012 or on the date that Pelmaintains a certain debt coverage ratio for a specified period.
The company is a guarantor of an operating lease for a subsidiarylocated in Vienna, Ohio. In case of a default, the company isobligated to pay the remaining balance due. This guarantee expireson June 1, 2016. The total future lease payments related to thislease are $16,800,000 as of December 31, 2002. This amount hasbeen included in the company’s future minimum lease paymentdisclosure in Note 8 Financing Arrangements.
In connection with the Ashland plant sale, the company enteredinto a four-year supply agreement with the buyer. The companyagrees to purchase a fixed amount each year ranging from$8,500,000 in the first year to $4,650,000 in year four or an aggre-gate total of $25,900,000. The agreement also details the paymentterms and penalties assessed if the buyer does not meet the company’s performance standards as outlined. This agreementexpires on June 30, 2006.
7 CONTINGENCIESThe company and certain of its U.S. subsidiaries have been designated as potentially responsible parties (PRPs) by the UnitedStates Environmental Protection Agency for site investigation andremediation under the Comprehensive Environmental Response,Compensation and Liability Act (Superfund) with respect to certainsites. The claims for remediation have been asserted againstnumerous other entities which are believed to be financially solvent and are expected to fulfill their proportionate share of theobligation. In addition, the company is subject to various lawsuits,claims and proceedings which arise in the ordinary course of its business. The company accrues costs associated with environ-mental and legal matters when they become probable and reasonably estimable. Environmental costs include compensationand related benefit costs associated with associates expected todevote significant amounts of time to the remediation effort andpost-monitoring costs. Accruals are established based on the estimated undiscounted cash flows to settle the obligations andare not reduced by any potential recoveries from insurance or otherindemnification claims. Management believes that any ultimate liability with respect to these actions, in excess of amounts provided, will not materially affect the company’s consolidatedoperations, cash flows or financial position.
The company is the guarantor of $27,500,000 in debt for PelTechnologies, LLC, (Pel) an equity investment of the company. A
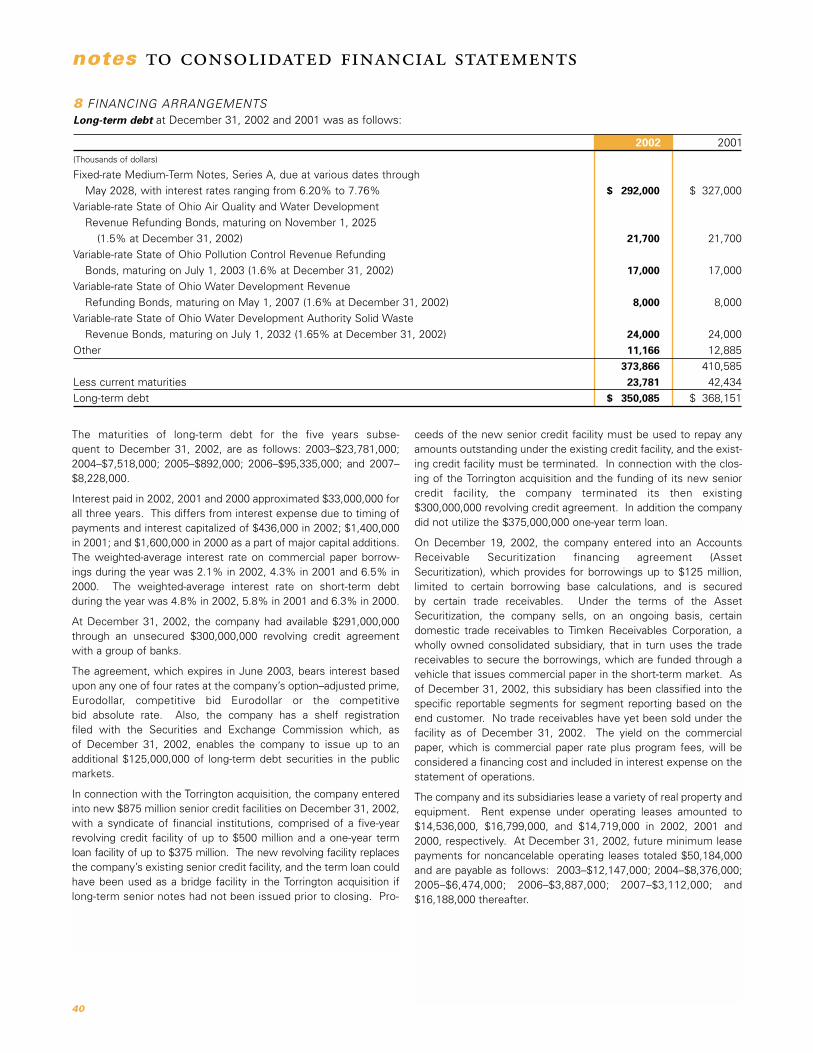
8 FINANCING ARRANGEMENTSLong-term debt at December 31, 2002 and 2001 was as follows:
2002 2001(Thousands of dollars)
Fixed-rate Medium-Term Notes, Series A, due at various dates through
May 2028, with interest rates ranging from 6.20% to 7.76% $ 292,000 $ 327,000
Variable-rate State of Ohio Air Quality and Water Development
Revenue Refunding Bonds, maturing on November 1, 2025
(1.5% at December 31, 2002) 21,700 21,700
Variable-rate State of Ohio Pollution Control Revenue Refunding
Bonds, maturing on July 1, 2003 (1.6% at December 31, 2002) 17,000 17,000
Variable-rate State of Ohio Water Development Revenue
Refunding Bonds, maturing on May 1, 2007 (1.6% at December 31, 2002) 8,000 8,000
Variable-rate State of Ohio Water Development Authority Solid Waste
Revenue Bonds, maturing on July 1, 2032 (1.65% at December 31, 2002) 24,000 24,000
Other 11,166 12,885
373,866 410,585
Less current maturities 23,781 42,434
Long-term debt $ 350,085 $ 368,151
40
The maturities of long-term debt for the five years subse-quent to December 31, 2002, are as follows: 2003–$23,781,000;2004–$7,518,000; 2005–$892,000; 2006–$95,335,000; and 2007–$8,228,000.
Interest paid in 2002, 2001 and 2000 approximated $33,000,000 forall three years. This differs from interest expense due to timing ofpayments and interest capitalized of $436,000 in 2002; $1,400,000in 2001; and $1,600,000 in 2000 as a part of major capital additions.The weighted-average interest rate on commercial paper borrow-ings during the year was 2.1% in 2002, 4.3% in 2001 and 6.5% in2000. The weighted-average interest rate on short-term debt during the year was 4.8% in 2002, 5.8% in 2001 and 6.3% in 2000.
At December 31, 2002, the company had available $291,000,000through an unsecured $300,000,000 revolving credit agreementwith a group of banks.
The agreement, which expires in June 2003, bears interest basedupon any one of four rates at the company’s option–adjusted prime,Eurodollar, competitive bid Eurodollar or the competitive bid absolute rate. Also, the company has a shelf registration filed with the Securities and Exchange Commission which, as of December 31, 2002, enables the company to issue up to an additional $125,000,000 of long-term debt securities in the publicmarkets.
In connection with the Torrington acquisition, the company enteredinto new $875 million senior credit facilities on December 31, 2002,with a syndicate of financial institutions, comprised of a five-yearrevolving credit facility of up to $500 million and a one-year termloan facility of up to $375 million. The new revolving facility replacesthe company’s existing senior credit facility, and the term loan couldhave been used as a bridge facility in the Torrington acquisition iflong-term senior notes had not been issued prior to closing. Pro-
notes to consolidated financial statements
ceeds of the new senior credit facility must be used to repay anyamounts outstanding under the existing credit facility, and the exist-ing credit facility must be terminated. In connection with the clos-ing of the Torrington acquisition and the funding of its new seniorcredit facility, the company terminated its then existing$300,000,000 revolving credit agreement. In addition the companydid not utilize the $375,000,000 one-year term loan.
On December 19, 2002, the company entered into an AccountsReceivable Securitization financing agreement (AssetSecuritization), which provides for borrowings up to $125 million,limited to certain borrowing base calculations, and is secured by certain trade receivables. Under the terms of the AssetSecuritization, the company sells, on an ongoing basis, certaindomestic trade receivables to Timken Receivables Corporation, awholly owned consolidated subsidiary, that in turn uses the tradereceivables to secure the borrowings, which are funded through avehicle that issues commercial paper in the short-term market. Asof December 31, 2002, this subsidiary has been classified into thespecific reportable segments for segment reporting based on theend customer. No trade receivables have yet been sold under thefacility as of December 31, 2002. The yield on the commercialpaper, which is commercial paper rate plus program fees, will beconsidered a financing cost and included in interest expense on thestatement of operations.
The company and its subsidiaries lease a variety of real property andequipment. Rent expense under operating leases amounted to$14,536,000, $16,799,000, and $14,719,000 in 2002, 2001 and2000, respectively. At December 31, 2002, future minimum leasepayments for noncancelable operating leases totaled $50,184,000and are payable as follows: 2003–$12,147,000; 2004–$8,376,000;2005–$6,474,000; 2006–$3,887,000; 2007–$3,112,000; and$16,188,000 thereafter.

Following is the related assumptions under the Black-Scholes method:
2002 2001 2000Assumptions:
Risk-free interest rate 5.29% 6.32% 6.31%
Dividend yield 3.57% 3.36% 3.01%
Expected stock volatility 0.506 0.480 0.481
Expected life - years 8 8 8
A summary of activity related to stock options for the above plans is as follows for the years ended December 31:
2002 2001 2000Weighted- Weighted- Weighted-
Average Average AverageOptions Exercise Price Options Exercise Price Options Exercise Price
Outstanding - beginning of year 6,825,412 $20.22 5,720,990 $21.41 4,515,676 $22.90
Granted 1,118,175 25.01 1,367,400 15.05 1,356,400 15.88
Exercised (499,372) 16.30 (54,528) 14.67 (88,761) 12.96
Canceled or expired (134,189) 20.61 (208,450) 20.35 (62,325) 21.28
Outstanding - end of year 7,310,026 $21.21 6,825,412 $20.22 5,720,990 $21.41
Options exercisable 4,397,590 3,745,131 2,910,271
depending on the transaction. These deferred gains and losses are reclassified from accumulated other comprehensive loss andrecognized in earnings when the future transactions occur, orthrough depreciation expense.
The carrying value of cash and cash equivalents, accounts receivable, commercial paper, short-term borrowings and accountspayable are a reasonable estimate of their fair value due to the short-term nature of these instruments. The fair value of thecompany's fixed-rate debt, based on quoted market prices, was$325,000,000 and $334,000,000 at December 31, 2002 and 2001,respectively. The carrying value of this debt was $308,000,000 and$346,000,000.
9 FINANCIAL INSTRUMENTSAs a result of the company’s worldwide operating activities, it is exposed to changes in foreign currency exchange rates, which affect its results of operations and financial condition. The company and certain subsidiaries enter into forward exchange contracts to manage exposure to currency rate fluctuations, primarily related to anticipated purchases of inventory and equip-ment. At December 31, 2002 and 2001, the company had forwardforeign exchange contracts, all having maturities of less than oneyear, with notional amounts of $72,070,000 and $19,507,000,respectively. The forward foreign exchange contracts were primarily entered into by the company’s European subsidiaries tomanage Euro and U.S. dollar exposures. The realized and unrealized gains and losses on these contracts are deferred and included in inventory or property, plant and equipment,
The company sponsors a performance target option plan that iscontingent upon the company’s common shares reaching specifiedfair market values. Under the plan, no awards were issued nor wascompensation expense recognized during 2002, 2001 or 2000.
Exercise prices for options outstanding as of December 31, 2002,range from $13.50 to $33.75; the weighted-average remain-ing contractual life of these options is six years. The estimated weighted-average fair values of stock options granted during 2002, 2001 and 2000 were $10.36, $6.36 and $7.01, respectively.
At December 31, 2002, a total of 302,667 restricted stock rights,restricted shares or deferred shares have been awarded under theabove plans and are not vested. The company distributed 100,947,61,301 and 100,832 common shares in 2002, 2001 and 2000,respectively, as a result of awards of restricted stock rights, restricted shares and deferred shares.
The number of shares available for future grants for all plans atDecember 31, 2002, including stock options, is 2,679,841.
earnings per share is required by SFAS No. 123, and has beendetermined as if the company had accounted for its associate stock options under the fair value method of SFAS No. 123. Thefair value for these options was estimated at the date of grant using a Black-Scholes option pricing model. For purposes of pro forma disclosures, the estimated fair value of the options granted under the plan is amortized to expense over the options’vesting periods.
10 STOCK COMPENSATION PLANSUnder the company’s stock option plans, shares of common stockhave been made available to grant at the discretion of theCompensation Committee of the Board of Directors to officers andkey associates in the form of stock options, stock appreciationrights, restricted shares and deferred shares. In addition, shares can be awarded to directors not employed by the company. The options have a ten-year term and vest in 25% increments annually beginning twelve months after the dateof grant. Pro forma information regarding net income and
41

42
The following tables set forth the change in benefit obligation, change in plan assets, funded status and amounts recognized in the consolidated balance sheet of the defined benefit pension and postretirement benefits as of December 31, 2002 and 2001:
Defined BenefitPension Plans Postretirement Plans
2002 2001 2002 2001(Thousands of dollars)
Change in benefit obligationBenefit obligation at beginning of year $ 1,825,602 $1,641,959 $ 640,701 $ 588,824Service cost 36,115 35,313 4,357 4,047Interest cost 132,846 126,809 47,505 48,380Amendments 4,165 6,246 - (33,413)Actuarial losses 223,763 120,256 77,224 69,500Associate contributions 936 1,604 - -International plan exchange rate change 20,791 (5,416) 29 (126)Curtailment loss 6,706 16,522 980 9,109Benefits paid (133,780) (117,691) (50,121) (45,620)Benefit obligation at end of year $ 2,117,144 $1,825,602 $ 720,675 $ 640,701
Change in plan assets(1)
Fair value of plan assets at beginning of year $ 1,295,214 $1,383,683Actual return on plan assets (91,994) (51,608)Associate contributions 936 1,604Company contributions 112,297 84,882International plan exchange rate change 15,678 (5,656)Benefits paid (133,780) (117,691)Fair value of plan assets at end of year $ 1,198,351 $1,295,214
Funded statusProjected benefit obligation in excess of plan assets $ (918,793) $ (530,388) $ (720,675) $ (640,701)Unrecognized net actuarial loss 711,396 260,126 306,520 241,018Unrecognized net asset at transition dates, net of amortization (1,102) (2,246) - -Unrecognized prior service cost (benefit) 131,173 146,448 (45,335) (51,743)Accrued benefit cost $ (77,326) $ (126,060) $ (459,490) $ (451,426)
Amounts recognized in the consolidated balance sheetAccrued benefit liability $ (802,327) $ (456,517) $ (459,490) $ (451,426)Intangible asset 129,042 136,118 - -Minimum pension liability included in accumulated
other comprehensive income 595,959 194,339 - -Net amount recognized $ (77,326) $ (126,060) $ (459,490) $ (451,426)
(1) Plan assets are primarily invested in listed stocks and bonds and cash equivalents.
The company sponsors defined contribution retirement and savings plans covering substantially all associates in the UnitedStates and certain salaried associates at non-U.S. locations. Thecompany contributes Timken Company common stock to certainplans based on formulas established in the respective plan agreements. At December 31, 2002, the plans had 12,310,779shares of Timken Company common stock with a fair value of $235,136,000. Company contributions to the plans, including performance sharing, amounted to $14,603,000 in 2002;$13,289,000 in 2001; and $14,384,000 in 2000. The company paiddividends totaling $6,407,000 in 2002; $8,192,000 in 2001; and$7,958,000 in 2000, to plans holding common shares.
The company and its subsidiaries sponsor several unfunded postre-tirement plans that provide health care and life insurance benefitsfor eligible retirees and dependents. Depending on retirement dateand associate classification, certain health care plans contain contributions and cost-sharing features such as deductibles and coinsurance. The remaining health care and life insurance plans are noncontributory.
The company and its subsidiaries sponsor a number of definedbenefit pension plans, which cover many of their associates exceptthose at certain locations who are covered by government plans.
11 RETIREMENT AND POSTRETIREMENT BENEFIT PLANS
notes to consolidated financial statements

The following table summarizes the assumptions used by the consulting actuary and the related benefit cost information:
Pension Benefits Postretirement Benefits
2002 2001 2000 2002 2001 2000
AssumptionsDiscount rate 6.6% 7.5% 8.0% 6.6% 7.5% 8.0%
Future compensation assumption 3% to 4% 3% to 4% 3% to 4%
Expected long-term return on plan assets 9.5% 9.5% 9.5%
Components of net periodic benefit cost(Thousands of dollars)
Service cost $ 36,115 $ 35,313 $ 33,328 $ 4,357 $ 4,047 $ 4,309
Interest cost 132,846 126,809 119,943 47,505 48,380 40,043
Expected return on plan assets (135,179) (126,882) (116,302) - - -
Amortization of prior service cost 19,725 19,919 21,995 (6,408) (4,376) (3,730)
Recognized net actuarial (gain) loss 473 (292) (566) 11,827 9,646 3,670
Curtailment loss 6,706 6,333 - - 8,738 -
Amortization of transition asset (1,143) (982) (1,002) 871 - -
Net periodic benefit cost $ 59,543 $ 60,218 $ 57,396 $ 58,152 $ 66,435 $ 44,292
12 RESEARCH AND DEVELOPMENTExpenditures committed to research and development amountedto approximately $53,000,000 in 2002; $54,000,000 in 2001; and
$52,000,000 in 2000. Such expenditures may fluctuate from yearto year depending on special projects and needs.
On September 10, 2002, the company issued 3,000,000 shares ofits common stock to The Timken Company Collective InvestmentTrust for Retirement Trusts (Trust) as a contribution to three company-sponsored pension plans. The fair market value of the3,000,000 shares of common stock contributed to the Trust wasapproximately $54,500,000, which consisted of 2,766,955 sharesof the company’s treasury stock and 233,045 shares issued from authorized common stock. As of December 31, 2002, the company’s defined benefit pension plans held 2,700,000 commonshares with fair value of $51,570,000.
In 2002, lower investment performance, which reflected lowerstock market returns and lower interest rates, reduced the compa-ny’s pension fund asset values and increased the company’sdefined benefit pension liability. The lowering of the discount ratefrom 7.5% to 6.6% also contributed to the increased pension liability. The accumulated benefit obligations at December 31,
For measurement purposes, the company assumed a weighted-average annual rate of increase in the per capita cost (health carecost trend rate) for medical benefits of 9.0% for 2003; declininggradually to 6.0% in 2006 and thereafter for pre-age 65 benefits;6.0% for post-age 65 benefits for all years; and 15.0% for 2003,declining gradually to 6.0% in 2014 and thereafter for prescriptiondrug benefits.
The assumed health care cost trend rate has a significant effect onthe amounts reported. A one-percentage-point increase in theassumed health care cost trend rate would increase the 2002 totalservice and interest cost components by $2,107,000 and wouldincrease the postretirement benefit obligation by $31,969,000. Aone-percentage-point decrease would provide corresponding reductions of $1,878,000 and $28,567,000, respectively.
2002 exceeded the market value of plan assets for the majority of the company’s plans. For these plans, the projected benefit obligation was $2,097,000; the accumulated benefit obligation was$1,989,000; and the fair value of plan assets was $1,184,000 atDecember 31, 2002.
The intangible pension asset decreased by $7,100,000 fromDecember 31, 2001. In 2002, the company recorded additionalminimum pension liability of $394,700,000, which is included inaccrued pension cost. This increase in the pension liability generated a non-cash aftertax charge to accumulated other comprehensive loss of $254,300,000 in 2002.
For 2003 expense, the company changed the expected rate ofreturn on plan assets from 9.5% to 8.75%. This change, along withthe lower discount rate, will result in an increase in 2003 pretaxpension expense of approximately $25,000,000.
43
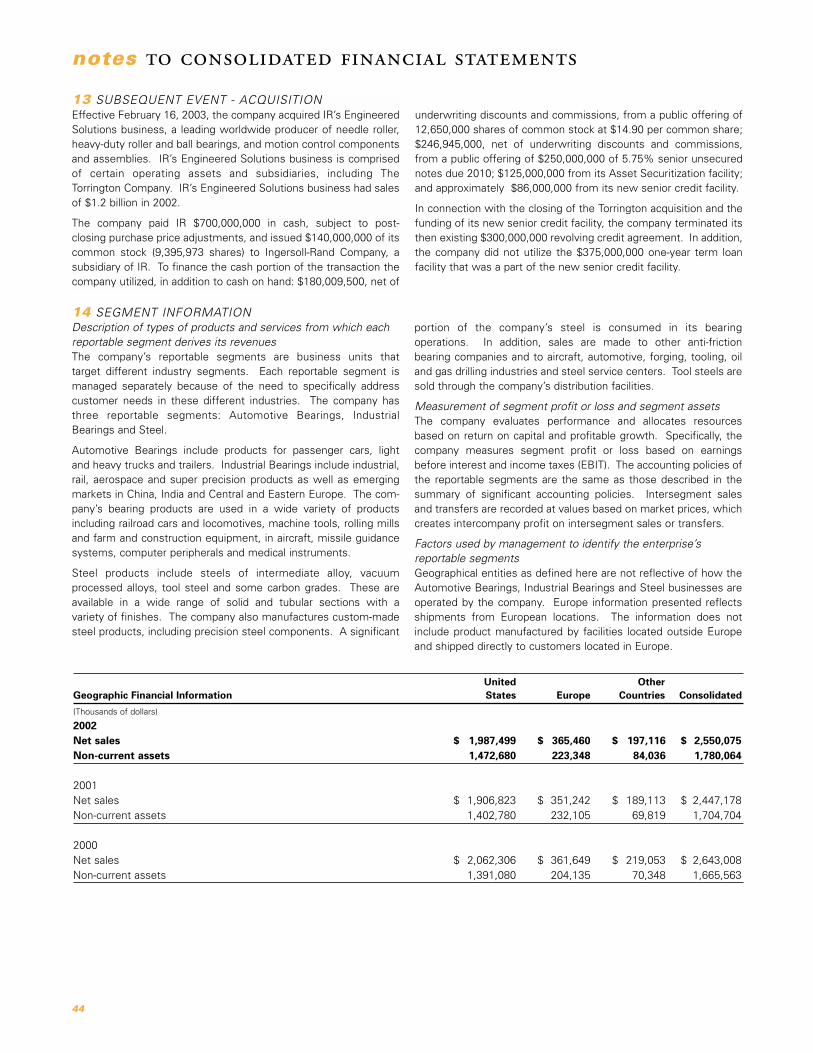
portion of the company’s steel is consumed in its bearing operations. In addition, sales are made to other anti-friction bearing companies and to aircraft, automotive, forging, tooling, oiland gas drilling industries and steel service centers. Tool steels aresold through the company’s distribution facilities.
Measurement of segment profit or loss and segment assetsThe company evaluates performance and allocates resources based on return on capital and profitable growth. Specifically, thecompany measures segment profit or loss based on earningsbefore interest and income taxes (EBIT). The accounting policies ofthe reportable segments are the same as those described in thesummary of significant accounting policies. Intersegment sales and transfers are recorded at values based on market prices, whichcreates intercompany profit on intersegment sales or transfers.
Factors used by management to identify the enterprise’sreportable segmentsGeographical entities as defined here are not reflective of how theAutomotive Bearings, Industrial Bearings and Steel businesses areoperated by the company. Europe information presented reflectsshipments from European locations. The information does notinclude product manufactured by facilities located outside Europeand shipped directly to customers located in Europe.
14 SEGMENT INFORMATIONDescription of types of products and services from which each reportable segment derives its revenuesThe company’s reportable segments are business units that target different industry segments. Each reportable segment ismanaged separately because of the need to specifically addresscustomer needs in these different industries. The company hasthree reportable segments: Automotive Bearings, IndustrialBearings and Steel.
Automotive Bearings include products for passenger cars, light and heavy trucks and trailers. Industrial Bearings include industrial,rail, aerospace and super precision products as well as emergingmarkets in China, India and Central and Eastern Europe. The com-pany’s bearing products are used in a wide variety of productsincluding railroad cars and locomotives, machine tools, rolling millsand farm and construction equipment, in aircraft, missile guidancesystems, computer peripherals and medical instruments.
Steel products include steels of intermediate alloy, vacuumprocessed alloys, tool steel and some carbon grades. These areavailable in a wide range of solid and tubular sections with a variety of finishes. The company also manufactures custom-madesteel products, including precision steel components. A significant
United OtherGeographic Financial Information States Europe Countries Consolidated
(Thousands of dollars)
2002Net sales $ 1,987,499 $ 365,460 $ 197,116 $ 2,550,075Non-current assets 1,472,680 223,348 84,036 1,780,064
2001Net sales $ 1,906,823 $ 351,242 $ 189,113 $ 2,447,178Non-current assets 1,402,780 232,105 69,819 1,704,704
2000Net sales $ 2,062,306 $ 361,649 $ 219,053 $ 2,643,008Non-current assets 1,391,080 204,135 70,348 1,665,563
notes to consolidated financial statements
44
underwriting discounts and commissions, from a public offering of12,650,000 shares of common stock at $14.90 per common share;$246,945,000, net of underwriting discounts and commissions,from a public offering of $250,000,000 of 5.75% senior unsecurednotes due 2010; $125,000,000 from its Asset Securitization facility;and approximately $86,000,000 from its new senior credit facility.
In connection with the closing of the Torrington acquisition and thefunding of its new senior credit facility, the company terminated itsthen existing $300,000,000 revolving credit agreement. In addition,the company did not utilize the $375,000,000 one-year term loanfacility that was a part of the new senior credit facility.
13 SUBSEQUENT EVENT - ACQUISITIONEffective February 16, 2003, the company acquired IR’s EngineeredSolutions business, a leading worldwide producer of needle roller,heavy-duty roller and ball bearings, and motion control componentsand assemblies. IR’s Engineered Solutions business is comprisedof certain operating assets and subsidiaries, including TheTorrington Company. IR’s Engineered Solutions business had salesof $1.2 billion in 2002.
The company paid IR $700,000,000 in cash, subject to post-closing purchase price adjustments, and issued $140,000,000 of itscommon stock (9,395,973 shares) to Ingersoll-Rand Company, asubsidiary of IR. To finance the cash portion of the transaction thecompany utilized, in addition to cash on hand: $180,009,500, net of

Segment Financial Information 2002 2001 2000(Thousands of dollars)
Automotive BearingsNet sales to external customers $ 840,763 $ 751,029 $ 839,838
Depreciation and amortization 33,866 36,381 35,344
Impairment and restructuring charges 18,992 27,270 1,143
Receipt of U.S. Continued Dumping and Subsidy Offset Act (CDSOA) payment
(net of expenses) 10,829 2,501 -
Earnings (loss) before interest and taxes 14,715 (39,939) 24,595
Capital expenditures 34,948 36,427 50,540Assets employed at year-end 718,495 661,514 632,814
Industrial BearingsNet sales to external customers $ 883,534 $ 882,279 $ 923,477
Depreciation and amortization 45,429 48,314 48,197
Impairment and restructuring charges 9,313 25,671 11,499
Receipt of CDSOA payment (net of expenses) 39,373 27,054 -
Earnings before interest and taxes 72,872 32,144 54,304
Capital expenditures 32,178 34,646 59,382Assets employed at year-end 1,051,053 966,647 944,493
SteelNet sales to external customers $ 825,778 $ 813,870 $ 879,693
Intersegment sales 155,500 146,492 196,500
Depreciation and amortization 67,240 67,772 67,506
Impairment and restructuring charges 3,838 1,748 15,112
Earnings before interest and taxes 28,682 9,345 19,349
Capital expenditures 23,547 31,274 52,795
Assets employed at year-end 978,808 904,924 986,798
TotalNet sales to external customers $ 2,550,075 $2,447,178 $2,643,008
Depreciation and amortization 146,535 152,467 151,047
Impairment and restructuring charges 32,143 54,689 27,754
Receipt of CDSOA payment (net of expenses) 50,202 29,555 -
Earnings before interest and taxes 116,269 1,550 98,248
Capital expenditures 90,673 102,347 162,717
Assets employed at year-end 2,748,356 2,533,084 2,564,105
Income Before Income TaxesTotal EBIT for reportable segments $ 116,269 $ 1,550 $ 98,248
Interest expense (31,540) (33,401) (31,922)
Interest income 1,676 2,109 3,479
Intersegment adjustments (887) 2,859 792
Income (loss) before income taxes and cumulative effect of change
in accounting principle $ 85,518 $ (26,883) $ 70,597
The company evaluates operating performance based on each segment’s profit before interest and income taxes. Therefore, interestexpense and interest income are maintained at a corporate level and are not shown on a segmented basis.
45

Following is the reconciliation between the provision for income taxes and the amount computed by applying U.S. federal income tax rateof 35% to income before taxes:
2002 2001 2000(Thousands of dollars)
Income tax (credit) at the statutory federal rate $ 29,931 $ (9,409) $ 24,709
Adjustments:
State and local income taxes, net of federal tax benefit 1,465 1,107 507
Losses without current tax benefits 3,598 20,854 5,177
Settlements and claims for prior years - - (5,125)
Adjustment of world-wide tax liabilities (2,117) 532 (1,900)
Other items 1,190 1,699 1,341
Provision for income taxes $ 34,067 $ 14,783 $ 24,709
Effective income tax rate 40% N/A 35%
In 2001 and 2000, the company incurred losses without current tax benefits related to the United Kingdom, Brazil and China. In 2002, thecompany incurred losses without current tax benefits related to Brazil and China.
15 INCOME TAXESThe provision (credit) for income taxes consisted of the following:
2002 2001 2000Current Deferred Current Deferred Current Deferred
(Thousands of dollars)
United States:
Federal $ 5,220 $ 17,808 $ (18,523) $ 22,620 $ (1,093) $ 13,093
State and local 3,936 (1,682) 2,332 (628) 1,775 (995)
Foreign 7,661 1,124 7,961 1,021 13,442 (1,513)
$ 16,817 $ 17,250 $ (8,230) $ 23,013 $ 14,124 $ 10,585
The company received an income tax refund of approximately $27,000,000 in 2002 and made income tax payments of approximately$7,210,000 in 2001 and $17,520,000 in 2000. Taxes paid differ from current taxes provided, primarily due to the timing of payments.
The effect of temporary differences giving rise to deferred tax assets and liabilities at December 31, 2002 and 2001 was as follows:
2002 2001(Thousands of dollars)
Deferred tax assets:
Accrued postretirement benefits cost $ 169,113 $170,975
Accrued pension cost 192,983 67,571
Benefit accruals 18,262 18,473
Tax loss and credit carryforwards 59,515 33,787
Other–net 1,818 12,754
Valuation allowance (18,124) (34,756)
423,562 268,804
Deferred tax liability–depreciation (218,508) (198,746)
Net deferred tax asset $ 205,054 $ 70,058
The company has U.S. net operating losses from 2002 and 2001 with benefits totaling $29.5 million. These losses will start to expire in2021. In addition, the company has loss carryforward benefits in various foreign jurisdictions of $4.7 million without expiration dates andstate and local loss carryforward benefits of $2.5 million, which will begin to expire in 2014. These losses are fully reserved by the company.
The company has a research tax credit carryforward of $2.9 million, an AMT credit carryforward of $9.3 million and state income tax credits of $10.6 million. The research tax credits will expire annually between 2019 and 2022, and the AMT credits do not have any expiration date. The state income tax credits will expire at various intervals beginning in 2003 and are fully reserved by the company.
notes to consolidated financial statements
46
FORWARD-LOOKING STATEMENTS
Certain statements set forth in this annual report (including thecompany’s forecasts, beliefs and expectations) that are not histori-cal in nature are "forward-looking" statements within the meaningof the Private Securities Litigation Reform Act of 1995. In particu-lar the Corporate Profile on pages 18 through 20 andManagement’s Discussion and Analysis on pages 22 through 31 contain numerous forward-looking statements. The companycautions readers that actual results may differ materially from thoseexpressed or implied in forward-looking statements made by or on behalf of the company due to a variety of important factors, such as:
a) risks associated with the consummation of the acquisition of Torrington, including the uncertainties in both timing andamount of actual benefits, if any, that may be realized as a resultof the integration of the Torrington business with the company’soperations and the timing and amount of the resources requiredto achieve those benefits; risks associated with diversion of management’s attention from routine operationsduring the integration process; and risks associated with thehigher level of debt associated with the acquisition.
b) changes in world economic conditions, including additionaladverse effects from terrorism or hostilities. This includes, but is not limited to, political risks associated with the potentialinstability of governments and legal systems in countries inwhich the company or its customers conduct business and significant changes in currency valuations.
c) the effects of changes in customer demand on sales, productmix and prices in the industries in which the company operates.This includes the effects of customer strikes, the impact ofchanges in industrial business cycles and whether conditions offair trade continue in the U.S. market.
d) competitive factors, including changes in market penetration,increasing price competition by existing or new foreign anddomestic competitors, the introduction of new products by exist-ing and new competitors and new technology that may impactthe way the company's products are sold or distributed.
We believe that our audits provide a reasonable basis for our opinion.
In our opinion, the financial statements referred to above presentfairly, in all material respects, the consolidated financial position ofThe Timken Company and subsidiaries at December 31, 2002 and2001, and the consolidated results of their operations and theircash flows for each of the three years in the period endedDecember 31, 2002, in conformity with accounting principles generally accepted in the United States.
As discussed in Note 6 to the consolidated financial statements,"Change in Method of Accounting," the company adoptedStatement of Financial Accounting Standards No. 142, "Goodwilland Other Intangible Assets" effective January 1, 2002.
Canton, OhioFebruary 18, 2003
REPORT OF INDEPENDENT AUDITORS
To the Board of Directors and Shareholders The Timken Company
e) changes in operating costs. This includes the effect of changesin the company's manufacturing processes; changes in costsassociated with varying levels of operations; changes resultingfrom inventory management and cost reduction initiatives anddifferent levels of customer demands; the effects of unplannedwork stoppages; changes in the cost of labor and benefits; andthe cost and availability of raw materials and energy.
f) the success of the company's operating plans, including its ability to achieve the benefits from its global restructuring, manufacturing transformation, and administrative cost reduction initiatives as well as its ongoing continuous improve-ment and rationalization programs; the ability of acquired companies to achieve satisfactory operating results; and its ability to maintain appropriate relations with unions that represent company associates in certain locations in order toavoid disruptions of business.
g) unanticipated litigation, claims or assessments. This includes,but is not limited to, claims or problems related to intellectualproperty, product liability or warranty and environmental issues.
h) changes in worldwide financial markets, including interest ratesto the extent they affect the company's ability to raise capital orincrease the company's cost of funds, have an impact on theoverall performance of the company's pension fund investmentsand/or cause changes in the economy which affect customerdemand.
Additional risks relating to the company’s business, the industriesin which the company operates or the company’s common stockmay be described from time to time in the company’s filings withthe SEC. All of these risk factors are difficult to predict, are subjectto material uncertainties that may affect actual results and may bebeyond the company’s control.
Except as required by the federal securities laws, the companyundertakes no obligation to publicly update or revise any forward-looking statement, whether as a result of new information, futureevents or otherwise.
We have audited the consolidated balance sheets of The TimkenCompany and subsidiaries as of December 31, 2002 and 2001, andthe related consolidated statements of operations, shareholders'equity, and cash flows for each of the three years in the period ended December 31, 2002. These financial statements arethe responsibility of the company's management. Our responsibilityis to express an opinion on these financial statements based on our audits.
We conducted our audits in accordance with auditing standardsgenerally accepted in the United States. Those standards requirethat we plan and perform the audit to obtain reasonable assuranceabout whether the financial statements are free of material misstatement. An audit includes examining, on a test basis, evidence supporting the amounts and disclosures in the financialstatements. An audit also includes assessing the accounting principles used and significant estimates made by management, as well as evaluating the overall financial statement presentation.
47
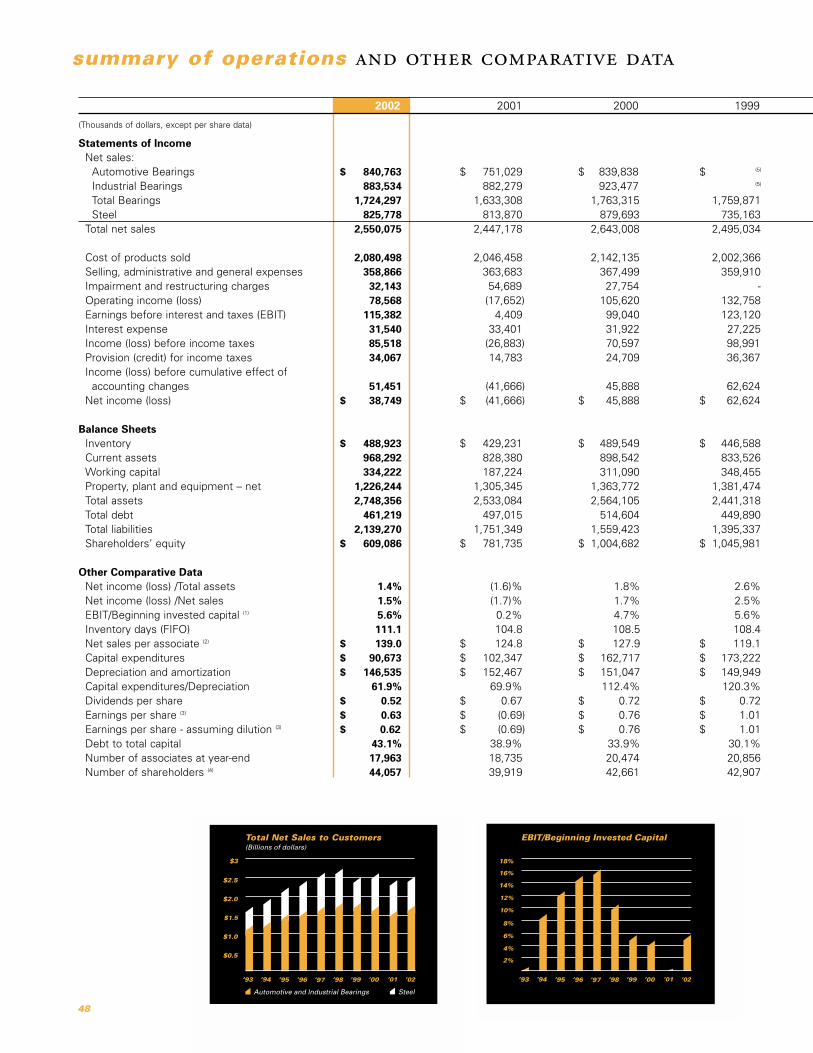
2002 2001 2000 1999
(Thousands of dollars, except per share data)
Statements of IncomeNet sales:
Automotive Bearings $ 840,763 $ 751,029 $ 839,838 $ (5)
Industrial Bearings 883,534 882,279 923,477 (5)
Total Bearings 1,724,297 1,633,308 1,763,315 1,759,871Steel 825,778 813,870 879,693 735,163
Total net sales 2,550,075 2,447,178 2,643,008 2,495,034
Cost of products sold 2,080,498 2,046,458 2,142,135 2,002,366Selling, administrative and general expenses 358,866 363,683 367,499 359,910Impairment and restructuring charges 32,143 54,689 27,754 -Operating income (loss) 78,568 (17,652) 105,620 132,758Earnings before interest and taxes (EBIT) 115,382 4,409 99,040 123,120Interest expense 31,540 33,401 31,922 27,225Income (loss) before income taxes 85,518 (26,883) 70,597 98,991Provision (credit) for income taxes 34,067 14,783 24,709 36,367Income (loss) before cumulative effect of
accounting changes 51,451 (41,666) 45,888 62,624Net income (loss) $ 38,749 $ (41,666) $ 45,888 $ 62,624
Balance SheetsInventory $ 488,923 $ 429,231 $ 489,549 $ 446,588Current assets 968,292 828,380 898,542 833,526Working capital 334,222 187,224 311,090 348,455Property, plant and equipment – net 1,226,244 1,305,345 1,363,772 1,381,474Total assets 2,748,356 2,533,084 2,564,105 2,441,318Total debt 461,219 497,015 514,604 449,890Total liabilities 2,139,270 1,751,349 1,559,423 1,395,337Shareholders’ equity $ 609,086 $ 781,735 $ 1,004,682 $ 1,045,981
Other Comparative DataNet income (loss) /Total assets 1.4% (1.6)% 1.8% 2.6%Net income (loss) /Net sales 1.5% (1.7)% 1.7% 2.5%EBIT/Beginning invested capital (1) 5.6% 0.2% 4.7% 5.6%Inventory days (FIFO) 111.1 104.8 108.5 108.4Net sales per associate (2) $ 139.0 $ 124.8 $ 127.9 $ 119.1Capital expenditures $ 90,673 $ 102,347 $ 162,717 $ 173,222Depreciation and amortization $ 146,535 $ 152,467 $ 151,047 $ 149,949Capital expenditures/Depreciation 61.9% 69.9% 112.4% 120.3%Dividends per share $ 0.52 $ 0.67 $ 0.72 $ 0.72Earnings per share (3) $ 0.63 $ (0.69) $ 0.76 $ 1.01Earnings per share - assuming dilution (3) $ 0.62 $ (0.69) $ 0.76 $ 1.01Debt to total capital 43.1% 38.9% 33.9% 30.1%Number of associates at year-end 17,963 18,735 20,474 20,856Number of shareholders (4) 44,057 39,919 42,661 42,907
’96 ’97 ’98 ’99
$3
$1.5
$1.0
$0.5
’95
$2.0
‘93 ‘94
$2.5
’00 ’01
Total Net Sales to Customers(Billions of dollars)
’02
Automotive and Industrial Bearings Steel
’96 ’97 ’98 ’99
18%
10%
6%
4%
’95
14%
‘93 ‘94
16%
’00 ’01
EBIT/Beginning Invested Capital
’02
12%
8%
2%
summary of operations and other comparative data
48

1998 1997 1996 1995 1994 1993
$ (5) $ (5) $ (5) $ (5) $ (5) $ (5)
(5) (5) (5) (5) (5) (5)
1,797,745 1,718,876 1,598,040 1,524,728 1,312,323 1,153,987882,096 898,686 796,717 705,776 618,028 554,774
2,679,841 2,617,562 2,394,757 2,230,504 1,930,351 1,708,761
2,098,186 2,005,374 1,828,394 1,723,463 1,514,098 1,369,711356,672 332,419 319,458 304,046 283,727 276,928
- - - - - 48,000224,983 279,769 246,905 202,995 132,526 14,122208,866 286,766 242,304 197,957 134,674 7,84326,502 21,432 17,899 19,813 24,872 29,619
185,350 266,592 225,259 180,174 111,323 (20,919)70,813 95,173 86,322 67,824 42,859 (3,250)
114,537 171,419 138,937 112,350 68,464 (17,669)$ 114,537 $ 171,419 $ 138,937 $ 112,350 $ 68,464 $ (271,932)
$ 457,246 $ 445,853 $ 419,507 $ 367,889 $ 332,304 $ 299,783850,337 855,171 793,633 710,258 657,180 586,384359,914 275,607 265,685 247,895 178,556 153,971
1,349,539 1,220,516 1,094,329 1,039,382 1,030,451 1,024,6642,450,031 2,326,550 2,071,338 1,925,925 1,858,734 1,789,719
469,398 359,431 302,665 211,232 279,519 276,4761,393,950 1,294,474 1,149,110 1,104,747 1,125,843 1,104,407
$ 1,056,081 $ 1,032,076 $ 922,228 $ 821,178 $ 732,891 $ 685,312
4.7% 7.4% 6.7% 5.8% 3.7% (15.2)%4.3% 6.5% 5.8% 5.0% 3.5% (15.9)%
10.5% 16.1% 15.1% 12.6% 9.0% 0.5%109.4 111.5 117.5 112.2 118.0 122.5
$ 127.5 $ 130.5 $ 132.4 $ 134.2 $ 119.9 $ 104.5$ 258,621 $ 229,932 $ 155,925 $ 131,188 $ 119,656 $ 92,940$ 139,833 $ 134,431 $ 126,457 $ 123,409 $ 119,255 $ 118,403
192.5% 177.3% 127.0% 109.1% 102.6% 80.2%$ 0.72 $ 0.66 $ 0.60 $ 0.56 $ 0.50 $ 0.50$ 1.84 $ 2.73 $ 2.21 $ 1.80 $ 1.11 $ (0.29)$ 1.82 $ 2.69 $ 2.19 $ 1.78 $ 1.10 $ (0.29)
30.8% 25.8% 24.7% 20.5% 27.6% 28.7%21,046 20,994 19,130 17,034 16,202 15,98545,942 46,394 31,813 26,792 49,968 28,767
(1)EBIT/Beginning invested capital, a type of return on asset ratio, is used internally to measure the company’s performance. In broad terms, invested capital is total assets minus non-interest-bearing current liabilities.
(2)Based on the average number of associates employed during the year.
(3)Based on the average number of shares outstanding during the year and excludes the cumulative effect of accounting changes in 1993, which related to the adoption of FAS No. 106, 109 and 112.
(4)Includes an estimated count of shareholders having common stock held for their accounts by banks, brokers and trustees for benefit plans.
(5)It is impracticable for the company to restate prior year segment financial information into Automotive Bearings and Industrial Bearings as this structure was not in place until 2000.
49
Karl P. Kimmerling, 45, 23 years of servicePresident – AutomotiveOfficer since 1998
Roger W. Lindsay, 46, 12 years of serviceSenior Vice President – Human Resources andOrganizational AdvancementOfficer since 2002
Salvatore J. Miraglia, Jr., 52, 30 years of serviceSenior Vice President – TechnologyOfficer since 1996
Hans J. Sack, 48, 13 years of servicePresident – Specialty SteelOfficer since 1998
Mark J. Samolczyk, 47, 21 years of serviceSenior Vice President – Automotive IntegrationOfficer since 2000
Scott A. Scherff, 48, 23 years of serviceCorporate Secretary and Assistant General CounselOfficer since 1999
W.R. Timken, Jr., 64, 40 years of serviceChairman – Board of DirectorsOfficer since 1968
Ward J. Timken, 60, 34 years of serviceVice PresidentOfficer since 1992
Ward J. Timken, Jr., 35, 10 years of serviceCorporate Vice President – Office of the ChairmanOfficer since 2000
John M. Timken, Jr., 51, Director since 1986 (A)Private Investor (Old Saybrook, Connecticut)
W.R. Timken, Jr., 64, Director since 1965Chairman – Board of DirectorsThe Timken Company
Ward J. Timken, 60, Director since 1971Vice PresidentThe Timken Company
Ward J. Timken, Jr., 35, Director since 2002Corporate Vice President – Office of the ChairmanThe Timken Company
Joseph F. Toot, Jr., 67, Director since 1968Retired President and Chief Executive OfficerThe Timken Company
Martin D. Walker, 70, Director since 1995 (C)PrincipalMORWAL Investments (Westlake, Ohio)
Jacqueline F. Woods, 55, Director since 2000 (A)Retired PresidentAmeritech Ohio (Cleveland, Ohio)
(A) Member of Audit Committee (C) Member of Compensation Committee
OFFICERS
Curt J. Andersson, 41, 2 years of serviceSenior Vice President – Industrial IntegrationOfficer since 2000
Michael C. Arnold, 46, 23 years of servicePresident – IndustrialOfficer since 2000
Sallie B. Bailey, 43, 7 years of serviceSenior Vice President – Finance and ControllerOfficer since 1999
Bill J. Bowling, 61, 37 years of serviceExecutive Vice President, Chief Operating Officerand President – SteelOfficer since 1996
William R. Burkhart, 37, 8 years of serviceSenior Vice President and General CounselOfficer since 2000
Donna J. Demerling, 52, 30 years of serviceSenior Vice President – Supply Chain TransformationOfficer since 2000
Glenn A. Eisenberg, 41, 1 year of serviceExecutive Vice President – Finance and AdministrationOfficer since 2002
Jon T. Elsasser, 50, 24 years of serviceSenior Vice President – e-Business and Corporate PlanningOfficer since 1996
James W. Griffith, 49, 18 years of servicePresident and Chief Executive OfficerOfficer since 1996
DIRECTORS
Stanley C. Gault, 77, Director since 1988 (C) Retired Chairman and Chief Executive OfficerThe Goodyear Tire and Rubber Company (Akron, Ohio)Retired Chairman and Chief Executive OfficerRubbermaid, Inc. (Wooster, Ohio)
James W. Griffith, 49, Director since 1999President and Chief Executive OfficerThe Timken Company
John A. Luke, Jr., 54, Director since 1999 (C)Chairman and Chief Executive OfficerMeadWestvaco (New York, New York)
Robert W. Mahoney, 66, Director since 1992 (C)Retired ChairmanDiebold, Incorporated (Canton, Ohio)
Jay A. Precourt, 65, Director since 1996 (A)Chairman and Chief Executive OfficerScissorTail Energy (Vail, Colorado)
50
directors and officers
Dr. Carl H. HahnWolfsburg, Germany
Madame Marie-France GaraudParis, France
Corporate OfficesThe Timken Company 1835 Dueber Ave., S.W. Canton, Ohio 44706-2798Telephone: 330-438-3000
Annual Meeting of ShareholdersTuesday, April 15, 2003, 10 a.m., Corporate Offices.Direct meeting inquiries to Scott A. Scherff, corporate secretary and assistant general counsel, at 330-471-4226.
Stock ListingNew York Stock Exchange trading symbol, “TKR.” Abbreviation used in most newspaper stock listings is “Timken.”
Shareholder InformationDividends on common stock are generally payable in March, June, September and December.
The Timken Company offers an open enrollment dividend reinvestment and stock purchase plan through its transfer agent. This program allows current shareholders and newinvestors the opportunity to purchase shares of common stock without a broker.
Shareholders of record may increase their investment in the company by reinvesting their dividends at no cost. Shares held in the name of a broker must be transferred to the shareholder’s name to permit reinvestment.
Please direct inquiries to:
National City Bank Reinvestment ServicesP.O. Box 94946Cleveland, Ohio 44101-4946
Inquiries concerning dividend payments, change of address or lost certificates should be directed to National City Bank at 1-800-622-6757.
Transfer Agent and RegistrarNational City Bank Shareholder ServicesP.O. Box 92301Cleveland, Ohio 44193-0900
Independent AuditorsErnst & Young LLP 200 Market Ave., N.Canton, Ohio 44702-1418
PublicationsThe Annual Meeting Notice, Proxy Statement and Proxy Form are mailed to shareholders in March.
Copies of Forms 10-K and 10-Q may be obtained from the company’s Web site,www.timken.com/investors,or by written request at no charge from:
The Timken Company Shareholder Relations, GNE-04P.O. Box 6928Canton, Ohio 44706-0928
Other InformationAnalysts and investors may contact:
Kevin R. Beck, GNE-04Manager – Investor Relations The Timken CompanyP.O. Box 6928Canton, Ohio 44706-0928Telephone: 330-471-7181
Media representatives may contact:
Elaine M. Russell Reolfi, GNW-37Global Manager –
Corporate and Marketing Communications The Timken CompanyP.O. Box 6932Canton, Ohio 44706-0932Telephone: 330-471-3502
The Timken Company’s Web site: www.timken.com.
Printed on Recycled Paper
international advisors
shareholder information

WORLDWIDE LEADER IN BEARINGS AND STEEL
Timken® is the registered trademark of The Timken Companywww.timken.com
© 2003 The Timken CompanyPrinted in the U.S.A.65M-2-03-05 Order No. 1416