tin- and chromium-coated steel sheet from japan. international trade commission washington, dc 20436...
TRANSCRIPT

Tin- and Chromium-Coated Steel Sheet From Japan
Investigation No. 731 -TA-860 (Preliminary)
Publication 3264 December 1999
Washington, DC 20436

COMMISSIONERS
Lynn M. Bragg, Chairman Marcia E. Miller, Vice Chairman
Carol T. Crawford Jennifer A. Hillman
Stephen Koplan Thelma J. Askey
Robert A. Rogowsky Director of Operations
Staff assigned:
Larry Reavis, Investigator Vincent DeSapio, Industry Analyst
Victoria Chomo, Economist Chandrakant Mehta, Accountant
Willis Martyn, Attorney
Vera Libeau, Supervisory Investigator
Address all communications to Secretary to the Commission
United States International 'hade Commission Washington, DC 20436

U.S. International Trade Commission Washington, DC 20436
Tin- and Chromium-Coated Steel Sheet From Japan
Publication 3264 December 1999


C O N T E N T S
Page
Determination . . . . . . . . . . . . . . . . . . . . . . . . . . . . . . . . . . . . . . . . . . . . . . . . . . . . . . . . . . . . . . . . . . 1 ViewsoftheCommission . . . . . . . . . . . . . . . . . . . . . . . . . . . . . . . . . . . . . . . . . . . . . . . . . . . . . . . . . 3 PartI: Introduction . . . . . . . . . . . . . . . . . . . . . . . . . . . . . . . . . . . . . . . . . . . . . . . . . . . . . . . . . . . . . . 1-1
Background . . . . . . . . . . . . . . . . . . . . . . . . . . . . . . . . . . . . . . . . . . . . . . . . . . . . . . . . . . . . . . . . . . 1-1 Allegations of LTFV sales . . . . . . . . . . . . . . . . . . . . . . . . . . . . . . . . . . . . . . . . . . . . . . . . . . . . . . I- 1 Summarydata . . . . . . . . . . . . . . . . . . . . . . . . . . . . . . . . . . . . . . . . . . . . . . . . . . . . . . . . . . . . . . . . 1-2 Theproduct . . . . . . . . . . . . . . . . . . . . . . . . . . . . . . . . . . . . . . . . . . . . . . . . . . . . . . . . . . . . . . . . . . 1-2
Part 11: Conditions of competition in the U.S. market ................................... 11-1 Market segments and channels of distribution ....................................... 11-1
11-1
U.S.demand . . . . . . . . . . . . . . . . . . . . . . . . . . . . . . . . . . . . . . . . . . . . . . . . . . . . . . . . . . . . . . 11-2 Substitutability issues . . . . . . . . . . . . . . . . . . . . . . . . . . . . . . . . . . . . . . . . . . . . . . . . . . . . . . . . . . 11-2
Factors affecting purchasing decisions . . . . . . . . . . . . . . . . . . . . . . . . . . . . . . . . . . . . . . . . . . 11-2 Comparisons of domestic products and imports from Japan ......................... 11-3
. . . : . . . 11-3 Part 111: Condition of the U.S. industry . . . . . . . . . . . . . . . . . . . . . . . . . . . . . . . . . . . . . . . . . . . . . . 111- 1
U.S. producers . . . . . . . . . . . . . . . . . . . . . . . . . . . . . . . . . . . . . . . . . . . . . . . . . . . . . . . . . . . . . . . 111-1 111-2
Part IV: U.S. imports, apparent consumption, and market shares .......................... IV- 1 Part V: Pricing and related information . . . . . . . . . . . . . . . . . . . . . . . . . . . . . . . . . . . . . . . . . . . . . . V- 1
Factors affecting prices . . . . . . . . . . . . . . . . . . . . . . . . . . . . . . . . . . . . . . . . . . . . . . . . . . . . . . . . . V-1 U.S. inland transportation costs . . . . . . . . . . . . . . . . . . . . . . . . . . . . . . . . . . . . . . . . . . . . . . . . V- 1 Exchangerates . . . . . . . . . . . . . . . . . . . . . . . . . . . . . . . . . . . . . . . . . . . . . . . . . . . . . . . . . . . . . V-1
Pricing practices . . . . . . . . . . . . . . . . . . . . . . . . . . . . . . . . . . . . . . . . . . . . . . . . . . . . . . . . . . . . . . V-2 Pricingmethods . . . . . . . . . . . . . . . . . . . . . . . . . . . . . . . . . . . . . . . . . . . . . . . . . . . . . . . . . . . . V-2 Sales terms and discounts . . . . . . . . . . . . . . . . . . . . . . . . . . . . . . . . . . . . . . . . . . . . . . . . . . . . V-2
Price data . . . . . . . . . . . . . . . . . . . . . . . . . . . . . . . . . . . . . . . . . . . . . . . . . . . . . . . . . . . . . . . . . . . . V-2 Pricetrends . . . . . . . . . . . . . . . . . . . . . . . . . . . . . . . . . . . . . . . . . . . . . . . . . . . . . . . . . . . . . . . V-3 Pricecomparisons . . . . . . . . . . . . . . . . . . . . . . . . . . . . . . . . . . . . . . . . . . . . . . . . . . . . . . . . . . V-6
Lost sales and revenues . . . . . . . . . . . . . . . . . . . . . . . . . . . . . . . . . . . . . . . . . . . . . . . . . . . . . . . . . V-7 Part VI: Financial condition of the U.S. industry ....................................... v1-1
Background . . . . . . . . . . . . . . . . . . . . . . . . . . . . . . . . . . . . . . . . . . . . . . . . . . . . . . . . . . . . . . . . . . v1-1 Operations on TCCSS . . . . . . . . . . . . . . . . . . . . . . . . . . . . . . . . . . . . . . . . . . . . . . . . . . . . . . . . . . v1-1 Investment in productive facilities, capital expenditures, and R&D expenses . . . . . . . . . . . . . . v1-5 Capital and investment . . . . . . . . . . . . . . . . . . . . . . . . . . . . . . . . . . . . . . . . . . . . . . . . . . . . . . . . . v1-5
Part VII: Threat considerations . . . . . . . . . . . . . . . . . . . . . . . . . . . . . . . . . . . . . . . . . . . . . . . . . . . . . VII- 1
Supply and demand considerations ................................................ U.S.supply . . . . . . . . . . . . . . . . . . . . . . . . . . . . . . . . . . . . . . . . . . . . . . . . . . . . . . . . . . . . . . . 11-1
Comparisons of domestic products and imports from Japan to nonsubject imports
U.S. production, capacity, capacity utilization, shipments, inventories, and employment . . . . .
Appendixes
A . Federal Register notices . . . . . . . . . . . . . . . . . . . . . . . . . . . . . . . . . . . . . . . . . . . . . . . . . . . . . . . . A-1 B . Witnesses at the Commission’s conference ......................................... B-1 C.Summarydata . . . . . . . . . . . . . . . . . . . . . . . . . . . . . . . . . . . . . . . . . . . . . . . . . . . . . . . . . . . . . . . . C-1 D . Alleged effects of imports on producers’ existing development and production efforts. growth.
investment. and ability to raise capital .......................................... D- 1
i

CONTENTS
Page
Figures
V-1. Exchange rates: Indices of real and nominal exchange rates in U.S. dollars per Japanese V-1
V-2. Weighted-average f.0.b. U.S. and importer prices per ton of products 1-3 . . . . . . . . . . . . . . V-6 yen, by quarters, Jan. 1996-June 1999 ........................................
Tables
111-1. TCCSS: U.S. producers, position on the petition, plant location(s), and share of production in1998 . . . . . . . . . . . . . . . . . . . . . . . . . . . . . . . . . . . . . . . . . . . . . . . . . . . . . . . . . . . . . . . . 111-1
111-2. TCCSS: U.S. production, average practical capacity, capacity utilization, domestic shipments, exports, end-of-period inventories, average number of U.S. production and related workers, and hours worked by and wages paid to such workers, 1996-98, Jan.-Sept. 1998, and Jan.3ept.1999 . . . . . . . . . . . . . . . . . . . . . . . . . . . . . . . . . . . . . . . . . . . . . . . . . . . . . . . . . . 111-3
1996-98, Jan.-Sept. 1998, and Jan.-Sept. 1999 ................................. IV-3
IV-1. TCCSS: U.S. imports, by sources, 1996-98, Jan.-Sept. 1998, and Jan.-Sept. 1999 . . . . . . . . IV-2 IV-2. TCCSS: U.S. shipments of domestic product, U.S. imports, and apparent U.S. consumption,
V-1. Product 1 (TCSS): Weighted-average f.0.b. prices and quantities of domestic and imported product 1 and margins of underselling/(overselling), by quarters, Jan. 1996-Sept. 1999 . V-4
V-2. Product 2 (TCSS): Weighted-average f.0.b. prices and quantities of domestic and imported product 2 and margins of underselling/(overselling), by quarters, Jan. 1996-Sept. 1999 . V-5
V-3. Product 3 (CCSS): Weighted-average f.0.b. prices and quantities of domestic and imported product 3 and margins of underselling/(overselling), by quarters, Jan. 1996-Sept. 1999 . V-5
VI-1. Results of operations of U.S. producers in the production of TCCSS, fiscal years 1996-98, Jan.-Sept. 1998, and Jan.-Sept. 1999 ......................................... VI-2
VI-2. Results of operations (per short ton) of U.S. producers in the production of TCCSS, fiscal years 1996-98, Jan.-Sept. 1998, and Jan.-Sept. 1999 ............................. VI-3
VI-3. Results of operations of U.S. producers in the production of TCCSS, by firms, fiscal years 1996-98, Jan.-Sept. 1998, and Jan.-Sept. 1999 . . . . . . . . . . . . . . . . . . . . . . . . . . . . . . . . . VI-3
VI-4. Variance analysis of U.S. producers’ TCCSS operations, fiscal years 1996-98, Jan.-Sept. 1998, and Jan.-Sept. 1999 . . . . . . . . . . . . . . . . . . . . . . . . . . . . . . . . . . . . . . . . . VI-4
VI-5. Value of assets, capital expenditures, and R&D expenses of U.S. producers of TCCSS, fiscal years 1996-98, Jan.-Sept. 1998, and Jan.-Sept. 1999 ........................ VI-5
VII- 1. TCCSS: Japan’s production, capacity, shipments, and end-of-period inventories, 1996-98, Jan.-Sept. 1998, and Jan.-Sept. 1999 ......................................... VII-2
C-1. TCCSS: Summary data concerning the U.S. market, 1996-98, Jan.-Sept. 1998, and Jan.-Sept. 1999 . . . . . . . . . . . . . . . . . . . . . . . . . . . . . . . . . . . . . . . . . . . . . . . . . . . . . . . . . . C-3
Note.-Information that would reveal confidential operations of individual concerns may not be published and therefore has been deleted from this report. Such deletions are indicated by asterisks.
.. 11

Glossary of Abbreviations
Weirton ....................... usw .......................... ISU ........................... LTFV ......................... TCCSS ........................ TCSS ......................... CCSS ......................... HTS .......................... FR ............................ Commerce ..................... Commission .................... Nippon Steel . . . . . . . . . . . . . . . . . . . Kawasaki ...................... N K K . . . . . . . . . . . . . . . . . . . . . . . . . . Toyo Kohan .................... ASTM ......................... AIS1 .......................... Bethlehem ..................... LTV .......................... National ....................... uss Posco ..................... Ohio Coatings . . . . . . . . . . . . . . . . . . US Steel ....................... f.0.b. .......................... COGS ......................... SG&A ........................ R&D ..........................
Weirton Steel Corp. United Steelworkers of America, AFL-CIO Independent Steelworkers Union Less than fair value Tin- and chromium-coated steel sheet Tin-coated steel sheet Chromium-coated steel sheet Harmonized Tariff Schedules of the United States Federal Register U.S. Department of Commerce U.S. International Trade Commission Nippon Steel Corp. Kawasaki Steel Corp.
Toyo Kohan Co. Ltd. American Society of Testing and Materials American Institute of Iron and Steel Bethlehem Steel Corp. LTV Steel Co. National Steel Corp. USS Posco Industries Inc. Ohio Coatings Co. U.S. Steel Group Free on board Cost of goods sold Selling, general, and administrative expenses Research and development
NKK Corp.


UNITED STATES INTERNATIONAL TRADE COMMISSION
Investigation No. 73 1 -TA-860 (Preliminary)
TIN- AND CHROMIUM-COATED STEEL SHEET FROM JAPAN
DETERMINATION
On the basis of the record’ developed in the subject investigation, the United States International Trade Commission determines,* pursuant to section 733(a) of the Tariff Act of 1930 (19 U.S.C. 6 1673b(a)), that there is a reasonable indication that an industry in the United States is materially injured by reason of imports fiom Japan of tin- and chromium-coated steel sheet (as defined by the Department of Commerce (Commerce)), that are alleged to be sold in the United States at less than fair value (LTFV) .
Pursuant to section 207.18 of the Commission’s rules, the Commission also gives notice of the commencement of the final phase of its investigation. The Commission will issue a final phase notice of scheduling which will be published in the Federal Register as provided in section 207.21 of the Commission’s rules upon notice from Commerce of an affirmative preliminary determination in the investigation under section 733(b) of the Act, or, if the preliminary determination is negative, upon notice of an affirmative final determination in that investigation under section 735(a) of the Act. Parties that filed entries of appearance in the preliminary phase of the investigation need not enter a separate appearance for the final phase of the investigation. Industrial users, and, if the merchandise under investigation is sold at the retail level, representative consumer organizations have the right to appear as parties in Commission antidumping and countervailing duty investigations. The Secretary will prepare a public service list containing the names and addresses of all persons, or their representatives, who are parties to the investigation.
BACKGROUND
On October 28, 1999, a petition was filed with the Commission and Commerce by Weirton Steel Corp., Weirton, WV; the United Steelworkers of America (USW), AFL-CIO; and the Independent Steelworkers Union (ISU), alleging that an industry in the United States is materially injured and threatened with material injury by reason of LTFV imports of tin- and chromium-coated steel sheet from Japan. Accordingly, effective October 28, 1999, the Commission instituted antidumping investigation No. 731-TA-860 (Preliminary).
Notice of the institution of the Commission’s investigation and of a public conference to be held in connection therewith was given by posting copies of the notice in the Office of the Secretary, U.S. International Trade Commission, Washington, DC, and by publishing the notice in the Federal Register of November 4, 1999 (64 FR 60225). The conference was held in Washington, DC, on November 18, 1999, and all persons who requested the opportunity were permitted to appear in person or by counsel.
’ The record is defined in sec. 207.2(f) of the Commission’s Rules of Practice and Procedure (19 CFR 0 207.2(f)).
Commissioner Crawford not participating.
1


VIEWS OF THE COMMISSION
Based on the record in this investigation, we find that there is a reasonable indication that an industry in the United States is materially injured by reason of imports of tin- and chromium-coated steel sheet from Japan that are allegedly sold in the United States at less than fair value (“LTFV”).’
I. THE LEGAL STANDARD FOR PRELIMINARY DETERMINATIONS
The legal standard for preliminary antidumping and countervailing duty determinations requires the Commission to determine, based upon the information available at the time of the preliminary determination, whether there is a reasonable indication that a domestic industry is materially injured, threatened with material injury, or whether the establishment of an industry is materially retarded, by reason of the allegedly unfairly traded imports.2 In applying this standard, the Commission weighs the evidence before it and determines whether “( 1) the record as a whole contains clear and convincing evidence that there is no material injury or threat of such injury; and (2) no likelihood exists that contrary evidence will arise in a final in~estigation.”~
11. DOMESTIC LIKE PRODUCT AND INDUSTRY
A. InGeneral
To determine whether there is a reasonable indication that an industry in the United States is materially injured or threatened with material injury by reason of imports of the subject merchandise, the Commission first defines the “domestic like product” and the “industry.yy4 Section 771(4)(A) of the Tariff Act of 1930, as amended (“the Act”), defines the relevant domestic industry as the “producers as a [wlhole of a domestic like product, or those producers whose collective output of a domestic like product constitutes a major proportion of the total domestic production of the pr~duct.”~ In turn, the Act defines “domestic like product” as “a product which is like, or in the absence of like, most similar in characteristics and uses with, the article subject to an investigation . . . .yy6
The decision regarding the appropriate domestic like product(s) in an investigation is a factual determination, and the Commission has applied the statutory standard of “like” or “most similar in characteristics and uses” on a case-by-case bask7 No single factor is dispositive, and the Commission
’ Commissioner Crawford did not participate in this determination.
19 U.S.C. 9 1673b(a); see also American Lamb Co. v. United States, 785 F.2d 994, 1001-1004 (Fed. Cir. 1986); Aristech Chemical Corn. v. United States, 20 CIT-, Slip Op. 96-5 1 at 4-6 (March 11, 1996).
States, 35 F.3d 1535, 1543 (Fed. Cir. 1994). American Lamb, 785 F.2d at 1001 (Fed. Cir. 1986); see also Texas Crushed Stone Co. v. United
19 U.S.C. 6 1677(4)(A).
19 U.S.C. 9 1677(4)(A).
19 U.S.C. 0 1677(10).
See, ex., NEC Corn. v. DeDarhnent of Commerce, Slip Op. 98-164 at 8 (CIT, Dec. 15, 1998); Nimon Steel Corn. v. United States, 19 CIT 450,455 (1995); Torrington Co. v. United States, 747 F.
(continued.. .)

may consider other factors it deems relevant based on the facts of a particular investigation.8 The Commission looks for clear dividing lines among possible like products and disregards minor variation^.^ Although the Commission must accept the determination of the Department of Commerce (“Commerce”) as to the scope of the imported merchandise allegedly subsidized or sold at LTFV, the Commission determines what domestic product is like the imported articles Commerce has identified.’O
B. Product Description
In its notice of institution, Commerce described the merchandise within the scope of the investigation as follows:
tin mill flat-rolled products that are coated or plated with tin, chromium or chromium oxides. Flat-rolled steel products coated with tin are known as tin plate. Flat-rolled steel products coated with chromium or chromium oxides are known as tin-free steel or electrolytic chromium-coated steel. The scope includes all the noted tin mill products regardless of thickness, width, form (in coils or cut sheets), coating type (electrolytic or otherwise), edge (trimmed, untrimmed or further processed, such [as] scroll cut), coating thickness, surface finish, temper, coating metal (tin, chromium, chromium oxide), reduction (single- or double-reduced), and whether or not coated with a plastic material. The merchandise subject to this investigation is classified in the Harmonized Tariff Schedule of the United States (“HTSUS”), under HTSUS subheadings 7210.1 1.0000, 72 10.12.0000,72 10.50.0000,72 12.10.0000, and 72 10.50.0000 [sic] if of non-alloy steel and under HTSUS subheadings 7225.99.0090, and 7226.99.0000 if of alloy steel. Although the subheadings are provided for convenience and Customs purposes, our
’ (...continued) Supp. 744, 749, n.3 (CIT 1990), affd, 938 F.2d 1278 (Fed. Cir. 1991) (“every like product determination ‘must be made on the particular record at issue’ and the ‘unique facts of each case’ ”). The Commission generally considers a number of factors including: (1) physical characteristics and uses; (2) interchangeability; (3) channels of distribution; (4) customer and producer perceptions of the products; ( 5 ) common manufacturing facilities, production processes and production employees; and, where appropriate, (6) price. See Nippon, 19 CIT at 455, n.4; Timken Co. v. United States, 913 F. Supp. 580, 584 (CIT 1996).
See, e.g., S. Rep. No. 96-249, at 90-91 (1979).
Nipuon Steel, 19 CIT at 455; Torrington, 747 F. Supp. at 748-49. See also S. Rep. No. 96-249, at 90-91 (1979) (Congress has indicated that the like product standard should not be interpreted in “such a narrow fashion as to permit minor differences in physical characteristics or uses to lead to the conclusion that the product and article are not ‘like’ each other, nor should the definition of ‘like product’ be interpreted in such a fashion as to prevent consideration of an industry adversely affected by the imports under consideration.”).
lo Hosiden Corn. v. Advanced Display Mfrs., 85 F.3d 1561, 1568 (Fed. Cir. 1996) (Commission may find single like product corresponding to several different classes or kinds defined by Commerce); Torrinsrlon, 747 F. Supp. at 748-752 (affirming Commission determination of six like products in investigations where Commerce found five classes or kinds).
l 1 This second reference to HTSUS subheading 7210.50.0000 appears to be a misprint in the published notice. Commerce may have intended to refer instead to HTSUS subheading 72 12.50.0000.
4

written description of the scope of this investigation is dispositive.12
C. Domestic Like Product Issues
Petitioners argue that tin- and chromium-coated steel sheet represent a single domestic like product. Respondents urge the Commission to adopt this view for the preliminary determination, but to revisit the issue in the final determination. Based on the record developed in the preliminary phase of this investigation, we determine that there is a single like product covering both tin- and chromium- coated steel sheet.
Tin-coated and chromium-coated steel sheet are physically similar in that they consist of a flat steel substrate covered by a layer of another metal, and are generally sold in similar thicknesses, widths, coating thicknesses, tempers, and surface finishes.13 They are both used primarily in the production of metal cans for storing food, paints, and other substance~.’~ Although tin- and chromium-coated steel sheet are rarely interchanged in particular applications, they are theoretically interchangeable. The channels of distribution are the same - direct from the manufacturer to customers who fabricate the steel sheet into consumer coated steel, using the same production facilities, workers, and production process.16 The record at this stage contains little information on customer perceptions, but we note that both the producers and customers group tin- and chromium-coated steel into a single class of “tin mill produ~ts.”’~ Finally, there is some overlap in prices.18 Accordingly, we find for the purposes of this preliminary determination that tin- and chromium-coated steel sheet form a single like product.lg
Most companies that produce tin-coated steel also produce chromium-
D. Domestic Industry and Related Parties
The domestic industry is defined as “the producers as a [wlhole of a domestic like product. . .
Notice of Initiation, 64 Fed. Reg. 66892, 66893 (Nov. 30, 1999).
l3 American Iron & Steel Institute, Steel Products Manual covering Tin Mill Products, at 13-18, Petition, Exh. 2. Tin-coated steel sheet is also available in differential coating thicknesses, with one side having a thicker coating than the other. This option is apparently unavailable for chromium-coated steel sheet. Id. at 18.
l4 Confidential Report (“CR’) at 1-2, Public Report (“PR’) at 1-2. Although tin-coated steel may be disfavored for some canning applications, most notably cans for soft drinks and beer, the similarities in the uses of tin- and chromium-coated steel appear at this stage in the investigation to outweigh the differences.
l5 CR at 11-1, PR at 11-1.
l6 CR at 1-2 - 1-3, PR at 1-2; Tr. at 57 (Riderer), Tr. at 10 (Schagrin).
l7 See, ez., Petitioners’ postconference brief at 3, Tr. at 76 (Rourke).
l8 The tin-coated steel sheet, represented by products 1 and 2, ranged in price from * * * per short ton, while chromium-coated product 3 ranged from * * per short ton. CR, Tables V-1, V-2, and V-3.
We note that the record contains somewhat limited evidence related to the six factors of the domestic like product analysis. We intend to seek more data on these issues in the final phase of the investigation. Based on the data received, we will reexamine our preliminary finding on the domestic like product.
5

.”20 In defining the domestic industry, the Commission’s general practice has been to include in the industry all of the domestic production of the like product, whether toll-produced, captively consumed, or sold in the domestic merchant market.2’ Based on our finding that the domestic like product consists of both tin- and chromium-coated steel sheet, we conclude that the domestic industry consists of all domestic producers of that merchandise.
We must further determine whether any producer of the domestic like product should be excluded from the domestic industry pursuant to section 771(4)(B) of the Act. That provision of the statute allows the Commission, if appropriate circumstances exist, to exclude from the domestic industry producers that are related to an exporter or importer of subject merchandise or which are themselves importersF2 Exclusion of such a producer is within the Commission’s discretion based upon the facts presented in each case.23
National Steel is 70 percent owned by NKK Corp., a foreign producer and exporter of the subject merchandise from Japan.24 Accordingly, National Steel is a related party. However, we find that appropriate circumstances do not exist to exclude National Steel from the domestic industry. National Steel is a major producer of the domestic like product, did not import any subject merchandise fkom Japan during the period examined, and * * *, which demonstrates that its primary interest lies with
2o 19 U.S.C. 8 1677(4)(A).
21 See United States Steel Group v. United States, 873 F. Supp. 673,681-84 (CIT 1994), afrd, 96
22 19 U.S.C. 0 1677(4)(B).
23 Sandvik AB v. United States, 721 F. Supp. 1322, 1331-32 (CIT 1989), aff d without opinion, 904 F.2d 46 (Fed. Cir. 1990); Empire Plow Co. v. United States, 675 F. Supp. 1348, 1352 (CIT 1987). The primary factors the Commission has examined in deciding whether appropriate circumstances exist to exclude the related parties include: (1) the percentage of domestic production attributable to the importing producer; (2) the reason the U.S. producer has decided to import the product subject to investigation, i.e., whether the firm benefits from the LTFV sales or subsidies or whether the firm must import in order to enable it to continue production and compete in the U.S. market; and (3) the position of the related producers vis-a-vis the rest of the industry, i.e., whether inclusion or exclusion of the related party will skew the data for the rest of the industry. See, e.g., Torrington Co. v. United States, 790 F. Supp. 1161, 1168 (CIT 1992), affd without opinion, 991 F.2d 809 (Fed. Cir. 1993). The Commission has also considered the ratio of import shipments to U.S. production for related producers and whether the primary interests of the related producers lie in domestic production or in importation. See. e.g., Melamine Institutional Dinnerware from China, Indonesia, and Taiwan, Invs. Nos. 73 1-TA- 741-743 (Final), USITC Pub. 3016 (Feb. 1997) at 14, n.81.
24 Petition at 4; CR at 111- 1, PR at 111-1. The Commission has previously decided that “control does not exist, absent evidence to the contrary, if the ownership interest is less than that necessary, in and of itself, to establish control.” Certain Structural Steel Beams From Germany, Japan. Korea, and Spain, Invs. Nos. 701-TA-401 & 731-TA-852-855 (Prelim.), USITC Pub. 3225 at 8, n. 40 (Sept. 1999); see - also Engineered Process Gas Turbo-Compressor Systems from Japan, Inv. No. 73 1 -TA-748 (Prelim.), USITC Pub. 2976 at 8 (July 1996). NKK’s 70 percent interest in National Steel appears to be enough, by
F.3d 1352 (Fed. Cir. 1996).
itself, to constitute control.
6

domestic product i~n .~~
Another importer of the subject merchandise owns a portion of the shares of Ohio Coatings, a domestic producer of the like product. However, we find that this ownership interest is * * *,26 * * *.27
Since the record contains no additional information demonstrating direct or indirect control by the importer over the company, we find that Ohio Coatings is not a related party.”
111. REASONABLE INDICATION OF MATERIAL INJURY BY REASON OF ALLEGEDLY LTFV IMPORTS
In the preliminary phase of antidumping or countervailing duty investigations, the Commission determines whether there is a reasonable indication that an industry in the United States is materially injured by reason of the imports under inve~tigation.’~ In making this determination, the Commission must consider the volume of imports, their effect on prices for the domestic like product, and their impact on domestic producers of the domestic like product, but only in the context of U.S. production operation~.~’ The statute defines “material injury” as “harm which is not inconsequential, immaterial, or unimp~rtant.”~’ In assessing whether there is a reasonable indication that the domestic industry is materially injured by reason of subject imports, we consider all relevant economic factors that bear on the state of the industry in the United States.32 No single factor is dispositive, and all relevant factors are considered “within the context of the business cycle and conditions of competition that are distinctive to the affected ind~stry.”~’
For the reasons discussed below, we determine that there is a reasonable indication that the domestic industry producing tin- and chromium-coated steel sheet is materially injured by reason of subject imports from Japan that are allegedly sold in the United States at less than fair value.
2s CR & PRY Table 111-1. We note further that National Steel’s financial results were * * * and included * * *. CR & PRY Table VI-3. Therefore, it appears that the relationship with NKK has not shielded National from any injury caused by imports and that including the company in the domestic industry will not skew the aggregate results.
26 CR at 111-1.
27 See Black’s Law Dictionary, 6& ed., at * * *. 28 Even if some aspect of the importer’s ownership interest allowed it to exercise direct or indirect
control, appropriate circumstances do not exist to exclude the company from the domestic industry. Ohio Coatings * * *, suggesting that its primary interest lies with domestic production. While the financial results of Ohio Coatings * * *, there was no evidence that the relationship with the importer conveyed some benefit to the company. We further note that the company was * * *.
29 19 U.S.C. 0 1671b(a) and 1673b(a).
30 19 U.S.C. 9 1677(7)(B)(i). The Commission “may consider such other economic factors as are relevant to the determination” but shall “identify each [such] factor . . . [alnd explain in full its relevance to the determination.” 19 U.S.C. 0 1677(7)(B). See also Angus Chemical Co. v. United States, 140 F.3d 1478 (Fed. Cir. 1998).
31 19 U.S.C. 0 1677(7)(A).
32 19 U.S.C. 6 1677(7)(C)(iii).
33 19 U.S.C. 0 1677(7)(C)(iii).
7

A. Conditions of Competition
We find several conditions of competition relevant to this investigation.
First, demand in the canning industry is a function of the supply of the agricultural goods used for canned foods.34 Demand, as measured by apparent domestic consumption, increased from 3,894,357 short tons (“ST”) in 1996 to 3,943,949 ST in 1997, then decreased to 3,728,847 ST in 1998. However, the 2,991,774 ST of consumption in the first three quarters of 1999 represented an increase over the 2,890,015 ST consumed in the same period in 1998.
Second, tin- and chromium-coated steel sheet are almost always sold in the United States pursuant to annual contracts that establish fixed prices and a target volume. Purchasers typically negotiate contracts with both domestic producers and importers on a calendar year basis, with discussions beginning in the fourth quarter of the year before the contract takes effect, and often continuing into the following year.35 In some circumstances, the price may change during the course of a contract.36 Contractual volume arrangements may be more flexible, and might allow purchasers to shift a portion of their orders to lower cost suppliers even after a contract is entered into.37
Third, the domestic c,anning industry, which accounts for the vast majority of purchases of tin- and chromium-coated steel sheet, has consolidated in recent years.38 The seven largest purchasers now account for approximately three-quarters of apparent domestic consumption of tin- and chromium-coated steel previously had, which they have used to obtain lower prices from their suppliers.4O
These developments have given the largest purchasers greater market power than they
Fourth, reliability in meeting delivery schedules is highly important to US. purchasers, since food must be canned as soon as possible after it reaches the canning facility. Purchasers also value
34 CR at 11-3, PR at 11-2.
35 CR at V-2, PR at V-2. The record shows that negotiations may sometimes continue into the second quarter of the year in which the contract is supposed to take effect. Letter from Bethlehem Steel Corp. to the Commission at 1 (Dec. 9, 1999).
36 Letter from Kirkland & Ellis to the Commission at 1-2 (Nov. 23, 1999).
37 CR at V-2, PR at V-2. The record contains limited information on the nature and terms of these contracts. We intend to gather further information in the final phase of this investigation on the process of negotiating annual contracts, the extent to which purchasers negotiate at the same time with domestic producers and foreign producers or importers, whether prices may be changed during the course of a contract, whether purchasers are permitted to disregard volume targets, and other topics relevant to our determination.
38 CR at 11- 1, PR at 11- 1. The extent of consolidation which occurred during the period reviewed is
39 Postconference brief of Kawasaki Steel Corp., Nippon Steel Corp., and Toyo Kohan Co., Ltd. at 4
40 Petitioners’ postconference brief at 19; Kawasaki postconference brief at 5-6. In the final phase of
unclear.
(“Kawasaki postconference brief”), CR & PR, Table IV-2.
the investigation, we will examine further any relationship between consolidation and price declines.
8

suppliers’ ability to respond quickly to changes in their needs.‘“ Since domestic producers are typically closer than foreign suppliers to domestic customers, they are better able to meet this need and, consequently, generally maintain a consistent price premium over imported rnerchandi~e.~’
Fifth, several of the major purchasers operate canning facilities on the grounds of Weirton’s West Virginia mill. In addition to making rental payments, these companies agree that their Weirton canning plants will buy a certain minimum volume of steel from Weirton, and will not use steel from any foreign source.43 The parties agree that this arrangement shelters Weirton from import competition to some extent.44
Sixth, nonsubject imports entered the market in large volumes throughout the investigation period, and held a greater market share than did imports from Japan for most of that time. However, subject imports grew at a faster rate, and by the end of the period held a greater market share, than all other sources combined.45
Finally, most producers of the domestic like product are located on the East Coast or in the Midwest, and tend to focus their sales in the regions close to their steel mills. As a result, few domestic producers ship to the West Coast. Many purchasers in that region buy subject imports from ports of entry that are closer to their facilities than are the domestic producer^.^^ Shipments into West Coast ports accounted for approximately 30 percent of imports from Japan in 1999.47
B. Volume
Section 771(7)(C)(i) of the Act provides that the “Commission shall consider whether the volume of imports of the merchandise, or any increase in that volume, either in absolute terms or relative to production or consumption in the United States, is ~ignificant.”~~ After staying roughly stable from 1996 to 1997, the volume of the subject imports grew both in terms of units shipped and market share in 1998 and interim 1999, with the rate of increase at its highest point in interim 1999.49 At the same time, the volume of the shipments and market share of the domestic producers showed the opposite trend,
41 CR at 11-3 - 11-4, PR at 11-2.
42 Tr. at 103 (Rourke & Yurco).
43 Petitioners’ postconference brief at 16.
44 Petitioners’ postconference brief at 16, Kawasaki postconference brief at 13,
45 CR & PR, Tables IV-2 & C-1 . 46 CR at 11-1 & 11-4, PR at 11-1 & 11-3.
47 CR & PR, Table IV-2, Petitioners’ postconference brief, Exh. 9.
48 19 U.S.C. 0 1677(7)(C)(i).
49 Subject imports grew from 199,196 ST in 1996 to 23 1,507 ST in 1998, with 174,153 ST in interim period 1998 and 265,382 ST in interim period 1999. These figures gave subject imports a 5.1 percent market share in 1996 and 1997, which grew to 6.2 percent in 1998, and was 8.9 percent in the first three quarters of 1999. CR & PRY Table IV-2. The value of subject imports also increased, from $134.1 million in 1996 to $159.0 million in 1998, with interim period values of $120.4 million in 1998 and $161.9 million in 1999. CR & PR Table IV-1, Table C-1.
9

falling in 1998 and interim 1999, with the rate of decrease highest in interim 1999.”
We find a reasonable indication that both the volume of subject imports and the increase in the volume of subject imports are ~ignificant.~~ Nevertheless, we note that there are several market conditions that may limit this significance, such as the concentration of imports from Japan in geographical areas that may be underserved by domestic producers, the extent to which domestic producers were unable to meet customers’ demands for timely delivery, the nature of contractual negotiations, and purchasing restrictions in Weirton Steel’s agreements with certain customers. We intend to investigate these issues further in the final phase of this investigation.
C. Price Effects of the Subiect Imports
Section 771(7)(C)(ii) of the Act provides that, in evaluating the price effects of the subject imports, the Commission shall consider whether -
(I) there has been significant price underselling by the imported merchandise as compared with the price of domestic like products of the United States, and
(11) the effect of imports of such merchandise otherwise depresses prices to a significant degree or prevents price increases, which otherwise would have occurred, to a significant degree. 52
The domestic like product and subject merchandise appear to be good substitutes for each other. Although there are a small number of niche products that may only be available from Japanese producers, these represent a small portion of the apparent domestic cons~mption.~~ Otherwise, the record in this preliminary investigation indicates that U.S. producers are capable of producing all of the products that Japanese producers sell in the United States.54
The record evidence on pricing in this preliminary phase is limited. Most importantly, we have little information on the negotiation and operation of annual supply contracts. Testimony by the parties provides conflicting evidence on whether the timing of negotiations allows purchasers to use prices for
50 U.S. producers’ domestic shipments began at 3,449,673 ST in 1996, rose slightly to 3,505,828 ST in 1997, and then fell to 3,247,236 ST in 1998. Interim period 1999 showed a decrease to 2,469,615 ST, from 2,528,210 ST in interim period 1998. The domestic industry’s market share rose from 88.6 percent in 1996 to 88.9 percent in 1997, and then fell to 87.1 percent in 1998. The interim periods saw a steeper fall, from 87.5 percent in the first three quarters of 1998 to 82.5 percent in the first three quarters of 1999. CR & PR, Table IV-2, Table C-1.
planned orders from domestic producers to importers who promised lower prices in their annual contracts. If this occurred, it would suggest that annual contracts negotiated at the end of 1998 and during 1999 had a continuing effect on the domestic industry’s shipment volume throughout 1999. We intend to investigate this allegation further in the final phase of this investigation.
51 Petitioners allege that the volume of subject imports grew in 1999 because customers shifted their
52 19 U.S.C. 0 1677(7)(C)(ii).
53 CR at 1-3, PR at 1-2.
54 Tr. at 99 (Yurco & Rourke).
10

imports from Japan to obtain price concessions from their domestic su~p l i e r s .~~ As indicated above, we intend to examine closely the contract negotiating process, including the role played by nonsubject imports, in the final phase of this investigation.
In addition, the product-specific pricing information gathered by the staff has significant limitations. The three products for which Petitioners requested pricing information account for less than five percent of the volume of subject imports, and yielded a relatively small number of comparisons with products sold by the domestic industry.56 Thus, overall, the products in question do not appear to be fully representative of competition between domestic and Japanese mer~handise.~~ We note, however, that there were some sales of product 3 from both the United States and Japan, and that the subject imports undersold domestic merchandise in a large majority of the corn par is on^.^^
We were unable to place any significant weight on allegations of lost sales and lost revenues. As initially presented in the petition, the allegations lacked certain basic inf~rmation.~~ Although Petitioners supplemented the allegations two weeks later,60 the delay hindered our investigation, such that we were
55 Purchasers take conflicting positions on this issue. Some large purchasers testified that negotiations with foreign suppliers take place only after purchasers finish their negotiations with domestic suppliers. Tr. at 94 (Yurco), Letter from BWAY Corp. to the Commission at 2 (Nov. 23, 1999). However, another domestic purchaser reports that it compares bids from domestic and foreign suppliers and allocates its orders based on their relative competitiveness. See Declaration of * * * at 5-6, - in Letter from Howrey & Simon to the Commission (Nov. 23, 1999). Domestic producers provided information indicating that negotiations sometimes continue into the second quarter of the year in which prices take effect. Given the long lead times for purchases from foreign sources, Petitioners believe that purchasers would have to have completed their negotiations with Japanese suppliers long before this time to ensure timely delivery. Bethlehem Letter at 1.
56 CR at V-4, Tables V-1 - V-3, PR at V-3, Tables V-1 - V-3.
57 Petitioners have suggested that the Commission use a broader set of products in the final phase of
’* CR & PRY Table V-3. Domestic producers’ prices for product 3 also declined over the
the investigation. Petitioners’ postconference brief at 14, n. 13.
investigation period. However, prices for domestically produced product 1 declined at an even greater rate, even though questionnaire data show * * * sales of product 1 by subject imports. CR & PR, Table v-2.
59 Two of the five allegations consisted exclusively of a customer name and quantity, while the remainder consisted exclusively of customer names. See Petition at 24, n. 17. None contained contact names or transaction dates. The allegations were not sufficiently detailed for us to obtain confirmation or denial of the allegations from customers. Incomplete allegations or allegations that are made too late in the investigative process for us to investigate will typically be given little or no weight in our preliminary determination. The petition should include enough information to enable us to contact the purchaser at issue and to enable the purchaser to comment on the accuracy of the allegation.
6o - See Letter from Petitioners to the Commission, Exhibit (Nov. 12, 1999). This letter also contained an allegation of lost revenue on sales to * * * that had not been referenced in the Petition. In accordance with Commission practice, we disregarded this allegation. Elastic Rubber Tape from India, Invs. Nos. 701-TA-383 and 731-TA-805 (Preliminary), USITC Pub. 3133 at 11-12 n.73 (Oct. 1998) (disregarding new allegations contained in questionnaire responses); Dynamic Random Access Memory
(continued.. .)
11

unable to investigate all of the allegations.61 Of the three allegations that we checked, two could not be confirmed.62
We also considered the average unit values of imports and shipments of domestic merchandise. The average unit value for imports from Japan declined by 1 1.8 percent in the first three quarters of 1999, as compared with 1998.63 Two major Japanese importers testified that their mix of imported products did not change during the investigation period, which suggests that overall price levels for imported merchandise were declining.64 Over the same periods, the average unit values for nonsubject imports and domestic merchandise both declined to a lesser degree, with the domestic merchandise declining least of all.65
Finally, the record shows that although unit production costs decreased by approximately one percent in 1999, unit revenues declined by 4.6 percent.66 This suggests that subject imports, which entered at falling prices, prevented the domestic industry from maintaining prices at the level necessary to cover all of its production costs.
Domestic producers’ announcement of a 3.75 percent price increase for the year 2000 contracts may suggest evidence of a price re~overy.~’ However, the record indicates that customers often refuse to
6o (...continued) Semiconductors Of One Megabit and Above From Taiwan, Inv. No. 73 1 -TA-8 1 1 (Preliminary), USITC Pub. 3149 at 19, n. 117 (Dec. 1998) (disregarding new allegations contained in questionnaire responses).
CR at V-11 - V-12, PR at V-7.
62 CR at V-11 - V-12, PR at V-7. * * *. 63 CR & PR, Table C-1 . The fact that the average unit value of Japanese merchandise for the first
three quarters of 1998 was greater than the average for the full year suggests that prices began to decline in the fourth quarter of 1998.
64 Tr. at 104-105 (Sessions & Peak). Respondents submitted a declaration by Thomas Yurco of U.S. Can that contradicted this testimony by stating that U.S. Can began to purchase less costly tin mill products from Japan in 1999. Kawasaki postconference brief at 43 & Exh. 11. We will attempt to resolve this contradiction in the final phase of this investigation by investigating the mixture of goods that US. and Japanese producers sold in the United States during the investigation period. In the final phase of this investigation, we will also examine the extent to which higher unit values for subject imports than for the domestic like product reflect differences in the mix of products sold in the United States by US. and Japanese producers, which would indicate a lower degree of substitutability between the subject merchandise and the domestic like product.
65 CR & PR, Table C- 1. We note that the decline in average unit values for all sources of tin- and chromium-coated steel sheet may be due in some part to consolidation of the purchasers in the canning industry and to cyclical changes in the supply of agricultural products. We intend to examine these possibilities in the final phase of this investigation.
in 1996, decreased to 96.5 percent in 1997, then increased again in 1998, to 98 percent. For the interim periods, that ratio was 96.6 percent in 1998 and increased yet again in interim 1999, to 100.4 percent.
66 CR & PR, Table VI-2. We note further that the ratio of cost of goods sold to sales was 98.8 percent
67 Tr. at 30 (Davis).
12

accept announced increases.68 Even if fully realized, the price increase would not recover the 4.1 percent decline in domestic producers’ average unit values in the first three quarters of 1999.69 Therefore, we cannot conclude on this preliminary record that the announced price increase is proof that prices are not being suppressed or depressed to a significant degree by the subject imports.
Based on these considerations and the other evidence on the administrative record, we find a reasonable indication that there has been significant price underselling by subject merchandise, and that the significant volume of subject imports has depressed prices and prevented increases in prices that would otherwise have occurred to a significant degree.
D. Impact
In examining the impact of the subject imports on the domestic industry, we consider all relevant economic factors that bear on the state of the industry in the United States.70 These factors include output, sales, inventories, capacity utilization, market share, employment, wages, productivity, profits, cash flow, return on investment, ability to raise capital, and research and development. No single factor is dispositive and all relevant factors are considered “within the context of the business cycle and conditions of competition that are distinctive to the affected ind~stry.”~’ 72 73
The domestic industry’s financial performance was poor throughout the investigation period, with the worst results occurring in the first three quarters of 1999, when imports increased. Revenues increased slightly from $2.18 billion in 1996 to $2.30 billion in 1997, then declined to $2.1 1 billion in 1998.74 This figure subsequently declined again, falling from $1.64 billion in interim period 1998 to $1.55 billion in interim period 1999. The industry registered negative operating margins throughout the investigation period: -3.2 percent in 1996, -1 .O percent in 1997, and -3.2 percent in 1998, with - 1.7
68 For example, Weirton announced a 2.8 percent price increase in 1997, but average unit values for
69 CR & PR, Table (2-3. 70
the industry decreased by 1.1 percent. Tr. at 30 (Davis), CR & PR, Table C-3.
19 U.S.C. 6 1677(7)(C)(iii). See also SAA at 851 and 885 (“In material injury determinations, the Commission considers, in addition to imports, other factors that may be contributing to overall injury. While these factors, in some cases, may account for the injury to the domestic industry, they also may demonstrate that an industry is facing difficulties from a variety of sources and is vulnerable to dumped or subsidized imports.” Id. at 885.).
71 19 U.S.C. 0 1677(7)(C)(iii). See also SAA at 851 and 885 and Live Cattle from Canada and Mexico, Invs. Nos. 701-TA-386 and 731-TA-812-813 (Preliminary), USITC Pub. 3155 (Feb. 1999) at 25,n.148.
72 The statute instructs the Commission to consider the “magnitude of the dumping margin” in an antidumping proceeding as part of its consideration of the impact of imports. 19 U.S.C. 0 1677(7)(C)(iii) (V). In its notice of initiation, Commerce stated that the estimated dumping margins were between 0.78 and 95.29 percent. 64 Fed. Reg. 66892,66894 (Nov. 30, 1999).
dumping to be of particular significance in evaluating the effects of subject imports on domestic producers. Inv. No. 731-TA-731 (Final), USITC Pub. 2968 (June 1996).
73 Chairman Bragg notes that she does not ordinarily consider the magnitude of the margin of
Separate and Dissenting Views of Commissioner Lynn M. Bragg in Bicycles from China,
74 CR & PR, Table VI- 1.
13

percent in interim period 1998 and -5.6 percent in interim period 1 999.75 Production increased slightly from 1996 to 1997, then fell in 1998 and remained relatively stable in interim 1999, as compared to interim 1998.76 Capacity utilization followed the same pattern, starting at 76.5 percent in 1996 and falling to 70.1 percent in 1998, and 68.8 percent in the first three quarters of 1998 and 1999.77 Industry employment dropped substantially, by more than 10 percent from 1997 to 1998, and a further seven percent between interim 1998 and 1 999.78
We find that there is a reasonable indication that the subject imports are having a negative impact on the domestic industry. As noted above, there is a reasonable indication that subject imports depressed and suppressed domestic prices and are, in part, responsible for the decrease in domestic producers’ average unit values in 1998 and 1999. Furthermore, the subject imports have taken volume and market share from the domestic producers, which contributed to the reduction in industry revenues and employment. Accordingly, we find that the record of the preliminary phase of this investigation indicates that there is a reasonable indication that the subject imports have had a significant impact on the domestic industry’s condition.
CONCLUSION
For the reasons stated above, we determine that there is a reasonable indication that an industry in the United States is materially injured or threatened with material injury by reason of imports of tin- and chromium-coated steel sheet from Japan that are allegedly sold in the United States at less than fair value.
75 CR & PR, Table VI-1. These figures reflect operating losses beginning at $70 million in 1996, improving to $24 million in losses in 1997, then falling back to $67 million in losses in 1998. In the first three quarters of 1999, the domestic producers have already suffered a $87 million operating loss, more than in all four quarters of the preceding year.
fell to 3,386,077 in 1998. Production stayed approximately the same in the interim periods - 2,622,710 in the first three quarters of 1998 and 2,637,672 in the same period in 1999.
76 CR & PR, Table 111-2. Production began at 3,630,128 ST in 1996, grew to 3,677,762 in 1997, then
77 CR& PR, Table 111-2.
78 CR & PR, Table 111-2.
14

PART I: INTRODUCTION
BACKGROUND
This investigation was instituted in response to a petition filed by counsel for Weirton, Weirton, WV; the USW; and the ISU on October 28, 1999, alleging that an industry in the United States is materially injured and threatened with material injury by reason of LTFV imports of tin- and chromium- coated steel sheet (TCCSS) from Japan.’ Information relating to the background of the investigation is provided below.2
Date
October 28, 1999 . . .
November 18, 1999 . November 30,1999 . December 13, 1999 . December 13, 1999 .
Action
Petition filed with Commerce and the Commission; institution of Commission
Commission’s conference3 Commerce’s notice of initiation (64 FR 66892, November 30, 1999) Commission’s vote Commission’s determination transmitted to Commerce
investigation (64 FR 60225, November 4, 1999)
TCCSS has not been the subject of any previous Commission investigation.
ALLEGATIONS OF LTFV SALES
Petitioners calculated normal, or “fair,” values for the Japanese product on the basis of Nippon Steel’s home-market prices in June 1999. (Nippon Steel is one of 4 producers in Japan, including Kawasaki, NKK, and Toyo Kohan). Actual values were calculated on the basis of US. customs values at the ports of entry for HTS subheadings 7210.12.00 and 7210.50.00 during the same period. The petitioners’ weighted-average dumping margins were 86.52 percent for tin-coated steel sheet, 3.76 percent for chromium-coated steel sheet, and 62.97 percent overall.
’ For purposes of this investigation, TCCSS is tin-coated steel sheet (TCSS) and chromium- or chromium oxide- coated steel sheet (CCSS) regardless of thickness, width, form (coils, cut sheets, or other), coating application (electrolytic or other), edge (trimmed, untrimmed, or further processed), coating thickness, temper, surface finish, reduction (single- or double-reduced), and whether or not coated with a plastic material. It is classified in the HTS under subheadings 7210.1 1.00 and 7210.12.00 (tin-coated non-alloy steel sheet 24 inches or more in width), 7210.50.00 (chromium- and chromium oxide-coated non-alloy steel sheet 24 inches or more in width), 7212.10.00 (tin-coated non-alloy steel sheet under 24 inches in width), 7212.50.00 (chromium- and chromium oxide-coated (and otherwise coated) non-alloy steel sheet under 24 inches in width), 7225.99.00 (tin- and chromium-coated alloy steel sheet 24 inches or more in width), and 7226.99.00 (tin- and chromium-coated alloy steel sheet under 24 inches in width). The general rates of duty for these subheadings, applicable to Japan, range from 2.1 percent ad valorem to 3.9 percent ad valorem.
Federal Register notices cited in the tabulation are presented in app. A.
A list of witnesses appearing at the conference is presented in app. B.
I- 1

SUMMARY DATA
A summary of data collected in the investigation is presented in appendix C, table C-1. U.S. industry data are based on questionnaire responses of U.S. producers representing 100 percent of the subject product’s production in the United States during the period for which data were collected (January 1996-September 1999). Data for U.S. imports are based on official statistics of Commerce.
THE PRODUCT
TCCSS is an intermediate product available in a range of varieties and is primarily used to manufacture containers and caps of containers for both food and non-food products. Referred to in the industry as “tin mill products,” it consists of two major components: tin-coated steel sheet (TCSS), otherwise known as “tin plate,” and chromium-coated steel sheet (CCSS), otherwise known as “tin free steel.” Although for many applications TCSS and CCSS are technically interchangeable, they are not used interchangeably. CCSS is more corrosion-resistant than TCSS and is generally used where additional resistance is desired, such as for beer and soft drinks where the containers must withstand the corrosive effects of carbonation. TCSS and CCSS also have slightly different surface characteristics that may appeal to different customers because of the way the surface appears with or accepts the company’s printed graphics. Otherwise, TCSS and CCSS are produced in identical manner, often by the same producer with the same equipment, and are often sold to the same end users. U.S. producers’ sales to container manufacturers are usually direct: whereas foreign producers’ sales are usually through their U.S. import affiliates or through other independent importers. Sales are normally on a contractual basis for the calendar year.
cold-rolled (cold-reduced) to approximate the user’s desired thickness (generally 0.5 rnm or less), followed by annealing (heat treating) and then either temper rolling, which improves flatness and stiffness, or a second cold-reduction, which in addition to flatness and stiffness also improves strength. After trimming to the user’s desired width (generally over 24 inches), the sheets are electroplated with either tin or chromium (including chromium oxide) in various weights to suit the user’s specific container. A variety of thicknesses, widths, coating thicknesses, tempers, surface finishes, etc. are available, and U.S. producers and importers report no major changes in the types or proportional mix of these varieties for the period of investigation.
ASTM and the AISI, and both the Japanese- and U.S.-produced products conform to these specifications. For the bulk of U.S. consumers’ needs, a full range of product is available from both countries; however, for a small portion of the market, estimated at less than one percent, the subject product is only available from Japan and/or other foreign sources. Such specialized applications are mainly for CCSS and include products such as canisters for 35mm film. Although materials such as aluminum, glass, and plastic serve similar uses in the container industry, producers and importers report no major shifts to these products in recent periods, and there are currently no steel-based alternatives in the industry to tin- and chromium- coated steel plate.
To manufacture TCSS and CCSS, strips of hot-rolled sheet,5 1.6 mm to 2.5 mm thick, are first
TCCSS for U.S. consumption is produced in accordance with published specifications of the
A small quantity of U.S.-produced TCCSS is sold through distributors. Virtually all of the subject product is made from carbon steel.
1-2
PART 11: CONDITIONS OF COMPETITION IN THE U.S. MARKET
MARKET SEGMENTS AND CHANNELS OF DISTRIBUTION
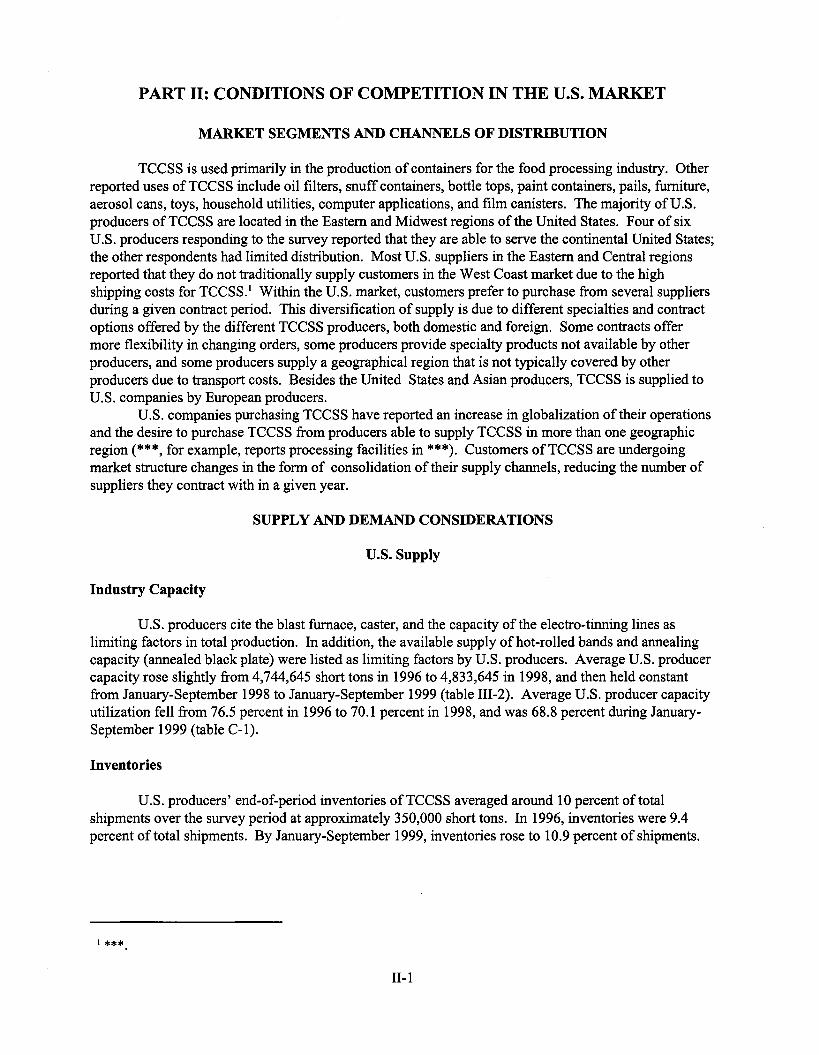
TCCSS is used primarily in the production of containers for the food processing industry. Other reported uses of TCCSS include oil filters, snuff containers, bottle tops, paint containers, pails, furniture, aerosol cans, toys, household utilities, computer applications, and film canisters. The majority of U.S. producers of TCCSS are located in the Eastern and Midwest regions of the United States. Four of six U.S. producers responding to the survey reported that they are able to serve the continental United States; the other respondents had limited distribution. Most U.S. suppliers in the Eastern and Central regions reported that they do not traditionally supply customers in the West Coast market due to the high shipping costs for TCCSS.' Within the U.S. market, customers prefer to purchase from several suppliers during a given contract period. This diversification of supply is due to different specialties and contract options offered by the different TCCSS producers, both domestic and foreign. Some contracts offer more flexibility in changing orders, some producers provide specialty products not available by other producers, and some producers supply a geographical region that is not typically covered by other producers due to transport costs. Besides the United States and Asian producers, TCCSS is supplied to U.S. companies by European producers.
and the desire to purchase TCCSS from producers able to supply TCCSS in more than one geographic region (***, for example, reports processing facilities in ***). Customers of TCCSS are undergoing market structure changes in the form of consolidation of their supply channels, reducing the number of suppliers they contract with in a given year.
US. companies purchasing TCCSS have reported an increase in globalization of their operations
SUPPLY AND DEMAND CONSIDERATIONS
U.S. Supply
Industry Capacity
U.S. producers cite the blast furnace, caster, and the capacity of the electro-tinning lines as limiting factors in total production. In addition, the available supply of hot-rolled bands and annealing capacity (annealed black plate) were listed as limiting factors by U.S. producers. Average U.S. producer capacity rose slightly from 4,744,645 short tons in 1996 to 4,833,645 in 1998, and then held constant from January-September 1998 to January-September 1999 (table 111-2). Average U.S. producer capacity utilization fell from 76.5 percent in 1996 to 70.1 percent in 1998, and was 68.8 percent during January- September 1999 (table C-1).
Inventories
U.S. producers' end-of-period inventories of TCCSS averaged around 10 percent of total shipments over the survey period at approximately 350,000 short tons. In 1996, inventories were 9.4 percent of total shipments. By January-September 1999, inventories rose to 10.9 percent of shipments.
I ***

Production Alternatives
U.S. producers reported using plant, equipment, and labor for alternative products. Alternative products listed by U.S. producers include black plate, cold-rolled products, galvanized steel, electro-zinc, and corrosion resistant sheet. These alternative products are produced using the same equipment and labor that is used in the production of TCCSS.
Export Markets
Exports of U.S.-produced TCCSS have been small relative to domestic sales, averaging 5.6 percent of domestic shipments during 1996-98. A total of 190,482 short tons were exported in 1996. That quantity rose to 195,999 in 1998, and then increased from 137,063 short tons in January-September 1998 to 174,470 in January-September 1999.
U.S. Demand
Demand Characteristics
Fluctuations in supply of agricultural commodities has cyclical effects on demand for TCCSS used by food can makers, according to representatives of the US. food processing industry and US. producers.* Demand for TCCSS is predominantly derived from the demand for containers used in the food processing industry. In turn, the demand for food containers is dependent on the annual supply of vegetable and h i t crops in the United States and on consumer demand for processed food products.
Substitute Products
Three U.S. producers cited flat U.S. demand for TCCSS since 1996. One U.S. producer cited a decrease in U.S. demand for TCCSS, citing substitute products as the source of decreased demand. Substitutes for TCCSS were listed by questionnaire respondents. These substitute products include aluminum, paper, plastic, glass, and Mylar.
SUBSTITUTABILITY ISSUES
Factors Affecting Purchasing Decisions
Questionnaire respondents reported that TCCSS produced in the United States, Japan, and other foreign sources are relatively interchangeable. With the exception of a few specialty orders for specifications which cannot be met by U.S. producers, the products are close substitutes in regards to physical characteristics.
Customers of TCCSS report that reliability of the supplier is a major factor in choosing between TCCSS suppliers. Reliability of the supplier to deliver TCCSS the week agreed in the contract is considered relatively more important than the price, according to TCCSS customers. Due to contractual obligations with their own customers, customers of TCCSS expressed sensitivity towards late shipments of TCCSS, which result in late delivery of their final products to their customers. Customers of TCCSS rank producers on reliability of supply. Customers have traditionally purchased from several domestic
11-2

and international sources during a contract year, citing differences in quality requirements and product specifications as major reasons for choosing more than one supplier to meet their total annual demand.
Comparisons of Domestic Products and Imports from Japan
Shorter lead time, resulting in greater flexibility for changing orders, was cited as a significant factor in determining whether to purchase from domestic producers, according to testimony from TCCSS customers. Variability in supply of agricultural commodities and demand for processed food products creates a need for flexibility in supply of TCCSS. The longer lead times from Japanese producers results in significantly less flexibility to change orders when market conditions change. The longer lead times can create problems for TCCSS customers, who must store unused TCCSS if they overestimate their needs or may fail to deliver a product to their customers if they underestimate their needs. Superior U.S. producer flexibility was listed as one of the most important features in choosing between U.S. and Japanese suppliers. However, customers located on the West Coast cited geographical proximity as a reason for choosing Japanese over domestic suppliers. Most U.S. producers are located on the East Coast or Central region, and cited those regions as their targeted markets.
Reliability of Japanese suppliers to deliver the product during the specified contract week was listed as superior to U.S. producers by some customers of TCCSS. Although the lead times are longer for Japanese producers, customers cited generally higher reliability of Japanese producers to meet the contract dates than some U.S. producers who are geographically closer to the market.
Comparisons of Domestic Products and Imports from Japan to Nonsubject Imports
No significant difference was cited by questionnaire respondents between the quality of domestic products, Japanese imports, and other TCCSS import suppliers. Lead times, transportation costs, and ability to serve the customer’s needs were cited as the significant factors determining the choice of supplier.
11-3


PART 111: CONDITION OF THE U.S. INDUSTRY
The Commission analyzes a number of factors in making injury determinations (see 19 U.S.C. 9 1677(7)(B) and 1677(7)(C)). Information on the alleged dumping margins was presented earlier in this report and information on the volume and pricing of imports of the subject merchandise is presented in Parts IV and V. Information on the other factors specified is presented in this section andor Part VI and (except as noted) is based on the questionnaire responses of seven firms that accounted for 100 percent of U.S. production of TCCSS in the period for which the data were collected.
U.S. PRODUCERS
In addition to the petitioners, six other firms produce TCCSS in the United States (table 111-1). Most of the firms share their TCCSS rolling mills and employment with other cold-rolled and hot-rolled steel products, and all except National and Ohio Coatings produce both TCSS and CCSS. None of the firms dominates the entire market; however, they are geographically spaced to concentrate on certain regions, generally with some territorial overlap with other producers. National is owned by a Japanese importer (NKK U.S.A., New York, NY) and producer (NKK). According to a news item published by Reuters News Service in October 1998, NKK has supplied technical assistance, facilities development, and financial support to National; but, because of a recent deterioration in NKK’s financial condition (reportedly due to turmoil in its domestic market), further financial support is doubtful and NKK may even seek financial support from National. ***. Ohio Coatings is also partially owned by a Japanese importer (***), but the ownership ***.
Table 111- 1 TCCSS: U.S. producers, position on the petition, plant location(s), and share of production in 1998
Position Share of on the production
Firm name petition Plant location(s) in 1998
Petitioner: (Percent)
*** Weirton . . . . . . . . . . . . . . . . . Support Weirton, WV
Non-petitioners: Bethlehem *** LTV .................... National *** uss Posco ***
US Steel ***
. . . . . . . . . . . . . . . ***
. . . . . . . . . . . . . . . . . . . . . . . . . . . . . .
Ohio Coatings‘ *** . . . . . . . . . . . . . . . . . . . . . . . . . . .
Subtotal . . . . . . . . . . . . . . . Total . . . . . . . . . . . . . . . .
Sparrows Point, MD Aliquippa, PA; East Chicago, IN Portage, IN Pittsburg, CA Yorkville, OH Gary, IN; Fairless Hills, PA
*** *** *** *** *** *** *** - -
99.9
Ohio Coatings is *** percent owned by Wheeling-Pittsburgh Steel Corp., Wheeling, WV, and began supplying Wheeling-Pittsburgh’s production needs in early 1997 shortly after the latter discontinued its TCCSS operations in Wheeling, WV.
Source: Compiled from data submitted in response to Commission questionnaires.
111- I

U.S. PRODUCTION, CAPACITY, CAPACITY UTILIZATION, SHIPMENTS, INVENTORIES, AND EMPLOYMENT
Selected data relating to U.S. producers’ TCCSS operations are shown in table 111-2. After 1997, U.S. producers show decreasing production, capacity utilization, U.S. shipments, and employment, in contrast to increasing inventory levels and relatively steady capacity. No significant changes such as relocations, consolidations, or outages were reported that adversely affected the quantity or quality of production. The average unit value of TCCSS declined markedly in this period, especially in January- September 1999. Significantly, the decline is evident in both U.S. shipments and exports. Because U.S. producers and importers reported no radical shifts in’the market’s product mix during the period of investigation, the decline in unit values suggests a worldwide decline in prices, or at least a situation that is not particular to the domestic market.
111-2

Table 111-2 TCCSS: U.S. production, average practical capacity, capacity utilization, domestic shipments, exports, end-of-period inventories, average number of U.S. production and related workers, and hours worked by and wages paid to such workers,’ 1996-98, Jan.-Sept. 1998, and Jan.-Sept. 1999
Jan.-Sept.-- Item 1996 1997 1998 1998 1999
Production (short tons) . . . . . . . . . . . . . Average capacity (short tons) . . . . . . . . Ratio of production to capacity (percent).. U.S. shipments:
Quantity (short tons) . . . . . . . . . . . .
Unit value ....................
Quantity (short tons) . . . . . . . . . . . . Value’ (1,000 dollars) . . . . . . . . . . . Unit value ....................
Quantity (short tons) . . . . . . . . . . . . Value’ (1,000 dollars) . . . . . . . . . . . Unit value ....................
Value2 (1,000 dollars) . . . . . . . . . . .
Exports:
Total shipments:
Inventories (short tons) . . . . . . . . . . . . .
during the period (percent) . . . . . . . Ratio of inventories to total shipments
Average number of production and
Hours worked by production and related workers . . . . . . . . . . . . . . . .
related workers (1,000 hours) . . . . . Tons produced per 1,000 hours . . . . . . .
related workers (1,000 dollars) . . . . Wages paid to production and
Hourly compensation paid to production and related workers . . . . . . . . . . . . .
3,630,128 3,677,752 4,744,645 4,8 19,645
76.5 76.3
3,449,673 3,505,828 2,139,824 2,173,983
$620.30 $620.1 1
190,482 186,507 122,380 124,065 $642.48 $665.20
3,640,155 3,692,335 2,262,204 2,298,048
$621.46 $622.38 342,527 366,598
9.4 9.9
6,472 6,283
14,336 13,953 253.2 263.6
340,926 345,659
$23 -78 $24.77
3,386,077 4,833,645
70.1
3,247,236 1,991,387
$6 13.26
194,999 1 18,262 $606.47
3,442,235 2,109,649
$612.87 356,570
10.4
5,635
12,427 272.5
315,027
$25.35
2,622,710 2,637,672 3,835,984 3,835,984
68.8 68.8
2,528,210 2,469,615 1,556,328 1,457,210
$615.58 $590.06
136,063 172,870 84,153 98,676
$618.49 $570.81
2,664,273 2,642,485 1,640,481 1,555,886
$615.73 $588.80 356,914 385,251
10.0 10.9
5,843 5,414
9,161 9,437 286.3 279.5
246,527 241,702
$26.91 $25.61 ~ ’ The data include Wheeling-Pittsburgh’s operations in 1996.
Net sales value, i.e., gross value less all discounts, allowances, rebates, and the value of returned goods.
Note.--The ratios of inventories to total shipments in Jan.-Sept. 1998 and Jan.-Sept. 1999 are annualized.
Source: Compiled from data submitted in response to Commission questionnaires.
111-3


PART IV: U.S. IMPORTS, APPARENT CONSUMPTION, AND MARKET SHARES
Japan is by far the largest exporter of TCCSS to the United States. During the period of investigation, its share of total U.S. imports of the subject product continued to rise through January- September 1999, when its share surpassed that of all other countries combined (table IV-1). At least 25 countries exported TCCSS to the United States during the period for which data were collected.
The overwhelming bulk of Japanese exports are imported by 11 Japanese-owned firms: Mitsui & Co. (USA) Inc., New York, W, Nippon Steel Trading America, Inc. (Nittetsu Shoji America Inc.), Los Angeles, CA; Marubeni America Corp., Los Angeles, CA, and New York, NY; Kanematsu USA Inc., Houston, TX; Itochu International Inc., Chicago, IL; Mitsubishi International Steel Inc., Los Angeles, CA; Nichimen America Inc., New York, NY; Nissho Iwai America Corp., Santa Fe Springs, CA; Kawasho International (USA) Inc., New York, NY; Tomen America Inc., New York, NY; and Sumitomo Corp. of America, New York, NY. None of these firms adds production value to the imported product.
from January-September 1998 to January-September 1999, but imports from all other countries combined show much the same trend, albeit to a lesser degree. Coinciding with the marked increase in imports from January-September 1998 to January-September 1999 was a marked decrease in unit values. The average unit values of imports from Japan, however, were consistently above those for the aggregate throughout the period of investigation. This is not necessarily an indication that prices for the Japanese product have remained above those for competitive products from other counties. TCCSS is sold in many varieties, and although producers and importers reported no major changes in the relative proportions of these varieties sold on the market, there is no clear indication at this time as to what varieties and mix of varieties are sold by each country.
With minor fluctuations in quantity, apparent consumption of TCCSS in the United States remained relatively constant between 1996 and January-September 1999 (table IV-2). As a share of consumption, however, imports increased, rising from 1 1.1 percent in 1997 to 17.5 percent in January- September 1999 while producers’ US. shipments fell from 88.9 percent to 82.5 percent. Japan’s share of consumption increased from 5.1 percent to 8.9 percent in this period. The share of other countries combined increased from 6.3 to 8.6 percent.
Imports from Japan increased by 16 percent from 1997 to 1998 and by more than 52 percent
IV- 1
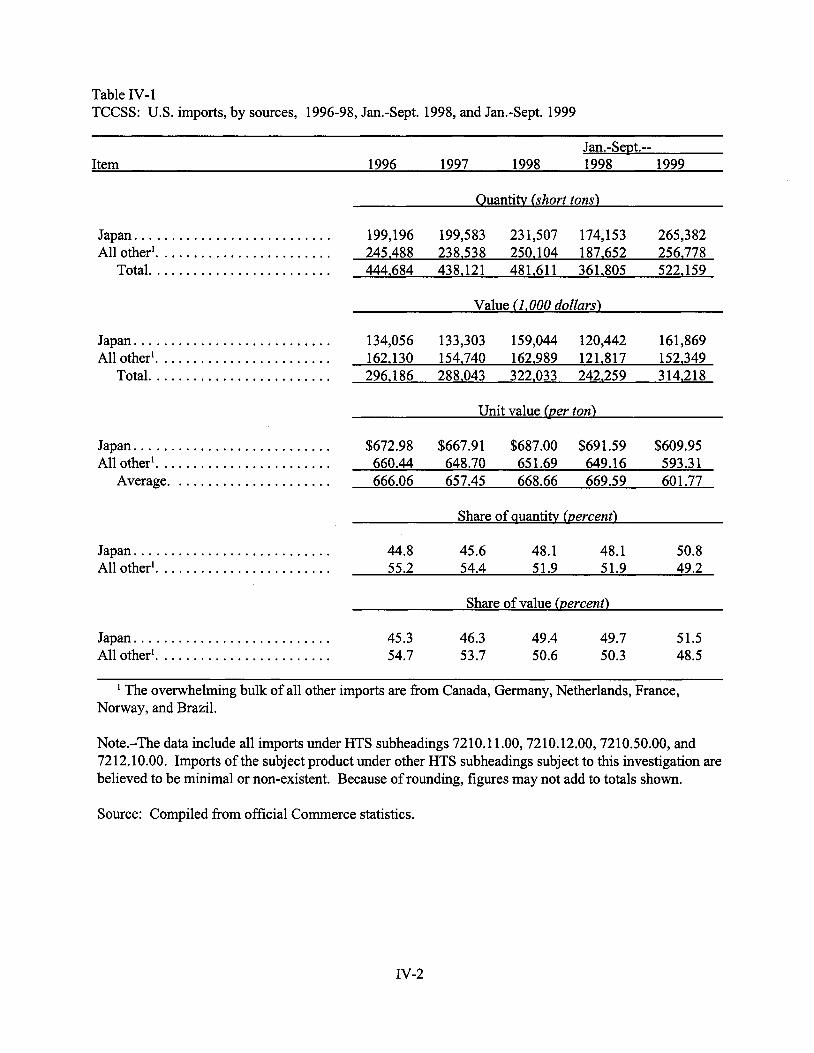
Table IV- 1 TCCSS: U.S. imports, by sources, 1996-98, Jan.-Sept. 1998, and Jan.-Sept. 1999
Jan.-Sept.-- Item 1996 1997 1998 1998 1999
Ouantitv (short tons)
Japan ........................... 199,196 199,583 231,507 174,153 265,382 All other'. ....................... 245,488 238.538 250.104 187,652 256,778
Total ......................... 444,684 438,121 481.61 1 361.805 522,159
Value (1.000 dollars)
Japan ........................... 134,056 133,303 159,044 120,442 161,869 All other'. ....................... 162,130 154,740 162,989 121.817 152.349
Total. ........................ 296,186 288.043 322.033 242.259 314,218
Unit value (Der ton)
Japan ........................... $672.98 $667.91 $687.00 $691.59 $609.95 All other'. ....................... 660.44 648.70 651.69 649.16 593.3 1
Average. ..................... 666.06 657.45 668.66 669.59 60 1.77
Share of auantitv hercent)
Japan ........................... 44.8 45.6 48.1 48.1 50.8 All other'. ....................... 55.2 54.4 51.9 51.9 49.2
Share of value (Dement)
Japan ........................... 45.3 46.3 49.4 49.7 51.5 All other'. ....................... 54.7 53.7 50.6 50.3 48.5
The overwhelming bulk of all other imports are from Canada, Germany, Netherlands, France, Norway, and Brazil.
Note.-The data include all imports under HTS subheadings 7210.1 1 .OO, 7210.12.00,7210.50.00, and 7212.10.00. Imports of the subject product under other HTS subheadings subject to this investigation are believed to be minimal or non-existent. Because of rounding, figures may not add to totals shown.
Source: Compiled from official Commerce statistics.
IV-2

Table IV-2 TCCSS: U.S. shipments of domestic product, U.S. imports, and apparent U.S. consumption, 1996-98, Jan.-Sept. 1998, and Jan.-Sept. 1999
Item
Producers’ US. shipments . . . . . . . . . . U.S. imports from--
Japan. ....................... All other .....................
Total ...................... Apparent consumption . . . . . . . . . . . . .
Producers’ U.S. shipments .......... U.S. imports from--
Japan. ....................... All other .....................
Total ...................... Apparent consumption . . . . . . . . . . . . .
Producers’ U.S. shipments . . . . . . . . . . U.S. imports from--
Japan. ....................... All other .....................
Total ......................
Producers’ U.S. shipments . . . . . . . . . . U.S. imports from--
Japan. ....................... All other .....................
Total ......................
Jan.-Sept.-- 1996 1997 1998 1998 1999
Quantity [short tons)
3,449,673 3,505,828 3,247,236 2,528,210 2,469,615
199,196 199,583 231,507 174,153 265,382 245,488 238,538 250,104 187,652 256,778 444.684 438.121 481.61 1 361,805 522.159
3,894,357 3,943,949 3.728.847 2,890,015 2.991.774
2,139,824 2,173,983 1,991,387 1,556,328 1,457,210
134,056 133,303 159,044 120,442 161,869 162,130 154.740 162.989 121,817 152,349 296,186 288.043 322.033 242,259 3 14.21 8
2,436,010 2.462.026 2,313,420 1,798.587 1,771.428
Share of quantity of U.S. consumption hercent)
88.6 88.9 87.1 87.5 82.5
5.1 5.1 6.2 6.0 8.9 6.3 6.0 6.7 6.5 8.6
11.4 11.1 12.9 12.5 17.5
Share of value of U.S. consumption (percent)
87.8 88.3 86.1 86.5 82.3
5.5 5.4 6.9 6.7 9. I 6.7 6.3 7.0 6.8 8.6
12.2 11.7 13.9 13.5 17.7
Note.-The data include all imports under HTS subheadings 7210.1 1 .OO, 7210.12.00,7210.50.00, and 7212.10.00. Imports of the subject product under other HTS subheadings subject to this investigation are believed to be minimal or non-existent.
Source: Compiled from data submitted in response to Commission questionnaires and from official Commerce statistics.
IV-3


PART V: PRICING AND RELATED INFORMATION
FACTORS AFFECTING PRICES
U.S. Inland Transportation Costs
Domestic producers generally reported transportation costs of 0-3 percent (one producer cited a range of *** percent) of the total delivered cost. Producers generally arrange for transportation of the product. Transportation costs were reported to account for 2-8 percent of total delivered cost of imported Japanese TCCSS. Importers generally arrange transportation to the purchaser’s location. Two importers reported 32-40 percent of sales and four reported 70- 100 percent of sales within 100 miles of their storage facility or port of entry.
Exchange Rates
The Japanese yen has weakened against the dollar over most of the period, with a rebound at the end of 1998 (figure V-1).
Figure V-1 Exchange rates: Indices of real and nominal exchange rates in U.S. dollars per Japanese yen, by quarters, Jan. 1996-June 1999
Source: International Monetary Fund.
v- 1

PRICING PRACTICES
Pricing Methods
Domestic producers reported contracting once a year in October-December, with prices and target quantities set for the following calendar year (some domestic producers cited flexibility in quantities). Negotiations begin with the offer price announced to customers by U.S. producers. Quantities, prices, and terms are discussed between buyer and seller until an agreement is reached on price and sometimes quantities ***. One TCCSS customer *** reported *** price flexibility within the annual contract period ***. Small customers of TCCSS have formed buyers alliances *** for contract negotiations, raising their combined purchasing volume to the level of larger customers ***. Food processors are the primary TCCSS customers listed in the U.S. producer questionnaires. Food processing is dependent on agricultural production, which generally occurs on an annual cycle.
reported mostly contractual pricing, negotiated once a year, with the exception of one respondent who reported transaction-by-transaction sales for small volume customers and one importer who reported contracting every half to one year. The majority of the importer questionnaire respondents reported setting both price and quantity in the contracts; one reported setting only price.
Domestic price negotiations generally precede foreign price negotiations ***. Importers
Sales Terms and Discounts
Importer prices are quoted for delivered product, with sales terms ranging from net 30 to net 90 days (the majority offer net 30 days). Three importers reported a lead time between customer’s order and the date of delivery of 3-4 months. Two importers reported a lead time of 12 months. Domestic producers quoted prices f.0.b. warehouse or mill, with a few offering both f.0.b. and delivered prices. Sales terms range from a discount of *** percent if the balance is paid in 10 days to net balance due in 30 days. Domestic producers reported lead times of not more than 2 months. Domestic producers cited discounts based on quantity and annual volume. Quantity and volume discounts would explain the prevalence of buyers’ alliances. Only one producer reported price premiums (*** percent) for sub- minimum shipments.
PRICE DATA
The Commission requested U.S. producers and importers of TCCSS to provide quarterly data for the total quantity and value of TCCSS products that were shipped to distributors. Six importers and seven U.S. producers provided usable price data. These data are used to calculate the weighted-average price in each quarter. Data were requested for the period January 1996 through September 1999. The products for which pricing data were requested are as follows:
Product 1: 55 pound, double reduced, 0.20 electrolytic tin plate, with a thickness of 0.0061 in coils, with widths greater than 30.5 inches.
Product 2: 75 pound, single reduced, 0.20 electrolytic tin plate, with a thickness of 0.0083 in coils, with widths greater than 30.5 inches.
Product 3: 75 pound, single reduced, tin free steel, with a thickness of 0.0083 in coils, with widths greater than 30.5 inches.
v-2

Import quantities of product 1 were reported for only three quarters of the sample period. Product 2 import sales in the U.S. market were reported to be zero by all importing questionnaire respondents from April 1997 to September 1998. Usable import sales data for product 2 were provided for the periods January 1996-March 1997 and October 1998-September 1999. Usable price data were received for product 3 for all periods except January-March 1996. The three products listed account for 5.3-6.2 percent of total U.S. shipments of TCCSS by U.S. producers. The highest share was in 1996 and the lowest in 1999. The products in the questionnaire account for 1 .l-4.1 percent of U.S. imports of TCCSS from Japan. Their share in total U.S. imports from Japan was lowest in 1999.
Price Trends
Price data for TCCSS received in producer and importer questionnaires were used to calculate weighted-average quarterly prices and margins (tables V-1, V-2, and V-3 and figure V-2). U.S. producer prices were available in all quarters of the sample period. Import price data were not available for 12 of the 15 quarters for product 1 ,6 of 15 quarters for product 2, and 1 quarter for product 3.
the range of $650 to $680 per ton for the period 1996-98. The weighted-average U.S. producer price for product 1 dropped to a three-year low of $621.21 in the third quarter of 1999. Importer questionnaire data for product 1 are available only in three quarters of the sample period, July-September 1996, October-December 1996, and April-June 1998. Usable weighted-average importer price data from third quarter 1996 and first quarter 1998 show a price decline from approximately *** to *** per ton. Product 2 weighted-average prices for U.S. producers varied between approximately *** and *** per ton over the period, with the exception of the first quarter of 1996. The lowest prices in the sample were *** per ton in the second quarter of 1998, when there were no reported imports of Japanese product 2, and *** per ton in the third quarter of 1999. Importer weighted-average price data are available for the periods January 1996-January 1997 and October 1998-September 1999. The first period of import data illustrates the weighted-average import price varying between *** and ***. In the second import data period, import price varies between *** and *** per ton.
The weighted-average price received by U.S. producers for product 1 was generally constant in
v-3

United States
Price Quantity Period (per ton) (tons)
Japan
Price Quantity Margin (per ton) (tons) (percent)
I Apr.-June I 668.52 I 25,695 I - I - I -I
United States
Price Quantity Period (per ton) (tons)
Jan. -Mar. $706.02 24,674 1996:
*** *** *** July-Sept. 673.55 25,124
0ct.-Dec. 667.65 27,326 *** *** ***
Japan
Price Quantity Margin (per ton) (tons) (percent)
- Jan. -Mar.
1997: Jan. -Mar. 683.86 22,465
Apr. - June 674.71 2 1,670
July-Sept. 669.48 25,098
1 $706.02 I 24,674
0ct.-Dec. 674.36 22,118
1998: Jan.-Mar. 667.60 26,541
*** *** *** Apr . -June 677.75 20,390
July-Sept. 665.07 20,393
0ct.-Dec. 661.41 21,619
1999: Jan. -Mar. 659.17 21,655
Apr.-June 649.14 12,853
July-Sept. 621.21 15,212 ~ ~~ ~~ ~~
double reduced, 0.20 electrolytic tin plate, with a thickness of 0.0061 in coils with widths greater than 30.5 inches.
Source: Compiled from data submitted in response to Commission questionnaires.
v-4

Table V-2 Product 2 (TCSS): Weighted-average f.0.b. prices and quantities of domestic and imported product 2 and margins of underselling/(overselling), by quarters, Jan. 1996-Sept. 1999
United States
Price Quantity Period (per ton) (tons)
* * * * * * *
Japan
(per ton) (tons) Price Quantity
~ ~~ ~
1996: Jan. -Mar.
Apr.- June
July- S ept .
~
$620.49 25,512 - 615.76 22,923 *** *** 604.05 27,7 1 1 $575.73 2,060
0ct.-Dec.
1997: Jan. -Mar.
613.76 24,828 590.76 62 8
628.25 23,920 573.94 1,934
Apr . - June
July-Sept.
612.91 29,853 557.50 2,800
609.73 29,167 590.05 1,949
0ct.-Dec. ~ 1 - 6 0 2 . 0 i i - 19,927 I ~ 592.14 I 814
0ct.-Dec.
1998: Jan. -Mar.
607.2 1 23,367 597.01 1,206
610.14 26,437 594.88 93 8
~ ~
~ 577.31 I 23,825 I *** I *** July-Sept. I
Apr . - June
July- Sept .
.ed product 3'
1
606.85 25,945 624.35 575
599.27 18,971 623.67 1,318
~
Margin (percent)
1999: Jan. -Mar.
Apr.-June
4.7 I
592.06 24,778 561.59 552
585.53 22,861 *** *** -1
*** *** I
75 pound, single reduced, tin free steel, with a thickness of 0.0083 in coils with widths greater than 30.5 inches.
Source: Compiled from data submitted in response to Commission questionnaires.
v-5

Figure V-2 Weighted-average f.0.b. U.S. and importer prices per ton of products 1-3
* * * * * * *
Product 3 weighted-average U.S. producer prices have varied between $577 and $628 over the period, with the peak of $628 per ton in the first quarter 1997 and the low of $577 per ton in July- September 1999. Since January 1997, the weighted-average price of product 3 has mostly declined. Importer weighted-average price data for product 3 are available for all periods except the first quarter of 1996. Prices fluctuated upwards from *** in the second quarter of 1996 to a high point of *** in the second quarter of 1998. Prices then fell by *** to a low point of *** in the second quarter of 1999, before recovering to *** in the remaining quarter.
Price Comparisons
Price comparisons between the domestic and Japanese products, based on questionnaire data, were possible in only three quarters for product 1. Japanese imports of product 1 reported in the questionnaires occurred only in the last two quarters of 1996, and again in the second quarter of 1998. The reported import quantities were low for product 1 compared with U.S. producer sales. Usable price data were available for product 2 during all periods for U.S. producers. Product 2 import price data were available from January 1996 to March 1997 and from October 1998 to September 1999. No imports were reported by companies for the period April 1997 to September 1998. Thus, no price data were available for product 2 during this period. Usable price data are available for product 3 in all periods except the first quarter of 1996. No imports from Japan were reported in that quarter.
of *** percent in the second half of 1996. The Japanese product undersold the U.S. product by *** percent for the one quarter in 1998 for which data were provided.
Weighted-average U. S. producer prices were below the weighted-average import prices by margins of *** percent during the period January 1996 to March 1997. Weighted-average prices of imports from Japan were below U.S. producer prices, with underselling margins of *** percent, during the period October 1998 to September 1999.
1 1 of the 14 periods in which imports were reported. The underselling margin varied from 1.6 to 1 1.1 percent. In periods when the U.S. product undersold Japanese imports, the margin was 2.9-4.1 percent. U.S. product undersold Japanese product in the last reported quarter of 1999, while the volume of product 2 imports from Japan reported in the questionnaires had fallen in 1999 to its lowest level in the period of 1996 to September 1999.
import price data were available. US. products undersold imports from Japan in 10 of the 26 periods. For products 1 and 2, imports from Japan oversold US. products in 1996 and 1997, while imports from Japan undersold U.S. products in 1998 and 1999. For product 3, imports from Japan undersold U.S. products in all periods except April-June 1998, July-September 1998, and July-September 1999. In those 3 periods, the U.S. product undersold product 3 imports from Japan.
The Japanese weighted-average import price for product 1 was above the US. price by a margin
There were no Japanese imports of product 2 reported between April 1997 and September 1998.
The Japanese weighted-average import price for product 3 was below the U.S. producer price in
Imports from Japan undersold U.S. products in 16 of the 26 periods in which domestic and
V-6

LOST SALES AND REVENUES
*** reported price reductions and a roll back of announced price increases in response to alleged competition from Japanese imports in its *** market. *** reported lowering prices *** percent during 1998-99 due to its estimates that Japanese imports were priced lower and would capture its market shares with its customers, ***, all of which were cited as purchasing some portion of their total demand from Japanese suppliers. *** alleged that price reductions on Japanese imports resulted in one lost sale of *** and five instances of price reductions ranging from *** to retain sales with its customers, ***. *** reported in its questionnaire that it reduced prices due to competition from Japanese imports; however, it commented that there were “no specific instances” to cite. Three U.S. producers, ***, reported no price reductions or roll back in prices due to competition from Japanese imports. *** reported announcing price increases for the year 2000 contract negotiations.
Where sufficient information was provided in the questionnaires, the Commission contacted customers listed in the allegations. One customer, ***, confirmed an allegation of price reduction (***). One customer, ***, denied allegations of price reductions by its U.S. supplier, ***, stating that the aforementioned U.S. producer “declined to supply” its *** demand due to shipping costs ***, and was therefore not in competition with Japanese imports, which are limited to the customer’s *** operations. One customer, ***, provided a letter it received from a U.S. supplier, ***, during contract negotiations; *** reported that a *** quantity reduction in the contract supply was due to a ***. ***.
v-7


PART VI: FINANCIAL CONDITION OF THE U.S. INDUSTRY
BACKGROUND
Seven U.S. producers' supplied financial data on their operations on TCCSS. These data represent all known U.S. production of TCCSS in 1998. Ohio Coatings started production of TCCSS in January 1997.
OPERATIONS ON TCCSS
Income-and-loss data for the U.S. producers on their TCCSS operations are presented in table VI-1; data on a per-short-ton basis are shown in table VI-2. Selected financial data, by firms, are presented in table VI-3. The aggregate operating loss margin decreased from 3.2 percent in 1996 to 1 .O percent in 1997 and then increased back to 3.2 percent in 1998. The margin rose to 5.6 percent during January-September 1999, compared to 1.7 percent during January-September 1998.
From 1996 to 1997, the volume of total net sales increased by about 5 percent. On a per-short- ton basis, average selling price almost remained stable while the average COGS declined, resulting in a higher gross profit and a lower operating loss; in 1998, average selling price declined while the average COGS remained stable, resulting in a lower gross profit and a higher operating loss. The volume of total net sales decreased by about 2 percent in 1998 from 1997. In January-September 1999, average selling price fell much faster than the decline in the average COGS, resulting in a gross loss and a higher operating loss compared with January-September 1998. Between these periods, the volume of total net sales declined by about 0.8 percent. Five firms reported operating losses in January-September 1999, compared with two firms in January-September 1998.
* * * * * * *
The variance analysis for the seven U.S. producers of TCCSS is presented in table VI-4. The information for this variance analysis is derived from table VI-1. Export sales were minor and averaged less than 6.0 percent of total shipments in short tons during 1996-98. ***. The variance analysis provides an assessment of changes in profitability as related to changes in pricing, cost, and volume. This analysis is more effective when the product involved is a homogeneous product with no variation in product mix. The analysis shows that the decrease in operating loss fkom 1996 to 1998 is attributable to favorable net cost/expense and net volume variances offset by an unfavorable price variance, whereas the increase in operating loss from January-September 1998 to January-September 1999 is attributable to the much higher unfavorable price variance compared to favorable net costlexpense and net volume variances.
U.S. producers are Bethlehem, LTV, National, Ohio Coatings, USS Posco, US Steel, and Weirton. The fiscal year of each of these producers ends on December 3 1. Wheeling-Pittsburgh Steel Corp. did not provide financial data for 1996.
VI- 1

Table VI4 Results of operations of U.S. producers in the production of TCCSS, fiscal years 1996-98, Jan.-
VI-2

Table VI-2 Results of operations (per short ton) of US. producers in the production of TCCSS, fiscal years 1996-98, Jan.Sept. 1998, and Jan.-Sept. I999
Fiscal year
1996 1997 1998 Item
Jan .-Sept.
1998 1999
Net sales
COGS
Gross profit
SG&A expenses
! Operating income or (loss) 1 (20.07) 1
$621.43 $622.22 $61 3.30 $616.44 $587.97
61 3.80 600.24 600.80 595.68 590.05
7.63 21.98 12.50 20.76 (2.08)
27.70 28.36 31.93 30.94 30.88
(6.38) ~ (19.43) I (10.18) 1 (32.96)
1 Source: Compiled from data submitted in response to Commission questionnaires.
Table VI-3 Results of operations of US. producers in the production of TCCSS, by firms, fiscal years 1996- 98, Jan.-Sept. 1998, and JanAept. 1999
* * * * * * *
VI-3

Table V I 4 Variance analysis of U.S. producers’ TCCSS operations, fiscal years 1996-98, Jan.Sept. 1998, and Jan.SeDt. I999
1996-98 1996-97
Fiscal year
1997-98 1998-99
1 Jan.-Sept. 1
Operating income variance
Summarized as:
3,508 1 46,764 1 (43,256) 1 (59,887)
I I I
Net costlexpense variance 30,157 47,645 (14,211) 15,050
Net volume variance 1,310 (3,788) ~ 1,622 214
VI-4

INVESTMENT IN PRODUCTIVE FACILITIES, CAPITAL EXPENDITURES, AND R&D EXPENSES
Fiscal year
1996 1997 1998 Item
The responding firms’ data on capital expenditures, R&D expenses, and the value of their property, plant, and equipment are shown in table VI-5. R&D expenses were not incurred by ***. ***.
Jan.Sept.
1998 1999
Table VI-5 Value of assets, capital expenditures, and R&D expenses of U.S. producers of TCCSS, fiscal years 1996-98, Jan.Sept. 1998, and Jan .-Sept. 1999
Capital expenditures R&D expenses Fixed assets:
Value ($1,000)
145,279 89,007 78,133 45,030 90,488 4,707 4,667 4,189 3,238 3,433
Original cost Book value
1,744,646 1,732,343 1,779,675 1,749,497 1,883,647 796,856 761,526 747,437 741,753 81 5,331
CAPITAL AND INVESTMENT
The Commission requested U.S. producers to describe any actual or potential negative effects of imports of TCCSS from Japan, on their firms’ growth, investment, ability to raise capital, or development and production efforts (including efforts to develop a derivative or more advanced version of the product). Their responses are shown in appendix D.
VI-5


PART VII: THREAT CONSIDERATIONS
The Commission analyzes a number of factors in making threat determinations (see 19 U.S.C. 0 1677(7)(F)(I)). Information on the nature of the alleged LTFV sales is summarized in Part I and is shown in Commerce’s notice presented in appendix A of this report; information on the volume and pricing of imports of the subject merchandise is presented in Parts IV and V, and information on the effects of imports of the subject merchandise on U.S. producers’ existing development and production efforts is presented in Part VI. Information on inventories of the subject merchandise; foreign producers’ operations, including the potential for “product-shifting;” any other threat indicators, if applicable; and any dumping in third-country markets, follows.
for the production of TCCSS is about 60 percent of U.S. capacity. Its capacity levels remained fairly constant throughout the period of investigation, as did its utilization rates ( in contrast to those in the United States, which continued to fall after 1997). Japan’s capacity is not expected to increase through 2000. Japan’s home market consumes the bulk of its production; however, exports were a large and increasing share of shipments during the investigative period. The United States’ share of these exports rose from 7.1 percent in 1996 to 13.2 percent in January-September 1999, a faster rate of increase than for exports as a whole. Indeed, while exports to the United States increased, home market shipments and exports to other countries declined.’ As a share of shipments, Japanese inventories remained fairly constant. (Generally, Japanese TCCSS in the United States is not available from inventory. The quantities imported coincide with the quantities already purchased under contractual arrangement).
So far as it is known, only one ongoing trade restriction is applicable to Japanese TCCSS: on April 30, 1999, Indonesia imposed an antidumping duty of 68 percent ad valorem on imports of Japanese tin-coated steel sheet. Southeast Asia is a principal export market for ***. In addition to the dumping duty, recent economic pressures have reduced demand for many foreign products in Southeast Asia and China, which may partially explain the decline of Japan’s exports to other countries and its increases to the United States after 1997. Other important export markets for Japanese TCCSS are Taiwan and Mexico.
Data for the four Japanese producers of TCCSS are shown in table VII-1. Japan’s total capacity
Note that data for exports to the United States provided by the Japanese producers average about 14 percent higher than the Commerce data presented in tables IV-1 and IV-2. Product that entered the United States under HTS subheadings 72 12.50.00,7225.99.00, and 7226.99.00 (considered minimal and excluded from the tables) may account for some portion of the difference.
VII- 1

Table VII-1 TCCSS: Japan’s production, capacity, shipments, and end-of-period inventories, 1996-98, Jan.-Sept. 1998, and Jan.-Sept. 1999
Jan.-SeDt.-- Item 1996 1997 1998 1998 1999
Production (short tons)‘ . . . . . . . . . . . . 3,007,010 3,016,975 2,897,996 2,218,017 2,123,615 Capacity (short tons) . . . . . . . . . . . . . . 3,461,290 3,391,764 3,395,252 2,549,412 2,436,111 Ratio of production to capacity (percent) 86.9 89.0 85.4 87.0 87.2 Shipments:
Internal consumptiodtransfers .... 1,000 0 2,000 2,000 0 Home market (short tons)’ . . . . . . . 1,972,446 1,906,590 1,741,614 1,318,968 1,222,591
United States (short . . . . . 213,962 231,108 294,029 211,333 285,538 All others (short tons)4 . . . . . . . 816,173 881.317 865.667 690,063 653,810
Exports to--
Total exports (short tons) . . . 1.030.135 1.1 12.425 1,159,696 901,396 939.348
(short tons) . . . . . . . . . . . 3,002,581 3,019,015 2,901,310 2,220,364 2,161,939
(percent) ..................... 34.3 36.8 40.0 40.6 43.4
Total shipments
Exports’ share of total shipments
United States’ share of total exports (percent) ..................... 7.1 7.7 10.1 9.5 13.2
End-of period inventories (short tons) . 290,439 287,299 283,785 285,853 244,461
’ Japanese producers project their production to be *** tons in 1999 and *** tons in 2000. They plan *** in capacity during this period.
Japanese producers project their home market shipments to be *** tons in 1999 and *** tons in 2000. Japanese producers project their shipments to the United States to be *** tons in 1999 and *** tons in
Japanese producers project their shipments to other countries to be *** tons in 1999 and *** tons in 2000.
2000.
Source: Compiled from data submitted in response to Commission questionnaires.
VII-2

APPENDIX A
FEDERAL REGISTER NOTICES
A- 1


Federal Register / Vol. 64. No. 2 13 /Thursday, November 4, 1999 / Notices 60225
INTERNATIONAL TRADE COMMISSION [Investigation No. 731-TA-860 (Preliminary)]
Tin- and Chromium-Coated Steel Sheet From Japan AGENCY: United States International Trade Commission. ACTION: Institution of antidumping investigation and scheduling of a preliminary phase investigation.
SUMMARY: The Commission hereby gives notice of the institution of an investigation and commencement of preliminary phase antidumping investigation No. 73 1-TA-860 (Preliminary) under section 733(a) of the Tariff Act of 1930 (19 U.S.C. 1673b(a)) (the Act) to determine whether there is a reasonable indication that an industry in the United States is materially injured or threatened with material injury, or the establishment of an

60226 Federal Register/Vol. 64, No. 213/Thursday. November 4, 1999/Notices
industry in the United States is materially retarded, by reason of imports from Japan of tin- and chromium-coated steel sheet, provided for in subheadings 72 10.1 1 .OO, 7210.12.00. 7210.50.00, 7212.10.00. 7212.50.00, 7225.99.00, and 7226.99.00 of the Harmonized Tarif€ Schedule of the United States, that are alleged to be sold in the United States at less than fair value. Unless the Department of Commerce extends the time for initiation pursuant to section 732(c)(l)(B) of the Act (19 U.S.C. 1673a(c)( 1) (B)). the Commission must reach a preliminary determination in antidumping investigations in 45 days, or in this case by December 13. 1999. The Commission's views are due at the Department of Commerce within five business days thereafter, or by December 20, 1999.
For further information Concerning the conduct of this investigation and rules of general application, consult the Commission's Rules of Practice and Procedure, part 201, subparts A through E (1 9 CFR part 20 1) , and part 207. subparts A and B (1 9 CFR part 207). EFFECTIVE DATE: October 28. 1999. FOR FURTHER INFORMATION CONTACT: Larry Reavis (202-205-3185), Office of Investigations, U.S. International Trade Commission, 500 E Street SW.. Washington, DC 20436. Hearing- impaired persons can obtain information on this matter by contacting the Commission's TDD terminal on 202- 205-1810. Pasons with mobility impairments who will need special assistance in gaining access to the Commission should contact the Office of the Secretary at 202-205-2000. General information concerning the Commission may also be obtained by accessing its internet server (http:// www.usitc.gov). SUPPLEMENTARY INFORMATION:
Background.-This investigation is being instituted in response to a petition filed on October 28. 1999, by Weirton Steel Corp.. Weirton, WV: the United Steelworkers of America (USW). AFL- CIO; and the Independent Steelworkers Union QSv).
have the right to appear as parties in Commission antidumping investigations. The Secretary will prepare a public service list containing the names and addresses of all persons. or their representatives, who are parties to this investigation upon the expiration of the period for filing entries of appearance.
proprietary information (BPI,) under an administrative protective order (APO) and BPI service list.-Pursuant to section 207.7(a) of the commission's rules, the Secretary will make BPI gathered in this investigation available to authorized applicants representing interested parties (as defined in 19 U.S.C. 1677(9)) who are parties to the investigation under the APO issued in the investigation, provided that the application is made not later than seven days after the publication of this notice in the Federal Register. A separate service list will be maintained by the Secretary for those parties authorized to receive BPI under the APO.
Conference.-The Commission's Director of Operations has scheduled a conference in connection with this investigation for Thursday, November 18. 1999. at the U S . International Trade Commission Building, 500 E Street SW.. Washington, DC. Parties wishing to participate in the conference should contact Larry Reavis (202-205-3185) not later than November 16 to arrange for their appearance. Parties in support of the imposition of antidumping duties in this investigation and parties in opposition to the imposition of such duties will each be collectively allocated one hour within which to make an oral presentation at the conference. A nonparty who has testimony that may aid the Commission's deliberations may request permission to present a short statement at the conference.
sections 20 1.8 and 207.15 of the Commission's rules, any person may submit to the Commission on or before November 23, 1999, a written brief containing information and arguments
Limited disclosure of business
Written submissions.-As provided in
Participation in the investigation and pertinent to the subject matter of the public service list.-Persons (other than investigation. Parties may file written petitioners) wishing to participate in the testimony in connection with their investigation as parties must file an presentation at the conference-no later, entry of appearance with the Secretary. than three days before the conference. If to the Commission, as provided in briefs or written testimony contain BPI, sections 20 1.1 1 and 207.10 of the they must conform with the Commission's rules, not later than seven requirements of sections 201.6,207.3. days after publication of this notice in and 207.7 of the Commission's rules. the Federal Register. Industrial users The Commission's rules do not and (if the merchandise under authorize filing of submissions with the investigation is sold at the retail level) Secretary by facsimile or electronic representative consumer organizations means.
in accordance with sections 201.16(c) and 207.3 of the rules, each document filed by a party to the investigation must be served on all other parties to the investigation (as identified by either the public or BPI service list), and a certificate of service must be timely filed. The Secretary will not accept a document for filing without a certificate of service.
Authority: This investigation is being conducted under authority of title VII of the Tariff Act of 1930: this notice is published pursuant to section 207.12 of the Commission's rules.
Issued: October 29, 1999. By order of the Commission.
Donna R Kahnke,
[FR Doc. 99-28892 Filed 11-3-99: 8:45 am] secretary.
BILLING CODE

66892 Federal Register / Vol. 64, No. 229 /Tuesday, November 30, 1999 /Notices
DEPARTMENT OF COMMERCE
International Trade Administration
[A-588-854]
Initiation of Antidumping Duty Investigation: Certain Tin Mill Products From Japan
AGENCY: Import Administration, International Trade Administration, Department of Commerce. EFFECTIVE DATE: November 30,1999. FOR FURTHER INFORMATION CONTACT: Samantha Denenberg at (202) 482-1386 or Linda Ludwig at (202) 482-3833, Import Administration, International Trade Administration, U.S. Department of Commerce, 14th Street and Constitution Avenue, NW, Washington, DC 20230. Initiation of Investigations The Applicable Statute and Regulations
citations to the statute are references to the provisions effective January 1,1995, the effective date of the amendments made to the Tariff Act of 1930 (the Act) by the Uruguay Round Agreements Act (URAA). In addition, unless otherwise indicated, all citations to the Department’s regulations are references to the provisions codified at 19 CF’R Part 351 (1998). The Petition On October 28,1999, the Department
of Commerce (“the Department”) received a petition filed in proper form by Weirton Steel Corporation, Independent Steelworkers Union, and United Steelworkers of America, AFL- CIO (collectively petitioners). The Department received supplemental information to the petition on November 8,1999.
In accordance with section 7321b) of the Act, petitioners allege that imports of certain tin mill products (“TMP”) from Japan are being, or are likely to be, sold in the United States at less than fair value within the meaning of section 731 of the Act, and that such imports are materially injuring an industry in the United States.
The Department finds that petitioners filed these petitions on behalf of the domestic industry because they are interested parties as defined in sections 771(9)(C) and (D) of tlie Act and they have demonstrated sufficient industry support with respect to the antidumping investigation they are requesting the Department to initiate (see Determination of Industry Support for the Petition below).
Unless otherwise indicated, all

Federal Register / Vol. 64, No. 229 /Tuesday, November 30, 1999 /Notices 66893
Scope of Investigation The scope of this investigation
includes tin mill flat-rolled products that are coated or plated with tin, chromium or chromium oxides. Flat- rolled steel products coated with tin are known as tin plate. Flat-rolled steel products coated with chromium or chromium oxides are known as tin-free steel or electrolytic chromium-coated steel. The scope includes all the noted tin mill products regardless of thickness, width, form (in coils or cut sheets), coating type (electrolytic or otherwise), edge (trimmed, untrimmed or further processed, such and scroll cut), coating thickness, surface finish, temper, coating metal (tin, chromium, chromium oxide), reduction (single-or double-reduced), and whether or not coated with a plastic material.
The merchandise subject to this investigation is classified in the Harmonized Tariff Schedule of the United States (“HTSUS”), under HTSUS subheadings 72 10.11 .OOOO, 7210.12.0000, 7210.50.0000, 7212.10.0000, and 7210.50.0000 if of non-alloy steel and under HTSUS subheadings 7225.99.0090, and 7226.99.0000 if of alloy steel. Although the subheadings are provided for convenience and Customs purposes, our written description of the scope of this investigation is dispositive. Determination of Industry Support for the Petition
Section 732(b)(1) of the Act requires that a petition be filed on behalf of the domestic industry. Section 732(c)(4)(A) of the Act provides that a petition meets this requirement if the domestic producers or workers who support the petition account for: (1) at least 25 percent of the total production of the domestic like product; and (2) more than 50 percent of the production of the domestic like product produced by that portion of the industry expressing support for, or opposition to, the petition.
the “industry” as the producers of a domestic like product. Thus, to determine whether the petition has the requisite industry support, the statute directs the Department to look to producers and workers who produce the domestic like product. The International Trade Commission (ITC), which is responsible for determining whether “the domestic industry” has been injured, must also determine what constitutes a domestic like product in order to define the industry. While both the Department and the ITC must apply the same statutory definition regarding
Section 771(4)(A) of the Act defines
the domestic like product (section 771(10) of the Act), they do so for different purposes and pursuant to separate and distinct authority. In addition, the Department’s determination is subject to limitations of time and information. Although this may result in different definitions of the like product, such differences do not render the decision of either agency contrary to the law.’
domestic like product as “a product which is like, or in the absence of like, most similar in characteristics and uses with, the article subject to an investigation under this title.” Thus, the reference point from which the domestic like product analysis begins is “the article subject to an investigation,” i.e., the class or kind of merchandise to be investigated, which normally will be the scope as defined in the petition. Moreover, petitioners do not offer a definition of domestic like product distinct from the scope of the investi ation.
in the petition is the single domestic like product defined in the “Scope of Investigation” section, above. The Department has no basis on the record to find the petition’s definition of the domestic like product to be inaccurate. The Department has, therefore, adopted the domestic like product definition set forth in the petition. In this case, the Department has determined that the petition and supplemental information to the petition contain adequate evidence of sufficient industry support (see Attachment to the Initiation Checklist Re: Industry Support, November 17,1999). Producers and workers supporting the petition represent over 50 percent of total production of the domestic like product. Accordingly, both tests under section 732(c)(4)(A) are satisfied, and the Department determines that this petition is filed on behalf of the domestic industry within the meaning of 732(b)(1) of the Act. Export Price and Normal Value
The following are descriptions of the allegations of sales at less than fair value upon which our decision to initiate this investigation is based. Should the need arise to use any of this information in our preliminary or final determinations for purposes of facts available under
Section 771(10) of the Act defines the
The 8omestic like product referred to
‘See Algoma Steel Corp. Ltd., fhited States, 688 F. Supp. 639,64244 (CIT 1988); High Information Content Flat Panel Displays and Display Glass Therefore fmm Japan: Final Determination; Rescission of Investigation and Partial Dismissal of Petition, 56 FR 32376,32380- 81 (July 16,1991).
section 776 of the Act, we may re- examine the information and revise the margin calculations, if appropriate.
Japan Petitioners identified Nippon Steel
Corporation, NKK Corporation, Kawasaki Steel Corporation, and Toyo Kohan Co. Ltd. as possible exporters of TMP from Japan. Petitioners further identified these exporters as the primary producers of subject merchandise in Japan. Petitioners based export price (‘‘EP”) for imports from Japan on import values as recorded in official U.S. Department of Commerce IM-145 statistics. In calculating import values, petitioners used the customs values reported for the HTS categories which represent imports of tin plate (e.g., HTSUS 7210.12.0000) and imports of tin free steel (e.g., HTSUS 7210.50.0000). Petitioners used average customs values for each product (for the month of June 1999) which approximate the FOB price of the merchandise, packaged and ready for delivery in the exporter’s country. Petitioners did not deduct foreign inland freight and handling in Japan because they had no information regarding these expenses.
With respect to normal value (“NV”), petitioners stated that the volume of Japanese home market sales was sufficient to form a basis for normal value, pursuant to section 773(a)(l)(C)(ii) of the Act. Petitioners constructed normal values based on the average prices of tin mill products sold in Japan by Nippon Steel Corporation (“Nippon”) to large end users during June 1999. Petitioners determined that, because Nippon is the largest producer of the subject merchandise in the Japanese market, Nippon’s prices would be representative of the normal value in the Japanese tin mill market. The Japanese home market prices for five sample models of tin plate products and thirteen sample models of tin free steel were obtained by foreign market research consultants in Japan. The prices used in the calculation of NV were delivered, VAT exclusive prices. Petitioners derived NV by deducting a commission from the delivered price, which represents payment made to large trading companies. Petitioners also deducted expenses for freight, handling, and other movement related expenses such as storage during transportation and tolls. For the calculation of dumping margins, petitioners compared the average unit value for all five sample sales of tin plate to the average customs value for the corresponding HTSUS item for the month of June 1999, and the average unit value for all thirteen sample sales of tin free steel to the

66894 Federal Register I Vol. 64, No. 229 I Tuesday, November 30, 1999 I Notices
average customs value for the corresponding HTSUS item for the month of June 1999.
The estimated dumping margins in the petition, based on a comparison between Nippon’s home market prices and U.S. prices derived from Ih4-145 statistics, range from 0.78 percent to 95.29 percent. Fair Value Comparisons
petitioners, there is reason to believe that imports of certain tin mill products from Japan are being, or are likely to be, sold at less than fair value. Allegations and Evidence of Material Injury and Causation
The petition alleges that the U.S. industry producing the domestic like product is being materially injured, and is threatened with material injury, by reason of the imports of the subject merchandise sold at less than fair value. Petitioners explained that the industry’s injured condition is evident in the declining trends in net operating profits, net sales volumes, and capacity utilization. The allegations of injury and causation are supported by relevant evidence including U.S. Customs import data, lost sales, and pricing information. The Department assessed the allegations and supporting evidence regarding material injury and causation, and determined that these allegations are supported by accurate and adequate evidence and meet the statutory requirements for initiation (see Attachments to Initiation Checklist, Re. Material Injury, November 17,1999). Initiation of Antidumping Investigation,
Based upon our examination of the petition on TMP and petitioners’ supplemental information clarifying the petition, we have found that the petition meets the requirements of section 732 of the Act. Therefore, we are initiating an antidumping duty investigation to determine whether imports of certain tin mill products from Japan are being, or are likely to be, sold in the United States at less than fair value. Unless the deadline is extended, we will make our preliminary determination no later than 140 days after the date of publication of this notice. Distribution of Copies of the Petitions
732@)(3)(A) of the Act, a copy of the public version of each petition has been provided to the representatives of Japan. We will attempt to provide a copy of the public version of each petition to each exporter named in the petition (as appropriate).
Based on the data provided by
In accordance with section
International Trade Commission Notification
We have notified the lTC of our initiation, as required by section 732(d) of the Act. Preliminary Determinations by the ITC
The ITC will determine, by December 13,1999, whether there is a reasonable indication that imports of certain tin mill products from Japan are causing material injury, or threatening to cause material injury, to a U.S. industry. A negative ITC determination will result in the investigation being terminated: otherwise, these investigations will proceed according to statutory and regulatory time limits.
section 777(i) of the Act.
Joseph A. Spetrini, Acting Assistant Secretary for Import Administmtion. [FR Doc. 99-30972 Filed 11-29-99; 8:45 am]
This notice is published pursuant to
Dated: November 17,1999.
BILLING CODE 35104S-P


APPENDIX B
WITNESSES AT THE COMMISSION’S CONFERENCE
B-I


CALENDAR OF PUBLIC CONFERENCE
Those listed below appeared as witnesses at the United States International Trade Commission’s conference:
Subject: Tin- and Chromium-Coated Steel Sheet from Japan
Inv. No.: 73 1 -TA-860 (Preliminary)
Date and Time: November 18,1999 - 9:30 a.m.
Sessions in connection with this investigation were held in Courtroom A, U.S. International Trade Commission, 500 E Street, SW, Washington, DC.
In Support of the Imposition of Antidumping Duties:
Schagrin Associates Washington, D.C.
on behalf of
Weirton Steel Corp. United Steel Workers of America, AFL-CIO Independent Steelworkers Union
Richard Riderer, Pres. and CEO, Weirton Steel Corp.
Earl Davis, Exec. VP Commerce, Weirton Steel Corp.
Dave Gill, General Manager, Tin Mill Products, Weirton Steel Corp.
Mark Glyptis, Pres., Independent Steelworkers Union
Stephen Francisco, Legislative Representative, United Steel Workers of America
Dr. Robert Scott, Economic Policy Institute
Roger Schagrin )-OF COUNSEL

In Opposition to the Imposition of An tidumping Duties:
Gibson, Dunn & Crutcher Washington, D.C.
on behalf of
Kawasaki Steel Corporation Nippon Steel Corporation Toyo Kohan Co. Ltd.
Willkie Farr & Gallagher Washington, D.C.
on behalf of
NKK Corporation
and
Kirkland & Ellis Washington, D.C.
on behalf of
Mitsui & Co. (U.S.A.), Inc.
Thomas J. Yurco, VP Materials Mgmt and Logistics, United States Can Co.
Robert Hall, Dir. of Purchasing, United States Can Co.
Patrick J. Rourke, VP Purchasing and Logistics, Brockway Standard, Inc.
Neils Peak, Senior VP-Sales, Nippon Steel Trading America, Inc.
Richard Sessions, Sales Mgr, Northern Region, Steel and Raw Materials Div., Itochu International Inc.
Daniel W. Klett, Principal, Capital Trade Incorporated
Donald Harrison )-OF COUNSEL, Gibson, Dunn & Crutcher Michelle A. Lewis )-OF COUNSEL, Gibson, Dunn & Crutcher James P. Durling )-OF COUNSEL, Willkie Farr & Gallagher Daniel L. Porter )-OF COUNSEL, Willkie Farr & Gallagher Kenneth G. Weigel )-OF COUNSEL, Kirkland & Ellis

APPENDIX C
SUMMARY DATA
c- 1


Table C-1 TCCSS: Summary data concerning the US. market, 1996-98, Jan.-Sept 1998, and Jan.-Sept. 1999
(Quantity=short tons, value=1,000 dollars, unit values, unit labor costs, and unit expenses are pcr short ton; period changes=pment, except whcre noted) Reported data Period changes
Jan.-Sept Jan.-SCpt lUm 1996 1997 1998 1998 1999 1996-98 1996-97 1997-98 1998-99
U.S. consumption quantity: Amount.. ................... 3,894,357 3,943,949 3,728,847 2,890,015 2,991,774 -4.3 I .3 -5.5 3.5 Producers' share (1) ........... 88.6 88.9 87. I 87.5 82.5 -1.5 0.3 -1.8 -4.9 Importers' share (1): Japan ...................... 5.1 5.1 6.2 6.0 8.9 1.1 -0.1 1.1 2.8 other sources ............... 6.3 6.0 6.7 6.5 8.6 0.4 -0.3 0.7 2.1 Total imports. .. 11.4 11.1 12.9 12.5 17.5 1.5 -0.3 1.8 4.9
Amount.. ................... 2,436,010 2,462,026 2,313,420 1,798,587 1,771,428 -5.0 1.1 -6.0 -1.5 Producers' share ( I ) 87.8 88.3 86.1 86.5 82.3 -1.8 0.5 -2.2 -4.3 Importers' share (1):
US. consumption value:
Japan ...................... 5.5 5.4 6.9 6.7 9.1 1.4 -0.1 1 .5 2.4 Other sources ........ 6.7 6.3 7.0 6.8 8.6 0.4 -0.4 0.8 1.8 Total imports.. ............ 12.2 11.7 13.9 13.5 17.7 1.8 -0.5 2.2 4.3
US. imports: Japan: Quantity. .................. Value ..................... Unit value. ................. Quantity. .................. Value ..................... Unit value.. ................
Quantity ................... Value ..................... Unit value.. ................
Other sources:
All sources:
us . producm': Average capacity quantity. .....
Capacity utilization ( I ) ........ Quantity. .................. Value ..................... Unit value.. ................
Quantity. .................. Value .....................
Production quantity. ..........
US. shipments:
Export shipments:
Ending inventory quantity. ..... lnventoriedtotal shipments (1) . . Production workers. .......... Hours worked ( 1,000s) ......... Wages paid ($l,OOOs). ......... Hourly wages. ............... Productivity (tons per 1,OOO hour) Unit labor costs. ............. Net sales: Quantity ................... Value ..................... Unit value. .................
Cost of goods sold (COGS). .... Gross profit or (loss) .......... SG&A expenses. ............. Operating income or (loss) ..... Capital expenditures ........... Unit COGS.. ................ Unit SG&A expenses. ......... Unit operating income or (loss) . . COGWsales (1) .............. Operating income or (loss)/ sales (1) ...................
199,196 134,056 $672.98
245,488 162,130 $660.44
444,684 296,186 $666.06
4,744,645 3,630,128
76.5
3,449,673 2,139,824
$620.30
190,482 122,380 $642.48 342,527
9.4 6,472
14,336 340,926 $23.78 253.2
$93.92
3,505,155 2,178,204
$621.43 2,15 1,448
26,756 97,100
(70,344) 145,279 $613.80 $27.70
($20.07) 98.8
-3.2
199,583 133,303 $667.91
238,538 154,740 $648.70
438,121 288,043 $657.45
4,819,645 3,677,752
76.3
3,505,828 2,173,983
$620.1 1
186,507 124,065 $665.20 366,598
9.9 6,283
13,953 345,659 $24.77 263.6
$93.99
3,693,888 2,298,395
$622.22 2,2 17,203
81,192 104,772 (23,580) 89,007
$600.24 $28.36 ($6.38)
96.5
-1.0
231,507 159,044 $687.00
250,104 162,989 $651.69
481,611 322,033 $668.66
4,833,645 3,386,077
70.1
3,247,236 1,99 1,387
$613.26
194,999 118,262 $606.47 356,570
10.4 5,635
12,427 315,027
$25.35 272.5
$93.04
3,439,861 2,109,669
$613.30 2,066,668
43,001 109,837 (66,836) 78,133
$600.80 $31.93
($19.43) 98.0
-3.2
174,153 120,442 $691.59
187,652 121,817 $649.16
361,805 242,259 $669.59
3,835,984 2,622,710
68.4
2,528,210 1,556,328
$615.58
136,063 84,153
$618.49 356,914
10.0 5,843 9,161
246,527 $26.91 286.3
$94.00
2,660,949 1,640,305
$616.44 1,585,070
55,235 82,367
(27,132) 45,030
$595.68 $30.95
96.6 (0 10.20)
265,382 161,869 $609.95
256,778 152,349 $593.3 I
522,159 3 14,2 18 $601.77
3,835,984 2,637,672
68.8
2,469,6 15 1,457,210
$590.06
172.870 98,676
$570.81 385,251
10.9 5,414 9,437
24 1,702 $25.61 279.5
$91.63
2,639,990 1,552,234
$587.97 1,557,720
81,533 (87,019) 90,488
$590.05 $30.88
($32.96) 100.4
(5,486)
-1.7 -5.6
16.2 18.6 2.1
1.9 0.5
-1.3
8.3 8.7 0.4
1.9 -6.7 -6.5
-5.9 -6.9 -1.1
2.4 -3.4 -5.6 4.1 0.9
-12.9 -13.3 -7.6 6.6 7.6
-0.9
-1.9 -3.1 -1.3 -3.9 60.7 13.1 5.0
-46.2 -2.1 15.3 3.2
-0.8
0.1
0.2 -0.6 -0.8
-2.8 -4.6 -1.8
-1.5 -2.7 -1.3
1.6 1.3
-0.2
I .6 1.6
-0.0
-2.1 1.4 3.5 7.0 0.5
-2.9 -2.7 1.4 4.2 4.1 0.1
5.4 5.5 0.1 3.1
203.5 7.9
66.5 -38.7 -2.2 2.4
68.2 -2.3
2.2
16.0 19.3 2.9
4.8 5.3 0.5
9.9 11.8
I .7
0.3 -7.9 -6.3
-7.4 -8.4 -1.1
4.6 -4.7 -8.8 -2.7 0.4
-10.3 -10.9
-8.9 2.3 3.4
-1.0
-6.9 -8.2 -1.4 -6.8
-47.0 4.8
-183.4 -12.2
0.1 12.6
-204.4 1.5
-2.1
52.4 34.4
-11.8
36.8 25.1 -8.6
44.3 29.7
-10.1
0.0 0.6 0.4
-2.3 -6.4 -4.1
27. I 17.3 -7.7 7.9 0.9
-7.3 3.0
-2.0 -4.8 -2.4 -2.5
-0.8 -5.4 -4.6 -1.7
-109.9 -1.0
-220.7 101.0
-0.9 -0.2
-223.3 3.7
-4.0
(1) "Reported data" are in percent and "period changes" are in percentage points.
Note.--Financial data are reported on a fiscal year basis and may not necessarily be comparable to data reported on a calendar year basis.
Source: Compiled from data submitted in response to Commission questionnaires, and from official Commerce statistics.
c-3


APPENDIX D
ALLEGED EFFECTS OF IMPORTS ON PRODUCERS' EXISTING DEVELOPMENT A N D PRODUCTION EFFORTS, GROWTH,
INVESTMENT, AND ABILITY TO RAISE CAPITAL
D- 1


The Commission requested U.S. producers to describe any actual or anticipated negative effects of imports of TCCSS from Japan on their return on investment or their growth, investment, ability to raise capital, and existing development and production efforts (including efforts to develop a derivative or more advanced version of the product), or their scale of capital investments undertaken as a result of such imports. The responses are as follows:
Actual Negative Effects
* * * * * * *
Anticipated Negative Effects
* * * * * * *
D-3