tip-enhanced raman spectroscopy: from concepts to ... · frontiers article tip-enhanced raman...
TRANSCRIPT

Chemical Physics Letters 659 (2016) 16–24
Contents lists available at ScienceDirect
Chemical Physics Letters
journal homepage: www.elsevier .com/locate /cplet t
Frontiers article
Tip-enhanced Raman spectroscopy: From concepts to practicalapplications
http://dx.doi.org/10.1016/j.cplett.2016.06.0350009-2614/� 2016 Elsevier B.V. All rights reserved.
⇑ Corresponding authors at: Department of Chemistry, University of Illinois atChicago, Chicago, IL 60607, United States (N. Jiang); Department of Chemistry,Northwestern University, Evanston, IL 60208, United States (R.P. Van Duyne).
E-mail addresses: [email protected] (N. Jiang), [email protected](R.P. Van Duyne).
Nan Jiang a,⇑, Dmitry Kurouski b, Eric A. Pozzi b, Naihao Chiang c, Mark C. Hersamb,c,d,Richard P. Van Duyne b,c,⇑aDepartment of Chemistry, University of Illinois at Chicago, Chicago, IL 60607, United StatesbDepartment of Chemistry, Northwestern University, Evanston, IL 60208, United StatescApplied Physics Graduate Program, Northwestern University, Evanston, IL 60208, United StatesdDepartment of Materials Science and Engineering, Northwestern University, Evanston, IL 60208, United States
a r t i c l e i n f o a b s t r a c t
Article history:Received 4 June 2016In final form 14 June 2016Available online 16 June 2016
Tip-enhanced Raman spectroscopy (TERS) is a powerful technique that integrates the vibrational finger-printing of Raman spectroscopy and the sub-nanometer resolution of scanning probe microscopy (SPM).As a result, TERS is capable of obtaining chemical maps of analyzed specimens with exceptional lateralresolution. This is extremely valuable for the study of interactions between molecules and substrates,in addition to structural characterization of biological objects, such as viruses and amyloid fibrils, 2Dpolymeric materials, and monitoring electrochemical and photo-catalytic processes. In this mini-review, we discuss the most significant advances of TERS, including: super high resolution chemicalimaging, monitoring of catalytic processes, incorporation of pulsed-excitation techniques, single-siteelectrochemistry, biosensing, and art conservation. We begin with a short overview of TERS, comparingit with other surface analytical techniques, followed by an overview of recent developments and futureapplications in TERS.
� 2016 Elsevier B.V. All rights reserved.
1. Introduction
The ability to observe chemical process on solid surfaces atmolecular length scales makes manipulating and controllingreactions at the single molecular level possible. Probing individualmolecules and surface sites allows one to obtain information thatmay otherwise be obscured due to ensemble averaging, makingnanoscale spatial resolution important. Among the various classesof techniques utilized to probe solid surfaces, surface vibrationalspectroscopy has gained enormous attention due to its ability tounderstand the structure–property relationship of nanoscale struc-tures and their chemical interactions with solid surfaces. However,classical spectroscopic techniques, including infrared, ultraviolet–visible, Raman, andfluorescence spectroscopy,which are commonlyused for such studies, are limited in terms of their spatial resolutionto about half thewavelength of the light because of the Abbe diffrac-tion limit. Recently invented super-resolution microscopy, such asphotoactivated localization microscopy (PALM) and direct stochas-
tical optical reconstruction microscopy (d-STORM), have provideda pathway for overcoming the Abbe diffraction limit in selectedcases [1–3]. However, super-resolution microscopy has a majordrawback, namely it requires labeling since not every molecule isfluorescent.
At the same time, Raman and IR spectroscopy are indispensabletools for the collection of chemical signatures pertaining to surfacedefects, mechanical deformation and thermal properties. Infraredspectroscopy and Raman spectroscopy have been extensively usedfor probing the vibrational states of gases, liquids and solids. Ininfrared spectroscopy, molecules absorb incident photons havingenergies equal to the energy differences between the ground andvibrational excited state of each IR-active molecular normal mode.On the other hand, in Raman spectroscopy, a molecule is firstexcited to a virtual or real electronic state and then relaxes backto the ground state concomitant with the emission of a photonwith an energy different from the incident wavelength by anamount equal to a vibrational quantum (inelastic scattering). Bothtechniques produce weak signals and generally require a largenumber of molecules to produce detectable signals.
Scanning probe microscopy (SPM) does not require light forsample imaging. Instead, a metal or silicon probe is used to obtaintopographic information and physical properties of analyzedspecimens. There are two major modalities of SPM: scanning

N. Jiang et al. / Chemical Physics Letters 659 (2016) 16–24 17
tunneling microscopy (STM) and atomic force microscopy (AFM).In addition to the topography, SPM can be used to acquireelectronic signatures of nanostructures. For instance, STM inelasticelectron tunneling spectroscopy (IETS) has made it possible toidentify the chemical fingerprint of a molecule adsorbed on a con-ducting surface [4]. This technique, however, requires the sampleto be measured at cryogenic temperatures to avoid thermalsmearing of electron energies. The IETS spectra have poorlyunderstood selection rules, and the number of observable modesis limited compared to other vibrational spectroscopic techniques.
In 2014, high-quality tip-enhanced IR spectroscopy wasreported by Lu et al. [5]. Enhanced signal was collected fromsamples as small as monolayer islands, and the authors attainedsensitivity exceeding that obtained by the best scattering near-field scanning optical microscopy (s-NSOM) systems. An estimated�300 molecules interacting with the AFM tip corresponded withan experimental sensitivity of �30 molecules. However, optimiz-ing the tip plasmon resonance to enhance the entire broadbandspectrum required for IR spectroscopy needs to be furtherdeveloped.
Tip-enhancedRaman spectroscopy (TERS) is a newpowerful ana-lytical technique that is capable of unraveling structural organiza-tion of the analyzed specimens with sub-nanometer spatialresolution. In TERS, scanning probe microscopy is coupled withRaman spectroscopy. Illumination of noble metal nanostructuresat the apex of a scanning probe with electromagnetic radiationcauses collective electron oscillations on the metal surface, knownas localized surface plasmon resonances (LSPR). LSPR inducesintense local electromagnetic fields, causing adrastic (108) enhance-ment of the Raman scattering signals emanating from moleculeslocated in a close vicinity to the metal surface. Therefore, spatialresolution in TERS is determined by the confinement of the electro-magnetic field and not by the wavelength of the illuminating light[6–10]. In addition to continuous-wave excitation, pulsed electro-magnetic radiation can be used. This allows for studying moleculardynamics near plasmonic surfaces, which elucidates mechanismsof plasmon-mediated chemical reactions, such as plasmonically-enhanced photocatalytic or photovoltaic processes.
Optical excitation of a noble metal SPM probe creates a highlyconfined electromagnetic field at the tip-sample junction, whichprovides significant enhancement to the Raman scattering, infra-red absorption, and fluorescence signals. With the presence of aplasmonic metal tip in close proximity to the surface (usuallywithin a few nanometers), field enhancement allows vibrationalsignatures of one or a few molecules to be quantitatively detectedand unambiguously identified. Unlike fluorescence spectroscopy,Raman spectroscopy is a relatively non-perturbative techniquethat does not require labels. The use of excitation overlappingthe molecular resonance of the analyte can provide a resonanceRaman contribution and a subsequent enhancement on the orderof 104 to 107. With this contribution, single-molecule detectioncan be achieved. Single-molecule detection was confirmed usinga low surface coverage argument, but also included spectral fluctu-ations and discrete signal losses as further confirmation [11]. Thefirst single-molecule work combined with STM topographic scan-ning was published by the Pettinger group, in which they analyzedBCB molecules on a smooth Au substrate using an Ag tip [12]. Son-ntag et al. illustrated single-molecule detection using moleculardiffusion and frequency shifts created by using the isotopicallylabeled R6G, so called the isotopologue approach, originally devel-oped for single-molecule surface-enhanced Raman spectroscopy(SMSERS) [13]. The TERS signal switches between the isotopes asthe molecules diffuse in and out the tip-sample junction. Thedetection of vibrations from single molecules makes TERS apowerful tool to study site-specific chemical structure andreactivity.
2. Concepts
2.1. Spatial resolution
The sub-nanometer spatial resolution of TERS allows for theunraveling of molecule–substrate interactions. Moreover, usingTERS, individual molecules can be imaged on atomically flat metalsurfaces. In the first TERS paper, Stöckle et al. recorded 25 spectraalong the boundary of (BCB) film dispersed on a glass support usinga Ag-coated AFM tip [6]. It was shown that only Raman spectraacquired over the BCB region exhibited the signature of the dyemolecule. Stöckle et al. concluded that spatial resolution is limitedto a size of an apex of the metal-coated tip.
Concurrent SPM imaging supplements TERS with topographicinformation. More importantly, monitoring spectral changes whenthe tip is moved across the surface can address the spatial resolu-tion directly. Both Deckert and co-workers [14] and Kawata andco-workers [15] have independently demonstrated sub-2 nmresolution TER images under ambient conditions (Fig. 1a and b).Published in Nature in 2013, Zhang et al. has further energized thisfield with their demonstration of sub-nm spatial resolution in thedetected Raman signal of a porphyrin under ultrahigh vacuumconditions, as shown in Fig. 1c [16]. The obtained TER images allowfor visualization of the inner structure of a single molecule. Alsodemonstrated in this work was the ability to correlate the observedRaman signal with a molecule’s local environment using TERimaging. This work has raised single molecule chemical imagingto an unprecedented level and sets the stage for future superhigh-resolution chemical imaging studies.
2.2. Chemical information
Another advantage of optical spectroscopy is its abundantchemical information. Chemical identification considerablyenhances the usefulness of SPM, especially on poorly defined sur-faces of technological interest. In 2012, Jiang et al., for the firsttime, resolved multiple vibrational modes for large polyatomicmolecular adsorbates on a solid surface in collected TER spectraobtained concurrently with molecular resolution topographicSPM imaging [17]. Furthermore, electronic structure calculationsand simulated Raman spectra were carried out using density-functional theory. The atomic motions involved in each mode havebeen detailed. This work allows the relationship between largepolyatomic molecular adsorbates and solid surfaces to be quantita-tively and unambiguously interrogated. Additionally, the theoriesof resonance Raman scattering have predicted dependence of theRaman intensity on the excitation wavelength. Recently, multipleexcitation wavelength TERS has been realized for the first timeon a porphyrin molecule under UHV conditions [18]. As shown inFig. 2, the excitation wavelengths were chosen to coincide withindividual Q-bands of the porphyrin, allowing the authors tosuccessfully resolve the spectral differences of different vibronicstates. Furthermore, simultaneous collections of TERS andtip-enhanced fluorescence with the same tip were demonstratedfor the first time.
Beyond fingerprinting identification, TERS can also unravel theintricacies of adsorbate–substrate interactions that are inaccessibleby other means. Klingsporn et al. compared the TER spectra of Rho-damine 6G (R6G) on Ag(111) surface at different temperatures [19].Theoretical analysis determined that the observed spectral changesupon sample coolingwere due to the strong interaction between theethylamine substituents and the Ag surface. Liu et al. used fishing-mode TERS to observe whether the tip-surface junction is bridgedby a single molecule. The clear correlations between the Ramanspectra and the measured conductance indicated that TERS could
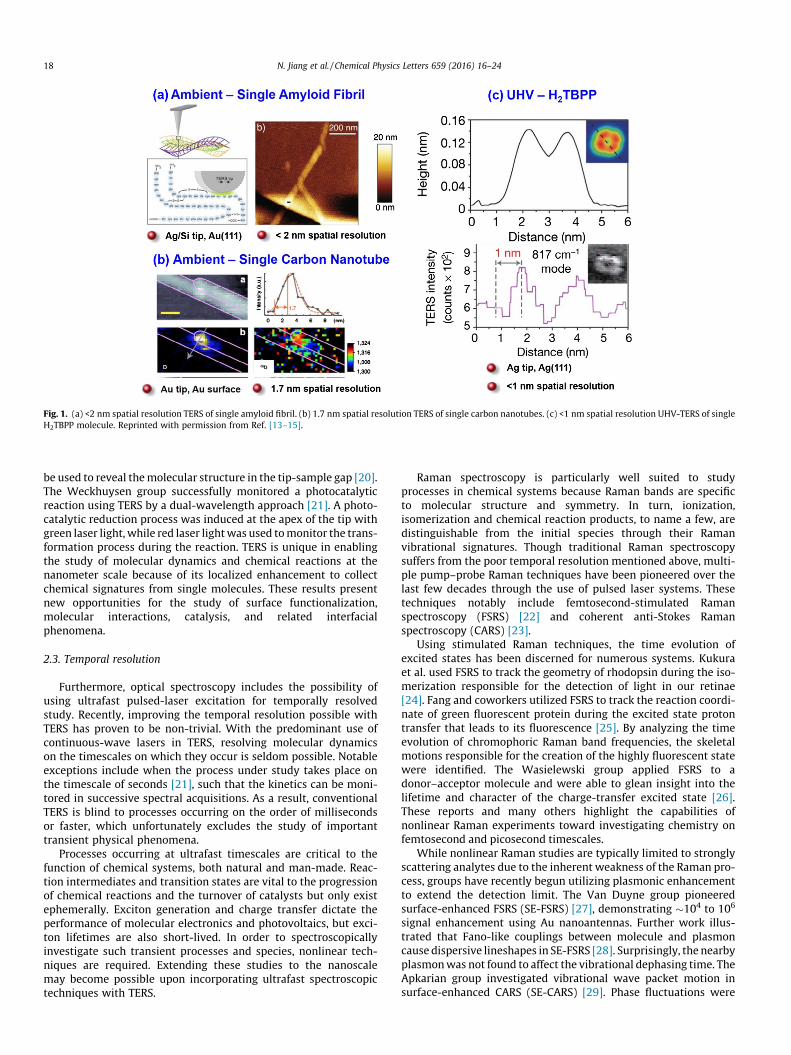
Fig. 1. (a) <2 nm spatial resolution TERS of single amyloid fibril. (b) 1.7 nm spatial resolution TERS of single carbon nanotubes. (c) <1 nm spatial resolution UHV-TERS of singleH2TBPP molecule. Reprinted with permission from Ref. [13–15].
18 N. Jiang et al. / Chemical Physics Letters 659 (2016) 16–24
be used to reveal themolecular structure in the tip-sample gap [20].The Weckhuysen group successfully monitored a photocatalyticreaction using TERS by a dual-wavelength approach [21]. A photo-catalytic reduction process was induced at the apex of the tip withgreen laser light, while red laser lightwas used tomonitor the trans-formation process during the reaction. TERS is unique in enablingthe study of molecular dynamics and chemical reactions at thenanometer scale because of its localized enhancement to collectchemical signatures from single molecules. These results presentnew opportunities for the study of surface functionalization,molecular interactions, catalysis, and related interfacialphenomena.
2.3. Temporal resolution
Furthermore, optical spectroscopy includes the possibility ofusing ultrafast pulsed-laser excitation for temporally resolvedstudy. Recently, improving the temporal resolution possible withTERS has proven to be non-trivial. With the predominant use ofcontinuous-wave lasers in TERS, resolving molecular dynamicson the timescales on which they occur is seldom possible. Notableexceptions include when the process under study takes place onthe timescale of seconds [21], such that the kinetics can be moni-tored in successive spectral acquisitions. As a result, conventionalTERS is blind to processes occurring on the order of millisecondsor faster, which unfortunately excludes the study of importanttransient physical phenomena.
Processes occurring at ultrafast timescales are critical to thefunction of chemical systems, both natural and man-made. Reac-tion intermediates and transition states are vital to the progressionof chemical reactions and the turnover of catalysts but only existephemerally. Exciton generation and charge transfer dictate theperformance of molecular electronics and photovoltaics, but exci-ton lifetimes are also short-lived. In order to spectroscopicallyinvestigate such transient processes and species, nonlinear tech-niques are required. Extending these studies to the nanoscalemay become possible upon incorporating ultrafast spectroscopictechniques with TERS.
Raman spectroscopy is particularly well suited to studyprocesses in chemical systems because Raman bands are specificto molecular structure and symmetry. In turn, ionization,isomerization and chemical reaction products, to name a few, aredistinguishable from the initial species through their Ramanvibrational signatures. Though traditional Raman spectroscopysuffers from the poor temporal resolution mentioned above, multi-ple pump–probe Raman techniques have been pioneered over thelast few decades through the use of pulsed laser systems. Thesetechniques notably include femtosecond-stimulated Ramanspectroscopy (FSRS) [22] and coherent anti-Stokes Ramanspectroscopy (CARS) [23].
Using stimulated Raman techniques, the time evolution ofexcited states has been discerned for numerous systems. Kukuraet al. used FSRS to track the geometry of rhodopsin during the iso-merization responsible for the detection of light in our retinae[24]. Fang and coworkers utilized FSRS to track the reaction coordi-nate of green fluorescent protein during the excited state protontransfer that leads to its fluorescence [25]. By analyzing the timeevolution of chromophoric Raman band frequencies, the skeletalmotions responsible for the creation of the highly fluorescent statewere identified. The Wasielewski group applied FSRS to adonor–acceptor molecule and were able to glean insight into thelifetime and character of the charge-transfer excited state [26].These reports and many others highlight the capabilities ofnonlinear Raman experiments toward investigating chemistry onfemtosecond and picosecond timescales.
While nonlinear Raman studies are typically limited to stronglyscattering analytes due to the inherent weakness of the Raman pro-cess, groups have recently begun utilizing plasmonic enhancementto extend the detection limit. The Van Duyne group pioneeredsurface-enhanced FSRS (SE-FSRS) [27], demonstrating �104 to 106
signal enhancement using Au nanoantennas. Further work illus-trated that Fano-like couplings between molecule and plasmoncause dispersive lineshapes in SE-FSRS [28]. Surprisingly, the nearbyplasmonwas not found to affect the vibrational dephasing time. TheApkarian group investigated vibrational wave packet motion insurface-enhanced CARS (SE-CARS) [29]. Phase fluctuations were
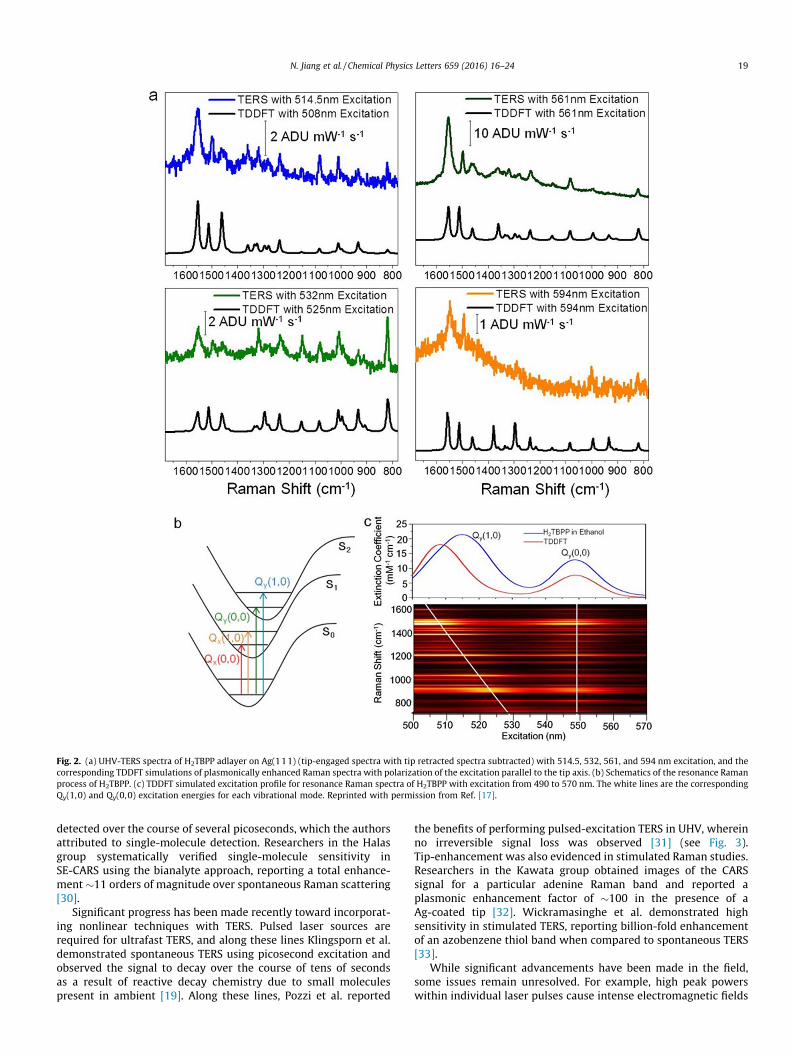
Fig. 2. (a) UHV-TERS spectra of H2TBPP adlayer on Ag(111) (tip-engaged spectra with tip retracted spectra subtracted) with 514.5, 532, 561, and 594 nm excitation, and thecorresponding TDDFT simulations of plasmonically enhanced Raman spectra with polarization of the excitation parallel to the tip axis. (b) Schematics of the resonance Ramanprocess of H2TBPP. (c) TDDFT simulated excitation profile for resonance Raman spectra of H2TBPP with excitation from 490 to 570 nm. The white lines are the correspondingQy(1,0) and Qy(0,0) excitation energies for each vibrational mode. Reprinted with permission from Ref. [17].
N. Jiang et al. / Chemical Physics Letters 659 (2016) 16–24 19
detected over the course of several picoseconds, which the authorsattributed to single-molecule detection. Researchers in the Halasgroup systematically verified single-molecule sensitivity inSE-CARS using the bianalyte approach, reporting a total enhance-ment �11 orders of magnitude over spontaneous Raman scattering[30].
Significant progress has been made recently toward incorporat-ing nonlinear techniques with TERS. Pulsed laser sources arerequired for ultrafast TERS, and along these lines Klingsporn et al.demonstrated spontaneous TERS using picosecond excitation andobserved the signal to decay over the course of tens of secondsas a result of reactive decay chemistry due to small moleculespresent in ambient [19]. Along these lines, Pozzi et al. reported
the benefits of performing pulsed-excitation TERS in UHV, whereinno irreversible signal loss was observed [31] (see Fig. 3).Tip-enhancement was also evidenced in stimulated Raman studies.Researchers in the Kawata group obtained images of the CARSsignal for a particular adenine Raman band and reported aplasmonic enhancement factor of �100 in the presence of aAg-coated tip [32]. Wickramasinghe et al. demonstrated highsensitivity in stimulated TERS, reporting billion-fold enhancementof an azobenzene thiol band when compared to spontaneous TERS[33].
While significant advancements have been made in the field,some issues remain unresolved. For example, high peak powerswithin individual laser pulses cause intense electromagnetic fields

Fig. 3. (A) Waterfall plot of sixty 5 s TER spectra of R6G collected using ps irradiation (k = 532 nm, Pex = 0.05 W/cm2). The initially retracted Ag tip was brought into tunnelingrange at t = 60 s. (B) CW TER engaged (blue) and retracted (gray) spectra (k = 532 nm, Pex = 1.3 W/cm2, tacq = 30 s) plotted above averages of 12 ps TER engaged spectra withsignal/noise ratios above 12 (red) and 12 retracted spectra (gray) from (A). Black lines represent individual and composite peak fits. The included scale bar applies to allplotted spectra. Reprinted with permission from Ref. [31]. (For interpretation of the references to colour in this figure legend, the reader is referred to the web version of thisarticle.)
20 N. Jiang et al. / Chemical Physics Letters 659 (2016) 16–24
and likely heat at the tip-sample junction, potentially affecting thestability of molecules in the enhancing region. Unwanted chemicalreactions and surface diffusion may result, especially whenperformed in ambient. As a result, particular molecular systemsare expected to be more stable than others under pulsed irradia-tion. Changes in the fine structure of the probe are also possiblein analogy to previous studies on plasmonic colloids and surfaces[27,34], and preferred probe geometries and compositions maybe discerned.
The successful combination of broadband stimulated Ramantechniques with TERS will enable investigation of transientbehavior in molecular systems with nanoscale spatial resolution.Sub-populations and potentially single molecules may be interro-gated, allowing surface sites and adsorption configurations to bedifferentiated and correlated with transient kinetics. Resultingexperiments have the potential to characterize ultrafast processesat the molecular level with unprecedented detail.
3. Applications
3.1. Applications of TERS in material and life sciences
A growing body of evidence demonstrates that TERS can besuccessfully utilized in various research areas ranging from mate-rials and life sciences to conservation art science. For example, ithas been shown that TERS is capable of detecting small defectsand contaminations in graphene sheets [35–38]. Shaffel et al.found that intensity of the graphene D band (1350 cm�1)significantly increased in the presence of graphene defects, as wellas at the edges of graphene sheets [39]. At the same time, in-planemodes, such as G band, were found to be weakly enhanced becauseof their non-optimal orientation perpendicular to the tip [40].These studies showed that TERS can be used to probe electronicproperties of carbon 2D materials.
Recently, Peica et al. demonstrated that TERS can be utilized toprobe structural organization of 3D carbon materials, such as car-bon nanotubes [41]. Specifically, using TERS, single-walled carbonnanotubes could be identified within a carbon nanotube bundle.
Separately, Yano et al. showed that mechanical properties of carbonnanotubes can be explored by TERS [42]. It has been found that anincrease in pressure on the nanotube induced by AFM tip caused ashift in the G mode frequency on around 10 cm�1. These studiesrevealed that TERS can be utilized to investigate properties of 2Dand 3D carbon materials at the nanoscale.
Additionally, Van Schrojenstein et al. showed that TERS could beused to monitor photocatalytic conversion of p-nitrothiophenoladsorbed on gold nanoplates [43]. This study demonstrated thatTERS allows one to overcome averaging effects of standardexperiments and is able to study chemical reactions and moleculedynamics at the nanoscale.
Label-free high-resolution examination of chemical compositionpossible in TERS makes it an attractive technique for the structuralcharacterization of complex biological systems, such as cells,viruses or bacteria. For example, a TERS study of a single tobaccomosaic virus revealed the presence of both coat proteins and RNAcomponents on its surface [44]. Separately, Böhme et al.demonstrated that protein and lipid components can be resolvedon the cell surface using TERS [45]. In the acquired TER spectraauthors also observed vibrational modes originating from oligosac-charides. Using advance spectral processing algorithms Richteret al. showed that using TERS both protein and lipid domains couldbe differentiated at the nanometer scale [46].
Macromolecules and protein aggregates, such as DNA, RNA,amyloid and collagen fibrils, were also extensively studied by TERS.For example, the high spatial resolution of TERS allowed research-ers to resolve individual nucleobases on both RNA and DNA strands[47,48]. It was demonstrated that all four nucleobases could beidentified on both RNA and DNA strands [49,50]. Recently, Lipiecet al. reported that, using TERS, molecular structure of terminalgroups at DNA fragments can be probed, which consequentlyallowed the authors to identify double strand breaks of DNA[51]. Based on the acquired TER spectra authors proposed thatUV radiation likely causes C@O band cleavage.
Amyloid fibrils are b-sheet rich protein aggregates that arestrongly associated with various neurodegenerative diseases [52].TERS studies of insulin fibrils revealed that their surface is hetero-geneous from the viewpoint of both protein secondary structure

GG
G
1594
1541
1425
1344
A
1600 1400 1200 1000 800 600
212 ADU mW-1s-1
Raman shift (cm-1)In
tens
ity
800
*
C
121212
6412
77
1100
G
1329
1
G
B
D E
100 µm
Fig. 4. TER spectra of (A) iron gall ink spot on 19th century historical paper engaged(blue) and retracted (black). TER spectrum of (B) the AFM Ag-coated tip removedfrom the fiber immediately after data acquisition. Normal Raman spectrum of (C)gallic acid powder. Fragment of 19th century letter (D) and a micrograph of thepaper crack (E). Red arrow indicates the spot where the AFM Agcoated tip waspositioned. Peaks corresponding to the vibrational modes of glucose are marked by‘‘G”. The asterisk (⁄) indicates the peak at 521 cm�1 which results from silicon onthe AFM tip. TER spectra acquired using kex = 532 nm; tacq = 4 s; Pex � 0.36 mW.Normal Raman spectrum acquired using kex = 785 nm; tacq = 10 s; Pex � 1 mW.Reprinted with permission from Ref. [52]. (For interpretation of the references tocolour in this figure legend, the reader is referred to the web version of this article.)
N. Jiang et al. / Chemical Physics Letters 659 (2016) 16–24 21
and amino acid composition [14,53]. It has been shown that onlyaround a third of insulin fibril surface was composed of b-sheet,which may template aggregation of misfolded protein, while therest of it was dominated by mixtures of a-helix and unorderedprotein. This discovery indicated that amyloid fibrils have differentinside (cross-b-sheet core) and outside (surface) structural organi-zation. Kurouski et al. also demonstrated that b-sheet clusters andareas dominated by a-helix/unordered protein secondary struc-tures have different amino acid compositions. It has been foundthat aromatic amino acids, such as tyrosine and phenylalanine, aswell as cysteine are much more frequently present on b-sheetclusters than on the areas dominated by a-helix/unorderedprotein. At the same time, proline, which is known to disruptb-sheet integrity, is much more abundant in a-helix/unorderedprotein clusters. TERS was also utilized to probe surface organiza-tion of insulin fibril polymorphs with different topologies: flat, tapelike and twisted [54]. It has been found that surfaces of thesepolymorphs have distinctively different amino acid compositionand protein secondary structures. Also, for the first time thesurface of filaments, precursors of fibril, was investigated. Compar-ison of amino acid propensities and protein secondary structureson the surface of the filaments with mature fibrils elucidated themechanism of filament propagation into mature insulin fibrils.
These studies also revealed the challenges faced by TERS for theinvestigation of structural organization of complicatedmacroscopicbiosystems. First, many biological molecules, such as amino acidsand lipids, often have the same chemical groups, which conse-quently will give the same vibrational bands in Raman spectra.Therefore, it is often difficult to achieve unambiguous assignmentof the vibrational bands and consequently identify these molecules[55,56]. Secondly, TER spectra acquired form protein moleculesoften lack amide bands, which limits their utilization fordetermining protein secondary structure. Kurouski et al. hasrecently proposed that this can be due to a distancing of the peptidebond from the roughmetal surface of STM or AFM tip by amino acidside chains [57].However, it is likely that other factors,whichare yetunknown, can contribute to the amide bonds suppression [56].Finally, the short lifetime of SPM probes and their possiblecontamination during spectral acquisition limits TERS imaging oflarge areas of biological objects, such as cells.
3.2. Applications of TERS in art conservation science
Confirmatory, non-destructive and non-invasive identificationof colorants in situ is highly important for the understanding ofhistorical context and for the long-term preservation of culturalheritage objects [58–60]. It was recently demonstrated that TERScan identify indigo dye and iron gall ink in situ on Kinwashi paper[61]. In this proof-of-concept work, Ag-coated AFM tip wasapproached at the surface of the paper and illuminated it with532 nm laser radiation. TER spectra were directly acquired fromthe paper using low laser powers (�0.2 mW) and fast acquisitiontimes (3–10 s) avoiding any damage or photo-degradation to thedyed paper. Authors demonstrated that TER spectra collected fromKinwashi paper dyed in 0.5 M indigo solution exhibit vibrationalbands originating from indigo, cellulose and its monomer glucose.This study revealed that, using TERS, organic dyes can benon-destructively and non-invasively identified directly onartwork. It also showed that TERS was able to resolve chemicalcomposition of the paper down to its monomers.
Authors also demonstrated that TERS can be utilized foridentification of iron gall ink on historical documents. For example,a fragment of the latter dated to the 19th century with a handwritten text was investigated by positioning a Ag-coated AFM tipon a single fiber of paper near the circumference of one of thecracks, as shown in Fig. 4D (red arrows). The acquired TER spectra
exhibited vibrational modes corresponding to gallic acid, the maincomponent of iron gall ink, and glucose, a cellulose monomer.These results indicated that TERS allowed for the identification ofindividual components in the complex chemical mixture such asiron gall ink, which could not be achieved using normal Ramanspectroscopy even with higher powers and longer acquisitiontimes. This work demonstrated the great potential of TERS as anadditional spectroscopic tool for minimally invasive compositionalcharacterization of artworks in situ and opened exciting newpossibilities for cultural heritage research.
3.3. Electrochemical scanning probe microscopy and TERS
Chemical and physical processes that take place at solid/liquidinterfaces have been intensively investigated in recent years[62,63]. These studies allowed researchers to understand funda-mental mechanisms of electron and ion transfers at the solid/liquidinterfaces and consequently were the basis for different batteries,

Fig. 5. Stack plot (A) and individual (B) EC-TER spectra of NB acquired at different potentials during cyclic voltammetry (CV) showing reversible reduction and oxidation ofNB. P = 110 lW, t = 1 s, k = 633 nm, scan rate = 10 mV/s. The asterisk denotes the Si Raman band from the AFM tip. (C) Background subtracted CV of NB on ITO acquiredconcurrently with the EC-TER spectra in (A). E00 = �0.215 V. (D) Charge acquired by integrating the CV in (C). The charge is directly proportional to the number of moleculesreduced during the CV. The reverse sweep is offset by 0.6 lC/cm2 for clarity. (E) Potential dependence of the integrated TERS intensity of the 591 cm�1 band of NBOX. Theblack lines are meant to highlight the dependence as a guide for the reader. The intensity–potential profiles strongly resemble the mirror image of the charge shown in (D). AllTERS intensities were normalized to the initial value at 0.0 V vs Ag/AgCl. The reverse sweep is offset for clarity. TERS spectra in (A) and TERS voltammograms in (E) are theaverage of four experiments. Reprinted with permission from Ref. [72].
22 N. Jiang et al. / Chemical Physics Letters 659 (2016) 16–24
semiconductors, fuel cells, and solar cells [64]. Cyclic voltammetryin general and scanning electrochemical microscopy (SECM) andscanning electrochemical cell microscopy (SECCM) in particular,are commonly used to study electrochemical reactions atsolid–liquid interfaces [65–67]. Precise measurements of the cur-rent and voltage allow one to acquire valuable information aboutchemical and physical processes at the interfaces, such as diffusion,adsorption, electron and ion transfers. Applications of other tech-niques, such as quartz crystal microbalance (QCM) [68], infrared,Raman and surface enhanced Raman spectroscopies [69,70] havedrastically expanded our understanding about electrochemical pro-cesses at solid/liquid interfaces. The invention of SPM significantlyimpacted studies of solid/liquid interface processes because of itsability to acquire information about the surface structure withatomic resolution in real time and real space. In particular, it wasfound that adsorption–desorption reactions of hydrogen is stronglydependent on the crystallographic orientation of platinum [71].Development of electrochemical SPM (ECSPM) by coupling STMwith electrochemistry brought substantial progress in surface andinterface research [72–74]. In this setup, the bias potential of theSTM tip and the sample can be separately controlled using abipotentiostat. This allowed researchers to study surface reactionsat the nanoscale and manipulate surface objects, as well as monitoroxidation–reduction conversion of the single molecule [66,75].
The Van Duyne group has recently demonstrated the first AFMelectrochemical TERS (EC-TERS) [76]. Kurouski et al. investigatednanoscale redox behavior of Nile Blue (NB) and compared theseresults with conventional cyclic voltammetry (CV). NB undergoestwo electron, one proton reduction at negative potentials(��0.5 V vs Ag/AgCl) at pH above 6. While the oxidized form ofNB (NBO) absorbs light at �630 nm, the reduced one (NBR) lacksabsorption in this spectral region. Instead, it exhibits severalabsorption bands in the near-UV (261, 362 and 405 nm). In theEC-TERS experiment, NB was adsorbed onto indium tin oxide(ITO) film, which was used as the working electrode (WE). Ptand Ag/AgCl were used as the counter and reference electrodesrespectively. After the Au-coated AFM tip was positioned on theWE, changes in acquired TER spectra were monitored as thepotential was swept from 0.0 to �0.6 V vs Ag/AgCl and returnedback to 0.0 V vs Ag/AgCl (Fig. 5). Kurouski et al. found that overallintensities of the spectra decreased with a decrease of thepotential, in agreement with the change in electronic state, fromNBO to NBR. As the potential was swept from �0.6 V backto 0.0 V, �75% of the initial spectral intensity returned,demonstrating reversibility of the monitored redox reaction ofNB under the AFM.
Recently, the Ren group reported that STM EC-TERS could be uti-lized to monitor arrangements of (40-(pyridin-4-yl)biphenyl-4-yl)
N. Jiang et al. / Chemical Physics Letters 659 (2016) 16–24 23
methanethiol (4-PBT) on Au(111) as a result of its protonation anddeprotonation [77]. The authors pointed out that such informationabout potential-dependent re-configuration of 4-PBT could not beobtained from EC-SERS experiments. This work demonstrated thatinsulation of STM tips, necessary for reducing Faradaic current fromtip shaft, could be successfully achieved. Zeng et al. proposed toembed freshly etched Au or Ag wire into polyethylene glue, whichallowed the tip apex to remain plasmonically active [77].
These findings demonstrate that TERS can be successfully usedto monitor electrochemical processes at the nanoscale. They showthat, using TERS, one can understand how the number of molecularbinding sites changes the electrochemical properties of themolecule, including its formal potentials and the electron transferkinetics. One can expect that these findings will help to developour understanding of plasmon-driven electron transfer as well asto improve the performance of solar cells and batteries.
4. Concluding remarks
With the aid of TERS, the unambiguous and quantitativeinterrogation of individual molecules can be explored in detail.Simultaneous detection of SPM topography and vibrationalsignatures makes TERS a powerful tool for studying light-matterinteraction at the single-molecule level. TERS can be performed ina variety of environments (UHV, controlled atmosphere, liquid)and at variable temperatures. The capability of combining pulsedlaser excitationwith TERS gives the opportunity of performingmea-surements with simultaneous high spatial and temporal resolution.
The recent applications of TERS has been demonstrated invarious research areas ranging from electrochemistry to artconservation science. It shows that TERS can be used to investigatestructural organization of biological specimens, such as cellmembranes and amyloid fibrils. Using this powerful analyticaltechnique, amino acid composition and protein secondarystructure on the surface of these physiologically active speciescould be unraveled. Moreover, TERS can be used to unravelphysical properties and defects in polymeric materials. The reviewalso shows how TERS can be utilized to monitor electrochemicaland photocatalytic reactions. Sub-nanometer spatial resolutionand single-molecule sensitivity of TERS makes it highly desirablefor probing electrochemical and electrocatalytic reactions atdifferent surface sites, such as lattices, edges and vacancies. Onecan expect that these findings will transform our understandingabout catalysis, electron transfer and energy storage. Therefore,TERS has the potential to have great scientific impact throughunderstanding site-specific chemical reactivity at surfaces.
Acknowledgments
E.A.P. and R.P.V.D. acknowledge support from the NationalScience Foundation Center for Chemical Innovation dedicated toChemistry at the Space-Time Limit (CaSTL) Grant CHE-1414466.D.K. and R.P.V.D were supported by the Air Force Office of ScientificResearch MURI (FA9550-14-1-0003). N.J., N.C., M.C.H. and R.P.V.D.acknowledge funding from the Department of Energy Office ofBasic Energy Sciences (SISGR Grant DE-FG02-09ER16109). E.A.P.,M.C.H., and R.P.V.D. also acknowledge support from the NationalScience Foundation Materials Research Science and EngineeringCenter (DMR-1121262). E.A.P. was additionally supported by theNational Science Foundation Graduate Research Fellowship underGrant DGE-1324585.
References
[1] S.W. Hell, J. Wichmann, Opt. Lett. 19 (1994) 780.[2] M.J. Rust, M. Bates, X.W. Zhuang, Nat. Methods 3 (2006) 793.
[3] E. Betzig, G.H. Patterson, R. Sougrat, O.W. Lindwasser, S. Olenych, J.S.Bonifacino, M.W. Davidson, J. Lippincott-Schwartz, H.F. Hess, Science 313(2006) 1642.
[4] B.C. Stipe, M.A. Rezaei, W. Ho, Science 280 (1998) 1732.[5] F. Lu, M.Z. Jin, M.A. Belkin, Nat. Photon. 8 (2014) 307.[6] R.M. Stockle, Y.D. Suh, V. Deckert, R. Zenobi, Chem. Phys. Lett. 318 (2000) 131.[7] B. Pettinger, G. Picardi, R. Schuster, G. Ertl, Electrochemistry 68 (2000)
942.[8] N. Hayazawa, Y. Inouye, Z. Sekkat, S. Kawata, Opt. Commun. 183 (2000) 333.[9] M.S. Anderson, Appl. Phys. Lett. 76 (2000) 3130.[10] N. Jiang, N. Chiang, L.R. Madison, E.A. Pozzi, M.R. Wasielewski, T. Seideman, M.
A. Ratner, M.C. Hersam, G.C. Schatz, R.P. Van Duyne, Nano Lett. 16 (2016) 3898.[11] C.C. Neacsu, J. Dreyer, N. Behr, M.B. Raschke, Phys. Rev. B 73 (2006) 193406.[12] J. Steidtner, B. Pettinger, Phys. Rev. Lett. 100 (2008) 236101.[13] M.D. Sonntag, J.M. Klingsporn, L.K. Garibay, J.M. Roberts, J.A. Dieringer, T.
Seideman, K.A. Scheidt, L. Jensen, G.C. Schatz, R.P. Van Duyne, J. Phys. Chem. C116 (2012) 478.
[14] T. Deckert-Gaudig, E. Kammer, V. Deckert, J. Biophoton. 5 (2012) 215.[15] C. Chen, N. Hayazawa, S. Kawata, Nat. Commun. 5 (2014) 3312.[16] R. Zhang, Y. Zhang, Z.C. Dong, S. Jiang, C. Zhang, L.G. Chen, L. Zhang, Y. Liao, J.
Aizpurua, Y. Luo, J.L. Yang, J.G. Hou, Nature 498 (2013) 82.[17] N. Jiang, E.T. Foley, J.M. Klingsporn, M.D. Sonntag, N.A. Valley, J.A. Dieringer, T.
Seideman, G.C. Schatz, M.C. Hersam, R.P. Van Duyne, Nano Lett. 12 (2012)5061.
[18] N.H. Chiang, N. Jiang, D.V. Chulhai, E.A. Pozzi, M.C. Hersam, L. Jensen, T.Seideman, R.P. Van Duyne, Nano Lett. 15 (2015) 4114.
[19] J.M. Klingsporn, N. Jiang, E.A. Pozzi, M.D. Sonntag, D. Chulhai, T. Seideman, L.Jensen, M.C. Hersam, R.P. Van Duyne, J. Am. Chem. Soc. 136 (2014) 3881.
[20] Z. Liu, S.Y. Ding, Z.B. Chen, X. Wang, J.H. Tian, J.R. Anema, X.S. Zhou, D.Y. Wu, B.W. Mao, X. Xu, B. Ren, Z.Q. Tian, Nat. Commun. 2 (2011) 305.
[21] E.M. van Schrojenstein Lantman, T. Deckert-Gaudig, A.J.G. Mank, V. Deckert, B.M. Weckhuysen, Nat. Nanotechnol. 7 (2012) 583.
[22] P. Kukura, D.W. McCamant, R.A. Mathies, Annu. Rev. Phys. Chem. 58 (2007)461.
[23] J.X. Cheng, X.S. Xie, J. Phys. Chem. B 108 (2004) 827.[24] P. Kukura, D.W. McCamant, S. Yoon, D.B. Wandschneider, R.A. Mathies, Science
310 (2005) 1006.[25] C. Fang, R.R. Frontiera, R. Tran, R.A. Mathies, Nature 462 (2009) 200.[26] J.V. Lockard, A. Butler Ricks, D.T. Co, M.R. Wasielewski, J. Phys. Chem. Lett. 1
(2009) 215.[27] R.R. Frontiera, A.I. Henry, N.L. Gruenke, R.P. Van Duyne, J. Phys. Chem. Lett. 2
(2011) 1199.[28] R.R. Frontiera, N.L. Gruenke, R.P. Van Duyne, Nano Lett. 12 (2012) 5989.[29] S. Yampolsky, D.A. Fishman, S. Dey, E. Hulkko, M. Banik, E.O. Potma, V.A.
Apkarian, Nat. Photon. 8 (2014) 650.[30] Y. Zhang, Y.R. Zhen, O. Neumann, J.K. Day, P. Nordlander, N.J. Halas, Nat.
Commun. 5 (2014) 4424.[31] E.A. Pozzi, M.D. Sonntag, N. Jiang, N. Chiang, T. Seideman, M.C. Hersam, R.P.
Van Duyne, J. Phys. Chem. Lett. 5 (2014) 2657.[32] T. Ichimura, N. Hayazawa, M. Hashimoto, Y. Inouye, S. Kawata, Phys. Rev. Lett.
92 (2004).[33] H.K. Wickramasinghe, M. Chaigneau, R. Yasukuni, G. Picardi, R. Ossikovski, ACS
Nano 8 (2014) 3421.[34] J.C. Hulteen, M.A. Young, R.P. Van Duyne, Langmuir 22 (2006) 10354.[35] A.C. Ferrari, J.C. Meyer, V. Scardaci, C. Casiraghi, M. Lazzeri, F. Mauri, S.
Piscanec, D. Jiang, K.S. Novoselov, S. Roth, A.K. Geim, Phys. Rev. Lett. 97 (2006)187401.
[36] R. Zhao, Y. Zhang, T. Gao, Y. Gao, N. Liu, L. Fu, Z. Liu, Nano Res. 4 (2011) 712.[37] Y. Zhang, T. Gao, Y. Gao, S. Xie, Q. Ji, K. Yan, H. Peng, Z. Liu, ACS Nano 5 (2011)
4014.[38] M. Tommasini, C. Castiglioni, G. Zerbi, Phys. Chem. Chem. Phys. 11 (2009)
10185.[39] F. Schaffel, M. Wilson, A. Bachmatiuk, M.H. Rummeli, U. Queitsch, B.
Rellinghaus, G.A. Briggs, J.H. Warner, ACS Nano 5 (2011) 1975.[40] K.F. Domke, B. Pettinger, J. Raman Spectrosc. 40 (2009) 1427.[41] N. Peica, C. Thomsen, J. Maultzsch, Nanoscale Res. Lett. 6 (2011) 174.[42] T. Yano, P. Verma, Y. Saito, T. Ichimura, S. Kawata, Nat. Photon. 2009 (2009)
473.[43] E.M. van Schrojenstein Lantman, T. Deckert-Gaudig, A.J. Mank, V. Deckert, B.M.
Weckhuysen, Nat. Nanotechnol. 7 (2012) 583.[44] D. Cialla, T. Deckert-Gaudig, C. Budich, M. Laue, R. Moller, D. Naumann, V.
Deckert, J. Popp, J. Raman Spectrosc. 40 (2009) 240.[45] R. Bohme, D. Cialla, M. Richter, P. Rosch, J. Popp, V. Deckert, J. Biophoton. 3
(2011) 455.[46] M. Richter, M. Hedegaard, T. Deckert-Gaudig, P. Lampen, V. Deckert, Small 7
(2011) 209.[47] R. Treffer, R. Bohme, T. Deckert-Gaudig, K. Lau, S. Tiede, X. Lin, V. Deckert,
Biochem. Soc. Trans. 40 (2012) 609.[48] R. Treffer, V. Deckert, Curr. Opin. Biotechnol. 21 (2010) 4.[49] R. Treffer, X. Lin, E. Bailo, T. Deckert-Gaudig, V. Deckert, Beilstein J.
Nanotechnol. 2 (2011) 628.[50] A. Rasmussen, V. Deckert, J. Raman Spectrosc. 37 (2006) 311.[51] E. Lipiec, R. Sekine, J. Bielecki, W.M. Kwiatek, B.R. Wood, Angew. Chem. 53
(2014) 169.[52] T.P. Knowles, M. Vendruscolo, C.M. Dobson, Nat. Rev. Mol. Cell Biol. 15 (2014)
384.

24 N. Jiang et al. / Chemical Physics Letters 659 (2016) 16–24
[53] D. Kurouski, T. Deckert-Gaudig, V. Deckert, I.K. Lednev, J. Am. Chem. Soc. 134(2012) 13323.
[54] D. Kurouski, T. Deckert-Gaudig, V. Deckert, I.K. Lednev, Biophys. J. 106 (2014)263.
[55] C. Blum, T. Schmidt, L. Opilik, S. Weidmann, S.R. Fagerer, R. Zenobi, J. RamanSpectrosc. 43 (2012) 1895.
[56] C. Blum, L. Opilik, J.M. Atkin, K. Braun, S.B. Kammer, V. Kravtsov, N. Kumar, S.Lemeshko, J.-F. Li, K. Luszcz, T. Maleki, A.J. Meixner, S. Minne, M.B. Raschke, B.Ren, J. Rogalski, D. Roy, B. Stephanidis, X. Wang, D. Zhang, J.-H. Zhong, R.Zenobi, J. Raman Spectrosc. 45 (2014) 22.
[57] D. Kurouski, T. Postiglione, T. Deckert-Gaudig, V. Deckert, I.K. Lednev, Analyst138 (2013) 1665.
[58] C.L. Brosseau, F. Casadio, R.P. Van Duyne, J. Raman Spectrosc. 42 (2011) 1305.[59] C.L. Brosseau, A. Gambardella, F. Casadio, C.M. Grzywacz, J. Wouters, R.P. Van
Duyne, Anal. Chem. (Washington, DC, U.S.) 81 (2009) 3056.[60] F. Casadio, M. Leona, R. Lombardi John, R.P. Van Duyne, Acc. Chem. Res. 43
(2010) 782.[61] D. Kurouski, S. Zaleski, F. Casadio, R.P. Van Duyne, N.C. Shah, J. Am. Chem. Soc.
(2014).[62] D. Wang, L.-J. Wan, J. Phys. Chem. C 111 (2007) 16109.[63] S. Yoshimoto, K. Itaya, Annu. Rev. Anal. Chem. (Palo Alto, Calif.) 6 (2013) 213.[64] A.J. Bard, H.D. Abruna, C.E. Chidsey, L.R. Faulkner, S.W. Feldberg, K. Itaya, M.
Majda, O. Melroy, R.W. Murray, J. Phys. Chem. 40 (1993) 1162.[65] T. Sun, Y. Yu, B.J. Zacher, M.V. Mirkin, Angew. Chem. Int. Ed. 53 (2014) 14120.[66] M. Wilms, M. Kruft, G. Bermes, K. Wandelt, Rev. Sci. Instr. 70 (1999) 3641.[67] M.E. Snowden, A.G. Guell, S.C. Lai, K. McKelvey, N. Ebejer, M.A. O’Connell, A.W.
Colburn, P.R. Unwin, Anal. Chem. 84 (2012) 2483.[68] R. Schuumacher, Angew. Chem. 29 (1990) 329.[69] T. Iwasita, F.C. Nart, Prog. Surf. Sci. 55 (1997) 271.[70] P.L. Stiles, J.A. Dieringer, N.C. Shah, R.P. Van Duyne, Annu. Rev. Anal. Chem.
(Palo Alto, Calif.) 1 (2008) 601.[71] J. Clavilier, R. Faure, G. Guinet, R. Durand, J. Electroanal. Chem. 107 (1980) 205.[72] R. Sonnenfeld, P.K. Hansma, Science 232 (1986) 211.[73] K. Itaya, S. Sugawara, Chem. Lett. 16 (1987) 1927.[74] H.Y. Liu, F.R.F. Fan, C.W. Lin, A.J. Bard, J. Am. Chem. Soc. 108 (1986) 3838.[75] K. Suto, S. Yoshimoto, K. Itaya, Langmuir 22 (2006) 10766.[76] D. Kurouski, M. Mattei, R.P. Van Duyne, Nano Lett. 15 (2015) 7956.[77] Z.C. Zeng, S.C. Huang, D.Y. Wu, L.Y. Meng, M.H. Li, T.X. Huang, J.H. Zhong, X.
Wang, Z.L. Yang, B. Ren, J. Am. Chem. Soc. 137 (2015) 11928.
Nan Jiang is an assistant professor in the Department ofChemistry, University of Illinois at Chicago. He receivedhis Ph.D. in Condensed Matter Physics from ChineseAcademy of Sciences in 2010. He was also a joint Ph.D.student in Professor Klaus Kern Group at Max PlanckInstitute for Solid State Research. Then he worked withProfessor Richard Van Duyne as a postdoc at North-western University. His research focuses on developingimaging and spectroscopy technology to study physicsand chemistry at the nanometer-scale.
Dmitry Kurouski earned his M.S. in Biochemistry fromBelarusian State University, Belarus and Ph.D. (Distin-guished Dissertation) in Analytical Chemistry fromSUNY Albany, NY, USA. His Doctoral Thesis was focusedon studies of protein aggregation and amyloid fibrilformation using deep UV resonance (DUVRR), surface(SERS) and tip (TERS) enhanced Raman spectroscopies.During his PhD, Dmitry was also collaborating with RinaDukor and Laurence A. Nafie at Biotools, Inc., investi-gating supramolecular chirality of amyloid aggregates.In 2012 he joined the laboratory of Professor RichardP. Van Duyne at Northwestern University, where heexplored practical applications of TERS in electrochem-istry and art conservation science.
Eric A. Pozzi studied Biochemistry, Chemistry andMathematics at the University of Colorado at Boulderand received a B.A. in 2011. At the University of Color-ado he pursued high-pressure spectroscopic research offluorescent protein variants under the advisement of J.Mathias Weber. He then joined the Department ofChemistry at Northwestern University and pursuedresearch in the laboratories of Richard P. Van Duyne andMark C. Hersam, graduating with a Ph.D. in 2016. AtNorthwestern, he investigated physical and photo-physical properties of surface-bound molecular speciesusing ambient and ultrahigh-vacuum surface- and tip-enhanced Raman spectroscopies.
Naihao Chiang received his B.S. degrees in Chemistry,Physics, and Economics/Mathematics from the Univer-sity of Southern California (USC) in 2010. He is currentlya Ph.D. student in applied physics at NorthwesternUniversity under the supervision of Professor Richard P.Van Duyne and Tamar Seideman. His research interestsfocus on ultrahigh vacuum tip-enhanced Raman spec-troscopy and its applications.
Mark C. Hersam is the Walter P. Murphy Professor ofMaterials Science and Engineering and Director of theMaterials Research Center at Northwestern University.He earned a B.S. in Electrical Engineering from theUniversity of Illinois at Urbana-Champaign (UIUC) in1996, M.Phil. in Physics from the University ofCambridge in 1997, and Ph.D. in Electrical Engineeringfrom UIUC in 2000. His research interests includenanofabrication, scanning probe microscopy, semicon-ductor surfaces, and nanoelectronic materials. His workhas been recognized with several awards including aPresidential Early Career Award for Scientists andEngineers and a MacArthur Fellowship.
Richard P. Van Duyne is the Charles E. and Emma H.Morrison Professor of Chemistry and Professor ofBiomedical Engineering and Applied Physics at North-western University. He received a BS (1967) at Rensse-laer Polytechnic Institute and PhD (1971) at theUniversity of North Carolina, Chapel Hill, both inChemistry. He is a member of the National Academy ofSciences, the American Academy of Arts and Sciences,and the American Institute of Medical and BiologicalEngineers. He is known for the discovery of surface-enhanced Raman spectroscopy (SERS), the invention ofnanosphere lithography (NSL), and development ofultrasensitive nanosensors based on localized surfaceplasmon resonance (LSPR) spectroscopy.