tip/ring trs signal sim simulator - advent instrumentsr1.1).pdftrs sim tip/ring signal simulator...
TRANSCRIPT

TRsSim
Tip/Ring Signal
Simulator
Terminal Equipment Simulator
User Guide & Reference Manual (Applies to AI-5620)
Advent Instruments Inc.
Release 1.1 - February 2010

Copyright 2010 - Advent Instruments Inc. All rights reserved. Printed in Canada Advent Instruments Inc. 111 - 1515 Broadway Street Port Coquitlam, BC, V3C6M2 Canada Internet: [email protected] [email protected] Web Site: http://www.adventinstruments.com Telephone: (604) 944-4298 Fax: (604) 944-7488

Advent Instruments Inc.
Contents
1. Introduction 5
2. Installation & Setup 7 2.1 System Requirements 7 2.2 Software Installation 7 2.3 USB Driver Installation 8 2.4 First Time Setup 8 2.5 Technical Support 11
3. Getting Started 12 3.1 Overview of TRsSim 12
3.1.1 Data and Setting Files 13 3.1.2 Scripting Capability 15 3.1.3 Remote Control 15
3.2 Using the AI-5620 15 3.2.1 Optional Waveform Capture (AI-ET004) 17 3.3.2 Optional 3rd Complex Line Impedance (AI-E701) 17
4. Basic Operation 18 4.1 Control Panel & Views 18
4.1.1 Status & Action View 19 4.1.1.1 Line State Icon 20 4.1.1.2 Level Meter 21 4.1.1.3 Show / Change Settings 21 4.1.1.4 Stop All Actions 21 4.1.1.5 Collapse/Expand Size 21 4.1.1.6 Save/Recall Settings 22 4.1.1.7 Capture Timer 22 4.1.1.8 Action Status 22 4.1.1.9 Waveform Download 22 4.1.1.10 Event Counter 23 4.1.1.11 Status Information 23 4.1.1.12 Settings & Action Tabs 23 4.1.1.13 Toggle Hook Switch 23 4.1.1.14 Device Identifier 23
4.1.2 Measurement & Analysis Views 24 4.2 General Settings 25
4.2.1 General Tab 25 4.2.2 Signals Tab 27 4.2.3 Line State Tab 29 4.2.4 Digital Input & Outputs Tab 31 4.2.5 Echo Tab 31
4.3 Caller ID Support 32 4.3.1 TIA/Telecordia Caller ID 32 4.3.2 ETSI Caller ID 33
TRsSim – Terminal Equipment Simulator i

Advent Instruments Inc.
4.3.2.1 Type I (On-Hook) 34 4.3.2.2 Type II (Off-Hook) 34
4.3.3 Japan (NTT) Caller ID 35 4.4 Export & Logging Data 36
4.4.1 Export & Logging Settings 36 4.4.2 Exporting Data 38
5. Performing Actions 40 5.1 Line State: On/Off Hook 40 5.2 DTMF Dialing 43
5.2.1 DTMF Symbol Parameter Offsets 44 5.2.2 Off-Hook & On-Hook Dialing 45
5.3 Pulse Dialing & Line Flash 45 5.4 Tone Generation 46
5.4.1 Arbitrary Tones and Patterns 46 5.4.2 Frequency Shift Keying 47 5.4.3 Broadband Noise 48 5.4.4 Waveform Playback 49
5.5 Measurements 50 5.5.1 Level Meters 50 5.5.2 AC Signal Sweeps 52 5.5.3 DC Resistance Sweeps 55
5.6 Scripting 57
6. Line Monitoring 63 6.1 Event Detection 63
6.1.1 Detection & Warning Limit Settings 65 6.1.2 Event Listing View 67
6.1.2.1 Filter Bar 68 6.1.2.2 Time Line 69 6.1.2.3 Event Listing 70
6.1.3 Marking & Deleting Events 71 6.1.4 Event Storage & History 72
6.2 Waveform Capture (Optional) 72 6.2.1 Download Mode & Storage 73 6.2.2 Waveform Display View 74
6.2.2.1 Navigation 77 6.2.2.2 Graph Settings 78 6.2.2.3 Waveform Time Line 78 6.2.2.4 Event Display 79 6.2.2.5 Time Region Selection 80 6.2.2.6 Waveform Operations 82 6.2.2.7 Cursors 85 6.2.2.8 Measurements 86
6.3 FFT View (Optional) 88 6.3.1 Captured Mode 89 6.3.2 Settings 90 6.3.3 Cursors 91
6.4 Chart Recorder 93 6.4.1 Navigation 96 6.4.2 Settings 98 6.4.3 Cursors 99
6.5 Metering Pulses 100
ii TRsSim – Terminal Equipment Simulator

Advent Instruments Inc.
7. Additional Information 102 7.1 Line Interface Protection 102 7.2 Device Setup 104 7.3 Enabling Optional Features 105
Appendix A: Pattern Definitions 107
Appendix B: FSK Message Script 110
Appendix C: USB Driver Installation 113
Appendix D: Glossary of Terms 116
TRsSim – Terminal Equipment Simulator iii


Advent Instruments Inc. 1. Introduction
1. Introduction
The AI-5620 simulates a single port two wire analog TE (Terminal Equipment) or CPE (Customer Premise Equipment) device. It is designed to measure and analyze signals generated by a CO (central office) line card, VoIP terminal adapter's FXS port, or any device utilizing a SLIC (subscriber line interface circuit).
Common applications include:
• Verifying Caller ID signal generation from CO's, PBX's, and line simulation equipment.
• Measuring general telephony signals such as DTMF, ringing, pulse dialing, line flash duration, metering pulses, and line voltage.
• Testing SLIC characteristics using adjustable load resistances, ringing loads, and AC terminations.
• Monitoring telephone line signals including line voltage and loop current.
When used in conjunction with the TRsSim software, the AI-5620 performs a wide range of test functions, including:
Measurement & Signal Detection
• Line voltage, loop current, common mode voltage
• Ringing frequency, level, duration, DC offset voltage
• AC RMS level, frequency, THD+N
• DTMF digit level, twist, frequency error, duration
• CAS/DTAS level, frequency, duration
TRsSim – Terminal Equipment Simulator 5
1. Introduction Advent Instruments Inc.
• Metering pulse level, frequency, duration
• V.23 and Bell 202 FSK based Caller ID
• Pulse dialing, line flash, polarity reversals
Signal Generation Capabilities
• DTMF tones with arbitrary frequency, level, and duration
• Programmable flash timing and pulse dialing
• V.23 and Bell 202 FSK modulated data
• One to four tones of arbitrary frequency, level, and duration
• Wave file playback
• Broadband noise generation
• Echo generation
Line Interface Capabilities
• Off hook programmable DC resistance from 50 to 1000 Ω
• Off hook fixed terminations of 600 Ω and short circuit
• Resistive AC impedance programmable from 200 to 1000 Ω
• Complex AC terminations for TBR-21, German ZR
• Programmable ringing loads
This document contains information on the installation, setup, and use of the TRsSim software with the AI-5620. Consult the following sections for more detailed information on various aspects of the software.
• Installation & Setup on page 7 provides instructions for installing the software, minimum PC requirements, and setting up the hardware.
• Getting Started on page 12 introduces the TRsSim software and provides an overview of its operation.
• Basic Operation on page 18 presents information on how the various windows and settings control the operation of the AI-5620.
• Performing Actions on page 40 provides details regarding the 'actions' that may be executed. These include changing line state, dialing (DTMF & pulse), line flashes, tone generation, and various measurements.
• Line Monitoring on page 63 describes the line monitoring capabilities of the AI-5620, such as telephony event detection, waveform capture, FFT display, and the chart recorder operation.
• Additional Information on page 102 describes how to configure TRsSim for connecting to various devices and enabling optional components.
6 TRsSim – Terminal Equipment Simulator

Advent Instruments Inc. 2. Installation & Setup
2. Installation & Setup
This section provides information on how to install the TRsSim software and configure it for use with the AI-5620 Terminal Equipment Simulator. Contact information for Technical Support is located on on page 11 if any assistance with the operation or installation of the software is required.
2.1 System Requirements
Computer/Processor: PC with Pentium 4 (2 GHz) or greater
Memory: 512 MB of RAM
Display: SVGA or greater
Operating System: Microsoft Windows 2000, XP, Vista
Interface to AI-5620: Full speed USB port
The exact memory and processor requirements depend greatly on the enabled features of the TRsSim software. At the extreme, performing continuous waveform capture and viewing multiple live FFT windows requires a reasonably powerful PC. However if the waveform capture option is not enabled, the PC requirements can be relaxed to a slower processor and less memory than stated above.
All waveforms collected by the TRsSim software are stored in temporary files on the PC. These files can become very large if many waveforms are recorded. Up to 40 GB of hard disk space is required if the waveform capture option is allowed to reach its storage maximum capacity.
2.2 Software Installation To start using the AI-5620 the TRsSim application software must be installed first followed by the installation of the USB driver. During the installation of the software the AI-5620 should not be connected to the PC.
When installing the software from the supplied CD, insert the CD in your PC's CD-ROM drive. Automatically your default browser software should display a window showing the various products from Advent Instruments. Click the mouse on the AI-5620 device. This displays a listing of product specific software applications and documents. Click the mouse on the TRsSim – Terminal Equipment Simulator item. This executes the
TRsSim – Terminal Equipment Simulator 7

2. Installation & Setup Advent Instruments Inc.
software's setup program. Follow the instructions displayed on the screen to complete the remainder of the installation.
If the CD does not auto start, click the Start button on the Windows Task Bar. Choose Run, then type 'D:\index.htm' in the Open textbox and click OK. If the PC's CD-ROM is not mapped to driver letter 'D', then substitute the appropriate drive letter.
Alternatively, the software can be downloaded from our web site at
http://www.adventinstruments.com
as a single file executable. To install the software simply run the single file executable and follow the instructions presented.
At this point the TRsSim application is installed but in order to connect via USB the installation of the USB driver described in section 2.3 USB Driver Installation must be completed.
Software updates are made available on our web site for download. The TRsSim software can be configured to periodically check for a newer version. If one is available, a message is displayed and you may download the latest files. When executing the TRsSim software for the first time, you will be asked if periodic update checks should be enabled.
2.3 USB Driver Installation The proper drivers must be installed before a USB connection can be established with the AI-5620. The driver files needed are included with the TRsSim software in addition to being located on the supplied CD.
Note: For detailed, step-by-step, instructions on installing the driver, see: Appendix C: USB Driver Installation on page 113.
In summary, the installation of the AI-5620 USB driver requires the following steps:
1. Ensure sufficient operating system rights are available to install device drivers. This normally requires using the administrator account.
2. Power up the AI-5620.
3. Connect the AI-5620 to the PC using a USB cable.
4. The windows operating system will indicate that it has found a new device and is requesting the location for the proper driver. Specify that the driver is located in the \drivers\ subdirectory of the TRsSim software. If the default directory was used during the software installation, this will be:
C:\Program Files\Advent\TRsSim\Drivers
5. A message should be displayed indicating the successful installation of the driver.
2.4 First Time Setup After completing the software installation you can execute the TRsSim program. By default the installation process adds an entry to the 'Programs' menu under the folder
8 TRsSim – Terminal Equipment Simulator
Advent Instruments Inc. 2. Installation & Setup
Advent Instruments. Selecting the Tip-Ring Signal Simulator entry in this folder starts the program.
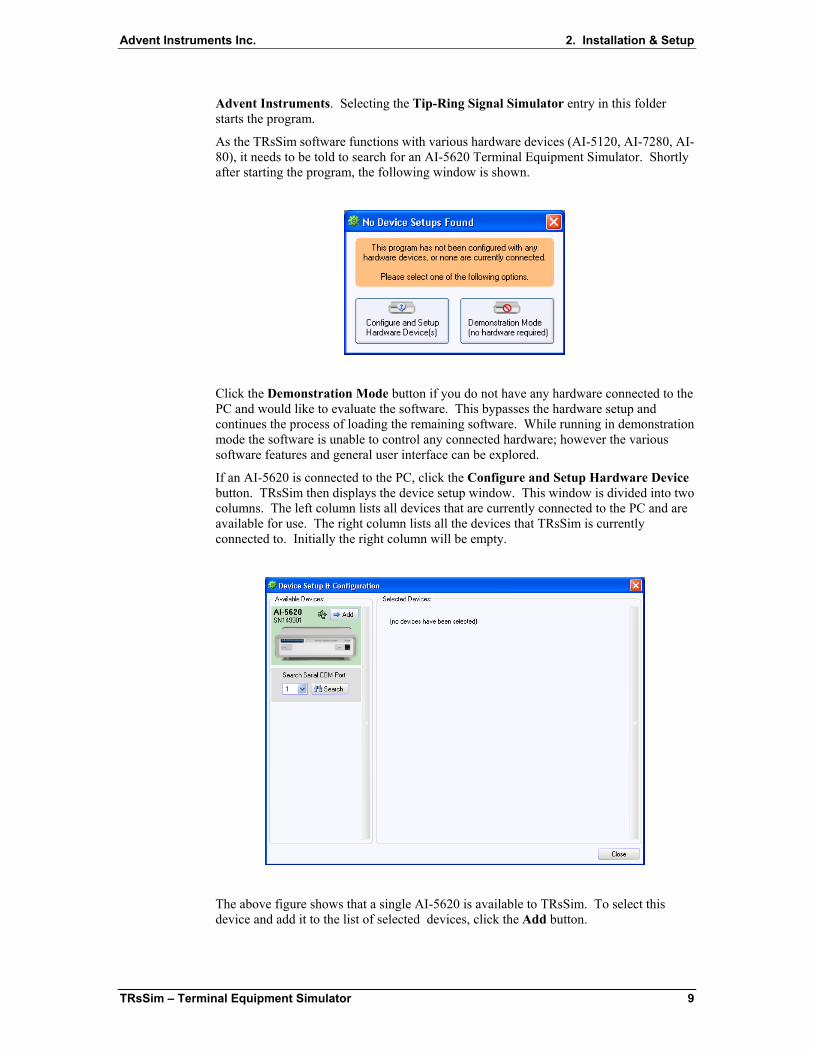
As the TRsSim software functions with various hardware devices (AI-5120, AI-7280, AI-80), it needs to be told to search for an AI-5620 Terminal Equipment Simulator. Shortly after starting the program, the following window is shown.
Click the Demonstration Mode button if you do not have any hardware connected to the PC and would like to evaluate the software. This bypasses the hardware setup and continues the process of loading the remaining software. While running in demonstration mode the software is unable to control any connected hardware; however the various software features and general user interface can be explored.
If an AI-5620 is connected to the PC, click the Configure and Setup Hardware Device button. TRsSim then displays the device setup window. This window is divided into two columns. The left column lists all devices that are currently connected to the PC and are available for use. The right column lists all the devices that TRsSim is currently connected to. Initially the right column will be empty.
The above figure shows that a single AI-5620 is available to TRsSim. To select this device and add it to the list of selected devices, click the Add button.
TRsSim – Terminal Equipment Simulator 9
2. Installation & Setup Advent Instruments Inc.
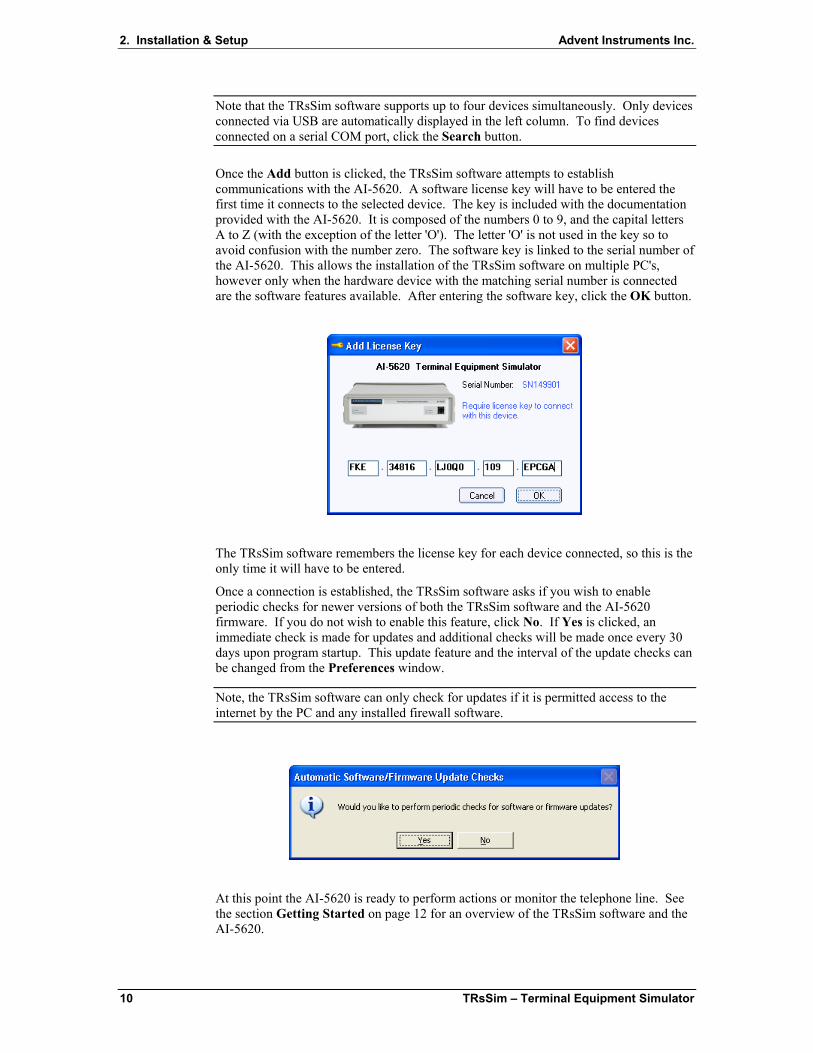
Note that the TRsSim software supports up to four devices simultaneously. Only devices connected via USB are automatically displayed in the left column. To find devices connected on a serial COM port, click the Search button.
Once the Add button is clicked, the TRsSim software attempts to establish communications with the AI-5620. A software license key will have to be entered the first time it connects to the selected device. The key is included with the documentation provided with the AI-5620. It is composed of the numbers 0 to 9, and the capital letters A to Z (with the exception of the letter 'O'). The letter 'O' is not used in the key so to avoid confusion with the number zero. The software key is linked to the serial number of the AI-5620. This allows the installation of the TRsSim software on multiple PC's, however only when the hardware device with the matching serial number is connected are the software features available. After entering the software key, click the OK button.
The TRsSim software remembers the license key for each device connected, so this is the only time it will have to be entered.
Once a connection is established, the TRsSim software asks if you wish to enable periodic checks for newer versions of both the TRsSim software and the AI-5620 firmware. If you do not wish to enable this feature, click No. If Yes is clicked, an immediate check is made for updates and additional checks will be made once every 30 days upon program startup. This update feature and the interval of the update checks can be changed from the Preferences window.
Note, the TRsSim software can only check for updates if it is permitted access to the internet by the PC and any installed firewall software.
At this point the AI-5620 is ready to perform actions or monitor the telephone line. See the section Getting Started on page 12 for an overview of the TRsSim software and the AI-5620.
10 TRsSim – Terminal Equipment Simulator

Advent Instruments Inc. 2. Installation & Setup
2.5 Technical Support For assistance in program installation, hardware setups, or general technical questions, please contact us in any of the following methods.
• Email:
• In North America: Tel (604) 944-4298 Fax (604) 944-7488 Mail Advent Instruments Inc. 111 - 1515 Broadway St. Port Coquitlam, BC, V3C6M2 Canada
• In Asia: Tel (852) 8108-1338 Fax (852) 2900 9338 Mail Advent Instruments (Asia) Ltd. Unit 42, 18/F., Block D, Wah Lok Industrial Centre, Phase II, 31 / 35 Shan Mei Street, Fotan, Shatin, New Territories, Hong Kong
Product updates providing new features and bug fixes are made available on our web site at:
http://www.adventinstruments.com
If unexpected results or any program errors are detected, please contact us in any of the above manners. In order to help us resolve encountered problems, it is recommended that all of the TRsSim settings and collected data are saved to a file. This is accomplished by selecting the File menu followed by the Save as Configuration File command. By emailing us this file as well as a description of the problem, it greatly assists our ability to re-create similar operating conditions.
TRsSim – Terminal Equipment Simulator 11

3. Getting Started Advent Instruments Inc.
3. Getting Started
This section introduces the TRsSim software and provides an overview of its operation when used with the AI-5620.
The topics included in this section are:
• Overview of TRsSim on page 12.
• Using the AI-5620 on page 15.
3.1 Overview of TRsSim The TRsSim software can connect to and control multiple devices at the same time. While normally only a single AI-5620 is used at any time, it is possible to connect additional devices such as another AI-5620, an AI-7280 Central Office Line Simulator, or an AI-5120 Telephone Line Monitor.
Each device controlled by the TRsSim software is represented by a separate 'control panel' window. In the example shown below, the TRsSim software controls two different devices. The left window represents the AI-5620 while the right window represents an AI-7280 Central Office Line Simulator. Each window has separate controls and displays specific to the type of device it is connected to.
12 TRsSim – Terminal Equipment Simulator
Advent Instruments Inc. 3. Getting Started
While every connected device operates independently from one another, they can all be controlled via the built in scripting capabilities of TRsSim. Programs written in the scripting language may control either a single device, or all of the connected devices.
Each time TRsSim starts, it attempts to connect to the same devices it was using when the software was last shut down. To change, add, or remove devices, use the 'Device Setup' window. It is displayed by clicking on the 'Configuration' menu, followed by the 'Device Setup' command. For more information, see the section Device Setup on page 104.
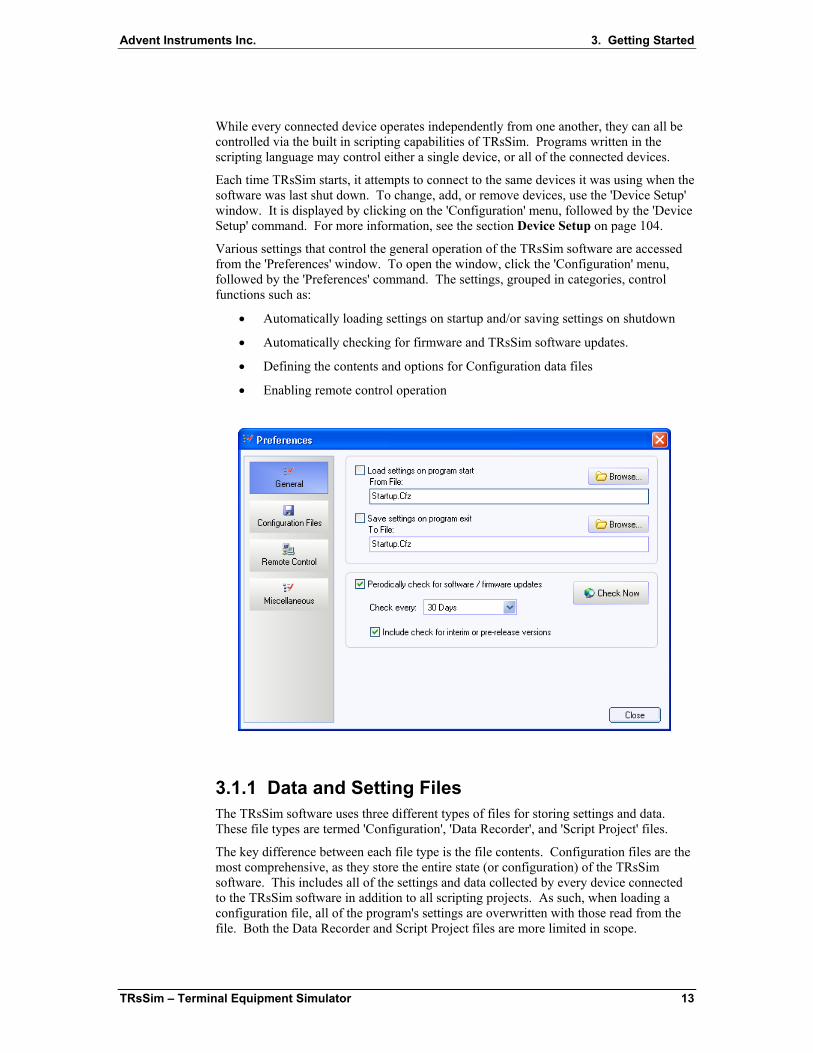
Various settings that control the general operation of the TRsSim software are accessed from the 'Preferences' window. To open the window, click the 'Configuration' menu, followed by the 'Preferences' command. The settings, grouped in categories, control functions such as:
• Automatically loading settings on startup and/or saving settings on shutdown
• Automatically checking for firmware and TRsSim software updates.
• Defining the contents and options for Configuration data files
• Enabling remote control operation
3.1.1 Data and Setting Files The TRsSim software uses three different types of files for storing settings and data. These file types are termed 'Configuration', 'Data Recorder', and 'Script Project' files.
The key difference between each file type is the file contents. Configuration files are the most comprehensive, as they store the entire state (or configuration) of the TRsSim software. This includes all of the settings and data collected by every device connected to the TRsSim software in addition to all scripting projects. As such, when loading a configuration file, all of the program's settings are overwritten with those read from the file. Both the Data Recorder and Script Project files are more limited in scope.
TRsSim – Terminal Equipment Simulator 13

3. Getting Started Advent Instruments Inc.
Configuration File (*.cfz)
Data Recorder File (*.drz) Script Project File (*.spz)
The Data Recorder file contains only the data collected by connected devices. For the AI-5620, this includes the events detected, waveforms captured, chart recordings, and measurement/sweep readings. The file does not contain any information on the various device settings or script project information. As such, when loading Data Recorder files, the current settings or script projects are not altered.
Also limited in scope, Script Project files only contain information for one or more scripting projects. This includes the script source code modules, project settings, and output logs. They do not contain any device settings or any data recorded.
The Configuration file type may be customized in the following manners:
• Store the data and settings from only specific devices
• Store only devices settings
• Password protect the file contents
• Place requirements on which devices must be connected in order to load the file
• Place restrictions on changing certain settings after loading the file
• Embed text notes, possibly to describe the file contents or purpose
• Allow file load only between a range of dates
To change any of the above settings, display the 'Preferences' window and click on the Configuration Files category.
14 TRsSim – Terminal Equipment Simulator
Advent Instruments Inc. 3. Getting Started
Note: Prior versions of the TRsSim software used an older uncompressed file format for Configuration, Data Recorder, and Script Project files. The file extensions used to identify these files are .cfg, .drf, .spj. While these files may be opened by newer versions of the TRsSim software, all files saved will use the newer compressed file format.
3.1.2 Scripting Capability A scripting capability is included with the TRsSim software and may be used to automate repetitive tasks or perform more complex tests. The scripts can access any device connected and change its settings or read data collected by the device. All the script settings and programs are saved as part of the configuration file, or can be saved to a separate 'Script Project' file that only contains information related to the scripting capability of TRsSim.
Descriptions of the scripting language are outside the scope of this document. For more information, please see the documents located in the Scripting section under the Help menu..
3.1.3 Remote Control The TRsSim software can be controlled from another application by means of passing commands over a TCP/IP connection or via files. While by default, this feature is turned off, it can be enabled by opening the Preferences window and clicking on the Remote Control category.
By enabling a TCP/IP connection, an application located on the same or a different computer may setup a link to control the TRsSim software. Once a link is established, commands can be issued to return data collected by a device, change device settings, or load/run script programs.
For more information on using these features, see the Remote Control on-line document, available from within the Help menu). It describes how to enable remote control, and the supported command set. Using the supplied example program called 'TRsSimRC.exe', a TCP/IP connection can be setup with TRsSim allowing the transmission of simple commands. This program is located in the same directory as TRsSim (normally c:\Program Files\Advent\TRsSim).
Additionally, a Windows DLL and a .NET assembly is available for abstracting the TCP/IP connection and low level commands. The .NET assembly allows applications to be developed from within Microsoft's Visual Studio IDE. The DLL, .NET assembly, and .NET example program are available for download from the web site:
http://www.adventinstruments.com/
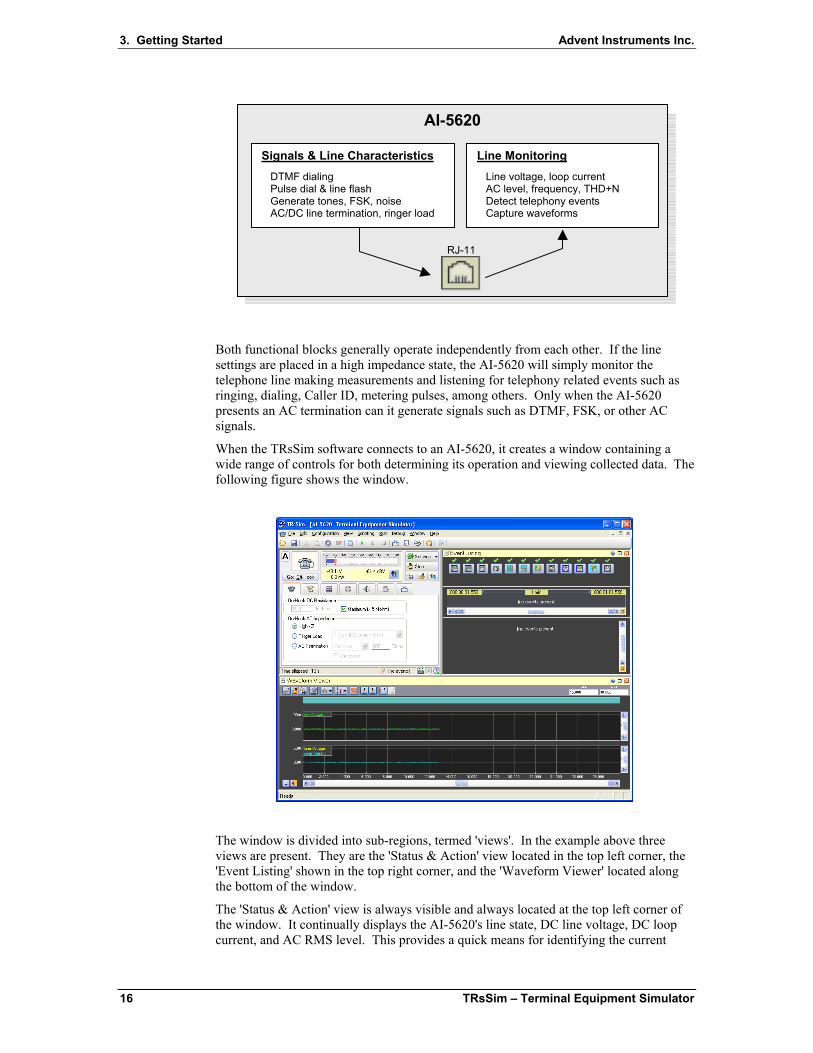
3.2 Using the AI-5620 Logically the AI-5620 consists of two distinct functional blocks. The first provides the ability to change physical line characteristics and generate a wide range of signals, while the second provides all of the line monitoring and signal measurement capabilities.
TRsSim – Terminal Equipment Simulator 15
3. Getting Started Advent Instruments Inc.
AI-5620
Signals & Line Characteristics DTMF dialing Pulse dial & line flash Generate tones, FSK, noise AC/DC line termination, ringer load
Line Monitoring Line voltage, loop current AC level, frequency, THD+N Detect telephony events Capture waveforms
RJ-11
Both functional blocks generally operate independently from each other. If the line settings are placed in a high impedance state, the AI-5620 will simply monitor the telephone line making measurements and listening for telephony related events such as ringing, dialing, Caller ID, metering pulses, among others. Only when the AI-5620 presents an AC termination can it generate signals such as DTMF, FSK, or other AC signals.
When the TRsSim software connects to an AI-5620, it creates a window containing a wide range of controls for both determining its operation and viewing collected data. The following figure shows the window.
The window is divided into sub-regions, termed 'views'. In the example above three views are present. They are the 'Status & Action' view located in the top left corner, the 'Event Listing' shown in the top right corner, and the 'Waveform Viewer' located along the bottom of the window.
The 'Status & Action' view is always visible and always located at the top left corner of the window. It continually displays the AI-5620's line state, DC line voltage, DC loop current, and AC RMS level. This provides a quick means for identifying the current
16 TRsSim – Terminal Equipment Simulator

Advent Instruments Inc. 3. Getting Started
conditions on the telephone line. The remainder of the view contains a number of controls for adjusting the line characteristics and performing actions. For example, to take the AI-5620 off-hook, simply click the button labeled 'Go Off-Hook'. The various tabs below this button display settings for the on-hook state, off-hook state, DTMF dialing, pulse dialing, tone generation, and measurement actions.
The event listing and waveform view shown in the above figure display information on the detected telephony events and captured waveforms respectively. These views can be modified in size, removed, or changed to show other data. Up to five different view types are available. They are:
• Measurements & Sweep Data
• Event Listing
• Chart Recorder
• Waveform ( Added with AI-ET004 option )
• FFT Display ( Added with AI-ET004 option )
Of the five different types of views, up to four can be displayed at any time in various locations. However in all cases, the 'Status & Action' view is always visible in the upper left corner of the control panel window.
For more detailed information on the various 'views', performing actions, and the line monitoring capabilities, see the section Basic Operation on page 18.
Note, the Waveform view and FFT view are only available when the 'Waveform Capture' option to the AI-5620 is enabled. This option provides the functionality to download waveforms.
3.2.1 Optional Waveform Capture (AI-ET004) The optional waveform capture component provides the TRsSim software the ability to download waveforms from the AI-5620 on a real time basis. The waveforms downloaded represent the differential line voltage, loop current, common mode line voltage, AC coupled signals, and rear panel digital input connections. Both the waveform and FFT views are unavailable if this option is not enabled.
3.3.2 Optional 3rd Complex Line Impedance (AI-E701) The AI-5620 contains three different AC line impedance termination settings that are installed by default. They are:
• Resistive (adjustable from 200 to 1000 Ω)
• Complex: 270 Ω + (750 Ω|| 150 nF) - TBR-21 Reference Impedance
• Complex: 220 Ω+ ( 820 Ω|| 115 nF ) - German 'ZR' Impedance
As an option, a 3rd complex impedance may be added to the AI-5620. This is a factory installed option and must be specified at the time of ordering. Please contact us directly if you have a specific requirement.
TRsSim – Terminal Equipment Simulator 17
4. Basic Operation Advent Instruments Inc.
4. Basic Operation
This section provides basic information on how to control the AI-5620 with the TRsSim software.
The topics included in this section are:
• Control Panel & Views on page 18
• General Settings on page 25
• Caller ID Support on page 32
• Export & Logging Data on page 36
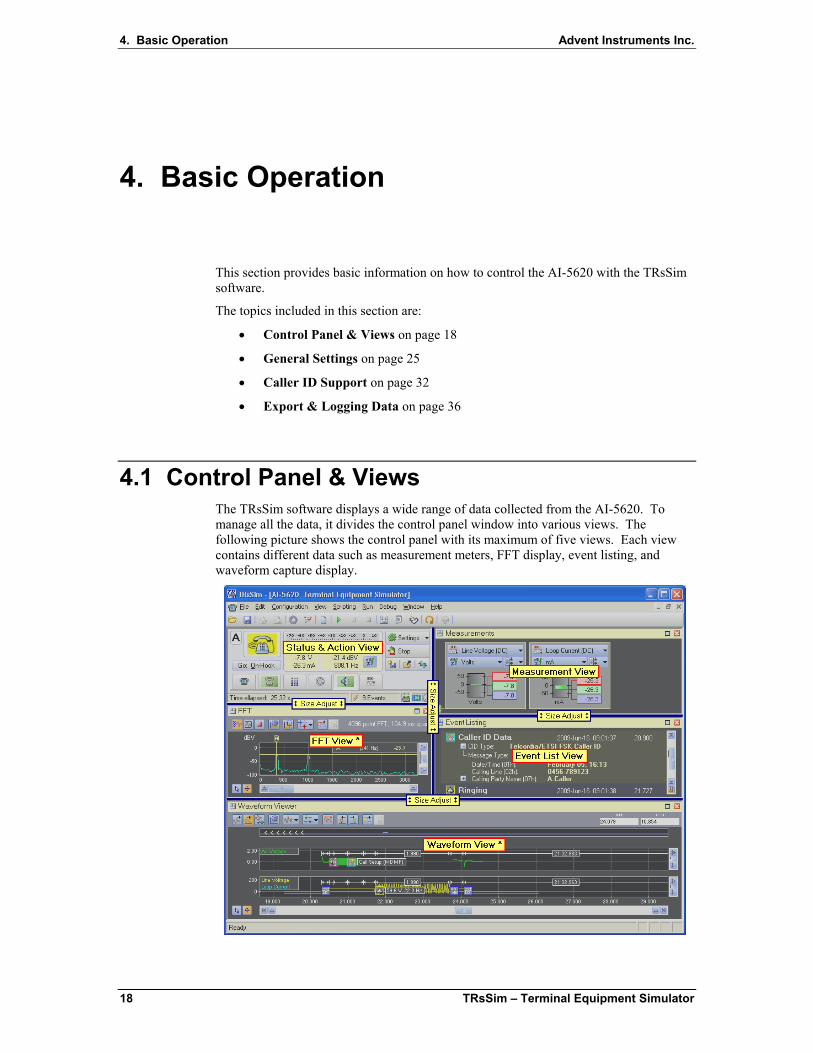
4.1 Control Panel & Views The TRsSim software displays a wide range of data collected from the AI-5620. To manage all the data, it divides the control panel window into various views. The following picture shows the control panel with its maximum of five views. Each view contains different data such as measurement meters, FFT display, event listing, and waveform capture display.
18 TRsSim – Terminal Equipment Simulator

Advent Instruments Inc. 4. Basic Operation
The number of views can range from just one to the maximum of five. To adjust the size of each view, simply click the mouse on the grey bars dividing each view and drag it to a new position.
The 'Status & Action' view, located in the top left corner is always located in the same position and can not be removed. However the contents of the other views can be changed at any time. These views use a common title bar shown in yellow. Located on this title bar are three buttons used to adjust the view, and an additional button to display help information.
Clicking on the left most button will display a popup menu. This menu contains options related to display of the current view as well as selections to change the type of data displayed. The figure below shows the FFT view menu.
The two buttons located at the right side of the title bar are used to toggle between a maximized / normal view sizes, and to close the view.
When a view size is maximized, its size is increased to that of the entire control panel. Clicking on the button again, returns it to its previous size. This same action may be activated by double clicking the mouse anywhere on the title bar.
Clicking the close button removes that view and the size of all the remaining views are adjusted to fill up the available space.
4.1.1 Status & Action View The 'Status & Action' view is the heart of the AI-5620 control panel. It displays the current status of the device and is used to start/stop/modify various actions. The following figure identifies the key regions and controls for this view.
TRsSim – Terminal Equipment Simulator 19

4. Basic Operation Advent Instruments Inc.
Starting from the top left corner and proceeding clockwise, the various regions and controls operate as follows:
4.1.1.1 Line State Icon This icon graphically indicates the current state of the telephone line. The state is determined by a combination of various measurements, including line voltage, loop current, and AC signal level. A number of different icons are used to represent the various states, as shown in the figure below.
Each row of icons indicate a different line state. They are:
• On-hook: Not drawing any loop current and the line voltage indicates no other device is off-hook.
• Off-hook: Drawing loop current.
• In use: The AI-5620 is not drawing any loop current but the line voltage indicates that another device is off-hook.
• Disconnect: Not drawing any loop current and no line voltage is detected.
The column of icons represents what activity is occurring (if any). They are:
• Idle: No tones being generated, no FSK detected, no ringing.
20 TRsSim – Terminal Equipment Simulator

Advent Instruments Inc. 4. Basic Operation
• Tone: A tone is being generated.
• FSK data: V.23 or Bell 202 FSK data is either being sent or detected.
• Over limit, protection: Excessive voltage, current, power dissipation detected. See Line Interface Protection on page 102 for more information.
The line voltage and loop current thresholds used to determine the line state are programmable and may be modified in the General Settings window (page 25). Based on the threshold values, it may be possible for the line state to enter an undefined region. In this case, the line state become indeterminate and a question mark is shown on the icon.
4.1.1.2 Level Meter The level meter (to the right of the line state icon) is continually updated with the AC signal level, line voltage, and loop current readings. AC signal levels are displayed both numerically and as a horizontal bar graph. To change the AC level units, click the button located to the right of the readings. This displays a popup menu with a list of possible unit selections. If ringing is detected, the scale of the bar graph increases and its units are automatically changed to Vrms.
4.1.1.3 Show / Change Settings Clicking the Settings button display a popup menu similar to the following figure. Selecting any of the options in the top group, opens a window with the respective settings. The last two menu commands are used to toggle between suspending or resuming the timer used for event detection and waveform capture, and deleting all events and waveforms data currently stored.
4.1.1.4 Stop All Actions Clicking the Stop button halts the execution of any action. This includes DTMF dialing, pulse dialing, performing a line flash, generating tones, FSK, noise, wave file playback, or performing any sweep measurements.
4.1.1.5 Collapse/Expand Size The Collapse/Expand button adjusts the height of the 'Status & Action' view by toggling between the minimum size needed to show only the action tabs, and the height needed to show all of the action tab contents.
TRsSim – Terminal Equipment Simulator 21

4. Basic Operation Advent Instruments Inc.
4.1.1.6 Save/Recall Settings These two buttons are used to quickly save and recall settings for one or more of the action tabs. By clicking the left most save button, the settings for the currently display action are saved. A unique name must be provided in order to identify the saved settings. Once saved, these settings may be restored by clicking the middle recall button.
By using the save button to store different test conditions, they can be immediately recalled at any time by clicking on the recall button.
4.1.1.7 Capture Timer The capture timer controls the operation of the event detector, waveform capture, and chart recorder. It exists in either the running or suspended state. When running the event detector, waveform capture, and chart recorder functions are enabled. The timer provides consistent timing information between all three functions. However when suspended, the event detector, waveform capture, and chart recorder functions are frozen.
The timer state is identified by the icon located at the bottom right corner of the 'Status & Action' view. Clicking the mouse on the icon brings up a menu for toggling the timer state and deleting all event detection data, waveform capture data, and chart recorder data.
Note, upon loading a configuration or data recorder file, the timer automatically enters the suspended state.
4.1.1.8 Action Status The action status icon shows if any action (DTMF dialing, pulse dialing, tone generation, measurement sweeps) is currently active.
4.1.1.9 Waveform Download The waveform download icon indicates if any waveforms are being downloaded from the AI-5620. Clicking on the icon displays a menu presenting options to change the capture mode or to display a window controlling the event and waveform capture settings.
22 TRsSim – Terminal Equipment Simulator

Advent Instruments Inc. 4. Basic Operation
Note, only if the waveform capture option is enabled for the AI-5620, can waveforms be downloaded.
4.1.1.10 Event Counter The event counter simply shows the number of events that have been detected by the AI-5620. Clicking on the icon displays a menu presenting options to either delete all event and waveform data, or to display a window containing the event detection settings.
4.1.1.11 Status Information The status line, located at the bottom of the 'Status & Action' view, normally indicates the elapsed time for the capture timer. If any actions are started or errors detected, a brief message will be shown.
4.1.1.12 Settings & Action Tabs A number of icon tabs are used to show the different action settings. Clicking on any of the tabs displays the settings for the corresponding action. When an action is active, the background color of the tab changes to a green color.
In the example figure above the AI-5620 is in the off-hook state and pulse dialing, as indicated by the background color of the corresponding tabs.
4.1.1.13 Toggle Hook Switch To change the hook switch state, click the button located just underneath the line state icon. Alternatively, pressing ALT-O also toggles the hook switch state when the control panel is the active window.
4.1.1.14 Device Identifier The device identifier is simply a letter from A to D assigned by the TRsSim software. It is used by the scripting language to distinguish between multiple devices (if more than one is connected). The device identifier can be changed from the Device Setup window (page 104).
Note: For details on performing actions, jump ahead to Performing Actions (page 40). For details on the line monitoring aspects of TRsSim function, see Line Monitoring (page 63). The remainder of this section provides further information on the basic operation of the TRsSim software.
TRsSim – Terminal Equipment Simulator 23

4. Basic Operation Advent Instruments Inc.
4.1.2 Measurement & Analysis Views To add, remove, or change the position of 'views', use the Measurement & Analysis Views window. The window is displayed by either:
• Clicking on the Settings button and then selecting Measurement & Analysis Views, or
• Clicking on the view menu button (located at the left edge of any view's title bar) and selecting Move or Add Views.
This window graphically shows the current views on its left side, while the right side lists all the available view types.
The locatioin of the 'Status & Action' view is fixed and it can not be removed, nor can its position be changed from the top left corner.
To add a new view, simply click one of the view type buttons on the right side and drag it left to the desired position. If it is dragged to the position of an existing view, then the existing view is moved to the new location.
To swap the positions of two views, click one of the view icons and drag it to the desired position. Once the mouse button is released, the two views will be swapped.
To remove a view, click the close button located in the top right corner of the view image.
The contents of the five different view types are described as follows:
• 1) Measurements View: Displays one of four measurements. They are:
• Level Meters: Shows one or more graphical level meters representing various measurements continually made by the AI-5620. These include AC signal level, AC filtered signal level, AC signal frequency, AC signal THD+N, DC line voltage, DC loop current, DC common mode voltage, RMS line voltage, RMS loop current, and RMS common mode voltage.
• AC Signal Sweep Results: Shows the results of any AC signal sweeps performed. The data is graphically displayed in addition to a table of the measurement points.
24 TRsSim – Terminal Equipment Simulator

Advent Instruments Inc. 4. Basic Operation
• DC Resistance Sweep Results: Shows the results of any DC resistance sweeps.
• Metering Pulse Measurements: Shows the minimum, maximum, and average for all detected metering pulse measurements.
For more information on the operation of the level meters, AC signal sweeps, and DC resistance sweeps, see Measurements on page 50. For information on the metering pulse measurements, see Metering Pulses on page 100.
• 2) Event Listing View: Displays the details on any telephony events detected. The listing of events can be filtered to only show specified event types, and an optional time line can be enabled to show relative time position between the events. For more information on this view and its operation see Event Detection on page 63.
• 3) Chart Recorder View: Graphically displays the data collected by the chart recorder. The chart recorder performs periodic measurements of line voltage, loop current, common mode voltage, AC signal level, AC signal frequency, AC signal THD+N at an approximate rate of 5 readings per second. For more information on this view and the chart recorder operation, see Chart Recorder on page 93.
• 4) Waveform View: Graphically displays line voltage, loop current, common mode voltage, AC signal waveforms downloaded from the AI-5620. Additionally, it overlays the position and relative timing of detected events. For more information on this view and its operation, see Waveform Capture on page 72.
• 5) FFT View: Displays an FFT on either the currently downloading waveforms, or any captured waveforms. For more information on this view and its operation, see FFT View on page 88.
Note, the Waveform view and FFT view are only available when the 'Waveform Capture' option to the AI-5620 is enabled. This option provides the functionality to download waveforms.
4.2 General Settings The general settings window contains a wide range of configuration options for the AI-5620. To display this window, click the Settings button on the 'Status & Action' panel, followed by the General Settings menu item.
The window divides the various configuration settings into categories, each represented by a different tabs. Each category is described in the following sections.
4.2.1 General Tab Clicking on the 'General' tab displays the settings for the AC signal level units, signal generation, and the AI-5620 telephone line interface.
AC signal levels can be expressed using six different unit types. They are:
• Vrms (Volts RMS)
TRsSim – Terminal Equipment Simulator 25

4. Basic Operation Advent Instruments Inc.
• mVrms (millivolts RMS)
• dBV (RMS voltage relative to 1 Vrms expressed in logarithms)
• dBm (signal power relative to 1 mWatt assuming a 600 Ω terminating impedance expressed in logarithms)
• dBr (RMS voltage relative to an arbitrary specified level, expressed in logarithms)
• % (percentage ratio of RMS voltage relative to an arbitrary specified level)
The units can be independently specified for
i) the level meter shown on the 'Status & Action' panel,
ii) various measurements displayed in other views, and
iii) the generation of AC signals.
To change a setting, simply click the mouse on the current setting and select a different unit from the provided list.
The reference level field is used only when dBr or % units are selected. The reference level is always specified in units of Vrms.
The two 'Signal Generation' settings determine how the output level is calculated when generating signals.
Termination Impedance specifies the assumed line impedance looking out from the AI-5620. The signal levels present on the telephone line will be effected by both the impedance presented by the AI-5620 and the impedance 'seen' by the AI-5620. By setting the 'Terminating Impedance' to the impedance as seen by the AI-5620, the TRsSim software adjusts the signal output level in order to compensate for the voltage loss across the AI-5620's internal source impedance.
For example, if both the AI-5620 AC impedance and the Terminating Impedance are set to 600 Ω, the voltage drop from the signal generators to the telephone line will be half (6 dB). The TRsSim software automatically increases the signal generator level by 6 dB to compensate, thus ensuring the signal level measured on the telephone line matches the desired level.
26 TRsSim – Terminal Equipment Simulator

Advent Instruments Inc. 4. Basic Operation
The default setting of Open Circuit assumes that the AC impedance seen by the AI-5620 is effectively an open circuit, and as such the TRsSim software will not increase the signal generator's output level beyond what is specified.
The setting of Source Z assumes that the impedance seen by the AI-5620 will always match the AI-5620's internal AC impedance. This causes TRsSim to always increase the signal generator level by 6 dB above the numerical value specified.
The Noise Bandwidth setting is used to further adjust the signal levels when generating a broadband noise signal. The AI-5620's noise generator produces a broadband signal with a bandwidth of approximately 18 kHz. Compliance standards may specify noise levels in terms of a fixed bandwidth. By changing the 'Noise Bandwidth' setting, the TRsSim software adjusts the AI-5620 noise generator level to output the desired level when measured over the specified bandwidth.
For example, selecting a bandwidth setting of 3 kHz and generating a noise level of -20 dBV causes the AI-5620 noise generator to output a level -20 dBV when measured over a 3 kHz bandwidth. The total (broadband) output from the AI-5620 will be approximately 15 dB higher (18 kHz / 3 kHz).
The last group of settings control the telephone interface balance impedance, adjust the receiver sensitivity, and enable or disable the connection to the AI-5620's front panel RJ-11 jack.
The Balance Impedance setting is used by the AI-5620's internal hybrid bridge. When using the hybrid, this setting should match the impedance as seen by the AI-5620, as this provides the most rejection of transmitted signals. The usage of the hybrid is controlled from the Signals tab, described in the following section.
By enabling the Mute Tx and Increase Rx Gain check box, the AI-5620 stops all signal generation to the telephone interface and increases the gain of the receiver by approximately 15 dB. The increased sensitivity in this mode allows for more accurate low level noise measurements.
Note, when enabled the maximum receiver input level before overload decreases to approximately -4 dBV.
The last check box disconnects the AI-5620 front panel RJ-11 jack from its internal circuits.
4.2.2 Signals Tab The 'Signals' tab contains a number of settings for controlling the signal routing and gain internal to the AI-5620. The following figure shows the routing of the AI-5620's signal sources and sinks.
TRsSim – Terminal Equipment Simulator 27

4. Basic Operation Advent Instruments Inc.
600
Echo
BalanceNetwork
TX
RX
BNC Input
BNC Output
Filters
Z/2
Z/2
Tip
Ring
Switch Node
Metering Pulse Detector
CAS/DTAS Detector
DTMF Detector
FSK Decoder
Waveform Capture
Tone
Generators
Legend
Detector
Meter
FSK
DTMF/MF
Waveform
Noise
THD+N
RMS Level
Freq. Counter
The Meter Source selection controls where the AC level, frequency, and THD+N meters obtain their signal for measurement. This setting effects the broadband level meter shown on the 'Status & Action' panel, as well as the measurements used by the AC signal sweeps and the chart recorder.
The Detector Source setting controls input to the DTMF, FSK, CAS/DTAS, and metering pulse detectors. As well, it determines the signal source for the waveform capture.
Both the meter and detector signal source can be selected from any of the following:
• Telephone Interface Receive: Represents the signal present at the front panel RJ-11 jack.
• Telephone Interface Receive Hybrid: Represents the signal present at the output of the hybrid bridge.
• Telephone Interface Transmit: Represents the signal being sent to the telephone interface (generated by the AI-5620).
• Generator: Represents the signal being output by the tone generator, noise generator, and waveform playback.
• BNC Input: Represents the signal present at the rear panel BNC input connector.
• Off: Turns off meter/detector signal source.
28 TRsSim – Terminal Equipment Simulator

Advent Instruments Inc. 4. Basic Operation
The rear panel BNC Output connector can be used to monitor one of a various number of signals within the AI-5620. By default, the BNC Output Source is set to off. It can be changed to any of the settings listed above in addition to the following:
• Wave Playback: Represents the output of any waveform playback.
• Meter Output: Represents the signal being measured by the meter, following the optional filter that may be applied.
• Meter Notch Output: Represents the signal following the meter's notch filters. The notch filters are used in performing THD+N measurements. Selecting this source outputs the harmonic and noise components of the signal routed to the meters.
The Telephone Interface Transmit Source selection controls which signals (if any) will be transmitted on the telephone line. By default, the selection is set to Generator which represents the AI-5620's internal tone, FSK, DTMF, and noise generators. Additional selections allow for signals present at the rear panel BNC input connector to be routed to the telephone interface, or the summation of both the internal generators and BNC input signals.
The three Signal Gain fields determine the gain applied to the BNC input, BNC output, and the waveform playback respectively. The default value of 1 represents no gain or loss applied. Values greater than 1 represent gain, while values between 0 and 1 represent loss. Using a negative value inverts the polarity. For example, the value of -0.5 reduces the level by half (6 dB) and inverts the signal's polarity.
4.2.3 Line State Tab The 'Line State' tab sets the voltage and current thresholds used to define the four line states such as on-hook, off-hook, in-use, and disconnected.
Three current thresholds and three voltage thresholds are required to determine the line state, as shown in the following figure.
TRsSim – Terminal Equipment Simulator 29

4. Basic Operation Advent Instruments Inc.
Current
Off-Hook Ioff-hook
Ion-hook
In Use On-Hook Idisconnect
Disconnect
Voltage Vdisconnect Vin-use Von-hook
The 'Off-Hook' line state is indicated any time the measured loop current exceeds the specified threshold. The other three line states are determined by looking at both the current flowing through the AI-5620 and the line voltage. The On-Hook state is reached when the current is below the Ion-hook threshold and the line voltage is above the Von-hook. The In Use state is defined when the loop voltage is below the Vin-use and at the same time the current is below Ion-hook. The In-Use state is usually achieved when two devices are attached to the same telephone line but only one is drawing loop current. The last state is Disconnect and it is reached when the loop voltage and current are at such a low level , below Vdisconnect and Idisconnect respectively, that the AI-5620 is considered to be disconnected from the line.
If the measured loop current or line voltage drifts to a region outside those defined by the above figure, the line state icon remains the same. However, a question mark is shown to indicate the indeterminate condition.
30 TRsSim – Terminal Equipment Simulator

Advent Instruments Inc. 4. Basic Operation
Note, the loop current thresholds and line voltage thresholds specified into the General Settings window must be entered in descending order.
4.2.4 Digital Input & Outputs Tab The 'Digital In/Out' tab determines the operation of the rear panel digital output and input pins. The outputs labeled 'A', 'B', and 'C' may be forced to a logic low output state, high output state; or alternatively, to a state based on internal AI-5620 conditions. These conditions are as follows:
• Output A – FSK Decoder Output: The output pin mirrors the state of the V.23 or Bell 202 FSK decoder. It goes high when detecting a mark signal and low when detecting a space signal.
• Output B – Ring Detector: The output pin goes high when ringing is detected and returns low when ringing stops.
• Output C – Off-Hook State: The output pin goes high when the AI-5620 enters the off-hook state and returns low when changing back to the on-hook state.
The rear panel digital input pin 'A' may be configured to force the AI-5620 into the off-hook state when a high level logic level is sensed. To enable or disable this function, click on the Input 'A' Function drop down list. Note that only the programmable off-hook termination is taken off-hook when using this feature. The fixed resistance and short circuit terminations are unaffected.
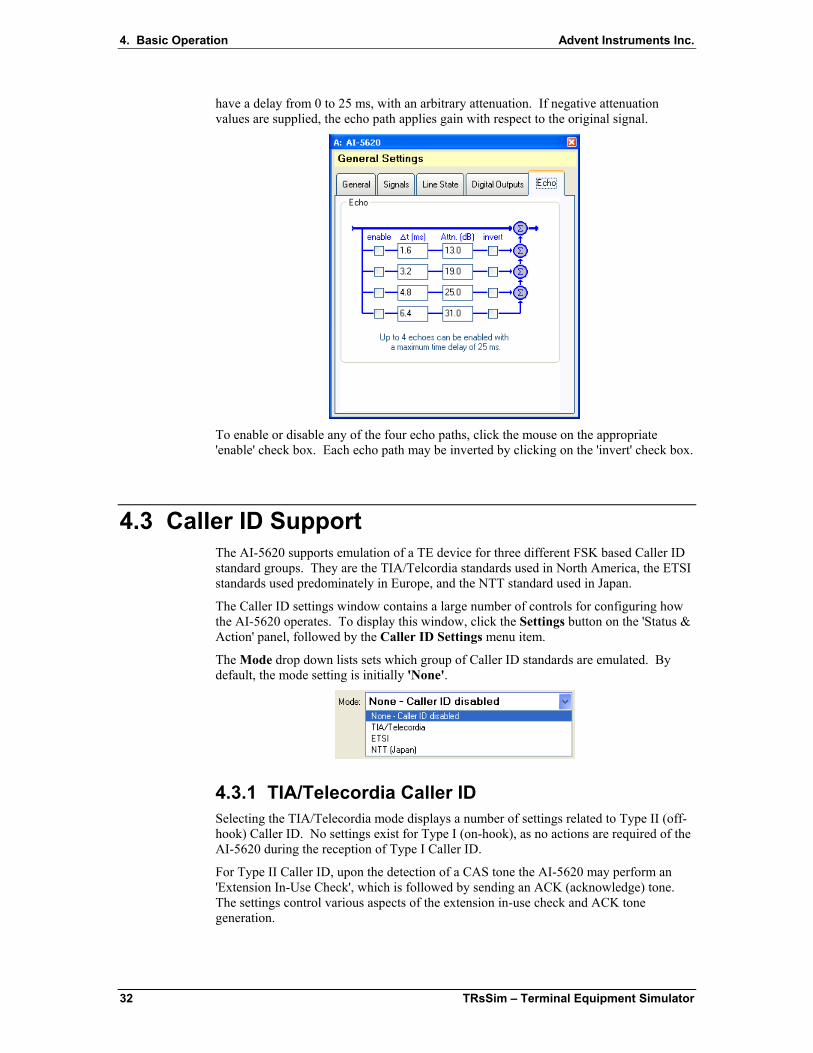
4.2.5 Echo Tab The 'Echo' tab controls the operation of the signal echo generator. Up to four echoes can be created for any signal transmitted from the telephone line interface. Each echo may
TRsSim – Terminal Equipment Simulator 31
4. Basic Operation Advent Instruments Inc.
have a delay from 0 to 25 ms, with an arbitrary attenuation. If negative attenuation values are supplied, the echo path applies gain with respect to the original signal.
To enable or disable any of the four echo paths, click the mouse on the appropriate 'enable' check box. Each echo path may be inverted by clicking on the 'invert' check box.
4.3 Caller ID Support The AI-5620 supports emulation of a TE device for three different FSK based Caller ID standard groups. They are the TIA/Telcordia standards used in North America, the ETSI standards used predominately in Europe, and the NTT standard used in Japan.
The Caller ID settings window contains a large number of controls for configuring how the AI-5620 operates. To display this window, click the Settings button on the 'Status & Action' panel, followed by the Caller ID Settings menu item.
The Mode drop down lists sets which group of Caller ID standards are emulated. By default, the mode setting is initially 'None'.
4.3.1 TIA/Telecordia Caller ID Selecting the TIA/Telecordia mode displays a number of settings related to Type II (off-hook) Caller ID. No settings exist for Type I (on-hook), as no actions are required of the AI-5620 during the reception of Type I Caller ID.
For Type II Caller ID, upon the detection of a CAS tone the AI-5620 may perform an 'Extension In-Use Check', which is followed by sending an ACK (acknowledge) tone. The settings control various aspects of the extension in-use check and ACK tone generation.
32 TRsSim – Terminal Equipment Simulator

Advent Instruments Inc. 4. Basic Operation
The ACK tone is normally a single DTMF digit 'A' or 'D'. The Send Condition drop down list determines if an ACK tone is to be generated. This can range from always, never, and only if no other device is off-hook. The Send Delay for the ACK is specified in milliseconds and is timed with respect to either: i) end of CAS tone, ii) start of extension in-use check period, iii) detection of on-hook state, and iv) end of the extension in-use check period. The ACK tone characteristics, such as duration, level, twist, row & column frequency error, are fully programmable.
Note that a positive twist value generates a column (high) tone level greater than the row (low) tone level.
In addition to sending an ACK tone, an interfering broadband noise or single frequency tone may be generated. The SNR setting defines the ratio in signal power between the ACK tone and the interfering signal. A positive value indicates the interference level is less than the ACK tone level. The duration of interference can start from the detection of CAS, or start concurrently with the ACK signal.
If the Extension In-Use Check is enabled, the AI-5620 goes on-hook following a programmable delay with respect to the end of CAS. While on-hook it waits for the line voltage to raise above the on-hook threshold voltage. If this occurs, then no other devices connected to the line are currently off-hook. The AI-5620 returns to the off-hook state once the on-hook line state is reached, or following a timeout specified by the maximum duration for the extension in-use check.
4.3.2 ETSI Caller ID The ETSI Caller ID mode contains a wide range of settings for both Type I (on-hook) and Type II (off-hook) Caller ID.
TRsSim – Terminal Equipment Simulator 33

4. Basic Operation Advent Instruments Inc.
4.3.2.1 Type I (On-Hook) For Type I (on-hook) Caller ID, the AI-5620 may enter an Idle Line Signaling State (ILSS) and/or generate a DC Wetting Pulse.
Entering the ILSS is triggered by detecting one of three conditions. They are:
• Ring Pulse Alerting Signal (RPAS): Level, frequency, and duration limits for the RPAS are fully programmable.
• Dual Tone Alerting Signal (DTAS)
• Line Reversal followed by Dual Tone Alerting Signal (DTAS)
If the condition specified in the TE Alerting Mode setting is met, the ILSS is entered following the specified delay. Entering the ILSS causes the AI-5620 to adjust its AC terminating impedance, or its DC loop resistance from the nominal settings.
The end of the ILSS is specified as either a delay time from the end of FSK reception, or a timeout period if no FSK signal is detected. When leaving the ILSS state, the AC terminating impedance and its DC loop resistance return to the nominal settings.
Clicking on the Enable DC Wetting Pulse checkbox enables or disables its operation. If enabled, it causes the AI-5620 to change its DC loop resistance for a specified duration once the TE alerting signal is detected.
4.3.2.2 Type II (Off-Hook) The Type II (off-hook) settings are similar to those for the TIA/Telecordia mode. The exception is no support for an extension in-use check. The ACK tone may be sent following the detection of the Dual Tone Alerting Signal (DTAS), with a programmable delay, duration, level, twist, and frequency error.
34 TRsSim – Terminal Equipment Simulator

Advent Instruments Inc. 4. Basic Operation
In addition to sending an ACK tone, an interfering broadband noise or single frequency tone may be generated. The SNR setting defines the ratio in signal power between the ACK tone and the interfering signal. A positive value indicates the interference level is less than the ACK tone level. The duration of interference can start from the detection of DTAS, or concurrently with the ACK signal.
4.3.3 Japan (NTT) Caller ID Selecting the NTT (Japan) mode displays a number of settings for Type I (on-hook) Caller ID. No settings exist for Type II (off-hook) Caller ID support.
TRsSim – Terminal Equipment Simulator 35

4. Basic Operation Advent Instruments Inc.
In the Type I (on-hook) mode, the AI-5620 waits for a line polarity reversal followed by one or more CPE Activation Ring (CAR) bursts. The CAR is a short ringing burst that meets specified limits for level, frequency, duration, and interval. If a specified minimum number of CAR bursts are detected within a time-out period, the AI-5620 goes off-hook. Once off-hook it waits for the reception of FSK data. Once the FSK data has been received, it returns to the on-hook state following a specified delay. If no FSK signal is detected, it also returns to the on-hook state after a timeout interval. Optionally, the AI-5620 can be configured to answer the call by going off-hook. If auto-answer is enabled, it answers the call by going off-hook a specified amount of time after it had returned to the on-hook state.
4.4 Export & Logging Data The TRsSim software can export and log a large variety of data collected by the AI-5620. Exporting is defined as writing all collected data to a text file in a single operation. Logging also writes data to a file; however it occurs on a continuous basis. New data is written to a logging file once it becomes available.
The types of data that can be logged or exported are as follows:
• Detected Events
• AC Signal Sweep Data
• DC Resistance Sweep Data
• Metering Pulses
• Level Meter Measurements (logging mode only – data export not supported)
4.4.1 Export & Logging Settings TRsSim supports a wide range of flexibility in determining the type of data written to the export/logging files along with the format of those files. To view or change these settings, click the File menu, followed by the Export & Data Log Settings command. This displays a window similar to the following figure.
At the top of the window are five different tabs used to select one of the different data types. Each data type has its own independent formatting and logging settings.
For each type of export/logging data, three additional tabs are used to display the settings for:
• Data Selection: Determines what specific data properties are exported/logged
• File Format: Determines formatting aspects for the text file.
• Logging: Enables or disables logging, specifies file name and file mode.
36 TRsSim – Terminal Equipment Simulator

Advent Instruments Inc. 4. Basic Operation
The Data Selection tab specifies which data elements are exported or logged. In the case of events (as shown in the previous figure), the different event types may be selected, along with settings for including events with or without warnings. The same data selection settings are used for both exporting and logging
The File Format tab controls formatting aspects of the output text file. This includes options for field separators, fixed field lengths, enclosing text strings in quotation marks, replacement for space character, and the units to use for AC signal levels. The same settings are used for both exporting and logging
The Logging tab contains all the settings specific only to data logging. Clicking on the Enable check box toggles the data logging on or off. The default file location is in the 'Logs' subdirectory of the TRsSim software. This is normally located at:
C:\Documents & Settings\All Users\Application Data\Advent\TRsSim
To write the file to a different directory, specify the logging file name with a drive letter or network path. For example:
TRsSim – Terminal Equipment Simulator 37

4. Basic Operation Advent Instruments Inc.
C:\NewData\LogFiles\EventsData.txt
The File Mode setting is determines how file(s) are written. The three possible modes operates as follows:
• Append: New data is appended to an existing file. If the file does not exist, it will be created.
• Overwrite: New data creates a new file overwriting any existing file.
• Save To New File: New data creates a new file using a numerical suffix appended to the file name. After the data is written, the suffix number is incremented.
The Events, Metering Pulses, and Level Meters data types only support the append file mode. Changes made in this window only take effect once the OK button is clicked. Clicking Cancel ignores all changes.
4.4.2 Exporting Data Exporting data is accomplished by clicking the File menu, followed by the Export Data command. After supplying the file name and location to write to, the Export Data window is displayed. From this window, the data type to export is selected. This can be either, event data, AC signal sweep data, DC resistance sweep data, or metering pulse data.
38 TRsSim – Terminal Equipment Simulator

Advent Instruments Inc. 4. Basic Operation
If the AC signal or DC resistance sweep is selected, normally only the data from the last sweep is exported. However, by clicking on the Export All check box, all stored sweeps will be exported to a single file.
To change the exporting settings, click the Settings button. This displays the export and logging settings window from which data selection and formatting changes can be made.
To write the export data file, click the Export button.
TRsSim – Terminal Equipment Simulator 39

5. Performing Actions Advent Instruments Inc.
5. Performing Actions
This section provides information on how to perform various actions with the AI-5620. The topics included are:
• Line State: On/Off Hook on page 40
• DTMF Dialing on page 43
• Pulse Dialing & Line Flash on page 45
• Tone Generation on page 46
• Measurements on page 50
• Scripting on page 57
Clicking on the tabs located on the 'Status & Action' view, displays the settings for the corresponding action. When an action is active the background color of the tab changes to green.
5.1 Line State: On/Off Hook The AI-5620 alternates between the off hook and on hook state by clicking the button located just underneath the line state icon. Each hook switch state has independent control of the DC resistances and AC impedances presented to the telephone line.
The following diagram shows the various AC and DC terminations that can be applied across the tip/ring leads. All of the terminations are divided into four groups. They are AC impedance, off-hook resistance, on-hook resistance, on-hook ringing loads.
40 TRsSim – Terminal Equipment Simulator

Advent Instruments Inc. 5. Performing Actions
The AC impedance terminations are connected to the tip/ring leads by a 2uF capacitor, with the option of adding an additional 20uF in parallel. This additional capacitance improves the level accuracy when generating low frequency signals. The termination impedance is selectable from either an adjustable value in range of 200 to 1000 Ω, or the TBR-21 complex impedance, the German ZR complex reference impedance, or an optional third complex impedance (if installed).
TBR-21
ZR
opt.
200 - 1000
AC Impedance
2 uF
20 uFWideband
600
0
50 - 1000
DC Resistance
o/c
Off Hook
1k - 20k
DC Resistance
On Hook
Ringing Load
Tip/Ring
Signal Generators
The AC impedance terminations may be connected to the tip/ring leads in both the on-hook and off-hook state. However the default setting disconnects them in the on-hook state.
The off-hook resistance can be selected from a variable 50 to 1000 Ω settings, fixed 600 Ω, or a short circuit setting.
Note that in the off-hook state, the AC impedance terminations are automatically disconnected if the fixed 600 Ω or short circuit settings are selected. It is not possible to generate any tones when then fixed 600 Ω or short circuit termination is selected.
In the on-hook state, the DC resistance may be selected from a variable 1 kΩ to 20 kΩ setting, or an open circuit setting. In the open circuit setting the DC resistance across the tip/ring leads is slightly more than 5 MΩ.
Also in the on-hook state, various AC ringing loads may be applied. Six different ringing loads can be used, corresponding to REN1 through REN6 as defined by the TIA-1063 standard.
TRsSim – Terminal Equipment Simulator 41

5. Performing Actions Advent Instruments Inc.
Note If any of the ringing loads are enabled, the signal generator AC termination is automatically disconnected.
To view the on-hook settings, click the mouse on the left most 'on-hook' icon on the action tab strip.
In the on-hook state, the DC resistance of the AI-5620 can be selected from either a high resistance mode (greater than 5 MΩ), or an adjustable mode, ranging from 1 kΩ to 20 kΩ. By default, the high resistance mode is selected.
The AC impedance presented to the telephone line in the on-hook state is controlled by the clicking on one of the three buttons. They select from:
• High-Z: The high impedance mode removes all AC terminations from the telephone line interface
• Ringer Load: Enabling the ringer load termination places an impedance representing a 'telephone ringer' across the tip/ring leads. By default the AI-5620 contains six different ringing loads, which can be selected from the drop down list.
• AC Termination: In this mode, the AC impedance presented by the AI-5620's signal generators is placed across the tip/ring leads. The AC impedance is either a resistive value between 200 and 1000 Ω, or selected from a list of installed complex impedances.
Note that only when the 'AC Termination' mode is selected, can signals be transmitted to the telephone line.
To display the off-hook settings, click the off-hook icon located on the action tab strip.
In the off-hook state, one of three different terminations modes are available. They are:
42 TRsSim – Terminal Equipment Simulator

Advent Instruments Inc. 5. Performing Actions
• Programmable: In this mode the DC resistance of the telephone line is adjustable over a range of 50 to 1000 Ωs. The AC impedance may be selected from either a high impedance setting, or the impedance presented by the AI-5620's signal generators.
• Short Circuit: Terminates the telephone line in a very low impedance (less than 3 Ω).
• Fixed Resistance: Terminates the telephone line with a fixed resistance of 600 Ω.
The Fast Settling setting is used in conjunction with the adjustable off-hook resistance. It controls the rate at which the AI-5620 reaches the desired off-hook resistance during a transition from the on-hook to off-hook state. When disabled, an approximately time constant (τ) of 20 ms (settling to within 1% by 5 * 20 ms) dominates the loop stabilization rate, while if enabled it is approximately 10 times faster.
Note that if the AI-5620 is connected to an active DC feed, the combination of both the AI-5620 and DC feed's active circuitry determines the time required to stabilize the line voltage and loop current.
5.2 DTMF Dialing The DTMF dialing settings are displayed by clicking on the corresponding icon in the action tab strip.
Dialing is accomplished by either using the DTMF dial pad shown on the left side of the following figure, or entering a series of DTMF digits and clicking the start button (shown in the upper right corner).
To use the dial pad, click and hold the mouse on any of the 16 digits. The DTMF signal is generated for as long as the mouse button is held down. Alternatively, if the Toggle mode setting is checked, each click of the mouse on dial pad turns on or off (toggles) the DTMF signal generator.
The DTMF signal level is specified as either total level and twist, or by row and column tone levels. Positive twist is defined as a column (high) tone level greater than the row (low) tone level. The units for the signal levels is specified in the General Settings window.
Either of the row and column tones may be generated with an independent frequency error in the range of +/- 20% plus an additional offset in units of Hz. The percentage error is calculated based on the nominal row or column frequency.
TRsSim – Terminal Equipment Simulator 43

5. Performing Actions Advent Instruments Inc.
As an example, using a percentage error of +1.5% and an offset of +2 Hz, the resulting row and column frequencies for DTMF digit 1 are:
Row: (697 * 1.015) + 2 = 709.5 Hz
Column: (1209 * 1.015) + 2 = 1229.1 Hz
The On and Pause timing settings determine the duration of the DTMF digits and the interval time between DTMF digits respectively.
5.2.1 DTMF Symbol Parameter Offsets The above mentioned settings for level, frequency, and timing effect all DTMF digits equally. However it is possible to apply an offset to one or more specific DTMF digits. Offset values can be specified for a digit's level, frequency, or timing characteristics.
By default, no symbol offset are defined. To add, view, or modify existing offsets, click the button labeled Change. This displays a window similar to the following.
To add an offset for a DTMF digit, click the Add Symbol button. This shows a number of fields for entering the:
• Symbol digit: 0 to 9, *, #, A, B, C, or D
• Row level offset in units of dB
• Column level offset in units of dB
• Row frequency offset in units of Hz
• Column frequency offset in units of Hz
• Digit duration offset in units of ms.
• Pause interval (following the digit) in units of ms.
If no offset is desired for a specific field, leave the default value of zero.
In the example shown above, the digit '#' is modified to have a row tone level 2.3 dB lower than the nominal row tone level. A column frequency 5 Hz higher than the
44 TRsSim – Terminal Equipment Simulator

Advent Instruments Inc. 5. Performing Actions
nominal column tone frequency for that digit, and a pause interval (to the next digit) 10 ms shorter than the nominal pause interval. Once all of the desired values have been entered, click the OK button.
Offsets for additional symbols can be added by repeatedly clicking the Add Symbol button.
The window lists all of the DTMF symbols that have non-zero offset values. To edit any of the existing symbol offsets, simply click the mouse on the displayed offset value. To remove all the offsets for a symbol, click the appropriate close button (red X).
5.2.2 Off-Hook & On-Hook Dialing DTMF dialing normally occurs only in the off-hook state. If the Delay from off-hook setting is checked and the AI-5620 is in the on-hook state when dialing is started, then the AI-5620 automatically goes off-hook and waits the specified amount of time before generating the DTMF digits.
To generate DTMF in the on-hook state, disable the Delay from off-hook setting and ensure that AC terminations are applied in the on-hook state.
5.3 Pulse Dialing & Line Flash Generating a pulse dialing digit or performing a line flash is accomplished from the Pulse Dialing settings.
To dial a single digit, click the mouse on any digit within the rotary dialing wheel. For dialing a series of digits, enter them in the text box and click the start dialing button.
TRsSim – Terminal Equipment Simulator 45

5. Performing Actions Advent Instruments Inc.
The pulse dialing timing is specified as either break/make time, or by pulses-per-second and break ratio. Changing any of the four timing settings updates the others. The Inter-digit time sets the delay between dialed digits.
To perform a line flash, enter the duration in milliseconds and click the start button.
Pulse dialing and line flashes only occur in the off-hook state. If the AI-5620 is in the on-hook state, then it automatically goes off hook and waits the specified amount of time before dialing the digit(s) or performing the line flash.
5.4 Tone Generation The tone generator settings provide a wide range of flexibility for generating various signals. Four different signal types are supported. They are:
• Arbitrary Tones & Patterns
• Frequency Shift Keying (FSK)
• Broadband Noise
• Waveform Playback
Each of the different signal types have there own independent settings and more than one can be active at any time.
5.4.1 Arbitrary Tones and Patterns The AI-5620 can generate up to four tones simultaneously with arbitrary frequency and level. To generate a tone, simply enter a frequency, level, and then click the Enable check box.
The frequency setting ranges from a minimum of 10 Hz to a maximum of 18,000 Hz. The units used for signal level is specified from the General Settings window.
Any of the four tones can be linked to a pattern generator. The pattern generator is used to control the duration of the tones. By clicking the Patterned check box, each tone can be linked to the pattern generator.
Patterns are defined by a text string containing a series of time durations. The example pattern in the above figure '500-500-R', defines a tone on period of 500 ms followed by a tone off period of 500 ms, which repeats indefinitely. For more information on the various pattern commands, see Appendix A: Pattern Definitions on page 107. Very complex patterns may be formed with nested loops and adjustments made to the tone's frequency and level.
46 TRsSim – Terminal Equipment Simulator

Advent Instruments Inc. 5. Performing Actions
To start the pattern generator (and any tones linked to it), click the 'Start' button located at the bottom right corner of the settings panel. The pattern generator is stopped by clicking on the corresponding 'Stop' button.
Under certain conditions, some of the tone generators may not be available. This occurs if the tone generator(s) are used for other functions, such as generating DTMF, FSK, or AC signal sweeps.
Tones that are currently in use are indicated by a small red 'x', as shown in the above figure. Hovering the mouse on top of the red 'x', displays the reason the tone is unavailable.
5.4.2 Frequency Shift Keying Clicking the FSK tab displays the various settings used by the FSK generator.
The signal level can be defined as either, total level and twist, or by specifying the mark/space levels independently. Positive twist is defined by a mark tone level greater than the space tone level. The units for FSK levels are controlled from the General Settings window.
The Skew setting controls the bit time skew between the mark bit and the space bit. It is defined as the ratio of the mark bit time to the sum of the mark and space bit times. A value of 50% indicates equal bit time periods.
The FSK generator operates in one of three modes selected by clicking on the drop down list. The operating modes are:
• Single Shot: Send data once and then turn off
• Repeat: Repeat the data pattern indefinitely
• Hold Last Bit: Send data pattern once but maintain generating the last bit indefinitely
The data sent by the FSK generator is specified by clicking on the 'Data' tab. Six different types of data pattern can be selected from. They are:
TRsSim – Terminal Equipment Simulator 47

5. Performing Actions Advent Instruments Inc.
• All Mark: Generate the specified number of mark bits.
• All Space: Generate the specified number of space bits.
• Alternate Mark/Space: Generate an alternating one/zero pattern of bits.
• Hex String: The data consists of a specified number of channel seizure bits (alternating one/zero pattern), followed by a specified number of mark bits, followed by a series of hexadecimal bytes, followed by a specified number of mark bits (mark out). Each hexadecimal byte is serialized LSB (least significant bit) first and is preceded by a space (start) bit and followed by a mark (stop) bit.
• ASCII String: Similar to 'Hex String', a specified number of channel seizure, mark, and mark out bits are accompanied with data bytes. However the data bytes are specified as ASCII characters instead of hexadecimal bytes.
• Message Script: A series of scripting commands are used to define the FSK data bits. This mode provides the most flexibility, as the data pattern can be defined down to the individual bit level. See Appendix B: FSK Message Script on page 110 for more information on the message script commands.
To start the FSK generator, click the 'Start' button located next to the 'Data' tab. Stopping the generator is accomplished by clicking the 'Stop' button.
5.4.3 Broadband Noise To generate a broadband noise signal, click the 'Noise' tab, as shown in the following figure. The noise generator output is spectrally flat up to a bandwidth of approximately 17 kHz. The units used for output level is determined by the General Settings window.
Also contain in the General Settings window is the Noise Bandwidth setting. This setting adjusts the noise generator output to match the specified bandwidth. For example, if a 3 kHz bandwidth is selected, a noise level of -20 dBV would generate an output level of -20 dBV when measured over a 3 kHz bandwidth. The same noise when measured over the entire 17 kHz generator band will be significantly higher.
48 TRsSim – Terminal Equipment Simulator

Advent Instruments Inc. 5. Performing Actions
To turn on the noise generator, ensure the Enable box is checked. As with the tone generators, a pattern may be applied to the noise generator when the Patterned box is checked. If no pattern is applied, then the noise generator runs continuously at the specified level.
To use the pattern generator, both the Enable and Patterned boxes must be checked. In the figure shown above, the pattern of '1000-1000-R' generates noise for 1 second, turns off the noise for 1 second, and then repeats indefinitely.
Clicking on the 'Start' button starts the noise generator with the specified pattern. Turning off the noise pattern is accomplished by clicking the 'Stop' button.
For more information on the various pattern commands, see Appendix A: Pattern Definitions on page 107.
5.4.4 Waveform Playback Clicking on the 'Wave' tab displays the settings for waveform playback. The AI-5620 can play waveforms up to a maximum duration of 60 seconds, or 1 million samples. Waveform data is read from either '.wav' files, or text files. To open a waveform file, click on the 'File Open' button, shown to next to the 'Start' and 'Stop' buttons. Once a selected file has been read, it is then loaded into the AI-5620 and ready for playback
Three different markers are used to control waveform playback. They are termed Position, Start At, and Stop At, and their time value can range from zero to the duration of the waveform. The 'Position' marker presents the current playback position. Normally it starts at time zero. While playback is in progress, it can be seen moving across the waveform. When the 'Position' marker reaches the 'Stop At' marker, it immediately jumps to the 'Start At' marker and a check of the loop counter is made. If the loop counter is zero the playback stops. However if the loop counter is greater than zero, it is decremented and playback continues. By using these markers, the playback region can be limited to only a specific portion of the entire waveform.
TRsSim – Terminal Equipment Simulator 49

5. Performing Actions Advent Instruments Inc.
To change any of the markers, either enter a new time value in the appropriate field, or click the mouse on the graphical marker and drag it to the desired position.
The Looping field determines the number of times to loop playback. A value of zero means playback will stop once the 'Stop At' position is reached. A value of one means the playback continues for one additional cycle. To play waveforms continuously, ensure the Cont. (continous) box setting is checked.
The gain applied during waveform playback is adjustable over a +40 dB to -40 dB range. To change the gain, simply enter a new value (units of dB), or click and drag the Gain slider either up or down.
By hovering the mouse on top of the text showing the number of samples, rate, and length, a popup shows the positive and negative peak values as well as the RMS level for the loaded waveform.
5.5 Measurements All of the measurement functions are accessed by clicking on the 'Measurement' tab. This tab displays a drop down list containing all of the measurement operations as well as the settings for the currently selected operation.
To force the display of a measurement 'View', click the icon indicated in the following figure. It changes to the corresponding view panel used to show the measurement results.
If the box next to the icon is checked (as shown in the figure above), then anytime the measurement operation is changed, the existing views is automatically changed to display the results.
5.5.1 Level Meters The Level Meters operation simply displays one or more graphical signal meters. Each meter can be customized by units, scale, and peak hold functions.
The settings for the level meters include its AC level response time, filter selection, distortion notch filter tuning mode, and line voltage / loop current response time.
50 TRsSim – Terminal Equipment Simulator

Advent Instruments Inc. 5. Performing Actions
The meter response time settings are used to either increase or decrease the measurement integration time. A slow response time provides better measurement accuracy for low frequency signals. The default setting for AC level measurements results in a meter accuracy of +/-0.05 dB for frequencies above 20 Hz.
For the AC signal measurements, an optional filter may be applied. The filter can be selected from a wide range of low pass, high pass, band pass, and notch types. Some of the filters have adjustable corner or center frequencies, which is specified by the two fields next to the filter selection drop down list.
Three different notch filter tuning modes are available for THD+N measurements. They are:
• Single Frequency – Auto Tune: Automatically adjust a single notch filter to the reading provided by the frequency counter.
• Single Frequency – Manual: Manually enter the center frequency of the single notch filter.
• Dual Frequency – Manual: Manually enter the center frequency of two notch filters. This mode is normally used to measure DTMF THD+N.
Up to 10 graphical meters may be displayed in the 'Measurement' View. The following figure shows an example of using five meters. Each meter consists of three buttons selecting the measurement type, units, and scale functions along with a bar graph display of the measurement readings.
TRsSim – Terminal Equipment Simulator 51

5. Performing Actions Advent Instruments Inc.
By clicking the mouse on one of the three buttons, a popup menu appears listing the available selections. The measurement type includes 15 different reading types for AC signal level, AC signal frequency, line voltage, loop current, tip lead voltage, ring lead voltage, and common mode voltage.
For the AC signal level readings, the level units are selectable as either Vrms, mVrms, dBV, dBm, dBr, or %.
By default, each meter displays a maximum and minimum reading that resets once every 3 seconds. To change the display of the peak readings or change the reset time, click the scale settings button. Other scale options include changing its center position, allowing it to float, or changing the range of the scale.
While the width of each meter is fixed, their height is adjustable by clicking and dragging the vertical resize icon located at the bottom of the top left meter.
5.5.2 AC Signal Sweeps The AI-5620 can perform a wide variety of AC signal sweeps. Settings for this operation are displayed by selecting 'AC Signal Sweep' from the drop down list. Grouped into two categories, the 'Detector' settings determined what and how measurements are made, while the 'Sweep Source' settings control the signal generator characteristics.
52 TRsSim – Terminal Equipment Simulator

Advent Instruments Inc. 5. Performing Actions
The measurements taken during the sweep are selected from one of the following:
• AC Freq. Response: Measures the AC signal level with or without an optional filter applied.
• AC Freq. Response with tracking filter: Measures the AC signal level following a band pass filter with a center frequency that matches the frequency of the source signal. Using the band pass filter minimizes the effect of noise or distortion on the level measurement.
• THD+N: Measures the total harmonic distortion and noise as a ratio to the total AC signal level. An optional filter can be engaged for this measurement.
A number of different low pass, high pass, band pass, and notch filters may be placed in front of the measurement meter. To enable a filter, simply select its type from the drop down list. Some filters allow adjustable corner or center frequencies. If these filters are selected, the corresponding text boxes may be used to change the filter characteristics.
The sweep source generator operates in one of three different modes. They are:
• Sweep Frequency: The signal generator adjusts its frequency over a specified range while keeping its output level constant.
• Sweep Level: The signal generator adjusts its output level over a specified range while keeping its frequency constant.
• Off – Track Signal Frequency: The signal generator is turned off. The detector continually monitors the AC level and frequency. When the AC level is greater than the Trigger level, it performs a measurement of the both the level and frequency and reports the results. This mode allows for external generators providing the signal stimulus.
When using the sweep frequency or level modes, a start and stop point must be specified, along with the desired number of data points. The generator stepping is by default linear, but can be changed to logarithmic by enabling the Log setting.
The minimum and maximum dwell time sets limits on how long the AI-5620 waits for readings to stabilize.
Sweeps begin by clicking on the 'Start' button, and finish automatically when the specified number of measurements have been made. Clicking the 'Stop' button terminates any sweep immediately.
Note, if the source mode is set to 'Off –Track Signal Frequency', the detector waits for signals indefinitely. In this mode, the 'Stop' button must be used to terminate the sweep.
TRsSim – Terminal Equipment Simulator 53

5. Performing Actions Advent Instruments Inc.
The results of AC signal sweeps are displayed on the 'Measurement' view. Normally, such a view is opened automatically when the measurement operation is selected. The following figure shows an example of sweep results. The display consists of three regions. These are a description of the sweep settings, a graph of the measurements, and a table of the measurements.
A range of options for adjusting the display is presented by clicking on the view menu button in the top left corner of the measurement view. This displays a popup menu with selections for hiding or showing each of the three regions, along with other settings. Normally if both the graph and table are shown, the table is always drawn to the right of the graph. However, one of the options in the popup menu expands the graph to match the entire view width. In this mode, the table is drawn below the graph and a vertical scroll bar is used to view it.
The TRsSim software remembers the last twenty AC signal sweeps performed. The results from earlier sweeps may be viewed by using the 'Next' and 'Previous' buttons located in the upper right corner of the view. Clicking on the right most 'Erase' button deletes the data from the currently viewed sweep.
54 TRsSim – Terminal Equipment Simulator

Advent Instruments Inc. 5. Performing Actions
Additionally, the results from older sweeps may be plotted on the current graph. By default the last sweep result is plotted using a darker color. The number of old graphs plotted may be increased or decreased by selecting the 'Set number of history sweeps' command from the view menu.
The units for the graph's vertical scale are determined by the selection made in the General Settings window. For all units except '%' the vertical scale is always logarithmic. In addition for THD+N measurements, the vertical scale is always in units of 'dB' unless the measurement units of '%' is selected.
The horizontal scale is always in units of Hz, and is logarithmic if a logarithmic step size was used for the sweep.
5.5.3 DC Resistance Sweeps The DC resistance sweeps operate in a similar manner to the AC Signal Sweeps. In all sweep modes, the AI-5620 records measurements of the line voltage, loop current, and common mode voltage.
The AI-5620 can sweep its DC resistance setting in one of two ranges. The first is in the off-hook state over a range of 50 to 1000 Ω, while the second is in the on-hook state over a range of 1.0 to 20.0 kΩ. For each sweep the starting resistance, ending resistance, and number of points can be specified. If the Log. Sweep settings is checked, logarithmic step sizes are used. Otherwise the sweep is made in linear steps.
The minimum and maximum dwell settings provide limits on how long the AI-5620 should wait for readings to settle.
In addition to sweeping resistance, two additional modes allow for the tracking of line voltage or loop current. Setting the source mode to Off –Track Line Voltage causes the AI-5620 to continuously monitor the line voltage. When a change is sensed, it waits for a stable reading and records the new line voltage, loop current, and common mode voltage. This allows an external source to sweep the line voltage while the AI-5620 performs the measurements. Likewise, the source mode selection of Off – Track Loop Current tracks changes in loop current instead of line voltage. In both of these modes, the 'Stop' button must be pressed to end the sweep.
The results of DC sweeps are displayed on the 'Measurement' view. Normally, such a view is opened automatically when the measurement operation is selected. The following figure shows an example of a DC resistance sweep. The display consists of three regions. These are a description of the sweep settings, a graph of the measurements, and a table of the measurements.
TRsSim – Terminal Equipment Simulator 55

5. Performing Actions Advent Instruments Inc.
In the above example, the resistance was swept from 1000 Ω to 50 Ω. As the resistance is reduced, the line voltage decreased and the loop current increased.
Similar to the AC Signal Sweeps, a selection of options for adjusting the display is presented by clicking on the view menu button. This displays a popup menu with selections for hiding or showing each of the three regions among other settings. Normally if both the graph and table are shown, the table is always drawn to the right of the graph. However, one of the options in the popup menu can expand the graph to match the entire view width. In this case, the table is shown below the graph and the vertical scroll bar is used to view it.
The common mode voltage measurements are by default not displayed. They can be shown by selecting the appropriate command from the view menu shown above.
The TRsSim software remembers the last twenty sweeps performed. The results from earlier sweeps may be viewed by using the 'Next' and 'Previous' buttons located in the upper right corner of the view. Clicking on the right most 'Erase' button deletes the data from the currently viewed sweep.
56 TRsSim – Terminal Equipment Simulator

Advent Instruments Inc. 5. Performing Actions
Additionally, the results from older sweeps may be plotted on the current graph. By default only the last sweep result is plotted using a darker color. The number of previous graphs plotted may be increased or decreased by selecting the 'Set number of history sweeps' command from the view menu.
The following figure shows an example of displaying previous sweep. In this case multiple resistance sweeps were made with a constant current source DC feed attached to the AI-5620. The graph shows that at progressively higher constant loop current settings, the DC feed is unable to maintain the desired current and so limits the voltage as the resistance increases.
Depending on the source mode selection, the graph's horizontal scale will be in units of ohms, volts, or mA. In all source modes, the graph always uses a linear scale in both the vertical and horizontal axis.
5.6 Scripting The scripting tab allows the AI-5620 to accomplish a wide variety of tasks that can not be performed by using the other actions alone. Scripts are a set of instructions downloaded to the AI-5620 and executed. These instructions can access the AI-5620's resources to generate tones, adjust line interface settings, or perform measurements.
By clicking on the scripting tab, a very basic text editor is presented for creating script programs. In the following figure, an example script is used to take the AI-5620 off-hook and then 100 ms later generate a 1004 Hz tone for 2 seconds.
TRsSim – Terminal Equipment Simulator 57

5. Performing Actions Advent Instruments Inc.
Controlling the execution of a script is performed by using the three buttons shown in the upper left corner. Clicking the start button downloads the script to the AI-5620 and starts its execution. While the script is running, clicking the pause button suspends execution indefinitely. To resume operation, click the start button. Finally clicking on the stop button terminates the script program immediately.
The right most button displays a more advanced editor for writing script programs. This window may be resized for editing longer scripts and also includes a help system for listing commands and properties available with the AI-5620.
For information on the scripting language syntax, consult the appropriate manuals included with the TRsSim software.
58 TRsSim – Terminal Equipment Simulator

Advent Instruments Inc. 5. Performing Actions
To access a number of editing commands, right click the mouse within the text editor. This brings up a pop-up menu with various editing commands, as shown in the following figure.
Clicking on the 'Settings' tab displays a number of controls used to modify how the script programs are generated and executed.
The default settings provide the simplest and safest environment for the script programs and allows for a wide range of tasks. However for more complex scripts checking the 'Advanced mode' box enables the ability to perform multiple tasks at the same time. Additionally, it enables the 'Full system access' setting which can be used to access all of the properties available within the AI-5620. Note, that caution must be exercised when accessing various system level properties as they may conflict with the TRsSim software.
The list of substitution parameters provides a means of customizing the script programs. Before a script program is executed, any occurrences of the ten tokens "%0%" to "%9%" within the script program are replaced by their specified value (as shown in the list above). For example, when the following script is executed, the tone generator frequency will be set to 1234 Hz if the value of token "%0%" is set to "1234".
ToneA.Level = 1
TRsSim – Terminal Equipment Simulator 59

5. Performing Actions Advent Instruments Inc.
ToneA.Freq = %0%
ToneA.Enable = 1
To change any of the token values, click the mouse on the value column and enter the new value. Additional, the TRsSim scripting language can be used to assign token values.
A special library of routines for data transfer to and from the TRsSim scripting environment is enabled by ensuring the 'Include data transfer library' box is checked. These routines allow the script program executing on the AI-5620 to transfer data and access the TRsSim scripting logs and tables. This allows the script programs a means to return measurement data or have parameters passed to the program. The routines provided by the library as listed in the following table.
Logging Routines: The following collection of routines allow a script program to create and modify output logs which are visible from the TRsSim scripting environment.
Sub LogName (String Name)
Calling this routine creates an output log with the passed name. If a log with the same name already exists, that log is selected for output All of the other logging functions will output text to or modify the added or selected log.
Sub LogClear
Clears the selected log of all text.
Sub LogShow
Ensures the log window is displayed.
Sub LogText(String Text)
Appends the passed text string to the selected log. Note the maximum length of the text string is approximately 55 characters.
Sub LogNumber(Numeric Value)
Appends the passed numeric value to the selected log.
Sub LogNewLine
Starts a new line to the selected log.
Sub LogColumn(Numeric ColumnPosition)
Sets the column position on the current text line of the currently selected log.
Table Routines: These routines provide a means for script programs to access data tables visible from the TRsSim scripting log window.
Sub TableName(String Name)
Calling this routine creates a data table with the passed name. If a table with the same name already exists, then that table is selected for access All of the remaining functions access the table added or selected by this routine. The maximum number of unique tables supported is 100.
Sub TableSetText(Numeric Row, Numeric Column, String Text)
Places the passed text string in the selected data table at the position specified by the Row and Column parameters. The first row and column are accessed by passing the value of 1 (one based). If the
60 TRsSim – Terminal Equipment Simulator

Advent Instruments Inc. 5. Performing Actions
accessed column is configured as a numeric data type, the passed text string is converted to a number before being stored in the table. The maximum length of the text string is approximately 50 characters.
Sub TableSetNumber(Numeric Row, Numeric Column, Numeric Value)
Places the passed numeric value in the selected data table at the position specified by the Row and Column parameters. The first row and column are accessed by passing the value of 1 (one based). If the accessed column is configured as a string data type, the passed numeric value is converted to a text string before being stored in the table.
Function String TableGetText(Numeric Row, Numeric Column)
Returns the contents of the specified data table cell as a text string. Note, the first row and column are access by passing a value of 1. If the selected column is configured to store numeric values, the cell's value is converted to a string before being returned.
Function Numeric TableGetNumber(Numeric Row, Numeric Column)
Returns the contents of the specified data table cell as a numeric value. Note, the first row and column are access by passing a value of 1. If the selected column is configured to store text strings, the cell's content is converted to a numeric value before being returned.
Sub TableSize(Numeric RowCount, Numeric ColumnCount)
Sets the size of the data table to the specified number of rows and columns. The maximum number of rows or columns in a data table is 200.
Sub TableColumnName(Numeric Column, String ColumnName)
Sets the name assigned to the specified column to the passed text string.
Sub TableColumnType(Numeric Column, Numeric IsText)
Sets the data type for the specified column as either containing numeric or string data. If the parameter 'IsText' is a non-zero value, the column will be configured to contain string data. Otherwise it will hold numeric values.
Sub TableTitle(String Title)
Sets the title for the selected data table. The maximum length of the table title is approximately 55 characters.
Data Exchange Routines: Script programs can exchange data with the TRsSim scripting environment by using the following routines. They store and retrieve data to/from a flexible data bank, where each numeric value or text string is referenced by a unique ID number. The ID numbers can be any positive integer value. As the TRsSim scripting environment can access this data bank as well, it provides a method for data exchange.
Sub SendText(Numeric IDnum, String Text)
Stores the passed text string to the data bank using the associated ID number. If the ID number is unique, a new entry is created. Otherwise the existing contents associated with that ID number is overwritten. The ID number can be any positive integer. The text string is limited to about 55 characters in length.
Sub SendNumber(Numeric IDnum, Numeric Value)
Stores the passed numeric value to the data bank using the associated ID number. If the ID number is unique, a new entry is created. Otherwise the existing contents associated with that ID number is overwritten. The ID number can be any positive integer.
Function String GetText(Numeric IDnum)
Returns the text string associated with the passed ID number. If no data was previously written to the
TRsSim – Terminal Equipment Simulator 61

5. Performing Actions Advent Instruments Inc.
data bank with the ID number, an empty sting is returned. If the data stored was a numeric value, it is converted to a text string before being returned.
Function Numeric GetNumber(Numeric IDnum)
Returns the numeric value associated with the passed ID number. If no data was previously written to the data bank with the ID number, a value of zero is returned. If the data stored was a text string, it is converted to a numeric value before being returned.
62 TRsSim – Terminal Equipment Simulator
Advent Instruments Inc. 6. Line Monitoring
6. Line Monitoring
The AI-5620 has a number of functions useful for monitoring signals and conditions present on the telephone line. Their operation is described in the following sections:
• Event Detection on page 63
• Waveform Capture on page 72
• FFT View on page 88
• Chart Recorder on page 93
• Metering Pulses on page 100
All line monitoring functions, with the exception of the FFT view, utilize a timer that time stamps events, downloaded waveforms, and chart recorder data. While the timer normally starts running when the TRsSim software starts, it can be suspended at any time. When suspended, no events are detected, no waveforms are downloaded, and no chart recorder measurements are stored. When resumed, all the line monitoring functions resume their prior operation.
The timer state is identified by the icon located at the bottom right of the 'Status & Action' view. Clicking the mouse on the icon brings up a menu for toggling the timer state and deleting all chart recorder data, event detection data, and waveform capture data.
Note, upon loading a configuration or data recorder file, the timer automatically enters the suspended state.
6.1 Event Detection The AI-5620 continually monitors the telephone line for a wide variety of telephony related events. This includes events such as a change of line state, ringing, DTMF, FSK/Caller ID. Once an event is detected, various measurements may be performed and
TRsSim – Terminal Equipment Simulator 63

6. Line Monitoring Advent Instruments Inc.
the results are displayed to the 'Event Listing' view. In addition, icons and timing markers for each event may be overlaid on top of captured waveforms.
The events detected by the AI-5620 are:
Going Off-Hook: This event timestamps the point in time when the AI-5620 line state is detected as off-hook. This state is entered when the loop current exceeds the 'I-OffHook' threshold defined in the General Settings window.
Going On-Hook: Marks the time when the AI-5620 line state is deemed to be on-hook. This requires the measured line voltage exceeding the 'V-OnHook' threshold voltage and simultaneously the loop current falling below the 'I-OnHook' threshold as defined in the General Settings window.
Line In-Use: Marks the time when the telephone line has been seized by a parallel connected device. This state is reached when the measured line voltage falls below the 'V-InUse' threshold, but is above the 'V-Disconnect' threshold, and the measured loop current falls below the 'I-OnHook' threshold, as defined in the General Settings window.
Disconnected: This state indicates that the AI-5620 has most likely been disconnected from any DC feeding bridge. It requires the both the measured line voltage and loop current be below the 'V-Disconnect' and 'I-Disconnect' thresholds respectively. The thresholds are defined in the General Settings window.
Line Flash: The line flash event is derived from the on-hook, in-use, and off-hook events. If a brief on-hook interval falls within a specified time range, a line flash event is displayed. The timing limits for the line flash are defined in the Event Detection & Warning Settings window. By default the timing range is 100 to 1000 ms.
Open Switching Interval (OSI): The OSI event is displayed if the disconnect line state occurs for a specified time range. The timing limits for an OSI are defined in the Event Detection & Warning Settings window. By default the timing range is 100 to 1000 ms.
Line Reversal: A line reversal event occurs when the DC line voltage changes sign (positive to negative, or negative to positive), and the absolute voltage measurement is above the 'V-Disconnect' threshold. Ringing is not considered to be a line reversal event.
Ringing (start of): This event marks the start of ringing. Ringing is defined as the presence of an AC signal measured to exceed 40 Vrms and falling within the frequency range of 10 to100 Hz. During ringing, the frequency, AC voltage, and DC offset voltage measurements are recorded. The end of ringing is marked by one of an on-hook, off-hook, or a line in-use event.
Pulse Dialing Digit: The pulse dialing event is derived from a series or on-hook/off-hook or on-hook/in-use events. If the break and make times meet the limits specified in the Event Detection & Warning Setting window, the pulse dialing event is shown.
DTMF Dialing: Marks the start of one or more DTMF digits. The AI-5620 will measure the frequency and level of both the row and column tones during each digit. The tone levels must be higher than the threshold set in the Event Detection & Warning Settings window in order for the DTMF digit to be detected.
Caller ID FSK Message: The Caller ID event indicates that a FSK message conforming to the ETSI, TIA/Telecordia, or NTT format was detected.
FSK Message: While normally a sub-event of the Caller ID events, this icon is displayed if FSK data bytes are detected but their content does not conform to the above mentioned Caller ID message standards.
64 TRsSim – Terminal Equipment Simulator

Advent Instruments Inc. 6. Line Monitoring
CAS/DTAS Tone: Marks the start of a CAS or DTAS tone. The signal is comprised of two tones at 2130 Hz and 2750 Hz that are present for a duration between approximately 80 to 100 ms.
Metering Pulse: Marks the start of a metering pulse tone. The tone is normally a short high frequency tone burst used for providing tolling information to a TE device. The minimum tone level, frequency, and frequency tolerance for the tone is specified in the Event Detection & Warning Settings window.
Extension In-Use Check: This event indicates the detection of a very short on-hook to in-use/off-hook pulse. It is normally used during Type II (off-hook) Caller ID as a means for the TE to detect if another device on the line is also off-hook. The timing limits for this event are specified in the Event Detection & Warning Setting window.
Digital Input A: Marks either a rising edge or falling edge detected at the AI-5620's rear panel digital input 'A' connector. The desired edge is specified in the Event Detection & Warning Settings window.
Digital Input B: Marks either a rising edge or falling edge detected at the AI-5620's rear panel digital input 'B' connector. The desired edge is specified in the Event Detection & Warning Settings window.
Information: This event reports status information from the AI-5620. Normally it is generated when most actions are performed. By default, this event is not shown, but can be enabled from the event listing filter bar.
6.1.1 Detection & Warning Limit Settings The Event Detection & Warning Settings window contains all the settings related to event detection and warning limits. To view this window, either click on the Settings button, or on the event counter icon as shown in the status bar.
The setting window (as shown in the following figure) consists of a list of all events detected by the AI-5620. The on-hook, off-hook, in-use, and disconnect events are grouped together as Line State Events.
TRsSim – Terminal Equipment Simulator 65

6. Line Monitoring Advent Instruments Inc.
For each event or group of events, a check box is shown beside its icon and name. If checked, that event type will be detected by the AI-5620. If not checked, the event is ignored and will not be recorded by the TRsSim software.
An additional check box sits along the right edge of the window for each event type. If checked then upon detecting an event, the TRsSim software automatically downloads captured waveforms for that event. When not checked, no waveforms are downloaded from the AI-5620. Also, waveforms can only be downloaded if the Waveform Capture option is installed.
Note that if the AI-5620 is configured to download waveforms continuously, the check box setting is redundant.
Many of the events listed have additional settings for defining detection criteria along with warning limits. To view these settings, click on the small '+' expand/collapse button located to the left the event icons. In the figure above, the settings for DTMF digits are shown.
Note: Normally, when expanding the settings for an event type, the settings for all other events are collapsed. To keep the settings expanded, click on the '+' expand/collapse button with the right mouse button.
The DTMF event settings shown above have both detection limits and warning limits. Some events may only have one category present, or neither. Detection limits control whether or not the AI-5620 will detect the event. If measurements fall outside the detection limits the event is not detected by the AI-5620.
Warning limits, if they exist for an event, can be enabled or disabled by the check box marked Perform Warning Checks. If enabled, every event detected has its measurements tested against the specified minimum/maximum limits shown. If an event measurement falls outside the limits, it is flagged with a warning which then displays a warning icon next to the event icon. In addition, the Event Listing view shows warning messages describing what measurement(s) failed the limits. The viewing of events can
66 TRsSim – Terminal Equipment Simulator

Advent Instruments Inc. 6. Line Monitoring
be filtered to only show events with warnings, events without warnings, or all events. As such, the warning limits provide a simple means for applying test criteria to detected events. Changing the warnings limits causes every existing event of that type to be checked against the new limits.
6.1.2 Event Listing View Displaying the detected events is performed by the Event Listing view. Multiple event listing views may be displayed at any time, with each one displaying the same or different events.
An example of the event listing view is shown below.
The view is divided into three sections. They are, from top to bottom, the filter bar, time line, and listing. Each section may be independently displayed or hidden. The filter bar is responsible for determining which events are shown in the time line and listing sections. The time line graphically shows timing relationships between events, and the listing provides detailed information on each event.
To show or hide any of the three sections, click on the view's menu button. This displays a popup menu containing various options for modifying the view's characteristics.
TRsSim – Terminal Equipment Simulator 67

6. Line Monitoring Advent Instruments Inc.
6.1.2.1 Filter Bar The event filter bar, if enabled, is always shown at the top of the view. It consists of one or more rows of buttons. Each button controls the filter setting for the event type represented by the button's icon. A small graphic above the button indicates the current filter setting for each event type.
For each event, there are four different filter settings. They are:
• Show All: Display all events of this type regardless of warning status.
• Show None: Do not display any events of this type.
• Only With Warnings: Show only the events of this type that have failed the warning limits.
• Only Without Warnings: Show only the events of this type that do not have any warnings (passed the limits).
Underneath each event button, the total number of events is displayed, along with the number of events that have failed the warning limits. For example, in the figure above, 6 ringing events where detected, with 3 of them failing the warning limits.
To change the filter setting for any of the event types, simply the click the associated button. A popup menu is displayed with the following selections.
68 TRsSim – Terminal Equipment Simulator

Advent Instruments Inc. 6. Line Monitoring
The first four selections changes the event's filter setting and causes an update of the time line and listing sections.
Selecting Show only this event type, sets all other event types to 'Show None'. This provides a simple means for showing only a single type of event.
The next three menu selections apply to all event types, and are used to display all of them, only those with warnings, or only those without warnings.
The final two selections either hide the filter button for the event, or cause all hidden filter buttons to be shown again.
6.1.2.2 Time Line The event time line provides a graphical representation of the timing relationship between events. It may be shown or hidden by clicking on the view's menu button and selecting the appropriate command.
The time line can show all events detected or be modified into showing specific event types based on the filter bar settings.
The time position corresponding to the left and right edges of the time line are shown in the upper corners, with the time span display in between.
A number of different methods can be used to adjust the position of the time line. They are:
• Click and drag the horizontal slider shown underneath the time line. This pans the time range either left or right. Once the slider moves towards the edge, the time range begins to scroll automatically.
• Click and drag the mouse anywhere on the time line to pan it either left or right.
• Rotate the mouse wheel anywhere over the time line to adjust the time span.
TRsSim – Terminal Equipment Simulator 69
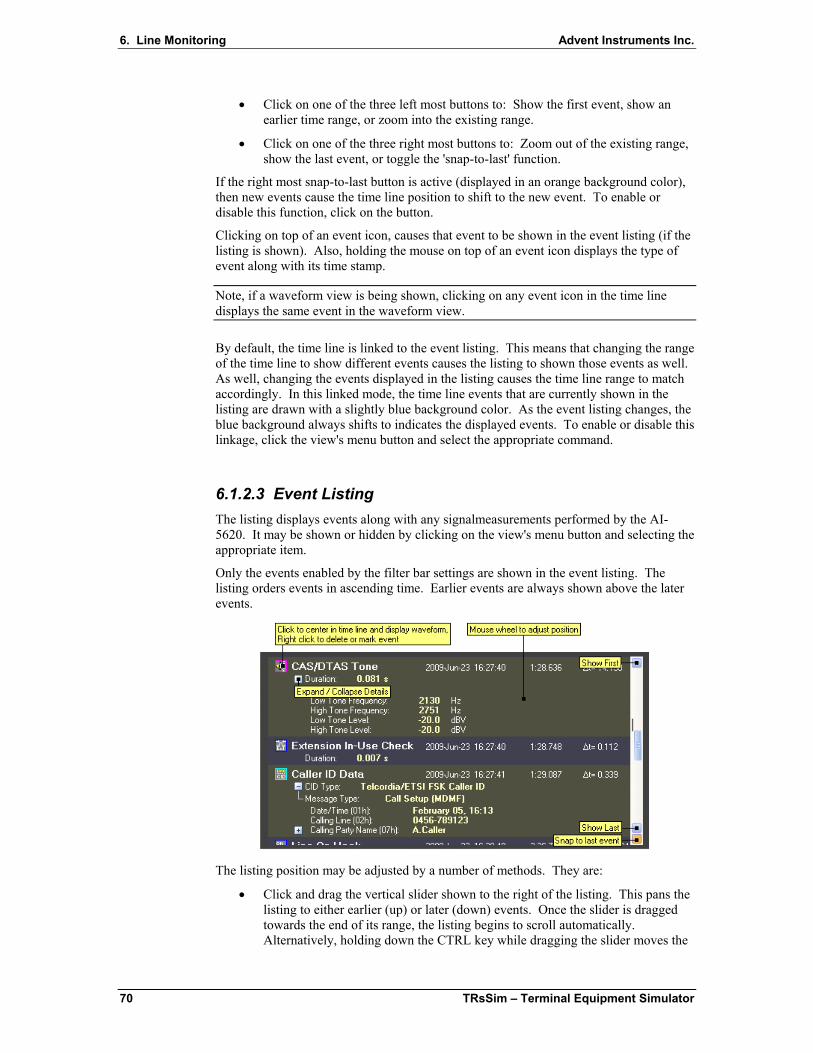
6. Line Monitoring Advent Instruments Inc.
• Click on one of the three left most buttons to: Show the first event, show an earlier time range, or zoom into the existing range.
• Click on one of the three right most buttons to: Zoom out of the existing range, show the last event, or toggle the 'snap-to-last' function.
If the right most snap-to-last button is active (displayed in an orange background color), then new events cause the time line position to shift to the new event. To enable or disable this function, click on the button.
Clicking on top of an event icon, causes that event to be shown in the event listing (if the listing is shown). Also, holding the mouse on top of an event icon displays the type of event along with its time stamp.
Note, if a waveform view is being shown, clicking on any event icon in the time line displays the same event in the waveform view.
By default, the time line is linked to the event listing. This means that changing the range of the time line to show different events causes the listing to shown those events as well. As well, changing the events displayed in the listing causes the time line range to match accordingly. In this linked mode, the time line events that are currently shown in the listing are drawn with a slightly blue background color. As the event listing changes, the blue background always shifts to indicates the displayed events. To enable or disable this linkage, click the view's menu button and select the appropriate command.
6.1.2.3 Event Listing The listing displays events along with any signalmeasurements performed by the AI-5620. It may be shown or hidden by clicking on the view's menu button and selecting the appropriate item.
Only the events enabled by the filter bar settings are shown in the event listing. The listing orders events in ascending time. Earlier events are always shown above the later events.
The listing position may be adjusted by a number of methods. They are:
• Click and drag the vertical slider shown to the right of the listing. This pans the listing to either earlier (up) or later (down) events. Once the slider is dragged towards the end of its range, the listing begins to scroll automatically. Alternatively, holding down the CTRL key while dragging the slider moves the
70 TRsSim – Terminal Equipment Simulator

Advent Instruments Inc. 6. Line Monitoring
listing to any point in the event time range. This method can be used to rapidly traverse the captured events.
• Rotate the mouse wheel anywhere over the listing to pan it either up or down. Hold down the CTRL key to pan up or down by pages instead of lines.
• Click on the top most button to show the first event.
• Click on one of the two bottom buttons to: Show the last event, or toggle the 'snap-to-last' function.
If the bottom snap-to-last button is active (when shown with an orange background color), then any new event is automatically displayed and the view window is updated. The function may be toggled on or off by clicking on the button.
Clicking directly on an event icon, causes that event to be shown in the time line (if enabled). Also if a waveform view is being shown, clicking on any event icon in the listing displays the same event in the waveform view.
For events that contain a large number of measurements, the details shown may be expanded or collapsed by clicking on the small '+' or '-' buttons.
Right clicking the mouse anywhere on the listing displays a popup menu similar to the following figure. The first three selections in the menu effect all events and are used to hide their measurements and details, only show the measurements, or show both the measurements and details.
Additional selections in the popup menu enable or disable the display of timing information and warning messages.
6.1.3 Marking & Deleting Events Right clicking the mouse on top of an event icon causes a small popup menu. From this menu, the event can be marked, unmarked, or deleted.
Events that are marked, have a special status in that they are never automatically deleted. Normally events are deleted once they reach a specified age. By marking special or unusual events, they can be preserved for further analysis or stored to a file, while unmarked events are automatically deleted over time.
Marked events are displayed with an orange border surrounding the event icon. This occurs in the event time line, event listing, and the waveform view.
TRsSim – Terminal Equipment Simulator 71
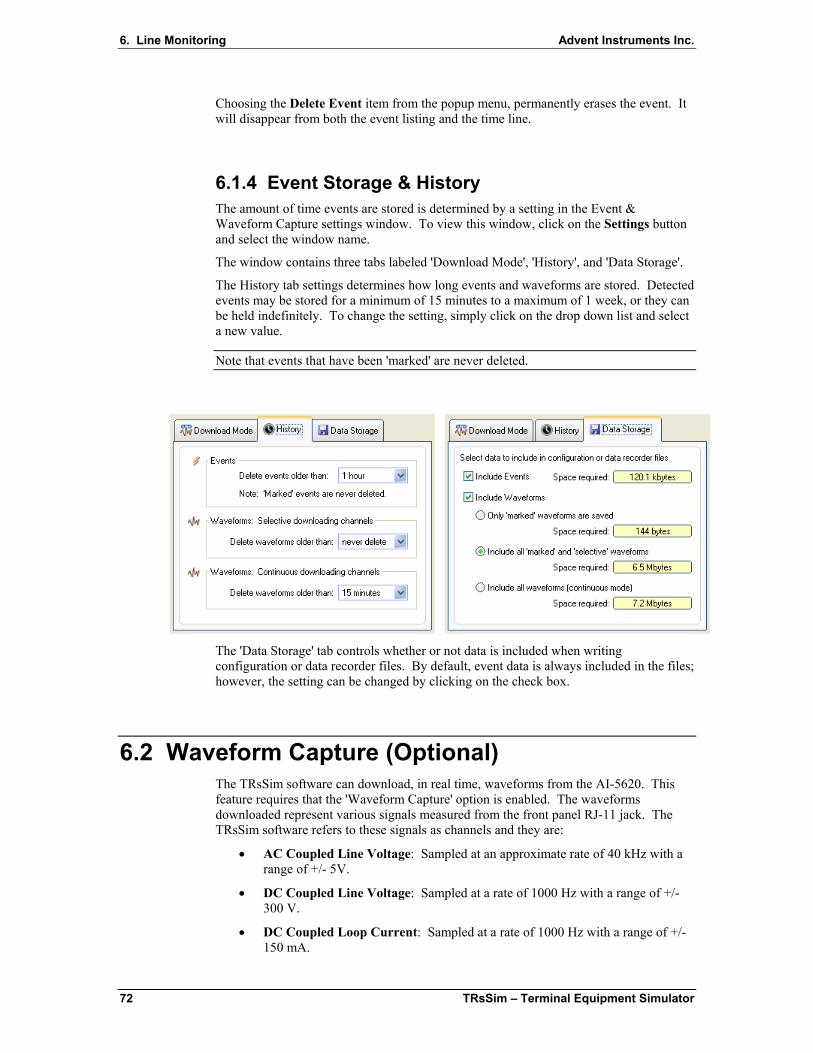
6. Line Monitoring Advent Instruments Inc.
Choosing the Delete Event item from the popup menu, permanently erases the event. It will disappear from both the event listing and the time line.
6.1.4 Event Storage & History The amount of time events are stored is determined by a setting in the Event & Waveform Capture settings window. To view this window, click on the Settings button and select the window name.
The window contains three tabs labeled 'Download Mode', 'History', and 'Data Storage'.
The History tab settings determines how long events and waveforms are stored. Detected events may be stored for a minimum of 15 minutes to a maximum of 1 week, or they can be held indefinitely. To change the setting, simply click on the drop down list and select a new value.
Note that events that have been 'marked' are never deleted.
The 'Data Storage' tab controls whether or not data is included when writing configuration or data recorder files. By default, event data is always included in the files; however, the setting can be changed by clicking on the check box.
6.2 Waveform Capture (Optional) The TRsSim software can download, in real time, waveforms from the AI-5620. This feature requires that the 'Waveform Capture' option is enabled. The waveforms downloaded represent various signals measured from the front panel RJ-11 jack. The TRsSim software refers to these signals as channels and they are:
• AC Coupled Line Voltage: Sampled at an approximate rate of 40 kHz with a range of +/- 5V.
• DC Coupled Line Voltage: Sampled at a rate of 1000 Hz with a range of +/- 300 V.
• DC Coupled Loop Current: Sampled at a rate of 1000 Hz with a range of +/- 150 mA.
72 TRsSim – Terminal Equipment Simulator

Advent Instruments Inc. 6. Line Monitoring
• DC Coupled Common Mode Voltage: Sampled at a rate of 1000 Hz with a range of +/- 300 V.
• Digital Inputs 'A' & 'B': Sampled at a rate of 1000 Hz.
6.2.1 Download Mode & Storage The TRsSim software downloads waveforms in one of two basic modes, when enabled. The two modes are termed Continuous and Selective.
Continuous waveform capture downloads all waveform channels continuously in real time. This mode of operation has the advantage of always being able to view waveforms regardless of when events are detected. However the disadvantage to continuous capture is a limit on the recording time (due to file size restrictions), and a greater processor loading on the PC. In continuous mode, up to the last 6 hours may be captured as limited by a 2 GB file size limit.
The second operating mode is Selective capture. In this mode, the TRsSim software only downloads waveforms when an event is detected. Once an event is detected, waveforms a specified amount of time prior and past the event are downloaded from the AI-5620.
The current waveform capture status is always displayed in the status line. Clicking the mouse on the icon displays a popup menu from which the capture mode can be changed, or the Event & Waveform Capture settings window opened.
The Event & Waveform Capture settings window controls how waveforms are downloaded from the AI-5620 along with how they are stored. This window is displayed by either clicking the Settings button and selecting the window name, or clicking on the download status icon as shown in the figure above.
The window consists of three tabs labeled 'Download Mode', 'History', and 'Data Storage' and it is used to change or view the download settings. Clicking on the Download Mode tab displays the following.
TRsSim – Terminal Equipment Simulator 73
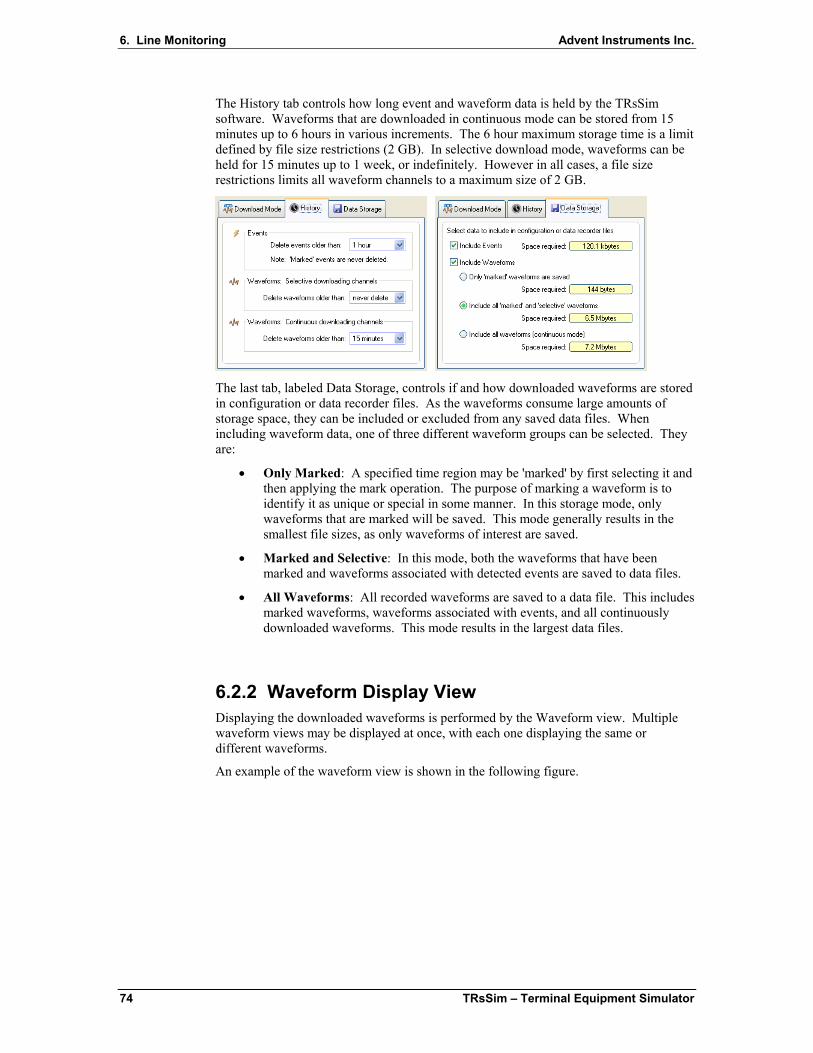
6. Line Monitoring Advent Instruments Inc.
The History tab controls how long event and waveform data is held by the TRsSim software. Waveforms that are downloaded in continuous mode can be stored from 15 minutes up to 6 hours in various increments. The 6 hour maximum storage time is a limit defined by file size restrictions (2 GB). In selective download mode, waveforms can be held for 15 minutes up to 1 week, or indefinitely. However in all cases, a file size restrictions limits all waveform channels to a maximum size of 2 GB.
The last tab, labeled Data Storage, controls if and how downloaded waveforms are stored in configuration or data recorder files. As the waveforms consume large amounts of storage space, they can be included or excluded from any saved data files. When including waveform data, one of three different waveform groups can be selected. They are:
• Only Marked: A specified time region may be 'marked' by first selecting it and then applying the mark operation. The purpose of marking a waveform is to identify it as unique or special in some manner. In this storage mode, only waveforms that are marked will be saved. This mode generally results in the smallest file sizes, as only waveforms of interest are saved.
• Marked and Selective: In this mode, both the waveforms that have been marked and waveforms associated with detected events are saved to data files.
• All Waveforms: All recorded waveforms are saved to a data file. This includes marked waveforms, waveforms associated with events, and all continuously downloaded waveforms. This mode results in the largest data files.
6.2.2 Waveform Display View Displaying the downloaded waveforms is performed by the Waveform view. Multiple waveform views may be displayed at once, with each one displaying the same or different waveforms.
An example of the waveform view is shown in the following figure.
74 TRsSim – Terminal Equipment Simulator

Advent Instruments Inc. 6. Line Monitoring
Each waveform view includes a tool bar of common operations (shown at the top), a time line of captured waveforms (below the tool bar), and finally one or more waveform graphs. In the example above, two graphs are displayed. The top most is configured to show the AC coupled line voltage (green trace), while the bottom most shows the captured DC coupled line voltage (yellow trace) and DC coupled loop current (blue trace).
Clicking on the view's menu button presents a selection of display modes along with a command to show the graph settings window.
Depending on the display mode setting, the graph time range may be automatically advanced to show the latest downloaded waveforms, or show the last event detected. In manual mode, the graph time range is only changed through user actions.
The tool bar provides a number of functions for managing the waveform display. The following figure shows the various tool bar controls.
Starting from the left, the first three buttons select the display mode. The current mode is indicated by the button's orange background color. Clicking any of these three buttons, changes the display mode.
Clicking the graph settings button displays a window used to control how many graphs are displayed along with specifying the waveforms to be plotted. More detailed information regarding this window is presented in the next section.
TRsSim – Terminal Equipment Simulator 75

6. Line Monitoring Advent Instruments Inc.
The waveform operation button displays a menu of commands for selecting waveforms, exporting waveforms, deleting waveforms, playback of waveforms, and marking/unmarking of waveforms. More information regarding waveform operations is provided in a following section.
The cursor operations button displays a menu of cursor related commands. Up to two cursors can be displayed to make measurements. More information regarding cursors is provided in a following section.
Clicking the measurements button displays a menu of commands for automatically performing various signal measurements on captured waveforms. See a following section for more information on waveform measurements.
The vertical resize button adjusts the vertical range of all graphs so the maximum amount of resolution is displayed for all waveforms.
The next two buttons are used to navigate to the previous or next events. Clicking on the previous event button finds the first event at an earlier time than the displayed range, and places that event at the center of the graph. Likewise, clicking the next event button finds the next event at a later time than the displayed range, and places that event at the center of the graph.
Anytime the graph time range or vertical scale is changed, a history of the previous range is maintained. Clicking on the right most two buttons in the tool bar, moves back or forward through the history of graph ranges. The previous range button returns the time range and vertical scale to the previous settings, thus moving backward in the history of graph ranges. Accordingly, the next range button moves forward in the history of graph ranges.
If the waveform view is wide enough, two text fields are displayed along the right edge of the tool bar.
These two text fields display the current center position and time span of the graph(s). The format for the time position and span is:
<hours> : <minutes> : <seconds>
At any time, a new position or span can be specified by simply clicking on the text field, entering a value, and pressing the Enter key. When entering time values, the suffix 'h', 'm' or 's' can be used to denote hours, minutes, or seconds respectively. Some examples of times are:
125 2 minutes, 5 seconds
5:15.25 5 minutes, 15.25 seconds
3.45h 3 hours, 27 minutes
1:6.7m 1 hour, 6 minutes, 42 seconds
Right clicking the mouse anywhere on the waveform graph, except over the event icons, displays a popup menu similar to the following:
76 TRsSim – Terminal Equipment Simulator

Advent Instruments Inc. 6. Line Monitoring
This menu provides many of the same functions available on the tool bar. These include moving forward or back in the view/range history, moving to previous or next events, and performing a resize of the graph(s) vertical scale.
6.2.2.1 Navigation A number of different methods can be used to change the graph position both vertically and horizontally. In addition to the tool bar buttons, and time line methods, a number of controls on the graph allow for position changes.
The two buttons in the lower left corner determine the mouse mode. The mouse can operate in one of two modes. They are zoom-box and pan. The selected mode is indicated by an orange background color on the appropriate button. When operating in pan mode, holding the left mouse button down and dragging the mouse causes the graph position to pan in the direction of the mouse. The zoom-box mode is useful for examining a very specific region of a waveform. In this mode, a zoom box is drawn by holding the left mouse button down and dragging it to form a box. Once the mouse button is released, the graph position changes to match the range specified by the drawn box.
As a short cut for changing mouse modes, double clicking the mouse anywhere on the graph toggles between the zoom-box and pan modes.
Zooming the graph's horizontal range in or out is easily performed by rolling the mouse wheel up or down. Rolling the mouse wheel up performs a horizontal zoom 'in' at the current position of the mouse, while rolling the mouse wheel down performs a zoom 'out'.
To zoom in or out on a graph's vertical range, press and hold the CTRL key while the mouse wheel is rolled either up or down.
The horizontal scroll bar shown at the bottom of the graph provides a number of controls for adjusting the time position of the graphs. The four buttons, from left to right, show the first (earliest) waveform captured, zoom in, zoom out, and show the last waveform captured. The scroll button in the middle is used to pan the graph either left or right. If the scroll button is dragged close to the edge of its range, the graph begins the slide continuously right or left. Releasing the scroll button stops any movement and resets its position to the center.
A vertical scroll bar for each graph operates in a similar manner.
TRsSim – Terminal Equipment Simulator 77

6. Line Monitoring Advent Instruments Inc.
If event icons are displayed on a graph, by double clicking on the icon the graph's horizontal and vertical range is changed to match the event. This provides a simple means to quickly look at the waveforms associated with an event.
6.2.2.2 Graph Settings Clicking the graph settings button on the tool bar, or selecting the graph display settings command from the view menu displays the following window.
This window determines how many graphs are displayed in the waveform view, and what the content of each graph is. Up to four graphs may be displayed in the waveform view. All of the graphs share the same horizontal time range. However their vertical scale is independent from each other.
For each graph, a drop down list selects the category of waveforms for display. These categories are: AC Coupled Channel, DC Coupled Channels, and Digital Inputs. Once a selection is made, a list of all applicable waveforms from that category are displayed. If a corresponding check box is checked, the waveform is displayed in the graph.
For each graph, event icons and event timing markers may be displayed or hidden. These are controlled by the two corresponding check boxes.
To add a new graph, click the button labeled 'Add Graph'. To remove a graph, click the remove graph button, shown by a cross in a red background.
As the graphs are displayed in the same order as listed in the window, use the swap position button (displayed below the remove graph button) to change the ordering of multiple graphs.
6.2.2.3 Waveform Time Line The waveform time line is a graphical aid for viewing and navigating captured waveforms. Displayed just below the tool bar, it shows the timing relationship between all captured waveforms and the currently viewed time range.
The time line primarily consists of three vertically stacked horizontal lines, each representing a category of waveforms. The bottom most line (if present), represents continuously downloaded waveforms. The middle line represents the 'selective' waveforms. These are waveforms associated with detected events. As such, they indicate where events have been detected. If no events are present, the middle line will be blank. Finally the top most line represents waveforms that have been marked.
78 TRsSim – Terminal Equipment Simulator

Advent Instruments Inc. 6. Line Monitoring
Marking a waveform is done to preserve or tag a waveform. Waveform ranges may be marked or unmarked from the operations menu.
The left most edge of the time line corresponds to the time of the earliest waveform captured, while the right most edge is the time of the last waveform captured.
In addition to displaying the relative position of various waveforms, the time line indicates the position and time span of the graph(s) currently being viewed by the green shaded area. As the graph position is moved, the shaded area on the time line moves to reflect the change. In situations where the graph position is moved to a time either earlier than any captured waveforms or later than any captured waveforms, arrows are drawn on the time line. These arrows indicate the direction the current graph position is relative to the captured waveforms.
When a time region is selected, it is represented on the time line as an area shaded yellow. Selecting a region is used to mark, export, delete, or playback waveforms and controlled from the operations menu.
Finally, if cursors are enabled their position is displayed on the time line by the 'A' and 'B' markers.
A number of methods can be used to adjust the graph's time range from the time line. They are:
• Dragging View Region: If the mouse is moved on top of the currently viewed time range (green shaded region), the mouse pointer changes to a left-right arrow. Pressing the left mouse button and dragging it left or right moves the displayed graph time range accordingly. When the desired position is reached, simply release the mouse button.
• Graph Peeking: By moving the mouse to a position over the time line (except on top of the currently viewed time range) for at least one second, the graph temporarily displays the time range represented by the mouse position. In this mode, the graphs are shaded with a blue background color. By sliding the mouse left or right, the graph time range shifts to match. Once the mouse leaves the time line, the graph view returns the previously viewed range. This method is useful in quickly looking at another time region without changing the current view position.
• Mouse Click: Clicking the mouse anywhere on the time line causes the current graph position to change to the time represented by the mouse position.
• Mouse Wheel: Rolling the mouse wheel when the mouse is on top of the time line causes the graph to zoom in or out.
6.2.2.4 Event Display Controlled by the graph settings window, the display of graphical icons representing detected events and timing relationships can be enabled or disabled. By default, they are enabled.
TRsSim – Terminal Equipment Simulator 79

6. Line Monitoring Advent Instruments Inc.
If event icons are displayed, hovering the mouse on top of the icon displays a small popup showing available measurements. In the example figure below, the details for a DTMF digit are shown by holding the mouse above the icon for the event.
A number of operations may be performed with the event icon. These include:
• Show in Event Listing: If an event listing view is opened, clicking the mouse on the icon causes the event listing to show the event.
• Event Zoom: Double clicking on the icon changes the graph's range to match the event time span.
• Event Menu: Right clicking the mouse on the event icon shows a menu similar to the following figure. From this menu, events may be marked/unmarked, or deleted. Marking events preserves them from automatic deletion.
6.2.2.5 Time Region Selection Waveform operations such as playback, export, deleting, and marking/unmarking are performed on selected time regions. This section describes the different methods available for selecting time regions.
Clicking on the waveform tool bar button displays a menu with various waveform operations.
The top three menu commands, as shown above, are used to control the selected time range, while the remainder perform waveform operations.
Four different modes can be used to select a time range. They are:
80 TRsSim – Terminal Equipment Simulator

Advent Instruments Inc. 6. Line Monitoring
• Visible: Selects the time range matching to the currently viewed graph.
• Cursor: Selects the time range between cursors A and B.
• Manual: Selects the time range specified by start/stop times, or by center/span times.
• All: Selects the time range encompassing all captured waveforms.
The default selection mode is 'Visible'. To change the mode, pick the 'Selection Mode' command in the waveform menu. This displays a window similar to the following.
The waveform selector window is used to manage the selection of time regions. The selection mode is controlled by the four tool bar buttons located at the top of the window. To change modes, click the mouse on any of the four buttons.
While in the Visible mode, as the graph position is changed, the start, stop, center and span fields automatically update themselves to reflect the current graph position. Likewise, if in Cursor mode and the cursor positions are changed the selection fields are automatically updated.
To select the time region represented by start, stop, center and span fields, click the Select button. The selected time region is then displayed on the graph with a yellow background shading. Once a region of time is selected, various waveform operations may be performed. These operations are described in the following section. The figure below shows an example of a selected time region encompassing a DTMF digit.
The last 10 selected time regions are remembered by the TRsSim software. They can be recalled by clicking on 'Go to Previous', 'Go to Next' buttons, or by clicking on the selection name drop down list. Every selection is automatically given a name based on the selection mode and time span; however, this name may be edited by clicking on the 'Change Selection Name' button.
TRsSim – Terminal Equipment Simulator 81
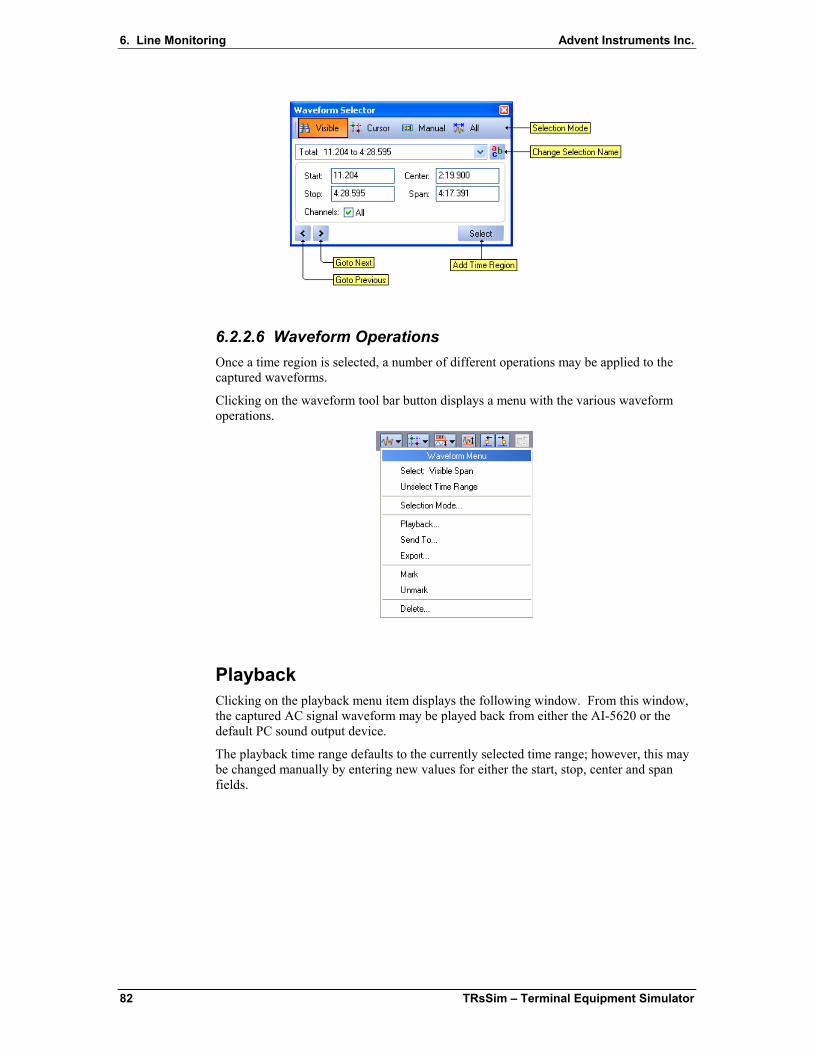
6. Line Monitoring Advent Instruments Inc.
6.2.2.6 Waveform Operations Once a time region is selected, a number of different operations may be applied to the captured waveforms.
Clicking on the waveform tool bar button displays a menu with the various waveform operations.
Playback Clicking on the playback menu item displays the following window. From this window, the captured AC signal waveform may be played back from either the AI-5620 or the default PC sound output device.
The playback time range defaults to the currently selected time range; however, this may be changed manually by entering new values for either the start, stop, center and span fields.
82 TRsSim – Terminal Equipment Simulator

Advent Instruments Inc. 6. Line Monitoring
To change the playback device to either the PC default sound output, or the AI-5620, click on the Playback Device button. Once the waveform has been loaded, the start, pause, and stop buttons displayed in the lower right corner of the window can be used to control playback.
Export Captured waveforms may be written to files by selecting the export waveform operation. This displays a window similar to the following.
The time range for file export defaults to the currently selected time range; however, this may be changed manually by entering new values for either the start, stop, center and span fields.
Waveforms may be exported in three different file formats. These are wave file, ASCII text, or binary. The wave file format creates a file containing the single selected channel. Optionally, gain may be applied for the AC coupled channel. The ASCII text format outputs each sample value to a line in a text file. Optionally, the timestamp of the sample may be included. Finally the binary format outputs each sample as either a 8 bit, 16 bit, or 32 bit signed integer.
When exporting waveforms from the AC coupled channel, the output sample rate may be changed from the default value of 39062 Hz. By clicking on the appropriate check box, the re-sampling may be enabled or disabled. The range of re-sampled rate is restricted to
TRsSim – Terminal Equipment Simulator 83

6. Line Monitoring Advent Instruments Inc.
4000 Hz to 24000 Hz. Optionally, an anti-alias filter may be applied to the waveform before its samples are written to the file. The filter is an 8th order elliptic with greater than 60 dB rejection for frequencies beyond 0.55 times the sample rate.
Mark/Unmark Selecting the mark waveform operation causes TRsSim to identify the waveform time region differently from all the other captured waveforms. This is useful for marking waveforms of interest that should be saved in Configuration or Data Recorder files. Since the amount of waveform data that can be captured by the AI-5620 is extremely large, it become impractical to save all the waveform data to Configuration or Data Recorder files. As an alternative, by only saving marked waveforms, the file sizes can become more manageable and easier to work with.
See the previous section Download Mode & Storage (page 73) for settings that control how waveform data is stored to data files.
All waveforms that are marked, are displayed in slightly brighter colors. In addition, the waveform view timeline indicates the regions of marked waveforms.
The unmark operation reverses the marked status of waveforms. To clear a time region of marked waveforms, simply select the region and click on the unmark menu item.
Delete Clicking on the delete waveform operation menu item displays the following window. From this window, waveforms may be deleted over any time range.
The time range for waveform deletion defaults to the currently selected time range; however, this may be changed manually by entering new values for either the start, stop, center and span fields. In the case of the window shown above all the channels for that time range are deleted. Specific channels may be deleted and a description of those chanels can be found Section 6.2
Clicking the Delete button clears all existing waveforms, even if they have been marked. The operation can not be undone.
Send To The send to operation allows the waveforms in the selected time region to be transferred to another device. The following window is displayed when clicking on the send to command from the waveform menu.
84 TRsSim – Terminal Equipment Simulator

Advent Instruments Inc. 6. Line Monitoring
Waveforms may be sent to any connected device that supports them. However, each device may have restrictions on the type of acceptable waveforms and their size.
The time range defaults to the currently selected time range; however, this may be changed manually by entering new values for either the start, stop, center and span fields.
6.2.2.7 Cursors Cursors may be used to make various measurements on captured waveforms. All cursor functions are accessed by clicking on the cursor menu button. This displays the following list of cursor operations.
Two cursors, labeled 'A' and 'B' may be displayed or hidden by selecting the 'Show Cursor' menu commands. When first displayed, the cursors are positioned in the center of the waveform graph.
Each cursor is represented by a vertical line and marker with the image of either 'A' or 'B' respectively. To change its position on the graph, click and hold the left mouse button on the cursor marker and drag the mouse either left or right. When at the desired location, release the mouse button.
The following figure shows the two cursors being used to measure ringing voltages and currents.
TRsSim – Terminal Equipment Simulator 85

6. Line Monitoring Advent Instruments Inc.
When either cursor is displayed, the top right corner of the graph displays the time position of each cursor along with the reading of each waveform channel the cursor passes through. In the example above, cursor 'A' is positioned at a minimum ringing voltage and current, while cursor 'B' is at a corresponding maximum two and a half cycles later.
By clicking on the cursor menu button, the following operations may be performed:
• Move To Center: Move the desired cursor to the center of the graph position regardless of where the cursor is currently located. The display graph time position and span is not changed.
• Center On: Change the graph time position such that the center of the graph moves to the time corresponding to the desired cursor. The cursor time is not changed.
• Set View To Cursor Span: Change the graph's time position and span such that its left and right edge match the cursor times. The cursor times are not changed. This operation is only available when both cursors are visible.
6.2.2.8 Measurements The measurement menu is used to automatically perform various measurements on captured waveforms. By clicking on the measurement button, a drop-down menu appears listing the available measurements.
To enable or disable a specific measurement, simply select it from the list. The last two commands are used to enable all measurements or turn them all off.
Waveform measurements are performed only over a limited time range. This range can be adjusted from a minimum of 10 ms to a maximum of 30 seconds. When a long time range is used, the measurement may take a few seconds as a large number of waveform samples must be processed If at least one measurement type is enabled, the time range used is displayed just above the waveform graph as shown in the following figure.
86 TRsSim – Terminal Equipment Simulator

Advent Instruments Inc. 6. Line Monitoring
To adjust the measurement time range, move the mouse over the graphic and click the mouse button to drag it. If the mouse is clicked on the left or right edge markers, then only the left or right edge of the measurement range is shifted. When clicking the mouse anywhere else in the measurement range, the entire range is shifted either left or right.
The above figures provides an example with all measurements enabled. For some of the measurements, only a portion of the waveform may be used. In this case, vertical lines are drawn representing the time region used for the signal measurement.
The available measurements are:
• Frequency: When attempting to determine the frequency of a waveform, the measurement scans over the entire measurement range looking for the largest AC signal. When found it attempts to find a time range which contains a stable frequency. Depending on the frequency of the signal, the time range needed can be from at little as 2 cycles to 30 cycles. The exact time position used to extract the frequency measurement is indicated on the graph with vertical lines.
• AC RMS: The AC RMS measurement is performed over the same time range as the frequency measurement. As such, the waveform requires a stable frequency in order to measure the AC RMS level. The units used to display the AC RMS level is the same as for all level measurements and can be set in the General Settings window.
• DC: The DC measurement represents the average level of waveform over the same time range as the frequency measurement. As such, the waveform requires a stable frequency in order to measure the DC level.
• Peak-to-Peak: The peak-to-peak measurement represents the difference between the maximum waveform level to the minimum waveform level over the same time range as the frequency measurement. As such, the waveform requires a stable frequency in order to measure the peak-to-peak level.
• Maximum: The maximum measurement returns the highest waveform level anywhere over the measurement range. Its position is indicated on the graph with a marker.
• Minimum: The minimum measurement returns the lowest waveform level anywhere over the measurement range. Its position is indicated on the graph with a marker.
TRsSim – Terminal Equipment Simulator 87

6. Line Monitoring Advent Instruments Inc.
If a waveform measurement can not be performed, the reading is displayed as "n/a". This may occur if the measurement time range is too short, or the waveform does not contain a region stable enough for a measurement.
6.3 FFT View (Optional) The FFT view displays the frequency domain representation for AC signals captured by the AI-5620. Operating in one of two basic modes, it shows the FFT for waveforms downloaded in real time, or on any AC signal that has been captured.
A tool bar at the top of the view provides access to various graph settings and FFT related functions.
The three left most tool bar buttons control the display mode for the FFT. Clicking the 'Live' view updates the graph in a quasi real time basis. As waveforms are downloaded from the AI-5620, FFT's are performed and the graph is continually updated. In this mode, averaging of the results may be performed as well as displaying a peak hold trace.
The 'Captured' view mode is used to display an FFT for a signal already captured. The FFT view becomes linked to a waveform view. As the waveform graph is moved or repositioned, an FFT is computed and displayed. This mode requires that a waveform view be visible.
The last mode simply freezes the FFT graph and prevents any further updates.
88 TRsSim – Terminal Equipment Simulator

Advent Instruments Inc. 6. Line Monitoring
Clicking the 'FFT Display Settings' button displays a window with various settings that control the FFT processing. This includes options to compute FFT averages and perform peak hold functions. See the following section for details on the various settings contained within this window.
The 'Maximum Graph Range' button resets both the vertical and horizontal scale of the FFT graph to their maximum ranges respectively.
The cursor operations button displays a menu of cursor related commands. Up to two cursors can be displayed and used to make measurements. More information regarding cursors is provided in a following section.
Anytime the graph horizontal or vertical scale is changed, a history of the previous range is maintained. Clicking on the two right most buttons in the tool bar moves back or forward through the history of graph ranges. The previous range button returns the horizontal and vertical scale to the previous settings, thus moving backward in the history of graph ranges. Accordingly, the next range button moves forward in the history of graph ranges.
Note, the FFT view is only available when the 'Waveform Capture' option to the AI-5620 is enabled. This option provides the ability to download waveforms.
6.3.1 Captured Mode When the FFT 'Captured' view mode is enabled, a linkage is made to a waveform view panel. If a waveform view is being displayed and it is showing an AC coupled waveform channel, then the FFT for that waveform is computed and displayed. Anytime the waveform graph changes position, the FFT is recomputed and updated.
The figure below shows an example of using the captured mode to view the FFT of a DTMF digit. Cursors in the FFT view are then used to measure the level and twist of the two frequencies that make up the DTMF digit.
TRsSim – Terminal Equipment Simulator 89

6. Line Monitoring Advent Instruments Inc.
The waveform view highlights in a red background color the time range used for the FFT calculation. Its position is always fixed to the center of the graph, while its width is determined by the number of sample points used to calculate the FFT. The number of sample points used in the FFT calculation is controlled from the graph settings window.
6.3.2 Settings The FFT display settings window contains a number of controls that determine how the FFT results are displayed and calculated. The window consists of three categories of settings called Source & Units, Display & Peak, and Processing.
The Source & Units tab selects the FFT operating mode as either using live downloading waveforms, or captured waveforms from a linked waveform view. This setting can also be changed from the tool bar.
By default the vertical units used for the FFT graph are the same as selected for all measurements in the General Settings window. However by clicking the Force To button the units can be changed to a different selection.
The Display & Peak category of settings control how the FFT results are displayed, whether averaging is performed, and whether peak measurements are displayed. The settings are shown in the following figure.
The FFT results can be displayed as either smoothed continuous lines, horizontal lines representing each bin of the FFT, or vertical bars representing the each bin of the FFT. The selection is made by clicking on the Style drop down list.
90 TRsSim – Terminal Equipment Simulator
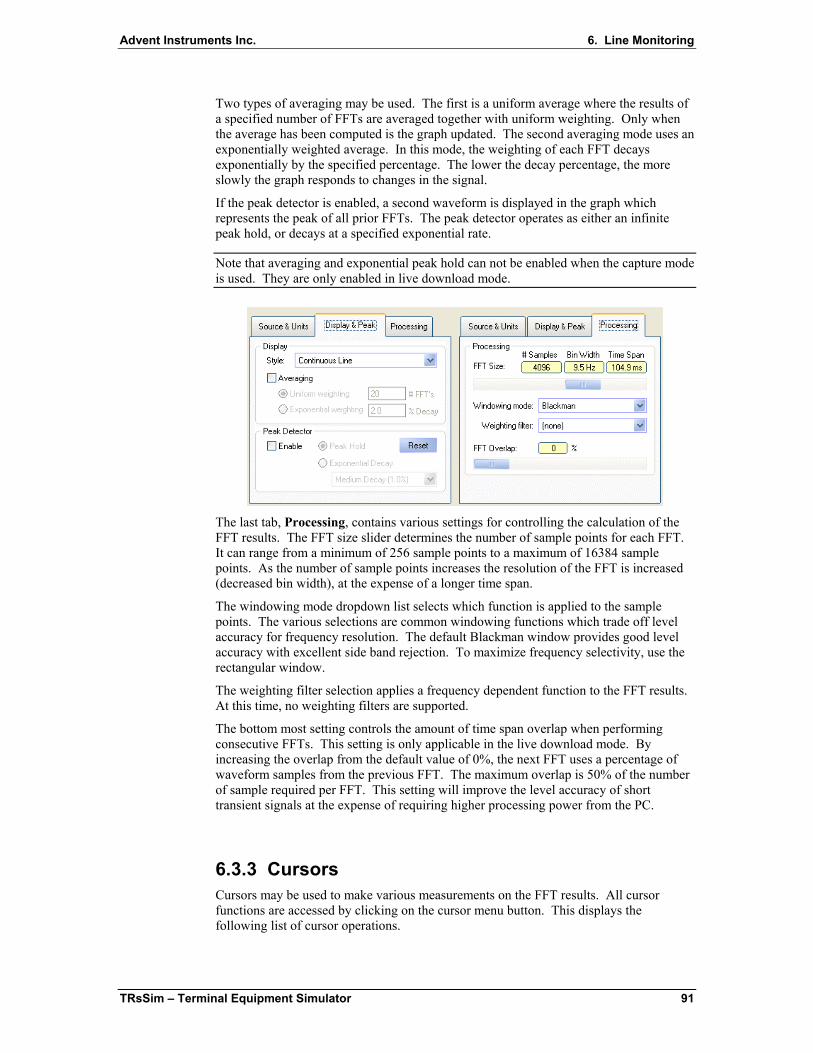
Advent Instruments Inc. 6. Line Monitoring
Two types of averaging may be used. The first is a uniform average where the results of a specified number of FFTs are averaged together with uniform weighting. Only when the average has been computed is the graph updated. The second averaging mode uses an exponentially weighted average. In this mode, the weighting of each FFT decays exponentially by the specified percentage. The lower the decay percentage, the more slowly the graph responds to changes in the signal.
If the peak detector is enabled, a second waveform is displayed in the graph which represents the peak of all prior FFTs. The peak detector operates as either an infinite peak hold, or decays at a specified exponential rate.
Note that averaging and exponential peak hold can not be enabled when the capture mode is used. They are only enabled in live download mode.
The last tab, Processing, contains various settings for controlling the calculation of the FFT results. The FFT size slider determines the number of sample points for each FFT. It can range from a minimum of 256 sample points to a maximum of 16384 sample points. As the number of sample points increases the resolution of the FFT is increased (decreased bin width), at the expense of a longer time span.
The windowing mode dropdown list selects which function is applied to the sample points. The various selections are common windowing functions which trade off level accuracy for frequency resolution. The default Blackman window provides good level accuracy with excellent side band rejection. To maximize frequency selectivity, use the rectangular window.
The weighting filter selection applies a frequency dependent function to the FFT results. At this time, no weighting filters are supported.
The bottom most setting controls the amount of time span overlap when performing consecutive FFTs. This setting is only applicable in the live download mode. By increasing the overlap from the default value of 0%, the next FFT uses a percentage of waveform samples from the previous FFT. The maximum overlap is 50% of the number of sample required per FFT. This setting will improve the level accuracy of short transient signals at the expense of requiring higher processing power from the PC.
6.3.3 Cursors Cursors may be used to make various measurements on the FFT results. All cursor functions are accessed by clicking on the cursor menu button. This displays the following list of cursor operations.
TRsSim – Terminal Equipment Simulator 91
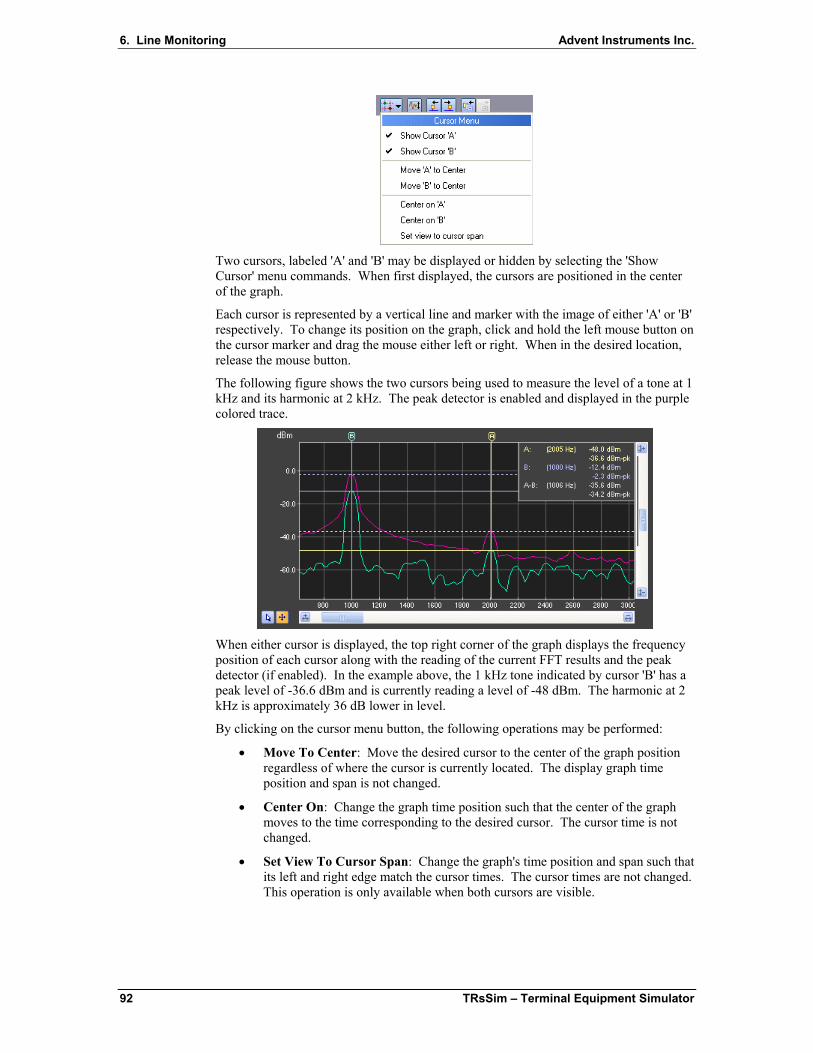
6. Line Monitoring Advent Instruments Inc.
Two cursors, labeled 'A' and 'B' may be displayed or hidden by selecting the 'Show Cursor' menu commands. When first displayed, the cursors are positioned in the center of the graph.
Each cursor is represented by a vertical line and marker with the image of either 'A' or 'B' respectively. To change its position on the graph, click and hold the left mouse button on the cursor marker and drag the mouse either left or right. When in the desired location, release the mouse button.
The following figure shows the two cursors being used to measure the level of a tone at 1 kHz and its harmonic at 2 kHz. The peak detector is enabled and displayed in the purple colored trace.
When either cursor is displayed, the top right corner of the graph displays the frequency position of each cursor along with the reading of the current FFT results and the peak detector (if enabled). In the example above, the 1 kHz tone indicated by cursor 'B' has a peak level of -36.6 dBm and is currently reading a level of -48 dBm. The harmonic at 2 kHz is approximately 36 dB lower in level.
By clicking on the cursor menu button, the following operations may be performed:
• Move To Center: Move the desired cursor to the center of the graph position regardless of where the cursor is currently located. The display graph time position and span is not changed.
• Center On: Change the graph time position such that the center of the graph moves to the time corresponding to the desired cursor. The cursor time is not changed.
• Set View To Cursor Span: Change the graph's time position and span such that its left and right edge match the cursor times. The cursor times are not changed. This operation is only available when both cursors are visible.
92 TRsSim – Terminal Equipment Simulator

Advent Instruments Inc. 6. Line Monitoring
6.4 Chart Recorder The AI-5620 continuously transmits various telephone line measurements to the TRsSim software at a rate of approximately 5 readings per second. Any of the recorded measurements may be displayed by the chart recorder view, with a time span ranging from a minimum of 1 minute to a maximum of 1 week.
The measurements available for display by the chart recorder are as follows:
• AC Signal Level: RMS level measured at the AI-5620's meter source point. By default the meter source point is the telephone interface.
• Filtered AC Signal Level: RMS level measured after the meter's programmable filter.
• Notched AC Signal Level: RMS level measured after the meter's programmable notch filters (used for THD+N) measurements.
• THD+N: Ratio of notched AC signal level to the filtered AC signal level.
• AC Signal Frequency: Frequency measured by the AI-5620's meter.
• DC Line Voltage: Differential DC voltage present at the telephone interface.
• DC Loop Current: DC loop current passing through the AI-5620.
• DC Common Mode Voltage: Common mode DC voltage present at the telephone interface w.r.t. earth ground.
• DC Tip Lead Voltage: DC voltage present on the 'Tip' lead w.r.t. earth ground.
• DC Ring Lead Voltage: DC voltage present on the 'Ring' lead w.r.t. earth ground.
• RMS (AC+DC) Line Voltage: Differential RMS voltage present at the telephone interface.
• RMS (AC+DC) Loop Current: RMS loop current passing through the AI-5620.
• RMS (AC+DC) Common Mode Voltage: Common mode RMS voltage present at the telephone interface w.r.t. earth ground.
• RMS (AC+DC) Tip Lead Voltage: RMS voltage present on the 'Tip' lead w.r.t. earth ground.
• RMS (AC+DC) Ring Lead Voltage: RMS voltage present on the 'Ring' lead w.r.t. earth ground.
The recorded measurements are effected by the AI-5620 meter's settings. This includes the AC filter selection, notch filter tuning mode, notch filter frequency, and response time & smoothing. For more information on these settings, see Level Meters on page 50.
Note that performing AC signal sweeps also effect the AI-5620 meter settings and thus the measurements contained within the chart recorder.
For each measurement channel, both the minimum and maximum value is recorded for each sample point. This permits capturing short transient conditions that have a duration less than the approximate sample rate of 5 Hz.
TRsSim – Terminal Equipment Simulator 93

6. Line Monitoring Advent Instruments Inc.
The above figure shows an example of the chart recorder view. Each view can display from one to four graphs, with each graph containing different (or the same channels). In the example above, the top most graph plots the measured DC line voltage and loop current. The middle graph plots the filtered AC signal level in units of dBV, and the bottom graph plots the AC signal frequency in Hz.
While multiple chart recorder views may be opened, they all share the same recorded data.
The tool bar shown at the top of the view provides access to commonly used functions. Starting and stopping the measurement recording is controlled from the two left most buttons which effects all chart recorder views. Additionally, recording is automatically suspended when the capture timer is suspended. The capture timer must be running for the chart recorder to store measurements.
The status of the recording process is displayed on the tool bar as one of the following:
• Recording: Measurements are being recorded.
• Stopped: Measurement recording is stopped.
• Suspended: Chart recorded is set to record measurements, but the capture timer is currently suspended. Once the timer is resumed, the measurement recording will resume as well.
94 TRsSim – Terminal Equipment Simulator

Advent Instruments Inc. 6. Line Monitoring
Clicking the 'Show Settings' tool bar button displays a window used to configure which graphs and measurement channels are displayed, as well as controlling the measurement depth (maximum time span) for the chart recorder. See the following section for details on the various settings contained within this window.
Clicking the vertical resize button causes an adjustment to the graph scaling, such that it matches the range of measurements over the current time span.
The cursor operations button displays a menu of cursor related commands. Up to two cursors can be displayed and used to make measurements. More information regarding cursors is provided in a following section.
Anytime the graph horizontal or vertical scale is changed, a history of the previous range is maintained. Clicking on the two right most buttons in the tool bar moves back or forward through the history of graph ranges. The previous range button returns the horizontal and vertical scale to the previous settings, thus moving backward in the history of graph ranges. Accordingly, the next range button moves forward in the history of graph ranges.
Also shown on the tool bar is the total time of recorded measurements and it's percentage of the maximum that can be stored before the earliest measurements are lost. In the figure above, 6 minutes and 23 seconds has been recorded, which represents 0.4% of the total amount of time that will be held by the chart recorder.
Each time the recording is started, a new segment is created. Each segment is then displayed without visual gaps in the chart recorder, except for a vertical line delimiting the segments. This prevents long periods of inactively from being displayed on the chart recorder graphs as empty space.
The following figure shows an example of the recorded segments.
In the above example figure, recording was stopped after 30 seconds which marks the end of the first segment. This is indicated by a vertical line plotted on the graph. At the one minute mark, recording was started again and a new segment was created. This continued until 1 minute and 30 seconds had elapsed. The third and final segment was started at 2 minutes and 15 seconds.
The time scale plotted on the chart recorder graphs is synchronized to the capture timer. As such the time stamp for a detected event or recorded waveform can be located on the chart recorder graph, provided recording was active at the time.
Note that if the capture timer is suspended and then resumed later while the chart recorder is recording, no additional segment is created. Suspending the timer effectively freezes time for all event detection, waveform captured, or measurement recording. Only stopping and starting the measurement recording creates a new segment.
TRsSim – Terminal Equipment Simulator 95

6. Line Monitoring Advent Instruments Inc.
Clicking the chart recorder's view menu button displays the following selection of commands.
The first menu command displays the chart recorder settings window as described in the following section, while the second command erases all measurement data in all the chart recorder views.
6.4.1 Navigation A number of different methods can be used to change the graph position both vertically and horizontally.
The two buttons in the lower left corner determine the mouse mode. The mouse can operate in one of two modes. They are zoom-box and pan. The selected mode is indicated by an orange background color for the appropriate button. When operating in pan mode, holding the left mouse button down and dragging the mouse causes the graph position to pan in the direction of the mouse. The zoom-box mode is useful for examining a very specific region of the recording. In this mode, a zoom box is drawn by holding the left mouse button down and dragging it to form a box. Once the mouse button is released, the graph position changes to match the range specified by the drawn box.
As a short cut to changing mouse modes, double clicking the mouse anywhere on the graph toggles between the zoom-box and pan modes.
Zooming in or out the graph's horizontal range is easily performed by rolling the mouse wheel up or down. Rolling the mouse wheel up performs a horizontal zoom 'in' at the current position of the mouse, while rolling the mouse wheel down performs a zoom 'out'.
96 TRsSim – Terminal Equipment Simulator

Advent Instruments Inc. 6. Line Monitoring
To zoom in or out on a graph's vertical range, press and hold the CTRL key while the mouse wheel is rolled either up or down.
The horizontal scroll bar shown at the bottom of the graph provides a number of controls for adjusting the time position of the graphs.
The left most button (Show Recorded Span) sets the graph span to continually match the depth of recorded data. As the amount of recorded data increases, the graph span automatically changes to match. This mode is toggled on or off and when active, the button is shown with an orange background color.
The right most button (Show Last) forces the right edge of the graph to align with the latest measurement made. As new measurements are recorded, the time span of the graph remains the same as the measurements scroll across from right to left. This mode is toggled on or off and when active, the button is shown with an orange background color.
The middle two buttons zoom in to the current time span or zoom out of the current time span respectively.
By clicking and dragging the scroll bar slider, the entire graph is panned either left or right. Once the slider reaches the edge of its range, the graph begins to scroll further left or right depending on the mouse position. Releasing the button, returns the slider to the center position.
The vertical scroll bar for each graph operates in a similar manner.
Aligned to the right edge of the graph are the measurement markers. These are small triangles used to represent the current measurement made for each channel displayed.
The measurement markers are shown in one of three different colors depending on the status of the chart recorder and the time range being viewed.
• Green: Recording is active and the right edge of the graph represents the current measurements.
• Yellow: Recording is active but the right edge of the graph does not represent the current measurements. The right edge is showing earlier measurements.
• Red: Recording has stopped. The position of the markers represents the last measurement result recorded.
TRsSim – Terminal Equipment Simulator 97

6. Line Monitoring Advent Instruments Inc.
6.4.2 Settings The chart recorder settings window is used to configure which measurement channels are displayed as well as the maximum recording time.
Up to four graphs may be displayed at once. All of the graphs share the horizontal time range. However their vertical scale is independent from each other.
For each graph, a drop down list selects the category of measurements to display. These categories are: Voltage/Current, AC Signal Levels, and Signal Frequency. Once a selection is made, a list of all available measurements for that category is shown. If the corresponding check box is checked, the measurement is displayed in the graph.
For the AC Signal Level category of measurements, the vertical scale units will be the same as specified in the General Settings window for measurements. However, by clicking on the 'Force AC level units to' checkbox, the units can be changed to a different selection. When displaying the THD+N measurement channel, its vertical scale is in units of dB when dBV, dVm, or dBr is selected, or expressed as a percentage when units of percent, Vrms, or mVrms is selected.
To add a new graph, click the button labeled Add Graph. To remove a graph, click the remove graph button, shown by a cross in a red background.
As the graphs are displayed in the same order as listed in the window, use the swap position button (shown below the remove graph button) to switch graph positions with the graph above.
To view or change the maximum recording depth, click the Recording Time tab shown at the top of the window. By moving the slider left or right, the recording depth can be configured between a range of 15 minutes to 1 week in various increments. Once a new recording depth is selected, the Update button must be clicked in order to accept the change. Any change effects all measurement channels, even if some of the measurement channels are not displayed.
98 TRsSim – Terminal Equipment Simulator

Advent Instruments Inc. 6. Line Monitoring
Both the current amount of disk space used and maximum amount of disk space required are shown at the bottom of the window. The maximum amount of disk space required is solely dependent on the selected recording depth.
6.4.3 Cursors Cursors may be used to make various measurements on the recorded channels. All cursor functions are accessed by clicking on the cursor menu button. This displays the following list of cursor operations.
Two cursors, labeled 'A' and 'B' may be displayed or hidden by selecting the 'Show Cursor' menu commands. When first displayed, the cursors are positioned in the center of the waveform graph.
Each cursor is represented by a vertical line and marker with the image of either 'A' or 'B' respectively. To change its position on the graph, click and hold the left mouse button on the cursor marker and drag the mouse either left or right. When at the desired location, release the mouse button.
The following figure shows the two cursors being used to obtain the minimum and maximum AC signal level for a tone being stepped in level.
TRsSim – Terminal Equipment Simulator 99
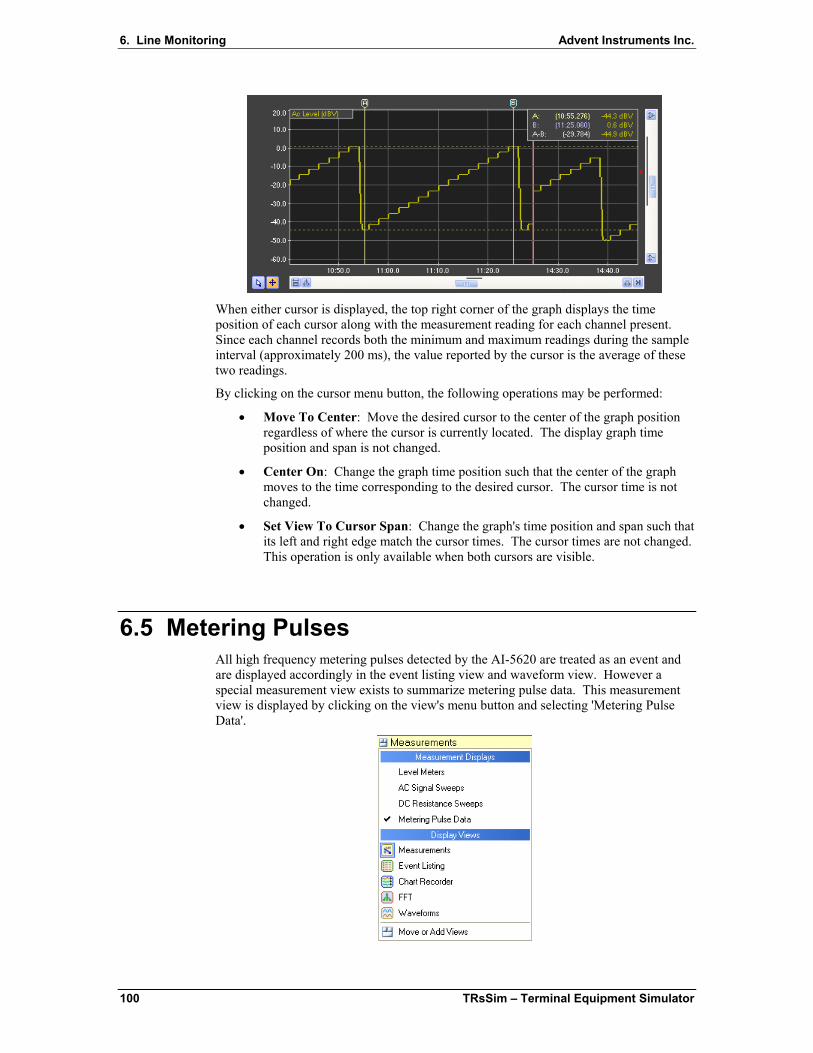
6. Line Monitoring Advent Instruments Inc.
When either cursor is displayed, the top right corner of the graph displays the time position of each cursor along with the measurement reading for each channel present. Since each channel records both the minimum and maximum readings during the sample interval (approximately 200 ms), the value reported by the cursor is the average of these two readings.
By clicking on the cursor menu button, the following operations may be performed:
• Move To Center: Move the desired cursor to the center of the graph position regardless of where the cursor is currently located. The display graph time position and span is not changed.
• Center On: Change the graph time position such that the center of the graph moves to the time corresponding to the desired cursor. The cursor time is not changed.
• Set View To Cursor Span: Change the graph's time position and span such that its left and right edge match the cursor times. The cursor times are not changed. This operation is only available when both cursors are visible.
6.5 Metering Pulses All high frequency metering pulses detected by the AI-5620 are treated as an event and are displayed accordingly in the event listing view and waveform view. However a special measurement view exists to summarize metering pulse data. This measurement view is displayed by clicking on the view's menu button and selecting 'Metering Pulse Data'.
100 TRsSim – Terminal Equipment Simulator

Advent Instruments Inc. 6. Line Monitoring
The measurement view displays the last, minimum, average, and maximum statistics on the metering pulse's frequency, level, duration, and interval measurements. In addition, the details for the last 1000 pulses detected are shown in a list. The following figure shows an example of the metering pulse measurement view.
Clicking on any of the column headers in the metering pulse list sorts the list on the column in ascending order.
To clear all the data collected, click the Clear Data button. Clicking the Settings button shows the Event Detection & Warning settings window. This window is used to enable or disable metering pulse detection as well as specifying the detection and warning limits.
Note, that the units for signal level are specified in the General Settings window for all measurements.
TRsSim – Terminal Equipment Simulator 101

7. Additional Information Advent Instruments Inc.
7. Additional Information
7.1 Line Interface Protection The AI-5620 continually monitors the telephone line interface for conditions that may damage its internal circuitry. When such a condition is detected, the AI-5620 attempts to protect itself by either i) permanently disconnecting its internal circuitry from the front panel RJ-11 jack, or ii) temporarily disconnecting affected circuits until the damaging condition is removed.
The conditions that cause permanent disconnection are:
• Absolute voltage exceeds 320 V.
• Absolute loop current exceeds 130 mA.
• Power dissipation exceeds 10 W.
The conditions that cause a temporary disconnection are:
• Power dissipation exceeds 4 watts when the fixed 600 Ω termination is applied. The termination is disconnected while the condition persists. An attempt to reconnect is made once a second.
• Power dissipation exceeds 5 watts when the programmable 50 Ω to 20 kΩ termination is applied. The programmable termination is disconnected while the condition persists. An attempt to reconnect is made once a second.
• AC RMS voltage greater than 6 Vrms is detected while any AC termination is applied. The AC termination is disconnected while the condition persists.
• AC RMS voltage greater than 150 Vrms is detected while a ringing load is applied. The ringing load is disconnected while the condition persists.
• DC line voltage exceeds 125 V while an AC termination or ringing load is applied. The AC termination and/or ringing load is disconnected while the condition persists.
If any of the AI-5620 protection mechanisms engage, the line state icon in the main control panel flashes with an orange background, similar to the following figure.
102 TRsSim – Terminal Equipment Simulator
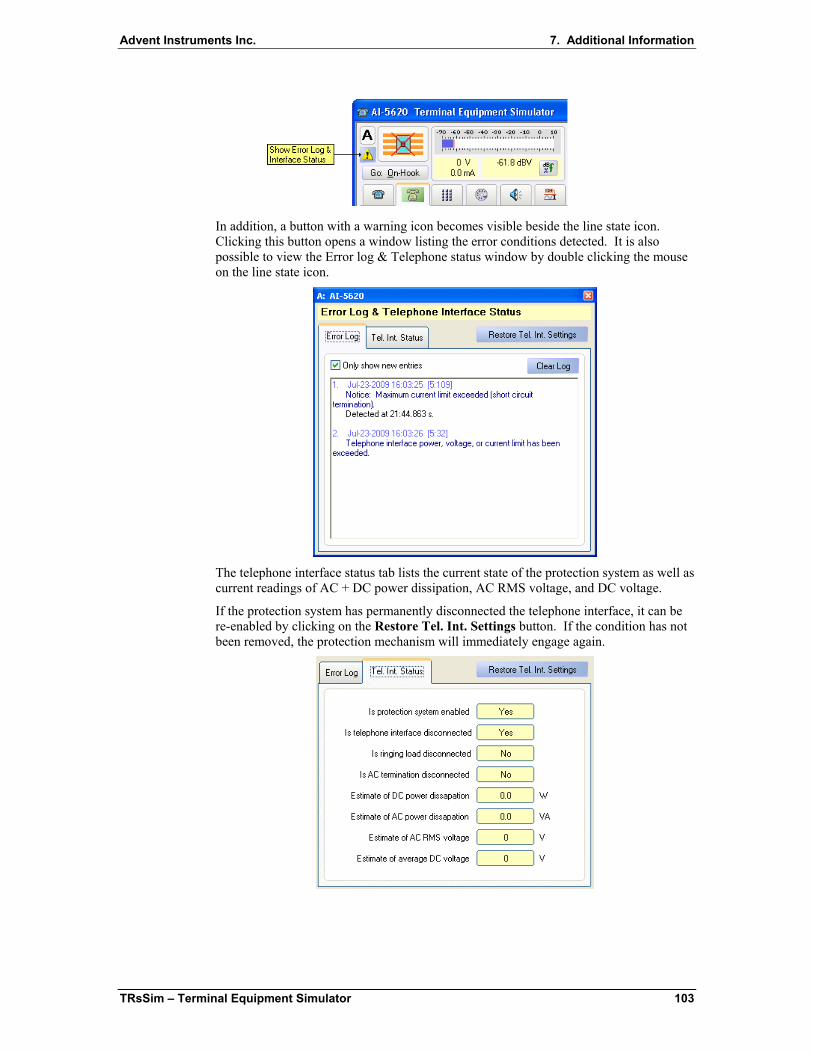
Advent Instruments Inc. 7. Additional Information
In addition, a button with a warning icon becomes visible beside the line state icon. Clicking this button opens a window listing the error conditions detected. It is also possible to view the Error log & Telephone status window by double clicking the mouse on the line state icon.
The telephone interface status tab lists the current state of the protection system as well as current readings of AC + DC power dissipation, AC RMS voltage, and DC voltage.
If the protection system has permanently disconnected the telephone interface, it can be re-enabled by clicking on the Restore Tel. Int. Settings button. If the condition has not been removed, the protection mechanism will immediately engage again.
TRsSim – Terminal Equipment Simulator 103

7. Additional Information Advent Instruments Inc.
7.2 Device Setup The Device Setup & Configuration window displays the current state of the AI-5620's connection to the PC. Selecting the Configuration menu followed by Device Setup command opens this window.
As shown below, the window is divided vertically into a listing of available devices (left side) and selected devices (right side).
Available devices connected via USB are automatically displayed. However for devices connected via a RS-232 serial port, they must be discovered manually by clicking the Search button.
The TRsSim software supports up to four simultaneously selected devices. To add available devices, simply click the Add button for the desired device. As devices are added, each is assigned a device letter from A to D. This letter is used to identify each device for scripting purposes.
To remove a selected device, simply click the device's Remove button.
Clicking the Change button displays a menu of options for enabling optional components or changing the letter assigned to the device.
104 TRsSim – Terminal Equipment Simulator

Advent Instruments Inc. 7. Additional Information
For each selected device, the window displays the device model & name, serial number, firmware and hardware versions, connection status, and what options (if any) are enabled.
When exiting the TRsSim software, it remembers which devices it was connected to. Thus when re-starting the program it attempts to connect with the same devices. If a device is missing or can not be found the Device Setup & Configuration window indicates that no connection was established with the device. Clicking on the Connect button attempts to find the unit again, while clicking on the button with the information icon displays why the attempt to find and connect to the unit failed.
7.3 Enabling Optional Features Depending on the connected device, various optional components may be available. The TRsSim software uses license keys for enabling these functions. Each key is linked to a specific device (ie. AI-5620) and may not be available if a different device is connected to TRsSim.
To enable optional components for a device, open the Device Setup & Configuration window by clicking on the Configuration menu followed by Device Setup command. Then click the Change button which displays the following menu.
Selecting the Enable Optional Components menu item then shows the following window. Enter the license key provided in this window to enable the optional components.
TRsSim – Terminal Equipment Simulator 105

7. Additional Information Advent Instruments Inc.
Once the new key has been entered the window closes and the Device Setup & Configuration window displays any changes to the optional components.
Options that are enabled are listed with a green check mark, while options not enabled are shown with a red 'X'.
106 TRsSim – Terminal Equipment Simulator

Advent Instruments Inc. Appendix A: Pattern Definitions
Appendix A: Pattern Definitions
The TRsSim software uses a special notation for defining signal patterns. These patterns can be used when generating tones or broadband noise.
A pattern is simply defined as a series of one or more commands. If more than one command is used in a pattern it must be separated by a dash ("-") character. The following list describes all of the commands supported.
<duration>: Tone On or Off Duration:
Where <duration> is an integer value between 1 and 1000000 in units of milliseconds. The first occurrence of <duration> turns on the tone for the stated duration, while the second occurrence turns off the tone for the stated duration. Subsequent commands repeat this on/off sequence.
R[<label>][<loop>]: Repeat Block:
This command repeats a block of commands. The number of times to loop is set by the optional integer value <loop>. If <loop> is present, it must be in the range of 1 to 1000000. If not specified, then the command block is repeated indefinitely. Optionally a <label>, composed of only letters, may be included in the command. If a <label> is specified, the repeat block starts at the marker command with a matching M[<label>]. If no <label> field is supplied, then all the commands from the last R[<loop>] or M command are repeated.
M[<label>]: Block Marker:
This command delimits a block of commands. It is used in conjunction with the R[<label.][<loop>] command to set the repeat range. The optional [<label>] field is used to link this marker with a repeat command using the same label
ON: Forces the tones/noise on.
OFF: Forces the tones/noise off.
STOP: Stops the pattern execution.
F[<tone>]<operator><value>: Adjust Tone Frequency
L[<tone>]<operator><value>: Adjust Tone or Noise Level
The above two commands are used to modify either the frequency or level of a tone. For the noise generator, only the level may be modified.
The optional <tone> field determines which tone(s) is modified. For example, if 'AB' is specified, then tones 'A' and 'B' will be modified. If no <tone> field is specified, then all tones associated with the pattern will be modified. For the noise generator, this field is not used.
The <operator> field determines how the frequency or level is to be changed. The valid operators are:
TRsSim – Terminal Equipment Simulator 107

Appendix A: Pattern Definitions Advent Instruments Inc.
= Set new frequency/level to <value> (units of Hz or Vrms)
+= Increment frequency/level by <value> (units of Hz or Vrms)
-= Decrement frequency/level by <value> (units of Hz or Vrms)
*= Multiply frequency/level by <value> (units of Hz or Vrms)
/= Divide frequency/level by <value> (units of Hz or Vrms)
+dB= Increase frequency/level by <value> dB
-dB= Decrease frequency/level by <value> dB
Examples of patterns:
500-700-500-3000
Turn signal on for 500 ms, then off for 700 ms, then on for 500 ms, and finally off for 3 seconds.
100-100-R9-ON
Turn signal on for 100 ms and then off for 100 ms. Repeat this 9 additional times and then turn the signal on indefinitely. This pattern is commonly used for stutter dial tone.
2000-4000-R
Turn signal on for 2 seconds, then turn signal off for 4 seconds. Repeat indefinitely.
100-150-R5-2000-1000-M-50-25-R10-ON
Generate 6 cycles of 100 ms signal on followed by 150 ms signal off. The turn on signal for 2 seconds and then off for 1 second. Then generate 11 cycles of 50 ms signal on and 25 ms signal off. Finally turn the signals on and stop the pattern.
1000-500-L+dB=1.5-R9
Turn signal on and wait 1000 ms, turn signal off and wait 500 ms, increase tone level by 1.5 dB, repeat 9 more times.
F=500-M-1000-F+=500-R9
Set tone frequency to 500 Hz, turn signal on and wait 1000 ms, increase frequency by 500 Hz, repeat the delay and frequency increment 9 more times.
FA=1000-MA-LA=1-LB=1-MB-100-LB-DB=3-RB19-FA*=1.2-RA9
This complex pattern has two nested loops. The inner loop 'MB' to 'RB19', Sweeps the level of tone generator B down in twenty 3 dB steps, once every 100 ms. The outer loop 'MA' to 'RA9', Sweeps the frequency of tone 'A' by increasing it by 20% through each of the 10 loops.
108 TRsSim – Terminal Equipment Simulator

Advent Instruments Inc. Appendix A: Pattern Definitions
The pattern can be read as follows: Set tone A frequency to 1000 Hz, mark start of loop 'A', set level of tone A to 1 Vrms, set level of tone B to 1 Vrms, mark start of loop 'B', turn on tones and wait 100 ms, decrement tone B level by 3 dB, repeat from marker 'B' 19 more times, increase tone A frequency by 20%, repeat from marker 'A' 9 more times.
TRsSim – Terminal Equipment Simulator 109

Appendix B: FSK Message Script Advent Instruments Inc.
Appendix B: FSK Message Script
A form of scripting language is used by the TRsSim software to create FSK messages. Though its use is not required, any Caller ID or SMS TL message can be specified with this scripting language. It gives a large degree of control regarding the exact bit pattern generated by the FSK modulator. This is very useful for testing exception condition handling for terminal devices, as the messages can contain non-standard data formats.
Each line of the message script must either contain a command, comment, or be blank. The FSK message script commands are not case sensitive and comment lines must start with the '*' character.
The supported commands within a message script are as follows:
STOPBITS (n)
Sets the number of stop bits added after each data byte sent. The value (n) must range between 1 and 100.
PARITY NONE | ODD | EVEN [ALL]
Sets the parity mode for transmitted data bytes. By default the parity setting is 'NONE' which transmits all eight data bits without any parity bit. A setting of 'ODD' or 'EVEN' transmits 7 data bits, with the 8th data bit representing either odd or even parity. Normally the parity setting only effects data bytes added to the message with the CHAR command. However, if the optional 'ALL' keyword is specified, then all data bytes in the message (except the checksum) is encoded with parity.
CHECKSUM CLEAR | ADD | ON | OFF | CRC16 | MOD256 | (n) | INC (n) | DEC (n)
This command is used to control the message checksum. The CLEAR keyword zeros the calculated checksum value to zero. The ADD keyword adds the checksum value to the message. The ON keyword enables the checksum calculator so any bytes added to the message will modify the checksum value. The OFF keyword disables the checksum calculation. The CRC16 keyword sets the checksum calculator to use a 16 CRC method. The MOD256 keyword sets the checksum calculator to use a modulus 256 calculation. If an integer value (n) is specified, then the current checksum calculator value is set to (n). The INC (n) and DEC (n) will increment or decrement the current checksum value by the specified integer (n).
MESSAGE TYPE (n|h) | END
Used to mark the beginning and end of a message. By knowing the start and end points of a message, the message length can be automatically calculated. The TYPE (n|h) keyword marks the start of the message and inserts single byte specified by either the 8 bit integer (n) or the hexadecimal byte (h). The END keyword is used to mark the end of the message.
PARAMETER TYPE (n|h) | END
110 TRsSim – Terminal Equipment Simulator

Advent Instruments Inc. Appendix B: FSK Message Script
Used to mark the beginning and end of a parameter. By knowing the start and end points of a parameter, the parameter length can be automatically calculated. The TYPE (n|h) keyword marks the start of the parameter and inserts single byte specified by either the 8 bit integer (n) or the hexadecimal byte (h). The END keyword is used to mark the end of the parameter.
BYTE (n) | (h) | MESSAGELENGTH [offset] | PARAMETERLENGTH [offset]
The BYTE command adds one or more byte values. This value can be either an 8 bit integer (n), or a hexadecimal byte (h). If specified as a integer, only a single byte is added to the message. Using the hexadecimal notation allows for sending multiple bytes. For example, 1234h adds two bytes to the message. The first is 12h which is then followed by 34h. Alternatively, the keywords MESSAGELENGTH and PARAMETERLENGTH are used to add a single byte value representing the message length or parameter length respectively. Optionally, an offset can be added to the length values. This is specified as an integer value.
INT16 (n) | (h) | MESSAGELENGTH [offset] | PARAMETERLENGTH [offset]
The INT16 command adds a 16 bit value. This value can be specified as either a 16 bit integer (n), or two hexadecimal bytes (h). Alternatively, the keywords MESSAGELENGTH and PARAMETERLENGTH are used to add a 16 bit value representing the message length or parameter length respectively. Optionally, an offset can be added to the length values, and is specified as an integer value. The 16 bit values added are sent as two separate bytes with the LSB sent before the MSB.
CHAR "abc"
Adds from 1 to 64 characters to the message. Each character is translated to its ASCII character code and then processed with the current parity setting.
BITS MARK (n) | SPACE (n) | ALTERNATE (n)
Adds individual bits to the message. If the MARK keyword is used, then (n) mark bits are added. Likewise the SPACE keyword adds (n) space bits. The ALTERNATE keyword adds an alternating pattern of zero and one bits. The pattern starts with a zero bit and the number of bits added is specified by (n). The value (n) must be an integer in the range of 0 to 4096
IF ONHOOK (command)
This statement allows conditional commands execution. Any of the above commands can be specified following the ONHOOK keyword. The command is executed if the tip/ring line state is on-hook at the time the message script is executed.
IF OFFHOOK (command)
Same functionality as the IF ONHOOK statement, except the command is executed if the tip/ring line state is off-hook.
DUPLICATE (n)|OFF
Duplicates the specified byte value if it has been added to the message. This is normally used for NTT Caller ID when the DLE code is used within the message.
Note that checksum byte(s) are never duplicated and the check for duplicate values is made prior to encoding the byte parity (if any).
The following example uses the message script to create a basic Caller ID message. The message uses the MDMF structure and contains date/time, calling number, and calling name information.
TRsSim – Terminal Equipment Simulator 111

Appendix B: FSK Message Script Advent Instruments Inc.
* Set the number of stopbits, * parity mode, and checksum mode STOPBITS 1 PARITY NONE CHECKSUM MOD256 CHECKSUM CLEAR CHECKSUM ON * If on-hook add 300 channel seizure * bits followed by 180 mark bits. IF ONHOOK BITS ALTERNATE 300 IF ONHOOK BITS MARK 180 * If off-hook only add 80 mark bits. IF OFFHOOK BITS MARK 80 * Use the Call Setup message type (80h) MESSAGE TYPE 80h BYTE MESSAGELENGTH * Add the data/time parameter: Oct. 25, 14:23 PARAMETER TYPE 01h BYTE PARAMETERLENGTH CHAR "10251423" PARAMETER END * Add the calling number parameter PARAMETER TYPE 02h BYTE PARAMETERLENGTH CHAR "01900150200" PARAMETER END * Add the calling name parameter PARAMETER TYPE 07h BYTE PARAMETERLENGTH CHAR "John Smith" PARAMETER END * End of the message, so add the * checksum and some mark out bits MESSAGE END CHECKSUM ADD BITS MARK 10
112 TRsSim – Terminal Equipment Simulator

Advent Instruments Inc. Appendix C: USB Driver Installation
Appendix C: USB Driver Installation
The following figures show the step by step procedure for installing the AI-5620 USB drivers. The figures are taken from the Windows XP operating system.
1. Connect the AI-5620 to the PC via a USB cable
With the AI-5620 powered on, connect a USB cable from the PC to the AI-5620. The windows operating system should detect the presence of the AI-5620 and briefly displays a popup bubble similar to the following:
As the USB drivers are not installed yet, Windows automatically starts the new hardware wizard to guide you through the installation process.
2. Select "No, not at this time", and click "Next"
The Windows operating system needs to be told how it should locate the driver files for the AI-5620. The correct selection is to specify the location for the driver files.
TRsSim – Terminal Equipment Simulator 113

Appendix C: USB Driver Installation Advent Instruments Inc.
3. Select "Install from a list or specific location" and click "Next"
The path to the driver files is supplied in the following window. Click the Browse button, which opens a window for selecting directories. The directory to select is the \drivers\ subdirectory within the TRsSim software program files. By default the drivers will be copied to the following folder when TRsSim is installed:
C:\Program Files\Advent\TRsSim\Drivers
As an alternative, the drivers are also located on the supplied CD under the following folder:
<CD Drive>:\UsbDriver
4. Specify the folder containing the drivers and click "Next"
114 TRsSim – Terminal Equipment Simulator

Advent Instruments Inc. Appendix C: USB Driver Installation
The installation process may take a few moments. During this time, a window similar to the following will be shown.
Once the installation is complete, the AI-5620 will be ready for use. The name for the USB driver is "FTDI FT8U2XX Device" so that when viewing the Control Panel's 'Device Manager' window, the AI-5620 is indicated by the "FTDI FT8U2XX Device" driver name.
5. Click "Finish"
A brief popup bubble, as shown below, indicates that the USB driver has been correctly installed and the AI-5620 is ready for use.
TRsSim – Terminal Equipment Simulator 115
Appendix D: Glossary of Terms Advent Instruments Inc.
Appendix D: Glossary of Terms
ACK Tone Acknowledgement signal sent by the TE in response to detecting a DT-AS or CAS tone. The signal is usually a DTMF digit 'D' or 'A'.
Bell 202 An FSK modulation standard that uses 1200 Hz for the mark tone frequency and 2200 Hz for the space tone frequency. The baud rate used is 1200 bits per second.
CAS Tone CPE Alerting Signal. See DT-AS.
Channel Seizure A FSK modulated alternating zero/one bit pattern that may be sent prior to any data bytes.
Checksum For the purposes of Caller ID or SMS DLL, the checksum is a byte value sent after the message data. It represents the two's complement sum of all the message byte values. The checksum is used for error detection.
dBm Unit of signal power level. Calculated as 10 times the base 10 logarithm of the ratio of the signals power relative to 0.001 Watt. For example, 1 mW = 0 dBm, 100 mW = 20 dBm. For most telephone applications, signal levels expressed in dBm are expressed with a 600 Ω terminating impedance. This fixes the relationship between dBm and dBV as 0 dBm = -2.218 dBV, or 0 dBV = 2.218 dBm.
dBV Unit of signal voltage level. Calculated as 20 times the base 10 logarithm of the signal's voltage. For example, 1 Vrms = 0 dBV, 0.1 Vrms = -20 dBV.
DLL
116 TRsSim – Terminal Equipment Simulator

Advent Instruments Inc. Appendix D: Glossary of Terms
Data Link Layer: A layer in the SMS protocol stack above the physical layer, but below the TL layer. Used to transport TL messages between SME's.
DT-AS Dual Tone Alerting Signal: A signal composed of two tones (2130 Hz & 2750 Hz) used to alert the TE of an incoming Caller ID data transmission. Also referred to a CAS tone.
DTMF Dual Tone Multi-Frequency: A signal comprised of two tones used for dialing or other signaling purposes. Eight different frequencies represented by a 4x4 matrix are used for the two tones.
Flash Telephone Line Flash: An action by a TE in which it momentarily goes on-hook, then returns to the off-hook state. The on-hook duration is usually in the range of 100 ms to 1000 ms.
FSK Frequency Shift Keying: A method of signal modulation for data transmission. For Caller ID and SMS applications, a tone's frequency is shifted between two values representing either a mark or space bit.
MDMF Multiple Data Message Format: A structure used to convey FSK modulated data of up to 255 bytes in length. Most commonly used for Caller ID applications or for sending SMS DLL messages.
MF Multi-Frequency: A method used to convey signaling information over telephone networks. Uses signals comprised of two, or possible more, tones from a standardized list of frequencies.
Off-Hook A state in which a TE draws loop current from the tip/ring interface. Denotes that the device is in use or active.
On-Hook A state in which a TE does not draw any loop current from the tip/ring interface. Denotes that the device is idle or in-active.
OSI Open Switching Interval: An interval of time in which the central office disconnects the DC feed voltage from the TE. Can be used as a method of informing a TE of an
TRsSim – Terminal Equipment Simulator 117
Appendix D: Glossary of Terms Advent Instruments Inc.
incoming Caller ID message, or simply generated as an artifact by the central office when various resources are being connected/disconnected from the telephone line.
PDU Protocol Data Unit: For the purposes the ETSI Protocol 1 SMS, the PDU is a data structure used to convey information. These PDU's are the Transfer Layer (TL) messages and take the form of one of six different types. They are: SMS-DELIVER, SMS-DELIVER-REPORT, SMS-SUBMIT, SMS-SUBMIT-REPORT, SMS-STATUS-REPORT, and SMS-COMMAND.
pps Pulses per Second: A measurement of pulse dialing which expresses the rate of dialing pulses. A dialing pulse is a short interval of time in which the TE goes on-hook and then returns to the off-hook state. The most common pulse rate in use is 10 pps; however various PSTN's may require faster or slower rates for dialing.
PSTN Public Switched Telephone Network: A network of devices allowing a TE to establish a connection to another device for the purposes of passing voice band signals.
RP-AS Ring Pulse Alerting Signal: A short ringing burst that is used to alert the TE of an incoming Caller ID data transmission.
SAS Subscriber Alerting Signal: A signal used as part of the call waiting service alerting the subscriber of an incoming call. Also may be used during a Type II Caller ID transmission by preceding the CAS signal.
SDMF Single Data Message Format: A data structure that may be used to send Type I Caller ID data consisting of date/time and calling number information. See also MDMF.
SM Short Message: Information sent between SME's using the Short Message Service (SMS)
SME Short Message Entity: A device having the capability to send or receive short messages (SM). Can be either a SM-TE or SM-SC.
SMS Short Message Service: A service used to send short messages (SM) to and from SME's.
118 TRsSim – Terminal Equipment Simulator

Advent Instruments Inc. Appendix D: Glossary of Terms
SM-SC Short Message Service Center: A functional unit that receives or sends short messages to a SM-TE.
SM-TE Short Message Terminal Equipment: A terminal equipment device that is capable of sending or receiving short messages to or from a SM-SC.
Start Bit For Caller ID and SMS applications, every 8 bit data byte transmitted via a FSK modulated signal is preceded with a single start bit. The start bit is always represented with the space tone.
Stop Bit For Caller ID and SMS applications, every 8 bit data byte transmitted via a FSK modulated signal is followed with at least one stop bit. The stop bit is always represented with the mark tone.
TE Terminal Equipment: A device connected to the telephone network. Also commonly referred to as a CPE (Customer Premise Equipment).
THD+N Total Harmonic Distortion plus Noise: A measurement normally expressed as a ratio of the signal's harmonic distortion level plus noise to the total signal level.
TL Transfer Layer: A layer in the SMS protocol stack providing a service to the SMS application layer. The transfer layer messages convey short message data or status information between SME's.
TPDU Transfer Protocol Data Unit. See ETSI TS 100 901 section 9 for PDU structure as it relates to SMS applications.
Twist Commonly refers to the ratio in signal level between the row and column tones of DTMF, or the mark and space tones of FSK. The ratio is normally expressed in decibels (dB). In the case of DTMF, positive twist indicates that the column signal level is greater than the row signal level. For FSK the most common convention is that positive twist indicates that the mark signal level is higher than the space level.
Type I
TRsSim – Terminal Equipment Simulator 119

Appendix D: Glossary of Terms Advent Instruments Inc.
120 TRsSim – Terminal Equipment Simulator
Caller ID data transmission occurring while the TE is in the on-hook state.
Type II Caller ID data transmission occurring while the TE is in the off-hook state.
V.23 An FSK modulation standard that uses 1300 Hz for the mark tone frequency and 2100 Hz for the space tone frequency. The baud rate used is 1200 bits per second.