title: application of continuous kinetic lumping model … 595 documents/class... · continuous...
TRANSCRIPT

BSysE 595 Biosystems Engineering for Fuels and Chemicals Spring 2013
Title: Application of Continuous Kinetic Lumping Model for Description of Pyrolysis Oil Hydrodeoxygenation
Spring 2013
Author: Filip Stankovikj Department of Biological Systems Engineering, Washington State University,
Pullman WA 99164-6120
Date: May 1, 2013

Continuous Kinetic Lumping Model for Pyrolysis Oil Hydrodeoxygenation
Filip Stankovikj Washington State University 2 of 25
5/1/2012
Project Title: Application of Continuous Kinetic Lumping Model for Description of Pyrolysis Oil Hydrodeoxygenation Contents:
1. Project Description.................................................................................................... 2
2. Introduction and Objectives ...................................................................................... 3
3. Historical perspective of lump modeling .................................................................. 5
4. Continuous kinetic lumping model – mathematical description............................... 6
5. Matlab implementation ............................................................................................. 9
6. Results and discussion ............................................................................................ 15
7. References ............................................................................................................... 18
8. Appendix (Matlab code) ......................................................................................... 19
1. Project Description
Hydrodeoxygenation has been identified as an important and almost inevitable step in pyrolysis upgrading. The pyrolysis oil is consisted of approximately 400 compounds, and the reactions that are involved in the process of catalytic upgrading are numerous, including: cracking, derabonylation, decarboxylation, hydrocracking, hydrodeoxygenation, and hydrogenation (fig. below). Today, even with the most sophisticated analytical tools we are not able to quantify and qualify this complex mixture. It is around 40 wt% unidentifiable compounds that are present in the bio-oil. Furthermore, knowing the kinetic parameters of the reactions of each of these 400 compounds would make the modeling effort of the hydrotreatment formidable and impossible task. Modeling of the complex kinetics of hydrodeoxigenation, predicting the yields of the process at different operating conditions in crucial for process development, optimization, control, design and selection of catalysts, etc. In order to address similar complex problem in the processes of hydrodesulfurization and hydrocracking, throughout many decades scientist have developed so called continuous lumping models which uses the true boiling points distribution of the crude oil mixture, obtained experimentally, to construct continuous concentration-reactivity function. The model follows the changes of this concentration-reactivity function throughout the hydrocracking process, and determines the fractional yield distribution of the species based on just few parameters. This seems to be an elegant and powerful method for modeling various processes in chemical engineering, however very few papers tried to use this modeling approach to describe hydrodeoxgenation processes in bio-fuel.
In this class project I will investigate the applicability of a proposed methodology for
modeling VGO (vacuum gas oil) hydrocracking to model bio-oil hydrodeoxygenation. Verification of the model will be done against the data for hydrodeoxygenation and the true boiling point distributions present in the literature. Moreover, I will propose a strategy to verify

Continuous Kinetic Lumping Model for Pyrolysis Oil Hydrodeoxygenation
Filip Stankovikj Washington State University 3 of 25
5/1/2012
the results of this model in our lab. A programing code will be developed in Matlab, and integrated within the framework of the modeling efforts in my thesis. It is as well worth investigating the ways to modify the distribution function of this model in order to get a more precise model of hydrotreatment, while using not more than 13 representative component groups. I have chosen this particular number of groups since one of my previous efforts in modeling a fractional condensation system demonstrated that this number of groups is sufficient to appropriately describe the system, and those may represent an input in the next step of the bio-refining concept (refer to figure and table in the next section).
2. Introduction and Objectives
There is no doubt among the scientists today that the number of fossil crude oil sources is diminishing, and that our only alternative for production of liquid transportation fuels and chemicals is biomass utilization. However, using biomass to produce gasoline, diesel and jet fuel is followed by much inefficiency and although many universities and national laboratories managed to develop viable concepts, they are still not able to produce fuels with prices competitive to the current fossil fuel prices. One of the most viable paths for bio-fuels production consists of biomass harvesting, fast pyrolysis and stabilization, and then refining the crude bio-oil in larger refineries by upgrading and distillation in order to obtain final transportation fuel cuts. Within this concept, developed as a design case by PNNL in 2009, diverse biomass sources might be utilized, however the large consumption of hydrogen together with the high prices of initial biomass were identified as main reasons that prevent widespread production of bio-fuels with acceptable price tags. In this spirit, the main goal of my graduate research is to develop new bio-refinery concept that will utilize the advantages of multi-step condensation systems, hydrotreatment and esterification in order to reduce hydrogen consumption and to produce novel partially deoxygenated transportation fuels. The expensive hydrogen is necessary for the processes of hydrodeoxygenation and hydrocracking, where oxygenated molecules are reacted with hydrogen on a catalyst surface in order to remove the oxygen in form of water and CO2 and produce stabilized oil. Rather than hydrotreating the whole bio-oil which consist of compounds that after hydrotreatment do not lead to liquid-fuel precursors and in the same time consume a lot
Continuous Kinetic Lumping Model for Pyrolysis Oil Hydrodeoxygenation
Filip Stankovikj Washington State University 4 of 25
5/1/2012
of hydrogen, it is better to separate the oil in fractions with distinctly different composition and characteristics and then hydrotreat only those fractions that will lead to drop-in fuels. This separation in distinct fractions may be achieved by stepwise condensation of pyrolysis vapors. In one of my previous efforts I modeled a single counter-flow spray condenser as an isothermal equilibrium flash separator in order to obtain a relationship between the product distribution and temperature at the outlet of the condenser. Naturally, the next step in modeling of the whole bio-refining concept would be modeling of the hydrotreatment step. The assumption, approximations, and methods used in this modeling project, as well as the results and the discussion on further developed will be presented in the text below. But first I will introduce the results from my previous modeling research and how this project can make use of these results in order to build one comprehensive model of a bio-refinery.
The basic hypothesis behind my previous study of the multistep condensation is that by
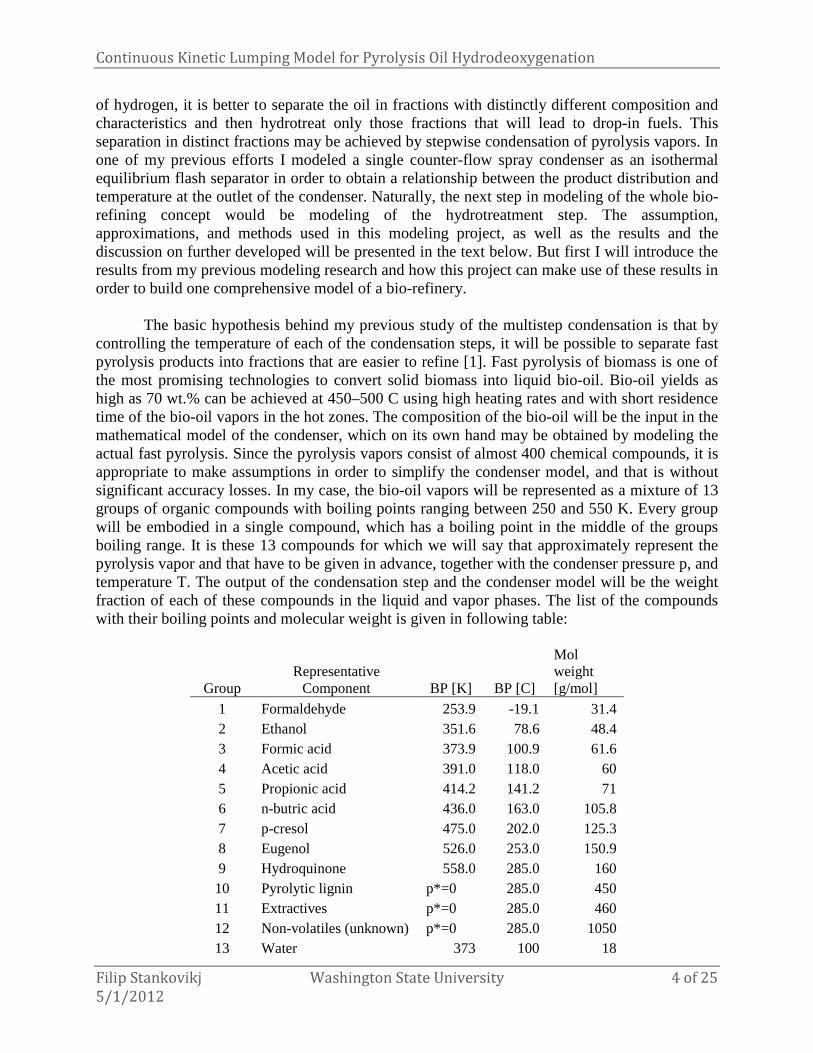
controlling the temperature of each of the condensation steps, it will be possible to separate fast pyrolysis products into fractions that are easier to refine [1]. Fast pyrolysis of biomass is one of the most promising technologies to convert solid biomass into liquid bio-oil. Bio-oil yields as high as 70 wt.% can be achieved at 450–500 C using high heating rates and with short residence time of the bio-oil vapors in the hot zones. The composition of the bio-oil will be the input in the mathematical model of the condenser, which on its own hand may be obtained by modeling the actual fast pyrolysis. Since the pyrolysis vapors consist of almost 400 chemical compounds, it is appropriate to make assumptions in order to simplify the condenser model, and that is without significant accuracy losses. In my case, the bio-oil vapors will be represented as a mixture of 13 groups of organic compounds with boiling points ranging between 250 and 550 K. Every group will be embodied in a single compound, which has a boiling point in the middle of the groups boiling range. It is these 13 compounds for which we will say that approximately represent the pyrolysis vapor and that have to be given in advance, together with the condenser pressure p, and temperature T. The output of the condensation step and the condenser model will be the weight fraction of each of these compounds in the liquid and vapor phases. The list of the compounds with their boiling points and molecular weight is given in following table:
Group Representative
Component BP [K] BP [C]
Mol weight [g/mol]
1 Formaldehyde 253.9 -19.1 31.4 2 Ethanol 351.6 78.6 48.4 3 Formic acid 373.9 100.9 61.6 4 Acetic acid 391.0 118.0 60 5 Propionic acid 414.2 141.2 71 6 n-butric acid 436.0 163.0 105.8 7 p-cresol 475.0 202.0 125.3 8 Eugenol 526.0 253.0 150.9 9 Hydroquinone 558.0 285.0 160 10 Pyrolytic lignin p*=0 285.0 450 11 Extractives p*=0 285.0 460 12 Non-volatiles (unknown) p*=0 285.0 1050 13 Water 373 100 18

Continuous Kinetic Lumping Model for Pyrolysis Oil Hydrodeoxygenation
Filip Stankovikj Washington State University 5 of 25
5/1/2012
The mathematical model developed along the lines of this class project is intended to use
the output, i.e. the bio-oil compounds distribution from the condensers in the liquid phase. The governing phenomena that determines the real composition of bio-oil out of a non-ideal condenser are dependent on the mass and energy transfer limitations, on the extent of interaction of the components in the mixture, which on the other hand depend on many measurable and immeasurable factors such as the size of the sprayed liquid particles, actual pressure and temperature in the condenser, its height, flow patterns, velocity of vapors and non-condensable gases inside the condenser, etc. However the results of my previous model are good enough to coarsely describe the bio oil.
A general form of the aforementioned model build on the previous assumptions will be
implemented in Matlab.
Figure 1. Proposed bio-refienery concept to be modeled
3. Historical perspective of lump modeling
There is a scarce literature on kinetic lumping modeling of hydrodeoxygenation reactions during pyrolysis oil upgrading. Most of the research in this area has been done on describing hydrocracking kinetics of standard petroleum oils, since prediction of yields of desired and undesired products leads to better optimization, control, and design of refining processes, as well as selection and design of catalyst. In any case, the feedstock in either hydrocracking or hydrotreatment is a complex mixture of hundreds of compounds. The actual processes of hydrocracking and hydrodeoxigenation are composed of many different reactions. This makes it difficult, even more impractical, to follow every single compound and reaction involved in these chemical processes. In the beginning, as for every new reaction, the researchers tested various model compounds in hydrocracking conditions to obtain data for product yield distribution.

Continuous Kinetic Lumping Model for Pyrolysis Oil Hydrodeoxygenation
Filip Stankovikj Washington State University 6 of 25
5/1/2012
Based on this data different models for hydrocracking were proposed. Product distribution patterns. The first models proposed were in the 70’s, various discrete lumping models, where the complex feedstock was presented as a series of lumps (lumps for gasoline, diesel, LPG, tar) and for each of them, parallel reaction models were developed. It is obvious that the precision of these models depended on the number of lumps, and number of reactions describing the processes. Since every reaction carries with itself optimization parameters, increasing the number of lumps meant increasing the number of parameters to be found, which increased the complexity of the models, and in some cases computer algorithms can fail to estimate large number of parameters. Few other discrete models were develop, which lowered the number of parameters one have to deal with, but either limited the overall reaction kinetics to first order (Stangeland, 1974 – model using comminution of particles analogy for predicting the TBP curve), or skewed the product yield at higher reaction severities (Krishna and Saxena, 1989). However, many of these models are still used in describing hydrocracking reactions.
If discrete lumping approaches divided the feedstock and product mixtures into cuts
according to different ranges of boiling points, molecular weights, carbon number, etc., and presented them as a sum of subgroups of pseudocomponents, the continuous lumping model sees the reactive mixture as a continuous mixture i.e. continuous function of the same descriptors (molecular weight, TBP, reactivity, etc.). In other words, this concept considers the reaction mixture as composed of infinite number of components. This concept was first introduced by DeDoner in 1931, and then this idea found application in describing distillation, thermodynamics, polymerization, reactions in continuous mixtures, oligomerization reactions, chromatographic separation, coke formation, and in many other fields. Weekman used this approach first in 1979 to describe cracking of crude oil. Chou and Ho (1988) used this approach to describe parallel reactions of n-th order, and they showed that continuum lumping accurately estimates the overall order of reaction in complex mixtures, which is important prerequisite for precise design of reactors. Cicarelli (1992) introduced fragmentation and Langimuir-Hinselwood kinetics in lump modeling, where he assumed equal stoichiometric distribution of all compounds in the reaction. Later, McCoy and Wang developed a method where different stoichiometric distribution for the reactants can be used.
Mathematically the continuous lumping model is based on solving integrodifferential
equation that describes the mass balance equation in hydrocracking reactions within the reactors. Its advantage is that one needs to optimize less parameters than the discrete models in order to precisely describe the reactions. This will be shown in the section below.
4. Continuous kinetic lumping model – mathematical description
In this class project applicability of continuous kinetic lump modeling for hydrocracking of petroleum oil on modeling of hydrodeoxygenation of pyrolysis oil will be assessed. Pyrolysis mixture can be described by the true boiling point (TBP) and in this case we will accept first order kinetics for individual components in the pyrolysis oil. Any other type of kinetics can be easily adopted in the later stages of development of this model by simply changing the yield distribution function p(k,K). TBP as characterization parameter of the bio-oil continuously changes over the reaction time in the hydrotreater. TBP is a distribution function that represents the boiling temperature vs. cumulative weight fraction of the compounds in the mixture, and for

Continuous Kinetic Lumping Model for Pyrolysis Oil Hydrodeoxygenation
Filip Stankovikj Washington State University 7 of 25
5/1/2012
modeling purposes it is usually represented in as a function of dimensionless temperature � defined as:
� =��� − ���(�)
����ℎ�− ���(�) (1)
TBP(h) and TBP(l) represent the boiling points of the heavies and lightest component in
the mixture. Of course with the modeling we would like to describe the concentration distribution of the reaction mixture at any given residence time �. If we designate with (�, �) the concentration of species with boiling point � at time �, than (�, �) ∙ � will represent the concentration of a lump of species in the boiling range of � + �. This equals to the product of the concentration of a pseudo component i, ����, and �, the infinitesimal range of that component. The following equation gives the link between the continuous and discrete lumping, and here it is assumed that i’s are equally spaced along the i-species axis:
���� ∙ � = (�, �) ∙ � (2)
We can make one more change in coordinates which gives us significant advantage on
the further development of the hydrotreating model. Namely, every species in the mixture is strictly defined (described) by its normalized temperature �, and to each of these species in the mixture certain reaction rate constant can be attached ki. This means that now from the TBP curve we can obtain a relation between the concentration of the species and their reactivity �( , �). This change from one coordinate system and the other based on �( , �) is give with the equation below:
��, �� ∙ � = �( , �) ∙ �( ) ∙ (3)
�( ) is called species-type distribution function. �( ) ∙ is the number of species with reactivity between and + . The distribution character of the right-hand side of the equation above is transferred to �( ), where �( , �) remains concentration of component i with reactivity k. �( ) can be viewed as Jacobian and it is defined as:
�� � = � =
�� ∙
� (4)
For hydrocracking, the dependence k vs. � is assumed to obey a power law (� is a model
parameter):
��� = ��/� (5)
However, for hydrodeoxygenation this function might have to get different shape since
the assumption that the reaction rate k=0 when �=0 does not hold i.e. the species with the lowest boiling point �=0 takes part in the hydrogenation reactions (k>0). We may use model compound to obtain more precise relationship for the k vs. � dependence.

Continuous Kinetic Lumping Model for Pyrolysis Oil Hydrodeoxygenation
Filip Stankovikj Washington State University 8 of 25
5/1/2012
If we differentiate equation (5) and supplement it in equation (4) we will obtain equation (6). Have in mind that �/� = � when � → ∞ (N stands for number of species in the mixture)
�� � = � ∙ � ���� ∙ ��� (6)
When you integrate the function above in the limits from = 0 to ���, you will obtain
that she species-type distribution function satisfies the following criteria:
1
� ∙� �� � ∙ ����
= 1 (7)
Material balance for the species with reactivity k can be defined with:
�� , ��
� = − ∙ �� , �� +� �� ,�� ∙ � ∙ ���, �� ∙ �� � ∙ �����
� (8)
�� ,�� is yield distribution function and it represents the amount of formation of species with reactivity k from species with reactivity K. This function for hydrocracking of petroleum products was adopted to have skewed Gaussian distribution and is given by the equation (9). I will check the compatibility of this function with modeling of hydrodeoxygenation of pyrolysis oil.
�� ,�� = 1
� ∙ √2 ∙ � ∙
������e
���� ����.���� ��
− � + ������� (9)
Where
� = ���.��� �� (10)
is obtained when �� ,�� = 0 at = �.
� = ∙ !1 − �" (11)
When = 0
�� ,�� = � ∙ √2 ∙ � (12)
Parameters in this model #, #�, are tuning parameters for this model and depend on
the catalyst type, activity, and impurities present in the feed. The �� ,�� function can be obtained from experimental data and for hydrocracking it should have the following properties:

Continuous Kinetic Lumping Model for Pyrolysis Oil Hydrodeoxygenation
Filip Stankovikj Washington State University 9 of 25
5/1/2012
1) �� ,�� = 0 for = � since species with reactivity k cannot be transformed into the “same” kind of species under hydrocracking conditions.
2) The �� ,�� function should satisfy material balance:
� �� ,�� ∙ �� � ∙ = 1 (13)
3) �� ,�� should be non-zero at k=0. 4) �� ,�� should always have a positive value.
5. Matlab implementation
The process of solving the mass balance equation (8) is iterative and goes through couple of loops. Final product of this algorithm are the optimal model parameters, and the starting point are TBP for the feed and for the product from a batch hydrocracking reactor. TBP of the feed and the product can be obtained by ASTM 5307. Fast and sufficiently precise determination of TBP can be done by ASTM D2887. This method uses traditional GC/MS instrument with a specific (shorter) column and few standard alkanes in order to obtain simulated distillation curve. However, the algorithm is presented in the following figure and the explanation of the steps follows:
First step will be to read the TBP (wt.% vs. boiling temperature °C) of the bio-oil fed into
the reactor (at residence time t=0) and the TBP at after the reaction (at final residence time tmax).

Continuous Kinetic Lumping Model for Pyrolysis Oil Hydrodeoxygenation
Filip Stankovikj Washington State University 10 of 25
5/1/2012
Next using equation (1) this curve is transformed in dimensionless units ((wt.% vs. boiling temperature �):
�� = ���� − ���(�)����ℎ� − ���(�) (14)
A caution here: TBP(h) of the component with highest boiling point is much higher than
the limit of the ASTM D2887 method 538°C, so this temperature should be carefully guessed/estimated in such a way that it is close to the final boiling point of the heaviest compound in the bio-oil mixture, and it accurately reproduces the experimental distillation curve obtained for the entire range of distillation. TBP(l) as well includes the gasses in the feed such as CH4, C2H6, etc.
Next ,set the number of compounds for the calculation N>40, and obtain the values for ��
for the feed and product for those N points. Calculate the values for $��% for all N points by linear interpolation between the points obtained by simulated distillation. After we start the loops for optimizing the parameters, we need to make a guess for the values of the five parameters: �, #, #�, , and ���.
Next step, use equation (5) to obtain the rate of reaction for each of the N points (k vs. � plot):
� = ��� ∙ �� �/� (15)
In order to solve integrodifferential equation (8), we have to calculate the concentration
of species at any time of reaction t, �� , ��. If we suppose linear dependence, which is reasonable if our domain is represented with many points N>40, than we can make a linear interpolation for �� , �� at � ≤ ≤ ��� and for any residence time t, and represent it with a first degree Lagrange polynomial:
�� , �� = ! − � ��� − �" ∙ �� ���, �� + ! − ��� � − ���" ∙ �� �, �� (16)
For the initial time t=0 i.e. for the bio-oil feed we get:
�� , 0� = ! − � ��� − �" ∙ �� ���, 0� + ! − ��� � − ���" ∙ �� �, 0� (17)

Continuous Kinetic Lumping Model for Pyrolysis Oil Hydrodeoxygenation
Filip Stankovikj Washington State University 11 of 25
5/1/2012
The weight fraction of any species with reactivities between � ≤ ≤ ��� can be
calculated:
$�� = � �� , 0� ∙ �� � ∙ ������ (18)
If we substitute (17) in (18):
$�� = �� ���, 0�� ! − � ��� − �" ∙ �� � ∙ ������ + �� �, 0�
∙� ! − ��� � − ���" ∙ �� � ∙ ������ ∙
(19)
Or abbreviated:
$�� = �� �, 0� ∙ #�� + �� ���, 0� ∙ #�� (20)
#�� =1
� − ��� ∙� ∙ � ���� %& ������
� + 1− ������� ' − & ����� + 1
− ��� ��� '( (21)
#�� =1
��� − � ∙� ∙ � ���� %& ������
� + 1− � ����
� ' − & ����� + 1− ����� '( (22)
At t=0 equation (20) becomes:
$���0� = �� � ∙ �� �, 0� (23)
$���0� = )$�$�$� … $�*� (24)
Continuous Kinetic Lumping Model for Pyrolysis Oil Hydrodeoxygenation
Filip Stankovikj Washington State University 12 of 25
5/1/2012
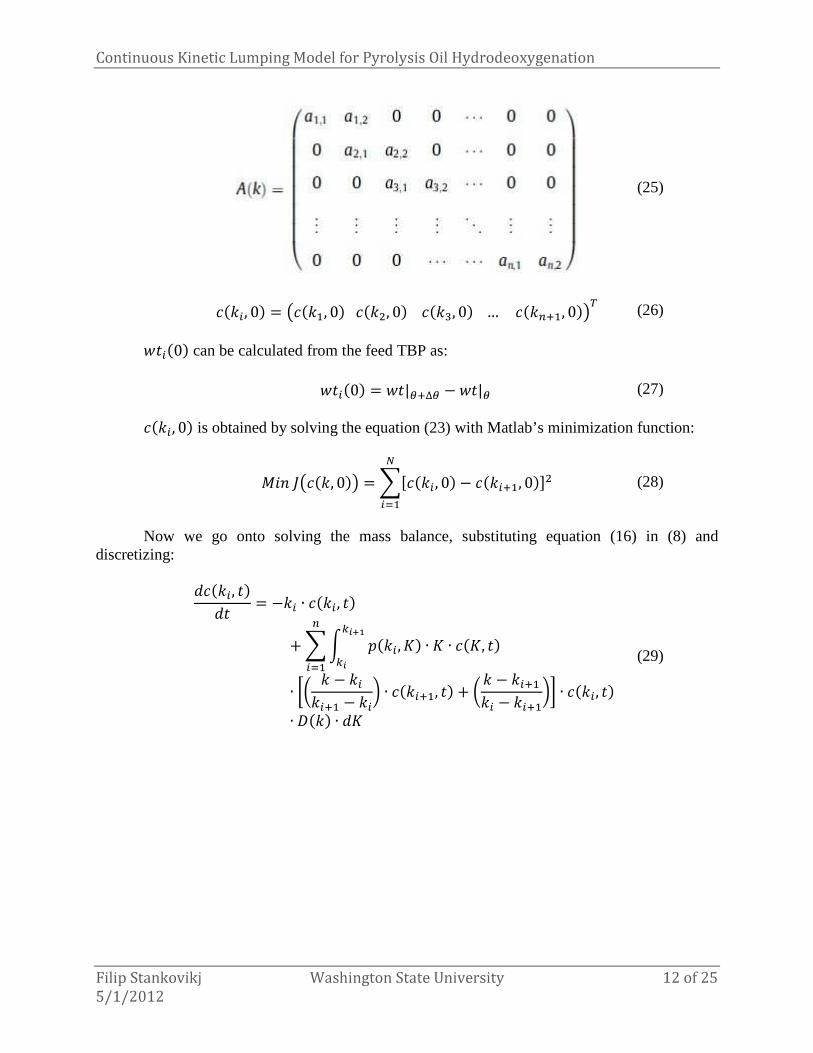
(25)
�� �, 0� = +�� �, 0��� �, 0��� �, 0�… �� ���, 0�,� (26)
$���0� can be calculated from the feed TBP as:
$���0� = $�|��∆� −$�|� (27) �� �, 0� is obtained by solving the equation (23) with Matlab’s minimization function:
-�./+�� , 0�, = 0)�� �, 0� − �� ���, 0�*����� (28)
Now we go onto solving the mass balance, substituting equation (16) in (8) and
discretizing:
�� �, ��� = − � ∙ �� �, ��+0� �� �,�� ∙ � ∙ ���, ������
������
∙ 1! − � ��� − �" ∙ �� ���, �� + ! − ��� � − ���"2 ∙ �� �, �� ∙ �� � ∙ �
(29)
Continuous Kinetic Lumping Model for Pyrolysis Oil Hydrodeoxygenation
Filip Stankovikj Washington State University 13 of 25
5/1/2012
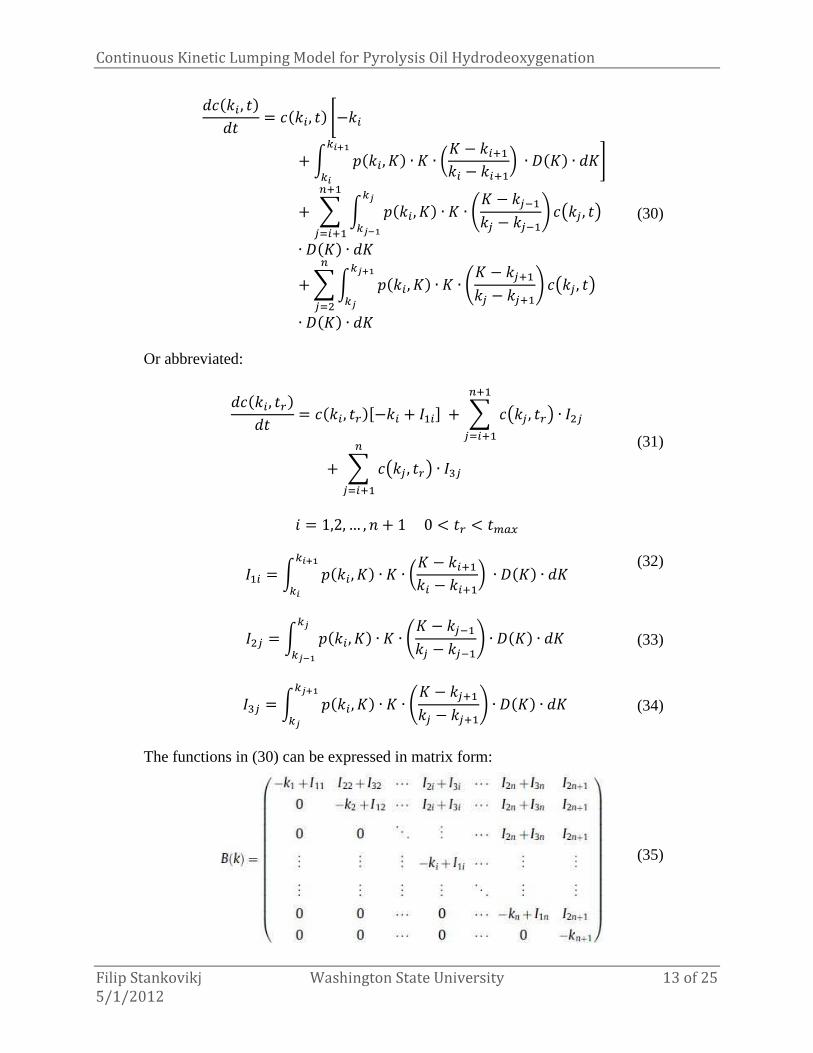
�� � , ��� = �� �, �� %− �+� �� �,�� ∙ � ∙ !� − ��� � − ���" ∙ ���� ∙ �
������ (
+ 0 � �� �,�� ∙ � ∙ &� − ��� � − ���' �+ � , �,���
��������
∙ ���� ∙ �+0� �� �,�� ∙ � ∙ &� − ��� � − ���' �+ � , �,
����
����
∙ ���� ∙ �
(30)
Or abbreviated:
�� �, ���� = �� �, ���)− � + 3��* + 0 �+ � , ��, ∙ 3����������
+ 0 �+ � , ��, ∙ 3���
�����
(31)
� = 1,2, … , . + 10 < �� < ����
3�� = � �� �,�� ∙ � ∙ !� − ��� � − ���" ∙ ���� ∙ �������
(32)
3�� = � �� �,�� ∙ � ∙ &� − ��� � − ���' ∙ ���� ∙ ���� (33)
3�� = � �� �,�� ∙ � ∙ &� − ��� � − ���' ∙ ���� ∙ ����
� (34)
The functions in (30) can be expressed in matrix form:
(35)

Continuous Kinetic Lumping Model for Pyrolysis Oil Hydrodeoxygenation
Filip Stankovikj Washington State University 14 of 25
5/1/2012
Matrix �( ) can be calculated by knowing the values of the assumed five parameters. In
order to solve (31) one should start from the compound with highest reactivity ��� and then (31) for ��� will be:
� �� ���, ��� = − ��� ∙ �� ���, ��� (36)
�� ���, ��� = �� ���, ����� ∙ exp�− ��� ∙ ��� (37)
0 ≤ ���� < �� ≤ ����
For the first calculation ���� = 0:
�� ���, ��� = �� ���, 0� (38) The compound with lower reactivity � is solved as:
� �� �, ��� = )− ��� + 3��* ∙ �� �, ���+ 3�� ∙ �� ���, ��� (39)
Again this equation can be solved like (36) as initial value problem:
�� �, ��� = �� � , ����� (40) This procedure goes on until the lightest component in the mixture is obtained. After that
we will have the �� , �� curve at time t. This is the starting point for solving the same equations, but now for higher residence times t.
$����� = �� � ∙ �� �, �� (41)
The objective function that needs to be minimized is the sum of squares of the differences
of the predicted and experimental cumulative weight fractions of products:
/+$�����, = 04$�����|� −$���� !|� 5����� (42)
At the end the following condition has to be checked whether it is satisfied.
0$������ = 1 (43)

Continuous Kinetic Lumping Model for Pyrolysis Oil Hydrodeoxygenation
Filip Stankovikj Washington State University 15 of 25
5/1/2012
6. Results and discussion
TBPs of the starting feedstock (input in the model) and the hydrocracked product are tabulated below.
One may see that the distillation curves are using ASTM D2887 method can be obtained
up until 538°C, so in order to get the distillation curve for the whole bio-oil, including the heavy lignin oligomers, I have made linear extrapolation of the given data. The linear extrapolation was done in such a way that the cumulative weight fraction adds up to one. In this way one can obtain the component in the mixture with highest boiling point and normalize the boiling curve using equation (14). The boiling curves are represented on the figures below.
Figure 2. Distillation curve of the feedstock

Continuous Kinetic Lumping Model for Pyrolysis Oil Hydrodeoxygenation
Filip Stankovikj Washington State University 16 of 25
5/1/2012
Figure 3. Normalized distillation curve of the feedstock
Next step is solving constrained minimization problem given by equation (28). It can be
seen that the Matlab algorithm although having constraints about the concentration values �� �, 0� > 0, for some of the points it gave values �� �, 0� < 0. This could not be solved by increasing the number of points, and my suggestion is using generic algorithm to solve this issue.
Figure 4. Concentration of the component with reactivity k at the reference time t=0

Continuous Kinetic Lumping Model for Pyrolysis Oil Hydrodeoxygenation
Filip Stankovikj Washington State University 17 of 25
5/1/2012
Although the concentration curve showed a lot of noise, the yield distribution function (12) matched with the distributions reported in the literature. As well, the mass balance equations (7) and (13) were satisfied.
Figure 5. Yield distribution function
In conclusion the results obtained by this project seem promising, however there many
glitches to be fixed, especially about the ODE solver part of the code in the next refinement steps.
The future work will involve working of solving of the systems of ordinary differential equations, calculation of the concentration curve for the products, and henceforth, calculation of the cumulative weight distribution of the hydrocracking product, comparing this results with data in the referenced literature and finally validating this model with mildly hydrotreated pyrolysis oil. The programing scripts with elaborate comments are given in the Appendix section of this work.

Continuous Kinetic Lumping Model for Pyrolysis Oil Hydrodeoxygenation
Filip Stankovikj Washington State University 18 of 25
5/1/2012
7. References
[1] R. J. M. Westerhof et al., “Fractional Condensation of Biomass Pyrolysis Vapors,” Energy & Fuels, vol. 25, no. 4, pp. 1817-1829, Apr. 2011.
[2] M. Garcia-perez, A. Chaala, H. Pakdel, D. Kretschmer, and C. Roy, “Characterization of bio-oils in chemical families National Bureau of Standards,” Biomass and Bioenergy, vol. 31, pp. 222-242, 2007.
[3] Karl F. Knopf. “Modeling, analysis and optimization of process and energy systems.” John Willey and Sons. 2012
[4] Warren L. McCabe, Julian C. Smith, Peter Harriott. “Unit operations of chemical engineering-7th ed.” McGraw-Hill. 2005
[5] Ignacio Elizalde, Jorge Ancheyta. “On the detailed solution and application of the continuous kinetic lumping modeling to hydrocracking of heavy oils.” Fuel 90, 3542-3550, 2007
[6] C.S. Laxminarasimhan, R.P. Verma, “Continuous Lumping Model for Simulation of Hydrocracking.” AIChE Journal, Vol.42, No.9, Sep.1996
[7] J. Govindhakannan, J.B. Riggs, “On the Construction of a Continuous Concentration – Reactivity Function for the Continuum Lumping Approach.” Ind. Eng. Chem. Res., 46, 1653-1656, 2007
[8] Ignacio Elizalde, Jorge Ancheyta, “Modeling the Simultaneous Hydrodesulfurization and Hydrocracking of Heavy Residue Oil by Using the Continuous Kinetic Lumping Approach.”, Energy Fuels, 3, 1999-2004, 2012
[9] M. Sau, K. Basak, U. Manna, M. Santra, R.P. Verma, “Effects of organic nitrogen compounds on hydrotreating and hydrocracking reactions.”, Catalysis Today, 109, 112-119, 2005

Continuous Kinetic Lumping Model for Pyrolysis Oil Hydrodeoxygenation
Filip Stankovikj Washington State University 19 of 25
5/1/2012
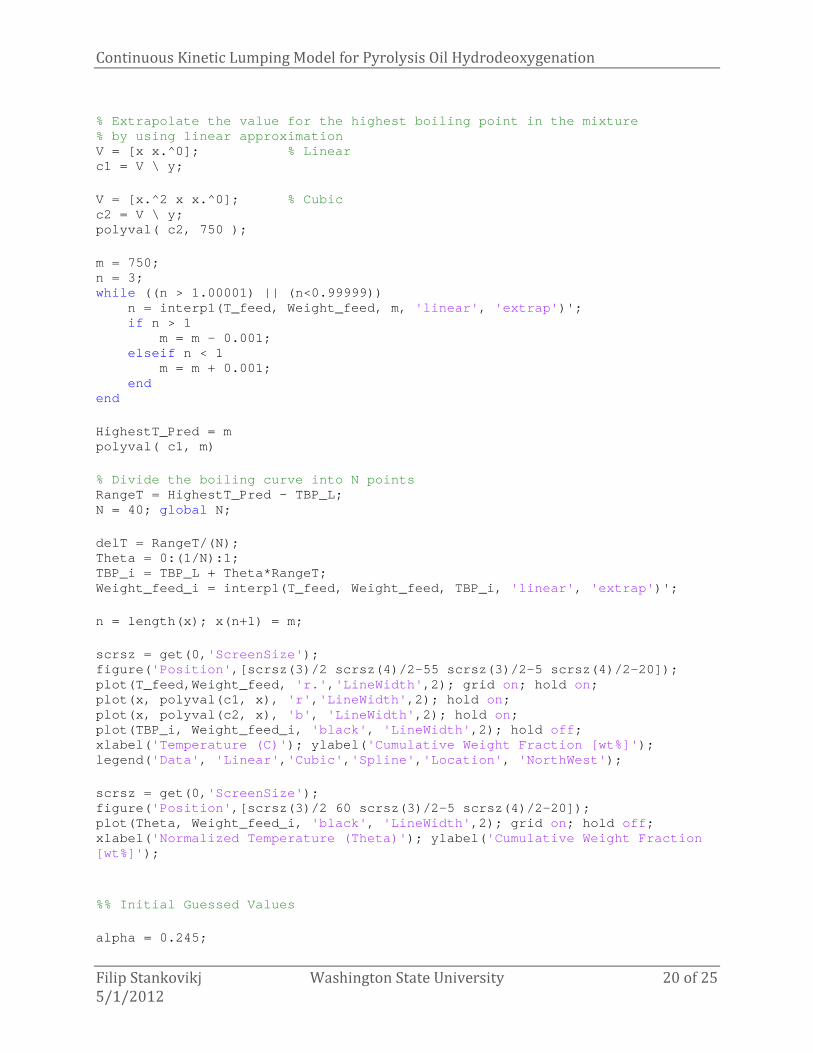
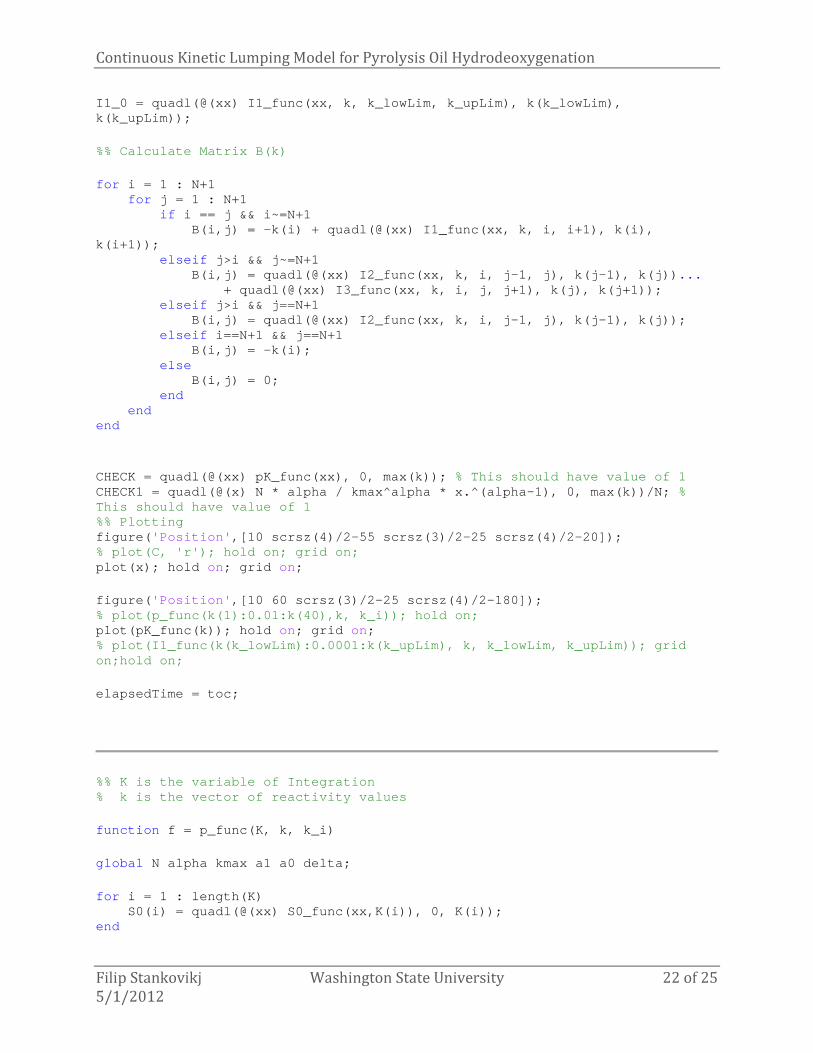
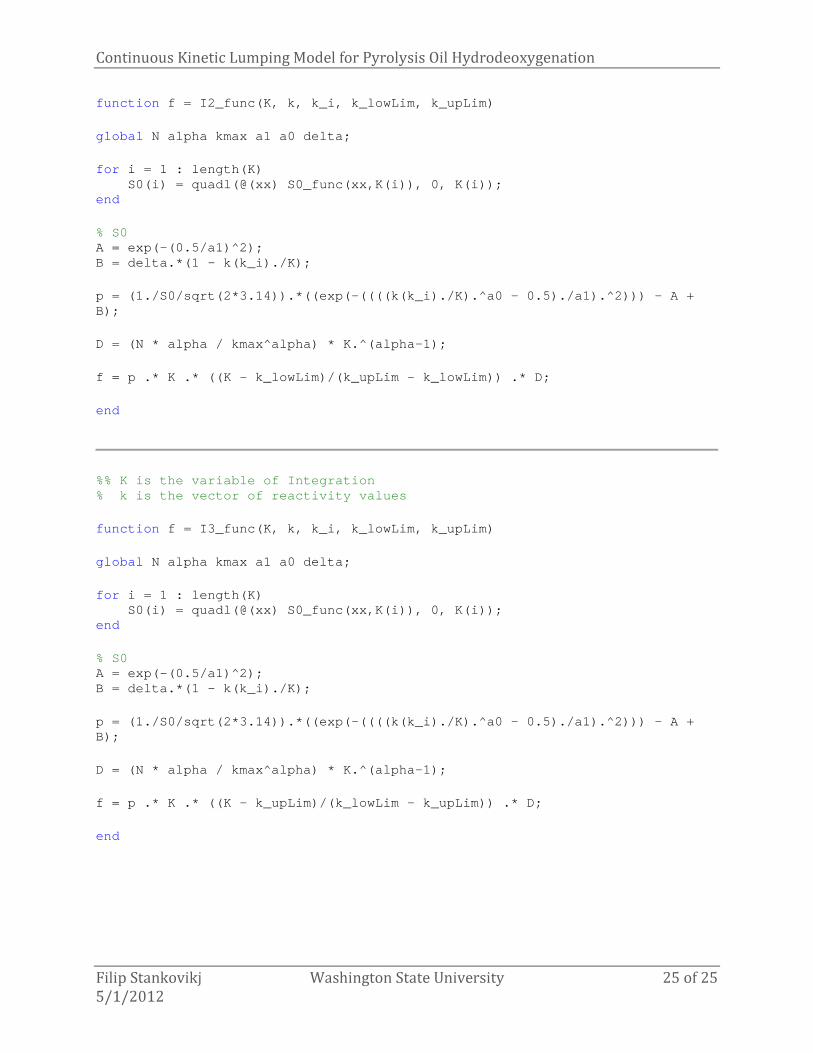
8. Appendix (Matlab code)
% Read Excel data into Matlab clear all ; close all ; clc; tic; %% Read TBP data and define Variables excelDirectory = 'D:\WSU School\BSYSE 595 Biosystems Engineering for Fuel and Chemicals\Class Project' ; cd (excelDirectory); excelFileName = 'Tdata.xlsx' ; [type, sheets] = xlsfinfo(char(excelFileName)); excelData = xlsread(char(excelFileName), char(sheet s(1)), 'B4:G24' ); clear type sheets excelFileName excelDirectory ; T_feed = excelData(:,1); T_feed(isnan(T_feed )) = []; %Remove any rows of matrix X containing NaNs Weight_feed = excelData(:,2); Weight_feed(isnan(W eight_feed)) = []; Theta_feed = excelData(:,3); Theta_feed(isnan(Th eta_feed)) = []; T_product = excelData(:,4); T_product(isnan(T_p roduct)) = []; Weight_product = excelData(:,5); Weight_product( isnan(Weight_product)) = []; Theta_product = excelData(:,6); Theta_product(i snan(Theta_product)) = []; system( 'taskkill /F /IM EXCEL.EXE' ); %% Initialize algorithm % Determine the highest boiling point by extrapolat ion TBP_L = min(T_feed); TBP_H = max(T_feed); RangeT = TBP_H - TBP_L; % Prepare vectors T_feed and Weight_feed for extrap olation by removing % zero values for the cumulative weight fraction x = T_feed; y = Weight_feed; n = length(y); i = 1; while n > i if y(i) == 0 y(i) = []; x(i) = []; i = i; else i = i + 1; end n = numel(y); end
Continuous Kinetic Lumping Model for Pyrolysis Oil Hydrodeoxygenation
Filip Stankovikj Washington State University 20 of 25
5/1/2012
% Extrapolate the value for the highest boiling poi nt in the mixture % by using linear approximation V = [x x.^0]; % Linear c1 = V \ y; V = [x.^2 x x.^0]; % Cubic c2 = V \ y; polyval( c2, 750 ); m = 750; n = 3; while ((n > 1.00001) || (n<0.99999)) n = interp1(T_feed, Weight_feed, m, 'linear' , 'extrap' )'; if n > 1 m = m - 0.001; elseif n < 1 m = m + 0.001; end end HighestT_Pred = m polyval( c1, m) % Divide the boiling curve into N points RangeT = HighestT_Pred - TBP_L; N = 40; global N; delT = RangeT/(N); Theta = 0:(1/N):1; TBP_i = TBP_L + Theta*RangeT; Weight_feed_i = interp1(T_feed, Weight_feed, TBP_i, 'linear' , 'extrap' )'; n = length(x); x(n+1) = m; scrsz = get(0, 'ScreenSize' ); figure( 'Position' ,[scrsz(3)/2 scrsz(4)/2-55 scrsz(3)/2-5 scrsz(4)/2- 20]); plot(T_feed,Weight_feed, 'r.' , 'LineWidth' ,2); grid on; hold on; plot(x, polyval(c1, x), 'r' , 'LineWidth' ,2); hold on; plot(x, polyval(c2, x), 'b' , 'LineWidth' ,2); hold on; plot(TBP_i, Weight_feed_i, 'black' , 'LineWidth' ,2); hold off ; xlabel( 'Temperature (C)' ); ylabel( 'Cumulative Weight Fraction [wt%]' ); legend( 'Data' , 'Linear' , 'Cubic' , 'Spline' , 'Location' , 'NorthWest' ); scrsz = get(0, 'ScreenSize' ); figure( 'Position' ,[scrsz(3)/2 60 scrsz(3)/2-5 scrsz(4)/2-20]); plot(Theta, Weight_feed_i, 'black' , 'LineWidth' ,2); grid on; hold off ; xlabel( 'Normalized Temperature (Theta)' ); ylabel( 'Cumulative Weight Fraction [wt%]' ); %% Initial Guessed Values alpha = 0.245;

Continuous Kinetic Lumping Model for Pyrolysis Oil Hydrodeoxygenation
Filip Stankovikj Washington State University 21 of 25
5/1/2012
a0 = 1.396; a1 = 22; delta = 4.46 * 10^-5; kmax = 0.537; global alpha a0 a1 delta kmax; %% Start Levenverg-Marquardt Algorithm % Calculate reactivity of species k_i k = kmax .* Theta .^(1/alpha); % global k; % Calculate Weight Fraction for i = 1 : N wt(i) = Weight_feed_i(i+1) - Weight_feed_i(i); end wt = wt'; for i = 1 : N A(i,i) = 1/(k(i)-k(i+1)) * (N*alpha/kmax^alpha) *( (k(i+1)^(alpha+1)/(alpha+1) - k(i+1)^(alpha+1)/(alp ha)) - (k(i)^(alpha+1)/(alpha+1) - k(i+1)*k(i)^alpha/alpha ) ); A(i,i+1) = 1/(k(i+1)-k(i)) * (N*alpha/kmax^alph a) *( (k(i+1)^(alpha+1)/(alpha+1) - k(i)*k(i+1)^(alpha)/( alpha)) - (k(i)^(alpha+1)/(alpha+1) - k(i)^(alpha+1)/alpha) ) ; end % A = A'; Weight_feed_i(N+1) = []; c(:,1) = (A \ Weight_feed_i); C = (wt\A)'; % Constrained minimization to find concetration dis tribution c(x,0) % [x,fval,exitflag,output] = fmincon(fun,x0,A,b,Aeq ,beq,lb,ub); x0 (1:N+1)= 0; [x] = fmincon( 'MinC' ,x0,[],[],A,wt,0,inf); D = N * alpha / kmax^alpha * k.^(alpha-1); % [q,fcnt] = quadl(fun,a,b,tol) K = k(40); % global K; % Numerical Integration [S0] = quadl(@(xx) S0_func(xx,K), 0, K); % global S0; fprintf( Check the output from here.\n' ) k_i = 17; k_lowLim = 5; k_upLim = 7; [P0] = quadl(@(xx) p_func(xx,k, k_i), k(k_i), k(k_i +2));
Continuous Kinetic Lumping Model for Pyrolysis Oil Hydrodeoxygenation
Filip Stankovikj Washington State University 22 of 25
5/1/2012
I1_0 = quadl(@(xx) I1_func(xx, k, k_lowLim, k_upLim ), k(k_lowLim), k(k_upLim)); %% Calculate Matrix B(k) for i = 1 : N+1 for j = 1 : N+1 if i == j && i~=N+1 B(i,j) = -k(i) + quadl(@(xx) I1_func(xx , k, i, i+1), k(i), k(i+1)); elseif j>i && j~=N+1 B(i,j) = quadl(@(xx) I2_func(xx, k, i, j-1, j), k(j-1), k(j)) ... + quadl(@(xx) I3_func(xx, k, i, j, j+1), k(j), k(j+1)); elseif j>i && j==N+1 B(i,j) = quadl(@(xx) I2_func(xx, k, i, j-1, j), k(j-1), k(j)); elseif i==N+1 && j==N+1 B(i,j) = -k(i); else B(i,j) = 0; end end end CHECK = quadl(@(xx) pK_func(xx), 0, max(k)); % This should have value of 1 CHECK1 = quadl(@(x) N * alpha / kmax^alpha * x.^(al pha-1), 0, max(k))/N; % This should have value of 1 %% Plotting figure( 'Position' ,[10 scrsz(4)/2-55 scrsz(3)/2-25 scrsz(4)/2-20]); % plot(C, 'r'); hold on; grid on; plot(x); hold on; grid on; figure( 'Position' ,[10 60 scrsz(3)/2-25 scrsz(4)/2-180]); % plot(p_func(k(1):0.01:k(40),k, k_i)); hold on; plot(pK_func(k)); hold on; grid on; % plot(I1_func(k(k_lowLim):0.0001:k(k_upLim), k, k_ lowLim, k_upLim)); grid on;hold on; elapsedTime = toc;
%% K is the variable of Integration % k is the vector of reactivity values function f = p_func(K, k, k_i) global N alpha kmax a1 a0 delta; for i = 1 : length(K) S0(i) = quadl(@(xx) S0_func(xx,K(i)), 0, K(i)); end

Continuous Kinetic Lumping Model for Pyrolysis Oil Hydrodeoxygenation
Filip Stankovikj Washington State University 23 of 25
5/1/2012
% S0 A = exp(-(0.5/a1)^2); B = delta.*(1 - k(k_i)./K); p = (1./S0./sqrt(2*3.14)).*((exp(-((((k(k_i)./K).^a 0 - 0.5)./a1).^2))) - A + B); f = p; end
%% K is the max K % k is the vector of reactivity values function f = pK_func(k) global N alpha kmax a1 a0 delta; D = (N * alpha / kmax^alpha) * k.^(alpha-1); K = max(k); S0 = quadl(@(xx) S0_func(xx,K), 0, K); A = exp(-((0.5/a1)^2)); B = delta.*(1 - k./K); p = (1./S0./sqrt(2*3.14)).*((exp(-((((k./K).^a0 - 0 .5)./a1).^2))) - A + B); % f = p .* D; f = p; end
%% k is the variable of Integration % K is a fixed number for a reativity value function f = S0_func(k,K) global N alpha kmax a1 a0 delta; D = (N * alpha / kmax^alpha) * k.^(alpha-1); A = exp(-((0.5/a1)^2)); B = delta*(1 - k./K); S = 1/sqrt(2*3.14) * ((exp(-((((k./K).^a0-0.5)./a1) .^2))) - A + B); S = S .* D; f = S; end

Continuous Kinetic Lumping Model for Pyrolysis Oil Hydrodeoxygenation
Filip Stankovikj Washington State University 24 of 25
5/1/2012
%% k is the variable of Integration % K is a fixed number for a reativity value function f = S0_func(k,K) global N alpha kmax a1 a0 delta; D = (N * alpha / kmax^alpha) * k.^(alpha-1); A = exp(-((0.5/a1)^2)); B = delta*(1 - k./K); S = 1/sqrt(2*3.14) * ((exp(-((((k./K).^a0-0.5)./a1) .^2))) - A + B); S = S .* D; f = S; end
%% K is the variable of Integration % k is the vector of reactivity values function f = I1_func(K, k, k_lowLim, k_upLim) global N alpha kmax a1 a0 delta; for i = 1 : length(K) S0(i) = quadl(@(xx) S0_func(xx,K(i)), 0, K(i)); end % S0 A = exp(-(0.5/a1)^2); B = delta.*(1 - k(k_lowLim)./K); p = (1./S0/sqrt(2*3.14)).*((exp(-((((k(k_lowLim)./K ).^a0 - 0.5)./a1).^2))) - A + B); D = (N * alpha / kmax^alpha) * K.^(alpha-1); f = p .* K .* ((K - k_upLim)/(k_lowLim - k_upLim)) .* D; end
%% K is the variable of Integration % k is the vector of reactivity values
Continuous Kinetic Lumping Model for Pyrolysis Oil Hydrodeoxygenation
Filip Stankovikj Washington State University 25 of 25
5/1/2012
function f = I2_func(K, k, k_i, k_lowLim, k_upLim) global N alpha kmax a1 a0 delta; for i = 1 : length(K) S0(i) = quadl(@(xx) S0_func(xx,K(i)), 0, K(i)); end % S0 A = exp(-(0.5/a1)^2); B = delta.*(1 - k(k_i)./K); p = (1./S0/sqrt(2*3.14)).*((exp(-((((k(k_i)./K).^a0 - 0.5)./a1).^2))) - A + B); D = (N * alpha / kmax^alpha) * K.^(alpha-1); f = p .* K .* ((K - k_lowLim)/(k_upLim - k_lowLim)) .* D; end
%% K is the variable of Integration % k is the vector of reactivity values function f = I3_func(K, k, k_i, k_lowLim, k_upLim) global N alpha kmax a1 a0 delta; for i = 1 : length(K) S0(i) = quadl(@(xx) S0_func(xx,K(i)), 0, K(i)); end % S0 A = exp(-(0.5/a1)^2); B = delta.*(1 - k(k_i)./K); p = (1./S0/sqrt(2*3.14)).*((exp(-((((k(k_i)./K).^a0 - 0.5)./a1).^2))) - A + B); D = (N * alpha / kmax^alpha) * K.^(alpha-1); f = p .* K .* ((K - k_upLim)/(k_lowLim - k_upLim)) .* D; end