title here (times new roman 42pt) - global … · loan-loss provisioning dr james cummings lecturer...
TRANSCRIPT

Loan-loss provisioning
Dr James Cummings
Lecturer
Faculty of Business and Economics
Macquarie University
June 2015

2 | © 2012 Global Association of Risk Professionals. All rights reserved.
Objectives
Forward-looking provisioning model
Evaluate the expected loss approach advocated by BCBS under Basel III
Examine the responsiveness of these provisions to credit risk
Role of regulatory provisioning in supporting capital requirements
Relationship with risk-based capital under the Basel rules
Explore the extent to which banks use provisioning for risk management
Basel II: Different rules for IRB banks
Direct linkage between provisioning and expected losses derived from a bank’s CRM
Test whether increased the incentives to use provisions for risk management

3 | © 2012 Global Association of Risk Professionals. All rights reserved.
Bank Discretionary Behaviour
Role of provisions in absorbing expected future credit losses
Provisioning varies with the business cycle (Bikker and Metzemakers, 2005)
Test the extent regulatory provisions reflect both problem loans and overall asset quality
Bank managers take account of capital adequacy and earnings
Capital management (Kim and Kross, 1998; Ahmed et al, 1999)
Income smoothing (Shrieves and Dahl, 2003; Hess et al, 2007)
Counter-cyclical explanation
Credit risk sown in a boom and materialises in a downturn (Bouvatier and Lepetit, 2008)
Test whether surplus regulatory capital and earnings used to cover future credit losses

4 | © 2012 Global Association of Risk Professionals. All rights reserved.
APRA’s Provisioning Model
Specific provisions
Credit losses expected in the short term (within 12-18 months)
Relevant factors clearly defined in the credit quality standard (APS 220)
General reserve for credit losses (GRCL)
Credit losses expected but not certain to arise over the full life of all the bank’s loans
Factors less clearly defined; requires subjective judgements

5 | © 2012 Global Association of Risk Professionals. All rights reserved.
Treatment of Provisions
Basel I banks and Basel II standardised banks
Impact on:
Tier 1 capital ratio
Numerator
Denominator
Net impact
Total capital ratio
Numerator
Denominator
Net impact
Basel II IRB banks
Impact on:
Tier 1 capital ratio
Numerator
Denominator
Net impact
Total capital ratio
Numerator
Denominator
Net impact
No impact on RWA
None (when in shortfall)
Shortfall
No impact on RWA
Total capital ratio
Retained earnings
Shortfall
No impact on RWA
Total capital ratio
Retained earnings
Shortfall (50%)
No impact on RWA
Tier 1 capital ratio
Retained earnings
Shortfall
Surplus (max 0.6% RWAC)
No impact on RWA
None
Shortfall (50%)
No impact on RWA
Step 2: EP non-defaulted
Impact of a one dollar increase in: Impact of a one dollar increase in:
Step 1: EL defaulted Step 2: EP defaulted
Tier 1 capital ratio
Retained earnings
Tier 1 capital ratio
Shortfall
Step 1: EL non-defaulted
No impact on RWA
Tier 1 capital ratio
Retained earnings
Shortfall (50%)
No impact on RWA
Tier 1 capital ratio
Shortfall (50%)
Impact of a one dollar increase in: Impact of a one dollar increase in:
RWA
Total capital ratio
No impact on RWA
None
Specific provisions GRCL
Retained earnings
No impact on RWA
Tier 1 capital ratio
Retained earnings
GRCL (max 1.25% RWA)
Retained earnings
RWA
6 | © 2012 Global Association of Risk Professionals. All rights reserved.
Data and Sample
22 banks, March 2004 to December 2012
Total loans, non-performing loans, provisions and earnings from APRA
Capital base and risk-weighted assets from APRA
Domestic and foreign subsidiary banks
Excludes banks with tier 1 capital ratios before provisions greater than 30%
Excludes building societies and credit unions
Basel II implemented in Australia from 1 January 2008
5 internal ratings-based banks
AIRB: ANZ Bank, Commonwealth Bank, NAB, Westpac; FIRB: Macquarie Bank
7 | © 2012 Global Association of Risk Professionals. All rights reserved.
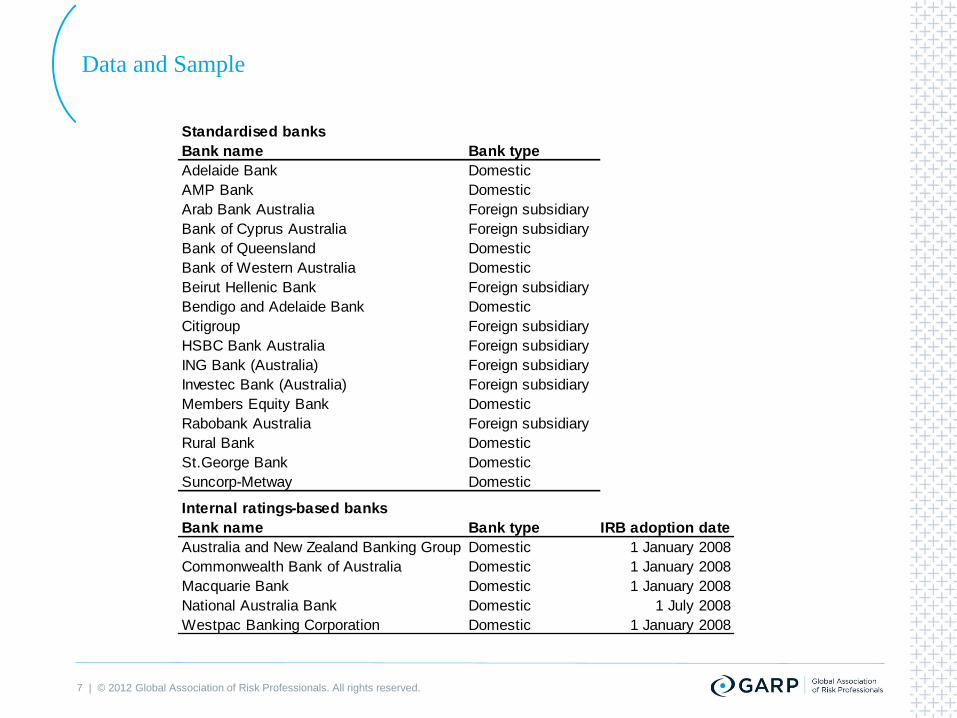
Data and Sample
Standardised banks
Bank name Bank type
Adelaide Bank Domestic
AMP Bank Domestic
Arab Bank Australia Foreign subsidiary
Bank of Cyprus Australia Foreign subsidiary
Bank of Queensland Domestic
Bank of Western Australia Domestic
Beirut Hellenic Bank Foreign subsidiary
Bendigo and Adelaide Bank Domestic
Citigroup Foreign subsidiary
HSBC Bank Australia Foreign subsidiary
ING Bank (Australia) Foreign subsidiary
Investec Bank (Australia) Foreign subsidiary
Members Equity Bank Domestic
Rabobank Australia Foreign subsidiary
Rural Bank Domestic
St.George Bank Domestic
Suncorp-Metway Domestic
Internal ratings-based banks
Bank name Bank type IRB adoption date
Australia and New Zealand Banking Group Domestic 1 January 2008
Commonwealth Bank of Australia Domestic 1 January 2008
Macquarie Bank Domestic 1 January 2008
National Australia Bank Domestic 1 July 2008
Westpac Banking Corporation Domestic 1 January 2008

8 | © 2012 Global Association of Risk Professionals. All rights reserved.
Descriptive Statistics
All banks, N=744
Data item Mean
Standard
deviation
Lower
quartile Median
Upper
quartile
Total loans $mil 62,327 102,602 3,375 12,953 48,581
Loans to households % 57.6 29.2 43.3 63.0 76.9
Loans to corporates % 42.0 29.1 21.7 36.7 55.3
Loans to other % 0.4 0.8 0.0 0.0 0.5
Non-performing loans % 2.00 2.64 0.61 1.06 2.10
RWA for credit risk % 95.3 46.7 70.4 86.7 103.2
Deposits % 19.8 14.7 8.8 18.9 28.7
Specific provisions % 0.38 0.53 0.06 0.17 0.47
GRCL % 0.57 0.35 0.33 0.52 0.78
Total provisions % 0.95 0.75 0.47 0.76 1.18
Tier 1 capital ratio 11.0 4.0 8.3 9.9 12.3
Total capital ratio 13.4 3.6 11.2 12.3 14.5
EBPT % pq 0.34 0.45 0.18 0.30 0.42

9 | © 2012 Global Association of Risk Professionals. All rights reserved.
Descriptive Statistics
0.0
0.2
0.4
0.6
0.8
1.0
1.2
1.4
2003 2004 2005 2006 2007 2008 2009 2010 2011 2012
Pro
vis
ion
s (
% o
f to
tal lo
an
s)
Year
All banks: Regulatory loan-loss provisions by type
GRCL Specific provisions
Basel I Basel II

10 | © 2012 Global Association of Risk Professionals. All rights reserved.
Provisioning: All Banks
Effects of credit risk, capital adequacy and earnings
Panel regression:
PROVi,t = ratio of provisions (specific provisions, GRCL or total provisions) to total loans
NPLi,t = non-performing loans / total loans
RWACi,t = ratio of credit RWA before provisions to total loans - 1
GDPGRt = growth of real GDP over the past year
BCONFt = NAB business confidence index
RT1CAPi,t = tier 1 capital ratio before provisions (actual - required)
EBPTi,t = earnings before provisions and taxes / average assets
LOGSIZEi,t = logarithm of total loans in billions of Australian dollars
DEPi,t = total deposits / total loans
tititititi
tttitiiti
DEPLOGSIZEEBPTRT1CAP
BCONFGDPGRRWACNPLPROV
,,3,2,1,
43,2,1,

11 | © 2012 Global Association of Risk Professionals. All rights reserved.
Provisioning: All Banks
Independent variables
NPL (β1) 0.1578 ** (13.38) 0.0191 ** (4.70) 0.1769 ** (15.86)
RWAC (β2) 0.0004 (0.57) 0.0028 ** (4.83) 0.0031 ** (4.36)
GDPGR (β3) -0.0038 (-0.34) -0.0448 ** (-4.48) -0.0486 ** (-3.09)
BCONF (β4) -0.0008 (-0.51) -0.0001 (-0.11) -0.0009 (-0.47)
RT1CAP (ϕ1) 0.0165 ** (4.72) 0.0143 ** (4.35) 0.0308 ** (5.38)
EBPT (γ1) -0.0039 (-0.11) 0.0307 ** (2.15) 0.0268 (0.79)
Log size (γ2) 0.0006 ** (2.24) 0.0004 (0.98) 0.0010 (2.01)
Deposits (γ3) -0.0039 ** (-4.10) -0.0025 ** (-2.30) -0.0064 ** (-3.53)
Bank intercepts Yes Yes Yes
Adj. R 2 0.78 0.70 0.78
Banks 22 22 22
Observations 744 744 744
Numbers in parentheses are t -statistics. ** indicates significance at the 5% level.
SPROV LLPGRCL
Dependent variables

12 | © 2012 Global Association of Risk Professionals. All rights reserved.
Further Analysis for IRB Banks
Descriptive statistics, N=98
Data item
Eligible provisions
Mean %
Median %
Standard deviation %
Expected losses
Mean %
Median %
Standard deviation % 1.68
1.28
1.13 2.010.88
1.30
0.53
0.45
0.72
Defaulted
exposures
Non-defaulted
exposures Total
0.83 0.53 1.37
0.46 0.47 0.90
0.80 0.23 0.98
13 | © 2012 Global Association of Risk Professionals. All rights reserved.
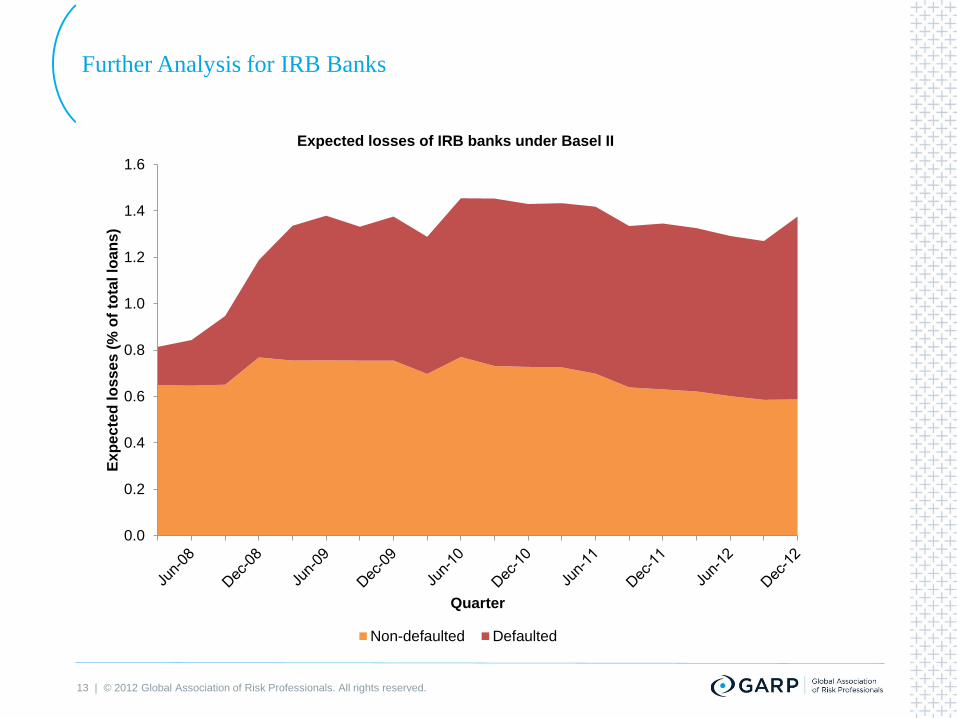
Further Analysis for IRB Banks
0.0
0.2
0.4
0.6
0.8
1.0
1.2
1.4
1.6
Exp
ecte
d lo
sses (
% o
f to
tal lo
an
s)
Quarter
Expected losses of IRB banks under Basel II
Non-defaulted Defaulted

14 | © 2012 Global Association of Risk Professionals. All rights reserved.
Further Analysis for IRB Banks
0
5
10
15
20
25
30
0
10
20
30
40
50
60
70
80
90
100
Cap
ital (%
of
RW
A)
Eli
gib
le p
rovis
ion
s (
% o
f E
L)
Quarter
Eligible provisions and bank capital ratios before provisions
Tier 1 capital Tier 2 capital Total EP

15 | © 2012 Global Association of Risk Professionals. All rights reserved.
Further Analysis for IRB Banks
Independent variables
NPL 0.4325 ** (12.39) 0.0189 (0.84) 0.4514 ** (12.46)
T1CAPTA 0.1832 ** (3.02) 0.1388 ** (5.91) 0.3220 ** (5.90)
EBPT 0.1184 (0.66) -0.2075 (-1.75) -0.0891 (-0.52)
Bank intercepts Yes Yes Yes
Adj. R 2 0.96 0.84 0.97
Banks 5 5 5
Observations 98 98 98
Numbers in parentheses are t -statistics. ** indicates significance at the 5% level.
Dependent variables
ELtot / TLELdef / TL ELnon-def / TL

16 | © 2012 Global Association of Risk Professionals. All rights reserved.
Further Analysis for IRB Banks
Independent variables
RT1CAP 0.9895 (0.53) 5.2613 ** (4.10) 3.7937 ** (3.72)
EBPT -2.5055 (-0.28) -0.4804 (-0.11) -4.2600 (-0.79)
Bank intercepts Yes Yes Yes
Adj. R 2 0.43 0.54 0.55
Banks 5 5 5
Observations 98 98 98
Numbers in parentheses are t -statistics. ** indicates significance at the 5% level.
Dependent variables
EPdef / ELdef EPnon-def / ELnon- EPtot / ELtot

17 | © 2012 Global Association of Risk Professionals. All rights reserved.
Conclusion
Banks use the regulatory provisioning model for risk management
Provisions reflect problem loans, inherent asset quality and macroeconomic conditions
Part of surplus capital and above-average earnings allocated to fund future credit losses
Internal ratings-based banks
Use freshly raised capital for replenishing provisions after IRB adoption
Loss expectations may be influenced by capital adequacy
Allocate more provisions against EL when tier 1 capital ratios are stronger

Creating a culture of
risk awarenessTM
Global Association of
Risk Professionals
111 Town Square Place
Suite 1215
Jersey City, New Jersey 07310
USA
+ 1 201.719.7210
2nd Floor
Bengal Wing
9A Devonshire Square
London, EC2M 4YN
UK
+ 44 (0) 20 7397 9630
www.garp.org
About GARP | The Global Association of Risk Professionals (GARP) is a not-for-profit global membership organization dedicated to preparing professionals and organizations to make
better informed risk decisions. Membership represents over 150,000 risk management practitioners and researchers from banks, investment management firms, government agencies,
academic institutions, and corporations from more than 195 countries and territories. GARP administers the Financial Risk Manager (FRM®) and the Energy Risk Professional (ERP®)
exams; certifications recognized by risk professionals worldwide. GARP also helps advance the role of risk management via comprehensive professional education and training for
professionals of all levels. www.garp.org.
© 2012 Global Association of Risk Professionals. All rights reserved.