title: impact assessment (ia) - gov.uk · the impact assessment includes three options which...
TRANSCRIPT

1
Title:
Energy Saving Opportunity Scheme IA No: DECC0142
Lead department or agency:
Department for Energy and Climate Change
Other departments or agencies:
Department for Transport
Impact Assessment (IA)
Date: 24/06/2014
Stage: Final
Source of intervention: EU
Type of measure: Secondary
Contact for enquiries: Henry Cormack 0300 068 6165
Summary: Intervention and Options
RPC Opinion: GREEN
Cost of ‘least cost’ Option (compared against ‘no directive’ baseline)
Total Net Present Value
Business Net Present Value
Net cost to business per year (EANCB on 2009 prices)
In scope of One-In, Two-Out?
Measure qualifies as
£1.6bn -£417m £35m No NA
What is the problem under consideration? Why is government intervention necessary?
The market for energy efficiency is characterised by a number of market failures. Enterprises typically lack awareness of how to reduce costs through energy efficiency. Article 8 of the Energy Efficiency Directive requires Member States to establish an energy audits regime under which all non-SME enterprises conduct an audit once every four years. Energy audits will need to include a detailed review of the energy consumption of an enterprise and identify the scope for improving the energy efficiency of its operations. The UK proposes to meet this requirement through introduction of the Energy Savings Opportunity Scheme (ESOS).
What are the policy objectives and the intended effects?
The objectives of the policy are to promote the take up of cost effective energy efficiency measures whilst minimising the cost to business of complying with the mandatory auditing requirements. By providing enterprises with tailored information about how they can make cost-effective savings ESOS should increase the take up of cost effective energy efficiency measures. This will increase productivity, support higher economic growth, reduce carbon emissions and improve security of supply.
What policy options have been considered, including any alternatives to regulation? Please justify preferred option (further details in Evidence Base)
The Impact Assessment includes three options which represent different approaches to implementing the minimum requirements of Article 8, and two options that go beyond the minimum requirements of the Directive, but may lead to higher benefits to the UK. Implementing this article is an EU legal obligation. An analysis of existing policies has concluded that they do not adequately meet the UK’s legal obligations under the Directive, and hence a do nothing option is not available. The Directive does not allow for transposing via self-regulation. The preferred option is Option 2 (implementing the minimum requirements of the Directive, with scheme administration through a central body, notification of compliance by organisations in scope and an option for organisations to voluntarily disclose the key audit results and action taken in light of audit) on the basis that this option minimises costs while offering the prospect of greater benefits than the other minimum-cost options.
Will the policy be reviewed? It will be reviewed. If applicable, set review date: 2016
Does implementation go beyond minimum EU requirements? No
Are any of these organisations in scope? If Micros not exempted set out reason in Evidence Base.
Micro No
< 20 No
Small No
Medium No
Large Yes
What is the CO2 equivalent change in greenhouse gas emissions? (Million tonnes CO2 equivalent)
Traded: 7.2
Non-traded: 2.9
I have read the Impact Assessment and I am satisfied that, given the available evidence, it represents a reasonable view of the likely costs, benefits and impact of the leading options.
Signed by the responsible SELECT SIGNATORY: Date:

2
Summary: Analysis & Evidence Policy Option 1 Description: Minimum requirement (scheme administration through central body, with notification of compliance)
FULL ECONOMIC ASSESSMENT
Price Base Year 2014
PV Base Year 2014
Time Period Years 16
Net Benefit (Present Value (PV)) (£m)
Low: Optional High: Optional Best Estimate: 1,636
COSTS (£m) Total Transition (Constant Price) Years
Average Annual (excl. Transition) (Constant Price)
Total Cost (Present Value)
Low Optional
1
Optional Optional
High Optional Optional Optional
Best Estimate
93 86 1,178
Description and scale of key monetised costs by ‘main affected groups’
The costs of implementing this policy option will be borne by large enterprises, energy assessors and Government. Around 9,400 large enterprises will face assessment costs estimated at £165m, the administrative burden estimated at £235m, and the capital cost and hassle cost of implementing measures estimated at £750m. Energy assessors will incur the cost of obtaining accredited status, estimated at £20m. The Government will face the scheme administration cost estimated at £10m. These costs are all measured against a no directive baseline.
Other key non-monetised costs by ‘main affected groups’
One of the knock on effects of improving an enterprise’s energy efficiency is that some of the financial savings may be spent on energy consuming goods and services: the rebound effect. This means that the overall impact on energy consumption is smaller (although businesses will benefit from the additional energy consumption). This reduction in benefits (cost) has not been quantified.
BENEFITS (£m) Total Transition (Constant Price) Years
Average Annual (excl. Transition) (Constant Price)
Total Benefit (Present Value)
Low Optional
Optional Optional
High Optional Optional Optional
Best Estimate
- 257 2,813
Description and scale of key monetised benefits by ‘main affected groups’
The main groups benefiting from the policy will be large enterprises and wider society. The large enterprises will benefit from energy savings estimated at £2.2bn, which will lead to lower energy bills. The wider society will benefit from resulting improved air quality estimated at £320m; non-traded carbon savings estimated at £150m; and traded carbon allowance savings estimated at £130m.
Other key non-monetised benefits by ‘main affected groups’
Cost-effective energy efficiency measures will reduce energy bills. For companies this translates into financial savings that can be reinvested for different purposes such as growing the business, leading also to enhanced competitiveness. This bolsters productivity, increasing growth. ESOS will also stimulate growth in the energy efficiency sector.
Key assumptions/sensitivities/risks Discount rate (%)
3.5
The analysis is significantly affected by the energy saving assumption used to estimate the benefits, as demonstrated by the sensitivity analysis. Other key sensitivities are the capital costs and the duration of the energy savings. If there is a significant rebound effect, energy savings will be lower than estimated, but this would be offset by the (unquantified) benefits of increased economic activity.
BUSINESS ASSESSMENT (Option 1)
Direct impact on business (Equivalent Annual) £m: In scope of OITO? Measure qualifies as
Costs: 35 Benefits: 0 Net: -35 No NA

3
Summary: Analysis & Evidence Policy Option 2 Description: Minimum requirement (scheme administration through central body, with notification of compliance and option for businesses to voluntarily disclose key audit results and action taken in light of audit)
FULL ECONOMIC ASSESSMENT
Price Base Year 2014
PV Base Year 2014
Time Period Years 16
Net Benefit (Present Value (PV)) (£m)
Low: Optional High: Optional Best Estimate: 1,636
COSTS (£m) Total Transition (Constant Price) Years
Average Annual (excl. Transition) (Constant Price)
Total Cost (Present Value)
Low Optional
Optional Optional
High Optional Optional Optional
Best Estimate
93 86 1,178
Description and scale of key monetised costs by ‘main affected groups’
The costs of implementing this option are the same as for Option 1 (see previous page). Organisations that choose to disclose the results of their ESOS assessment to the scheme administrator will incur additional costs, which we estimate to be around £1,200 per organisation. This cost is merely illustrative; it is not included in the estimated net present value of this option, as it is not compulsory.
Other key non-monetised costs by ‘main affected groups’
One of the knock on effects of improving an enterprise’s energy efficiency is that some of the financial savings may be spent on energy consuming goods and services: the rebound effect. This means that the overall impact on energy consumption is smaller (although businesses will benefit from the additional energy consumption). This reduction in benefits (cost) has not been quantified. There would be some additional costs associated with processing any information disclosed to the scheme administrator; the scheme administrator expects this cost to be negligible therefore it is not monetised.
BENEFITS (£m) Total Transition (Constant Price) Years
Average Annual (excl. Transition) (Constant Price)
Total Benefit (Present Value)
Low Optional
Optional Optional
High Optional Optional Optional
Best Estimate
257 2,813
Description and scale of key monetised benefits by ‘main affected groups’
The main groups benefiting from the policy will be large enterprises and wider society. The large enterprises will benefit from energy savings estimated at £2.2bn, which will lead to lower energy bills. The wider society will benefit from resulting improved air quality estimated at £320m; non-traded carbon savings estimated at £150m; and traded carbon allowance savings estimated at £130m.
Other key non-monetised benefits by ‘main affected groups’
Cost-effective energy efficiency measures will reduce energy bills. For companies this translates into financial savings that can be reinvested for different purposes such as growing the business, leading also to enhanced competitiveness. This bolsters productivity, increasing growth. ESOS will also stimulate growth in the energy efficiency sector. There may be potential benefits (reduced enforcement costs) from notification of compliance.
Key assumptions/sensitivities/risks Discount rate (%)
3.5
The analysis is significantly affected by the energy saving assumption used to estimate the benefits, as demonstrated by the sensitivity analysis. Other key sensitivities are the capital costs and the duration of the energy savings. If there is a significant rebound effect, energy savings will be lower than estimated, but this would be offset by the (unquantified) benefits of increased economic activity.
BUSINESS ASSESSMENT (Option 2)
Direct impact on business (Equivalent Annual) £m: In scope of OITO? Measure qualifies as
Costs: 35 Benefits: 0 Net: -35 No NA

4
Summary: Analysis & Evidence Policy Option 3 Description: Scheme administration through central body and mandatory public disclosure
FULL ECONOMIC ASSESSMENT
Price Base Year 2014
PV Base Year 2014
Time Period Years 16
Net Benefit (Present Value (PV)) (£m)
Low: Optional High: Optional Best Estimate: 1,534
COSTS (£m) Total Transition (Constant Price) Years
Average Annual (excl. Transition) (Constant Price)
Total Cost (Present Value)
Low Optional
Optional Optional
High Optional Optional Optional
Best Estimate
93 93 1,280
Description and scale of key monetised costs by ‘main affected groups’
The costs of implementing this policy option will be borne by large enterprises, energy assessors and Government. Around 9,400 large enterprises will face assessment costs estimated at £165m, the administrative burden estimated at £335m, and the capital cost and hassle cost of implementing measures estimated at £750m. Energy assessors will incur the cost of obtaining accredited status, estimated at £13m. The Government will face the scheme administration cost estimated £20m. These costs are all measured against a no directive baseline.
Other key non-monetised costs by ‘main affected groups’
One of the knock on effects of improving an enterprise’s energy efficiency is that some of the financial savings may be spent on energy consuming goods and services: the rebound effect. This means that the overall impact on energy consumption is smaller (although businesses will benefit from the additional energy consumption). This reduction in benefits (cost) has not been quantified.
BENEFITS (£m) Total Transition (Constant Price) Years
Average Annual (excl. Transition) (Constant Price)
Total Benefit (Present Value)
Low Optional
Optional Optional
High Optional Optional Optional
Best Estimate
257 2,813
Description and scale of key monetised benefits by ‘main affected groups’
The main groups benefiting from the policy will be large enterprises and wider society. The large enterprises will benefit from energy savings estimated at £2.2bn, which will lead to lower energy bills. The wider society will benefit from resulting improved air quality estimated at £320m; non-traded carbon savings estimated at £150m; and traded carbon allowance savings estimated at £130m.
Other key non-monetised benefits by ‘main affected groups’
Cost-effective energy efficiency measures will reduce energy bills. For companies this translates into financial savings that can be reinvested for different purposes such as growing the business, leading also to enhanced competitiveness. This bolsters productivity, increasing growth. ESOS will also stimulate growth in the energy efficiency sector. In addition, public disclosure could provide a reputational incentive and a tool to raise the profile of energy efficiency within an enterprise, which will make it more likely that measures are implemented. There may be potential benefits (reduced enforcement costs) from public disclosure.
Key assumptions/sensitivities/risks Discount rate (%)
3.5
The analysis is significantly affected by the energy saving assumption used to estimate the benefits, as demonstrated by the sensitivity analysis. Other key sensitivities are the capital costs and the duration of the energy savings. If there is a significant rebound effect, energy savings will be lower than estimated, but this would be offset by the (unquantified) benefits of increased economic activity.
BUSINESS ASSESSMENT (Option 3)
Direct impact on business (Equivalent Annual) £m: In scope of OITO? Measure qualifies as
Costs: 44 Benefits: 0 Net: -44 Yes IN

5
Summary: Analysis & Evidence Policy Option 4 Description: Minimum requirements with cost recovery (notification with administration and compliance costs recovered from businesses)
FULL ECONOMIC ASSESSMENT
Price Base Year 2014
PV Base Year 2014
Time Period Years 16
Net Benefit (Present Value (PV)) (£m)
Low: Optional High: Optional Best Estimate: 1,635
COSTS (£m) Total Transition (Constant Price) Years
Average Annual (excl. Transition) (Constant Price)
Total Cost (Present Value)
Low Optional
Optional Optional
High Optional Optional Optional
Best Estimate
93 86 1,179
Description and scale of key monetised costs by ‘main affected groups’
The costs of implementing this option policy package will be borne by large enterprises, energy assessors and Government. Around 9,400 large enterprises will face assessment costs estimated at £165m, the administrative burden estimated at £235m, and the capital cost and hassle cost of implementing measures estimated at £750m. Energy assessors will incur the cost of obtaining accredited status, estimated at £20m. The Government will face £3m of the estimated scheme administration costs and business the remaining £8m. These costs are all measured against a no directive baseline.
Other key non-monetised costs by ‘main affected groups’
One of the knock on effects of improving an enterprise’s energy efficiency is that some of the financial savings may be spent on energy consuming goods and services: the rebound effect. This means that the overall impact on energy consumption is smaller (although businesses will benefit from the additional energy consumption). This reduction in benefits (cost) has not been quantified.
BENEFITS (£m) Total Transition (Constant Price) Years
Average Annual (excl. Transition) (Constant Price)
Total Benefit (Present Value)
Low Optional
Optional Optional
High Optional Optional Optional
Best Estimate
257 2,813
Description and scale of key monetised benefits by ‘main affected groups’
The main groups benefiting from the policy will be large enterprises and wider society. The large enterprises will benefit from energy savings estimated at £2.2bn, which will lead to lower energy bills. The wider society will benefit from resulting improved air quality estimated at £320m; non-traded carbon savings estimated at £150m; and traded carbon allowance savings estimated at £130m.
Other key non-monetised benefits by ‘main affected groups’
Cost-effective energy efficiency measures will reduce energy bills. For companies this translates into financial savings that can be reinvested for different purposes such as growing the business, leading also to enhanced competitiveness. This bolsters productivity, increasing growth. ESOS will also stimulate growth in the energy efficiency sector. There may be potential benefits (reduced enforcement costs) from notification of compliance.
Key assumptions/sensitivities/risks Discount rate (%)
3.5
The analysis is significantly affected by the energy saving assumption used to estimate the benefits, as demonstrated by the sensitivity analysis. Other key sensitivities are the capital costs and the duration of the energy savings. If there is a significant rebound effect, energy savings will be lower than estimated, but this would be offset by the (unquantified) benefits of increased economic activity.
BUSINESS ASSESSMENT (Option 4)
Direct impact on business (Equivalent Annual) £m: In scope of OITO? Measure qualifies as
Costs: 36 Benefits: 0 Net: -36 No NA

6
Summary: Analysis & Evidence Policy Option 5 Description: Central reporting of comprehensive auditing results to scheme administrator
FULL ECONOMIC ASSESSMENT
Price Base Year 2014
PV Base Year 2014
Time Period Years 16
Net Benefit (Present Value (PV)) (£m)
Low: Optional High: Optional Best Estimate: 1,601
COSTS (£m) Total Transition (Constant Price) Years
Average Annual (excl. Transition) (Constant Price)
Total Cost (Present Value)
Low Optional
Optional Optional
High Optional Optional Optional
Best Estimate
93 88
1,212
Description and scale of key monetised costs by ‘main affected groups’
The costs of implementing this option policy package will be borne by large enterprises, energy assessors and Government. Around 9,400 large enterprises will face assessment costs estimated at £165m, the administrative burden estimated at £270m, and the capital cost and hassle cost of implementing measures estimated at £750m. Energy assessors will incur the cost of obtaining accredited status, estimated at £20m. The Government will face the scheme administration cost estimated £10m. These costs are all measured against a no directive baseline.
Other key non-monetised costs by ‘main affected groups’
One of the knock on effects of improving an enterprise’s energy efficiency is that some of the financial savings may be spent on energy consuming goods and services: the rebound effect. This means that the overall impact on energy consumption is smaller (although businesses will benefit from the additional energy consumption). This reduction in benefits (cost) has not been quantified.
BENEFITS (£m) Total Transition (Constant Price) Years
Average Annual (excl. Transition) (Constant Price)
Total Benefit (Present Value)
Low Optional
Optional Optional
High Optional Optional Optional
Best Estimate
257 2,813
Description and scale of key monetised benefits by ‘main affected groups’
The main groups benefiting from the policy will be large enterprises and wider society. The large enterprises will benefit from energy savings estimated at £2.2bn, which will lead to lower energy bills. The wider society will benefit from resulting improved air quality estimated at £320m; non-traded carbon savings estimated at £150m; and traded carbon allowance savings estimated at £130m.
Other key non-monetised benefits by ‘main affected groups’
Cost-effective energy efficiency measures will reduce energy bills. For companies this translates into financial savings that can be reinvested for different purposes such as growing the business, leading also to enhanced competitiveness. This bolsters productivity, increasing growth. ESOS will also stimulate growth in the energy efficiency sector. There are potentially wider benefits to society that could be gained for effective use of the information collected thought ESOS assessments. There may be potential benefits (reduced enforcement costs) from central reporting.
Key assumptions/sensitivities/risks Discount rate (%)
3.5
The analysis is significantly affected by the energy saving assumption used to estimate the benefits, as demonstrated by the sensitivity analysis. Other key sensitivities are the capital costs and the duration of the energy savings. If there is a significant rebound effect, energy savings will be lower than estimated, but this would be offset by the (unquantified) benefits of increased economic activity.
BUSINESS ASSESSMENT (Option 5)
Direct impact on business (Equivalent Annual) £m: In scope of OIOO? Measure qualifies as
Costs: 38 Benefits: 0 Net: -38 Yes IN

7
Evidence Base Contents 1 – Summary 2 – Problem under consideration 3 – Rationale for intervention 4 – Policy objective 5 – Description of options 6 – Cost-benefit analysis of the options 7 – Qualitative analysis of the options 8 – Sensitivity analysis 9 – Evaluation plan Annex A – Technical potential in buildings and industrial processes in scope of the policy Annex B – Structure of cost-benefit analysis Annex C – Number of buildings in scope of ESOS Annex D – Estimating the number of transport fleets in scope of the policy Annex E – Detailed transport sector analysis Annex F – Fit with the UK policy landscape Annex G – Literature review Annex H – Estimating the number of audits to be undertaken Annex I –Extract from Energy Efficiency Directive EED 1. Summary Article 8 of the Energy Efficiency Directive requires Member States to establish an energy audits regime under which all large enterprises conduct an audit once every four years. The Government is introducing the Energy Saving Opportunity Scheme (ESOS) to meet this requirement. An ESOS assessment will need to cover an enterprise’s significant energy consumption including, as appropriate, buildings, industrial processes and transportation operations, and include recommendations around what the enterprise can do to reduce its energy consumption. This intervention is expected to address a number of market failures that prevent enterprises investing in energy efficiency. These include a lack of detailed information on the opportunities for energy efficiency, an underdeveloped market and information asymmetries within enterprises. The objectives of ESOS are to:
Provide large enterprises with enterprise-specific information about how they can make energy savings,
Stimulate the take-up of cost-effective energy efficiency measures,
Minimise the cost to businesses of complying with the Directive, and
Maximise the synergies with existing policies.
The Government conducted an open consultation on the most appropriate way to implement the minimum requirements of Article 8. Since then a new shortlist of options has been created and is presented in this Impact Assessment. Options 1, 2 and 4 presented in this Impact Assessment represent different approaches to implementing the minimum requirements. Option 3 and 5 go beyond the minimum requirements, but may result in higher overall benefits to the UK.

8
There is a significant level of uncertainty around the costs and benefits of implementing the requirements of the Directive. The analysis conducted for this Impact Assessment suggests that around 9,400 enterprises are likely to fall within the scope of the policy. These enterprises occupy between 170,000 and 200,000 buildings (of which 8,000 to 10,000 are industrial plants) and consume about a third of UK energy demand. The development of ESOS will need to take into account a number of existing policies already in place. As Section 2 sets out, between 4,400 and 6,400 large enterprises are already measuring and reporting on their energy consumption under existing policies. However, given that the energy audits requirement in the Directive goes beyond measurement of consumption to include detailed recommendations for improvements, the policy is expected to have an additional impact on top of existing policies. The evidence base on the impact of energy audits is limited. The analysis therefore uses a range of illustrative assumptions to estimate the benefits from ESOS assessments, which have been informed by a review of the evidence available. These assumptions suggest that ESOS could generate annual savings of around 3.0 TWh per year, of which 2.3TWh from buildings and industrial processes and 0.7TWh from transport (which is equivalent to an average energy saving per enterprise of 0.7%). These energy savings are estimated to generate a net benefit to the UK of between £0.7bn and £2.8bn over the period 2015 to 2030. This estimate of energy savings delivered in buildings and industrial processes has been compared with the technical potential for energy efficiency in these sectors. The analysis presented in Section 6 suggests that there are 43TWh of potential savings with a payback of less than 2 years in scope of the policy (about 14% of energy consumption in these sectors). An annual saving of 2.3TWh in these sectors is therefore equivalent to around 5% of ESOS assessment recommendations being implemented. The most significant elements of the costs of the policy are the capital and hassle costs of implementing assessment recommendations (£700m over the period). For options 1-5, the cost of conducting ESOS assessments themselves is around £165m and in addition the administrative burden to enterprises in scope of the policy is £235-335m1. The accreditation and scheme administration regime is estimated to cost £30m over the period. In addition to the monetised cost and benefits, there are a number of wider costs and benefits discussed in Section 7. These include:
The impact of energy efficiency on economic growth, productivity and competitiveness,
The direct and indirect rebound effect (which can reduce the energy savings delivered),
The impact of some policy options on the information asymmetries within enterprises, and
The social benefits of applying the information collected by ESOS assessors to a wider range of uses.
1 This range represents the differing requirements on businesses under the 5 policy options. The low end of the range is the
administrative burden associated with the minimum requirement options (1 and 2) while the high end of the range represents the administrative burden associated with mandatory public disclosure (option 3).
9
2. Problem under consideration The EU Energy Efficiency Directive (2012/27/EU) was published in the Official Journal of the EU on 14 November 2012.2 Article 8 of the Directive requires Member States to establish an energy audits regime under which all non-SME enterprises conduct an energy audit by December 2015 and, thereafter once every four years. The energy audit will need to include a detailed review of the energy consumption of an enterprise and identify the scope for improving the energy efficiency of its operations. An exemption to the auditing requirement is available for enterprises that have implemented certain energy or environmental management systems. EU member states are required to transpose the majority of the Directive’s provisions, including Article 8, into national law by June 2014. 3. Rationale for intervention
The Government’s 2012 Energy Efficiency Strategy3 outlines four categories of market failures that prevent firms making otherwise cost effective energy efficiency investments; information failures, misaligned financial incentives, embryonic markets and undervaluing energy efficiency. These market failures are interrelated and work together to reduce investment in energy efficiency. Solving one area of market failure would not be enough on its own to realise the full potential for cost-effective energy efficiency. The main market failure that will be addressed by the introduction of ESOS assessments is the information failures, although the impact of the other market failures will also be reduced. One of the characteristics of the energy efficiency market is a lack of access to trusted and appropriate information. Where information is available, it may be generic, and not tailored to specific circumstances, which means that enterprises are not able to properly assess the benefits of an energy efficiency investment. Acquiring information, especially of the specific and tailored type, is costly and businesses may not recognise it as a valuable use of time and resources. While information is available about overall energy consumption, it is often difficult to relate that to individual activities in order to identify opportunities to make energy efficiency improvements. The informational market failure contributes to the embryonic state of the current energy efficiency market. Without detailed, accurate and specific information it is difficult for firms to know what kinds of investments they can make in energy efficiency, and therefore they do not demand these services. For example, this has meant that the market for advice has not developed. Without a catalyst to promote greater interest in energy efficiency investments, there is the risk of a continued cycle of underinvestment where neither the demand nor supply side develops. The lack of tailored information means that energy efficiency opportunities are often poorly or misunderstood by decision makers within companies. As a consequence energy efficiency is undervalued relative to other investment options and not prioritised. Outside of the energy intensive industry sectors, energy bills are only a small proportion of business costs. If the relative gain is small, then the hassle costs can act as a significant barrier, especially if there is uncertainty around the benefits of the investment. While hassle costs are not in themselves a market failure, they compound the impact of other barriers, reducing investment in energy efficiency.
2 14.11.2012 OJEU L315/17 Volume 55
3 https://www.gov.uk/government/uploads/system/uploads/attachment_data/file/65602/6927-energy-efficiency-strategy--the-energy-
efficiency.pdf
10
In addition, research has highlighted that the size, structure and sector of an enterprise affects its approach to energy efficiency.4 For example, giving energy management responsibilities to staff lower down in the hierarchy from senior executives can create information asymmetry and principal-agent issues within enterprises. Energy consumption will be less salient to senior managers when they are not responsible for it, yet these individuals will make the strategic decisions that influence its consumption. 4. Policy objective The objectives of ESOS are to:
Provide large enterprises with enterprise-specific information about how they can make energy savings,
Stimulate the take-up of cost-effective energy efficiency measures,
Minimise the cost to businesses of complying with the Directive, and
Maximise the synergies with existing policies. As set out in the Government’s Energy Efficiency Strategy, there are a wide range of benefits from improving the energy efficiency of the UK economy:
Cost-effective energy efficiency measures will reduce energy bills. For companies this translates into financial savings that can be reinvested for different purposes such as growing the business, leading to enhanced competitiveness. This bolsters productivity, increasing growth. For example, one study of the Government’s energy efficiency policy between 2000 and 2007 estimated that existing policies increased the annual rate of economic growth by around 0.1 percentage point within that period.5 The study also estimated that these policies resulted in roughly 270,000 additional jobs in 2010 owing to the cumulative impact of higher growth.
Improving energy efficiency is a cost effective way to reduce carbon emissions. Energy efficiency will need to play a significant role in meeting the Government’s long term carbon emission reduction targets. The Carbon Plan 2050 Scenarios show alternative pathways to meeting our 80% emissions reductions goal. Analysis supporting the 2013 update to the Energy Efficiency Strategy shows that these would require reductions in final energy consumption between broadly stable and 32 per cent savings between 2011 and 20506.Reducing energy demand through energy efficiency also improves security of supply. It reduces the UKs exposure to volatile international energy markets and means less energy infrastructure is required, lowering the overall costs of the energy system. Energy and climate change policies (including energy efficiency measures and a larger share of nuclear and renewables) could reduce the UK’s sensitivity to spikes in global oil, gas and coal prices by 30% in 2020 and 60% in 2050.7
4.1. Requirements of the Directive
ESOS is intended to meet the energy auditing requirements set out in Article 8(4) and Annex VI of the Energy Efficiency Directive. All non-SMEs will be required to have an ESOS assessment by 5 December 2015, and thereafter every four years. The Directive
4 https://www.gov.uk/government/uploads/system/uploads/attachment_data/file/65601/6925-what-are-the-factors-influencing-energy-
behaviours.pdf 5 Barker, T., Ekins, P., & Foxon, T. (2007). The macro-economic rebound effect and the UK economy. Energy Policy, 4935-4946.
6
https://www.gov.uk/government/uploads/system/uploads/attachment_data/file/266199/FINAL_2013_Statistical_Summary_131209__2_.pdf 7 2011. Oxford Economics: Fossil fuel prices and a low carbon economy Dec 2011

11
defines an SME as an enterprise with less than 250 employees and either annual turnover of less than €50m or an annual balance sheet less than €43m (or both). This includes private and non-profit sector enterprises, but not the public sector. The ESOS assessment itself should be:
Based on measured operational data on energy consumption,
Comprise a detailed review of the energy consumption of an enterprise’s buildings, industrial processes and transport operations,
Be proportionate and sufficiently representative to permit drawing a reliable picture of overall energy performance and the reliable identification of the most significant opportunities for improvement, and
Should allow detailed and validated calculations for proposed measures to provide clear information on potential savings.
The UK is required to define a minimum standard based on these requirements, and put in place quality assurance processes to check the ESOS assessments conducted meet it. The ESOS assessments will need to be carried out in an independent manner by qualified, accredited experts (who may be in-house staff of the enterprise concerned). Enterprises may be exempt from the ESOS requirement if they have implemented certain energy management systems. The requirements apply UK wide. Under Article 24 of the Directive, the UK is also required to report every three years on the number of enterprises in scope of the ESOS requirement and the number of ESOS assessments conducted.
4.2. Non-regulatory approaches There is a small existing market for energy assessment services, suggesting it could be possible to capture the benefits of the policy by relying on large enterprises conducting energy assessments voluntarily (either independently or through industry led self-regulation). However, the Directive places a legal obligation on the UK to make it a legal requirement for non-SMEs to undertake energy audits and to put in place an enforcement regime to ensure compliance. The Directive also sets out very clear prescriptive requirements that must be transposed in law setting out, amongst other things, the elements that audits must contain. An analysis of existing policies, presented in Annex F, has concluded that they do not adequately meet the UK’s legal obligations under the Directive. Nor does the Directive allow for transposition through self-regulatory means. There are therefore no do-nothing or self-regulatory options available. Attempting to transpose the requirements of Article 8(4) of the Directive by means of a non-regulatory approach would give rise to a significant infraction risk for the UK. It would not lead to a legally binding requirement for non-SMEs to conduct an energy audit and there is a considerable risk that some large enterprises would not voluntarily implement the requirements. Were the Commission to instigate infraction proceedings in such circumstances, there is a high risk of it being successful. Clearly defining which enterprises are required to comply with the auditing requirement in secondary legislation (supported by guidance developed with industry) would give greater certainty to businesses and ensure the UK fully complies with its obligations under EU law.

12
5. Description of options As noted above, an analysis of existing policies has concluded that they do not adequately meet the UK’s legal obligation under the Directive (see Annex F to this document for details). The requirements of Article 8 of the Directive are mandatory for the UK and must be transposed before 5 June 2014. The options appraisal focuses on the least cost way of implementing the requirements of the Directive, and then the costs and benefits of any additional elements that could improve the net benefit to the UK. The analysis focuses on the aspects of the policy that are judged to have a significant impact of the costs and benefits (given current evidence). The Directive applies to the UK and the same policy framework is being adopted by the Devolved Administrations.
5.1. Description of ESOS The Government will set out in legislation and supporting guidance what enterprises are required to do to comply with the ESOS. Article 8(6) of the Directive provides an ‘exemption’ from the energy auditing requirement for ‘enterprises that are implementing an energy or environmental management system (EMS) certified by an independent body according to the relevant European or International Standards’. This only applies where Member States ‘ensure that the management system concerned includes an energy audit on the basis of the minimum criteria.’ This means there will be at least two routes firms could use to comply: conducting an ESOS assessment or implementing an EMS.
For the ESOS compliance route, enterprises will have an assessment conducted by or overseen by a suitably qualified or accredited ESOS assessor.
For the EMS compliance route, enterprises will need to ensure the implementation of their EMS has been certified in accordance with relevant European or International standards, which member states consider to include an energy audit meeting the requirements set by Annex VI to the Directive.
ESOS assessment compliance route An ESOS assessment will comprise a detailed analysis of an enterprise’s energy consumption and potential for making energy efficiency improvements. The energy consumption will need to be based on operational data (and cover the load profile where appropriate). The assessment should:
Be proportionate but sufficiently representative to identify the cost effective opportunities to improve the energy efficiency of the enterprise,
Provide quantified estimates of energy savings available from implementing recommendations,
Be conducted, overseen or reviewed by a sufficiently qualified assessor and cover the enterprise as whole. This does not preclude the assessment being conducted by a team, with one professional approving the assessment as a whole and using specialists for different elements of the work, or an enterprise seeking verification by a qualified assessor of work previously carried out by competent energy auditors who are not qualified assessors.
Some more detailed advice for enterprises on interpreting the requirements of ESOS will be set out in non-statutory guidance. But significant elements of the ESOS assessment will be left to the discretion of the professional assessor. These include:

13
The number of sites the assessor/team needs to visit,
The actual recommendations that are made, and
The level of detail that different elements of the enterprises energy use are afforded (for example, the assessment of a firm’s transport energy use should be proportionate to transports’ share of total energy use).
EMS compliance route The Directive states that the member states may provide for enterprises that have implemented an EMS certified by an independent body according to relevant European or International Standards may be exempted from the separate mandatory auditing requirement created by the Directive.8 The recitals to the Directive note that this may include standards such as ISO 50001 (which has been implemented by around 40 companies in the UK)9 and ISO 14001 (where undertaken with an energy efficiency audit). However, the Directive places a requirement on member states to ensure that the management system concerned includes an energy audit on the basis of the minimum criteria contained in Annex VI to the Directive. In cases where enterprises use such relevant existing standards, they will still be subject to enforcement and compliance checks, in line with the options outlined in this Impact Assessment. The Government may choose to designate existing or new EMS standards as compliant with the Directive requirements. It may also provide the flexibility to accredit other suitable organisations to certify individual EMS. This would allow the market to bring forward a range of EMS’ that could be used by large enterprises to comply. There is currently no robust data on the cost of implementing an EMS, or the number of enterprises that may choose to use the EMS compliance route. The cost analysis is therefore based on the assumption that all large enterprises meet the legal requirement by hiring an external ESOS assessor. In reality many enterprises may use accredited internal staff, or use an Energy Management System instead. Enterprises will adopt which ever compliance route is best suited to their circumstances. The assumption that all firms adopt the same compliance route is therefore a conservative one; some firms will be able to meet the requirements at a lower cost. It should be noted that some enterprises may choose to go beyond the minimum requirements of the directive when conducting their assessment. Given that this would be voluntary, the costs have not been included in the analysis. Qualification and Accreditation of ESOS assessors The Directive requires the Government to ensure that ESOS assessments are conducted by experts who are qualified and/or accredited or alternatively are implemented and supervised by independent authorities. The Government has commissioned BSI to develop a Publicly Available Specification (PAS) to set out the level of competence required of lead ESOS assessors. The PAS is due to be published in June 2014. The Government will legislate for a mechanism to allow energy professionals to become recognised ‘ESOS assessors’ for the purposes of ESOS assessments. ESOS is likely to include quality assurance checks of a sample of assessors’ reports to ensure that
8 Note the definition of EMS is broader than simply a computer based energy use in information system and includes having in place
wider organisational energy management procedure and processes. 9 British Standards Institute

14
assessments are conducted to an adequate standard (this function may be conducted by the scheme administrator or another organisation). The Government consulted on what regime would be most effective at enforcing the requirements of the Directive in line with better regulation principles. This included a cost-benefit analysis, presented in the consultation-stage Impact Assessment10, of 6 policy options. Since presenting these 6 options in the consultation, we have determined that one of them falls short of the minimum requirements of the Directive (as we are required to report to the European Commission the number of companies undertaking energy audits, and hence some form of notification by large enterprises to the scheme administrator is required). The option not requiring any form of notification to the scheme administrator has therefore been discounted. We have discounted another on the basis that it goes far beyond the requirements of the Directive, would involve considerable costs for businesses and was roundly rejected by respondents to the consultation. Finally, we have added an option (Option 2 below) on the basis that there may be benefits of giving organisations the option, without requiring them, to disclose to the scheme administrator some details of the results of their ESOS assessment. The new short list of options considered in this Impact Assessment is therefore as follows: Option 1: Minimum requirement (scheme administration through central body, with notification of compliance) Under Option 1, each large enterprise (as defined by the Directive) would notify the scheme administrator that they are in scope of the Directive, and that they have undertaken an assessment. This data would be used to meet the UK’s reporting requirements under the Directive.11 Under this option, the initial compliance requirement placed on each large enterprise is that they undertake the assessment and notify the scheme administrator that they have done so. This represents the minimum requirement on organisations in scope that enables the UK to meet its reporting requirements under the Directive. The scheme administration body will monitor large enterprises to ensure they have carried out an assessment; or have implemented an approved EMS. A sample of firms will be checked each year to ensure they are compliant with the requirements, with penalties applied to those that have not. It is likely that the scheme administrator body would take a risk-based approach to targeting large enterprises. The compliance check could take the form of a letter from the scheme administrator to the large enterprise under consideration requesting confirmation of their compliance (for example – a copy of the ESOS assessment, or a letter of confirmation from an accredited ESOS assessor). It is also likely that, in line with better regulation principles and as required by the Directive, the scheme administrator would focus on bringing participants into compliance, with formal enforcement action (including penalties where appropriate) being used only as a last resort. Option 2: Minimum requirement (scheme administration through central body, with notification of compliance and option for businesses to voluntarily disclose key audit results and action taken in light of audit)
10
Accessible at: https://www.gov.uk/government/consultations/energy-savings-opportunity-scheme 11
The UK is required to provide data on the number of companies covered by the policy and numbers of ESOS assessments
conducted.

15
This option has the same enforcement and compliance requirement as Option 1, with a central scheme administrator checking the compliance of a sample of enterprises and organisations in scope being required to notify the scheme administrator that they are in scope and are compliant. It differs from Option 1 by ensuring the scheme administrator gives organisations in scope the option to disclose the key results, and any action taken in light, of their ESOS assessment to the scheme administrator. The scheme administrator would then publish any voluntary information received. The scheme administrator will take the same risk-based approach to targeting large enterprises as for Option 1. Under this option, the initial compliance requirement placed on a large enterprise is no different than under Option 1 however organisations that chose to disclose to the scheme administrator more details of their audit would obviously incur minor additional costs. Organisations may be inclined to voluntarily disclose the results of their audit as they may consider it a way of gaining recognition for action to increase their energy efficiency. Option 3: Minimum requirement (scheme administration through central body, with notification of compliance and mandatory public disclosure) This option is the same as Option 1, except that organisations would be required to publicly disclose the key results, and any action taken in light, of their ESOS assessment. This could consist of a short summary of the results of each assessment and any actions taken in the Directors’ Report (or Strategic Report) or corporate annual report (or via another route if such reports are not routinely published). Under this option, the initial compliance requirement placed on large enterprises is increased by the need for public disclosure. The burden for any subsequent enforcement action would be reduced. This is because the scheme administrator would be able to check publically available documents to confirm whether an enterprise is compliant. Option 4: Minimum requirement with cost recovery (notification with administration and compliance costs recovered from businesses) This option has the same enforcement and compliance requirement as Option 1, with a central scheme administrator monitoring the compliance of a sample of enterprises and each large enterprise reporting that they have undertaken an ESOS assessment. This option differs from Option 1 in that administrative and compliance costs incurred by the scheme administrator are recovered from the affected enterprises. In line with HMT rules, certain costs cannot be recovered from businesses and will be funded by HMG (these include start-up costs and enforcement costs). Large enterprises would inform the scheme administrator that they are in scope, have undertaken an ESOS assessment and pay an administration fee (the administration fee could be paid annually, and at the same time as notifying the scheme administrator). The scheme administrator will continue to sample large enterprises (through a risk-based approach) to check whether they are compliant with the Directive (as for Option 1). Option 5: Central reporting of comprehensive auditing results to scheme administrator
16
This option has the same enforcement and compliance requirement as Option 1, with a central scheme administrator monitoring the compliance of a sample of enterprises and each large enterprise reporting that they have undertaken an ESOS assessment. This option differs from Option 1 by including the requirement to report on the actual results of the ESOS assessment (for example, the quantity of energy savings identified and the recommendations made) to the scheme administrator, rather than just core minimum data (for example, confirmation that an assessment has been conducted). Following the assessment, the enterprise would be required to submit information on its findings to the scheme administrator using a standardised template. With respect to ex-post administrative burdens for businesses, the scheme administrator can confirm whether a large enterprise chosen by sampling is compliant, by checking if the appropriate information has already been supplied. This could be done without notifying the large enterprise. This would reduce the subsequent administrative burden on enterprises in scope of the policy. Box 1: Enforcement, qualification / accreditation and market incentives
The implementation of ESOS will create different incentives for firms and assessors. There is a risk that the structure of the scheme creates incentives that undermine the intention of the policy to help firms identify cost effective energy efficiency opportunities. The policy has been designed in a way so as to minimise these risks. For example, firms will have an incentive to comply with the auditing requirements at least cost. Some assessors may respond by decreasing the quality of their work and charging lower prices. Similarly, EMS providers certified to an adequate standard might seek to increase their market share by providing lower quality services and charging lower fees. Firms that did want to hire a high quality assessor may not be able to distinguish them from lower quality assessors. This could trigger a ‘race to the bottom’ in the sector, as higher quality assessor would be unable to charge higher fees. This issue is exacerbated by the under developed energy efficiency market, in which firms lack reliable information on the services available. The qualification and/or accreditation requirements and the enforcement regime will mitigate this to some extent. The scheme administrator will check the compliance of a sample of enterprises. A body (the qualification / accreditation body or the scheme administrator) will be will be responsible for checking the quality of the ESOS assessments, with possible sanctions including potentially loss of accreditation to punish poor ESOS assessors. A greater number of checks will increase the probability that such an assessor will be discovered, therefore reducing his incentive to provide low quality services. In a properly functioning market, firms should be able to demonstrate or advertise the quality of their services to prospective customers. The qualification and/or accreditation regime will therefore need to ensure assessment are of an adequate minimum standard, whilst also providing space for a differentiated market to grow to serve those firms wanting to go beyond the legal minimum. There is also a risk that in the absence of clear information on the costs of assessment, and what needs to be included, that some assessors may have an incentive to overcharge for their services, given the increase in demand created by the policy. However, a

17
competitive assessment market will drive out of business assessors who overcharge for ESOS assessments. The publication of guidance by the Government or a delivery partner will also help firms understand what standard is required to comply. Were the Government ultimately to require some level of public disclosure then this will also affect incentives. For example, requiring firms to publically declare what action they had taken following an ESOS assessment may create a reputational incentive to implemented more recommendations. However, public disclosure may also create an incentive for assessors to provide a smaller number of recommendations, and enable firms to declare they have done all they can to improve their energy efficiency.
6. Cost benefit analysis of the options There is limited evidence available of the likely impact of the ESOS. The Impact Assessment therefore uses a combination of quantitative and qualitative analysis, with the latter being used when there is insufficient evidence to provide robust quantitative estimates. The quantitative analysis of the costs and benefits is structured as follows:
1. Quantify scope of policy, in terms of energy, enterprises, buildings, industrial processes and vehicle fleets.
2. Identify the overlaps with existing policies; which affect both the costs and benefits of the policy.
3. Estimate the benefits using a high level assumption, supported by the evidence available.
4. Estimate the costs, including the cost of conducting the ESOS assessments, the administrative burden to businesses and government, and the cost of implementing recommendations.
5. Use breakeven analysis to estimate the additional energy savings that would be required to cover the additional cost of each option.
The quantitative analysis is supported by a qualitative assessment of the non-quantified costs and benefits, and a multi-criteria analysis which assesses each option against the key objectives of the policy. Time period for the appraisal is 2015 (when the first round of assessments will be implemented) to 2030. During this period, a total of 4 assessments will need to be conducted by organisations in scope. Cost and benefits incurred beyond 2030 are not included in the analysis. This is likely to underestimate the Net Present Value (NPV) of the policy, as some energy efficiency measures will last for a number of years and so continue to deliver savings beyond 2030. Box 2: Changes made to the cost-benefit methodology since the consultation-stage Impact Assessment
Since the consultation we have made a number of changes to the cost-benefit methodology used to generate the estimates that appear on the summary pages of this Impact Assessment, summarised below. Organisations in scope of ESOS
We have re-estimated the number of organisations in scope of ESOS, using data which
18
enables a more accurate estimate of the likely number of organisations in scope of ESOS. Our previous estimate (7,265 organisations) was based on BIS business population statistics12, which includes information about businesses’ employees but not their turnover, meaning our previous estimate was an underestimate of the true number of organisations in scope of ESOS. In this Impact Assessment, we use the Interdepartmental Business Register (IDBR) data source, which includes turnover information, in order to take account of organisations that would be in scope of ESOS by virtue of having a turnover of greater than €43 despite having fewer than 250 employees. For the purposes of estimating the number of audits that will actually be undertaken as a result of ESOS, we have made assumptions about the rate at which organisations in scope of ESOS will disaggregate for the purpose of complying with ESOS (the approach taken is set out in Annex H of this Impact Assessment). Our new estimate of organisations in scope of ESOS increases the estimated costs of the policy by approximately £150m, of which £80m are due to the more reliable measure of number of transport fleets in scope (ignoring the impact of other changes, described below). Timing of energy savings We have changed the assumed first year in which energy savings will be realised from 2015 to 2016, on consideration of the likelihood that any recommendations that organisations decide to act on which require investment by the organisation (non-behavioural measures) will be rolled over to FY 2016 due to the need to get internal approval for the spend. This approach also allows for other lag factors between considering the results of an ESOS assessment and acting on any measures, This change reduces the size, and hence estimated value, of energy savings; and capital costs (since capital costs are a function of energy efficiency investments made). The overall impact of this change is a reduction in the net present value of the policy. Scheme administration costs Our estimate of scheme administration costs was previously based on the cost of administering the CRC. The estimate presented in this Impact Assessment is based on the latest estimate made by the Environment Agency of the expected costs of administering the scheme, which is lower than the costs of administering the CRC. Hourly wage rates used to estimate administrative burden Our estimate of the administrative burden to organisations of complying with ESOS is based on the Standard Costs Model. We have updated the underlying wage rates since the Consultation Stage Impact Assessment to reflect figures in the most recently published Annual Survey of Hours and Earnings. This change has increased our estimate of admin burden. Transport assumptions A number of changes have been made to the analysis. The detailed transport sector analysis is set out in Annex E. A summary of the main changes made is as follows:
We have re-estimated the number of transport fleets in scope of the policy to better reflect patterns of vehicle usage across different sectors. The new approach is set out at Annex D. This has led us to revise upwards our assumed transport fleets in
12
https://www.gov.uk/government/collections/business-population-estimates
19
scope of the policy, which increases our estimate of total audit costs.
We have re-estimated company car mileage in scope of the policy, to reflect that only business mileage is in scope of ESOS. Our estimate of car mileage from company cars falls from 18% to 8%. This change in assumption slightly reduces the estimated energy savings of the policy.
We have re-estimated the percentage of vans owned by business, to take account of updated statistics13 used in the process. The new figure is unchanged when rounded to a whole number.
We now assume that ESOS assessments will lead to a 1% reduction in energy consumption by vans rather than a 2% reduction. This is based on discussion with stakeholders which indicates that van fleet operations may already be more carefully managed than car fleet operations and hence less scope exists for energy efficiency savings.
We now assume that ESOS assessments will lead to a 1% reduction in energy consumption by buses and coaches which is based on conversations with stakeholders and research that identified energy efficiency measures with payback shorter than 2 years.
Our estimate of capital costs for the transport sector is based on the costs of upgrading from the most common fleet vehicles to comparable vehicles which are more fuel efficient. Following discussion with transport industry stakeholders we have changed the specific vehicles used for the purposes of this modelling, which changes our estimate of capital costs. Unit costs (£/GWh) for cars are lower, whilst van and HGV unit costs are higher. Although capital costs for bus and coach upgrades have been added, the overall effect of this change is to reduce our estimated capital costs of the policy.
Updates to datasets used The analysis presented in this Impact Assessment takes account of updates to key underlying datasets since the consultation stage, namely:
DECC’s (2013) Energy Projections14 have been used to estimate total energy in scope of the policy – the relevant updated figures are slightly lower than before and therefore reduce the estimated benefits of the policy (ignoring the impact of other changes). Since our estimate of capital costs is derived from our estimate of energy savings, this update also reduces capital costs (but not enough to offset the reduction in benefits caused by this update)
ECUK (2013) energy projections15 have been used to apportion energy use to industrial buildings – the relevant updated figures are close enough to those previously used that they do not in themselves affect the results
The long run variable fuel costs set out in the supplementary guidance on energy and climate change impacts in the Green Book published in September 201316 have been used to monetise our estimate of energy savings – the updated figures slightly increase the estimated benefits of the policy
13
Currently licensed vehicles in GB for 2012, available at: https://www.gov.uk/government/collections/vehicles-statistics 14
https://www.gov.uk/government/publications/updated-energy-and-emissions-projections-2013 15
https://www.gov.uk/government/collections/energy-consumption-in-the-uk 16
https://www.gov.uk/government/publications/valuation-of-energy-use-and-greenhouse-gas-emissions-for-appraisal

20
6.1. Scope of the policy The requirements of the Directive go beyond the measurement of energy use to include a detailed analysis of the scope for energy efficiency improvements. Depending on the enterprise, this may require information to be collected on:
Building fabric, lighting and heating systems,
Energy efficiency of different element of industrial processes,
Vehicle types, fuel consumption and fuel efficiency of vehicle fleets, and
The enterprise’s energy management practices. This section sets out the estimated number of enterprises, buildings, industrial processes and vehicle fleets that are in scope of the policy, and the energy they consume. It also considers the extent to which these enterprises and the energy they consume is already covered by existing policies, which will affect both costs and benefits of ESOS assessments.
6.1.1. Enterprises in scope of policy The Directive defines an SME as an enterprise with less than 250 employees and either annual turnover of less than €50m or an annual balance sheet less than €43m (or both). As of April 2014 there were 9,382 large enterprises that meet these criteria, according to our analysis of the Interdepartmental Business Register (IDBR) dataset. These enterprises employed around 11.0m people and had a turnover of over £1.7tr.17 Table 1 presents the breakdown by sector, which is assumed, in the absence of reliable forecasts on sector development, to remain constant from 2015 to 2030. It has been assumed that some organisations will choose to disaggregate for the purpose of complying with ESOS and perform multiple audits. The economic modelling of audit costs has been performed using the disaggregated number of organisations in Table 1. The overall level of disaggregation is 14%. Table 1: Number of organisations in scope of ESOS and estimated audits to be undertaken, by sector
Number of large
organisations Number of large
organisations, disaggregated
Commercial 7,400 8,300
Industrial 1,500 1,700
Transport 400 500
No major industry 100 -
- Of which are assumed to have a fleet of vehicles
8,500 8,500
Total 9,400 10,500
Source: DECC analysis of the Interdepartmental Business Register (IDBR) dataset. Figures shown here are rounded, given the registered number of business changes on a frequent basis.
17 BIS Business population statistics, 2013, https://www.gov.uk/government/publications/business-population-estimates-2013

21
6.1.2. Buildings and industrial processes in scope of policy
For all options, an ESOS assessment is likely to require a visit to some of an enterprise’s sites. The number of buildings occupied by large enterprises has therefore been used as a proxy for the complexity of carrying out an ESOS assessment. It is estimated using Experian data that in 2012, around 170,000 – 200,000 buildings were occupied by large enterprises. The majority of these (55%) were shops smaller than 500m2 and around 11% were offices. Around 8,000 – 10,000 (5%) were classified as factories, which is used as proxy for the number of industrial processes in scope of the policy. Table 2 sets out the breakdown of significant sites owned by large enterprises. This Impact Assessment uses the assumption that the number and breakdown of buildings occupied by large enterprises remains constant over the period to 2030. Table 2: Indicative breakdown of buildings in scope of policy, by type and size
Number of buildings in each size Band (m2)
<100
100 to 250
250 to 500
500 to 1,000
1,000 to 5,000
5,000 to 10,000
>10,000 Total
Industrial sites 0% 1% 1% 1% 1% 0% 1% 5%
Offices 2% 3% 2% 1% 2% 1% 0% 11%
Shops 16% 27% 12% 7% 6% 1% 0% 70%
Other 1% 2% 4% 3% 3% 1% 1% 15%
All buildings 19% 32% 19% 12% 13% 3% 2% 100%
Source: DECC analysis using VOA Non Domestic Ratings File & analysis of Experian PH modelled company data, 2012
6.1.3. Fleets of vehicles in scope of policy In addition to covering an enterprise’s buildings and industrial processes, an ESOS assessment will need to include an assessment of energy efficiency of its transportation operations. Given the assessment will be proportionate and relevant to the enterprise, the extent to which transport is covered at all will depend on the size of the enterprise’s transport operations. There is little data available on the number of large enterprises that run significant transport operations. We have attempted to estimate the number of transport fleets likely to be in scope of ESOS, using the best available data and a number of simplifying assumptions. The methodology is set out in Annex D, and leads us to estimate there to be around 8,500 transport fleets in scope of ESOS. The extent to which this figure accurately represents the number of fleets in scope is unclear. On the one hand, this estimate may fail to account for enterprises that operate transport fleets and therefore require a transport audit. On the other hand, many of these enterprises will subcontract their transport operations to SMEs, which are exempt from the Directive requirements.
6.1.4. Energy consumption in scope of policy It’s estimated that around one third (596TWh) of UK energy demand in 2012 is consumed by large enterprises and therefore falls within the scope of ESOS. Figure 1 illustrates the relationship between total UK energy demand in the industrial, commercial and business transport sectors and the proportion that is covered by the policy.
The first column shows the total UK energy demand in 2012.

22
The second column shows the share of total demand that is estimated to be consumed by businesses (excluding aviation and shipping18). The business sector’s share of surface transport has been estimated using a number of assumptions described in detail in Annex E.
The third column shows the same energy use but with the industrial sector energy demand split between energy use in buildings (27%) and in industrial processes (73%).19 The energy use by industrial buildings is grouped with the energy use by the commercial and other sectors, assuming that they are constituted entirely by buildings.
The final column shows the amount of business energy demand that is used by non-SMEs. Details of how these estimates were developed can be found in Annex F.
Figure 1: Comparison of total industrial, commercial and transport energy consumption with energy in scope of policy
Source: DECC analysis of DECC Energy Statistics and the National Energy Efficiency Data framework (NEED) Total transport energy consumption in 2012 was 621TWh, of which 473TWh was used by surface transport (road and rail transport) and 148TWh by aviation and shipping. We have assumed that ESOS will not lead to energy savings in the aviation and shipping sectors, although they do incur costs. Aviation is highly energy intensive and so is likely to have made cost effective efficiencies already where these are available. There is currently
18
Organisations in scope of ESOS will be required to measure energy consumption for journeys that begin and/or end in the UK. To
estimate the amount of energy this equates to would require making certain assumptions, due to lack of complete information on aviation and shipping journeys. Given that we assume (see Section 6.4.7) aviation and shipping will not make savings as a result of ESOS, and including this amount of energy in our estimate of energy in scope of the policy does not therefore impact on our headline cost-benefit estimates, we exclude aviation and shipping energy from our estimate of energy in scope. 19
Energy Consumption in the UK 2013, Table 1.14a, http://www.decc.gov.uk/en/content/cms/statistics/publications/ecuk/ecuk.aspx.
Industrial sector energy use from buildings is assumed to include space heating, lighting, refrigeration and other.

23
very limited evidence on the potential for energy efficiency improvements in the sector. Business Innovation and Skills (BIS) statistics20 suggest there are no large shipping freight businesses which would be affected by the policy but that ten sea and coastal passenger transport businesses would need to comply.
6.1.5. Energy efficiency potential in scope of the policy The Energy Efficiency Strategy identified 196TWh of socially cost effective energy savings that could be delivered through energy efficiency by 2020. Analysis of the same datasets indicates there is around 47TWh of potential savings from non-domestic buildings and industrial processes in scope of the policy in 2015 (once the impact of existing policies has been accounted for, see Annex A for details). For the non-domestic building sector the majority of the savings are from improved lighting and heating systems and controls, but also include building fabric improvements and more efficient products and appliances. In the industrial process sector, savings can be made from a wide range of measures such as installing more efficient machinery in industrial plants or using waste heat more effectively. For the building sector, the estimate of technical potential is based on the Non-Domestic Energy and Emission Model (N-DEEM) dataset, which provides data on the total potential in non-domestic buildings and the associated capital costs. The costs are incurred upfront, and have been adjusted to include the cost of replacement for measures with a lifetime of less than 15 years (the time period of the cost benefit analysis). For industrial processes, cost and potential estimates are based on a number of datasets from AEA and Arup. Further details of the data sources can be found in Annex A. These estimates are based on the assumption that technical potential is distributed between SME and Non-SME firms in proportion to their energy use. This will overestimate technical potential in scope if large enterprises have implemented more energy efficiency measures than SMEs. In addition to this physical technical potential, there is often considerable scope for energy efficiency improvements to be made using equipment already in place. For example, better management of building space and water heating systems using existing controls or turning off electric systems overnight can often significantly reduce energy consumption. The potential energy saving from these behavioural and energy management measures has not been included in the analysis as there is currently little robust evidence of the scale of the contribution they can make to improving energy efficiency in large enterprises. Analysis of the Carbon Trust’s energy efficiency database published alongside this Impact Assessment suggests that behavioural measures account for a large proportion of measures implemented by organisations to have received an energy audit, but that these measures have lower persistence factors and thus account for a smaller proportion of total energy savings from audits. There is currently no comprehensive data on the potential for further energy efficiency improvements in the transport sector, or the proportion of this that might be in scope of existing policy. However, there are actions that could be taken to reduce fuel consumption for different vehicle types. These may involve changes in fleet policy, driving behaviour or operations as well as the uptake of technology measures to reduce fuel consumption.
20
BIS Business Population Statistics 2012 (Sea and Coastal Water Transport): https://www.gov.uk/government/collections/business-population-estimates

24
The Energy Savings Trust’s (EST) work carrying out Green Fleet Reviews gives us an indication of what types of recommendations could be made by ESOS assessors in relation to cars and vans (see box 3). These measures range from changes to fleet management and policy to the purchase of low emission vehicles. There may also be recommendations aimed at improving the energy efficiency of a company’s grey fleet (cars or vans owned by employees used for business purposes) through changing how the business reimburses employees for travel or fuel costs. Other recommendations might focus on driver behaviour and incentives to reduce fuel consumption. For HGVs, research for the Department for Transport and the Low Carbon Vehicle Partnership by Ricardo and AEA21 suggests that there are a number of technologies that could deliver fuel efficiency savings. In addition, industry bodies such as the Freight Transport Association (FTA) and the Road Haulage Association (RHA) have identified other measures relating to driver training and performance monitoring, logistics efficiency and modal shift which may reduce fuel consumption. As with road vehicles, there are a number of measures that may be implemented to improve the fuel efficiency of trains. These range from technologies such as regenerative braking on electric trains to behavioural measures such as eco-driver training. However, as discussed in Section 6.4.5, the Impact Assessment assumes there are no significant energy savings from the rail sector. Box 3 Energy Saving Trust – Green Fleet Consultancy
The Energy Saving Trust receives funding from DfT to carry out a number of activities including Green Fleet Consultancy. EST carries out Green Fleet Reviews, essentially tailored audits of a business’s car or van fleet. These involve detailed scrutiny of the available data on the fleet, including:
Vehicles in the fleet
Mileage
Drive cycles
Fuel consumption As part of the Review, EST makes a suite of recommendations tailored to the individual business and its fleet. The recommendations made will depend on the payback period faced by a particular firm. For example, exemption from the congestion charge for ultra-low emission vehicles in London may make buying such cars for a London-based fleet a cost-effective choice. Other recommendations include changes to fleet policy or fleet management such as the types of vehicles purchased; the lifetime of those vehicles or the ability of users to choose their own vehicles; the use of fuel cards for recording fuel purchases; and technologies such as telematics and speed limiters. Analysis of Green Fleet Reviews carried out in 2011/12 suggest that measures taken up led to a saving of 58 litres of fuel per vehicle per annum across the 8500 vehicles covered by the review. EST have identified several barriers that may prevent recommended measures being taken up from the Fleet Reviews including the upfront cost faced by business, the
21
Review of Low Carbon Technologies for Heavy Goods Vehicles, Ricardo Plc (2010)
Technology Roadmap for Low Carbon HGVs, Ricardo Plc (2010) Market Background Study, AEA Technology Plc (2010)

25
operational requirements of the business, lack of engagement from senior management and employee attitudes
6.2. Policy context There are a number of other policies which will interact, and in some cases overlap, with ESOS. These include the:
CRC Energy Efficiency Scheme (CRC),
Climate Change Agreements (CCAs) and the Climate Change Levy (CCL),
Mandatory Greenhouse Gas reporting,
Non-domestic Green Deal,
Display Energy Certificates (DECs),
Energy Performance Certificates (EPCs),
Smart Meters
Enhanced Capital Allowances (ECAs),
Products policy (including EU minimum standards and energy performance
labelling),
Building regulations,
EU Emissions Trading System (ETS),
the Carbon Price Floor (CPF),
EU new car and van CO2 regulations,
Green Bus Fund,
Energy Efficiency Design Index for new ships, and
Industry-led action to reduce emissions in the freight sector.
A key uncertainty is what the additional impact of ESOS will be over and above these policies. The analysis assumes that the impact of the ESOS will be smaller where an existing policy is already acting to improve energy efficiency. However, the requirements of Article 8 go beyond the scope of existing policies; they will cover a larger proportion of energy demand than existing comparable policies and require the production of detailed recommendations for improving energy efficiency, which existing policies do not. The introduction of ESOS is therefore expected to have an additional impact on energy efficiency, even for enterprises already covered by existing policies. That there are other policies acting to improve energy efficiency makes it difficult to estimate the impact of ESOS on energy efficiency over time. Some of the recommendations that are implemented as a result of an ESOS assessment may have been implemented in the future anyway as a result of these policies, and/or because of increasing energy prices. We have taken account of this in our analysis, discussed further in section 6.4.9 of this Impact Assessment. The analysis in Annex F sets out in detail how the ESOS will fit into the existing policy landscape. This section focuses on how the interaction with existing policies will affect the costs and benefits of ESOS. The analysis focused on the overlaps with the CRC, CCA and GHG reporting, as these are the most comparable policies in terms of scale, and types of enterprises affected.

26
A number of existing policies already require firms to measure some of their energy use, as part of the reporting process (for example, CRC, CCAs and mandatory Greenhouse Gas reporting). Given that ESOS assessment should be able to rely on these existing data collection systems and results, these enterprises should face lower data collection costs. Analysis of 2010-2011 CRC reporting data suggests there are between 4,400 and 6,400 large enterprises that are already reporting on their energy use under existing policies (with a central estimate of 5,400). This estimate is based on the following assumptions:
All enterprises in the CRC are large enterprises (when in reality some may be SMEs that use large amounts of energy),
For the low estimate, each Significant Group Undertaking22 is a large enterprise
For the high estimate, the average number of large enterprises per Significant Group Undertaking is 1.4723, and
All enterprises reporting under mandatory Greenhouse Gas reporting are also covered by the CRC24.
all large enterprises reporting under CCAs but not CRC will still face additional data collection costs (the data collected for CCA will not necessary be sufficient given it focuses on specific plants)
The central estimate has been validated using a comparison of Environment Agency CRC data collected in 2006 with Companies’ House data on enterprise employment. The Venn diagrams below illustrate the proportion of energy used by large commercial and industrial enterprises in 2010 (excluding transportation energy use) that is currently being measured and reported on under the CRC, CCA and ETS. The details of how these estimates were made can be found in Annex F.
22
A Significant Group Undertaking (SGU) is a subsidiary of a CRC participant that would be eligible to participate in their own right were
they not part of a group. 23
The CRC database includes data on the number of CCA facilities owned by CRC participants. Of firms that own at least one CCA
facility, the average number is 1.47. The estimate of 6,400 large enterprises in the CRC is based on the assumption that each CCA facility is a large enterprise., and that the same ratio holds for the rest of the CRC SGUs, 24
Annex C of the Final Impact Assessment of Mandatory Greenhouse Gas Reporting stated that 60 large organisations which were not
already reporting under the CRC, CCAs or voluntarily would be covered by the GHG reporting requirements. That assessment was based on the assumption that 2017 firms are covered by the CRC. This Impact Assessment estimates there are between 4,400 and 6,400 large enterprises reporting under the CRC, and so has assumed a full overlap between CRC and GHG reporting.

27
There are a number of policies in the transport sector aimed at reducing fuel consumption. EU regulations have set targets for improved fuel efficiency for cars and light goods vehicles (vans) out to 2020. The energy consumption baseline forecast used in this Impact Assessment takes account of the improvement in average fleet fuel efficiency out to 2020, and assumes that, post-2020, continued improvement is seen across the fleet due to fleet turnover. The energy consumption baseline forecast also assumes that voluntary action by the road freight industry leads HGVs to improve their fuel efficiency by 5% between 2010 and 2015 with diminishing impacts thereafter. Schemes like the FTA’s Logistics Carbon Reduction Scheme, in which businesses monitor and report their fuel consumption, vehicle fleet data and fleet operations, are estimated to cover around 8.5% of UK HGVs and the FTA estimates that around a third of the scheme’s members are non-SME businesses. For these businesses in particular, any additional impact of being assessed is expected to be small. For buses, the Green Bus Fund provides funding to bus operators to support the purchase of low-emission buses. The baseline energy consumption forecasts used for the analysis already assume that the fund drives uptake of low-emission buses out to 2030, and as a result there may be less scope to reduce emissions further.
6.3. Counterfactual The UK is required to comply with the Energy Efficiency Directive, meaning there is no ‘do nothing’ option. The NPV and Cost to Business presented on pages 2-6 of the Impact Assessment uses the ‘least cost’ minimum requirement option (Option 1) as the counterfactual. However, the Impact Assessment also includes an assessment of the costs and benefits of the minimum requirements option. The minimum requirements option is compared against a ‘no directive’ baseline and provides an estimate of the net impact of the Article 8 requirement on the UK (in line with Impact Assessment guidance).25
25
https://www.gov.uk/government/publications/better-regulation-framework-manual

28
There is already an existing market for energy auditing services, although little data is available on it scale. The Green Deal business survey, published in 2011,26 asked a number of questions about energy efficiency and included a sample of 277 businesses with more than 250 employees. It found that;
26% of these firms had sought advice from a specialist energy consultant or auditor,
33% had requested advice from the Carbon Trust,
A further 11% had sought advice from both
49% of these businesses reported having an energy audit or assessment (although these were likely to have been less extensive than will be required under the Directive).
The most appropriate comparison with the requirements of the Directive is seeking advice from specialist energy consultants. However, it’s not clear whether the energy assessments these firms refer to were conducted within the last four years, or if they covered the whole enterprise (as opposed to an individual building or industrial process). As mentioned above in Section 5, 40 enterprises already have ISO 50001 and around 300 large enterprises27 have the Carbon Trust standard. Given the absence of clear data on the current take up of comparable audits by large enterprises, the ‘no directive’ counterfactual scenario uses the illustrative assumption that 25% of firms (around 2,20028) in scope of the policy will already have conducted an energy audit. These enterprises are assumed to conduct an audit or implement a qualifying EMS irrespective of the whether the policy is implemented. The cost and benefits of the policy have therefore been adjusted down by 25% (with the exception of the cost of the accreditation and enforcement regime and the administrative burden of demonstrating compliance, which will be incurred by all large enterprises). This 25% reduction is applied evenly to all energy and enterprises, irrespective for whether they are covered by existing policy. Since this assumption impacts significantly on the estimated costs and benefits of the policy, we have undertaken a sensitivity analysis to show the impact of adjusting for the counterfactual using a 50% assumption. Increasing the counterfactual assumption from 25 to 50% reduces the NPV from £1.6bn to £1.1bn.
6.4. Benefits The introduction of the ESOS will have a number of benefits. By addressing the information market failures, the policy will lead some firms that had previously not considered investing resources in improving their energy efficiency (as they were unaware of the opportunities) to reduce their energy costs (and increase profits). There will also be a range of wider social benefits. Improvements in the energy efficiency of UK businesses will increase productivity, economic growth and international competitiveness. Reductions in energy consumption will also lead to lower non-traded CO2 emissions, better air quality, and reduce the number of EU ETS allowances UK businesses need to buy. These are all indirect benefits as they result from the implementation of assessment recommendations, rather than the assessments themselves.
26
Green Deal Business Survey; https://www.gov.uk/government/consultations/the-green-deal-and-energy-company-obligation 27
This figure represents the Carbon Trust’s best estimate of the number of Carbon Trust standard bearers that are non-SMEs as at
31/12/2013. 28
This is 25% of the estimated number of audits to be undertaken (approach set out in Annex H), as opposed to 25% of organisations
in scope of ESOS.

29
There is limited evidence available of the impact of ESOS assessments on enterprises’ energy consumption. The estimated benefits presented in this Impact Assessment are based on an illustrative assumption of what the average impact of ESOS assessments will be on energy consumption. This assumption is informed by a range of evidence sources including a review of the academic literature, research into comparable schemes and data on the impact of existing energy audit products. This section reviews the evidence available and sets out how the high-level assumption has been used to estimate the energy saving under ESOS (taking into account the existing policy landscape).
6.4.1. European Commission Impact Assessment The European Commission Impact Assessment published in June 2011 presented an estimate of the energy savings resulting from energy audits.29 The Impact Assessment first estimated the share of energy use that would fall within the scope of this measure. It then used a number of illustrative assumptions to calculate the energy savings delivered, depending on the extent to which businesses within Member States were already conducing energy audits, and the level of policy support provided for implementing recommendations. This analysis suggested the saving would be between 0.4% and 5% of total energy demand, with a central estimate of 3%. Given the UK already has a number of policies in place to tackle the market failures in this sector, it is reasonable to assume that the impact in the UK will be towards the lower end of the range presented by the Commission.
6.4.2. Review of academic literature DECC published a literature review of non-domestic sector interventions in 2012.30 This highlighted a number of studies into the impact of existing energy auditing policies in other countries. The programmes studied are all different and the studies themselves use a variety of different methodologies. Significantly, the programmes were all voluntary, meaning the results are likely to be affected by self-selection bias; firms that chose to take part would already have been interested in improving their energy efficiency, and so would have been more likely to implement recommendations than under a mandatory scheme. The programmes were also typically targeted at SMEs, which face slightly different barriers to energy efficiency than the large enterprises within the scope of this policy. However, the studies do provide some evidence of the impact of energy auditing policies, including the number of recommendations typically adopted, the required payback period for energy efficient projects and the energy savings that were delivered. The key finding are summarised below:
Anderson and Newell (2004)31 show a 53% uptake of measures among the sample of 9,034 SMEs which took part in a US Government reporting project that ran from 1981 to 2000. They found that the average cost of implementing an energy efficiency project was $7,400 and the average payback period was 1.29 years.
29
http://ec.europa.eu/energy/efficiency/eed/doc/2011_directive/sec_2011_0779_impact_assessment.pdf , page 48 30
https://www.gov.uk/government/publications/factors-influencing-energy-behaviours-and-decision-making-in-the-non-domestic-sector-
a-rapid-evidence-assessment 31
Anderson, S.T. & Newell, R.G., 2004. Information programs for technology adoption: the case of energy-efficiency audits, Resource
and Energy Economics.

30
Harris et al (2000)32 found a take up rate of 81% among a sample of 100 typically large firms who took part in an Australian Government audit programme which ran for 6 years until 1997.
Thollander et al (2007)33 found a take up rate of 22% for actual implemented measures (44% for actual and planned measures) among 47 SMEs who took part in the evaluation of the Swedish free audit programme. Recommendations actually implemented led to a 3.8% energy saving (which rises to 8.8% when both actual and planned measures are counted).
Bradford and Fraser (2008)34 report that 53% of a sample of 112 SMEs in Leeds adopted energy efficiency measures.
More details on these academic studies can be found in Annex G
6.4.3. Review of Australian energy auditing programme The Australian Government launched an audit programme called “Energy Efficiency Opportunities” in 2006. The programme is mandatory and covers large private sector energy users.35 By 2011, the audits covered 92% of total energy used by businesses captured by the programme. The recommendations made as part of the audit process were very specific, focused on measures with a payback of less than four years and included a cost-benefit analysis. The programme’s coverage is narrower than ESOS in terms of organisations (and energy use) in scope. The end of the cycle review, published in 201336, found that, in the period up to 2011, firms had committed or already implemented around 54% of the identified energy opportunities.37 The review suggested the average savings were around 5% of energy covered, although these savings were unadjusted, meaning they were not corrected for the possibility that some of the savings may have been achieved even in the absence of the programme. Out of these savings, the programme review concluded that approximately 41% of the total energy efficiency improvements were additional benefits driven by the EEO programme, suggesting the total additional savings were around 2%.
6.4.4. Research into Display Energy Certificates DECC commissioned a qualitative research project on Display Energy Certificates (DECs) in 2012. The research involved in-depth qualitative interviews and case studies with 23 public sector organisations and 15 private sector organisations. The research found that one of the more significant benefits of DECs was the actual process of data collection required to acquire a DEC. This raised awareness of energy use and encouraged monitoring among organisations that had not previously given much thought to energy efficiency.
32
Harris, J, Anderson, J. & Shafron, W., 2000. Investment in energy efficiency: A survey of Australian firms, Australian Bureau of
Agricultural and Resource Economics, GPO Box 1563, Canberra, ACT 2601, Australia. 33
Thollander, Patrik, Danestig, M. & Rohdin, Patrik, 2007. Energy policies for increased industrial energy efficiency: Evaluation of a
local energy programme for manufacturing SMEs. 34
Bradford, J. & Fraser, E.D.G., 2008. Local authorities, climate change and small and medium enterprises: Identifying effective policy
instruments to reduce energy use and carbon emissions, University of Leeds, Sustainability Research Institute, Leeds, United Kingdom. 35
Energy use greater than 0.5PJ/year (139 GWh/year) 36
http://eeo.govspace.gov.au/files/2013/05/EEO-Program-Review-Final-Report.pdf [accessed 11 June 2013] 37
In 2011, 89PJ out of 164PJ identified were implemented or committed to be implemented.

31
For organisations already trying to improve their energy efficiency DECs were useful for pointing out there worst-performing buildings. The information provided was also a useful tool for facilities managers to use internally when making the case for investing in energy efficiency measures. However, while the advisory report should provide detailed recommendations with a range of timescales, organisations did not consider that in their experience this was the case. They wanted information and guidance that was more readily useable with advice that was tailored to the building and the budget available, recommendations that were achievable according to the level of investment the organisation was willing to make, and an explicit and an accurate discussion of the costs and benefits of the recommended changes. DECC has also published statistical analysis of the impact of DECs38. The analysis used data on DECs logged at 48,000 unique premises up to December 2012. The analysis found that energy intensity (energy consumption per meter squared of floor space) fell by 2% more between 2008 and 2009 for public sector offices with a DEC than comparable private sector offices. This comparison provides tentative evidence to suggest that DECs in particular have had a slight impact on the energy performance of properties. However, the analysis was not able to control for a large number of other factors affecting public sector building use over this period. In addition, the tentative conclusions cannot necessarily be applied across the non-domestic sector, given that there are likely to be different drivers of energy efficiency in private and public sector organisations.
6.4.5. Analysis of the Carbon Trust’s database of energy efficiency audits The Carbon Trust has a database containing detailed information about recommendations made to Carbon Trust customers following the provision of energy efficiency audits. DECC recently commissioned the Carbon Trust to produce an analysis of their database to draw out key metrics to inform our cost-benefit analysis of ESOS.
The Carbon Trust analysis has been published in full alongside this Impact Assessment. Key findings include:
The average annual saving achieved by large enterprises as a result of a Carbon Trust audits is 1,742 MWh, or £88,100
The average take up rate of recommendations made by the Carbon Trust to large enterprises is 29%
80% of energy savings achieved through Carbon Trust audits are from measures that have a 2 year payback or less 6.4.6. Evidence on energy savings highlighted through the consultation
One respondent to the consultation highlighted evidence relevant to estimating the potential energy savings from ESOS assessments. Utilitywise highlighted the following evidence, which is based on their 481 most-recently conducted energy audits:
The average saving in energy expenditure as result of Utilitywise’s audits is £6,421
The represents a saving of 12.8% of total energy spend
The average payback period of measures implemented is 3.5 years
38
https://www.gov.uk/government/publications/energy-trends-june-2013-special-feature-articles-display-energy-certificates

32
Following their initial consultation response Utilitywise isolated non-SMEs39 from their sample in order to show that:
The average saving in energy expenditure for non-SMEs is 4.5%
This represents a saving of 5.9% of total energy consumption 6.4.7. Estimated energy savings from ESOS assessments
As set out in the Energy Efficiency Strategy, there are a range of complex factors that lead enterprises to improve the energy efficiency of their operations. For the purposes of this Impact Assessment, a simple conceptual framework has been used to model the impact of the policy on the take up of energy efficiency measures. Three broad drivers of energy efficiency take up have been identified (as illustrated in Figure 2 below):
Measurement, which improves firms understanding of how much their energy use is costing them
Auditing, which combines measurement of energy use with clear recommendations on actions to take
Reporting, which creates a reputational driver to implement recommendations for consumer facing enterprises
Figure 2: Illustration of key drivers of energy savings
For the purposes of this Impact Assessment, the estimates of energy savings are calculated using 3 illustrative assumptions.
For enterprises that are currently not measuring their energy use in detail, an ESOS assessment will result in an average energy saving of 1% of consumption from measurement alone.
In addition, the presentation of detailed recommendations on what enterprises could do to improve their energy efficiency will lead to an additional energy saving of 1%.40
39
Using an approximation for non-SME defined as a client whose electricity consumption is 5GW, meaning these results are less
applicable to ESOS than they would have been had they been based on the legal definition of non-SME used by the Directive. 40
This is equivalent to 1 in 10 organisations implementing recommendations that reduce their energy consumption by 10%

33
ESOS assessment will have a lower impact on energy intensive enterprises as the information market failures are likely to be less significant in these sectors.
These illustrative assumptions are informed by the evidence available, but not directly based on them, given that the ESOS is unlikely to be directly comparable with the examples set out above. For example, organisations who received an energy audit from the Carbon Trust by definition will have been seeking to identify energy saving opportunities, and will have been under no legal obligation to audit their energy use. For this reason, the level of energy savings realised from energy audits undertaken by the Carbon Trust (likewise, Utilitywise) cannot be assumed under ESOS, as there will be a proportion of organisations who have little or no desire to act on recommendations made by an ESOS assessment. In the context of the available evidence on the impact of energy audits therefore our assumptions are conservative, in that they assume a lower level of energy saving than that observed under various other schemes. At the same time, our assumptions fall within (towards the lower end of) the range used by the European Commission for Article 8 of the Directive.
6.4.7.1. Buildings and industrial processes The analysis of coverage of existing policies has been used to estimate the energy savings from the implementation recommendations in buildings and industrial processes. ESOS assessments are assumed to:
Have no impact on energy covered by CCAs or used by the fuel industry. 41 These firms are typically energy intensive (meaning energy is a higher proportion of their costs) and so less likely to be affected by information market failures. The CCAs and the EU ETS are also expected to capture most of the savings that would have been delivered as a result of an ESOS assessment.
Lead to 1% reduction in demand for energy covered by another policy instrument. These firms are already measuring their energy use however the requirements of ESOS go beyond the scope of existing policies; they will cover a larger proportion of energy demand than existing comparable policies and require the production of detailed recommendations for improving energy efficiency, which existing policies do not
Lead to 2% reduction in demand for energy not covered by existing policy instrument. These firms will benefit from ESOS assessments providing them with both accurate information on how much energy they are using, and detailed recommendations on how to reduce consumption through energy efficiency measures.
Figure 3 shows the proportion of projected energy demand that is covered by existing policy in the counterfactual scenario (based on the assumption that the share remains constant over time).42 Based on the assumption set out above, the average reduction in energy consumption in scope of the policy is 0.7% in 201643.
41
This only accounts for the energy used by plants covered by CCAs. Energy used by the wider organisations that own these plants
(for example, in there HQ) is assumed to be affected by ESOS assessments. 42
The projections are based on DECC Energy & Emissions Projections 2013, and so include the impact of existing policies 43
While organisations in scope of ESOS are required to undertake an assessment by December 2015, we assume that any
recommendations which organisations decide to act on that require investment by the organisation (non-behavioural measures) will be rolled over to FY 2016 due to the need to get internal approval for the spend, as well as other lag factors.

34
Figure 3: Proportion of non-domestic buildings and industrial process energy consumption in scope of the policy
Source: DECC Energy & Emissions 2013 baseline projections adjusted to account for energy in scope of policy Table 3 sets out the estimated energy savings from buildings and industrial processes as a result of ESOS assessments, based on the assumptions set out above, which is 2.3TWh in 2016 in the buildings and industrial processes sector. This ‘top down’ estimate of the total savings has been compared against a ‘bottom up’ analysis of the potential for energy efficiency. As discussed in Section 6.1.5, the cost effective potential for energy savings from physical measures (for example, more efficient lighting systems or industrial equipment) is estimated to be around 47TWh in 201544 in the buildings and industrial processes sector. Research suggests that firms typically require short payback periods in order make energy efficiency investments. The bottom up analysis therefore excludes all the potential savings with a payback of more than 2 years (leaving around 43TWh), on the basis that assessors will focus on only the most cost effective opportunities when making recommendations. This is equivalent to assuming that ESOS assessments identify cost effective savings of 14% of energy use on average (i.e. an average saving of 14% would be delivered if all assessor recommendations were implemented). This analysis excludes the considerable potential for energy savings from behavioural measures (including better energy management) which may be recommended ahead of physical measures. It also excludes potential savings from new technologies developed over the period 2016 to 2030. The comparison suggests the annual 2.3TWh energy saving estimated using the high level assumption is equivalent to 5% the potential energy savings identified actually being implemented in the buildings and industrial processes sector. This
44
Cost effective potential in 2015, as opposed to 2016, is used as this is the year in which the ESOS assessment will take place (even
though we expect savings to be realised from 2016).
-
50
100
150
200
250
300
350
400
450
500
2016 2019 2022 2025 2028
Ind
ust
ry a
nd
co
mm
erc
ial
No
n-S
ME'
s e
ne
rgy
de
man
d (
TWh
)
Energy use not covered by existing policiesEnergy use which is measured (CRC, ETS)Energy use covered by CCAEnergy use in fuel industry

35
take-up rate is generally lower than what has been observed in other auditing programmes. The energy saving assumption has a significant impact on the overall results of the cost benefit analysis. The analysis therefore uses a range (+/- 50% of the central scenario) to test the sensitivity of the final results to this assumption. The total energy saving under the high and low ‘take-up rate’ scenarios are also shown in Table 3. Table 3: Comparison of top down estimate of energy savings with bottom up estimate of potential in buildings and industrial processes
Low take-up
scenario Central
scenario High take-up
scenario
Energy saving in 2016 (TWh) 1.1 2.3 3.4
Technical potential for energy savings in 2016 (TWh)
47 47 47
Technical potential likely to be included in recommendations (TWh)
43 43 43
Indicative take up rate of recommendations
3% 5% 8%
Source: DECC analysis
6.4.7.2. Energy savings in transport sector For transport intensive industries (rail, bus and coach, road haulage), fuel costs make up a significant proportion of total costs meaning businesses in these sectors are likely to have already taken steps to make efficiencies and reduce costs. For transport services45 as a whole, energy cost is estimated to be 10% of total expenditure, compared to 20% for the Iron and Steel sector, 4% for other industrial sectors and 2% for other services. Enterprises are more likely to have invested in gathering information on how energy efficiency improvements can be made, meaning the information market failures will be less significant in these sectors (and therefore the impact of ESOS assessments will be proportionally smaller). In addition, the rail industry in particular is highly specialised and it seems very unlikely that an independent assessor would be able to make new recommendations to the industry that have not already been considered and/or implemented. For this Impact Assessment, illustrative assumptions have been used to estimate the energy savings from ESOS assessments, which vary depending on the mode of transport. Figure 4 illustrates the estimated surface transport energy use of large enterprises broken down by mode of transport (see Annex E for details). In the transportation sector, ESOS assessments are assumed to:
Have no impact on energy consumption by rail, aviation, shipping or business travel in household-owned cars,
Lead to 1% reduction in energy consumption by vans, heavy good vehicles and buses & coaches,
45
DECC analysis of Office for National Statistics data. Data for the non-domestic sector sourced from secondary analysis of the 2009 Supply Use Tables produced by the Office for National Statistics (ONS) as part of the National Accounts. The transport services sector is defined as organisations which identify their primary business activity as transportation. This is experimental analysis and as such each sector has an associated margin of error. Total expenditure is defined as final consumption expenditure plus the compensation of employees and non-deductible VAT. Gross capital formation has been excluded from this definition of expenditure.

36
Lead to 2% reduction in energy consumption for business travel in company car fleets.
Figure 4: Proportion of transport energy consumption in scope of the policy
Source: DfT analysis of DECC Energy & Emissions 2013
6.4.8. The impact of reporting requirements on energy savings There may be differences in the benefits of the various policy options considered in this Impact Assessment due to differences in their reporting requirements. For instance, the requirement to publicly disclose the results of an ESOS assessment (under Option 3) may create a reputational driver to implement energy efficiency recommendations for consumer facing enterprises or through shareholder pressure; and a competitiveness driver through increasing awareness and understanding of the potential cost savings through implementing energy efficiency measures. On the other hand, company concern about releasing performance information can lead to selective information release, aimed at portraying a positive corporate image, which can undermine the incentive to take positive steps to increase energy efficiency.46 In the absence of clear evidence on which to base an assessment of the likely difference in energy savings for the different policy options, we commissioned a research consultancy to undertake a Rapid Evidence Review on the impact of central and public disclosure methods for reporting energy use and energy efficiency, to inform the analysis in this Impact Assessment. A full copy of their report has been published alongside this Impact Assessment. While the report identified evidence indicating that certain features of reporting and disclosure schemes can drive positive behaviour change in certain contexts,
46
This potential effect of disclosure is identified by Eunomia in their report, ‘Evidence Review on the Impact of Central and Public
Disclosure Methods for Reporting Energy Use and Energy Efficiency’, published alongside this Impact Assessment.
-
20
40
60
80
100
120
2015 2018 2021 2024 2027 2030
Tran
spo
rt
No
n-S
ME'
s e
ne
rgy
de
man
d (
TWh
)
Non SME Rail Non SME PSVs Non SME HGVs Non SME LGVs Non SME Cars
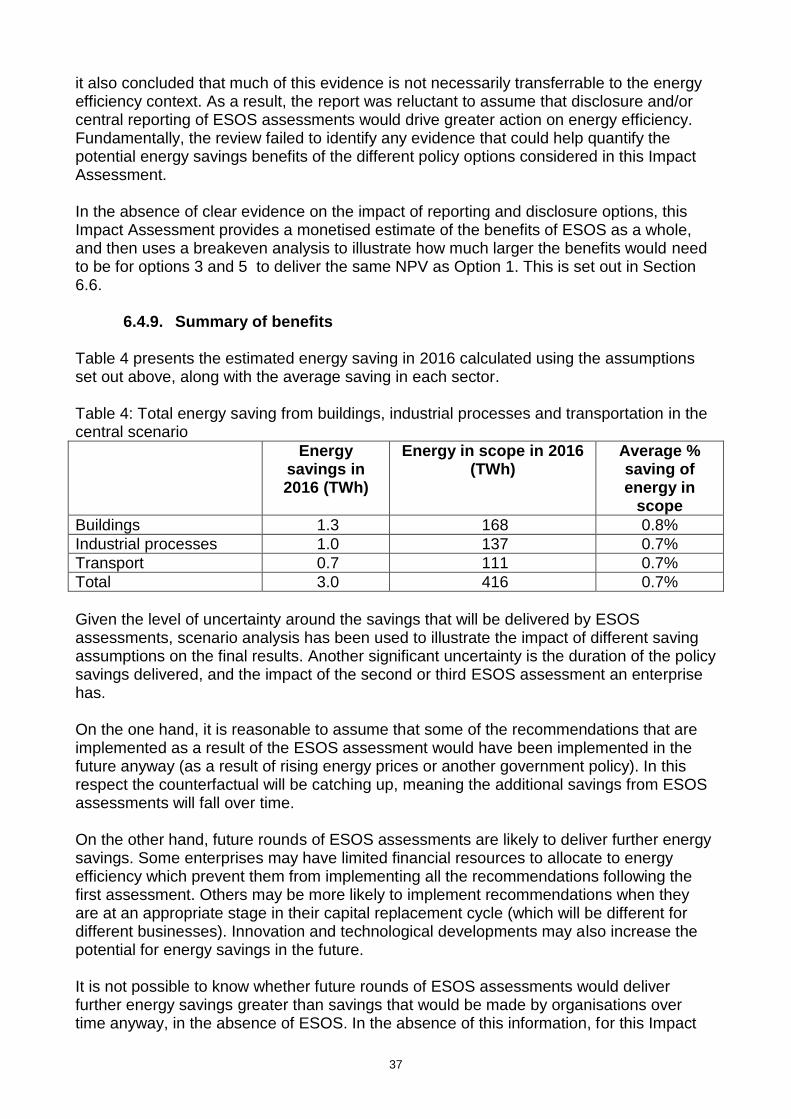
37
it also concluded that much of this evidence is not necessarily transferrable to the energy efficiency context. As a result, the report was reluctant to assume that disclosure and/or central reporting of ESOS assessments would drive greater action on energy efficiency. Fundamentally, the review failed to identify any evidence that could help quantify the potential energy savings benefits of the different policy options considered in this Impact Assessment. In the absence of clear evidence on the impact of reporting and disclosure options, this Impact Assessment provides a monetised estimate of the benefits of ESOS as a whole, and then uses a breakeven analysis to illustrate how much larger the benefits would need to be for options 3 and 5 to deliver the same NPV as Option 1. This is set out in Section 6.6.
6.4.9. Summary of benefits
Table 4 presents the estimated energy saving in 2016 calculated using the assumptions set out above, along with the average saving in each sector. Table 4: Total energy saving from buildings, industrial processes and transportation in the central scenario
Energy savings in 2016 (TWh)
Energy in scope in 2016 (TWh)
Average % saving of energy in
scope
Buildings 1.3 168 0.8%
Industrial processes 1.0 137 0.7%
Transport 0.7 111 0.7%
Total 3.0 416 0.7%
Given the level of uncertainty around the savings that will be delivered by ESOS assessments, scenario analysis has been used to illustrate the impact of different saving assumptions on the final results. Another significant uncertainty is the duration of the policy savings delivered, and the impact of the second or third ESOS assessment an enterprise has. On the one hand, it is reasonable to assume that some of the recommendations that are implemented as a result of the ESOS assessment would have been implemented in the future anyway (as a result of rising energy prices or another government policy). In this respect the counterfactual will be catching up, meaning the additional savings from ESOS assessments will fall over time. On the other hand, future rounds of ESOS assessments are likely to deliver further energy savings. Some enterprises may have limited financial resources to allocate to energy efficiency which prevent them from implementing all the recommendations following the first assessment. Others may be more likely to implement recommendations when they are at an appropriate stage in their capital replacement cycle (which will be different for different businesses). Innovation and technological developments may also increase the potential for energy savings in the future. It is not possible to know whether future rounds of ESOS assessments would deliver further energy savings greater than savings that would be made by organisations over time anyway, in the absence of ESOS. In the absence of this information, for this Impact

38
Assessment we have assumed that the energy savings are constant over time; there are no additional savings from future ESOS assessments, but savings delivered in 2016 persist until 2030.47 A visual representation of this is shown in Figure 5 in section 6.6 of this Impact Assessment. We have included a sensitivity scenario to illustrate the impact of this assumption on the final results (see Section 8 for details).
6.5. Costs The implementation of the ESOS will create a number of costs to business and government. The direct costs include:
Assessment costs: the cost of employing an ESOS assessor to conduct the assessment itself, including conducting any site visits necessary and producing the recommendations.
Administrative burden: the cost to business of complying with the regulations, including the time taken by staff to understand the requirements, work with the assessor on site and review any recommendations made.
Accreditation and scheme administration cost: the cost of managing the accreditation and scheme administration regime.
The indirect costs are:
Capital cost: the cost of any physical measures that are installed as a result of the ESOS assessment (e.g. lighting controls or more efficient motors).
Hassle cost: the cost of the business managing the implementation of recommendations, including the time taken working with contractors to install measures and halting operations in order to make improvements.
6.5.7. Assessment costs
The cost of conducting the assessment will depend on the number of enterprises in scope of the policy, the size and complexity of their operations and the cost employing an ESOS assessor. The actual number of buildings visited will be decided by assessor on a case by case basis. The survey should be proportionate, but large enough to enable a robust assessment of the energy efficiency of the enterprise. For the purposes of the Impact Assessment we have assumed this will be:
At least one site visit per enterprise, and
5% of all other buildings
10% of all other industrial plants (given these are less homogenous than buildings in the commercial sector and so will require a larger number of visits).
The cost of each ESOS assessment is based on daily cost of an assessor multiplied by the number of days it takes to assess the sites. The ESOS assessor qualified to conduct assessments of buildings are assumed to cost £500 per day. ESOS assessments of industrial processes are expected to both take longer and require specialised ESOS assessors, which are assumed to cost £1000 per day. The above assumptions are based on discussions with a range of industry stakeholders including the Carbon Trust, ABB, Siemens, ESTA, CIBSE and members of the Expert Advisory Panel on Energy Efficiency Audits. We use the same set of assumptions for the
47
Note the savings are constant percentage of energy in scope, meaning there are slight differences in the annual energy savings
driven by changes the underlying demand projection.

39
purposes of estimating the assessment costs of each policy option in this Impact Assessment (i.e. our estimate of assessment costs is the same for all 5 policy options). Table 5 shows the assumed number of days an ESOS assessment takes for different sized buildings. Table 6 shows the duration of ESOS assessments for those sites that include an industrial process. Table 5: Duration and cost of building ESOS assessments, by site size
Size of site (m2)
<100 100 to
250 250 to
500 500 to 1,000
1,000 to 5,000
5,000 to 10,000
>10,000
Days on site
0.5 0.5 1 1 2 4 4
Days off site
0.5 0.5 2 2 4 8 8
Total cost (£)
500 500 1500 1500 3000 6000 6000
Source: Discussions with industry stakeholders Table 6: Duration and cost of industrial process ESOS assessments, by site size
Size of site (m2)
<100 100 to
250 250 to
500 500 to 1,000
1,000 to 5,000
5,000 to 10,000
>10,000
Days on site
1 1 2 2 4 8 8
Days off site
1 1 3 3 8 8 8
Total cost (£)
2000 2000 5000 5000 12000 16000 16000
Source: Discussions with industry stakeholders The time needed to assess a company’s transport operations will depend on the availability and quality of the data on its transport operations. This may vary from expenses claims for fuel purchases to detailed data on fuel consumption of the fleet in litres. EST experience of auditing car and van fleets suggested that the availability of data and the overall quality of fleet management tends to depend on the size of the fleet rather than the size of the company. The EST estimate that an audit of a company car or van fleet takes around five days. This assumes the assessment is tailored to a business’s fleet operations; a more standard auditing process might be less time-consuming. The ESOS assessment of a standard sized fleet is expect to require a similar level of expertise as building ESOS assessment, and so is assumed to also cost £500 per day. For enterprises in the transport sector (i.e. whose main business is transportation and where operations may be more complex) the cost of assessing the fleet and making recommendations is expected to take longer (10 days), and require a higher level of expertise (at a cost of around £1,000 per day). The assumptions outlined above are used to estimate to the total cost of conducting ESOS assessments, which are presented in Table 7 for the different options. Table 7: Cost of conducting ESOS assessments over the period 2015 to 2030 (4 assessments in total) (PV £m)
Options 1-5
Commercial sector 50
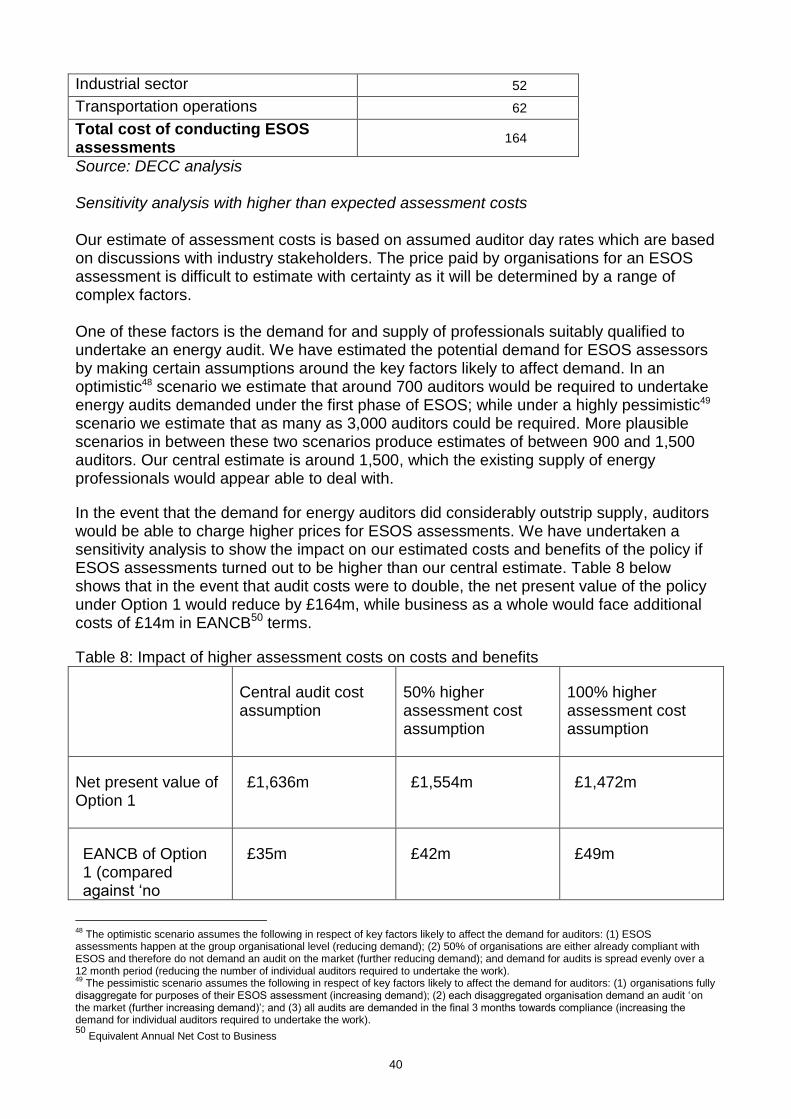
40
Industrial sector 52
Transportation operations 62
Total cost of conducting ESOS assessments
164
Source: DECC analysis Sensitivity analysis with higher than expected assessment costs Our estimate of assessment costs is based on assumed auditor day rates which are based on discussions with industry stakeholders. The price paid by organisations for an ESOS assessment is difficult to estimate with certainty as it will be determined by a range of complex factors. One of these factors is the demand for and supply of professionals suitably qualified to undertake an energy audit. We have estimated the potential demand for ESOS assessors by making certain assumptions around the key factors likely to affect demand. In an optimistic48 scenario we estimate that around 700 auditors would be required to undertake energy audits demanded under the first phase of ESOS; while under a highly pessimistic49 scenario we estimate that as many as 3,000 auditors could be required. More plausible scenarios in between these two scenarios produce estimates of between 900 and 1,500 auditors. Our central estimate is around 1,500, which the existing supply of energy professionals would appear able to deal with.
In the event that the demand for energy auditors did considerably outstrip supply, auditors would be able to charge higher prices for ESOS assessments. We have undertaken a sensitivity analysis to show the impact on our estimated costs and benefits of the policy if ESOS assessments turned out to be higher than our central estimate. Table 8 below shows that in the event that audit costs were to double, the net present value of the policy under Option 1 would reduce by £164m, while business as a whole would face additional costs of £14m in EANCB50 terms.
Table 8: Impact of higher assessment costs on costs and benefits
Central audit cost assumption
50% higher assessment cost assumption
100% higher assessment cost assumption
Net present value of Option 1
£1,636m £1,554m £1,472m
EANCB of Option 1 (compared against ‘no
£35m £42m £49m
48
The optimistic scenario assumes the following in respect of key factors likely to affect the demand for auditors: (1) ESOS assessments happen at the group organisational level (reducing demand); (2) 50% of organisations are either already compliant with ESOS and therefore do not demand an audit on the market (further reducing demand); and demand for audits is spread evenly over a 12 month period (reducing the number of individual auditors required to undertake the work). 49
The pessimistic scenario assumes the following in respect of key factors likely to affect the demand for auditors: (1) organisations fully disaggregate for purposes of their ESOS assessment (increasing demand); (2) each disaggregated organisation demand an audit ‘on the market (further increasing demand)’; and (3) all audits are demanded in the final 3 months towards compliance (increasing the demand for individual auditors required to undertake the work). 50
Equivalent Annual Net Cost to Business

41
directive’ baseline)
6.5.8. Administrative burden
The analysis has used the Standard Costs Model approach, using wage rates from the latest Annual Survey of Hours and Earnings51, to estimate administrative burden to businesses. Tables 3 and 4 in Annex C set out the tasks business will have to complete in order to comply with the regulations. Some of these costs (Understanding the requirements and Educating the organisation) are transition costs, whilst others are recurring. Most of the differences in the overall costs between Options 1 and 5 are primarily driven by the tasks that will fall to businesses. Table 9 below set out what these tasks are for each option. Table 9: Description of administrative burden to affected enterprises under each option
Option Administrative tasks
All options - Develop an understanding of what the enterprise needs to do to comply
- Recruit an ESOS assessor - Gather data on energy consumption - Accompany the assessor on site visits - Read the ESOS assessor’s report or attend a presentation - Some enterprises will go on to request and consider quotes for cost of
implementing measures52
1 and 2 - All enterprises will need to register with the scheme administrator and provide certain basic information (they are in scope and have conducted an ESOS assessment)
- A proportion will need to demonstrate compliance to the scheme administrator when asked
3 - All enterprises will need to prepare and publish a short narrative summary of the assessment finding.
- Only a small proportion will have subsequent compliance discussions with scheme administrator.
4 - All enterprises will need to register with the scheme administrator and provide certain basic information
- All enterprises will also need to process the scheme administration charge.
- A proportion will need demonstrate they have complied when asked
5 - All enterprises will need to register with the scheme administrator and report on the ESOS assessments’ findings to a central body using a standardised template.
- A proportion will need to demonstrate compliance to the scheme administrator when asked.
Where the tasks are comparable, the estimates are based on the cost of complying with the CRC.53 This is likely to overestimate the cost as the CRC is more complex for
51
http://www.ons.gov.uk/ons/rel/ashe/annual-survey-of-hours-and-earnings/index.html 52
Cost based on the assumption that half of all organisations will go on to investigate the cost of implementing recommendations 53
https://www.gov.uk/government/uploads/system/uploads/attachment_data/file/42934/4759-kpmg-assessing-admin-costs-crc-
scheme.pdf

42
businesses to administer than the ESOS will be. Where comparable cost data is not available we have used illustrative assumptions. ESOS will be developed to fit with existing energy use reporting requirements. As discussed in Section 6.2, many enterprises already collect a large proportion of the data that will be required for ESOS assessments in order to comply with existing policies (CRC, CCAs, GHG Mandatory reporting). These enterprises will therefore face lower data collection costs. Table 10 shows the average administrative burden per enterprise (split between transition and recurring costs) and the total burden for the six options. Table 10: Administrative burden on enterprises, by option
Transitional costs per
organisation
Average recurring cost per organisation (incurred every 4 years)
Total admin burden
(PV £m)
Organisations covered by existing policy
Organisations not covered by existing policy
Organisations with an audit in the counterfactual
Option 1
8,800
5,100
8,800
200
200
Option 2
5,100
8,800
200
200
Option 3
8,200
11,900
3,300
300
Option 4
5,100
8,800
200
200
Option 5
6,100
9,800
1,200
300
Source: DECC analysis The cost of conducting an ESOS assessment for an individual enterprise will vary according the size and complexity of its operations. The average cost per enterprise for the first round of ESOS assessments is estimated at around £21,000, with subsequent assessments costing around £13,000 (including the cost of the assessors’ visits and the administrative burden, but excluding the cost of implementing recommendations). Box 4, below, provides some illustrative examples showing how much an ESOS assessment could cost different enterprises. Box 4: Illustrative costs of ESOS assessments

43
The costs of conducting an ESOS assessment will vary according to the size and complexity of an organisation’s operations. The table below shows some illustrative examples that demonstrate how much an ESOS assessment might cost different types of organisation.
Estimated cost of first round of assessments per organisation
Distribution company with a 5 large warehouses and a fleet of vans
£25,000
Estate Agent with 50 small offices £17,000
High street retailer with 100 small shops £19,000
Manufacturing company with one large site £28,000
Road haulage business running a complex transport operation
£26,000
6.5.9. Capital and hassle cost of implementing recommendations The capital cost of installing the energy efficiency measures required to deliver the energy savings are set out in Table 11. For building and industrial processes, these costs are combined with the estimate of energy savings presented in Section 6.4.5 with the estimate of technical potential discussed in Section 6.1.5. The additional hassle cost of installing measures in building and industrial processes is assumed to be 20% of the capital costs54. Hassle costs have not been included for transportation measure as the capital costs are based on enterprises upgrading to more efficient vehicles as part of their fleet replacement cycle. As mentioned in Section 6.1.5; the analysis excludes the considerable potential for energy efficiency from behavioural measures. If measures recommended by the ESOS assessment do not require capital expenditure (for example, making better use of existing controls or optimising systems) then the costs of achieving energy savings will be lower. Table 11: Estimated capital and hassle cost of implementing recommendations
Buildings Industrial processes
Transportation
Total savings 2015 – 2030 (TWh) 21 16
15 Capital costs (£m PV) 57 187
458
Hassle costs (£m PV) 11 37 -
Source: DECC analysis As discussed in Section 6.1.5, there are a number of different actions which businesses may take to reduce transport energy consumption in response to ESOS assessments. For the purposes of this Impact Assessment, simplifying assumptions have been made about the measures which businesses take up in order to generate an estimate of costs.
54
This assumption is in line with the approach used by the International Energy Agency for estimating hassle costs, see: IEA, World
Energy Outlook 2012: http://www.worldenergyoutlook.org/publications/weo-2012/.

44
For cars and vans, it has been assumed that businesses change their fleet vehicle purchasing decisions, switching from the most common fleet vehicles to comparable vehicles which are more fuel efficient. In reality, it is expected that there would be a number of possible recommendations that ESOS assessors could make in relation to a business’s fleet policy and management, not all of which would involve significant capital expenditure. It is also not clear the extent to which the additional cost premium associated with more fuel-efficient cars and vans might be passed through to businesses which lease rather than buy vehicles. Therefore this estimate of costs is likely to represent the higher end of the range of possible costs. For cars, the additional cost and the fuel savings associated with switching within the lower medium size segment are used to calculate a unit cost (£/GWh saved over the lifetime of the vehicle) which is then applied to the total estimated fuel savings from cars. Based on forecast fuel prices, and assuming current vehicle excise duty bands remain in place in 2015 and beyond, the payback period associated with this capital expenditure is reasonably consistent with the usual life of a vehicle in a company fleet – around four years. For vans, vehicle specification data from the VCA database on Van CO2 and Fuel Consumption55 has been used to find comparable van models with significantly different CO2 emissions and, as with cars, data on vehicle prices used to estimate a unit cost for the energy savings over the lifetime of a vehicle. The payback period has been estimated at just less than three years. This analysis assumes that the unit cost associated with reducing fuel consumption stays constant over time. As average vehicle fuel efficiency improves over time in response to EU regulations, it is unclear how the additional cost associated with more efficient vehicles will change and this assumption may lead to either an overestimate or underestimate of costs out to 2030. In considering technological options to deliver fuel consumption savings from HGVs, different vehicle types and operations have been taken into account. Previous DfT analysis of potential emissions has drawn on the findings of two research reports commissioned by DfT in conjunction with the Low Carbon Vehicle Partnership:
Technology Roadmap for Low Carbon HGVs (Ricardo PLC, 2010)56
Market Background Study (AEA Technology PLC, 2010)57 These reports were used to develop cost-benefit analysis for the government’s Carbon Plan58 in which a number of technology measures were assumed to be taken up as a result of industry-led action to reduce HGV emissions. The baseline projection of energy consumption used in this Impact Assessment already assumes that a number of the most cost-effective technologies to reduce HGV fuel consumption have been taken up to varying degrees across the HGV fleet. The information about available technologies, fuel savings and costs only apply to some HGV vehicle types: rigid city delivery; rigid inter-urban delivery; utility vehicles; and articulated HGVs >33t gross vehicle weight. These vehicles account for about 60% of
55
http://vanfueldata.dft.gov.uk/ 56
http://www.lowcvp.org.uk/resources-library/reports-and-studies.asp?pg= 2 57
http://www.lowcvp.org.uk/resources-library/reports-and-studies.asp?pg= 2 58
https://www.gov.uk/government/publications/the-carbon-plan-reducing-greenhouse-gas-emissions--2

45
total HGV mileage. In the absence of other evidence, this cost analysis assumes technologies applied to these vehicles provide all the estimated fuel savings. In estimating costs associated with the take up of additional measures to reduce HGV fuel consumption, consideration has been given to the potential for additional take up beyond what is assumed in the baseline, as well as to the estimated payback period for individual technologies. As with cars and vans, a unit cost has been calculated for energy savings for each vehicle type listed above, and an assumption made that the estimated savings are made by the different vehicle types in proportion to their share of HGV kilometres. There is no reason to assume that savings would be made in this manner across the HGV fleet, but is an illustrative assumption designed to allow an estimate of potential costs to be made.
For buses and coaches there is new evidence that technologies are available for
retrofitting which would reduce fuel consumption and achieve a 1% energy saving. These
are the smart clutch compressor and the smart alternator both with pay back within 2
years. Evidence suggests that the potential for fuel savings is higher the older the vehicle
that the technology is applied to. Hence an average energy saving was calculated for each
technology assuming a lower estimated energy saving for newer buses and taking account
of the age distribution of buses currently being used in the public sector. An assumption
was made about the order in which the technologies would be applied to the vehicles in
order to estimate the average fuel savings and to avoid double counting of savings.
To generate an estimate of the costs of delivering the top-down savings, a unit cost
(£/GWh) based on delivering energy savings through these identified technologies was
derived.
6.5.10. Scheme administration Since being proposed in the consultation document, it has been decided that the Environment Agency will undertake the role of scheme administrator for ESOS.59 DECC is currently working with the Environment Agency (EA) to establish the cost of administering ESOS. For the purposes of this Impact Assessment, we have taken the EA’s latest headline estimate of scheme administration costs and inflated this figure to account for the estimated cost of enforcement and compliance activity in the UK’s Devolved Administrations, as this function will not be performed by the EA and is therefore not accounted for in the EA’s estimate.60 The estimated scheme administration costs during the period 2015-19 are set out below.
Year Estimated scheme administration costs (£m)
59
The consultation presented a number of options with regard to who should have responsibility for administration of ESOS. The majority of respondents (77%, 85 out of 111) stated that the Environment Agency (EA) should be appointed as the administrator for ESOS. The key themes amongst these responses include that the EA has appropriate enforcement powers to police such a scheme; the EA already administers a number of other relevant schemes such as EU ETS, CRC and CCAs; and the EA is able to remain impartial. 60
To estimate enforcement and compliance activity costs for the Devolved Administrations (DA), we adjust the Environment Agency’s
(EA’s) estimate of enforcement and compliance activity costs proportionally in line with each DA’s share of ESOS participants in the UK. We then add these estimates to the EA’s headline estimate of scheme administration costs.
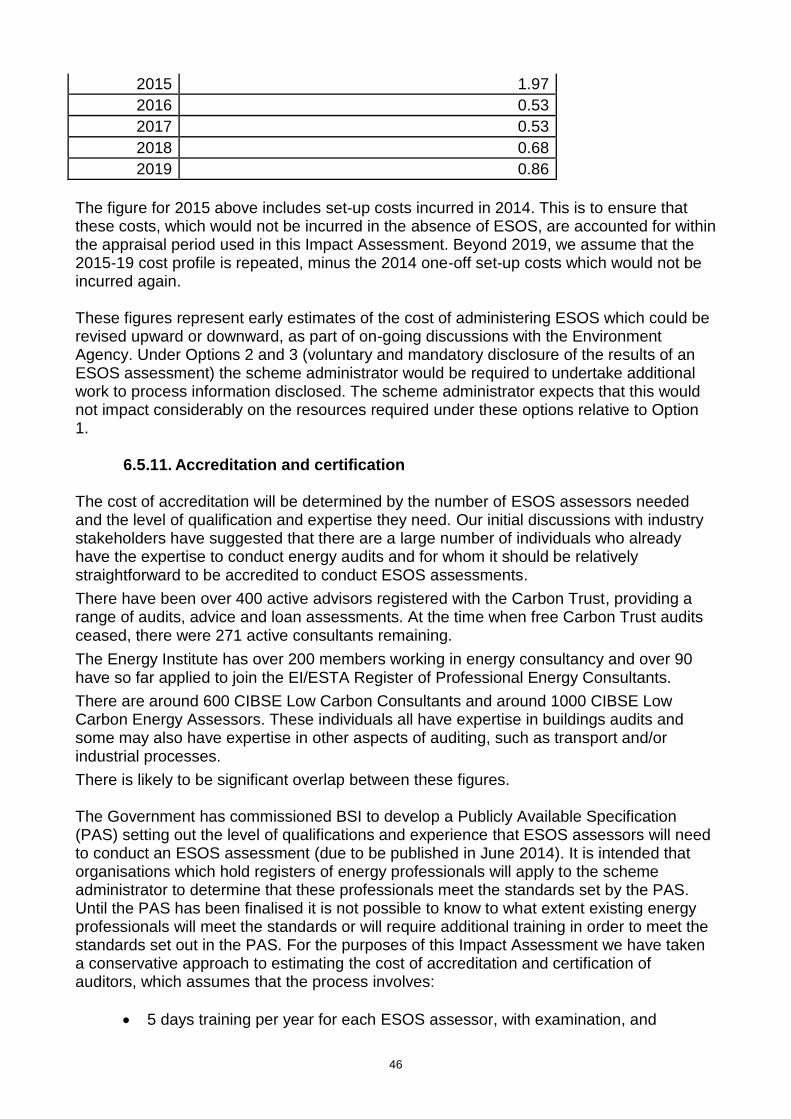
46
2015 1.97
2016 0.53
2017 0.53
2018 0.68
2019 0.86
The figure for 2015 above includes set-up costs incurred in 2014. This is to ensure that these costs, which would not be incurred in the absence of ESOS, are accounted for within the appraisal period used in this Impact Assessment. Beyond 2019, we assume that the 2015-19 cost profile is repeated, minus the 2014 one-off set-up costs which would not be incurred again. These figures represent early estimates of the cost of administering ESOS which could be revised upward or downward, as part of on-going discussions with the Environment Agency. Under Options 2 and 3 (voluntary and mandatory disclosure of the results of an ESOS assessment) the scheme administrator would be required to undertake additional work to process information disclosed. The scheme administrator expects that this would not impact considerably on the resources required under these options relative to Option 1.
6.5.11. Accreditation and certification The cost of accreditation will be determined by the number of ESOS assessors needed and the level of qualification and expertise they need. Our initial discussions with industry stakeholders have suggested that there are a large number of individuals who already have the expertise to conduct energy audits and for whom it should be relatively straightforward to be accredited to conduct ESOS assessments.
There have been over 400 active advisors registered with the Carbon Trust, providing a range of audits, advice and loan assessments. At the time when free Carbon Trust audits ceased, there were 271 active consultants remaining.
The Energy Institute has over 200 members working in energy consultancy and over 90 have so far applied to join the EI/ESTA Register of Professional Energy Consultants.
There are around 600 CIBSE Low Carbon Consultants and around 1000 CIBSE Low Carbon Energy Assessors. These individuals all have expertise in buildings audits and some may also have expertise in other aspects of auditing, such as transport and/or industrial processes.
There is likely to be significant overlap between these figures. The Government has commissioned BSI to develop a Publicly Available Specification (PAS) setting out the level of qualifications and experience that ESOS assessors will need to conduct an ESOS assessment (due to be published in June 2014). It is intended that organisations which hold registers of energy professionals will apply to the scheme administrator to determine that these professionals meet the standards set by the PAS. Until the PAS has been finalised it is not possible to know to what extent existing energy professionals will meet the standards or will require additional training in order to meet the standards set out in the PAS. For the purposes of this Impact Assessment we have taken a conservative approach to estimating the cost of accreditation and certification of auditors, which assumes that the process involves:
5 days training per year for each ESOS assessor, with examination, and

47
Quality assurance testing of the ESOS assessments conducted. Using the Standard Costs Model approach, based on wage rates from the latest Annual Survey of Hours and Earnings61, this process is estimated to cost £742 for each assessor and £40 per year for each assessment conducted (see Annex C for details). For options 1-5 we estimate that the number of ESOS assessors required to carry out energy audits in each 4-year cycle is around 1,500. In line with taking a conservative approach, we assume that this many individuals incur the above costs of accreditation (in practice it is likely that a proportion will already meet some or all of the standards set out in the PAS and will therefore require less training than that implied by the above assumptions). Our estimate of accreditation costs is £6.2m per audit cycle (£1.6m per year). This cost will be initially incurred by those applying for accreditation but in time is likely to be recovered through increases in prices charged by auditors. Therefore this cost is assumed ultimately to be incurred by organisations demanding an ESOS assessment.
6.6. Comparison of cost and benefits The analysis of the cost and benefits of the different options is summarised in Table 12 below. The Table shows the net present value (NPV) of each option when compared against a) the hypothetical ‘no directive’ baseline, and b) the lowest cost option. The comparison against the no directive baseline provides an estimate of the net impact of mandatory auditing requirement on the UK, in line with Better Regulation guidance.62 The overall cost of the audits requirement is estimate to be £1.2bn. The total benefits are estimated to be £2.8bn, meaning the net benefit is estimated at £1.6bn. The majority of the costs (60% in Option 1) are the capital cost of implementing the measures. The differences in the costs are primarily driven by the administrative burden to business of the different options. For Option 3, the additional costs are around 8% of total costs of Option 1, due to the additional cost of public disclosure. The chart below shows the pattern of costs and benefits during the appraisal period, 2015-30. The spikes in costs shown are a result of assumptions underpinning the analysis, specifically the assumption that audit costs are incurred in the final year of each 4-year audit cycle. In practice, organisations may choose to undertake audits before the compliance deadline, in which case costs will be more evenly spread across the years in each audit cycle than depicted below. We have modelled the impact of audit costs being evenly spread across years in audit cycles as part of a sensitivity analysis (see section 8 of this Impact Assessment).
61
http://www.ons.gov.uk/ons/rel/ashe/annual-survey-of-hours-and-earnings/index.html 62
Better Regulation Framework Manual, July 2013:
https://www.gov.uk/government/uploads/system/uploads/attachment_data/file/211981/bis-13-1038-better-regulation-framework-manual-guidance-for-officials.pdf

48
Figure 5: Timing of costs and benefits during the appraisal period, 2015-30
Table 12: Costs and benefits of Options 1 – 5, from 2015 to 2030
(£m PV) Option 1 Option 2 Option 3 Option 4 Option 5
Energy saving 2,216
Non-traded carbon savings
150
Avoided EU ETS
allowance purchases
130
Air quality benefits
320
Total benefits
2,210
Assessment costs
£164 £164 £164 £164 £164
Administrative burden on businesses
£233 £233 £335 £233 £268
Capital costs £702 £702 £702 £702 £702
Hassle costs £49 £49 £49 £49 £49
Scheme administration
costs £10 £10 £10 £10 £10
Accreditation costs
£20 £20 £20 £20 £20
Total cost £1,178 £1,178 £1,280 £1,179 £1,212
NPV (compared against ‘no directive’ baseline)
£1,636 £1,636 £1,534 £1,635 £1,601
0
50
100
150
200
250
300
350
2015 2016 2017 2018 2019 2020 2021 2022 2023 2024 2025 2026 2027 2028 2029 2030
Costs
Benefits
Net

49
NPV (compared
against ‘Option 1’ baseline)
£0 £0 -£102 -£1 -£35
Source: DECC analysis As set out in Section 6.4, there is currently insufficient evidence to quantify the different benefits of the policy options. The Impact Assessment therefore presents the estimated benefits of the minimum requirements and uses a ‘breakeven’ analysis to illustrate the additional savings that would be required to offset the additional cost of each option. Table 13 shows the average saving required to deliver the same NPV as Option 1 (the least cost option), given the additional cost of Options 2-5. It shows that, when estimated to 2 decimal places, Options 1, 2 and 4 require the same level of savings, while Option 3 requires an extra 0.03 percentage point average saving and Option 5 requires 0.01 percentage point average savings. To place this in context, Table 13 also shows the additional annual energy saving that would needed to deliver the same NPV for all options. Table 13: Breakeven analysis of Options 1 – 5
Option
1 Option
2 Option
3 Option
4 Option
5
Average energy saving needed to deliver same
NPV as Option 1 0.73% 0.73% 0.76% 0.73% 0.74%
Additional energy saving required per year to
deliver same NPV as Option 1 (GWh)
0.0 0.0 1.09 0.01 0.37
Source: DECC analysis
6.7. Preferred option Options 1, 2 and 4 represent different approaches to implementing the minimum requirements of Article 8. Options 3 and 5 represent approaches that go beyond the minimum requirements of the Directive, due to requiring public disclosure and central reporting respectively of the results of an ESOS assessment. Requiring businesses to disclose the results of their ESOS assessment would involve additional costs. We estimate these costs, which would be incurred under Options 3 and 5, at £102m and £34m respectively (£9m and £3m in EANCB63 terms). Requiring organisations to disclose the results of their ESOS assessment may encourage companies to undertake more energy efficiency, due to reputational and competitiveness drivers, and hence deliver greater benefits. It is not clear whether requiring disclosure/reporting of ESOS assessments would deliver greater benefits. A report64 commissioned by DECC specifically to inform our analysis of policy options for ESOS, published alongside this Impact Assessment, examined this issue and concluded in light of the available evidence that it cannot be assumed that disclosure
63
Equivalent Annual Net Cost to Business 64
See Eunomia, ‘

50
and/or central reporting of ESOS assessments would drive greater action on energy efficiency. Since the Directive does not require businesses to disclose the results of their audit, Options 3 and 5 would also constitute ‘gold plating’ the Directive. Since there is no evidence to justify gold plating in this instance, Options 3 and 5 are not preferred. Options 1 and 2 involve the lowest costs of the options considered. Option 2, by supporting organisations to voluntarily disclose the results of their ESOS assessment, has the potential to drive greater action on energy efficiency than Option 1. Organisations may be more inclined to take measures to reduce their energy consumption if they consider that they will get recognition through the actions being placed in the public domain. Therefore, our preferred option is Option 2 (the minimum requirements of the Directive, with scheme administration through a central body, notification of compliance by organisations in scope and an option for organisations to voluntarily disclose the key audit results and action taken in light of audit) on the basis that this option minimises costs while offering the prospect of greater benefits than the other minimum-cost options.
6.8. Distributional impact
Both the costs, in terms of complying with the regulation, and the benefits, in terms of lower energy costs through implementing measures to reduce energy consumption, of ESOS are likely to vary among organisations in scope. The cost to an individual enterprise is likely to vary depending on how large and complex their operations are and how easy their energy management data is to collect and analyse. Box 4 in section 6.5.2 of this Impact Assessment shows some illustrative examples that demonstrate how much an ESOS assessment might cost different types of organisation. Organisations with a large number of heterogeneous and/or unique industrial processes are likely to incur the greatest costs of getting an energy audit. The benefits in terms of lower energy costs are likely to vary according to the number of recommendations they implement. Some enterprises may simply conduct the assessment but not implement any recommendations. Organisations that stand most clearly to gain from an ESOS assessment, through acting on identified energy savings opportunities, are those which have not already taken steps to improve their energy efficiency. We currently lack data on the size and complexity of operations belonging to organisations in scope of ESOS, and on the extent to which organisations in scope are already energy efficient. As a result we are unable to quantitatively assess the distributional impact of ESOS. The factors discussed above imply that organisations with mostly homogenous sites or processes that have not yet taken steps to improve energy efficiency stand to gain most from ESOS; while organisations with a large number of heterogeneous, and therefore expensive to audit, already-energy efficient sites are least likely to gain from ESOS.
6.9. Costs to business

51
The direct cost to business are summarised in Table 14. The majority of the costs of the policy will fall on business, the exception being the scheme administration costs that are funded through taxes (though under Option 4 the costs of scheme administration fall on business65). The capital and hassle costs of implementing recommendations are not included as these are indirect (second round) effects. All the benefits of the policy are also indirect, and so have been excluded from the net cost of businesses calculation. The majority (98%) of the cost to business is the cost of the assessments themselves and the administrative burden. Table 14 also presents the Equivalent Annual Net Cost to Business (EANCB). The analysis shows the EANCB of mandatory auditing requirement is £29m. Under Option 4, businesses incur additional costs of scheme administration. However, this is not included in the calculation of the EANCB of this option, in line with Better Regulation Framework Guidance around treatment of cost-recovery.66 Table 14: Costs to business
(£m PV) Option
1 Option
2 Option
3 Option
4 Option
5
Assessment costs £164 £164 £164 £164 £164
Administrative burden £233 £233 £335 £233 £268
Scheme administration £0 £0 £0 £8 £0
Accreditation £20 £20 £20 £20 £20
Total cost £417 £417 £520 £425 £452
NPV (£m, compared against ‘non directive’
baseline)
-£417 -£417 -£520 -£425 -£452
EANCB £35 £35 £44 £36 £38
NPV (£m, compared against ‘Option 1’ baseline)
-
-
- 102
- 8
- 35
EANCB (compared against ‘Option 1’ baseline)
-
-
9
1
3
Source: DECC analysis
6.9.7. One In Two Out The Better Regulation Framework Guidance on One In, Two Out (OITO)67 sets out that in the case of EU legislation, the cost to business in scope of the OITO policy is the additional cost to business over and above the EANCB of implementing the minimum requirements. The preferred option represents the minimum requirements of Article 8 of the Directive therefore this policy does not involve an ‘in’.
6.9.8. Small and Micro-businesses Assessment
65
Excluding the proportion of scheme administration costs that relate to start-up and enforcement, in line with Treasury rules on cost
recovery. 66
https://www.gov.uk/government/uploads/system/uploads/attachment_data/file/31616/11-671-one-in-one-out-methodology.pdf 67
https://www.gov.uk/government/uploads/system/uploads/attachment_data/file/31616/11-671-one-in-one-out-methodology.pdf

52
The mandatory auditing requirement only applies to large enterprises. Small and Micro-business are therefore fully exempt from the regulations. Some ESOS assessors may operate as small businesses and may voluntarily choose to become accredited in order to benefit from the increased business opportunities the policy will create. 7. Qualitative analysis of the options
This section presented the qualitative analysis of the policy options. Section 7.4 discusses the costs and benefit that are included in the qualitative analysis. Section 7.5 presents the multi-criteria analysis of the different options, assessed against the policy objectives set out in Section 4.
7.4. Non-quantified costs and benefits
7.4.7. Economic growth, productivity and competiveness
Energy efficiency has the potential to boost growth as improvements in energy efficiency can result in productivity gains for firms.68 Evidence suggests that small and positive impacts exist at both economy wide and firm level. Energy efficiency investments reduce business costs, meaning they can deliver more for less. Firms can then increase output and profits. Capital spending on energy efficiency creates jobs for installers and manufactures of energy efficient equipment. Making firms more efficient also makes them more competitive in international markets, which can improve the UK’s trade balance. Reducing energy cost also reduces the UK’s exposure to high and volatile international energy prices. Finally, investment in the energy efficiency sector can also increase innovation, which has wider benefits to UK. ESOS will also stimulate growth in the energy efficiency sector. In 2011/12, the UK’s energy efficiency market accounted for 136,000 jobs and sales of over £18 billion.69 The process of conducting the ESOS assessments themselves will provide employment for auditors and auditing companies. A range of other energy efficiency product and service businesses may also benefit from supporting large enterprises in implementing ESOS assessors’ recommendations. The growth in the sector will help the supply side of the market mature, and enable the sector to promote the contribution it can make to a range of enterprises more effectively.
7.4.8. Direct and indirect rebound effect One of the knock on effects of improving an enterprise’s energy efficiency is that some of the financial savings may be spent on energy consuming goods and services: the rebound effect. This means that the overall impact on energy consumption is smaller (although businesses will benefit from the additional energy consumption, for example, through expanded production). The nature of the rebound effect will vary depending on the energy efficiency measures adopted. For example, if a firm installs a more efficient motor in its production line, the direct rebound effect would be an increase in output from the plant (which would increase energy consumption). An example of the indirect rebound effect would be using the financial savings to increase the profits of shareholders, who then
68
This is explained in more detail in the Government’s Energy Efficiency Strategy, available at:
https://www.gov.uk/government/uploads/system/uploads/attachment_data/file/65602/6927-energy-efficiency-strategy--the-energy-efficiency.pdf. An update to the Strategy is available at: https://www.gov.uk/government/publications/energy-efficiency-strategy-2013-update 69
BIS, Low carbon and environmental goods and services (LCEGS) report for 2011 to 2012 (July 2013). Note: energy efficiency sector
defined as Building Technologies & Energy Management.

53
spend more on energy using products and services. There is currently limited evidence on the scale of the rebound effect in the non-domestic sector, although the evaluation of the policy may provide an opportunity to improve the evidence on this effect.
7.4.9. Tackling organisational failures As discussed in Section 3, research suggests that the structure of an enterprise affects its approach to energy efficiency investments.70 Options that raise the profile of an ESOS assessment so that the opportunities for cost reduction are recognised at board level are more likely to deliver energy savings. In line with the legal definition of an audit, all 5 policy options considered in this Impact Assessment require Director (or senior manager) sign off of ESOS assessments. A report by Eunomia, commissioned by DECC and published alongside this Impact Assessment, considers, in light of evidence on other schemes, that “mandating board sign-off would help drive investments in energy efficiency”.71 Requiring enterprises to publically disclose that they have conducted an ESOS assessment, or centrally report on the results, may help further raise the profile of the ESOS assessments within enterprises and so make it more likely the recommendations are implemented. The report by Eunomia found some evidence to support this however it also noted the potential ‘greenwash’ effect, whereby company concern about releasing performance information can lead to selective information release, aimed at portraying a positive corporate image, which can undermine the incentive to take positive steps to increase energy efficiency recommendations.72
7.4.10. Wider benefits of information collected There are potentially wider benefits to society that could be gained for effective use of the information collected through ESOS assessments. Some of this information is a non-rival public good, meaning once it has been produced by the assessor it can be put to multiple uses for relativity low cost to society. The assessment findings could be used to reduce the cost to business of existing policies. For example, the CCA target setting process required industry to provide detailed information on the potential of energy efficiency improvements. ESOS could reduce the cost of this process by reusing data already collected. The Eunomia report also examined the wider benefits of information in terms of improved data for policy development.73 It cites evidence to support the assertion that relevant information in a usable format allows for analysis and policy development that targets areas which require the most intervention. The data collected under ESOS could be used to strengthen the evidence base underpinning all energy efficiency policies. This would reduce information asymmetries between policy makers and business that hamper the development of effective public policy. Provided all commercially confidential information was redacted, the aggregated results could also be made public, which would support wider analysis and debate around the role of energy efficiency policy in meeting the overall
70
https://www.gov.uk/government/uploads/system/uploads/attachment_data/file/65601/6925-what-are-the-factors-influencing-energy-
behaviours.pdf 71
See ‘Evidence Review on the Impact of Central and Public Disclosure Methods for Reporting Energy Use and Energy Efficiency’
(published alongside this Impact Assessment). 72
See ‘Evidence Review on the Impact of Central and Public Disclosure Methods for Reporting Energy Use and Energy Efficiency’
(published alongside this Impact Assessment). 73
See ‘Evidence Review on the Impact of Central and Public Disclosure Methods for Reporting Energy Use and Energy Efficiency’
(published alongside this Impact Assessment).
54
objectives of increasing economic growth, reducing carbon emissions and securing reliable energy supplies. Robust information on the potential for energy efficiency would also provide a strong signal to the energy efficiency market of the business opportunities available. Finally, effective central reporting on the information gathered by the ESOS assessments would enable a more robust evaluation of the policy in 2016, and enable any adjustments to be made to make the policy more effective. The results could also be fed into the wider European Commission evaluation of the Directive.
7.5. Multi-criteria analysis of policy options Given the challenges in quantifying some of the key benefits, this Impact Assessment also presents a multi-criteria analysis of the different options, illustrated in Table 14. This assesses each option against the key policy objectives. The criteria used are:
Maximise benefit to the UK o The policy addresses the information market failures by providing tailored
recommendations about an enterprise’s opportunities to save energy efficiency.
o The policy addresses organisational barriers that prevent the energy efficiency measures being implemented.
o The policy captures the wider benefits to the UK of the information created.
Minimise cost to business o The process of complying is simple for business to understand and
implement. o The scheme administration of the requirements imposes minimal costs to
businesses.
Meet EU reporting obligations o The policy ensures that the UK is able to accurately report on the number of
audits conducted (as required by Article 24 of the Directive). Address information market failures Options 1-5 are expected to perform adequately against this criterion. The requirement within the Directive is that ESOS assessments be proportionate and sufficiently representative to enable recommendations to be made. Taking a proportionate approach inevitably means some energy efficiency opportunities might be missed. However, under Options 1-5 ESOS assessments are still expected to provide enough detail to significantly improve the information available. Address organisational barriers As set out above, policies that raise the profile of energy efficiency within enterprises are more likely to overcome the organisational barriers to the take-up of measures, and lead to higher energy savings. Options 1 to 5 require a Director (or senior manager) in each organisation to sign off the results of an ESOS assessment prior to the organisation notifying the scheme administrator that it has undertaken an assessment. This is expected to go a long way to addressing organisational barriers to energy efficiency, by engaging actors at the top of an organisation.74 Options 3 and 5, by requiring disclosure/reporting of
74
An evidence review commissioned by DECC to inform the analysis of ESOS policy considers, in light of evidence on other schemes,
that “mandating board sign-off would help drive investments in energy efficiency”. See page 89 of Eunomia, ‘Evidence Review on the

55
the key results of an audit and action take in light of an audit, are more likely to raise the profile of an ESOS assessment and cause senior managers to engage closely with the assessment. These options may also create reputational incentive for some enterprises to ensure they are implementing cost effective recommendations. Options 3 and 5 might therefore go further in addressing organisational barriers to energy efficiency than the rest of the options. Capture the wider benefits of the information
Options 1 and 4 are unlikely to result in the wider benefits (set out above in Section 7.4) being realised as the assessment results would not be reported outside the enterprises concerned. For Options 3 and 5, making some element of the assessment public would enable third parties to collect the information and put it to alternatives uses. Option 5 is most likely to result in the wider benefits being captured, as it would enable a detailed evidence base to be developed on the potential for cost effective energy efficiency improvement and the impact of ESOS assessments on the enterprises in scope of the policy. Option 2 has the potential to capture the wider benefits of information but will depend on the extent to which organisations voluntarily disclose the results/action taken in light of their ESOS assessment.
Simple compliance process
The complexity of the compliance processes is largely determined by the number of tasks enterprises are required to do. Options 1 and 2 are simplest, because enterprises are only required to conduct the assessment and notify the scheme administrator that they have done so. Options 3, 4 and 5 are more complex because they require enterprises to do a number of further tasks: make a public disclosure, pay (and budget for) the scheme administration charge, and report on the assessment results centrally.
Proportionate enforcement process
The impact of the enforcement process on the cost to business would depend on the level of interaction they are required to have with the scheme administrator. All five options involve an initial interaction with the scheme administrator to notify it that an ESOS assessment has been undertaken and, in the case of option 5 only, disclose the key results of the audit. Under all five options, organisations in scope face the possibility of further interaction owing to the need for the scheme administrator to contact a sample of organisations for compliance checks. To the extent that the additional information provided under options 2, 3 and 5 enabled the scheme administrator to better target its compliance checks and thereby make fewer interactions with individual organisations, these options would be less intrusive. Option 4 would involve an additional interaction owing to the cost recovery aspect of this option. Enable accurate reporting to the European Union
The UK will have to report on the policy’s operation to the European Union. All five options are judged to provide the minimum information required to ensure the UK is fully able to meet its reporting requirements.
Table 15: Multi-criteria analysis of Options 1 - 5
Option 1 2 3 4 5
Impact of Central and Public Disclosure Methods for Reporting Energy Use and Energy Efficiency’ (published alongside this Impact Assessment).

56
Maximise benefit to the UK
Address information market failures
Address organisational barriers
Capture the wider benefits to UK
Minimise the costs to business
The process of complying is simple
The enforcement process is light touch
Meet EU reporting obligations
Enable accurate reporting to EU
8. Sensitivity analysis The analysis presented in Figure 6 focuses on the assumptions that have the most significant impact on the results. It presents sensitivity analysis to illustrate the level of uncertainty around the results. The input assumptions that have been tested in this analysis are:
The energy savings resulting from ESOS assessments
The impact of future ESOS assessments on total savings
The capital costs of implementing recommendations
Future energy prices
The number of firms already conducting audits in the no-directive baseline
The proportion of transport energy consumption used by large enterprises
The proportion of energy consumption used by large enterprises that own buildings and industrial processes
The proportion of energy in scope that is covered by existing policies
The size of the administrative burden imposed on businesses
The cost of conducting assessment
The hassle costs of implementing recommendations
The number of sites visited by ESOS assessors
The number of industrial process in scope of the policy
The number of vehicle fleets in scope of the policy
The number of enterprises covered by existing policy
The number of buildings in scope of the policy Figure 6 below illustrates the NPV of Option 2 (the preferred option) measured against the ‘no directive’ baseline in the different sensitivity scenarios. The best (worst) case scenario is modelled on the set of assumptions that produce the best (worst) NPV while remaining logically consistent. For example, in the best case scenario, assumed energy savings are increased by 50% which also increases the capital costs relative to the central scenario. In the worst case scenario the NPV of Option 2 is -£360m. In the best cases scenario the NPV is £6.1bn. The sensitivity analysis suggests that four variables in particular (energy savings delivered, capital costs, the duration of savings and energy prices) have a very substantial impact on the final results. By comparison, 6 assumptions tested in the sensitivity analysis have a small (less than 10%) impact on the final NPV. Table 16 presents the details of the sensitivity scenarios used.

57
Figure 6: Illustration of sensitivity analysis results for Option 2
Source: DECC analysis
0 500 1000 1500 2000 2500 3000
Businesses Overlaps
Number fleets
Number industries
Number Sites Visited
Hassle Cost
Cost Audit
Admin Burden
Policy Overlaps
SME/nonSME Split
NonSME Transport
Number firms with audit
Energy Prices
Capital Costs
Repeat Audits
Energy Savings
NPV Range (£m)
Central NPV NPV range

58
Table 16: Details of sensitivity analysis inputs and results for Option 2
Sensitivity Description Low NPV
(£m) High NPV
(£m)
Worst / best case A combination of the worst and best case
scenarios below.
-360
6,120
Energy Savings Assumptions made to estimate additional
energy savings from ESOS are increased or decreased by 50%.
600
2,670
Repeat Assessments
Additional savings from ESOS assessments are increased or decreased by 0.05% every
year.
770
2,460
Capital Costs Capital costs increased or decreased by 50%
(which in turn affects hassle costs).
1,260
2,010
Energy Prices Low and high energy prices75 are used instead
of central ones.
1,160
2,050
Number firms with audit
The number of firms already conducting audits in the no-directive baseline is increased from
25% to 50%.
1,110 -
Transport SME/non SME
Split
Proportion of transport energy consumption used by large enterprises.
1,540 1,730
Industry & buildings SME / non SME Split
Proportion of energy consumption used by large enterprises that own buildings and
industrial processes. In the central scenario large enterprises consume 79.3%, in the low
scenario 78.6% and in the high scenario 82.5% of total energy demand.
1,590
1,720
Policy Overlaps
The amount of uncovered energy in the central scenario is 84% and it is increased to 85% in the low case scenario or decreased to 78% in
the high case scenario.
1,610
1,720
Administrative Burden
The administrative burden from carrying out an assessment is increased or decreased by
50%.
1,520
1,750
Cost Assessment The cost of ESOS assessments are increased
or decreased by 50%.
1,550
1,720
Hassle Cost Hassle costs increased or decreased by 50%.
1,590
1,660
Number Sites Visited
The proportion of sites visited by ESOS assessors is increased or decreased by 50%.
1,600
1,660
Number of Industrial
enterprise in scope
The number of industrial enterprises in scope is increased or decreased by 50% (although
the total number of remains constant). 1,620
1,650
Number of Fleets in scope
The number of fleets in scope is increased or decreased by 50% (although the total number
1,580
1,690
75
Based on values in the Green Book supplementary guidance on energy and climate change impacts:
https://www.gov.uk/government/publications/valuation-of-energy-use-and-greenhouse-gas-emissions-for-appraisal

59
of remains constant).
Businesses Overlaps
The number of firms in CRC is reduced from 6,423 to 4,362 (which is the number of significant group undertakings in CRC).
1,600
1,620
Number Buildings The number of buildings is increased from
170,000 to 200,000.
1,630
1,640
Source: DECC analysis 9. Evaluation plan The government has committed itself to reviewing ESOS in 2016. This review is likely to include an evaluation of both the quantitative impact of ESOS and a qualitative understanding of the process through which ESOS assessments affect the energy efficiency of different enterprises. The key metrics used to evaluate the policy include
The number of mandatory energy audits carried out by participants within each period and the number of participants complying via alternative means (e.g. certified EMS)
The total number of energy audits carried out within each period (i.e. mandatory non-SME + voluntary SME and domestic household)
Energy savings (and resultant costs and financial savings) identified by non-SMEs through ESOS
Take up of energy saving recommendations by non-SMEs identified in audits
The energy savings realised by ESOS through mandatory audits
Cost to businesses of complying with ESOS
Financial savings to non-SME business, delivered by ESOS Whilst the details of how the evaluation will be conducted are being finalised, consideration of some of the broader evaluation issues are set out below.
9.1 Key Evaluation Issues
Establishing additionality Establishing additionality – to understand the energy savings achieved as the result of ESOS audits that would not have been achieved otherwise – is a key issue for the evaluation. The influence of extraneous factors, such as wider economic impacts and the influence of other policies on energy consumption suggest that analysis of energy consumption as a trend over time is not likely to be sufficient to establish the contribution of ESOS. The evaluation will explore alternative approaches to establishing the counterfactual, including; establishing the energy saving potential identified in ESOS audits and the extent to which these energy savings were achieved, accounting for businesses that have undertaken an audit prior to the launch of ESOS and implemented energy efficiency measures; and a comparison of the energy efficiency behaviours of businesses that are just within the threshold for complying with the policy against the energy efficiency behaviours of businesses that are just below the threshold (i.e. large SMEs). Policy Overlap

60
The evaluation of ESOS will need to consider the impact of other policy mechanisms designed to bring about improved energy efficiency in organisations. ESOS’s broad organisational energy remit means that it can be considered as encompassing all aspects of energy efficiency within a (non-SME) organisation but operating alongside policies designed to target specific energy efficiency measures (e.g. RHI) and/or energy intensive installations (e.g. EU ETS) means that the policy impacts are likely to be seen as cumulative. Evaluation of ESOS will align closely with wider-non domestic research and other policy evaluations, in order to account for cumulative impacts, where this is found to be feasible. The government is committed to reviewing ESOS in 2016. This post-implementation review will form part of a longer-term policy evaluation and will consider the initial impact of the policy and an early assessment of progress against the stated policy objectives. The post-implementation review is planned for publication in 2016/17.

61
Annex A –Technical potential in buildings and industrial processes in scope of the policy Figure 1 shows the estimated technical potential in buildings and industrial processes in scope of the policy. This annex summarises how this has been estimated. Figure 1: Projected technical potential for energy efficiency within scope of ESOS
1. Technical potential in buildings The estimate of the technical potential for energy efficiency improvements available in buildings used by non-SMEs is based on a combination of two datasets, namely: the Small Emitters Model (SEM)76 and the DECC Energy and Emissions Projections77. The SEM uses data from the National Non-Domestic Buildings Energy and Emissions Model (N-DEEM)78. Technology penetration rates estimated by Element Energy79 are used to estimate the remaining potential over time. The N-DEEM project ran between the mid-1990s to mid-2000s. The SEM includes data on the technical potential in the building sector for the period 2015-2030. This has been adjusted to make the scope of the potential match the scope of the policy. The steps were;
1. Remove technical potential in public sector buildings (this split was included in the
SEM).
2. Split the remaining technical potential into SME and non-SME sectors, using the
same ratio as used to estimate the energy in scope of the policy. This implicitly
requires the assumption that technical potential is distributed between SME and
Non-SME firms in proportion to their energy use.
3. The technical potential taken up as a result of policies not already included in the
SEM has been removed. Only policies which covered the relevant sectors were
76
Small Emitters Model (SEM) AEA 2010 77
https://www.gov.uk/government/publications/updated-energy-and-emissions-projections-2013 78
N-DEEM was developed by the Building Research Establishment (BRE) to provide an insight into energy use and abatement
potential within the country’s non‑domestic properties. BRE’s website: http://www.bre.co.uk/bretrust/index.jsp 79
Element Energy – Uptake of Energy Efficiency in Buildings – 2009. http://downloads.theccc.org.uk/docs/Element%20Energy_final_efficiency_buildings.pdf
0
5
10
15
20
25
30
35
40
45
50
2015 2018 2021 2024 2027 2030Ene
rgy
eff
icie
ncy
te
chn
ical
po
ten
tial
(TW
h)
Non-SME industrial processes potential, payback less than 2 years
Non-SME buildings potential, payback less than 2 yrs

62
considered (ETS, CRC, Building Regulation Part L 2010, non-domestic Green
Deal).
4. Finally, measures with a payback period longer than 2 years have been removed to
simulate the propensity to take up measures with a quicker return.
Results The technical potential in non-SME buildings is estimated to be a total of 21TWh in 2015. Figure 2 shows the impact of removing the technical potential assumed to be within SMEs and the technical potential delivered by policies not already included in the SEM baseline. Figure 2: Analysis of technical potential in buildings sector
Source: DECC analysis of Small Emitters Model data Limitations All measures with a zero or negative capital cost have been removed. Without these measures being installed it is likely that the remaining potential would deliver higher energy savings, however, we have not made this adjustment, but this effect is likely to be small. We are slightly underestimating the technical potential for energy savings through installing physical measures. 2. Technical potential in non-SME industrial processes The evidence on the potential for energy efficiency in industrial processes is based on the analysis carried out in the Energy Efficiency Strategy Marginal Abatement Cost Curve (EE MACC)80. The potential is derived from three principal sources. The Energy End-Use Simulation Model (ENUSIM) is a technology based, bottom-up industrial energy end-use simulation model which projects the uptake of energy-saving and/or fuel-switching technologies taking into account the cost effectiveness of technology options under future carbon and fossil fuel prices scenarios.81 Further detail on future abatement potential has been derived
80
https://www.gov.uk/government/uploads/system/uploads/attachment_data/file/65603/6928-the--energy-efficiency-strategy-statistical-
strat.pdf 81
Industrial Energy End-Use Simulation Model ENUSIM. DATABASE, DECC. (Updated: March 2010 and September 2002 [Original
Version: March 2001] Entec UK Limited and Cambridge Econometrics).
-
10
20
30
40
50
60
2015 2018 2021 2024 2027 2030
Ener
gy e
ffic
ien
cy t
ech
nic
al p
ote
nti
al (
TWh
)
SEM technical potential
Non-SME buildings potential
Non-SME buildings potential adjusted for policy baseline
Non-SME buildings technical potential, payback less than 2 yrs

63
from work undertaken by AEA Technology.82 The major sources of abatement covered within this work focus on six major sectors: cement, refineries, glass, chemicals, food and drink, and iron and steel. DECC commissioned further analysis to assess abatement potential beyond that considered in the AEA work.83 This project is based on top-down energy and abatement projections for 17 wider groups of light manufacturing. This potential identified in the EE MACC has been adjusted for the scope, to cover non-SME industrial processes excluding those owned by the fuel industry, as we have assumed that ESOS assessments will deliver no additional savings in the fuel industry. Moreover, measures with a zero or negative capital cost have been removed for consistency with the rest of the analysis. Results The technical potential in non-SME industrial processes is estimated to be a total of 22 TWh in 2015. Limitations The evidence on capital costs is not strong. For some measures capital costs are a top-down estimate of the willingness to pay, whereas for others they are based on a bottom-up estimate of the cost necessary to deliver the identified potential.
82
Analysing the Opportunities for Abatement in Major Emitting Industrial Sectors. Report for The Committee on Climate Change
AEAT/ENV/R/Industrial Energy Efficiency ED56369 Issue Number 1, 8th December 2010. 83
Understanding the Industrial Sector Abatement Opportunities for the 4th Carbon Budget Carbon Abatement Potential within the ‘Tail
End’ Industries. Report for DECC. Arup. Ref: 81/11/2010 – Issue June 2011.

64
Annex B – Structure of cost-benefit analysis The figure shows the structure of the cost benefit analysis used to assess the impact of ESOS (the figures below refer to Option 2).

65

66
1. Details of the standard cost model analysis of administrative burden and
accreditation
This section sets out the details of the assumptions used to estimate the administrative burden to enterprises of complying with the mandatory ESOS requirements and the cost to ESOS assessors of complying with accreditation regime. The analysis combines a) a breakdown of the tasks that need to be done, b) an estimate of how long each will take and c) estimates of the hourly wage of the individual required to complete the work (based on the Standard Cost Model). Accreditation costs Table 1 sets out the tasks that will need to be completed to ensure ESOS assessors are accredited and they are conducting audits of an adequate standard. Table 1: Standard Cost Model analysis of cost of accreditation
Directors and Department
Heads (£70/h)
Senior Manage-
ment (£54/h)
Middle Manage-
ment (£31/h)
Administra-tors (£13/h)
Total Cost (£)
Number of days spent on each task (FTE)
5 days annual training (per ESOS assessor)
1 5 5 £1,733
4 annual evaluations (per ESOS assessor)
4 4 £1,235
Quality assurance testing (for 1 in 10 ESOS assessments)
0.1 5 5 £1,581
Source: Discussions with stakeholders Administrative burden Tables 3 and 4 below set out the number of days it takes to complete the process each organisation will need to go through in order to comply with the ESOS requirement. For the administration burden, data from a survey of CRC participants collected by KPMG in 2011 has been used as an estimate of the time taken for some tasks (for example, the time taken to understand the regulations and or gather data).84 Where data is not available, illustrative assumptions have been used. Some tasks (Understand the requirement and Educate the organisation) will only need to be conducted once. Others will need to be completed each time an ESOS assessment is conducted. Table 3 sets out the task that organisations will need to complete for all options and Table 4 shows the tasks specific to each option.
84 https://www.gov.uk/government/uploads/system/uploads/attachment_data/file/42934/4759-kpmg-assessing-admin-costs-
crc-scheme.pdf

67
As discussed in Section 6.3 of the Impact Assessment, some enterprises will already be conducting some of the required tasks (either because of existing policies or because they are already conducting an audit in the counterfactual scenario). Table 2 provides a breakdown of which enterprises are assumed to incur the costs of which tasks. Table 2: Breakdown of which tasks different organisations will need to complete
Organisations
covered by
existing policy
Organisations
not covered by
existing policy
Organisations
with an audit
in the
counterfactual
Understand the requirement
(once) X X X
Educate the organisation
(once) X X X
Recruit an ESOS assessor X X
Gather data X
Gather data (transport) X X
Evidence Pack X
Accompanying ESOS
assessors on site visit X X
Attend presentation on
recommendations X X
Investigate ESOS
assessment
recommendations
X X
Option specific tasks
(enforcement activity,
reporting, public disclosure)
X X X

68
Table 3: Breakdown of ESOS tasks per organisation, for all policy options
Note: numbers in bold come from the KPMG report on CRC costs to businesses; numbers in italic are assumptions based on discussions with stakeholders.
85
A middle manager will spend 2 days researching which ESOS assessor the company should hire. 86
Based on CRC data on number of days Compiling and submitting your annual report evidence pack. 87
A middle manager will accompany the ESOS assessor for the duration of each site visit. 88
Two senior managers and two middle managers will attend a half-day presentation and spend half a day reading the report.
Directors and Department
Heads
Senior Management
Middle Management
Administrators
£70/h £54/h £31/h £13/h
ESOS tasks Number of days spent on each task (FTE)
Cost (£)
Common costs of all options – upfront (incurred once)
Understand the requirement 2.3 4.9 11.0 4.4 5,798
Educate the organisation 1.1 3.1 5.0 2.1 3,004
Common costs of all options – on-going (per round of ESOS assessment)
Recruit an ESOS assessor85
2
433
Gather data 0.4 1.5 6.3 5.9 2,488
Gather data (transport)
2 2 617
Evidence Pack86 0.3 0.8 2.9 1.6 1,212
Accompanying ESOS assessors on site visit87 1 X number of days on site
1,972
Attend presentation on recommendations88
2 2
1,194
Investigating ESOS assessment recommendations 1.5 1.5 463

69
Table 4: Breakdown of administrative tasks per organisation, specific to policy options 1-5
Note: numbers in bold come from the KPMG report on CRC costs to businesses; numbers in italic are assumptions based on discussions with stakeholders. Additional administrative costs for conducting an ‘in-house’ ESOS assessment Under ESOS, organisations will be permitted to conduct an ‘in-house’ ESOS assessment, provided it is undertaken by a suitability qualified professional within the organisation. Organisations that choose to comply via this route will be required to have their ESOS assessment signed off by two Directors in their organisation (as opposed to just one Director if the assessment is conducted by an external auditor). Organisations that choose to comply via this route will therefore incur an additional administrative burden, broadly equal to the cost of a Director’s time taken to consider the results of the assessment. It is reasonable to assume that organisations that choose to
89
Based on CRC data on ‘liaising with EA’ and ‘reporting’ but only 2% of firms incur these costs. 90
A middle manager will spend 4 days and a senior manager 1 day preparing the report for directors and preparing for publication. The 8 directors will meet and consider the proposals for a half-
day. [This is consistent with the cost of GHG reporting] 91
Based on CRC data on ‘reporting’
Directors and
Department Heads Senior
Management Middle
Management Administrators
£70/h £54/h £31/h £13/h
ESOS tasks Number of days spent on each task (FTE) Cost (£)
Additional cost of Options 1 and 2
Enforcement activity 0.0 0.1 0.4 0.2 171
Additional cost of Option 3
Light touch enforcement activity89 0.0 0.0 0.1 0.0 34
Public disclosure of ESOS compliance90 4 1 4
3,217
Additional cost of Option 4
Processing enforcement charge
0.1 9
Enforcement activity 0.0 0.1 0.4 0.2 171
Additional cost of Option 5
Report results to enforcement body91 0.3 0.8 2.9 1.6 1,212

70
undertake their ESOS assessment in-house will do so having considered that the associated cost, accounting for the cost of additional Director sign off, does not exceed the cost of a procuring an external audit. Therefore, we have not costed this additional administrative burden in the above table, as our estimate of assessment costs, set out in Section 6.5.7 of this Impact Assessment, is assumed to cover the costs of any in-house ESOS assessments.

71
Annex C: Number of buildings in scope of ESOS 1. Introduction This annex sets out how the estimate of the number of buildings in scope of ESOS was developed. This analysis was used to estimate the cost of conducting ESOS assessments and the size of the administrative burden to businesses. 2. Data sources The analysis uses a variety of data sources matched within the developmental non-domestic National Energy Efficiency Data-framework (NEED). In summary these were:
2.1 Non-domestic Rating File (NDR, Valuation Office Agency) File contains 1.8m “hereditaments” (rateable units) in England & Wales for which business rates are paid. This will include the vast majority of business and public sector premises. There are a few exceptions (such as MoD sites). The data from this source provide type of premises (e.g. office, shop and factory) and floor area. About 5% of these sites may have not buildings e.g. phone box, advertising board and these have been excluded from the analysis. It is possible to have multiple buildings within a rateable unit, for example an industrial site but the extent of this is not known.
2.2 ExperianPH Megafile The Experian data provide details on the number of employees modelled from a range of business records / surveys at each site and aggregated to company level. The accuracy of aggregation to parent company is not known but would appear to aggregate fewer businesses together than Official Business Statistics from the IDBR. This will lead to the count of sites being under-estimated as some enterprises will be classified below the employment threshold as not all sites have been captured (see Table 2 for more details). The extent to which this data covers public sector buildings with Display Energy Certificates (DECs) is thought to be minimal. Experian data are available for about half the premises in the NDR.
2.3 Display Energy Certificates Large public sector buildings are outside the scope of ESOS. There are about 30,000 buildings captured. These have been removed from the NDR total before grossing up the Experian results.
2.4 IDBR Business Statistics The data contained in these tables are produced from a snapshot of the Inter Departmental Business Register (IDBR) taken on 12 March 2012. The main administrative sources for the IDBR are VAT trader and PAYE employer information passed to the ONS by HM Revenue & Customs under the Value Added Tax Act 1994 for VAT traders and the Finance Act 1969 for PAYE employers; details of incorporated businesses are also passed to ONS by Companies House.
2.5 Business Population Statistical Estimate This is compiled based on a range of sources including the IDBR with the objective to better capture small and medium sized business not captured by the IDBR. The counts presented include not for profit organisations over the size threshold but public sector activity has been excluded. 2. Summary of businesses in the UK
Table 1: Number of enterprises with >=250 employees
Data source Number of businesses
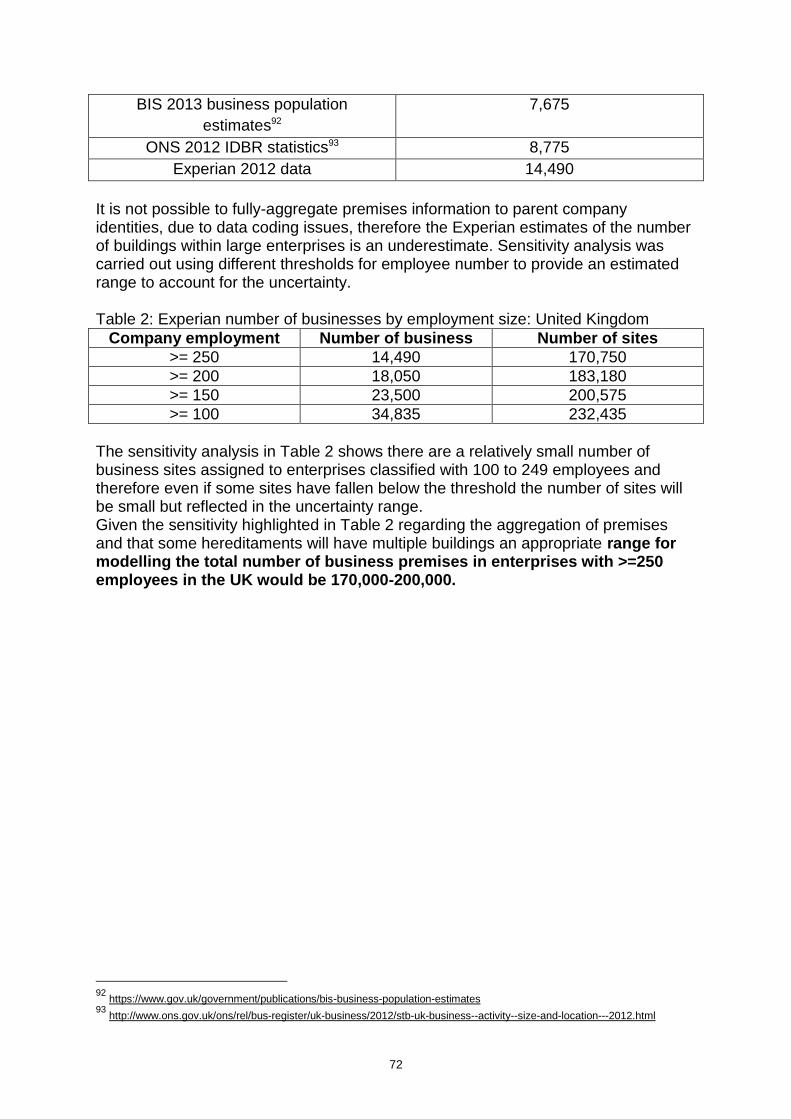
72
BIS 2013 business population
estimates92
7,675
ONS 2012 IDBR statistics93 8,775
Experian 2012 data 14,490
It is not possible to fully-aggregate premises information to parent company identities, due to data coding issues, therefore the Experian estimates of the number of buildings within large enterprises is an underestimate. Sensitivity analysis was carried out using different thresholds for employee number to provide an estimated range to account for the uncertainty. Table 2: Experian number of businesses by employment size: United Kingdom
Company employment Number of business Number of sites
>= 250 14,490 170,750
>= 200 18,050 183,180
>= 150 23,500 200,575
>= 100 34,835 232,435
The sensitivity analysis in Table 2 shows there are a relatively small number of business sites assigned to enterprises classified with 100 to 249 employees and therefore even if some sites have fallen below the threshold the number of sites will be small but reflected in the uncertainty range. Given the sensitivity highlighted in Table 2 regarding the aggregation of premises and that some hereditaments will have multiple buildings an appropriate range for modelling the total number of business premises in enterprises with >=250 employees in the UK would be 170,000-200,000.
92
https://www.gov.uk/government/publications/bis-business-population-estimates 93
http://www.ons.gov.uk/ons/rel/bus-register/uk-business/2012/stb-uk-business--activity--size-and-location---2012.html

73
Annex D – estimating the number of transport fleets in scope of the ESOS policy There is no information on the total number of fleets (cars, vans or HGVs) which are owned by non-SMEs and therefore which are in scope of the ESOS policy. In the absence of this information, we have estimated the number of fleets which are owned by non-SMEs using a measure of transport intensity in different sectors. This annex provides detail on the approach used. The first step in the approach is to use data analysed from IDBR which shows the number and proportion of non-SMEs in different business sectors. We then merge this with other data taken from a report by Oxford Economics94 which shows the share of leased vehicles in different industries. By merging these two sources of information, it is possible to approximate the leasing transport intensity of the non-SMEs in different industries by calculating, for each industry, the ratio of the share of leased vehicles to the share of non-SMEs.
(1) This transport intensity ratio provides an indication of how prevalent the
leased vehicles are in different business sectors. It indicates those industries
which are using a either a higher or lower share of leased vehicles than you
would expect if vehicle leasing usage was solely dependent on the number of
businesses operating in these different sectors. We can then use this
measure of the transport intensity in the leased sector to approximate the
overall transport intensity of different sectors if we assume the distribution of
non-leased vehicles across different sectors for non-SMEs is the same as the
distribution of leased vehicles across different sectors. The transport intensity
figures are then applied to the IDBR data on non-SMEs to estimate the
number of fleets in scope using the following assumptions: Where the
transport intensity is less than 1, it is assumed that only a fraction of
businesses in the sector have a fleet of vehicles that will need auditing.
(2) The transport intensity ratio shows the proportion of businesses which have a
fleet in each sector and ratios over 1indicate that some businesses are more
likely to have both a fleet of HGVs and a car/van fleet. The ratio was capped
at 2 for the construction sector as organisations in it are less likely to own
more than one fleet. The transport intensity ratio was capped to 1 in the other
community services category due to differences between the categorisation
used by Oxford Economics and our dataset for Other services
The table below shows the number of non-SMEs in different industries95, the share of non-SMEs in different industries, the share of leased vehicles in different industries, the leased transport intensity ratio, the overall transport intensity ratio, and hence the estimate of the number of vehicle fleets that belong to different industries and will need auditing.
94
The economic impact of the motor vehicle full-service leasing and renting sector. A report produced for the BVRLA. This can
be found here http://www.oxfordeconomics.com/my-oxford/projects/232333 (accessed on the 06/01/2014). The report allocates a fraction of leased vehicles to the business services sector. However, this does not match into the business sectors from Companies House which that we exclude the vehicle leasing data from this analysis. 95
This is measured as the most common sector where organisations operate according to SIC data on their economic activity
and is not a statistic of the number of large enterprises operating in each sector.

74
Summing across the different industries, we obtain an estimate of the total number of fleets which are owned by non-SMEs of 8,504. We have rounded the estimated number of fleets which are owned by non-SMEs to 8,500. ESOS requires compliance from each organisation in scope’s highest domestic owner. We estimate (see section 6.1.1) that there are 9,382 domestic ultimate owners of organisations in scope of ESOS. The estimated number of individual large organisations (expanding corporate groups) is 11,502. Accordingly, our estimate of 8,500 transport fleets in scope of ESOS implies that around 74% of large organisations own a transport fleet.
Agriculture & Mining
Manufacturing Construction Retail & Wholesale
Hotels & Restaurants
Transport & Communication
Financial Services (including business services)
Education Health & Social work
Other services
Number of non-SME businesses.
73 1484 433 1900 463 871 2676 406 641 435
Share of non-SME businesses.
1% 16% 5% 20% 5% 9% 29% 4% 7% 5%
Share of leased vehicles
3% 23% 10% 20% 1% 6% 18% 1% 7% 11%
Leased transport intensity ratio
0.15 1.05 1.82 1 0.12 0.89 2.74 0.41 1.05 2.37
Overall transport intensity ratio.
1.00 1.45 2.00 0.99 0.20 0.65 0.63 0.23 1.02 1.00
Illustrative estimate of the number of non-SME fleets.
73 2158 866 1876 94 563 1689 94 657 435

75
Annex E – Detailed transport sector analysis 1. Introduction This annex identifies the transport energy consumption baseline for non-SME businesses. Surface transport (road and rail) and aviation and shipping are treated separately in this analysis. This work fed into the cost benefit analysis of ESOS in the transport sector. 2. Sources
Transport energy consumption forecasts are taken from DECC’s 2013 Updated Emissions Projections, and then converted to GWh using the appropriate conversion factor96. 3. Surface transport
3.1 Estimating all business transport energy consumption The first step in creating a business transport energy consumption baseline is to estimate what proportion of energy consumption can be attributed to business-related travel, for both SMEs and non-SMEs. For some modes, this is relatively straightforward – for example, it seems reasonable to assume that all transport fuel purchased for HGVs, rail, and bus and coach travel is purchased by business. For cars and vans, energy consumption attributable to both company car and van fleets and household cars completing trips for business purposes needs to be taken into account. DfT transport statistics identify the proportion of the vehicle stock which is licensed to companies rather than private individuals97. National Travel Survey statistics also show that average annual mileage for company cars is considerably higher than for privately owned vehicles (19,200 miles/annum vs 7900 miles/annum), so this information is used to weight the proportion of car fuel consumption allocated to business company car fleets. Together these assumptions suggest that 18% of car energy consumption is attributable to company car fleets. However, only a proportion of the mileage travelled in company cars is for business purposes: around 7,600 miles per annum. This suggests around 8% of total car energy consumption is by company cars used for business purposes. In generating this estimate the simplifying assumption has been made that average fuel efficiency across privately owned vehicles and business owned vehicles is the same, although this may not be the case as businesses are likely to replace vehicles in their fleets more regularly and newer models tend to be more fuel efficient. The National Travel Survey (NTS) also provides information about trip purpose for household cars. DfT analysis of the NTS suggests that 81% of total car CO2 emissions are generated by households, and by implication, 19% of car emissions are generated by business-owned cars. This figure is very close to the 18% estimated above, and is a useful sense-check. Analysis of the NTS suggests 11% of household car CO2 emissions are generated by trips for business purposes (this excludes commuting). Translating these figures to energy consumption suggests 9% (11% *81%) of car energy consumption can be attributed to cars owned by households travelling for business.
96
1 mtoe = 11630 GWh 97
DfT Vehicle Licensing Statistics, tables veh0202 and veh0402, https://www.gov.uk/government/publications/vehicle-
licensing-statistics-2011
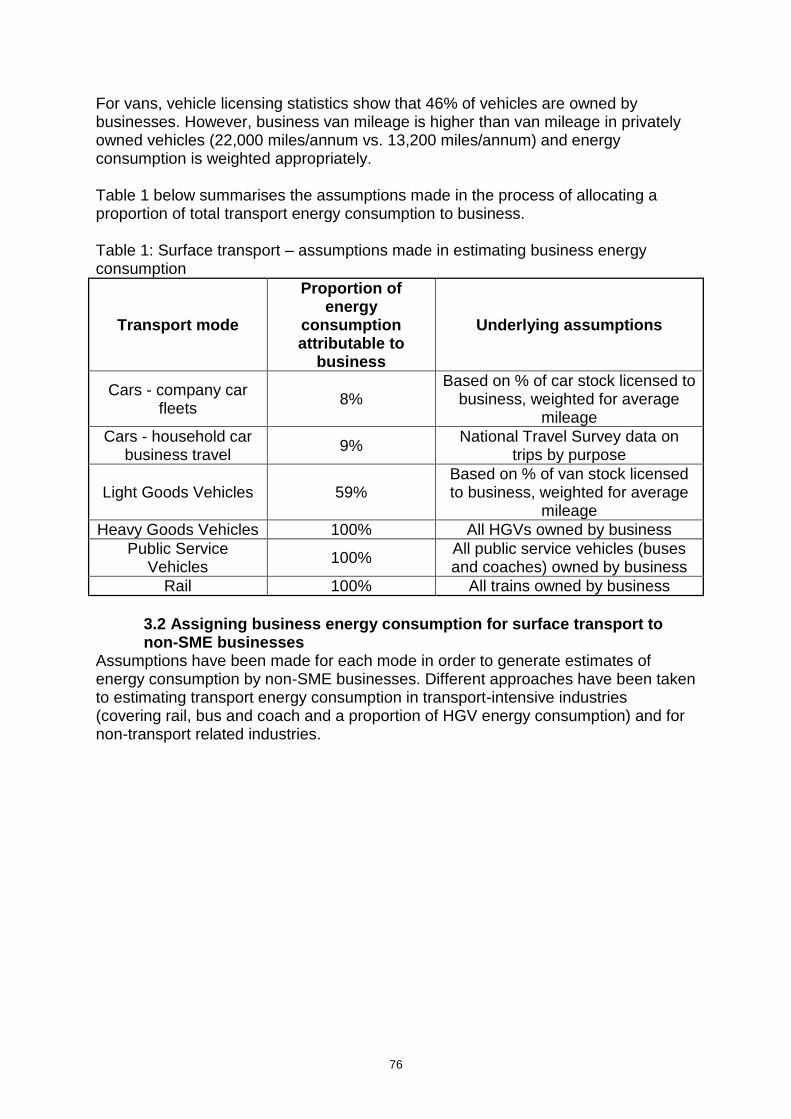
76
For vans, vehicle licensing statistics show that 46% of vehicles are owned by businesses. However, business van mileage is higher than van mileage in privately owned vehicles (22,000 miles/annum vs. 13,200 miles/annum) and energy consumption is weighted appropriately. Table 1 below summarises the assumptions made in the process of allocating a proportion of total transport energy consumption to business. Table 1: Surface transport – assumptions made in estimating business energy consumption
Transport mode
Proportion of energy
consumption attributable to
business
Underlying assumptions
Cars - company car fleets
8% Based on % of car stock licensed to
business, weighted for average mileage
Cars - household car business travel
9% National Travel Survey data on
trips by purpose
Light Goods Vehicles 59% Based on % of van stock licensed to business, weighted for average
mileage
Heavy Goods Vehicles 100% All HGVs owned by business
Public Service Vehicles
100% All public service vehicles (buses and coaches) owned by business
Rail 100% All trains owned by business
3.2 Assigning business energy consumption for surface transport to non-SME businesses
Assumptions have been made for each mode in order to generate estimates of energy consumption by non-SME businesses. Different approaches have been taken to estimating transport energy consumption in transport-intensive industries (covering rail, bus and coach and a proportion of HGV energy consumption) and for non-transport related industries.
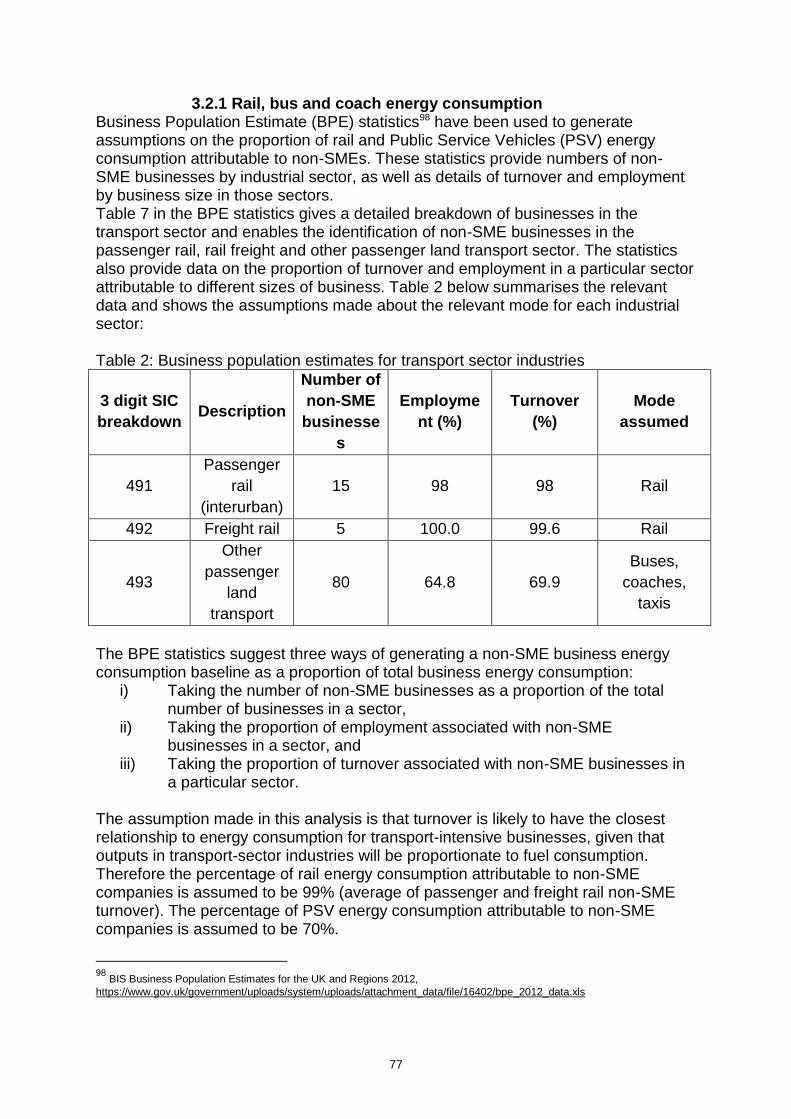
77
3.2.1 Rail, bus and coach energy consumption Business Population Estimate (BPE) statistics98 have been used to generate assumptions on the proportion of rail and Public Service Vehicles (PSV) energy consumption attributable to non-SMEs. These statistics provide numbers of non-SME businesses by industrial sector, as well as details of turnover and employment by business size in those sectors. Table 7 in the BPE statistics gives a detailed breakdown of businesses in the transport sector and enables the identification of non-SME businesses in the passenger rail, rail freight and other passenger land transport sector. The statistics also provide data on the proportion of turnover and employment in a particular sector attributable to different sizes of business. Table 2 below summarises the relevant data and shows the assumptions made about the relevant mode for each industrial sector: Table 2: Business population estimates for transport sector industries
3 digit SIC
breakdown Description
Number of
non-SME
businesse
s
Employme
nt (%)
Turnover
(%)
Mode
assumed
491
Passenger
rail
(interurban)
15 98 98 Rail
492 Freight rail 5 100.0 99.6 Rail
493
Other
passenger
land
transport
80 64.8 69.9
Buses,
coaches,
taxis
The BPE statistics suggest three ways of generating a non-SME business energy consumption baseline as a proportion of total business energy consumption:
i) Taking the number of non-SME businesses as a proportion of the total number of businesses in a sector,
ii) Taking the proportion of employment associated with non-SME businesses in a sector, and
iii) Taking the proportion of turnover associated with non-SME businesses in a particular sector.
The assumption made in this analysis is that turnover is likely to have the closest relationship to energy consumption for transport-intensive businesses, given that outputs in transport-sector industries will be proportionate to fuel consumption. Therefore the percentage of rail energy consumption attributable to non-SME companies is assumed to be 99% (average of passenger and freight rail non-SME turnover). The percentage of PSV energy consumption attributable to non-SME companies is assumed to be 70%.
98
BIS Business Population Estimates for the UK and Regions 2012,
https://www.gov.uk/government/uploads/system/uploads/attachment_data/file/16402/bpe_2012_data.xls

78
To summarise, the following assumptions are made in assigning a proportion of rail and PSV energy consumption to non-SMEs:
All rail and PSV energy consumption generated by transport sector industries, and
The proportion of energy consumption attributable to non-SME businesses in these sectors (passenger rail, rail freight, and other passenger land transport) is based on the proportion of turnover in the sector attributable to non-SMEs. 3.2.2 HGV energy consumption
HGV energy consumption can be divided between transport-sector industries (road freight and removal companies) and non-transport sector industries such as retail where large companies may run their own HGV fleets. To estimate non-SME HGV energy consumption, information is needed about the following:
Proportion of HGV energy consumption in transport sector industries i.e. road haulage businesses and removal services,
Proportion of HGV energy consumption in other sectors (e.g. retail, waste),
Non-SME businesses in road freight and removal services sector, and
Non-SME businesses with HGV fleets in other sectors.
DfT road freight statistics provide percentage of tonne kilometres which are ‘mainly own account’ and ‘mainly public haulage’99. ‘Public haulage’ is freight carried by HGVs owned by businesses that carry goods for hire or reward, whereas ‘own account’ is freight carried by HGVs owned by businesses that use the vehicle to carry goods within their own business. This provides us with a proxy for estimating the proportion of HGV energy consumption in transport sector and non-transport sector industries.
Mainly own account Mainly public haulage
% of tonne-kilometres 36% 64%
Using these figures suggests that 64% of HGV energy consumption might be attributable to businesses in the road freight and removals services sector. BPE statistics then provide data on the number of non-SME businesses in this sector (60 or 0.4% of the total) and the percentage of total turnover in this sector generated by these non-SME businesses (26.5%). As with the rail and PSV estimate, the percentage of turnover generated by non-SMEs is taken as a proxy for the proportion of energy consumption by non-SMEs. These assumptions suggest 17% (26.5% * 64%) of HGV energy consumption is attributable to non-SME road freight businesses. 36% of HGV tonne-kilometres are assumed to be generated by HGVs owned by non-transport sector businesses. However, no evidence has been found to suggest what proportion of businesses with their own HGV fleets would be classified as non-SME. For illustrative purposes, an assumption has been made that a high proportion of ‘own account’ tonne-kilometres are generated by HGV fleets associated with non-SME businesses. It seems reasonable to assume that larger businesses are more likely to run their own HGV fleets. The assumption made in the central case is that 80% of the remaining HGV energy consumption is attributable to non-SME
99
DfT Road Freight statistics, table rfs0108, https://www.gov.uk/government/publications/road-freight-statistics-2010

79
businesses running their own HGV fleets. Therefore, 29% (80% *36%) of HGV energy consumption is assumed to be attributable to non-SME businesses in non-transport intensive sectors.
3.2.3 Car and van energy consumption In the absence of evidence on the relationship between size of businesses and the size of their car and van fleets, illustrative assumptions have been made to assign a proportion of business car and van energy consumption to non-SME businesses. It is assumed 50% of company cars and vans are owned by non-SMEs, and that this translates to 50% of company car and van energy consumption. The implicit assumption made here is that travel patterns and fuel consumption are similar for company cars and vans owned by both SME and non-SME.
3.3 Summary – non-SME transport energy consumption baseline for surface transport
In generating a baseline forecast of non-SME transport energy consumption, the above assumptions on splits between business/non-business and SME/non-SME across the different modes have been held constant over time. This is a simplifying assumption and does not take account of, for example, possible future changes to the proportion of the car stock owned by business, or other key drivers of business transport energy consumption. Table 3 below shows total surface transport energy consumption, business surface transport energy consumption and non-SME surface transport energy consumption, given the assumptions outlined above.

80
Table 3 Baseline surface transport energy consumption (TWh)
2015 2020 2025 2030
Total 460 443 422 410
All business 211 211 208 211
% of total 46% 48% 49% 51%
Non-SME 111 111 110 112
% of total 24% 25% 26% 27%
4. Shipping
BIS Business Population Estimates suggest that there are no non-SME sea and coastal shipping freight businesses, and that there are ten sea and coastal passenger transport businesses. It has not been possible to assign a proportion of forecast shipping energy consumption to these businesses. Fuel costs are a significant proportion of a shipping firm’s operating costs and therefore there is already a strong incentive for operators to minimise those costs in the course of their business through, for example, setting optimum speeds (sometimes described as ‘slow steaming’). Energy efficiency is a high profile issue within the shipping industry and international negotiations in the International Maritime Organization have led to the development of the Energy Efficiency Design Index (EEDI) for new ships. The index requires new ships to meet a minimum energy efficiency level per capacity mile for different ship types and size segments. Given progress made in international negotiations, plus existing incentives for ship owners to reduce their fuel costs, it is not expected that ESOS assessments would lead to any affected shipping businesses taking up additional fuel saving measures. 5. Aviation
BIS Business Population Estimates suggest there are 20 non-SME passenger air transport businesses that will fall under the scope of ESOS assessments. It has not been possible to attribute a proportion of forecast aviation energy consumption to these businesses as energy consumption estimates are based on UK aviation fuel sales which includes sales to non-UK owned airlines. There are a number of reasons to expect that ESOS assessments would not drive additional fuel savings in aviation energy consumption. As with other energy-intensive business, fuel costs make up a significant proportion of total operating costs in the aviation industry100 and therefore there are clear incentives for airlines to undertake cost-effective actions to reduce fuel consumption, in order to improve their competitive advantage. DfT’s most recent published aviation forecasts assume an improvement in fuel efficiency of 8% between 2010 and 2030 in the central forecast, driven largely by the current fleet being replaced in the 2020s by a future generation of more fuel efficient aircraft101. There are limited options to retrofit existing aircraft to improve fuel efficiency in the shorter term and given aviation’s inclusion in the EU
100
IATA estimate fuel costs account for 30% of total operating costs,
http://www.iata.org/pressroom/facts_figures/fact_sheets/Pages/fuel.aspx 101
https://www.gov.uk/government/uploads/system/uploads/attachment_data/file/183931/aviation-forecasts.pdf

81
ETS, it is expected that any cost-effective actions to reduce fuel consumption and emissions would be undertaken in the counterfactual. Marginal abatement cost curves for the aviation sector developed for DfT in 2011 suggest that there are only limited actions to reduce fuel consumption that are less costly than purchasing EUAs102. A key measure is more efficient air traffic management which is not something that airlines themselves have control over. It therefore seems reasonable to assume that fuel efficiency improvements will be made as part of the natural fleet replacement cycle, as assumed in the aviation forecasts.
102
A Marginal Abatement Cost Curve Model for the UK Aviation Sector (AEA and EMRC, 2011)
https://www.gov.uk/government/uploads/system/uploads/attachment_data/file/4209/mac-report.pdf

82
Annex F – Fit with the UK policy landscape 1. Introduction
This annex covers how ESOS fits with the existing UK policy landscape. It does so by looking at three aspects:
The relationship between the requirements of ESOS and those of existing
policies,
The number of businesses in CRC which would fall under the ESOS
requirement, and
The energy consumption which is in scope of ESOS and is already being
measured and reported on under existing policies.
2. Policy instrument overlaps
Table 1 shows how ESOS relates to existing policies. It illustrates that there is a gap between requirements of Article 8 and the requirements of existing domestic UK policies.
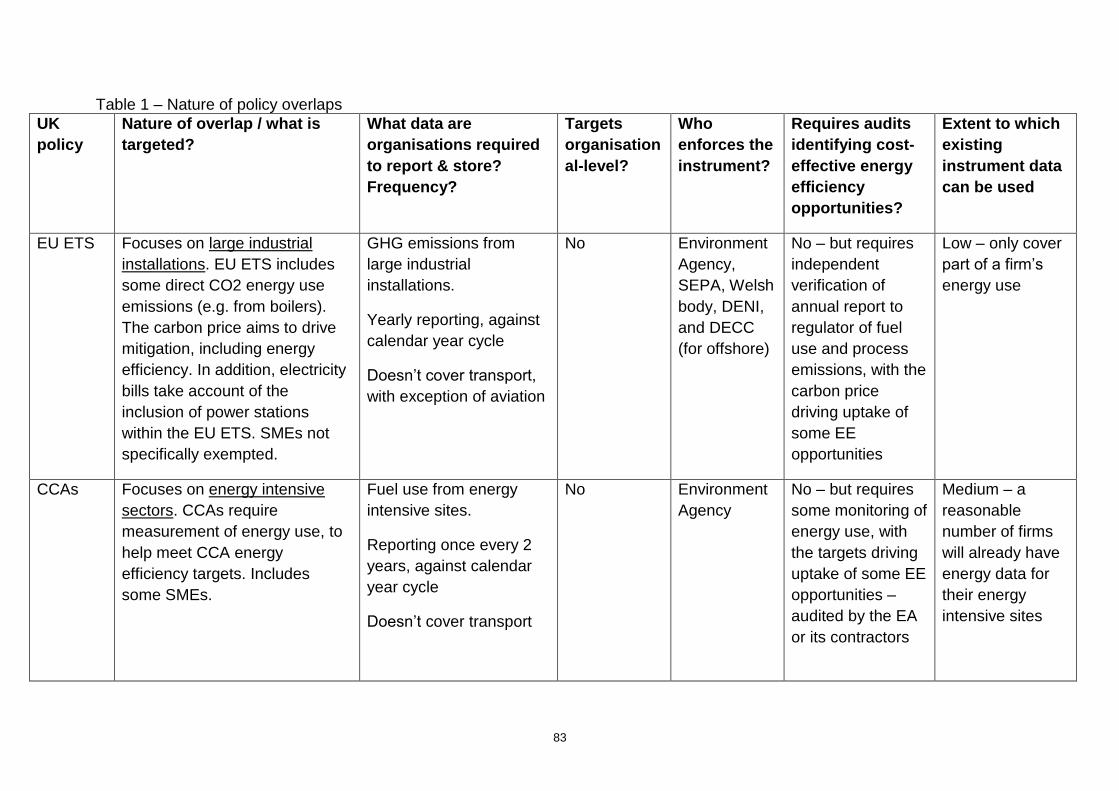
83
Table 1 – Nature of policy overlaps
UK
policy
Nature of overlap / what is
targeted?
What data are
organisations required
to report & store?
Frequency?
Targets
organisation
al-level?
Who
enforces the
instrument?
Requires audits
identifying cost-
effective energy
efficiency
opportunities?
Extent to which
existing
instrument data
can be used
EU ETS Focuses on large industrial
installations. EU ETS includes
some direct CO2 energy use
emissions (e.g. from boilers).
The carbon price aims to drive
mitigation, including energy
efficiency. In addition, electricity
bills take account of the
inclusion of power stations
within the EU ETS. SMEs not
specifically exempted.
GHG emissions from
large industrial
installations.
Yearly reporting, against
calendar year cycle
Doesn’t cover transport,
with exception of aviation
No Environment
Agency,
SEPA, Welsh
body, DENI,
and DECC
(for offshore)
No – but requires
independent
verification of
annual report to
regulator of fuel
use and process
emissions, with the
carbon price
driving uptake of
some EE
opportunities
Low – only cover
part of a firm’s
energy use
CCAs Focuses on energy intensive
sectors. CCAs require
measurement of energy use, to
help meet CCA energy
efficiency targets. Includes
some SMEs.
Fuel use from energy
intensive sites.
Reporting once every 2
years, against calendar
year cycle
Doesn’t cover transport
No Environment
Agency
No – but requires
some monitoring of
energy use, with
the targets driving
uptake of some EE
opportunities –
audited by the EA
or its contractors
Medium – a
reasonable
number of firms
will already have
energy data for
their energy
intensive sites
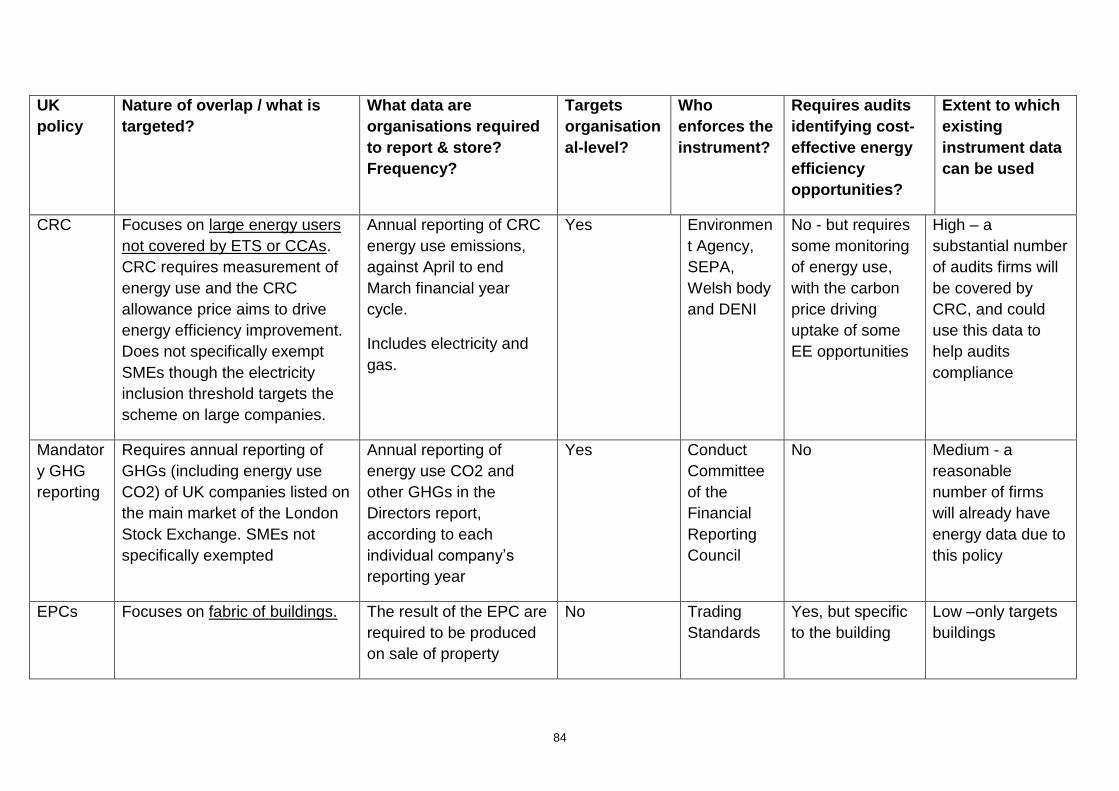
84
UK
policy
Nature of overlap / what is
targeted?
What data are
organisations required
to report & store?
Frequency?
Targets
organisation
al-level?
Who
enforces the
instrument?
Requires audits
identifying cost-
effective energy
efficiency
opportunities?
Extent to which
existing
instrument data
can be used
CRC Focuses on large energy users
not covered by ETS or CCAs.
CRC requires measurement of
energy use and the CRC
allowance price aims to drive
energy efficiency improvement.
Does not specifically exempt
SMEs though the electricity
inclusion threshold targets the
scheme on large companies.
Annual reporting of CRC
energy use emissions,
against April to end
March financial year
cycle.
Includes electricity and
gas.
Yes Environmen
t Agency,
SEPA,
Welsh body
and DENI
No - but requires
some monitoring
of energy use,
with the carbon
price driving
uptake of some
EE opportunities
High – a
substantial number
of audits firms will
be covered by
CRC, and could
use this data to
help audits
compliance
Mandator
y GHG
reporting
Requires annual reporting of
GHGs (including energy use
CO2) of UK companies listed on
the main market of the London
Stock Exchange. SMEs not
specifically exempted
Annual reporting of
energy use CO2 and
other GHGs in the
Directors report,
according to each
individual company’s
reporting year
Yes Conduct
Committee
of the
Financial
Reporting
Council
No Medium - a
reasonable
number of firms
will already have
energy data due to
this policy
EPCs Focuses on fabric of buildings. The result of the EPC are
required to be produced
on sale of property
No Trading
Standards
Yes, but specific
to the building
Low –only targets
buildings

85
UK
policy
Nature of overlap / what is
targeted?
What data are
organisations required
to report & store?
Frequency?
Targets
organisation
al-level?
Who
enforces the
instrument?
Requires audits
identifying cost-
effective energy
efficiency
opportunities?
Extent to which
existing
instrument data
can be used
DECs Focuses on operational use of
buildings. Only mandated on
public sector
Result must be displayed
in public place
No Trading
Standards
Yes, but specific
to the building
Low – not
mandated on
business, only
targets buildings
Non-
domestic
Green
Deal
Voluntary, provides finance
targeting EE in non-domestic
buildings. Includes
measurement of energy use and
identification of EE opportunities
Uses similar methodology
to EPCs. Results of
assessment lodged with
central body.
No Yes, but specific
to the building
Low – not
mandated on
business, and only
targets buildings
ESOS Focuses on large companies
(SMEs are exempt). Targets UK
energy use within the whole
organisation, including buildings,
transport and processes
Energy consumption and
potential for energy
efficiency improvements.
ESOS assessment
required every 4 years,
and data must be
storable.
Yes Scheme
administrato
r
Yes N/A

86
3. Number of Businesses covered by CRC and CCAs
This section sets out the analysis done to estimate the number of non-SMEs in scope of ESOS that are also covered by existing policies. This analysis is used to estimate the number of organisations that are already collecting the data needed for ESOS assessments (and therefore face a lower administration burden).
3.2 Summary This analysis shows that the number of firms covered by the CRC is very similar to the coverage of non-SMEs. The total turnover of the two groups is also very similar. Based on data from 2010/11 a possible range of estimates of the number of non-SMEs in CRC would be:
A low estimate of 4,400 firms based on the number of Significant Group
Undertakings(SGUs) in CCA,
A central estimate of 5,400 based on the number of non-SMEs who declared information
for CRC in 2008, and
A high estimate of 6,400 based on the number of SGUs and 1.47 ratio of VAT
registrations to SGUs.
Given that most CRC participants are very large organisations,1 it is likely that the same firms are covered by both schemes however this cannot be verified as:
Results are not comparable using official statistics because organisations in the CRC
report the main activity of the primary parent organisations, which in 20% of the cases
relates to management of holding companies. This would fall into a large variety of
activities in BIS Businesses Population Estimates.
There are no employment figures in the CRC database that would allow a robust
matching process.
The results should be treated with care and further research would be recommended to identify enterprises with large number of employees but low energy intensity. These organisations would be in the scope of ESOS but could fall out of the CRC.
3.3 Definitions of firms In comparing statistics from BIS Business Population Estimates and the CRC it is important to understand the different coverage and definition of what constitutes a single businesses entity BIS defines non-SME firms as those firms employing more than 250 full-time equivalent employees. In turn, a firm is defined as individual registration for VAT or National Insurance Contributions. A large part of the analysis in this paper is based on converting data from CRC organisations into VAT basis as reported in BIS Business Population Estimates. The definition of a CRC organisation is based in top parent organisation registered in Companies House2. Most parent organisations in the CRC would own other firms. Therefore it is important to estimate how many large VAT registered firms with more than 250 employees are associated with each of the parent organisation registered in the CRC. The CRC allows some reporting to be done at lower levels of disaggregation, breaking down large parent organisations into smaller units. This reporting has been used to estimate the equivalent number of CRC registered firms in VAT basis. These are the main CRC definitions that have been used in this analysis. CRC primary parent organisations (2,131 firms): This is a company at the top of the structure of a firm which could be a single entity or own other firms or groups of firms. Significant Group Undertaking (SGU) (4,362 firms): Where an organisation has any subsidiaries that would be eligible to participate in their own right were they not part of a group, these large subsidiaries are known as SGUs. CRC parent organisations have the choice to
1 The proportion of emissions from participants with a threshold electricity consumption above 10,000MWh is 98% based on phase I registration
report. 2 The scheme draws on the Companies Act 2006 definitions of parent and subsidiary undertakings to define the relationships within the Group,
specifically using the definition of ‘Group Undertaking’ set out in section 1161(5) of the Act.

87
disaggregate large subsidiaries to participate in CRC separately, but current rules do not allow them to disaggregate if what is left in the parent company would be below the 6000MWh threshold. CCA applicable companies (estimated 6,423): This would be the equivalent to a VAT registered firm but it is reported only in specific circumstances. If a significant proportion of an organisation’s emissions are covered by a CCA, they may be exempt from CRC altogether. Therefore, the CRC reporting covers the organisational structure in more detail when CCA exemptions are claimed. Figure 1 shows an example of an organisation which owns two CCA target units. Parent A owns 4 SGUs, X, Y Z and M. In turn M owns 3 independent firms, S1, S2 and S3 and two of them (S1 and S2) own a CCA facility. Using this example, the number of SGUs would be 4 and the number of independent companies would be 6 producing a ratio of 1.5 independent companies per SGU3.
Figure 1 CRC Structure4
Company’s structure below SGU level is only reported when there are CCAs. This example shows that it may not reflect the whole structure of the company but provides a better understanding of the equivalence between the number of VAT registrations and the ownership structure reported in the CRC.
3.4.1 Descriptive statistics of non-SME business from National Statistics According to BIS Business Population Estimates, in 2010 there were 6,320 Non-SME firms in the UK, with a turnover of £1.56 trillion. Note this figure is different to the 7,625 discussed in Section 6.1.1 of the Impact Assessment because it refers to private sector organisation only and is based on 2010 statistics, which are used here given because they are being compared to 2010 CRC reporting data. The following section tries to identify how many of these businesses are covered by the CRC and CCAs. It uses CRC statistics because at organisational level there is a large overlap between the CRC and large CCA organisations5.
3.4.2 Descriptive statistics of non-SME business from CRC CRC, CCA and EU-ETS focus on large energy users6. This analysis uses the assumption that all CRC firms are non-SMEs. This is based on assuming that there is a correlation between large energy use (above 6000MWh) and number of employees. Using the VAT registration definition, the analysis suggests there are potentially 6,423 firms covered by the CRC, with 2,455 falling into manufacturing sectors and 1,683 owning at least one CCA facility. The main source of data is the CRC annual and footprint report 2010-11 which contains detailed energy statistics of organisations participating in the CRC.
3 Notice that there would not be data in the CRC reporting about company S3.
4 Source: CRC Energy Efficiency Scheme guidance for participants in Phase 1 (2010-2011 to 2013-2014) Version 2 Published February 2013
5 Internal research on CCAs qualification for the CRC carried out by AEA for DECC.
6 CRC is based on parent organisations and CCA and EU ETS on installations.

88
This estimate has been calculated as follows: In the CRC 2010/11 annual report, there are 2,131 Parent Organisations and 4,362 Significant Group Undertakings SGU with an average of 2.05 SGUs per participant.7 These organisations have a registered turnover of £1.67 trillion (slightly higher than turnover from non-SME firms). These figures should be considered robust; they are based on administrative data which is subject to audits and there are penalties associated with miss-reporting. It is most likely that there is at least one large firm in VAT basis per every Significant Group Undertaking. This would generate a minimum of 4,362 firms in VAT basis. However, as shown in Figures 1 and 2 it is likely that there would be other firms below SGUs that could also qualify as individual firms when using the VAT registration definition. The CRC data does not report the structure of each organisation at this level so it is uncertain how many firms there are per group undertaking. However, when SGUs own CCAs they also report the company to which this CCA applies which may be another SGU or not. The CRC database can therefore be used to determine the number of single SGUs that that own at least one CCA facility (1143) and the number of individual companies that own these CCA facilities (1683). The average number of firms per SGU is therefore ~1.47 firms per group. If we apply the same ratio to the CRC, it suggests there could be a total of 6,423 firms covered by the CRC. However, there remains considerable uncertainty around this figure.
It uses data from manufacturing which represents a small proportion of all CCA
participants. The ratio of SGUs to VAT registrations could be higher or lower in other
sectors.
It assumes that all the CCA company applicable are large firms.
This analysis results in 2 SGUs per primary parent organisation and 1.5 VAT registered firms per SGU. The results also show a close match between the number of large firms on employment basis (BIS Business Populations estimates) and the number of large firm in energy consumption basis (CRC database). These have to be interpreted carefully as there is no validation of the actual number of non-SME firms per SGU in the CRC. A possible range of estimates of the number of non-SMEs in CRC would be:
A low estimate of 4,400 firms based on the number of SGUs, and
A high estimate of 6,400 based on the number of SGUs and 1.47 ratio of VAT
registrations to SGUs.
3.4 Information declarers A sensitivity check on the number of non-SMEs in CRC was carried out by estimating the number of non-SMEs outside CRC, using 2008 data from the Environment Agency (EA). When CRC was set up, organisations that consumed below 6,000 MWh of qualifying supplies of electricity in 2008 had to report their name and Company House number to the EA. A systematic random sample of these information declarers was selected and their employment size was checked through their Company House number. This produced an estimate of around 1,900 non-SMEs out of around 11,500 enterprises and non-profit organisations that fell below the CRC threshold. This estimate is compatible with the range of 4,400-6,400 non-SMEs in CRC. We have used this as a central estimate for overlaps, giving 5,400. There is a degree of uncertainty around this estimate because the data refers to 2008.
3.5 Uncertainty Ownership of large organisations is complex. Although aggregate figures seem to match in both data sets, it is quite hard to confirm this point at lower levels of disaggregation. It is possible that the CRC would include a larger number of energy intensive organisation and that BIS population estimates would include more employment intensive organisations. Both could cancel out producing spurious results.
7 This analysis excludes the 633 public sector organisations in the CRC.
89
The CRC reports SIC codes for parent organisations only. In 20% of the cases, the main SIC code of these large parent organisations correspond to activities related to management of holding companies. This could be anything, from real estate trust to large industrial conglomerations. As a result, it is not possible to disaggregate CRC data into energy intensive and employment intensive sectors and. In turn, it is not possible to do cross checks between BIS population estimates and the CRC for some relevant sectors. 4. Energy Overlaps
This section presents the analysis of the energy overlaps in the policy landscape, which was used in the quantitative analysis of benefits. The outputs of this analysis are the Venn diagrams presented in Section 6.2 of the Impact Assessment, which show how energy consumption in the business sector is split between policies and fuels for non-SMEs.
4.1 Inputs to cost benefit analysis There are two proportions that underpin analysis in the Impact Assessment:
It is estimated that 37-40% (or 57-67TWh) of non-SME electricity use is not covered by
the CRC or CCA.
It is estimated that up to 9% (or 30 TWh) of non-SME other energy use is not covered by
the CRC, CCA or EUETS.
4.2 Key Assumptions and Methodology Choices Due to a relative lack of evidence in this area, the overlaps analysis has to make some key simplifying assumptions and methodology choices:
1. Assumption - The energy use of SMEs in the CRC is very small compared to the energy
use of non-SMEs and is therefore taken as zero. Therefore all consumption in the CRC is
taken to be non-SME.
2. Assumption - If a site in the CCA belongs to a non-SME, the non-SME organisation will
be part of the CRC. The CRC reporting data then allows the CCA energy use to be
divided between SME and non-SME.
3. Methodology choice - There is uncertainty in how much non electricity energy the ETS
covers. Therefore a range of values are used to reflect this uncertainty.
4. Methodology choice - A top down approach can be used to estimate the split of total
energy use in the business sector between non-SMEs and SMEs.
4.3 Definitions Business sector – The business sector has been defined to include: the commercial sector, industry (buildings and processes), the energy industry and agriculture. Transport and the public sector are out of scope of the energy overlaps analysis. This definition aligns with the DUKES8 categories: energy industry, industry, commercial, agriculture, miscellaneous. Other energy/fuel use - Energy use from all fuels other than electricity (e.g. gas, petroleum products, coal, bio energy, heat sold).
4.5 Methodology This section sets out the methodology used to produce the energy overlaps Venn diagrams in greater detail. Step 1 – Calculate energy overlaps for business sector in terms of final energy consumption
8 https://www.gov.uk/government/organisations/department-of-energy-climate-change/series/digest-of-uk-energy-statistics-dukes
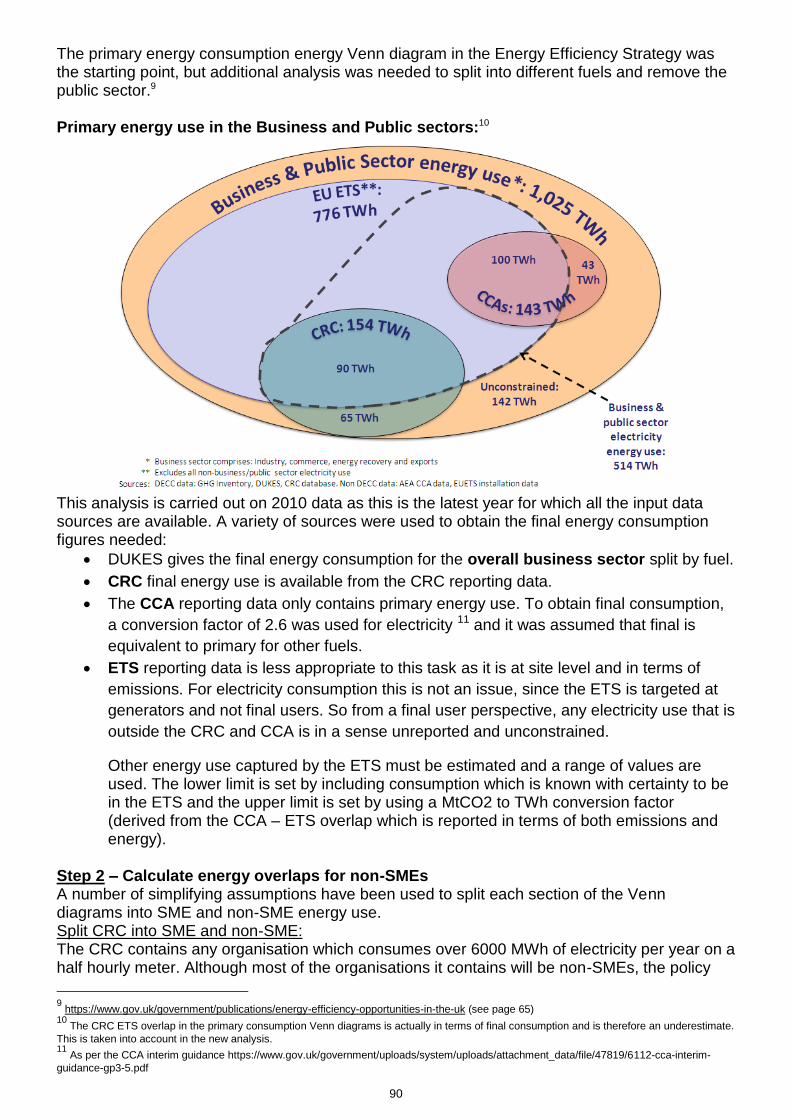
90
The primary energy consumption energy Venn diagram in the Energy Efficiency Strategy was the starting point, but additional analysis was needed to split into different fuels and remove the public sector.9 Primary energy use in the Business and Public sectors:10
This analysis is carried out on 2010 data as this is the latest year for which all the input data sources are available. A variety of sources were used to obtain the final energy consumption figures needed:
DUKES gives the final energy consumption for the overall business sector split by fuel.
CRC final energy use is available from the CRC reporting data.
The CCA reporting data only contains primary energy use. To obtain final consumption,
a conversion factor of 2.6 was used for electricity 11 and it was assumed that final is
equivalent to primary for other fuels.
ETS reporting data is less appropriate to this task as it is at site level and in terms of
emissions. For electricity consumption this is not an issue, since the ETS is targeted at
generators and not final users. So from a final user perspective, any electricity use that is
outside the CRC and CCA is in a sense unreported and unconstrained.
Other energy use captured by the ETS must be estimated and a range of values are used. The lower limit is set by including consumption which is known with certainty to be in the ETS and the upper limit is set by using a MtCO2 to TWh conversion factor (derived from the CCA – ETS overlap which is reported in terms of both emissions and energy).
Step 2 – Calculate energy overlaps for non-SMEs A number of simplifying assumptions have been used to split each section of the Venn diagrams into SME and non-SME energy use. Split CRC into SME and non-SME: The CRC contains any organisation which consumes over 6000 MWh of electricity per year on a half hourly meter. Although most of the organisations it contains will be non-SMEs, the policy
9 https://www.gov.uk/government/publications/energy-efficiency-opportunities-in-the-uk (see page 65)
10 The CRC ETS overlap in the primary consumption Venn diagrams is actually in terms of final consumption and is therefore an underestimate.
This is taken into account in the new analysis. 11
As per the CCA interim guidance https://www.gov.uk/government/uploads/system/uploads/attachment_data/file/47819/6112-cca-interim-
guidance-gp3-5.pdf

91
does cover some SMEs. The simplifying assumption made is that the energy use of the SMEs in the CRC is negligible compared to the energy use of non-SMEs, and is therefore assumed to be zero. This assumption is consistent with those used in the analysis of the overlaps in terms of number of organisations. Split CCA into SME and non-SME: Any organisation that is in the CRC will also report emissions that are covered by the CCA. It is assumed that all non-SME CCA sites will be captured by the CRC, and therefore it is possible to obtain the proportion of CCA emissions which are non-SME. In reality there will be some non-SMEs sites in the CCA which are not part of the CRC but the expectation is that they cover a small fraction of CCA emissions. The energy split is assumed to be the same as the emissions split. To split ETS into SME and non-SME: The ETS record level data contains the name of the organisation owning the site. It also partially matches to Experian data, which contains information on company size and turnover. The record level data was filtered to exclude generators and the public sector. A sample of 60% of ETS sites was examined and split between SME and non-SME on the basis of this information. Based on this analysis, it is estimated that 1% of emissions (and hence 1% of other energy use) in the ETS belongs to SMEs. To split unconstrained into SME and non-SME: It is not possible to estimate this split directly, so the split for the total business sector is estimated and the unconstrained non-SME consumption can be taken as the residual of the total and policy results. A top down approach was used to split business sector consumption between SMEs and non-SMEs. This approach made the following additional assumptions:
All consumption in the energy industry is non-SME,
Non CRC/CCA consumption can be split between SME and non-SME using a range of
proportions based on NEED 12 analysis and business turnover analysis (this suggests
that 39-51% of electricity and 31-51% of gas in this sector is non-SME), and
Non metered fuels split between SME and non-SME in a different way to metered fuels.
This section of the analysis contains the most uncertainty. Sensitivity analysis was run for this top down approach to determine at which point assumptions broke down and produced inconsistent results. The range of values presented takes this into account.
12
National Energy Efficiency Data framework, links non domestic business and property attribute data to consumption.

92
Annex G – Literature review 1. Introduction
This annex presents the literature review of energy efficiency audits, which is summarized in in Section 6.4.2 of the Impact Assessment. 2. Overview
A number of articles have been written on the impact of existing audit policies from across the world. The audit programmes examined are all different and the studies themselves use a variety of different methodologies. However, they do provide some evidence of the impact of energy auditing regimes, including the number of recommendations typically adopted, the required payback period for energy efficient projects and the energy savings that were delivered.
3.1 SMEs and energy audits evaluation in the US Anderson and Newell (2004) carried out an analysis of 9,034 US small and medium-sized manufacturers who participated in IAC (the US Department of Energy’s Industrial Assessment Centres energy audits programme), which was funded by the Government. The data was collected by IAC from 1981 to 2000. The IAC programme consists of a free assessment report that recommends opportunities to increase energy efficiency and of an ex-post analysis of the effects of the audit. Their study has shown an average 53% uptake of measures and an average payback period of 1.3 years. In particular, over 98% of firms have estimated payback thresholds less than 5 years, and about 79% have payback thresholds less than 2 years. The average cost of implementing an energy efficiency project was $7,400 and they delivered estimated savings of $5,600 per year.13
3.2 Energy efficiency behaviour and preferred policy options of SMEs in Leeds
Bradford and Fraser (2008) produced a study based on 112 interviews to SME’s carried out in 2005 in Leeds. They disaggregated the SME’s into sub-sectors based on economic sector and employee size: manufacturing, construction, commercial and small/medium. Then they studied their different behaviours toward energy saving measures and preferred policy instruments. They report that 53% of their sample adopted energy efficiency measures.
3.3 Large enterprises and energy audits evaluation in Australia
Harris et al. (2000) researched an Australian Government audit programme, which ran for 6 years until 1997 and was taken up by 1200 firms. Auditing costs were subsidised for 50% of the cost up to a maximum amount. The paper investigates the rates of adoption of energy efficiency measures and the reasons why the recommendations are not taken up. The data used comes from a survey of 100 randomly selected (typically large) firms that took part. They found an 81% take up rate, with an average cost of implementing all recommendations of about $85,000 per firm (the average cost of implemented recommendations was $61,000). They also reported an average 3.5 year payback period for their studied sample. The energy savings per firm were worth about $300,000 for all recommendations and $255,000 for implemented recommendations.14
3.4 Energy audits evaluation in Sweden
13
In 2000 US$. 14
In 1991-1997 average US$, calculated using the following exchange rate from A$: 1A$1 was on average, equal to US$0.70 over this period.
93
Thollander et al (2008) evaluated free audit programme in Sweden, partly funded by the EU, which ran from 2003 to 2008 for SME’s. 340 energy audits were carried out by a Swedish regional energy agency. The data used refers to the first 47 firms to take part to the evaluation, suggesting the sample may be biased due to self-selection. They reported an average uptake of 22% for actual implemented measures, and an uptake of 44% for implemented measures and those measures that the firms were planning to implement. They estimated this lead to an average 3.8% energy saving as a consequence of implementing recommendations and 8.8% if both implemented and planned measures were implemented. They estimate the average costs to government per firm of €1106 for the audit subsidy, €630 administrative cost and an investment cost to the firm of €198,575. Adopted measures covered space heating, ventilation, compressed air, lighting, production processes, educational and water. 4. Bibliography
Anderson, S.T. & Newell, R.G., 2004. Information programs for technology adoption: the case of energy-efficiency audits, Resource and Energy Economics. Harris, J, Anderson, J. & Shafron, W., 2000. Investment in energy efficiency: A survey of Australian firms, Australian Bureau of Agricultural and Resource Economics, GPO Box 1563, Canberra, ACT 2601, Australia Thollander, Patrik, Danestig, M. & Rohdin, Patrik, 2007. Energy policies for increased industrial energy efficiency: Evaluation of a local energy programme for manufacturing SMEs. Bradford, J. & Fraser, E.D.G., 2008. Local authorities, climate change and small and medium enterprises: Identifying effective policy instruments to reduce energy use and carbon emissions, University of Leeds, Sustainability Research Institute, Leeds, United Kingdom.

94
Annex H – Estimating the number of audits to be undertaken Outline The number of non SME UK businesses is used in the ESOS model to calculate the costs and benefits of the policy. The data source is the Inter Departmental Business Register (IDBR). Businesses are reported at Domestic Ultimate Owner (DUO) level and are divided into high level sectors. The DUO is the legal entity which will be required by ESOS to carry out audits. The cost benefit analysis assumes that audit costs vary depending on the industry that businesses operate in due to differences in their energy use patterns. IDBR data reports economic activity in standardised SIC codes and some large organisations have several SIC codes attached, which needed to be translated into discrete industries in line with our cost benefit approach. This methodology note focuses on the process of finding the most common industry sector for each DUO. This is necessary as some DUO’s operate with multiple SIC codes. The number of these audits is then scaled up to reflect the expectation that some businesses could disaggregate into their secondary sector division and undertake an additional audit. 1. Data source and definition of non-SME
IDBR is an administrative database of information on all UK registered businesses including turnover, activity, and employment, The DUOs in scope of ESOS are “large undertakings” defined as: An undertaking which has:
- 250 or more employees
Or
- Has fewer than 250 employees but has both an annual turnover exceeding £42.5m, and
a balance sheet exceeding £36.5m
NB: As IDBR data does not feature balance sheet information, annual turnover will be used for the second criterion. 2. Categorising organisation sectors
2.1 Overall approach
Three high level sectors based on the main differences in business operation and audit
requirements were prepared based on 2 digits SIC 2007 codes of company activity. The
sectors and their constituent activities are based on earlier assumptions used during the
consultation process. They currently follow the structure in Fig 1.
Figure 1 – Sector breakdown into SIC 2007 codes

95
2.2 Assigning sectors to companies with distinct major activity
Large DUOs are sometimes assigned multiple SIC codes to reflect their diverse activities. DUOs were assigned a representative sector based on where the majority of their SIC code records lie. Each DUO’s SIC codes were sorted into a frequency table and the SIC code of the frequency peaks was recorded. Therefore this approach looks for the mode of SIC codes. Then these codes were matched to the relevant sector to give the organisation’s representative sector as demonstrated in Table 1’s example.
Table 1 Example frequency table of DUO activities
SIC(2007) 2 digit
GUO 01 02 03 …35 ..49.. ..77 78..
ABC PLC15
FREQUENCY=0 FREQ=3 FREQ=0 FREQ=1 FREQ=0 FREQ=3 FREQ=0
TOTAL COMMERCIAL =3+3=6 TOTAL INDUSTRY = 1 TOTAL TRANSPORT= 0
- Frequency peaks are observed in SIC 02 and 77. - Both frequency peaks are in COMMERCIAL
ABC PLC sector is labelled as COMMERCIAL sector in our analysis
2.3 Assigning sector codes to companies without major activity (equal split between
sectors)
Some companies had an equal split of (most frequent) activities between sectors; this was the case for 134 DUOs. For instance ABC products Inc’s records could indicate its most frequent SIC designation was equally split between Commercial and Industrial sectors. Due to the difficulty of reliably assigning a single sector to businesses with such high vertical integration, they were double counted, once in each of the sectors. It was considered to count them as half in each sector, however in practice DUOs will probably take a full audit for each of their dominant sectors so this approach was rejected.
3. Sector statistics
There are 11,502 large enterprises which are owned by 9,382 Domestic Ultimate Owners.
15
ABC Plc is a fictional example
Commercial (includes non-
Industry
Transport H
A, F, G, I- U 01-04, 40-48, 54-99
05-39
49-53
B, C, D, E
Sector SIC (2007)
Group
SIC (2007) 2 digit codes

96
Figure 2 shows the breakdown of DUOs. Figure 2 DUO breakdown into sector
4. Removing public sector enterprises from IDBR database
The IDBR dataset report all non-SME enterprises, including those in the public sector or majority (50%+) public-funded. The latter are not in scope of ESOS and were filtered out by removing known public sector enterprises and sampling the level of public sector ownership in industries such as education, health etc., where public ownership could be high. Enterprises in SIC 2007 code 84 “Public administration and defence; compulsory social security” were filtered out as they are in the public sector. In addition all universities and university colleges were filtered out because public sector funding forms significantly less than 50% of their income16. Next all enterprises whose domestic ultimate owner was a known public sector enterprise were filtered out. With these enterprises removed, a list of sectors with potentially high public ownership was drawn up (see Table 2 below) and a random sample of enterprises was taken from each sector to determine the actual share of enterprises majority owned by the state. This percentage was applied to the sector as a whole to indicate the number of enterprises expected to fall out of scope by being in public ownership. Table 2: Sectors with potentially high level of public sector ownership
Sector SIC division
Education 85
Human Health 86
Residential care 87
Social Work 88
Museums and libraries 91
16
Universities UK, “The Funding Environment for Universities”, 2013;
http://www.universitiesuk.ac.uk/highereducation/Documents/2013/FundingEnvironmentForUniversities.pdf
Commercial
(includes non-
profit)
Industry
Transport 405
7,391
1,452
Distinct Sectors of
Activity Multiples Sectors of
Activity
9,248 134
Total before
disaggregation =
9,382
SPLIT
SPLIT
SPLIT
97
5. Disaggregation of companies to arrive at final estimate
Figure 3 shows the process of disaggregation.
It is expected that given the large operations of DUOs in scope of ESOS, some will choose to
disaggregate and perform an additional audit at subsidiary level, possibly within an additional
sector. For DUOs which have no major activity as they fall in two sectors, they have been
double counted in each of the sectors the split between, as in 2.3. The 134 DUOs in this
category have registered as operating in two different sectors with two instances of split across
3 sectors, giving a total of 270.
For DUOs with a clearly identifiable main sector of activity, it was assumed 10% might
disaggregate into smaller units and perform an additional audit, giving 10,173 audits.
The final figure used for the purposes of our central estimate of the number of audits
required is the sum of these disaggregated figures, i.e. 270 + 10,173= 10,443

98
Annex I – Extract from Energy Efficiency Directive EED
Article 8 Energy audits and energy management systems
1. Member States shall promote the availability to all final customers of high quality energy audits which are cost-effective and: (a) carried out in an independent manner by qualified and/or accredited experts according to qualification criteria; or (b) implemented and supervised by independent authorities under national legislation. The energy audits referred to in the first subparagraph may be carried out by in-house experts or energy auditors provided that the Member State concerned has put in place a scheme to assure and check their quality, including, if appropriate, an annual random selection of at least a statistically significant percentage of all the energy audits they carry out. For the purpose of guaranteeing the high quality of the energy audits and energy management systems, Member States shall establish transparent and non-discriminatory minimum criteria for energy audits based on Annex VI. Energy audits shall not include clauses preventing the findings of the audit from being transferred to any qualified/accredited energy service provider, on condition that the customer does not object. 2. Member States shall develop programmes to encourage SMEs to undergo energy audits and the subsequent implementation of the recommendations from these audits. On the basis of transparent and non-discriminatory criteria and without prejudice to Union State aid law, Member States may set up support schemes for SMEs, including if they have concluded voluntary agreements, to cover costs of an energy audit and of the implementation of highly cost-effective recommendations from the energy audits, if the proposed measures are implemented. Member States shall bring to the attention of SMEs, including through their respective representative intermediary organisations, concrete examples of how energy management systems could help their businesses. The Commission shall assist Member States by supporting the exchange of best practices in this domain. 3. Member States shall also develop programmes to raise awareness among households about the benefits of such audits through appropriate advice services. Member States shall encourage training programmes for the qualification of energy auditors in order to facilitate sufficient availability of experts. 4. Member States shall ensure that enterprises that are not SMEs are subject to an energy audit carried out in an independent and cost-effective manner by qualified and/or accredited experts or implemented and supervised by independent authorities under national legislation by December 2015 and at least every four years from the date of the previous energy audit. 5. Energy audits shall be considered as fulfilling the requirements of paragraph 4 when they are carried out in an independent manner, on the basis of minimum criteria based on Annex VI, and implemented under voluntary agreements concluded between organisations of stakeholders and an appointed body and supervised by the Member State concerned, or other bodies to which the competent authorities have delegated the responsibility concerned, or by the Commission. Access of market participants offering energy services shall be based on transparent and non-discriminatory criteria. 6. Enterprises that are not SMEs and that are implementing an energy or environmental management system - certified by an independent body according to the relevant European or International Standards - shall be exempted from the requirements of paragraph 4, provided that Member States ensure that the management system concerned includes an energy audit on the basis of the minimum criteria based on Annex VI. 7. Energy audits may stand alone or be part of a broader environmental audit. Member States may require that an assessment of the technical and economic feasibility of connection to an existing or planned district heating or cooling network shall be part of the energy audit. Without prejudice to Union State aid law, Member States may implement incentive and support schemes for the implementation of recommendations from energy audits and similar measures.

99
ANNEX VI
Minimum criteria for energy audits including those carried out as part of energy management systems The energy audits referred to in Article 8 shall be based on the following guidelines: (a) be based on up-to-date, measured, traceable operational data on energy consumption and (for electricity) load profiles; (b) comprise a detailed review of the energy consumption profile of buildings or groups of buildings, industrial operations or installations, including transportation; (c) build, whenever possible, on life-cycle cost analysis (LCCA) instead of Simple Payback Periods (SPP) in order to take account of long-term savings, residual values of long-term investments and discount rates; (d) be proportionate, and sufficiently representative to permit the drawing of a reliable picture of overall energy performance and the reliable identification of the most significant opportunities for improvement. Energy audits shall allow detailed and validated calculations for the proposed measures so as to provide clear information on potential savings. The data used in energy audits shall be storable for historical analysis and tracking performance.
ANNEX XIV
3.3. Energy audits and management systems (Article 8) National Energy Efficiency Action Plans shall include: (a) the number of energy audits carried out in the previous period; (b) the number of energy audits carried out in large enterprises in the previous period; (c) the number of large companies in their territory, with an indication of the number of those to which Article 8(5) is applicable.

100