title page evaluation of the distribution … with discussions 2.pdf · distribution channel...
TRANSCRIPT

1
TITLE PAGE
EVALUATION OF THE DISTRIBUTION CHANNELSOF CONSUMER GOODS IN
SELECTEDMANUFACTURING FIRMS IN NIGERIA
BY
EJETA FELIX ONORIODE
PG/MSC/06/45635
BEING AN M.SC DISSERTATION PRESENTED TO THE
DEPARTMENT OF MARKETING
FACULTY OF BUSINESS ADMINISTRATION
UNIVERSITY OF NIGERIA, ENUGU CAMPUS
IN PARTIAL FULFILMENT OF THE REQUIREMENT FOR
THE AWARD OF MSC DEGREE IN MARKETING

2
SUPERVISOR
DR J.I. UDUJI
JUNE 2013
APPROVAL PAGE
This research on “Evaluation of the Distribution Channels ofConsumer Goods in Selected
Manufacturing Firms in Nigeria” by Ejeta, Felix Onoriode is hereby approved as a
satisfactory project for the award of Master of Science (M.Sc) Degree in the department of
Marketing.
_______________ ______________
Dr. J.I. Uduji Date
(Supervisor)
______________ ______________
Dr. A.E. Ehikwe Date
(Head of Department)

3
DECLARATION
I, Ejeta Felix Onoriode, Reg. No PG/MSc/06/45635 hereby declare that this project report is
original and has not been submitted elsewhere for the award of a degree.
____________________ _______________
Ejeta Felix Onoriode Date
PG/M.SC/06/45635

4
DEDICATION
This work is dedicated first and foremost to the Almighty God for the wisdom, strength and
health given me to carry out the work. Also to my wife,MrsEjetaFavour for her moral support
all through the period of this program.

5
ACKNOWLEDGEMENTS
I wish to express my profound gratitude to all those who contributed directly or indirectly to
the success of this research work.
My gratitude goes to my able and amiable supervisor, Dr Uduji, J.I, who guided me and
enriched me with the knowledge and encouragement that propelled me into successful
completion of this master piece. I am also grateful to all the other lecturers of the department
of marketing who also enriched me with knowledge in the field of marketing, without which
this work would not be possible. My regards also go to the non academic staff of the
marketing department for their assistance and candid support. I must not fail to appreciate my
course mates in M.Sc. Marketing program for all their encouragement throughout the period
of the program.
My heartfelt gratitude goes to my wife, Mrs Ejeta Favour, my son master Ejeta
Oghenemudiakevwe and my daughters Ruki and Ejiro for their moral supports and
encouragement throughout the period of the program.
I would also like to appreciate Mr Olanibi Adeniyi, Mr Okocha Uchechukwu and Engr.
Francis Ikeriokwuehi who are my colleagues at PZ Cussons Nig. PLC, Aba for their
encouragement and support. This acknowledgement will be incomplete if I fail to appreciate
members of staff of the manufacturing companies who filled and returned the questionnaires
and also responded to my oral interviews for the purpose of this research work.
Finally and above all, my profound thanks go to ALMIGHTY GOD, the giver of life and
wisdom for his guidance and protection over me and for providing for my needs all through
the period of the program. I am indeed grateful to God.
Ejeta, Felix Onoriode PG/M.SC/06/45635

6
ABSTRACT
Over the years, consumer goods manufacturing firms in Nigeria are facing challenges of how to design, select and manage distribution channels that will ensure maximum savings in distribution costs, enhance product availability and effective co-ordination of channel activities. The manufacturers are bedeviled with problems of how to provide fast deliveries to customers, maintain optimum inventory volume and ideal market coverage, minimize use of warehouses at the least carrying costs of stock, reduce total distribution costs and maximize customer satisfaction. In fact, they need a new template to guide them to sales and distribution channel choices which better match channel costs with value and which offers the potential for competitive advantage. This study therefore focused on the task of carrying out a thorough strategic and empirical research and investigation that would come up with practical and cognate solutions to the above problems. In carrying out this task, attempts were made to: (1) find out whether the control exerted by the firm on the distribution channel depends on the length of the channel (2) examine the influence of hybrid channel conflicts on channel performance (3)determine the relationship between the control exerted by a firm and satisfaction with existing channel: (4) determine the relationship between the length of a distribution channel and the channel’s performance: and finally to: (5)determine the relationship between the number of distributors in a channel and the channel’s performance. . Survey research method was adopted to sample the opinion of managers in the Marketing, Distribution and Finance departments of four manufacturing firms selected through convenience sampling for this study. Questionnaires and oral interviews were the main instruments used in collecting primary data for the study. While information obtained from textbooks, journals and materials from the internet provided the guideline for setting the hypotheses and designing the questionnaire. The primary data were used in analyzing the research questions and testing the research hypotheses. Data were analyzed through the use of tables, simple percentages, and means. Multiple linear regression, t-test and z-test were used as appropriate in testing the research hypotheses. The study revealed that there is a significant relationship between the length of a distribution channel and the control exerted by the firm. It was also found that hybrid channel conflicts significantly influence channel performance and a significant relationship exist between the control exerted by a firm and satisfaction with its existing channel. However, it was found that no significant relationship exist between the length of a distribution channel and the channels performance. Similarly, no significant relationship was found between the number of distributors in a channel and the channel’s performance. Although, it was revealed that consumer goods manufacturing firms in Nigeria adopt multi-channel strategy in the distribution of their products but the commonest channel structure found in use is the traditional 3-level structure, which involves distribution from the manufacturer to the wholesaler/distributor and then to the retailer and finally to the consumer. Finally and most importantly was the discovery that consumer goods manufacturing firms in Nigeria have not embraced the use of e-commerce or internet and other forms of innovations in their distribution channels. It is concluded from the study that most consumer goods manufacturing firms in Nigeria have not fully tapped in to the benefits of well designed and efficiently managed distribution channel system. It is also concluded that the type and nature of the product determines the intensity of its distribution. However, it should be noted that the process for determining the right level of distribution coverage (intensity) often comes down to an analysis of the benefits (e.g. more sales) versus the cost associated with such benefit. Based on the above findings, it is recommended that most consumer goods manufacturing firms in Nigeria should analyze and restructure their sales and distribution approaches by

7
performing activities in new ways which increase value to customers and reduce cost. They should determine and adopt an ideal level of distribution intensity that would make their brand available widely enough to satisfy but not to exceed target customers needs because oversaturation increases marketing costs without providing benefits. Firms whose output and markets are limited should for economic reason spin-off the channel functions to other members of the channel. Similarly, there is need for consumer goods manufacturing firms in Nigeria to adopt more innovations in their channel approaches. E-commerce or sales through the internet is becoming a means to serve larger number of customers at much lower costs. Broader acceptance of electronic data interchange to monitor sales and inventory levels throughout the total channel is reducing inventories and speeding response to changing customer requirements. It is also recommended that manufacturers should make efforts to integrate their channel system as this will enhance more effective co-ordination of their channel functions and reduce conflicts in the channels. Finally, government should provide the necessary infrastructural environment that will enable the smooth and free flow of goods from the point of production to point of consumption.

8
TABLE OF CONTENTS
Title Page i
Approval Page ii
Certification iii
Dedication iv
Acknowledgement v
Abstract vi
Table of Contents viii
List of Figures xii
List of Tables xiii
CHAPTER ONE
INTRODUCTION:
1.1 Background of the Study 1
1.2 Statement of Problem 3
1.3 Objectives of the Study 4
1.4 Research Questions 5
1.5 Research Hypotheses 5
1.6 Scope of the Study 6
1.7 Significance of the Study 7
1.8 Limitation of the Study 7
1.9 Definition of Terms 8
References 9
CHAPTER TWO
REVIEW OF RELATED LITERATURE
2.0 Introduction 10
2.1 The concept of Distribution in Marketing 11
2.2 Distribution Channels 11
2.3 Distribution Channel Structures or Levels 15
2.3.1 Hybrid Channels 18
2.3.2 Control of Channels 19

9
2.3.3 Channel Service Levels 21
2.4 Marketing Flows 21
2.5 Determining the Appropriate Channel Structure 27
2.5.1 Determination of Marketing Channel Structure through
Postponement and speculation theory 27
2.5.2 Determination of Marketing Channel Structure through Functional
Spin-Off Approach 29
2.5.3 Determination of Marketing Channel Structure Through the Concept
Of Substitutability 31
2.5.4 Checklist Method of Determining the Appropriate Channel
Structure 32
2.6 Distribution Channel Design 34
2.7 Distribution Channel Decisions 36
2.7.1 Decision on Necessity of Services to the Customer 37
2.7.2 Decision on Channel Objectives 37
2.7.3 Managerial Decision on the Channel 37
2.7.4 Modifying Channel Arrangements 40
2.7.5 Channel Performance 41
2.7.6 Channel Satisfaction 42
2.8 Current Trend in Marketing Channels 43
2.8.1 An evolutionary Overview of Innovation in the Channels 43
2.8.2 Drivers of Innovation in Marketing Channels 44
2.8.3 The Technological Perspective of Innovation in Marketing Channels 46
2.8.3.1 Innovation in Vertical Relationship between Firms 46
2.8.3.2 Innovation in Relationships with Final Demand 49
2.8.4 Innovation in Channel Relationships 52
2.8.5 Retail Change and Channel Structure 54
2.9 The Theory of Power and Conflict in Channels of Distribution 56
2.9.1 Power: Definitions and Elaborations 56
2.9.2 The Role of Power in Distribution Channels 57
2.9.3 Conflict: Definitions and Elaborations 58
2.9.4 Origin of Channel Conflict 59
2.9.5 Best Practices of Minimizing and Managing Channel Conflict 60

10
2.10 Selected Manufacturing Companies in Nigeria 61
2.10.1 Nigeria Breweries PLC 61
2.10.2 Guinness Nigeria PLC 61
2.10.3 Unilever Nigeria PLC 61
2.10.4 PZ Cussons Nigeria PLC 62
References 63
CHAPTER THREE
RESEARCH METHODOLOGY
3.1 Introduction 76
3.2 Research Design 76
3.3 Sources of Data 76
3.4 Area of the Study 77
3.5 Population of Study 77
3.6 Sample Size Determination and Selection Method 77
3.7 Data Collection Instrument 78
3.8 Validity of Research Instrument 79
3.9 Reliability of Research Instrument 79
3.10 Operational Measures of the Variables 79
3.11 Data Analysis Techniques 80
References 81
CHAPTER FOUR
DATA PRESENTATION AND ANALYSIS
4.1 Data Presentation 82
4.1.1 Return of Questionnaire 82
4.1.2 Demographic Characteristics of Respondents 82
4.1.3 Companies’ Distribution and Support Services 84
4.1.4 Relationship between length of Distribution channel and Control 86
4.1.5 The Influence of Hybrid Channel Conflict on the Channels
Performance 88
4.1.6 Control Exerted by a Firm and Satisfaction with its existing
Channels 89

11
4.2 Tests of I Hypotheses 94
4.2.1 Test of Hypothesis One: There is no significant relationship between the length
of a distribution channel and the control exerted by the firm 94
4.2.2 Test of Hypothesis two: There is no significant relationship between 95
4.2.3 Test of Hypothesis Three: The control exerted by a firm does not influence
the firms’ satisfaction with its existing channels 96
4.2.4 Test of Hypothesis four: The length of a distribution channel does not determine
its performance 97
4.2.5 Test of Hypothesis Five: The number of distributors in a distribution channel
Does not determine the performance of the channel 97
4.3 Discussion of Findings 98
4.3. 1 Relationship between the length of a distribution channel and the control
exerted by the firm 98
4.3.2 The influence of a hybrid channel’s conflict on the channel’s performance 98
4.3.3 Channel’s control by a firm versus the firm’s satisfaction with the channels 99
4.3.4 The relation between the length of a channel and its performance 99
4.3.5 The number of distributors in a channel and the channel’s performance 99
CHAPTER FIVE
Summary of findings, conclusion and recommendations
5.0 Introduction 101
5.1 summary of findings I 01
5.2 Conclusion 101
5.3 Recommendation 102
5.4 Contribution to knowledge 103
5.5 Suggestion for Further Studies 104
Bibliography 105
Appendix 1: Letter of Introduction 119
Appendix 2: Questionnaire 120
Appendix 3: Oral Interview Guide I 23
Appendix 4: Regression Results for Test of Hypothesis Two 124
Appendix 5: Regression Results for Hypothesis Two 127
Appendix 6: T-Test Result for Test of Hypothesis Three 131
Appendix 7:7-TEST Result for Test of Hypothesis Four 132
Appendix 8: 7-1 Test Result for Test of Hypothesis Five 133

12
LIST OF ILLUSTRATIONS
List of Figures
2.1 Consumer Marketing Channels 15
2.2 Universal Marketing Functions 22
2.3 Functional Spin – Off 30

13
List of Tables
1.1 Four Top Ranking Consumer Goods Manufacturing Companies in Nigeria 6
2.1 Marketing Flows, their Activities and Costs 23
2.2 Marketing Flows, their Activities and Costs 24
2.3 Marketing Flows, their Activities and Costs 25
2.4 Marketing Flows, their Activities and Costs 26
2.5 Criteria’s Examples for Selection of Intermediaries 33
4.1 Return Rate Questionnaire 82
4.2 Distribution of Respondents by Sex 82
4.3 Distribution of Respondents by Age 83
4.4 Distribution of Respondents by Status in Organization 83
4.5: Distribution of Respondents by Length of Service 83
4.6: Levels of Distribution Channels used by Companies 84
4.7: Nature of Product Delivery to Customers 84
4.8: Support Services Rendered by Companies to their Channel Members 85
4.9: CSontrol Measures on Channel Members 85
4.10: Length of Distribution Channel and Control by Firm 86
4.11 Hybrid Channel Conflict and Channel’s Performance 88
4.12 Control Exerted by a Firm and the Firm’s Satisfaction with its Channels 89
4.13 Influence of the Length of a Channel on its Performance 91
4.14 Number of Distributors in a Channel and the Channel’s Performance 93
5.1 Selection Criteria for Distribution Intensity based on Products’ Characteristics 104

14
CHAPTER ONE
INTRODUCTION
1.1 Background of the Study
Since the introduction of democracy in Nigeria in 1999, the consumer goods industry has
shown considerable growth as government policies (allied with increasing oil prices) channel
more cash to the consumers. The advent of a democratic government has led to a more
business friendly environment and privatization policies have led to an increase in the size of
the private sector in the country. However, the sector faces many challenges caused by the
environment in Nigeria such as poor infrastructure, poor standards of education and high
levels of corruption and a general low level of disposable income of the population. There is
little manufacturing for export, but a significant activity exists in the manufacture of fast
moving consumer goods aimed at the domestic market. In recent years, multinational
corporations have increased their investment in physical plants, information technology and
staff training with a view to improving their operational performance.
The consumer goods sector is a major part of the manufacturing sector in Nigeria. And like
all other manufacturers, the consumer goods industry is characterized by low valued added
production. What we see are processors who process imported raw materials into finished
products, with very little value added. Multinational companies operating in this industry
hardly add value because they import concentrates from their parent companies, which they
convert into finished products with minimal value added. The industry is dominated by
wholesalers and distributors. In fact distributors and wholesalers account for over 50% of
total sales within the industry (Lead Capital, July 2009). Their dominance is as a result of
fragmentation nature at the retail end of the market. The retail end lacked adequate
supermarket and glossary stores. They mainly compose of roadside kiosks, stores and small
sized restaurants, whose sales volumes are generally low. Distribution to the retail market is
hampered by huge investments required for delivery trucks coupled with the general bad road
network. Consumer goods industry in Nigeria is highly fragmented with the presence of
multinationals, domestic and foreign companies. Except in categories where domestic players
are protected by legislation, multinationals usually dominate. Notable players include
UNILEVER Nig. PLC, Cadbury Nig. PLC, PZ Cussons Nig. PLC, Nestle Nig. PLC, UAC
foods, WAMCO Nig. PLC, Guiness Nig. PLC, and Nigeria Breweries PLC. It is common for

15
large international companies to form alliances with Nigeria companies to repackage and/or
market their products in Nigeria. This lowers the risk of market entry as well as enables the
international company to benefit from the existing marketing and distribution capabilities of
the Nigerian company.
The prime place of distribution program in planning the project objectives of consumer goods
manufacturing firms in Nigeria cannot be overemphasized. The economy of any nation
depends to a great extent on the production and distribution of finished goods and services
with distribution as the pivot of the operations. Products must therefore be delivered to
buyers when and where they need them and at a reasonable cost. In performing the delivery
function, goods and their titles are known to pass through certain paths or routes from the
producer to the consumer. These routes are variously called distribution channels or trade
channels.
Over the years, distribution channels have been widely discussed in the marketing literature
by academics, professionals and other agents of marketing including manufacturing firms and
products distribution agencies especially on factors relating to costs of distribution of
products. Distribution costs could have significant financial burden that may impact on the
profits of manufacturing firms and by implications on the economy of a nation such as
Nigeria. Many business concerns fail to achieve set objectives despite producing very high
quality goods because they do not accord distribution, the importance it deserves. Thus, one
may be tempted to ask: what is the economic worth of an effective productive actively that
fails to give the physical flow of the entire inventory the attention it deserves? Kotler
(1986:431) states that physical distribution activities when uncoordinated could tend to high
cost that consequently affect the level of service rendered by firm and the profit accruable to
it. In the circumstances, the benefits of business efforts are swallowed up resulting to loss or
mere break-even instead of the expected profit objective. Therefore, for a total realization of a
company’s profit objectives and customer satisfaction, its distribution channel strategy must
be carefully diagnosed, planned and implemented since production is not complete until
goods are in the hands or within the reach of the final consumer.
Furthermore, it should be noted that the design and management of effective and efficient
distribution channels offer significant, frequently untapped opportunities for firms to create
unique long term strategic advantages. Superior performance of channel activities has
16
become a major route to providing extraordinary value to end users. All around the world,
firms are increasingly recognizing these opportunities in channel management and are rapidly
adapting to the dramatic changes that have occurred in the organization of channel activities.
According to Uduji and Nnabuko (2011: 99), Global marketing channels are becoming more
important to companies seeking growth abroad. Manufacturers introducing products in
foreign countries must decide what type of channel structure to use – in particular, whether
the product should be marketed through direct channels or through foreign intermediaries.
They advised that Marketers should be aware that channel structures in foreign markets may
be very different from those they are accustomed to in the home country.
Regrettably, even though issues associated with distribution have become central to the
growth and well-being of firms, industries and society in general, the education and research
activities devoted to this “place element” of the marketing mix are sparse. It is against this
background that this study aims at evaluating the distribution channels of consumer goods
manufacturing firms in Nigeria with a view to developing more profitable ways to companies
to reach the market and end users.
1.2 Statement of the Problem
All around the world, more and more companies are discovering that their accustomed
approaches to selecting and managing sales and distribution channels no longer work. The
channels cost too much and provide too little value. They meet neither the needs of the
manufacturer nor the end customer. In the Nigerian context, the situation is worse when
considered against the backdrop of the poor infrastructural environment in which the
companies operate. In support of this view, Nnolim (2003: 15) says that the distribution
system in Nigeria i.e the general set-up to channel the product of labour and capital to both
intermediate and final consumer can best be described as haphazard, long-winded and
generally inefficient. The cost of the system arises from a high degree of duplication of
functions, highly atomized units of channel membership and operation, arbitrary margin
setting, margin taking without the performance of the corresponding function which is then
shifted. The added cost burden of poor infrastructural environment in the form of limited net-
work of roads and rail lines, bad roads, poor storage facilities, high cost and unavailability of
information and vital fast reliable communication net work is also very real. Hence, over the
years, consumer goods manufacturing firms in Nigeria are faced with the challenge of

17
designing and selecting channels of distribution that will ensure maximum savings in
distribution cost, enhance product availability and effective coordination of activities.
In recent times, more efforts are being channeled towards achieving the above stated
objectives based on the realization that the design and management of effective and efficient
distribution channels offer significant, frequently untapped opportunities for firms to create
unique, long-term strategic advantages. Reducing the amount of time, energy and effort
expended in acquiring goods and services has become as important, if not more so, as being
offered a reduction in their purchase prices (Louis W.S. and Barton A.W, 1997). Decisions
about the marketing channel system are among the most critical facing management today.
Creative, well-executed marketing channel strategies provide some of the more potent means
by which companies can enhance their ability to compete domestically and internationally.
Unfortunately, most companies concentrate their efforts and energies on other business
functions, such as finance, production, research and development or on elements of
marketing other than distribution in their attempts to secure competitive advantage. For a
number of companies, a critical assessment and revision of their marketing channels are long
overdue.
In the United States of America for instance, channel members collectively earn margins that
account for 30 to 50 percent of the ultimate selling price. In contrast, advertising typically
accounts for less than 5 to 7 percent of the final price (Kotler and keller, 2006). This is a
veritable pointer to the growing importance of marketing channels and this trend is gradually
permeating the Nigerian business environment. Manufacturing firms in Nigeria are wrapped
in the quagmire and confounding problems of how to provide fast deliveries to customers,
maintain optimum inventory volume, minimize use of warehouses at the least carrying costs
of stock, reduce total distribution costs and maximize customer satisfaction. Manufacturers
need a new template to guide them to sales and distribution channel choices which better
match channel costs with value and which offers the potential for competitive advantage. All
these can be achieved through selecting appropriate distribution channels. This study
therefore focuses on the task of carrying out a thorough strategic and empirical research and
investigation that could come up with practical and cognate solutions to the above problems.
1.3 Objectives of the study

18
This study has the major objectives of evaluating the distribution channels of consumer goods
manufacturing firms in Nigeria with a view to making appropriate recommendations for
effective and efficient distribution channel management. The following objectives are
considered relevant to the achievement and realization of the major objective of this study.
1. To find out whether the control exerted by the firm on the distribution channel
depends on the length of the channel.
2. To examine the influence of hybrid channel conflict on distribution channel
performance.
3. To determine the relationship between the control exerted by a firm and
satisfaction with its existing channel.
4. To examine the influence of the length of a distribution channel on the channel’s
performance.
5. To find out whether the number of distributors in a distribution channel influences
the channel’s performance.
1.4 Research Questions
In the light of the problem stated above, a number of research questions demand answers
from this study.
1. Is there any significant relationship between the length of a distribution channel
and the control exerted by the firm?
2. Does a hybrid channel’s conflict have any significant influence on the channel’s
performance?
3. Does the control exerted by a firm have any significant influence on the firm’s
satisfaction with the existing channel?
4. Does the length of a distribution channel have any significant influence on its
performance?
5. Does the number of distributors in a distribution channel have any significant
influence on the channel’s performance?
1.5 Research Hypotheses
The study will test the following hypothesis:
1. There is no significant relationship between the length of a distribution channel and
the control exerted by the firm.
2. Hybrid channel’s conflict has no significant influence on the channel’s performance.

19
3. The control exerted by a firm has no influence on the firm’s satisfaction with its
existing channels.
4. The length of a distribution channel does not significantly influence its performance.
5. The number of distributors in a distribution channel has no significant influence on
the channel’s performance.
1.6 Scope of the Study
Distribution Channels are the main focus of this investigation and is targeted at consumer
goods manufacturing companies in Nigeria. The study covers four companies which are
considered amongst the top ranking consumer goods manufacturing firms in Nigeria as
shown in the table below.
Table 1.1: Four Top Ranking Consumer Goods Manufacturing Companies in Nigeria
S/N COMPANY TURNOVER
(N000)
GROWTH
(%)
01 Nigeria Breweries PLC, Aba 198,300,000 18.4
02 Guinness Nigeria PLC, Aba 109,366,975 23
03 PZ Cussons Nigeria PLC, Lagos 62,667,910 10
04 UNILEVER Nigeria PLC, Lagos 46,807,860 5.2
Source: 2010 Companies Annual Reports.
These companies were selected for this study based on the fact that they are market leaders
in terms of sales and market coverage in Nigeria. They are involved in the manufacture and
distribution of consumer goods or products that are consumed by almost every household in
the Nigerian society. Their activities spread across all six geo-political zones in Nigeria.
They generally employ salespeople to market directly or personally to consumers in
Nigeria. However, they sometimes employ the services of agencies to market their products.
Some of them have multiple depots and distribution centers through which they reach the
markets.
The questionnaire and other instruments for primary data collection were distributed to the
managers of Marketing, Distribution and Finance Departments of the selected

20
manufacturing firms. The contents of the questionnaire were simplified to make for clarity
and easy understanding.
1.7 Significance of the Study
There had been studies in marketing literature relating to distribution channels in the past but
such studies may not have comprehensively made serious impact on distribution channels for
consumer goods. This study has a robust and comprehensive treatment of all the components
combined that make for concrete and standard contribution to efficient and effective
distribution channel management. The findings in this study will expose the problems of
distribution channels and proffer solutions for the benefits of manufacturing firms, the
consumers, the government and the entire publics. They will serve as guide to the
management of the companies in selecting distribution channels that will ensure cost
reduction, greater profitability and customer satisfaction. To the academic world, this study
will not only add to the body of knowledge but will also inspire further research in
distribution channels.
1.8 Limitation of the Study
The study focuses on distribution channels for manufactured goods, specifically consumer
goods in Nigeria. The primary limitation to the study is the unwillingness of those in
possession of information to give it out for fear of exposing official secrets. Finally, the
dearth of published data on the topic also posed great limitation to the study.

21
1.9 Definition of Terms
For easy understanding of the research report, the following key concepts have been defined
in this study in order to eliminate possible confusion.
Distribution: It is that marketing function responsible for moving goods and services from
the point of production to the point of consumption.
Consumer goods: These are goods or services that are destined for ultimate consumer in
such a form that they may be used without additional processing. They are goods for the final
user or consumer (Onah and Thomas 2004:190).
Distribution channel: It is the pathway taken by goods as they flow from point of production
to point of consumption (Amarchard and Vavad 1997:19).
Channel structure: Is the manner in which a set of distribution tasks has been allocated
among the channel members (Rosenbloom, B, 1990:11).
Intensity of Distribution: It refers to the number of intermediaries at each level of the
marketing channel (Rosenbloom, 1990:115).
Vertical channel integration: Occurs when two or more channel intermediaries at different
levels or stages of the channel combine or integrate their efforts and programmes under one
management or agree to cooperate to achieve marketing objectives. (Onyeke and Nebo 2000:
269).
Exclusive Distribution: It means severely limiting the number of intermediaries. It is used
when the producer wants to maintain control over the service level and outputs offered by the
resellers. (Kotler and Keller, 2006: 481).
Selective Distribution: Involves the use of more than a few but less than all of the
intermediaries who are willing to carry a particular product. (Kotler and Keller, 2006: 481).

22
Intensive Distribution: Consists of the Manufacturer placing the goods or services in as
many outlets as possible. (Kotler & Keller, 2006: 481).
Hybrid Channels: Involve the use of more than one primary channel to sell the same product
line to the same target market.
REFERENCES
Amarchard, D. and Vavad, H.B. (1979). An Introduction to Marketing New Delhi: Vikas
Publishing House Ltd.
Kotler, Philip (1990). Marketing Management Analysis, Planning, Implementation and
Control. Englewood Cliffs, New Jersey, USA Prentice Hall International Inc.
Kotler, P. & Keller k. (2006) Marketing Management, New Delhi, Prentice Hall of India
Lead Capital (2009)
Louis W.S. and Barton A.W (1997). The Revolution in Distribution: Challenges and
Opportunities. USA: Elsevier Science Ltd.
Onah, J.O and Thomas, M.J. (2004) Marketing Management, Strategies and Cases. UNEC
Nigeria: Institute for Development Studies
Onyeke J.K. and Nebo G.N. (2000), Principles of Modern Marketing, Enugu – Nigeria:
Precisions & Queens (Nig) ltd.
Rosenbloom, B (1990), Marketing Channels. A Management View, Chicago Dryden Press.
Uduji, J.I. and Nnabuko, J.O. (2011), Marketing, A Customer Relationship Management
Approach. Enugu, Southeast Nigeria: New Generation Books,

23
CHAPTER TWO
LITERATURE REVIEW
2.0 Introduction
Tuckman (1978:37) says that every serious research includes a review of relevant research,
more extensive in a dissertation for example than in a journal article where space is at a
premium. One gains little from discovering anew what is already known. A literature study
usually turns up a number of lead for further investigation that will advance the research
especially if one do not confine the investigation to obvious topic. These show that research
work cannot be properly carried out without reference to previous work done by eminent
scholars. Consequently, this chapter brings to view and summarizes the contribution of other
authors in the subject matter of study.
The introductory part of this section takes a look at physical distribution as considered
sacrosanct to our objective of determining an effective and efficient distribution channel
system for consumer goods manufacturers in Nigeria. This is based on the understanding that
though the path of physical possession of the product may be different from the path of title
transfer but it is believed that whatever path taken by physical possession has a great
influence on the efficiency and effectiveness of the entire system. Hence, the analysis starts
with the methods being used by firms to move their goods from the point of production i.e.
the factories to the channel members i.e. the market. Thereafter, the review dwells on
distribution channels for consumer goods with a perspective focused on the entire channel,
with reference to its structure and flows (information, physical, negotiating) that drive the
operations and link all the subjects. The economic orientation formed the basis and the crux
of analysis in which efficiency of the channel and other issues like channel design and
structure were thoroughly examined. However, the sociological approach to this study takes a
cursory look at behavioral issues focusing on power, cooperation, satisfaction and conflict in
the channels.

24
Finally, the exposition took a close look at contemporary emerging issues in distribution
channels with emphasis on various forms of innovations in the system. The concluding part
was on brief historical development of the consumer goods manufacturing firms used for this
study.
2.1 The Concept of Distribution in Marketing
The concept of distribution has many definitions depending on the view point of the author.
According to Achison (2002: 338), Distribution is that marketing function responsible for
moving goods and services to the consumer. Okeafor (1998: 79) defined it as the set of
business activities that is designed to move the right amount of products to the right place
(market), in proper condition at the right time and at a reasonable cost. Some say it is the
route taken by products as they move from the producer to the consumer.
The underlying concept of distribution or physical distribution is that product should meet
consumer satisfaction both in place, time, quantity, price and quality. The basic objective is to
get the products to customers at the fastest time and minimum or least cost. The dilemma for
manufacturers has been how to minimize costs in the use of physical distribution resources
and also achieve maximum satisfaction of customers. The profit of the firm can also be
improved or enhanced from the use of the resources of physical distribution, by reduction of
costs and maximization of the use of the resources to support maximum or increased
deliveries of products to customers. The attention of manufacturing firms have shifted to
physical distribution as today’s market place has been turbulent, that it is no longer sufficient
to have attractive products, competitively priced and creatively advertised. The customers
want higher levels of services and this provides a significant opportunity to differentiate
products and tailor the offerings to meet specific customer requirements (Christopher,
1992:2).
Distribution is now a key source for competitive advantages within the firm’s market efforts.
The goal of distribution is to move the right amount of the right products to the right place
and locations at the right time (Porter 1985: 159, Eztel et al., 2001: 478). On this MacDonald
(2005: 410) argues that if the product is not available when it is needed and where the
customer wants it, the outcome is surely a failure in the market place, and Stapleton et al,
(1998: 247 – 248) put it as a critical aspect of marketing management by which means a
company can increase its sales volume and profitability.

25
2.2 Distribution Channels
Goods and services must be made available to the consumer or end user when and where
they want them and at a reasonable cost. In this regard, goods and their titles are known to
pass through certain paths or routes from the producer to the consumer. These routes are
variously called distribution channels or trade channels or marketing channels. Formally,
marketing channels are sets of interdependent organizations involved in the process of
making a product or service available for use or consumption. They are the set of pathways a
product or service follows after production, culminating to purchase and use by the final end
user. (Kotler and Keller, 2006: 468).
Various definitions of distribution channel have been put forward by different authors. Tale et
al (1982: 335) defined it as the pipeline through which a product flows on its way to the
ultimate consumer. Beckman et al (1957: 39) regarded it as the course taken in the transfer of
titles to a commodity. Amarchard and Varad (1997: 19), also defined it as a pathway taken by
goods as they flow from point of production to point of consumption. Viewed from a
managerial perspective, Rosenbloom, B. (1978:4) defined marketing channel as the external
contractual organization which management operates to achieve its distribution objectives.
Whatever the viewpoints expressed in these definitions, the basic fundamental concept is that
between the producer and the final consumer are individuals or organizations who specialize
not in production of goods and services but in the task of taking title or assisting in
transferring title to the particular goods or services as they move from the first owner
(producer) to the last owner (consumer). These specialized individuals and organizations are
variously called the middlemen, channel intermediaries or channel members. Manufacturers
depend on channels for selling, transportation; warehousing and physical handling of their
products with the objectives to obtain optimal performance at minimum costs (Lambert et al.,
1993: 71). Channel constitutes the marketing intermediaries that provide possession, form,
time and place utilities. Possession utility is created through the process of exchange and title
transfer. Time utility is provided by holding inventory for quick access to consumers. Form
utility involves holding the items in factory fresh condition without damages and place utility
is created by location factor and movement of physical product to the market place (Limber
et al 1993: 76).
In other words, a firm’s distribution channel makes it possible for products to be available to
buyers by making them accessible or placing them at buyer’s convenience. The channel holds

26
the assortment of products to balance the discrepancies between what the manufacturer can
provide at a particular time and the actual market demand. Hence, Bucklin, (1966) bases the
theory of channel structure on the economic relationship among institutions and agencies. He
stated that the purpose of the channel is to provide consumers with the desired combinations
of its output, (lot size, delivery time, and market decentralization) at minimum costs. Every
manufacturer seeks to link the marketing institutions or intermediaries that will help it best
achieve its distribution objectives. According to Onyeke and Nebo (2000:265 – 267), any
manufacturer who eliminates the channel intermediaries should be ready to perform their
tasks of transferring the title to products or moving goods from the producer to the consumer.
They identified functions of channel intermediaries as follows:
1. Selling Function: Wholesalers and some big retailers sometimes provide a sales force
or other promotional efforts that could be used to perform the selling functions for the
manufacturers.
2. Buying Function: Wholesalers perform a buying function for retailers, industrial
users and other customers while retailers buy on behalf of the consumers.
3. Market Information: Intermediaries pass information from producers to other
channel members. Examples, when a wholesaler passes information about product
uses, repairs or guarantee as gotten from the manufacturer to retailer who then passes
it to the consumers. Information from consumers also flows from the retailer to the
wholesaler back to the producer.
4. Bulk Breaking Function: Intermediaries buy in relatively large quantities from
manufactures and sell in smaller quantities to retailers and consumers.
5. Storage Functions: Middlemen have the tendency of preserving and storing the
manufacturer’s product until they are needed. Storage functions relieve the
manufacturer of the cost and other problems associated with storage.
6. Sorting Function: After assembling or accumulating the products, intermediaries
perform sorting function by identifying quality differences and breaking down the
product into grade and /or size categories.
7. Assortment Function: Intermediaries create assortment function by purchasing many
different products from different manufacturers from which a consumer can select his
product choice.

27
8. Reduction in the Number of Transaction: Channel intermediaries accumulate bulk,
break bulk and create assortments in order to reduce the number of transactions
necessary to accomplish the exchange needed to keep consumers satisfied.
9. Transportation Function: Channel intermediaries sometimes use their delivery vans
to move goods from the manufacturer’s factory to where they are needed.
Manufacturers, wholesalers and retailers are all involved in this transportation
function.
10. Finance and Credit Function. Intermediaries perform finance function by paying in
advance for products that are not yet produced. They also grant credit facilities to
some customers or buyers who cannot pay immediate cash for the goods or services
they buy.
11. Risk Taking Function: Intermediaries bear the risk of product spoilage,
deterioration, or loss of products by fire, theft, flood and other natural disasters while
in transit or storage. They also bear the risk of sudden reduction in demand which
may be as a result of changes in taste, fashion, and preferences of consumer’s or
competitor’s or new product introduction.
From the foregoing, there is no gainsaying that channels are very important to the
manufacturer of consumer goods towards the achievement of the distribution objective. This
brings to focus the concept of the marketing channel system which is the particular set of
marketing channels employed by a firm. According to Kotler and Keller (2006: 468),
decisions about the marketing channel system are among the most critical facing
management. The channel chosen affect all other marketing decisions. The company’s
pricing depends on whether it uses mass merchandisers or high quality boutiques. The firm’s
sales force and advertising decisions depend on how much training and motivation dealers
need. In addition, channel decisions involve relatively long-term commitments to other firms
as well as a set of policies and procedures. When an automaker signs up independent dealers
to sell its automobile, the automaker cannot buy them out the next day and replace them with
company-owned outlets (E. Raymond Corey, 1991:5).
In their analysis, Kotler and Keller also hinted on the concepts of push and pull strategy.
They said that in managing its intermediaries, the firm must decide how much effort to
devote to push versus pull marketing strategy. A push strategy involves the manufacturer
using its sales force and trade promotion money to induce intermediaries to carry, promote

28
Manufacturer Manufacturer Manufacturer
Consumer Consumer Consumer Consumer
Jobber
Wholesaler
Retailer
Wholesaler
Retailer Retailer
Manufacturer
and sell the product to end users. Push strategy is appropriate where there is low brand
loyalty in a category, brand choice is made in the store, the product is an impulse item, and
product benefits are well understood. A pull strategy on the other hand involves the
manufacturer using advertising and promotion to persuade consumers to ask intermediaries
for the product, thus inducing the intermediaries to order it. Pull strategy is appropriate when
there is high brand loyalty and high involvement in the category, when people perceive
differences between brands, and when people choose the brand before they go to the store
(Kotler and Keller 2006: 468).
2.3 Distribution Channel Structures or Levels
Normally, goods and services pass through several hands before they come to the hands of
the consumer for use. But in some cases, producers sell goods and services directly to the
consumers without involving any middlemen in between them, which can be called a direct
channel. Hence there are two types of channels, one direct and the other indirect channel. Fig
2.1 illustrates a typical channel structures for consumer goods.
Figure 2.1 Consumer Marketing Channels
Source: Kotler and Keller (2006: 468)

29
A direct marketing channel also called a zero-level channel consists of a manufacturer selling
directly to the final consumer. The major examples are door-to-door sales, home parties, mail
order, telemarketing, TV selling, internet selling and manufacturer-owned store. (Kotler and
Keller, 2006: 474). A one-level channel or structure occurs when a producer sells his
products via one channel member say a retailer. For example, some manufacturers in Nigeria
sell their products direct to Park and Shop stores, Leventis, Eastern shop, Shoprite etc.
Similarly, a two-level channel contains two intermediaries while a three-level channel
contains three intermediaries.
Direct channels are the most simple distribution channels and they involve direct contact
between producer and user. In a direct distribution, (known as short channel as well)
producers sell their products directly to the final customer, which is without a participation of
an intermediary. (Berman 1996). According to Blue et al, 1970 direct distribution ensure
producers the whole control of distribution of products. In the other hand, producers must be
able to solve marketing and production problems and must gather know-how on direct sales
and retails operations due to engage in direct sales with large scale. With the exception of a
channel of level zero (which uses no intermediaries) all other channels are indirect. In an
indirect distribution (or long channel), independent members of the channel share the specific
activities to perform marketing flows. Berman (1996) highlights that despite the lower
financial need for each member of the distribution channel, a long channel requires large
efforts of coordination of activities and functions.
From management perspective, Rosenbloom defined channel structure as the manner in
which a set of distribution tasks has been allocated among the channel members. It means
therefore that the channel manager is faced with an allocation tasks which must be performed
to accomplish a firm’s distribution objectives. The manager must decide how to allocate or
structure the tasks. Thus, the structure of the channel will reflect the manner in which he has
allocated these tasks among the members of the channel. (Rosenbloom, B.1999:11).
Intermediaries are commonly part of a distribution channel but taking into consideration the
principle discussed by Berman (1996: 663) and Coughlan et al. (2002: 46), their functions
will not be necessarily eliminated if the intermediaries are excluded of the channel. In fact,
intermediaries functions will suffer an alteration or will be transferred to another existing
part(tie) of the channel. The reallocation of the marketing function can be performed by the

30
producer, but these functions can be also transferred to other companies out of the channel
(like facilitators, for example or even transferred downstream or upstream in the marketing
channel.
Using the concept of services performance of Bucklin (1966: 26-31), customers prefer to use
marketing channels that supply higher service levels. Following this line, intermediaries play
a singular role as in situations of high demand for level of services, the possibility of
excluding an intermediary is lower due to the need of efficiency in some marketing flows
performed by intermediaries. Coughlan et al (2002: 46), emphasize that intermediaries take
part in the channel’s efforts as they add value to it and help reducing distribution costs
through higher efficiencies. In this way, it is important to understand what functions should
be performed due to achieve the final user’s desired service level.
According to Ehikwe (2002:214), channel institutions involve the use of different levels of
distribution to reach the consumers and whatever the level that is in use, both manufacturers
and consumers will permanently remain at the beginning and the end of the distribution chain
respectively. The first type of channel is the direct sales to consumer where the manufacturers
deal directly with the consumers with no intermediary between them. In such situations the
products are mainly primary commodities, mostly agricultural goods. In the manufacturing
sector, they include custom-made or contractually produced products such as ships, aircraft,
special vehicles of roads and rails. Other products that may involve direct deliveries are
special raw materials, spare parts and industrial supplies from the manufacturers who carried
out the initial installations of plant and machineries.
The second types of distribution channel institutions are those that involve the use of two
levels including brokers, agents and direct to consumers. In the distribution of services such
as insurance companies, banks and housing corporations, (for the sale of buildings and
rentals), the use of agents, brokers and direct distribution channels is imperative. In these
institutions, there are no physical exchanges of goods except information and communication
documents and there is no exchange of title: the direct channel in the distribution of services
requires the opening of branch offices of the service provider nearer to the location of their
customers.
The third type of distribution channel institutions are also the two levels similar to those used
by service providers and these are the manufacturer, retailer and the consumer. The agents or

31
broker wholesalers do not normally take title to the goods but merely link wholesalers and
manufactures with necessary information and collect commission payment for the deal. In
some cases, the agents collect some goods and sell but return the unsold goods to the
manufacturers at the end of the sales period. In other developments, the merchant wholesalers
are the popular and traditional giants of the middlemen or intermediaries responsible for the
strongholds of the manufacturer’s relationships with the consumers. The merchant
wholesalers are a formidable group that is involved with more than 90 percent of the actual
distribution chain of the manufacturers. These wholesalers take title to the goods and could
undertake a backward integration of manufacturing products and a forward integration of
retailing direct to consumers. The bulk breaking of manufacturers products are handled by the
merchant wholesalers.
2.3.1 Hybrid Channels
Hybrid or Multichannel marketing occurs when a single firm uses two or more marketing
channels to reach one or more customer segment. By adding more channels, companies can
gain three important benefits. The first is increased market coverage. The second is lower
channel cost – selling by phone rather than personal visits to small customers.. The third is
more customized selling – adding a technical sales force to sell more complex equipment.
The gains from adding new channels come at a price, however, the new channels typically
introduce conflict and control problems. Two or more channels may end up competing for the
same customers. The new channels may be more independent and make cooperation more
difficult. (Kotler and Kelly 2006:490).
According to Rowland and Ursula (1990), there was a time when most companies went to
market only one way – through a direct sales force, for instance, or through distributors. But
to defend their turf, expand market coverage and control costs, companies today are
increasingly adopting arsenals of new marketing weapons to use with different customers
segments and under different circumstances.
In recent years, as managers have sought to cut costs and increase market coverage,
companies have added new channels to existing ones; they use direct sales as well as direct
mail, direct mail as well as direct sales. As they add channels and communications methods,
companies create hybrid marketing systems. The appearance of new channels and methods
inevitably raised problems of conflict and control - conflict because more marketing units
compete for customers and revenues, control because indirect channels are less subjective to

32
management authority than direct channels are. As difficult as they are to manage, however,
hybrid marketing systems can offer substantial rewards. A company that can capture the
benefits of a hybrid system – increased coverage, lower costs and customized approaches –
will enjoy a significant competitive advantage over rivals that cling to traditional ways. The
trend to hybrid systems, however, appears to be accelerating in many industries. According to
a senior manager survey conducted in the late 1980s, 53% of the respondents indicated that
their companies intended to use hybrid systems by 1992 – a dramatic increase over the 33%
that used those systems at the time of the survey (Rowland and Ursula 1990). Two
fundamental reasons explain this boost in the move to hybrids; the drive to increase market
coverage and the need to contain costs. To sustain growth, a company generally must reach
new customers or segments. Along the way it usually supplements existing channels and
methods with new ones designed to attract and develop new customers. This addition of new
channels and methods creates a hybrid marketing system. The method to contain costs is
another powerful force behind the spread of hybrid systems as companies look for ways to
reach customers that are more efficient than direct selling. In 1990, the loaded cost of face-to-
face selling time for national account managers reached $500 per hour for direct sales
representatives, the average was about $300 per hour – selling and administrative costs often
represent 20% to 40% of a company’s cost structure and thus have a direct effect on
competitive advantage and profitability. For instance, Digital Equipment selling and
administration costs in 1989 were 31% of revenues, for Sun Microsystems, the figure was
only about 24% (Rowland and Ursula, 1990).
2.3.2 Control of Channels
According to Nebo (2011:39) the degree to which a marketing channel member wishes to
control the marketing functions within the channel determines to a great extent the
distribution intensity strategy
It would use. If for example, channel members adopt an intensive strategy, there is always
that tendency for such channel member to lose control over how the product is marketed. The
only way such channel member can exercise some control over the marketing of the product
will depend on its degree of involvement in performing the channel functions. If on the other
hand a channel member adopts exclusive distribution, such channel member will exercise
more control over the performance of the marketing functions. Most often, the channel
participants use agreement (both formal and informal) to specify which channel member will
perform which function. The issue covered in such agreement includes products to carry,

33
target market to serve, territories to cover, inventories to hold, sales quota to achieve and
advertising and promotional activities to conduct.
According to Ehikwe (2002:234) the control of the channel is mostly exercised by the
channel captain or leader who is the manufacturer of the products, with the objective of
instituting sanity and enhancing efficiency in the channels of distribution. He pointed out the
following measures of control which the manufacturer exercises over the channel members
thus:
(i) Hiring and firing of channel members is one of the first measures of control the
manufacturer has over the middlemen. In hiring or selecting any channel of
distribution, the manufacturer has the final decision on which channel merits
appointment after consideration of various factors. The disciplinary measures of
dropping or firing a channel member for misconduct of not adhering to some sales
guides, poor performance from sales returns, low share of the market,
collaboration with competitors against particular manufacturer could attract
sanctions or delisting.
(ii) Pricing of products also provides bases of control subject to the fact that selling
prices should not be arbitrarily fixed by channel intermediaries without the
consent of the manufacturer. In Nigeria, he noted that this philosophy is still at the
drawing board as most manufacturers do not have control over the prices of their
products from the factories or distribution centres. Nevertheless, it still remains a
basis for control by the manufacturers including extension of credit facilities.
(iii) Promotional activities are also an aspect of control exercised by the manufacturers
as middlemen are not allowed to use their names in the marketing of products
without the consent and authorization of manufacturers. The manufacturers owe
obligations to the middlemen on the need to promote the products through
advertising, communication and information dissemination about the products,
thus the intermediaries do not have to subject themselves to the problems of
information management that could create friction and misunderstanding in the
channel.
(iv) Cost of distribution is a serious problem in the channel which manufacturers have
to control by determining the transportation of products, the level of inventories
carried by the middlemen and the replacement policies for damages of products,
the level of inventories carried by the middlemen and the replacement policies for

34
damages in transit and when and where the title is transferred with the attendant
burden on the parties. The manufacturer ensures that excess costs are minimized
and limited within the channel activities and transactions.
(v) Control of sales facilities is also a source of control as done by Coca Cola in
providing middlemen with coolers and refrigerators for their products and
sanctioning any middleman that adulterated the products in the coolers and
refrigerators with competitors products either by withdrawing the coolers and
delisting them or causing a temporary suspension of suppliers.
(vi) Channel absorptions and fusions, he noted are also measures of control where the
manufacturers take over total or absolute control of product distribution by
absorbing the wholesalers and retailers activities through integrations with other
manufacturers.
2.3.3 Channel Service Levels
Service levels of a channel refer to the performance of services that a channel offers to their
final customers/users, in terms of breaking bulk, variety, waiting time and convenience. The
identification of which services will satisfy customers’ needs starts with a survey of different
segments with different service level needs. Once service levels are identified to achieve
those needs, the next decision is what channel structure should be used to perform such
service level (Bucklin, 1966, Kotler; Armstrong, 1999; Coughlan et al., 2002). To achieve the
desired service level, channel members should perform channel’s flows and assume their
costs, which are discussed in the next session.
2.4 Marketing Flows
The marketing processes are divided by Dixon (1964: 28-34) in three different lines that are
contractual, contactual and materials. These three functions are necessary to link the channel
ties and are essential conditions to make exchanges (marketing) possible. Dixon (1964: 28-
34) also groups the marketing activities in “universal marketing functions” that are concerned
to possession, property, promotion, negotiation, financing, risk, order and payment as shown
in figure 2.2 below.

35
Producer
Processing
* Physical
* Property .
* Promotion
* Negotiation
* Information
* Financing
* Risk
* Order
* Payment
* Services
Intermediaries
Retailers
Wholesalers
Distributors
* Physical
* Property
*
Promotion
*
Negotiation
*
Information
* Financing
* Risk
* Order
* Payment
* Services
Industrial
and
residential
consumers
Fig. 2.2: Universal marketing function.
Source: Rosenbloom, B., (2004) Marketing Channels. Management View, South-
Western of Thomson, p.16.
The dashed line in the intermediaries shows that the flows can be performed from the
producer to the intermediary, from the intermediary to the consumer, from the producer to the
consumer or shared among them.
Stern et al (1996) grouped these functions into flows of transactions performed in sequence
by the channel members. These authors recognize that these flows can even become channels
with few very complex levels and a single function can be performed by more than one level
of the marketing channel. Coughlan et al. (2002) and Kotler and Armstrong (1993) present a
classification of independent flows that are performed by the channel members. In general,
the models seek to describe the functions and flows of the channels as a whole, involving
storage, promotion, service, negotiation, financing, risk, information, order and payment. In
this way, marketing flows are considered part of the distribution channel. Marketing flows
are performed by different members of a distribution channel and they vary according to the

36
structure adopted, which depends directly on service levels. Table 2.1 describes the
marketing flows considered for this study, with the activities involved in each case and also
with associated costs (examples).
Table 2.1: Marketing flows, their activities and costs
Flows Description Activities Costs Examples
Products
flow
(Property
and
possession)
Refers to the physical
movement of
products, starting from
the manufacturer and
finishing in the final
user. The process may
pass through
intermediaries and
agents which can own
the property or the
product that is being
transported, handled
or stored or just have
its temporary
possession.
The activities linked with products
flow are usually concerned to
physical or logistical distribution.
The main activities within this flow
are breaking bulks, convenience,
time and variety. Physical and
logistical distribution also plays an
important role in the channels as
they can also be an important tool
to add value to the chain. Demand
forecast, order processing, storage
management, packing and transport
can also be improved by a proper
physical and logistical distribution
service.
Physical possession,
storage, rental,
delivering, repair
and maintenance
movements and
loading, picking,
packing, expedition
etc. Property,
storage.
Maintenance,
depreciation, finance
and opportunity
costs. etc.
Source: Coughlan, A.T:Anderson, E, Stern I.W, El-Ansary, Adel, (2005),
Marketing Channels, Prentice Hall, P. 500

37
Table 2.2: Marketing flows, their activities and costs.
Flows Description Activities Costs Example
Promotion
flow
(marketing
communication
)
Promotion flows exist to
increase the product’s
awareness, inform the
characteristics and
benefits of the product to
potential buyers and to
persuade those to buy.
The activities related to
this flow can also
increase the brand value,
what would increase
future revenues. In these
activities, any member of
the channel can take part.
Promotion flows may
contain different
activities, such as
personal sales by an
employee or by an
external sales team
(brokers, consultants
or representatives);
media advertising;
sales promotion (trade
marketing actions to
intermediaries,
commerce or retail);
publicity and other
public relation
activities.
Sales personnel
(wages,
commissions, travel
expenses).
Advertising, sales
promotion,
publicity and public
relations, sales
meeting,
demonstrations and
business fairs etc.
Negotiation
flow
Negotiations within a
distribution channel
happen when sales
conditions and the
maintenance of relations
should be discussed and
decided.
Negotiation of price,
remuneration,
payment conditions,
service levels,
deadlines, etc.
Costs of time,
salaries,
commissions,
commercial deals,
legal contracts,
judicial consultants,
concessions,
discounts, etc
Source: Coughlan , A.T: Anderson, E, Stern, I.W, El-Ansary, Adel, (2005),
Marketing Channels, Prentice Hall, P. 500.

38
Table 2.3: Marketing flows, their activities and costs
Flows Description Activities Costs Examples
Order and
payment
flow
Order and
payment
processing, data
exchange and
correlated
activities.
Order and payment flow
involves the activities of
confirming the orders. Some
activities also refer to direct
sale to clients and can include,
in case of use of an
intermediary, storage to
prevent unexpected demand
increase or anticipation.
Order: Receiving costs,
emission, orders’
processing and sending
automation of sales team,
sales assistant etc.
Payment: Costs with
documents emissions and
collection, lawyers
information systems,
bank taxes (service
tariffs). etc
Service flow
In this study,
services are
considered
additional/extra
flow, due to their
importance to
strategies of
differentiation,
value addition,
loyalty creation
and client
satisfaction.
(1) Supply the mix of goods
desired by clients: (2) decrease
to total cost of distribution,
appeasing cost economy to
sellers and buyers: (3) be a
way of communication
between sellers and buyers; (4)
Control the quality in the
movement of change; (5)
perform services during and
after sales; (6) to be
responsible for the goods
movements and their
localization.
Development and
performance of extra
(additional ) services,
technical assistance,
installations,
maintenance, after sales,
CRM trainings,
standardization, etc.
Source: Coughlan, A.T: Anderson, E, Stern, I.W, EI-Ansary, Adel, (2005),
Marketing Channels, Prentice Hall, P. 500.

39
Table 2.4: Marketing flows, their activities and costs
Flows Description Activities Costs Example
Information
flow
Before setting a deal, an
agreement, agents of a
channel seek to know
demand and supply
conditions, prices,
quantities, competition
and marketing
environment.
Information about prices,
supply, competitors,
environment, financial
conditions, etc. Research and
data.
Information systems,
time, access to
information centres and
specialized institutions,
market research
analysis and
processing, etc.
Financing
flow
Financing flow is
directly linked with the
negotiation of sales’
conditions and also
involves payment and
financing alternatives,
triangulation and
partnerships with
facilitators (i.e banks).
Financing involves uptake
and allocation of capital
mainly to finance mobile
inventories in different
channel’s levels. It can also
help increasing revenues, as it
may represent an advantage to
the buyer.
Credit and sales’
conditions, payment
deadlines, credit
services, external
agents, interest rates,
taxes, etc. Financing
costs can be
shared/assumed by
producers.
Risk flow Involves all risks related
to distribution activities.
Usually, producers and
resellers assume/take the
channel risks
Every activity associated with
the channels operation
involves a risk. Risk within a
channel may include: losses,
economic problems,
competition’s increase,
demand’s decrease, product’s
acceptance, recalls,
guaranties, obsolescence, etc
Credit risk, currency
exchange, insurance
changes, non quality
cost, market risk etc,
risk of losing image
and reputation.
Source: Coughlan, A.T: Anderson, E, Stern, I.W, EI-Ansary, Adel, (2005),
Marketing Channels, Prentice Hall, P. 500.
40
2.5 Determining the Appropriate Channel Structure
According to Nebo O.G (2011: 42), the channel service level needed to effectively carry out
the distribution of an organization’s product is often dictated by the amount of service desired
by the target market. Since the various channel institutions specialize in undertaking
particular marketing tasks must be performed at each channel level, the choice of the
institutions that is included in a channel depends on which institution performs which
functions. Therefore, the interplay of channel members’ specialization and the consumer’s
demand for channel services results in a channel structure that is capable of satisfying the
needs of both groups.
Based on the above, Buckline (1965: 26-31) proposed the following approaches as means of
structuring the marketing channel:
●Theory of postponement speculation
●Theory of functional spin-off
● Checklist method
● Substitutability
These approaches will be examined separately in this section.
2.5.1 Determination of Marketing Channel Structure through Postponement and
Speculation Theory
Marketing channel structure can be determined based on where inventory should be held to
enable the channel members provide appropriate service level and at the same time achieve
adequate return to channel members. The principle involved in determining the marketing
channel based on the above conditions is what is known as postponement/speculation theory.
(Nebo, O.G., 2011: 43).
By this principle, efficiency can be achieved in the marketing channel system through the
postponement of changes in the form and identity of the product to the latest possible point in
the marketing process and also postponement of changes in the inventory location to the
latest possible point in time. By moving differentiation nearer to the point of purchase,
postponement principles achieve the efficiency of the distributive functions through reduction
of risks and uncertainty costs. It also reduces the cost of physical distribution by producing
and sorting only when purchase is certain and also by sorting products in large lots and in
relatively undifferentiated state.

41
If one views postponement from the point of view of the distribution channel as a whole, it
may be seen as a device for individual institutions to shift the risk of owning goods to
another. The manufacturer who postpones by refusing to produce except to order is shifting
the risk forward to the buyer. The middleman postpone by either refusing to buy except from
a seller who provides next day delivery (backward postponement) or by purchasing only
when he has made a sale (forward postponement). The consumer postpones by buying from
those retail facilities which permit him to take immediate possession directly from the store
shelf. Further, where the consumer first contracts a number of stores before buying, the
shopping process itself may be seen as a process of postponement, a process which
advertising seeks to eliminate (Louis P. Bucklin, 1966). In synopsis, therefore, postponement
is an organizational concept whereby some of the activities in the supply chain are not
performed until customer’s orders are received. Companies can then finalize the output in
accordance with customer preferences and even customize their products. Meanwhile, they
can avoid building up inventories of finished goods in anticipation of future orders.
Moreover, transportation between warehouses and factories can be avoided by shipping
products directly to the customer rather than keeping them in stock even though this may lead
to smaller sized shipments over longer distances. As a result, postponement is often more
relevant when products are more sensitive to inventory than transport costs (e.g higher value
added products with large product variety. Additionally, lead time constraints may limit the
possibility to perform postponement activities while still assuring delivery windows that meet
customer’s willingness to wait (R.I.Van Hock, 2011)
Speculation on the other hand stipulates that changes in form and identity should be made at
the earliest possible time in the marketing process in order to reduce the marketing costs
(Louis P. Bucklin, 1966). This means that risk is assumed by the channel institution instead
of shifting them away. According to Nebo (2011: 45), speculation is a way of achieving
reduced costs through economies of large scale production by changing form at the earliest
possible time. It could also achieve reduced costs through the elimination of frequent orders
and also through the reduction of stock outs and its attendant cost in the form of consumer
dissatisfactions and possible brand switching. He went further to say that speculative
principles work in the distribution of convenience goods where indirect and long channels are
used and cost of holding household goods tend to be relatively high.

42
The theory of postponement speculation is a useful tool for determining a channel structure.
The concept of postponement result in the involvement of different types of channel
institutions as the channel members try to avoid the risk of assuming title and physical
possession. For this reason, channel members tend to adopt direct channel. Succinctly stated
by Louis P. Bucklin, “the combined principles of postponement speculation states that A
speculative inventory will appear at each point in a distribution channel whenever its costs
are less than the net savings to both buyer and seller from postponement.”
2.5.2 Determination of Marketing Channel Structure through Functional Spin-Off
Approach
The functional spin-off approach for the determination of marketing channel structure was
first proposed by Bruce (1973). This approach is of the view that marketing channel
institutions should delegate those channel functions that other channel institutions can
perform more effectively at less cost and perform those it has cost advantage than others.
(Bruce E. Mallen, 1973).
According to Morash E.A (1986: 89-107), the basic rationale for functional transfer relates to
both specialization and environmental uncertainty reduction. Functional transfer
contemplates that channel functions have been delegated to an external third-party specialist
and that the entire channel flow is only partially separated. Examples would include use of an
advertising agency, manufacturers reps, public warehouses etc. The concept of specialization
implies both the use of entities with special abilities and knowledge, and the law of large
numbers which entails spreading environmental risk over large volumes. Hollander, S.C
(1964: 18-22) and Mallen, Bruce (1973: 18-25) have also highlighted the potential for
operational marketing efficiencies and economies of scale from functional spin-offs.
To apply this concept in determining the marketing channel structure, the channel institution
adopting should be able to identify the relative cost of performing each of the marketing
flows and also the level of sales volume that each channel is capable of generating. An
illustration of this concept was given in Nebo (2011: 47-50) thus: If for example, a
manufacturer has the option of choosing from just two channels alternatives. In alternative 1,
the manufacturer employs his sales force and also maintains its warehouse. In alternative 2,
the manufacturer sells through manufacturer’s representative or agent and rents a space in the
public warehouse for the storage of its products. This therefore means that the manufacturer

43
carries out personal selling functions and the storage of its products in alternative 1 while in
alternative 2 it spins-off the personal selling function and storage to specialized agent
wholesalers.
Fig. 2.3: Functional spin-offs
Source: Adapted from Nebo O.G. (2011: 48).
In the above examples, each channel alternative generates different level of sales volume and
costs, The first thing the manufacturer should consider is whether more sales volume would
be achieved through the company’s sales force or through the sales agency. After determining
the level of sales volume each channel alternative is capable of generating, the manufacturer
should then estimate the cost of selling different volumes through each channel. The cost
schedule shown above demonstrates the cost characteristics of the different channel
alternatives in relation to volume of sales. The average cost of alternative 2 to the
manufacturer (i.e spinning off both functions) is constant over the range of sales. On the other
hand, the units cost of alternative 1 (using company’s sales force and warehouse) declines as
the level of sales increases. It is pertinent to state that the average cost of alternative 1 can
only decline when the sales force compensation plan is based on straight salary and the
warehouse was out-rightly bought by the company.
Alternative1, Man. Sales force: Average cost declines as volume increases.
Alternative 11, Sales agent: Average cost constant as volume of sales increases.

44
In the above diagram, the two alternatives have equal costs at point X. This means that at
sales level Q3, either of the alternatives can be used by the manufacturer. At sales level less
that Q3, the manufacturer should choose alternative 2 because the average cost of selling
through that alternative is less. At sales greater than Q3, the manufacturer should choose
alternative 1 (i.e performing the personal selling and warehousing functions by itself).
Based on the above analysis, it is more economical for firms whose outputs and markets are
limited to spin-off the channel functions to other members of the channel for such company
to perform such functions.
2.5.3 Determination of Marketing Channel Structure through the Concept of
Substitutability
Underlying the logic of the principle to be developed is the hypothesis that economic
interaction among basic marketing functions and between the functions and production,
provides much of the force that shapes the structure of the distribution channel. These
interactions occur because of the capability of the various functions to be used as substitutes
for each other within certain broad limitation. (Louis P. Bucklin, 1966)
The substitutability of marketing functions may occur both within the firm and among the
various institutions of the channel e.g producers, middlemen and customers. This
substitutability permits the work load of one function to be shrunk and shifted to another
without affecting the output of the channel. These functional relationships may also be seen
to be at the root of the “total cost” concept employed in the growing literature of the
management of the physical distribution system (Edward W. Smykay, Donald I. Bowersox
and Frank J.Mossman, 1961: 4).
A familiar example of one type of substitution that may appear in the channel is the use of
inventory to reduce the cost of production stemming from cyclical demand. Without the
inventory, production could only occur during the time of consumption. Use of the inventory
permits production to be spread over a longer period of time. If some institutions of the
channel sense that the costs of creating a seasonal inventory would be less than the savings
accruing from a constant rate of production, it would seek to create such a stock and to retain
the resulting profits. The consequence of the action is the formation of a new and alternate
channel for the product.

45
In essence, the concept of substitutability states that under competitive conditions, institutions
of the channel will interchange the work load among functions not to minimize the cost of the
individual function but the total costs of the channel. It provides thereby, a basis for the study
of distribution channels. By understanding the various types of interactions among the
marketing functions and production that could occur, one may determine the type of
distribution structure that should appear to minimize the total channel costs including those of
the customer (Louis P. Bucklin, 1966).
2.5.4 Checklist Method of Determining the Appropriate Channel structure
The checklist approach is more general of all the approaches because it considers not only the
economic factors of determining the channel structure but all other factors. (Nebo O.G.,
2011: 51). The checklist approach therefore provides a list of factors that should be
considered to enable the manufacturer determine the channel structure to adopt. The factors
according to Brown (1983) include:
i. Market factors
ii. Product factors
iii. Organizational factors
iv. Channel Members factors
v. Environmental factors.
Market Factors
The characteristics of the target market determine the choice of channel structure. Direct
channel of distribution will be more desirable under the following market situations:
i. If the customer are few
ii. If the market is geographically concentrated
iii. If the average orders size is large.
On the other hand, long channels will be more desirable under the following market
situations:
i. If the customers are geographically dispersed
ii. If the average order size is small
iii. If the customers purchase more frequently.

46
Product Factors
The product characteristics also determine the choice of channel structure a firm uses. The
products unit value sets limit as to how short or long channel structure can be. A product of
high unit value (of about tens or hundreds of thousands of naira) would normally require
short channel to distribute while product of low unit values would require longer channel.
The degree of perish ability of the product also influences the choice of channel structure that
should be used. If the product is perishable, it should best be distributed through relatively
short channels so that the product will reach the final consumer early enough before it
damages. If the product is not perishable, it could be distributed through long channel,
assuming the other factors to be constant. The complexity and technical nature of products
also determine the channel length. Technically complex products require the know-how of
the manufacturer to market. As a result, such products require short channel to market.
Highly standardized items are sold through long and complex channels while custom-made
goods are better distributed direct.
Company Factors
Factors within manufacturer’s organization strongly influence the channel design. The
financial strengths and weaknesses of the company strongly influence its choice of channel.
Short channel requires relatively larger capital outlay for fixed selling expenses than the long
channels. The company’s desire for the control of the product sales to the end users
influences the channel length. If a company’s management wants to control the promotional,
credit and storage activities of the product, it should choose the shortest available channel.
Channel Members Factors
Channel design reflects the strengths and weaknesses of the different types of intermediaries
in handling various tasks. For example, manufacturer’s representatives are able to contact
customers at low cost per customer because the total cost is shared by several clients. On the
other hand, the selling effort per customer is less intense than if the firm is using company’s
sales force. Again, intermediaries differ in their ability in handling promotion negotiation,
storage, contact and credit. Therefore, the relative ability of the channel members in carrying
out the above functions determines the choice of channel structure to use.

47
Environmental Factors
Manufacturers prefer to distribute their goods directly to the final consumers during a
depressed economic period. Such situation does not allow for full capacity operation and as a
result, manufacturers would want to distribute their goods through the shortest possible
channel. On the other hand, during the period of full capacity operation, firms would want to
engage the services of all the available intermediaries to resell all the segments of the market.
2.6 Distribution channel design
Use of the term “design” as it applies to the marketing channel varies widely. Some authors
use it as a term to describe channel structure. Others use it to denote the formation of a new
channel from scratch, while still others use it more broadly to include modifications to
existing channels. Finally, design has also been used synonymously with the term selection,
with no distinction made between the two. Such variation in the usage leads to a good deal of
confusion. Hence, there is need to define more precisely what we mean by design as it applies
to the marketing channel thus:
Channel design according to Rosenbloom (2004: 105) refers to those decisions involving the
development of new marketing channels where none had existed before, or the modification
of existing channels. From this definition, it could be inferred that channel design is a
decision which the marketer faces and it may involve setting up channels from scratch and
modifying existing channels. It also implies that the marketer is consciously and actively
allocating the distribution tasks in an attempt to develop an efficient channel structure.
Therefore, the term selection in this context refers to only one phase of channel design which
means selection of the actual channel members.
Selection decision may or may not be the result of channel design decisions. For examples,
suppose a firm needs more coverage in existing TERRITORIES. Even though its channel
structure remains essentially the same in terms of its length, intensity, and types of
intermediaries, the firm may need additional outlets to allow for growth. Another common
reason for selection, independent of channel design decisions is to replace channel members
that have left the channel either voluntarily or otherwise. (Rosenbloom, 2004: 104-105).
Certainly, the design of marketing channel is not entirely new to the academic literature.
There are some models in designing the marketing channel but there are few methods
specially designed for selection of intermediary in marketing channel (Hamad, R., Kamran,

48
S., and Gholamreza, J. 2011: 25-42). The first use of operation research models in selection
of intermediary was in 1986. Rangan, Zolters and Becker postulated a model for intermediary
selection under the assumption that the firm’s distribution channel structure remains
unaltered. The optimal intermediary network selected by the model was compared to an
intuitive network recommended by sales management (Rangan et al., 1986: 1114-1122).
Nevs (2001: 518-539) proposed a model that has 4 phases – understanding, objectives/goals,
implementation, monitoring and revision and 11 steps in implementation phase. In the 9th step
– channel selection – once the objective is set, the company can select the channel structure
and channel members if it has the flexibility to do so, which depends on the availability of
agents in the channel, the kind of relationship that will be built and several other factors
analyzed in the preceding steps. Stern and El-Ansary (1982: 105) affirm that a channel is not
easy selected: there are some constraints such as the availability of good middlemen,
traditional channel pattern, product characteristics, company finances, competitive strategies
and customer dispersion question. It is the same idea of Mcvey (1960: 61-65) who states that
channels networks were not necessarily designed under the control of one type of
organization and it faces limited choices in designing the channels for their products.
Rosenbloom (2004: 105-109) developed a model for designing the channel that can be
broken down into seven phases or steps: (1) Recognizing the need for a channel design
decision, (2) Setting and co-coordinating distribution objectives, 93) specifying the
distribution tasks, (4) Developing possible alternative channel structure, (5) Evaluating the
variables affecting channel structure, (6) choosing the “best” channel structure, (7) selecting
the channel members. The actual selection of firms that will become marketing channel
members is the last phases of channel design model.
Rix, P. (2005) proposed a model consisted of 4 steps: first decide the task of distribution
within the marketing mix, second, select the type of distribution channel, third, determine
appropriate intensity of distribution and finally choose specific channel members. In the final
step, the firm select intermediary of marketing channel.
Kotler (2006: 476-482) developed a model including 4 steps, analyzing consumer’s needs,
setting channel objective, identifying major alternatives and evaluating them. In the final step
like Rix model, the firm select intermediary of marketing channel.

49
Coughlan et al (2005: 305-316) proposed an analytical model to design and manage
marketing channels. According to this model, the marketing channel design process evolves
activities such as analyzing the customer needs and the services required by different market
segments, identifying the channel flows, defining the channel members, establishment of
channel portfolios (simple or multiple). In the implementation phases, the following aspects
should be analyzed: the use of power among channel members, the management of conflicts,
strategic alliances and legal issues. Thus, the marketing channel plan involves the design,
implementation and control processes.
Finally, a distribution channel selection process was proposed by Mallen (1996: 5-21). This
process is constituted by six steps. First, decision related to five questions should be made.
(1) What degree of “directiveness” should the company’s channel structures have? (2) How
selective should the distribution channel be? (3) What type or types of middlemen are to be
selected? (4) How many channels should be established for a given product? (5) How shall
the individual middlemen be chosen to fill the slots created? Second, the company must
define objectives related to four dimensions: (1) maximize sales, (2) minimize cost, (3)
maximize channel control. Third, it must be analyzed the internal and external factors which
are important to the process. These factors are the market, the marketing mix, the available
resources and the macro environment. Forth, the options should be quantified. Fifth, the
company should select one specific distribution models among the options. Finally, the
company should develop the channel review and evaluation process.
2.7 Distribution Channel Decisions
There are several forms in which a channel can be organized. That will directly influence on
how flows will be performed and, consequently, how the final customers will be satisfied. To
set the form of a channel, however, there are some essential decisions that may be taken due
to reach the objective of the channel and its optimization, with an increase on profits and
lower costs to the companies involved (Consoli and Neves, 2008: 174-185).
Decisions that concern about the choice of the most appropriate channel for a firm, according
to Kotler and Armstrong (1993), are among the most important decisions that must be taken
and can be related and grouped as;

50
2.7.1 Decision on Necessity of Services to the Customer
As mentioned in the previous sessions, it is necessary to understand the levels of services
desired by customers to plan the channel efficiently (Consoli and Neves, 2008: 174-185).
Coughlan et al (2005: 500) illustrates that these, such as breaking bulks and setting the size of
the lots, selecting the level of market decentralization, the variety of products that will be
offered, service support and wait time for products may have an important impact on the
relationship between the parts and consequently, on product’s image.
2.7.2 Decision on Channel Objectives.
Channel’s objectives must be also a result of the levels of services demanded. (Consoli and
Neves, 2008: 180-185). The objectives of the distribution channel can be divided into (1)
objectives for the customers (2) objectives of the firm and (3) objectives for the
intermediaries. Factors like corporate policies, characteristics of the intermediaries, nature of
the products, and competition may also interfere on channel’s objectives.
2.7.3 Managerial decisions on the channel
Managerial decisions are taken in, basically, three different areas referring to the marketing
channel structure. According to Coughlan et al (2005: 461), those areas are related (1) the
extension of the channel (length) or directivity, (2) to the distribution intensity and (3) to the
choice of intermediaries to perform the functions inherent to the channel.
Decisions on channel’s extension/directivity: Decisions on channel’s extension concern
about, mainly, how direct or indirect should the channel be or how short or long should it be
in order to achieve the channel’s objectives (Consoli and Neves 2008: 182). Direct channels
are the most simple distribution channels, and it involves direct contact between producer and
user. In a direct distribution (known as short channel as well) producers sell their products
directly to the final consumer. That is, without a participation of an intermediary (Berman,
1996: 663).
According to Blue et al (1970), direct distribution ensures producers the whole control of
distribution products. On the other hand, producer must be able to solve marketing and
production problems and must gather know-how on direct sales and retail’s operations due to
engage in direct sales with large scale. With the exception of a channel of level zero (which
uses no intermediaries), all other channels are indirect. In an indirect distribution (or long
channel), independent members of the channel share the specific activities to perform

51
marketing flows. Berman (1996: 663) highlights that despite the lower financial needs for
each member of the distribution channel; a long channel requires large efforts of coordination
of activities and functions.
Decision on Distribution Intensity
The intensity of distribution is determined by how many of certain intermediaries are used in
the same level of a channel (Coughlan et al 2005: 455). In this case, there is usually three
possibilities (i) exclusive distribution: (ii) selective distribution and: (iii) intensive
distribution.
i. In an exclusive distribution strategy, the producers takes control of the quality of
services performed and also deal/contract with the intermediary not to commercialize
competitors’ brands, characterizing a deal based on relationship (Pelton, Strution,
Lumpkin, 1997: 728).
ii. Selective distribution is characterized by a limited number of intermediaries serving
the producer performing the necessary functions of personal sales, communication
and services to the product. To reach desirable results, producers must establish a
well-planned network of intermediaries, which may share the same goals and
objectives of the producer and reach the same desired target market. According to
Lambin (2000: 726), the choice of a selective distribution strategy is essential when
the size of the intermediaries, the quality of the services and availability for
cooperation with the producer are being taken into account.
iii. Using an intensive distribution strategy, the company tries to achieve as many sale’s
points as possible and to multiply the distribution centers, to ensure a high volume of
business and minimum coverage of sale’s territory (Lambim, 2000: 727), Consoli
(2005:) emphasizes that this kind of distribution are commonly used by beverage and
food companies, whose products can be found in a vast number of distribution points
such as supermarkets, drugstores, convenience stores, vending machines, etc.

52
Decisions on Choice of the Intermediaries
Once decisions on channel’s intensity were made, there are some criteria that can be analyzed
before the selection of intermediaries. These criteria will directly influence on the choice of
intermediaries, as each type of intermediary has advantages in certain conditions and also
some restrictions and advantages. Table 2.2 presents some criteria that can be analyzed,
aiming at the optimal selection of intermediaries (depending on companies’ objectives).
Table 2.5: Criteria’s Example for Selection of Intermediaries
Source: Consoli, M.A., (2005), Retrieved Sept. 2011
http://www.pensaconference.org/ul-pensa-conference.
SELECTIONS’ CRITERIA
DESCRIPTION
Credit and financial conditions.
Financial capacity, credit guarantees, restrictive information.
Sale’s Force. Sales’ force size and qualification, frequency of visits and customer’s service. Sale’s Performance
Information about history of sales, incoming per area, sales, clients, etc.
Lines of products
Aspects of extension of products’ lines; competitors’ products, substitutes and complementary.
Reputation Reputation to suppliers, clients and customers. Involves image, character and company’s history.
Market coverage
Size of the covered area, quantity of clients and potential common areas with other regions.
Attitudes Takes into account aggressiveness, enthusiasm, and will to form partnerships. Size It relates size with sales’ volume, financial capacity, better equipment, more
employees, etc. Experience Indicates if the member of the channel has the demanded knowledge and
experience within the market, products’ lines and with other companies. Managerial factors
Involves managerial capacity, organization, costs’ structure, planning, etc.
Support Services
Capability to offer support services to distribution and differentials over local competitors.
Market’s information
Available information that can be shared with the company about the market, products, competitors, trends (tendency). Etc
Structure Adaptation of the company and products to the managerial, logistical and storage structure.
Coordination Capability and interest to perform marketing functions that will be allocated among the members of the channel.
Control Involves the set of control’s level that the company will have over resources activities of the channel.
53
2.7.4 Modifying Channel Arrangements
Due to the strategic and dynamic nature of distribution channel structures, a producer must
periodically review and modify its channel arrangements. According to Ehikwe (2002: 213 –
214), the degree of control and privileges will determine the extent of such modification or
adjustments. There are situations in which dual distribution may be contemplated by
manufacturers to reach the consumers, thus resulting in the use of field sales force and
middlemen. This applies mostly to manufacturers who may have been using sales agents for
distribution and as production expands and wider markets are reached, the need for salesmen
becomes absolutely necessary to meet the grassroots customers in the sales territories.
Kotler and Keller (2006: 485 – 486), identified some of the conditions necessary for
modification to include: when the distribution channel is not working as planned, consumer
buying pattern change, the market expands, new competition arises, innovative distribution
channels emerge and the product moves into later stages in the product life cycle. No
marketing channel will remain effective over the whole products life cycle. Early buyers
might be willing to pay for high value added channels, but later buyers will switch to lower
cost channels. For instance, small office copiers were first sold by manufacturer’s direct sales
force, later through office equipment dealers, still later through mass merchandisers, and now
by mail-order firms and internet marketers.
Channel take over is also a common feature of structure modification whereby manufacturers
may co-operate to combine their distribution service in order to maximize channel efficiency.
In one of such combinations, manufacturers could embark on taking over the wholesale and
retail services and deal directly with consumers in a forward integration. Alternatively,
retailers and wholesalers may integrate backward to produce the products they distribute by
taking over manufacturing activities. A forward or backward movement is a function of
reaching consumers (Ehikwe, A. E., 2002: 214).
In competitive markets with low entry barriers, the optimal channel structure will inevitably
change over time. The change could involve adding or dropping particular market channels,
or developing a totally new way to sell goods. Adding or dropping individual channel
members requires an incremental analysis. What would the firm’s profit look like with and
without this intermediary? Sometimes a producer considers dropping all intermediaries
whose sales are below a certain amount. (Kotler and Keller, 2006: 485).

54
2.7.5 Channel Performance
The performance of a channel can be measured across multiple dimensions. The parameters
that are measured usually are effectiveness, efficiency, productivity, equity and profitability
of the channel.. While channel efficiency emphasizes controlling costs incurred by
intermediaries while performing channel functions, channel productivity is concerned with
maximizing outputs for a given level of input. Channel effectiveness deals with the
intermediary’s proficiency in satisfying customer needs and equity measures the distribution
of accessibility of the channel among customers (ICMR, 2011).
According to Michael and Adrea (2006), channel performance can be measured in many
fashions. The accounting literature, for instance, has adopted measures like ‘firm survival’ in
the longer term and return of investments and return of assets in the shorter term. Financial
performance indicators have been, however, criticized of being myopic (Kaplan and Norton,
1996). In public sector operations (e.g. public broadcasting, telephone companies and the
post office), the current endeavor is to measure performance by assessing the overall quality
of service delivered to specific stakeholders. When these stakeholders are of societal
importance, then the societal indicators typically focus on changes in the human condition
and therefore are much less financially based (Ogata and Goodkey, 2002). Last but not the
least; channel performance can be measured as a function of efficiency. It should focus on
how well the firm minimizes costs associated with performing necessary channel functions
such as transferring goods from the manufacturer to the end consumer disregarding the
profits made at any point along the line.
Clearly, there must be a reason behind the diversity of channel performance measures. Each
of the preceding authors suggests their channel measures lead to organizational success
through effective channel management. Evidently, each individual measure of performance
has limitations and is incomplete. Rather, a combination of the available measures is
necessary to appropriately judge true channel performance. Further, different combinations
will be appropriate in different situations. The difficulty of performance measure is to
determine the underlying structure that defines the combination of measures most suited to a
particular set of circumstances. In order to achieve this, a framework of channel performance
metric guidelines is required (Michael and Andrea 2006).
55
Performance Measurement
Traditionally, performance measurement systems were both outcome focused and financially
focused and were neither multidimensional nor strategic. In the 1990s, performance
measurement systems became broader and included measures of innovation and customer
satisfaction. Yeniyurt (2003), reports that UK companies still consider internal financial
measures more important that external market measures. The literature suggests that accurate
measurement of marketing performance allows marketing managers to objectively and
regularly assess the quality of their decisions and is central to the learning organizations’
success. Further, the role of marketing measures is also to help implement marketing strategy.
Hence, marketing performance and channel performance can also be seen as a function of the
quality of marketing metrics.
The fundamental rationale of any business measurement system is to cater for feedback,
relative to one organization’s goals, that intends to advance the organization’s probabilities of
accomplishing these goals in an effective and efficient manner. In that, performance
measurement systems support managers in monitoring the deployment of business strategy
by evaluating actual outcomes related to strategic goals and objectives (Neely, 1998).
2.7.6 Channel Satisfaction
Much of the marketing channels research has been done from a behavioral perspective.
Attention has focused on satisfaction as it relates to performance and issues of power and
control (Stern and Reve, 1980). Satisfaction is thought to facilitate improved morale and
cooperation among channel members (Hunt and Nevin, 1974) and lower dysfunctional
conflict (Lush 1976).
Managers’ satisfaction with their firm’s marketing channel is believed to be related to
performance (Robicheaux and El-Ansary 1975), but the determinants of satisfaction are not
well understood, particularly in an international context. While satisfaction is a result of past
decisions, expected satisfaction is an antecedent of such decisions. Firms may be using
channels that are not the most preferred, but they may not be able to change. Because of a
lack of external intermediaries, firms may be performing functions internally that they would
otherwise contract for a market – mediated transactions. Alternatively, they may be locked
into external contracts that they would prefer to internalize but are unable to alter. Firms are

56
not always able to obtain the best channel structure for their purposes, particularly in an
international context. It is likely that satisfaction is related to the ability to achieve a desired
channel structure. Satisfaction is seen by marketers as a general psychological phenomenon
describing the emotional state resulting from an evaluation of one’s experiences in
connection with an object, action or condition (Westbrook and Reilly 1983). Satisfaction has
been regarded as a kind of stepping away from an experience and evaluating it. Satisfaction is
not simply the pleasurableness of an experience, it is evaluation rendered that the experience
was at least as good as it was supposed to be (Hunt 1977).
The discrepancy model argues that satisfaction is a function of the expectations, the more
realistic such expectations, the lower the likelihood of disconfirmation and the greater the
satisfaction. Realistic expectations are a function of prior experience, and we should expect
experience to be positively associated with expectation. Satisfaction is generally thought to
depend on the degree of difference between pursued and perceived outcomes (Thierry and
Koopman – Iwema 1984). In the evaluation process, an individual estimates, either on a
conscious or subconscious level, the relationship between some object, action, or condition
and one or more of one’s values. Perceptions are considered to be selective and evaluations
may be distorted due to particular frames of reference. The major theories of satisfaction
marketing depend on confirmation/disconfirmation of expectations (Anderson 1973, Bearden
and Teel 1983).The standard of comparison on which expectations are based is as critical for
the evaluation of satisfaction as is the actual performance of the product or service (Tse and
Wilton 1988). The subjective evaluation of the size of the discrepancy determines the extent
of satisfaction (Oliver and Swan 1989).
2.8 Current trend in Marketing Channels
2.8.1 An Evolutionary Overview
According to the Smith-Stinger paradigm, marketing and distribution channels were
originally studied in reference to models based on the market structure, competition and the
type of specialization of the interacting subjects (Mallen, 1973). This paradigm also justified
the existence of trade intermediaries with their capability to generate economies of
specialization.
Tied to microeconomics principles, the institutional perspective (Bucklin, 1966) focused on
channel actors as a sequence of institutions that carry out the transfer of goods from the
producer to the end-customer. In turn, they activate various types of flows. Similar to the

57
institutional approach, the functional approach has analyzed marketing channels on the bases
of the roles carried out by their members (Alderson, 1957).
Marketing channels have also been defined as Vertical Marketing System (VMS)
(McCammon, 1970), in the cases where a co-coordinating leader emerges. All traditional
perspectives have assumed that a marketing channel or a VMS can be seen as a vertically
integrated, uni-linear structure linking the retailer with the manufacturer through a series of
intermediary wholesalers. This is no longer appropriate conceptualization for the structure of
distribution channels in the highly developed retailing systems of western countries. In these
systems, power relations between agents in the channel have been fundamentally changed by
the actions of the manufacturers and large retailers in extending, through vertical integration,
the scope of their activities, particularly at the expense of wholesaler intermediaries (Dawson,
1979). The distribution channel has also been changed upon by the horizontal incorporation
of additional actors (e.g, buying groups) who are not always engaged in the physical
distribution of goods. For the small multiple retailer and the single-site independent, franchise
organizations, voluntary groups and trade associations have become increasingly prominent
agents within the distribution channel.
In recent years, the context of globalization in which market channel structures and strategies
are developing (Rosenbloom, Larson, 2008: 235-252) is bringing to a more complex concept
of marketing channels, with disintermediation or re-intermediation, multi-channeling and
new roles/specializations that are emerging as new issues. Moreover, the increasing search
for efficiency and speed in vertical relationships, is leading to a convergence of perspectives
for those channel related activities like supply chain management, logistics and purchasing
(Gundlach et al., 2006: 428-438).
In this context, innovation in marketing channels becomes a complex, multi-organizational,
multidisciplinary activity that requires collaboration and interactions across various entities
within the supply chain network, with a substantial portion of the innovation process and
resulting outcomes that occur at the buyer-seller interface level (Ganesan et al., 2009: 84-94).
2.8.2 Drivers of Innovation in Marketing Channels
Referring to marketing channels, the concept of innovation must be viewed in the context of
a double layer through which it expresses itself. On the other hand, it must be seen as a

58
strategic activity for both industrial and distribution firms to acquire a competitive advantage
along the distribution channel. On the other hand, it should be seen as a changing process of
the economic function of the distribution systems. Following this changing process, new
forms of distribution emerge, offering new services to the existing ones. In both cases,
innovation comes from the choices of firms along the channel, which increasingly involve
their partners, upstream and downstream of the network they belong to. This originates
innovations increasingly focused on the vertical network, more than on the individual firm
(Musso, 2010).
In recent years, the innovation processes in marketing channels have occurred with high
intensity and speed, especially following the changes spurred by technology that allowed the
adoption of more efficient organization solutions. As a consequence, an increased
competitiveness for all firms in the channel has emerged. Another factor which has greatly
stimulated innovative processes in marketing channels was the process of modernization of
the retail sector that in recent decades has progressively strengthened and enriched the role of
retailers. Even the social changes and new behavioral patterns of the final demand, have
stimulated innovations designed to accommodate new values concerning consumer goods and
their distribution systems (e.g., traceability and the compliance with social, ecological and
ethical values in the manufacturing processes).
These influencing factors have been active in a context of strong emphasis on competitive
dynamics, both at the horizontal level (between manufacturers and between retailers) and the
vertical level. Such dynamics have occurred with the development of private label products,
the emergence of retailing marketing, the increasing downstream integration by
manufacturers (e.g., manufacturer-owned retail stores and factory outlets) and, conversely,
the upstream integration of the retailers’ supply chain.The stimulus to innovation in
distribution channels has been distinguished as technology based, with reference to the
opportunities offered by innovation in information and communication technologies (ICT),
and market-based (Castaldo, 2001: 15). Market based factors may, in turn, be distinguished in
demand-based factors, related to changes in the characteristics and behaviors of customers
that companies seek to comply with (Kaufman-Scarborough, Forsythe, 2009: 517-520), and
competition based factors, with specific reference to a differentiation and quick response to
the final demand changes approach. Often times, this logic is based on the principles of time-
based competition (Hum, Sim, 1996; 75-90). emphasizing the value of the time variable in

59
pursuing a competitive advantage, and planning marketing policies on a perspective referred
to competitors, in some cases more than to the final demand.
Innovation in marketing channels will be analyzed by taking into account all types of
channels and subjects, not just those at the retail distribution level, and will consider all types
of products distinct. The analysis will be carried out following three different perspectives:
A. Technological perspective: What are the fronts of technological innovation for the
optimization of interactions among companies and with the final demand?
B. Relational perspective: Which innovation fields can be developed on, in regard to
vertical relationships between firms in a marketing channel?
C. Structural perspective: What new channel configurations may occur?
2.8.3 The Technological Perspective of Innovation
The technological perspective can be divided into an area of innovation in vertical
relationships between firms and an area of innovation in relationships with final demand.
2.8.3.1 Innovation in Vertical Relationship between Firms
Following the technological perspective, the first innovation field in the relationships is that
of technology based interaction tools. That is, all the techniques that allow, through the use of
ICT technology, to speed up universal relationships and make them more efficient, without
interruptions and with stock reduction. Information technology and telecommunications – the
main technologies on which the inter and intra-firm information management process has
been built – actually represents the technological platform of Supply Chain Management.
(SCM) (Musso, 2010).
In actuality, global SCM is becoming a strategic objective for many companies. In addition,
the concept of SCM is becoming fully recognized as a common process to manage innovation
and coordination among firms’ networks. A permanent body – the project consortium
Efficiency Consumer Response (ECR) – has been established for this purpose, after being on
the negotiating table for several years, where manufacturers and retailers work to search for
better cooperation for more efficient supply chains. ECR aims to develop the supply chain as
a whole and eliminate non value-added functions. The key elements of ECR are efficient
replenishment, efficient assortment, efficient product introduction and efficient promotion.

60
These are the means with which to face the major problems in retail stores, namely out-of-
stocks and over-stocks (Kotzab, H. 1999: 364-377).
There are three levels of cooperation that can be achieved in managing the supply chain. The
first level refers to logistics, with the objective of improving the productivity of physical and
information flows by improving the transportation network, the logistic centres management,
the non-compliance managing processes, and by the establishment of communication
infrastructures such as Electronic Data Interchange (EDI). In regards to logistics, some
elements have resulted as changing factors that go beyond a simple technical optimization
allowed by developments in information and communication management. More specifically,
for innovative relationships within the channel, characterized by the need for greater
coordination and integration, logistics can be seen as an interface between strategic and
tactical orientations that can sometimes be different or conflicting among the channel
partners. To lower the cost of the stock management, handling and transports, several
organizational solutions have been developed, aimed at making the logistic cycle faster and
without errors. These solutions can be developed via third party operators or by the use of
transit logistic facilities, according to the cross docking technique.
The most recent fields in logistic innovation regarding monitoring systems for material
movements, both inside and outside the warehouses, relate to Radio-Frequency Identification
(RFID). RFID is the use of an object (typically referred to as an RFID tag) applied to a
product, or a package, for the purpose of identification and tracking using radio waves. RFID
is also used in inventory systems, with relevant potential reductions in out-of-stocks
(Hardgrave, Miles, Mitchell, 2009). Other benefits of using RFID include the reduction of
labour costs, the simplification of business processes, and the reduction of inventory
inaccuracies.
The basic infrastructure for coordinating logistic processes among channel partners is the EDI
that has been defined as “tools which permit the automatic exchange of data between remote
applications in situations where these belong to different organizations’ (Martinez, Polo-
Redondo, 2001: 385-394). The principal attraction that EDI has for companies in marketing
channels lies in the large number of references that are exchanged. For large retailers, as well
as wholesalers, EDI means a big saving, because they work with a large number of suppliers
(and/or customers) with a great quantity of references, and all these means having to handle a

61
vast amount of documents of different types. This is why these are the companies that have
promoted the development of EDI in commercial distribution, in many cases forcing small-
scale suppliers to adopt this tool.
The second level of collaboration in supply chain processes is the joint management of
supplying activities, through techniques such as Vendor Management Inventory (VMI),
which includes assortments decisions, activities for reducing stock-outs, and the use of
indicators to control and improve joint processes. VMI is an operating model in which the
supplier takes responsibility for the inventory of its customer. In a VMI-partnership the
supplier makes the main inventory replenishment decisions for the customer. The supplier,
which may be a manufacturer, reseller or a distributor, monitors the buyer’s inventory levels
and makes supply decisions regarding order quantities, shipping and timing (Waller et al,
1999). In VMI, the supplier is able to smooth the peaks and valleys in the flow of goods, and
therefore to keep smaller buffers of capacity and inventory. Successful VMI implementations
in retailing can be found in the apparel industry. However, VMI has not gained large
acceptance in the grocery supply chain.
The third level of collaboration in SCM involves a higher degree of integration, with marked
implications for marketing, both in the end-customer analysis, and the establishment of
certain policies (e.g., category management, promotions inside outlets, and shelf space
management) through the adoption of methodologies such as Collaborative Planning
Forecasting and Replenishment (CPFR) and Vendor Managed Category Management
(VMCM). CPFR is a methodology for the joint purchasing management between retailers
and their suppliers. It consists of jointly making sales forecasts and procurement schemes,
and includes all activities that pertain to the management of assortments, such as promotions
and the introduction of new products. The CPFR encourages the sharing of market
information and collaborative planning for the establishment and management of optimal
assortments. The CPFR is suitable for those product categories that require a high level of
promotional activity and that are characterized by significant fluctuations in demand
VMCM is a concept for retail demand fulfillment that combines the ideas of VMI, Category
Management and outsourcing. The more frequent application for VMCM is on non-core
product categories because the benefits of outsourcing are most obvious: for a retailer, it is

62
expensive to maintain knowledge and skills to manage a minor product category, and the
outsourcing risk is at its lowest in a non-core category (Kaipa, Tanskanen, 2003: 165-175).
2.8.3.2 Innovation in Relationships with Final Demand
The most important fronts of technological innovation in the relationships with final
consumer are checkout technologies, dynamic pricing, electronic and mobile payment
systems, distance selling, mainly on-line sales and Self-Service Technologies (SSTs), such as
vending machines and multimedia kiosks. Checkout or Point of sales (POS) technologies are
applied to locations where a retail transaction occurs. A ‘checkout ‘refers to a POS terminal
or more generally to the hardware and software used for checkouts, the equivalent of an
electronic cash register. A POS terminal manages the selling process by a salesperson
accessible interface. Future development of the technology is towards web based POS
software that can be run on any computer with an internet connection and supported browser,
without additional software installations or manual updates required.
The benefits of POS technology are in the possibility to better manage inventory, by
combining sales data with the amount and cost of the purchases. This enables the firm to
analyze the profitability of individual products and manage inventory more accurately and
quickly. Moreover, with data on the rate of rotation and the productivity of products, it is
possible to optimize product display in the store through the use of specific space
management software. It has been several years since innovation technologies were being
experimented with to make checkout procedures faster and more personnel time saving. The
adoption of self-scanning systems, which are currently the most used trials in progress, seems
to be only an intermediate solution compared to technologies based on radio frequency
transmissions. The spread of these technologies, however, requires that manufacturers apply
RFID tags to all individual products.
In addition to POS technology, dynamic in-store pricing policies with the use of electronic
shelf label (ESL) systems can be conducted. They may allow price changes depending on
time of day and levels of customer traffic in the store. An ESL system consists of a PC, local
wireless communication network and electronic labels (small LCD screens). The system
obtains information from the store scanner database, and broadcasts it to the shelf labels. The
system continuously monitors the ESLs to ensure that they are present and that they display
the correct information. (Bergen et al 2008: 209-250). ESL systems yield 100% accuracy
because the cash register prices are identical to the prices displayed on the ESLs as both are

63
linked to the same database. According to Zbaracki et al. (2004: 514-533), ESL systems are
costly to purchase (system price, installation cost, training to employees to use the system)
and maintain (continuous upgrade of software and hardware, labels battery replacement,
labels replacement after tampering).
Related to POS-scanner technologies are electronic and mobile payment systems that are
usually under transition. The extensive use of credit and debit cards for proximity purchases
has already demonstrated the possibility of considerably reducing the volume of cash-based
transactions. Mobile payments are payments for goods, services, and bills with a mobile
device (such as a mobile phone, smart-phone, or personal digital assistant (PDA) by taking
advantage of wireless and other communication technologies (Dahlberg et al., 2008: 165-
181). Several successful mobile payments systems have already been launched in order to
enhance the convenience of micro-payments for local daily expenditures (Ondrus, Pigneur,
2006: 246-257). These solutions have been principally adopted by various quick-service
oriented industries such as public transportation, toll booths, gas stations, fast-food
restaurants, retail vending machines and ski resort ticketing (Chou, Lee, Chung, 2004: 1423-
1430).
Other forms of innovation in relationships with final consumer are detectable in distance
selling- mainly television (TV), telephone and on-line selling that represents the evolution of
mail order sales. TV sales are revitalizing their innovative role, following technologies that
make TV communication interactive, making it possible to make purchases directly through
the TV. The main innovation potential in distance selling, however, comes from online sales,
as part of e-commerce. Online shopping remains a small fraction of retail sales despite the
well-known benefits of electronic commerce to consumers, including lower prices
(Brynjolfsson, Smith 2000: 563-585), greater selection and availability (Ghose et al. 2006: 1-
19), and greater convenience by eliminating travel costs and enabling purchases irrespective
of geographic location. There are many reasons for consumers to slow adoption of online
shopping habits: inspecting non-digital products is often difficult, shipping can be slow and
expensive, and returning products can be challenging (Forman, Ghose, Goldfarb, 2009: 47-
57). That is, there appears to be a set of fixed disunity costs of buying on-line. These costs
vary across products and retailers, and in some markets have created significant hurdles to the
continued diffusion of electronic commerce.

64
The last face of technological innovation in dealing with the final consumer is that of Self-
service technologies (SSTs), based on interacting technologies, like vending machines and
multimedia kiosks. With consumers wanting quick and convenient access to competitively
priced products, the vending industry has seen a great deal of growth over the last ten years.
Vending machines are continually updating with the latest technologies, as well as the variety
of products that are being sold. One of the newest vending innovations is telemetry. The
advent of reliable, affordable wireless technology has made telemetry practical and provided
the medium through which cashless payments can be authenticated. Machines equipped with
telemetry can transmit sales and inventory data to a route truck so that the driver knows
exactly what products to bring in for restocking. Or the data can be transmitted to a remote
headquarter for use in scheduling a route stop, detecting component failure or verifying
collection information.
Responsive pricing policies (Courty, Pagliero, 2008: 235-259) in vending machines are also
made possible by technology, e.g., in the case of soft drinks vending machines that are
programmed with pricing schemes that vary prices based on consumer’s desire at that
moment, depending on outside temperature. New energy technology is also making its way to
vending machines in the form of hydrogen fuel-cell machines that run off the grid.
Multimedia kiosks, sometimes described as interactive kiosks or public access kiosks, are
computer workstations that are designed to provide public access to digital information and e-
transactions. Kiosk technology supports public access application with a highly visible
housing for the workstations, and interfaces that are easy to use and often based on touch
screens.
Kiosks are typically located in a store, or in a shopping centre or mall, or in other public
environments such as railway stations, motorway service stations and airports. Yet, whilst
web-based e-business has been the subject of much media and academic attention, kiosks are
an unobtrusive addition to the landscape of traditional retail outlets (Rowley, Slack, 2003). In
such applications, kiosks represent an innovation in in-store communication and promotion.
Kiosks can provide customers with a richness of product information, including, for instance:
related products, stock levels and availability, recipes, special offers, and personalized
product design. More sophisticated kiosks can be used as the basis for interaction with
customers, part of a loyalty programme, and may offer other opportunities for community
building, such as those associated with customer-to-customer communication. Multi-media

65
kiosks have been considered as the marketing organization’s opportunity to regain control
over the ultimate stage (the point-of-purchase decision) in the marketing cycle (Norris, 1994:
47-48).
2.8.4 Innovation in Channel Relationships
In reference to the relational perspective of innovation in marketing channels, innovation can
occur in the upstream activities conducted by channel members, or in their downstream
activities, or in relationships with end-customers. In the case of upstream activities, the main
field of innovation in recent years is that of the buying strategy of large retailers. This
innovation was step by step, rather than radical (Musso, 1999).
To respond to rapid changes in the final demand, to the shortening of the life cycle of
products, and to the increasing need of improving the efficiency of the physical distribution
of goods, retail buying activities have become more dynamic, while also becoming the
subject of organizational innovation. These innovations concern the relationship with
suppliers and require their involvement (Gonzalez-Padron et al., 2008: 69-82). Here, the
suppliers’ role and their importance varies in relation to their product offerings (in terms of
brands, originality, uniqueness, innovation), to their size, to the level of concentration within
the sector which they belong to, and to the value of their brand (Musso, 1999). While in the
past the prevailing behavior of retailers was to favor larger suppliers (Grayson, Dodd, 2007).
They can find additional space and play a complementary role, based on dynamicity, variety,
specialization, and a greater responsiveness to the logics of local sourcing, even at the
international level (Pepe, 2007).
In a mirror like position to the supply relations, one main field of innovation in down stream
relations is Trade Marketing (Dupuis, Tissier-Desbordes, 1996: 43-51). Trade Marketing is
aimed at identifying effective marketing tools facing a retailing sector that is no longer fully
controlled by the manufacturer. Even this front, therefore, arises from the process of the
modernization of retailing. The retailer, as an intermediary that is both a part of the marketing
infrastructure for the manufacturer (through which other marketing tools can be activated),
and a customer, becomes the object of the marketing initiatives, which must be consistent
with the policies that the manufacturer adopts towards the final consumer, and with the
buying strategies of the retailer itself.

66
The Trade Marketing brings to the development of innovations in the sales organization for
manufacturers, in the use of commercial and promotional tools towards retailers, in the
business intelligence process where the distributor becomes both the object and partner of
market analysis. The Trade Marketing has previously expressed its innovative potential in the
use of instruments addressed at the retailer. More recently, the analysis field focusing on the
buying process of distributors has been developed. Indeed, as traditional marketing includes
the study of the consumer buying behaviour, the Trade Marketing analyzes retailers’ criteria
for selecting suppliers and their buying strategies, organization and activities (Musso, 2010).
Related to the points stressed previously (the buying process of retailers and TM) and to the
assortment decisions, is category Management (CM). Category Management is a retail
management initiative that aims at improving a retailer’s overall performance in a product
category through more coordinated buying, merchandising, and pricing of the brands in the
category. CM involves the distributor/supplier process of managing categories as strategic
business units, producing enhanced business results (Dhar et al., 2001: 165-184).
CM involves both the front-end activities to enhance category demand and back-door
activities to improve supply management and logistic coordination with vendors. According
to Musso (2010), the areas of innovation arising from the CM can be identified as follows:
Criteria for product display in stores.
Manufacturer’s sales organization (roles and product specialization of key
accounts).
Organization for the buying activities of retailers and levels of responsibility;
need for coordination between sales and buying activities for retailers.
Analysis criteria of the role and viability of the product categories.
Relationship between trade marketing and retailing marketing; and
VMCM, as a process innovation of the VMI concept.
A further area for potential relational innovation in marketing channels is that of private label
products. Retailers are using their store brands as a means of differentiation, helping to drive
store traffic and increase loyalty due to unique identification with the store. Moreover, store
brands allow the retailer to better meet the needs of a growing value-conscious segment of
customers. Innovation linked to private label products leads to a redefinition of the roles
between manufacturers and retailers (Kumar, Steenkamp, 2007), with the later who
appropriate activities of brand policies, promotional activities, and, in some cases, even the

67
research and development of new products. Consequently, a potential loss of all marketing
functions of the producer, and sometimes of upstream activities, e.g., design and sourcing
appears. More recently, private label assortments are expanding over the traditional food
categories, involving several non-food categories, e.g., underwear, batteries, DIY tools, small
household appliances and pharmaceuticals.
A last area in which relational innovation can be developed relates to customer care
initiatives i.e, all activities aimed at strengthening the relationship with the end user based on
information obtained through Customer Relationship Management (CRM) process. The CRM
process in the retailing context is associated to the use of loyalty cards that allow the retailer
to obtain a great number of information from its customers. The technology of loyalty cards
allow retailers to transform cold data on consumer behaviour into warm and ‘learning’
relationships (Pine, Peppers, Rogers 1995) and into customer loyalty, founded on mutual
understanding and trust. (Mauri, 2003: 13-25).
2.8.5 Retail Change and Channel Structure
The main innovations of manufacturers in the structure of marketing channels have occurred
at the retail level. They may be related to franchising (Gillis, Combs, 2009: 553-561), mainly
at international level (Szulanski, Jensen, 2008: 1732-1741); Multilevel Marketing Systems
(Johnston, Ferrell, Darmon, 2007: 289-290); multilevel franchising (Emerson, 2009) that
combines both traditional distribution and direct selling techniques, manufacturer-owned
retail stores (Wang, Bell, Padmanabhan, 2009: 107-127); factory outlets (Bray, Berger,
2008: 14-17); and pop up stores, also named ‘guerrilla stores’ (Niehm et al., 2007: 2).
The latter are temporary stores that represent the latest expression of innovative solutions
adopted by brand manufacturers, as a new experiential marketing format intended to engage
consumers. Pop-up retail entails creation of a marketing environment focused on promoting a
brand or product line, available for a short time period, and generally in smaller venues that
foster more face-to-face dialogue with brand representatives, which is a top factor attracting
people to the experience (Gordon, 2004: 74-75). Moreover, pop up retail is applicable beyond
traditional retail environments or in businesses associated with creating retail environments,
such as apparel retailers or restaurants (Shanahan, 2005: 32). Pop up retail may be event-
driven and mobile, and generally depends on guerrilla marketing techniques (e.g., word-of-
mouth) instead of mass media campaigns to draw people (Trend Watching, 2006).

68
The retailing based innovation in marketing channels can be seen as a ‘product innovation’ of
the retail offer’. The product innovation in retailing is intended both in the perspective of the
rising of new distributive format/concepts of retail stores, and in the perspective of a
continuous evolution of the commercial offer through: the marketing levers (assortment,
prices, promotions, merchandising, etc); the environment and all soft attributes of retail stores
(visual merchandising, the architecture of retail stores, layouts, equipment, etc); the relations
with the end-customers (fidelity cards, micromarketing, and one to one marketing); and the
offer of services that lie outside the traditional competitive boundaries (catering,
entertainment, cultural services, etc) (Castaldo, 2001). Both in the case of structural
innovation developed by manufacturers, and that developed inside the retail sector, the
arising of new channels leads to the phenomenon of multi-channeling, especially with e-
commerce, that enables the integration of online sales into a portfolio of multiple alternative
distribution channels (Agatz et al., 2008: 339-356).
For manufacturers, major marketing-related concerns in multi-channeling include
cannibalization and channel conflicts (Web, 2002: 95-102). With an increase of the number
of channels carrying the product, the sales derived from each channel are reduced making it
difficult for a firm to recover its costs. Conflicts may arise between different divisions that
manage a company’s different channels, but even more so between different supply chain
members, for example a manufacturer competing with its own resellers through a customer-
direct internet channel (Tsay et al., 2004: 557-606). Consequently, managing the overall
portfolio, rather than individual channels, is key in multi-channeling and a multi-channel
strategy (Rosenbloom, 2007: 4-9) is necessary. It is important for vendors to manage
customer interactions across different channels using a common set of information and
processes, and leveraging information learned on any channel to provide better services or
more targeted offers on other channels. From an operations management perspective,
economies of scale from the integration of multiple channels need to be weighed against
specific requirements of each individual channel. Thus, companies need to make trade-offs
when deciding which processes to integrate across channels and which processes to separate
(Gulati, Garino, 2000: 107-114).

69
2.9 The theory of power and conflict in channels of distribution
For about a decade, the phenomena of power and conflict in channels of distribution have
been given rather regular, empirical attention in the marketing literature, both separately and
as a joint occurrence (Gaski, 2011). For instance, the relationship between power and
conflict, especially the impact of one channel member’s power on the amount of intra-
channel conflict that is present seems to be of particular interest. Based on reported findings,
it appears that the nature and sources of the power possessed by a channel entity may affect
the presence and level of conflict (as well as other behavioral variables) within the channel
(Brown and Frazier 1978: 266-270, Dwyer 1980: 45-65).
For a better understanding of these twin concepts and their implications on channel
management, it is pertinent to look at the various definitions and elaborations of the concepts
as advanced by different authors:
2.9.1 Power: Definitions and Elaborations
Although many behavioral scientists express despair about the arcane nature of power and the
difficulty encountered in attempting to define it, understanding of the concept actually seems
to be fairly consistent throughout the literature: Consider the following:
A has power over B to the extent that A can get B to do something that B
would not otherwise do. (Dahl, 1957: 201-218)
According to Emerson (1962: 31-41), The power of actor A over actor B is the
amount of resistance on the part of B which can be potentially overcome by A.
Similarly, Cartwright (1965: 1-47) stated that when an agent, O, performs an
act resulting in some change in another agent, P, we say that O influences P.
then we can say that O has power over P.
Clearly, there is considerable agreement among the authors of these frequently cited
definitions of power. As an expression of the underlying theme, “the ability to evoke a
change in another’s behavior’’ is hereby proposed. In other words, power is the ability to
cause someone to do something he/she would not have done. Essential concurrence is offered
by others who define power as:

70
…….an asymmetrical relation between the behavior of two persons……how a
change in the behavior of one (the influencer) alter the behavior of the other
(the influence) (Simon, 1953: 500-516).
Concerning the application of the concept to a marketing context:
Power refers to the ability of one channel member to induce another channel
member to change its behavior in favour of the objectives of the channel
member exerting influence (Wilemon 1972: 12-32).
Finally, according to El-Ansary and Stern (1972: 47-52):
the power of a channel member is his ability to control the decision variables
in the marketing strategy of another member in a given channel at a different
level of distribution. For this control to qualify as power, it should be different
from the influenced member’s original level of control over his own marketing
strategy.
2.9.2 The Role of Power in Distribution Channels
Channels of distribution can be viewed as social systems comprising a set of interdependent
organizations, which perform all the activities (functions), utilized to move a product and its
title from production to completion (Stern; 1971: 301-314). Because of this interdependency,
there arises a need for some form of co-operation between channel members and co-
ordination of activities. This co-operation and co-ordination is necessary in order to ensure
predictability and dependability between members which will allow individual organization
to plan effectively.
According to Wilkinson (1973: 119-129), Power or, rather, the use of power by individual
channel members to affect the decision making and/or behaviour of one another (whether
deliberate or not), is the mechanism by which the channel is organized and orderly behaviour
preserved. This is not meant to imply that organizations necessarily set out deliberately to
organize the channel, but that this organization of the channel arises out of individual
organizations adjusting their behaviour to one another in relation to the power they each have
and use. However, in some channels, firms may assume a leadership role and make deliberate
attempts to organize the channel, making use of their power. Power is the means by which
cooperation between individual channel members’ activities are coordinated and the means
by which conflict between firms is controlled. (Wilkinson I.F. 1973: 119-129)

71
Bierstadt (1950: 735) in a general context has aptly summarized the role of power in any
system: ‘’Power supports the fundamental order of society and the social organizations within
it, whenever there is order. Power stands behind every association and sustains its structure.
Without power, there is no order”. The study of power must be, therefore, an important part
of the study of distribution channel behaviour and will have important implications for the
study of physical distribution management. Moreover, the study of power is of increasing
importance today as the need for effective cooperation and coordination of activities between
channel members grows. Two basic, though not necessarily unrelated forces underlie this
trend. First, with the increasing rate of technological change being experienced today and the
constant introduction of new products, the tasks of marketing becomes more complex and as
Alderson (1954: 31) has argued: “The more complex the marketing task becomes the more
necessary it is for a channel to operate as an integrated whole in order to attain efficiency”. In
other words, channels cannot operate as integrated whole without effective cooperation and
coordination between their members.
The second force concerns the changing nature of the environment which channels are facing.
In a general context, Emery and Trist (1969: 241-247) have pointed out that the type of
environment increasingly facing organizations of all kinds is such that no longer can
individual organizations cope effectively by themselves. One aspect of this is the situation of
the organization comprising a distinct channel. The rise of consumerism and the increasing
concern being given to man’s effects on his natural environment create problems with which
individual organizations cannot cope alone. Partly, these problems can be met by better
cooperation and coordination between organizations in distribution channels. However, these
environmental changes also suggest the need for some degree of cooperation and
coordination between whole channels.
2.9.3 Conflict: Definition and Elaboration
Conflict according to Raven and Kruglanski (1970:70) is tension between two or more social
entities (individuals, groups or larger organizations) which arises from incompatibility of
actual or desired responses. The distinction made between actual and desired responses is
suggestive of the common taxonomic practice of separating conflict into two or more
categories of phenomena, usually representing a behavioral and a perceptual/attitudinal

72
dimension. Definition of conflict in a marketing channel setting has been provided by Stern
and El-Ansary (1977: 283).
Channel conflict is a situation in which one channel member perceives
another channel member to be engaged in behavior that is preventing or
impeding him from achieving his goals.
According to Stern and Gorman (1969: 156) and Etgar (1979: 61), Channel conflict is
present:
…when a component (channel member) perceives the behavior of another
component to be impeding the attainment of its goals or the effective
performance of its instrumental behavior patterns.
2.9.4 Origin of Channel Conflict
Channel conflict emerges as the market evolves and business strategies change. According to
Brent Driver & Zach Evans (2004), the primary motivations for supplier firms establishing
multi-channel arrangements are the desire to increase market share and to reduce costs. Firms
are attempting to reconstruct the supply chain and make it more efficient, a process that will
disrupt traditional channels, resulting in conflict both internally among the supplier’s channel
managers and externally with distribution partners. More often than not, objectives among
channels cannot be achieved concurrently. If one channel is succeeding, it is likely at the
expense of another (Hogan, Webb 2002: 5). This is the norm in multi-channel business
strategies. A diverse channel strategy is necessary; however, for survival in the market place,
“Manufacturers have historically been tentative in their approaches to electronic commerce,
primarily out of fear of direct competition with and potential damage to existing sales
channels” (Matta, Menta 2001). The only thing that manufacturers fear more than alienating
resellers is having no e-commerce plan at all. As a result, businesses are forging ahead with
e-commerce strategies regardless of the consequences (Bacheldor, Gilbert 2000).
The desire for power may be the most direct cause of channel conflict. According to Coupey
(2001: 249), a hallmark of power is that it relies heavily on perception. In other words, any
channel member may alter their behaviour to the extent of the power that they perceive the
other party to hold. Negotiations among manufacturers, distributors and retailers are often
about the power struggle. The influences that a manufacturer holds over his channel depend
on how prominent its products are in the channel’s business (Kaneshige, 2001).

73
2.9.5 Best Practices of Minimizing and Managing Channel Conflict.
Channel conflict is often thought of as dysfunctional and therefore, unwarranted. Conflict
can, however, be healthy and desirable in certain situations. Conflict can serve to keep
channel members from becoming too passive or lacking in creativity. This same conflict can
also motivate members to adapt, grow, and seize new opportunities. (Brent Driver & Zach
Evans 2004) From the manufacturer’s perspective, multi-channel distribution strategies can
be beneficial in a number of ways. First, it does allow the manufacturer to gain much needed
insight into end-consumer’s needs and shopping patterns. Second, manufacturers with “broad
product lines can benefit because it is unlikely that a single channel type will be optimal for
all products”. Third, excess manufacturing capacity can be better utilized with additional
outlets when existing channels are over-supplied. Finally, manufacturers with a multi-channel
distribution strategy can focus more on precisely targeting markets and improving their
overall competitiveness. (Webb 2002: 95-102).
Kevin Webb (2002: 95-102), in his paper Managing Channels of Distribution in the Age of
Electronic Commerce, proposes several ways that manufacturers can minimize channel
conflict. Once the decision has been made to sell direct to consumers online, lower levels of
channel conflict will be experienced:
1. By not pricing products on their web site below the resale price of their partners.
2. By diverting fulfillment of orders placed on their web site to their partners.
3. By promoting partners on their web site.
4. By encouraging partners to advertise on their web site
5. By limiting the offering on their web site to a subset of their products.
6. By using a unique brand name for products offered on their web site
7. The earlier the products offered on their web site are in the demand lifecycle.
8. The more effectively they coordinate their overall distribution strategy.
9. The more effectively they communicate their overall distribution strategy.
10. The more they make use of super ordinate (over-reaching) goals.
These methods of minimizing channel conflict are, at best, idealistic and, at worst, impossible
to implement given the pressure that companies are under to create e-business strategies that
have positive return on investment. The fact cannot be denied, however, that these
propositions would have the desired effect of minimizing channel conflict between
manufacturers and their partners. The shrewd manufacturer will make use of the propositions

74
that make the most sense for their given business situation (Brent Driver & Zach Evans
2004).
2.10 Selected manufacturing companies in Nigeria
In this section, we shall attempt a brief historical background of some Nigeria manufacturing
companies that were selected for this study.
2.10.1 Nigerian Brewery PLC
Nigerian Breweries PLC was incorporated in 1946 and recorded a landmark when the first
bottle of STAR lager beer rolled of the bottling lines in its Lagos Brewery in June, 1949. This
was followed by Aba Brewery which was commissioned in 1957, Kaduna Brewery in 1963
and Ibadan Brewery in 1982. In September, 1993, the company acquired its fifth brewery in
Enugu while in October 2003, a sixth brewery, sited at Ama in Enugu state was
commissioned. Ama Brewery is the biggest brewery in Nigeria and the most modern in the
world. Operations in Enugu brewery was discontinued in 2004. Thus from its humble
beginning in 1946, the company now has five operational breweries from which its products
are distributed to all parts of this great country, Nigeria. Some of these products include:
Heineken, Star, Amstel malt, Legend, Maltina, Fayrouz, Gulder and Clima. Retrieved (2011)
from http://www.nbplc.com/our-company.html
2.10.2 Guinness Nigeria
Guinness Nigeria is a subsidiary of Diageo Plc of the United Kingdom. It was incorporated in
1962 with the building of a brewery in Ikeja, the heart of Lagos. The brewery was the first
outside of Ireland and Great Britain. Other breweries have been opened overtime – Benin
City Brewery in 1974 and Ogba brewery in 1982. Guiness Nigeria produces the following
brands – Foreign Extra Stout (1962), Guiness Extra Smooth (2005), Malta Guinness (1990),
Harp Lager Beer (1974), Gordon’s Spark (2001), Smirnoff Ice (2006), Satzenbrau (2006).
(Retrieved (2011) from http://www.unilevernigeria.com/about)
2.10.3 Unilever Nigeria PLC
Unilever Nigeria Plc, was incorporated as Lever Brothers (West Africa) Ltd on 11th April,
1923 by Lord Leverhulme, but the company’s antecedents have to be traced back to his
existing trading interests in Nigeria and West Africa generally, and to the fact that he had
since the 19th century been greatly involved with the soap business in Britain. Unilever

75
Nigeria Plc started as a soap manufacturing company, and is today one of the oldest surviving
manufacturing organizations in Nigeria. After series of mergers/acquisitions, the company
diversified into manufacturing and marketing of foods, non-soapy detergents and personal
care products. These mergers/acquisitions brought in Lipton Nigeria Ltd in 1985 and
Cheesebrough Ponds Industries Ltd in 1988. The company changed its name to Unilever
Nigeria Plc in 2001. Unilever Nigeria Plc is a public liability company quoted on the Nigeria
Stock Exchange since 1973 with Nigerians currently having 49% of equity holdings.
(Retrieved (2011) from http://www.unilevernigeria.com/about)
2.10.4 PZ Cussons Nigeria PLC
PZ Cussons was founded in 1879 as a trading post in Sierra Leon by George Paterson and
George Zochonis as Paterson Zochonis. The British-owned company expanded its operation
into nearby Nigeria before the end of the 19th century. The first branch in Nigeria was opened
at Lagos in 1899. In 1903 a branch was established at Calabar and by 1912 the Nigerian
branch included Ibadan, Oshogbo, Ilorin and Kano. In 2002 Paterson Zochonis Plc was
renamed PZ Cussons Plc. At present, the company operates 26 depots spread across major
cities and towns of the federation and factories in Ikorodu, Ilupeju and Aba. Retrieved (2011)
from http://en.wikipedia.org/wiki/pz-cussons

76
REFERENCES
Achison C.B (2002), Strategic Marketing Management. Enugu: Precision Publishers Limited.
Agatz N. A. H, Fleischmann M and Van Nunen J.A., (2008) “E-Fulfillment and Multi-
channel Distribution.” A Review, European Journal of Operational Research 339-
356.
Alderson W. (1957) Marketing Behaviour and Executive Action. A functional Approach to
Marketing Theory, Irwin. Homewood.
Alderson W. (1954), Factors Governing the Development of Distribution Channels in
Clewett R.M. (ED) Marketing Channels For Manufactured Products, Irwin,
Homewood, 11: p.31.
Anderson R.E (1973) “Consumer Satisfaction: The Effect of Disconfirmed Expectancy on
Perceived Product Performance” Journal of Marketing Research 10 (February) 38 - 44
Amarchard, D and Varad, H.B (1979) An Introduction to Marketing, New Delhi, Vikas
Publishing House Limited.
Bacheldor, Beth and Gilbert, Alorie (2000), “The Big Squeeze.” information Week.
Retrieved 5th September, 2011, from
http://www.informationweek.com/779/prchannel.htm.
Beckman, J.N., Maynad, H.H and Davidson, W.R (1957) Principle of Marketing, New York,
The Ronald Press Company.
Bello, D.C., Lohtia R., and Sangtani V. (2004), An International Analysis of Supply Chain
Innovations in Global Marketing Channels, Industrial Marketing Management, vol
33, n 1, 57-64.
Bergen M., Levy D., Ray S., Rubin P.H and, Zeliger B.,(2008), “When Little Things Mean a
lot On the Inefficiency of Laws,” The Journal of Law and Economics, vol. 51, n 2,
209-250

77
Berman, B. (1996), Marketing Channels. Chichester John Willy & Sons, p. 663.
Berman, B. Thelen, S. (2004), “A guide to developing and Managing a Well integrated multi-
channel retail strategy”. International Journal of Retail & Distribution Management.
V 32, N 3, 147-157.
Bierstedt, R. (1950), “An Analysis of Social Power”. American Sociological Review: Vol. 15
No 6, 735.
Buel V.P., (1970), Handbook of Modern Marketing, New York: McGraw-Hill.
Bray, J.P. and Berger D., (2008), “Retail Innovation – The Never-Ending Road to Success? A
critical Analysis of Pitfalls and opportunities,” European Institute of Retailing and
Services Studies Annual Conference 14-17.
Brent Driver & Zach Evans (2004) Retrieved (2011) from http://www.mbafiles.com/wp-
content/uploads?
Brown S., (1988), “The Wheel of Retailing”. International Journal of Retailing, vol. 3, n 1,
16-37.
Brown J. and Frazier G., (1978) “The Application of Channel Power: Its effects and
Connotations in Research Frontiers in Marketing Dialogues and Directions,”
Subhash C. Jain ed Chicago American Marketing 266-270.
Brynjolfsson E. and Smith M., (2000). Frictionless Commerce? Comparison of Internet and
Conventional Retailers. Management Science, n, 46, 563-585.
Bucklin, L.P (1966), A Theory of distribution Channel Structure University of California,
Institute of Business and Economic research, Berkeley.
Bucklin, L.P. (1965), “Postponement, Speculation and Structure of Distribution Channels”
Journal of Marketing Research, 2.

78
Cartwright, Dorwin (1965), Influence, Leadership, Control in Handbook of Organizations,
James G. March ed. Chicago Rand McNally, 1-47.
Castaldo S. (2001) Retailing and Innovation. Egea, Milano. Chou Y., Lee C.W., Chung J.
(2004). “Understanding M-Commerce Payment Systems through the Analytic
Hierarchy Process,” Journal of Business Research, n. 57, 1423-143
Christopher, M, (1997) “Logistics and the National Economy,” International Journal of
Physical Distribution & Materials Management, vol. 11 No 4.
Consoli, M.A, and Neves, M.F. (2008) “A method for building new marketing channels. The
case of “door-to-door” in diary products direct marketing:” An International Journal
vol. 2
Consoli, M.A (2005). Retrieved Sept., 2011 from http://www.pensaconference.org/ul-
pensa-conference.
Coughlan, A.T. et al (2002), Canais de Marketing and Distribution, 6th ed; Bookman, Porto
Alegre, p. 461.
Coughlan, A.T: Anderson, E, Stern, I.W and El-Ansary, Adel, (2005) Marketing Channels,
7ed Prentice Hall, 500p.
Coupey, Eloise (2001). Marketing and the Internet: Conceptual Foundations, Prentice Hall,
249.
Courty, P., Pagliero M., (2008), “Responsive Pricing, Economic Theory,” vol. 34, n 2, 235-
259. Dahl, Robert A. (1957) “The Concept of Power” Behavioral Science, 2 July.
235-259.
Dahlberg T., Mallat N., Ondrus J. and Zinijewska A., (2008) “Past, Present and Future of
Mobile Payments Research:” A literature Review, Electronic Commerce Research
and Applications, vol 7,n2, 165-181.

79
Dawson J.A. (1979). The Marketing Environment, Croon Helm, London.
Dawson J.A (2001) “is there a New Commerce in Europe?” The International Review of
Retail, Distribution and Consumer Research vol. 11, n3 287-299.
Dhar S.K., Hoch S.J. and kumar N., (2001), “Effective Category Management Depends on
the Role of Category.” Journal of Retailing, vol. 77, 165-184.
Dixon, D.F (1964). “Functionalism as an Approach to Marketing Theory.” Economics and
Business Bulletin. 28-34
. Dupuis M. (2000). “Retail Innovation: Towards a Framework of Analysis,” International
EAERCO Conference on Retail Innovation, ESADE, Barcelona, July, 13-14.
Dupuis M., Tissier-Desbordes E., (1996). “Trade Marketing and Retail: A European
Approach,” Journal of Retailing and Consumer Services, vol. 3 n 1, 43-51.
Dwyer, F. Robert (1980), “Channel Member Satisfaction: Laboratory Insights” Journal of
Retailing. 56 (summer) 45-65.
Edward W. Smykay, Donald J. Bowersox and Frank i. Mossman (1961) Physical
Distribution Management., New York. Macmillan Company CH ,V.
Ehikwe, A.E. (2002) Transportation and Distribution Management. Enugu, Nigeria:
Precision Publishers Limited.
El-Ansary and Louis W. Stern (1972) “Power Measurement in the Distribution Channel.”
Journal of Marketing Research, 9(February), 47-52.
Emerson, R.W., (2009) “Franchise Contracts and Territoriality: A French Comparison.” The
Ohio State University Entrepreneurial Business Law Journal, n 315.
Emerson, Richard M. (1962) “Power Dependence Relations” American Sociological Review,
27 (February), 31-41.
80
Emery, F.E and Trist, E., (1969) The Causal texture of organizational Environments in
Emery F.E. (ed). Systems Thinking Penguin. Harmondsworth 241-257.
Eztel, M.J., Walker, B.J., and Stanton, W.J. (2001). Marketing (12th ed) Boston: McGraw
Hill, Irwin.
Forman C, Ghose A. and Goldfarb A. (2009) “Competition Between Local and Electronic
Markets. How the Benefit of Buying Online Depends on Where You live,”
Management Science, n55, January, 47-57.
Ganesan, S. George M., Jap S., Palmotier R., and Weitz B., (2009). “Supply Chain
Management and Retailer Performance: Emergen Trends, issues and implications for
Research and Practice,” Journal of Retailing, vol. 85, n 1, 84-94.
Ghose, A., Smith M., and Telang R. (2006). “Internet Exchanges for used books: An
Empirical Analysis of Product Cannibalization and Welfare Implications,” Inform
System Resources vol. 17 n 1,
Gillis W.E., andCombs J.G., (2009). “Franchisor Strategy and Firm Performance: Making the
Most of Strategic Resources Investment,” Business Horizons, vol. 52, n 6, Nov-Dec,
553-561.
Gonzalez – Padron T., Hult G.T.M., and Calatone R., (2008) “Exploiting Innovative
Opportunities in Global Purchasing. An Assessment of Ethical Climate and
Relationship Performance”. Industrial Marketing Management, vol. 37, 69-82.
Gordon K.T. (2004) “Give It a Go: A “Hands-on” Approach to Marketing Your Product
Could Be Just the Thing to Win Customers.” Entrepreneur Magazine, vol. 32, n 9,
74-75.
Grayson, D., and Dodd T., (2007). “Small is Sustainable (and Beautiful). Encouraging
European Smaller Enterprises to be sustainable,” occasional Paper, The Doughty
Centre for Corporate Responsibility, Cranfield School of Management.

81
Gulati R., Garino, J., (2000) “Get the right mix of bricks and clicks,” Harvard Business
Review, 78(3), 107-114.
Gundlach G.T., Bolumde Y.A., Eltantawy R.A., and Frankel R., (2006). “The Changing
Landscape of Supply Chain Management, Marketing Channels of Distribution,
Logistics and Purchasing,” Journal of Business 7 Industrial Marketing, vol. 21, n 7,
428-438.
Hamid R.I., Kamran S. and Gholamrezu J. (2011). Iranian Journal of Management Studies
(IJMS) vol. 4, No 1, 25-42.
Hardgrave B.C., Miles R.B. and Mitchell Y., (2009) “Item-level RFID for Apparel: The
Bloomingdale’s RFID Initiative,” Working Paper n. Information Technology
Research Institute, University of Arkansas.
Hogan, John E and Webb, Kevin L., (2002)” Hybrid Channel Conflict Causes and Effects on
Channel Performance.” The Journal of Business 7 Industrial Marketing. Santa
Barbara vol. 17(5).
Hollander, Stanley C. (1964). “Who Does the work of Retailing” Journal of Marketing, 28
(July) 18-22.
Hunt, H. Keith, (1977) “Consumer Satisfaction/Dissatisfaction: Overview and Research
Direction” in conceptualization and Measurement of Consumer Satisfaction and
Dissatisfaction, Ed. H. Keith Hunt Cambridge, MA Marketing Science Institute, 455 –
488.
Hum S.H. and Sim H.H (1996) “Time Based Competition.” Literature Review and
Implications for Modeling, International Journal of Operations & Production
Management, vol. 16, n 1, 75-90.
Iacobucci, D., (2001) in: “A comparative Analysis of The Main Food Distribution Structure
in Brazil.” Retrieved September 2011 from http://www.pensa.conference.org/nl-
pensa-conference.
IBS Centre for Management Research (ICMR) in Evaluating Channel Performance,
Retrieved 2011 from http://www.icmrindia.org/

82
Jain, S.C., (2000) Marketing Planning & Strategy 6th ed. Cincinnati: Thomson Learning,
925p
Gaski J.F., “The Theory of Power and Conflict in Channels of Distribution.” Retrieved Oct.
(2011) http://bear.warrington.ufi.edu/weitz/.
Johnston M.W., Ferrell O.C. and Darmon R., (2007) “Introduction; “Special Issue on Sales
Force Ethics – Strategic Implications and Leadership Challenges,” Journal of
Personal Selling and sales Management, vol. 27, n 4, fall, 289-290.
Kaipa R and Tanskanen k., “Vendor Managed Category Management – an outsourcing
Solution in retailing,” Journal of Purchasing and Supply Management, vol 9, n 4,
July 165-175.
Kaneshige, Tom (2001), “Avoiding Channel Conflict”, line 56. Retrieved August, 2011
www.line56.com.
Kaufman – Scarborough C and Forsythe S., (2009) “Current Issues in Retailing:
Relationships and Emerging Opportunities,” Journal of Business Research, n 62,
517-520.
Kim D., Cavusgil S.T. and Calantone R.J., (2006) “Information System Innovations and
Supply Chain Management: Channel Relationships and Firm Performance.” Journal
of the Academy of Marketing Science, vol. 34, n 1, 40-54.
Kotler, P., & Armstrong G., (2006) Principles of Marketing.,New Delhi: Prentice Hall of
India.
Kotler, P. & Keller K. (2006) Marketing Management, New Delhi: Prentice Hall of India.
Kotzab, H., (1999) “Improving Supply Chain Performance by Efficient Consumer Response?
A Critical Comparison of Existing ECR Approaches,” Journal of Business &
Industrial Marketing, vol. 14,n 5/6, 364-377.

83
Kumar N, and Steenkamp J.B., (2007) “Private Label Strategy. How to meet the Store Brand
Challenges.” Boston: Harvard Business School Press.
Lambert, D.M. and Stock J.R (1992) Strategic Logistics Management, Boston: Irwin
McGraw Hill.
Lambin J.J. (2000) Marketing Strategy 4th ed, Lisboa: McGraw Hill, 756p.
MacDonald, Laura (1999) “Managing Channel Conflicts”, Mortgage. Banking. Vol. 60.
Mallen, Bruce (1973), “Functional Spin-off: A key to Anticipating change in Distribution
Structure “Journal of Marketing”. 37 (July) 18-25.
Mallen, B.(1996) “Selecting Channels of Distribution & Logistics Management.” V 26, 5-21
Mauri, C., (2003) Card Loyalty. “A New Emerging Issue in Grocery Retailing,” Journal of
Retailing and Consumer Services vol. 10, n1, 13-25.
Martinez, J.J. and Polo-Redondo Y., (2001) “Key Variables in the EDI Adoption by Retail
Firms,” Technovation, n 21, 385-394.
Malta, Eskander and Mehta, Neel (2004) “Turning Channel Conflict into Channel
Cooperation.” CCG.XM. February 2001. Accessed August, 12, 2011.
McCammon B.C. Jr., (1970) “Perspective for Distribution Programming,” L.P. Bucklin (ed).
Vertical Marketing Systems, Scott, Foresman & Co., Glenview.
Mcvey Philip (1960). “Are Channels of Distribution What the Textbooks Say:” Journal of
Marketing vol. 24.
Morash, Edward A. (1986) “Customer Service, Channel Separation and Transportation
Intermediaries” Journal of Business Logistics, (Oct), 89-107.

84
Musso, F. (2010) “Emerging issues in Management,” n.1, Accessed 2011
http://webdepot.gsi.unimib.it/symphonya/Repec/.
Nebo, O.G., (2011) Marketing Channels & Physical Distribution Management. Owerri:
Nation wide Printing & Publishing Co. Ltd. 42-45.
Neves, M.F., Zuurbier, P., & Camponcar, M.C. (2001). “A Model for the distribution
channels planning process,” Journal of Business & Industrial Marketing, 16(7), 518-
539.
Niehm, L.S., Fiore A.M., Jeong M. and Kim H.J., (2007) “Pop-up Retails Acceptability as an
Innovation Business Strategy and Enhancer of the Consumer Shopping Experience”,
Journal of Shopping Centre Research, vol. 13, n 2.
Norris S., (1994). “Flash points,” Marketing Week, 1 JULY. 47-48.
Okeafor, U.S. (1998), Physical Distribution and Transportation Management: Port court:
Obchikel Publisher.
Oliver, Richard and John E, Swan (1989) “Equity and Disconfirmation Perceptions on
Markets and
Products Satisfaction” Journal of Consumer Research 16 (December) 372 - 383
Ondrus J. and Pigneur Y., (2006). “Towards a Holistic Analysis of Mobile Payments: A
Multiple Perspectives Approach,” Electronic Commerce Research and Applications, n
5, 246-257.
Onyeke, J.K. and Nebo, G.N. (2000). Principles of Modern Marketing. Enugu: Precious &
Queen
(Nig) Ltd.
Pelton, L.E, Strutton, D. and Lumpkin, J.R (1997) Marketing Channels: A Relationship
Management
Approach. Boston: McGraw-Hill, 728.
Pine, B.J., Peppers D. and Rogers M., (1995). “Do You Want To Keep Your Customers
Forever?” Harvard Business Review, March –April.

85
Porter, M.E (1985) Competitive Advantage: Creating and Sustaining Superior Performance,
New
York: The tree Press.
Rangan, V.K., Zoltners, A.A & Becker, R.J (1986)”The Channel Intermediary Selection
Decision:” A Model and an Application Marketing Science, September. 1114-1122.
Raven, Bertram & Kruglanski, W. (1970) Conflict and Power in The Structure of Conflict,
Paul Swingle and New York Academic Press 69-109.
Raymond Corey (1991) Industrial Marketing: Case and Concepts, 4th ed. (Upper Saddle
River, N.J: Prentice Hall, ch. 5.
Rix, P. (2005) Marketing (a practical Approach) (5th ed.) Australia McGraw – Hill.
Robicheaux, Roberts A and Adel El-Ansary (1975) “A General Model for Understanding
Channel Member Behaviour” Journal of Retailing 52 Winter) 13 – 30.
Rosen bloom, B. (2004) Marketing Channels: a Management View, 7th ed. South – Western
of
Thomson.
Rosen bloom, B. (2007) “Multi-Channel Strategy in Business – to – Business Markets:
Prospects and Problems,” Industrial Marketing Management, n 36, 4-7.
Rosen bloom, B. and Larsen, T. (20O8) “Wholesalers as Global Marketer,” Journal of
Marketing Channels, vol. 15, n 1, 235 – 252. Rowland, T. M. and Ursula, M (1990)
“Managing Hybrid Marketing Systems” Harvard Business Review, Nov., 1990.
Rowland, T. M. and Ursula, M (1990) “Managing Hybrid Marketing Systems” Harvard
Business Review, Nov., 1990.

86
Rowley J. and Slack F., (2003) “Kiosks in Retailing: the Quiet Revolution,” Communication
and Computing Research Centre Papers. Sheffield Hallam University. Accessed Sept., 2011
http://digitalcommons.shu.acuk/arc.
Shanahan L., (2005) “Bulbs (only) and Other Bring Ideals,” Brandweek, May 9, 2005.
Simon, Herbert (1953), “Notes on the observation and Measurement of Political Power
“Journal of Politics, 15 (November). 500-516.
Stapleton, J. and Thomas, M. (1998) “How to Prepare Marketing Plan.” A Guide to Reaching
the Consumer Market. (Fifth Edition).
Stern, L., El-Ansary, A.I and Coughlan, A.T (1996) Marketing Channels, 5th ed., Prentice
Hall, Eaglewood Cliffs, NJ.
Stern L.W. and Adel, I. El-Ansary (1977), Marketing Channels, Eaglewood Cliffs, NJ
Prentice Hall.
Stern, L.W and Ronald H. Gorman (1969) Conflict in Distribution Channels. An Exploration
In Distribution Channels Behavioral Dimension. Boston Houghton Mifflin. 156 –
175.
Szulanski G. and Jensen R.J., (2008) “Growing Through Copying: The Negative
Consequences of Innovation on Franchise Network Growth,” Research Policy, vol.
37, n. 10, December, 2008. 1732- 1741.
Tate, Jr. C.E., Magginson, L.C., Scott, Jr. C.R and Trueblood, L.R. (1982). “Successful
Business Management,” Third Edition, Texas Business Publications Ltd. Trend
Watching. Being Space $ Brand Spaces, Retrieved, September, 2011.
www.trendwatching.com/trends/brand-spaces.htm.
Thierry, Henk and Agnes M.Koopman-Iwema (1984) “Motivation and Satisfactio” In
Handbook of works and organization Psychology volume 1Eds P.J.D Drenth, Henk
Thierry, P.J. Williams New York 131 – 174.

87
Tsay A.A., and Agrawal N., (2004) “Modeling Conflict and Coordination in Multi-Channel
Distribution Systems:” A Review, D. Simchi-Levi et al. (edu), Modeling in the E-
Business
Era, Kluwer, Boston, 557- 606.
Tse, David k and Peter C. Wilton (1988) “Models of Consumer Satisfaction Formation: An
Extension” Journal Marketing Research 25(May) 204 – 212.
Tuckman, Bruce W. (1978). Conducting Educational Research 2nd (ed.) HARCOURT Bruce,
Jovanovich, New York. 37.
R.I. Van Hock, “The rediscovery of Postponement: a literature reverend directions for
research:” Journal of Operations Management (2001) 161-184 accessed Sept., 2011,
http://www.latec.uff.br/mestrado.
Waller M, Johnson M.E. and Davis T. (1999) “Vendor-Managed Inventory in the Retail
Supply Chain,” Journal of Business Logistics, vol 20,n.1.
Wang Y, Bell D.R. and Padmanabhan V. (2009) “Manufacturer-Owned Retail Stores,”
Marketing Letters, vol. 20, n. 2, June, 2009, 107
Webb K.L., (2002) Managing Channels of Distribution in the Age of Electronic Commerce.
Industrial Marketing Management, vol. 31n 2, 95-102.
Westbrook, Robert A. and Michael D. Reilly (1983) “Value Percept Disparity: An
Alternative to the Disconfirmation of Expectation Theory of Consumer Satisfaction”
256 - 261
Wilemon, David. (1972) “Power and Negotiation Strategies in Marketing Channels.” The
Southern
Journal of Business 7 (February). 12-32.
Wilkinson, I.F., (1974) “Researching the Distribution Channels for Consumer and Industrial
Goods. The Power Dimension “Journal of the Market Research Society. 16, n 10, 12-
32.

88
Zbaracki M., Ritson M, Levy D., Dutta S. and Bergen M., (2004)” Managerial and Customer
Costs of Price adjustment:” Review of Economics and statistics, vol. 86, n.2, May,
2004, 514-533.
\

89
CHAPTER THREE
RESEARCH METHODOLOGY
3.1 Introduction
This chapter focuses on the approach and methods adopted in obtaining data for the study. It
describes the methodology employed, tools and processes adopted in generation,
presentation and interpretation of data gathered. Other aspects incorporated in the design
include the population of study, the determination of sample size, the methods for
questionnaire distribution, the methods for data analysis and the description of operational
variables.
3.2 Research Design
Research design according to Abdellah and Levine (1979: 166) deals with how the subject
will be brought into the scope of the research and how they will be employed within the
research setting to yield the required data. It is an outline or a scheme that serves as a useful
guide to researcher in his efforts to generate data for his study. (Asika: 2000).
This study is based on a descriptive research design aimed at solving the problems of
distribution channels, towards profit leveraging in selected manufacturing companies in
Nigeria. The collection of data from the Marketing, Distribution and Finance departments of
the manufacturing firms by use of questionnaire and interviews was aided by the design that
also contributed to elimination of doubts and biases.
The questionnaire is segmented into three sections – A, B and C. Section A deals with profile
of the respondent while Section B focused on the company’s profile. Section C of the
questionnaire consist of a 5-point Likert summated rating scale of about 20 questions which
dwelt comprehensively on the subject matter of the study. .
3.3 Sources of Data Collection
Data for the study were obtained from primary sources. However, it should be noted that
the review of related literature which include other research works, the publications in
journals, textbooks, monographs, unpublished thesis from institutions of higher learning
and work places including libraries and distribution centers, official releases in bulletins
and manuals and the internet provided the guideline in stating the hypotheses and also aided

90
the construction and design of the questionnaire and oral interviews. The questionnaire,
personal interview and observations served as primary sources of data collection.
3.4 Area of the Study
The study was concentrated on two states of the federation namely, Abia and Lagos states.
This is so because even though the companies selected for this study have their operations
in the 36 states of the federation, their centres of activities and headquarters are located in
these two states chosen for the study. Hence, the study covers PZ Cussons Nigeria PLC,
Lagos, UNILEVER Nigeria PLC, Lagos, Nigeria Breweries PLC, Aba and Guiness Nigera
PLC, Aba.
3.5 Population of Study
The population of study is the aggregation of the elements from which the sample is drawn,
(Anyanwu, 2000: 113, Ikeagwu 1998: 172, Bailey 1982: 85, Kothari 2008: 153) and for this
study, it is the finite number of managers in the Marketing, Distribution and Finance
Departments of the firms selected for the study as follows:
PZ CUSSONS NIG. PLC = 82 Managers
NIGERIA BREWERIES PLC = 66 “
UNILEVER NIG. PLC = 59 “
GUINNESS NIG. PLC = 51 “
TOTAL = 258 Managers.
3.6 Sample Size Determination and Selection Method.
The sample size determination and selection methods adopted in this study were the
judgmental, simple random and stratified sampling, (Kothari, 2008: 153). The
judgmental sampling process was used to select the firms that form the bases of this
study, whereas, the simple random sampling was applied in selecting the managers
who are the respondents. The stratified sampling method was used to select the
population sample from the different firms used for the study.
The sample size was determined based on the total population formula (Yamane
1979:57) at 5 percent level of significance while stratified sample was used for
selection of the sub group’s population (Moser 1968: 78). According to Ugwuonah

91
(2005: 15), in stratified sampling, homogenous groups or sets are first developed
within the population, and then a simple random sample is taken within the stratum to
ensure complete coverage of all types of subjects in the entire population.
Finite population sample size formula:
N = N .
1 + N(e)
Where; n = sample size
N = total population
1 = constant
e = error margin
Stratified sample formula:
n1 = n(N1)
N
Where; n1 = sample size of strata 1.
n = sample size of N1
N1 = population of strata 1
N = total population.
Substituting as in equation 1:
n = N .
1 + N(e)2
The level of significance is 5% (0.05) and confidence limit is 95%.
Thus, a total of 156 questionnaires were distributed to the firms as specified above. It should
be noted that only managers in the departments of Marketing, Distribution and Finance that
have direct dealings with matters on Distribution channels were involved.
3.7 Data Collection Instruments
A comprehensive questionnaire was designed by the researcher. The questions were
structured using the 5-point Likert scale format as: (a) strongly agree; (b) agree; (c)
indifferent; (d) disagree; and (e) strongly disagree. There were also open ended questions

92
made as simple as ideal and necessary for the respondents’ practical demonstration of the
actual field practice and experience in distribution channel matters. The oral interview was
based on simple structured questions on the subject matter of distribution intensity,
manufacturer’s support programs and co-ordination efforts, Transportation, warehousing and
other activities that yielded the needed results.
The need for oral interview is based on the argument put forward by Moser and Koltong
(1971) on the limitations of questionnaire thus: wrong respondents may answer the questions,
the answers are accepted as final as there are no opportunities to prove beyond the given
answers, it can be used only when the questions are simple and straightforward enough to
comprehend with the help of pointed instructions. In the light of the above, personal
interview as a method of data collection was also employed.
3.8 Validity of Instrument
A sample of prepared questionnaire was given to a section of MSC Marketing students of the
University of Nigeria, Enugu campus. 20 questionnaires in all were administered to them at
the post graduate lecture hall where they were holding lectures. Based on this, the face and
content validity of the instrument with respect to clarity, ambiguity, triviality and sensibility
constructions were established.
3.9 Reliability of Instrument.
The researcher adopted the test-retest method to determine the reliability of the research
instrument for this study. By this, the researcher administered the pre-tested questionnaire to
MBA students of the University of Nigeria, Enugu campus at their hostel. Thereafter, the
Cronbach’s alpha was used to determine the strength of reliability and an Alpha of 0.96
obtained confirmed reliability of the instrument.
3.10 Operational Measures of the Variables.
Operational definition is a description of the concept in terms of how it is to be measured.
The key operational variables are the dependent and the independent variables. In this study,
length of a channel, hybrid channel conflict and control exerted by firm on the channel
formed the independent variables. The dependent or criterion variables are channel
performance, satisfaction with existing channel and control exerted by the firm, which will be
used to measure the effect of the independent variables. Interviews include the questions and

93
responses asked and received respectively between the researcher and staff of the
manufacturing firms who could not be served with the questionnaire (Malhotra, 1999: 217).
3.11 Data Analysis Techniques
The data collected were analyzed and presented by use of tables, percentages, test statistics
and explanatory notes. In testing the hypotheses, the quantitative data obtained through
questionnaire were analyzed using multiple linear regression, the t-test and z-test as the case
may be. Z –test was used to test the significance of the hypotheses at one percent level of
significance in comparing the mean of the sample to the hypothesized mean for the
population. This is based on the fact that our sample size is large (i.e. greater than 30).
The computer statistical package for social science (SPSS) software was used for the purpose
of analyzing the data generated for this study based on 95 percent level of confidence.

94
REFERENCES
Abdellah, F.C and Levine, E(1979), Better Patience Care Through Nursing Research, New York: Macmillan Publishing Company.
Anyamwu, A. (2000) Research Methodology in Business and Social Sciences, Owerri:
Cannun Publishers Nig. Ltd. Asika, N (2001) Research Methodology in Behavioral Sciences, Longman Nigeria Plc.
Bailey, K.D (1982) Methods of Social Research, London: Collier Macmillan Ltd. Baridam, D.M (2001) Research Methods in Administrative Sciences, Port court Shebrooke,
3rd ed. Bordens, S.K and Abbott, B.B. (2002). Research Design and Methods; A Process Approach,
(5th ed.), New York; McGraw-Hill Books. Green, P.E, Tull, D.S and Album, G.(1988) Research For Marketing Decisions, (5th ed.),
Englewood Cliffs, Prentice Hall. Ikeagwu, E.k (1998) Ground work of Research Methods and Procedures, Enugu Institute of
Developmental Studies. Kothari, G.R. (2008) Research Methodology: Methods and Techniques, (Revised Second
edition), New Delhi: New Age International Limited Publishers. Malhotra, N.K. (1999) Marketing Research. An applied Orientation, Upper Saddle River,
N.J. Prentice Hall. Moser, C.A. (1968) Survey Methods in Social Investigation, London: Heinemann Educational
Books Limited. Moser, C.A and Koltong (1971), Survey Method in Social Investigation. Heineman, London,
2nd edition, 185-186. Ugwuonah, G.E. (2005), Data Analysis and Interpretations: A Computer Based Approach,
Enugu, Cheston Limited, Uwani, Enugu. Yamane, T. (1964) An Introductory Analysis, (3rd edition), New York: Harper & Publisher.

95
CHAPTER FOUR
DATA PRESENTATION AND ANALYSIS
This chapter focused on the presentation, analysis and interpretation of data generated
through questionnaire.
4.1 Data Presentation
Data collected in the course of this study via the questionnaire research instrument is
presented and discussed descriptively using frequency and percentage tables, charts, mean
and standard deviation below.
4.1.1 Return Rate of Questionnaire
A total of one hundred and fifty six (156) questionnaires were distributed to managers in the
Marketing, Distribution and finance department of the four firms selected for the study. Out
of the one hundred and fifty six questionnaires administered, only one hundred and forty
questionnaires were received and found useful for this study. This gave a response rate of
89.7 percent.
Table 4.1: Return Rate of Questionnaire
Firm Questionnaire
Administered (%)
Correctly Filled
and Returned (%)
Wrongly Filled or
Not Returned (%)
PZ Cussons Nig Plc 49 (100.0) 42 (85.7) 7 (14.3)
Unilever Nig. Plc 36 (100.0) 31 (86.1) 5 (3.9)
Nigeria Breweries Plc 40 (100.0) 37 (92.5) 3 (7.5)
Guinness Nigeria Plc 31 (100.0) 30 (96.8) 1 (3.2)
Total 156 (100.0) 140 (89.7) 16 (10.3)
Source: Field Survey, 2013
4.1.2 Demographic Characteristics of Respondents
The demographic characteristics of the respondents are presented in table 4.2 to 4.6 below.
Table 4.2 Distribution of Respondents by sex
Firm Male Female Total
PZ Cussons Nig. PLC 32 10 42
Unilever Nig. PLC 12 19 31
Nigeria Breweries PLC 28 9 37
Guinness Nig. PLC 23 7 30
95 (67.9%) 45 (32.1%) 140
Source: Field Survey, 2013,

96
Table 4.2: above reveals that 95 (67.9%) of the sampled respondents are males while 45
(32.1%) of the sampled respondents are females.
Table 4.3 Distribution of respondents by age
Age Bracket Frequency Percentage
20 – 29 17 12.1%
30 – 39 55 39.3%
40 – 49 40 28.6%
50 – 59 28 20.0%
Total 140 100%
Source: Field Survey, 2013
Table 4.3 shows that 17 respondents (12.1%) are aged 20 to 29 years, 55 respondents (39.3%)
are aged 30 to 39 years, 40 respondents (28.6%) are aged 40 to 49 years and 28 respondents
(20%) are aged 50 to 59 years
Table 4.4 Distribution of Respondents by Status in Organisation
Status No Percentage
Marketing Manager 30 21.4
Customer Service Manager 20 14.3
Financial Manager 15 10.7
Distribution Manager 35 25
Sales Manager 40 28.6
Total 140 100%
Source: Field Survey 2013
As displayed in table 4.4, 40 (28.6%) respondents are sales managers, 35 (25%) respondents
are distribution managers, 15 (10.7%) respondents are financial managers, 20 (14.3%)
respondents are customer service managers while 30 (21.4%) are marketing managers.
Table 4.5: Distribution of Respondents by Length of Service
Length of Service No of Managers Percentage
1 – 4 years 28 20
5 – 8 years 61 43.6
9 – 12 years 36 25.7
13 & above years 15 10.7
140 100%
Source: Field Survey 2013

97
Table 4.5 shows that the length of service for 28 (20%) respondents is 1 to 4 years, 5 to 8
years for 61 (43.6%) respondents, 9 to 12 years for 36 (25.7%) respondents and 13 years and
above for 15 (10.7%) respondents.
4.1.3 Companies’ Distribution and Support Services
Responses of the respondents about the distribution and support services of their companies
are presented in table 4.2 to 4.5 below.
Table 4.6: Level of Distribution Channels used by Company (n = 140)
Frequency Per cent (%)
Zero – level 107 76.5
One – level 140 100
Two – levels 140 100
Three – levels 120 85.7
Source: Field Survey, 2013
As presented in table 4.6 above, 107 (76.5%) respondents indicated that their companies used
zero-level distribution channel, 120 respondents (85.7%) indicated that their companies used
three-levels while 140 (100%) respondents agreed that their companies used one – level and
two – levels channels.
Table 4.7: Nature of Product Delivery to Customers (n = 140)
Nature Responses Percentages
Direct delivery to key account distributors 140 100
Delivery through depots located near the market 140 100
Delivery through a third party arrangement 65 46.4
Source: Field survey, 2013
As presented in table 4.7, all (100%) the sampled respondents noted that their companies
delivers product directly to key account distributors and through depots located near the
market while 65 (46.4%) respondents said their companies deliver through a third party
arrangement.

98
Table 4.8: Support services rendered by companies to their channel members (n = 140)
Support Services Responses Percentages
Helping to advertise and promote products 140 100
Granting of credit facilities 120 85.7
Training of middlemen staff 54 38.6
Inventory control and material handling 47 22.5.
Source: Field survey, 2013
Table 4.8 shows that 140 (100%) respondents agreed that their companies do support channel
members through advertising and promotional activities, while 120 (85.7%) respondents
indicated that their companies provide credit facilities to their channel members. However, it
was observed that training of middlemen staff and inventory control/material handlings are
not popular support services being provided by companies to their channel members as these
attracted responses of 38.6 and 22.5 percent respectively.
Table 4.9: Control Measures on Channel Members (n = 140)
Control measures Responses Percentage (%)
Hire and fire channel members at will 128 91.4
Determines prices at will 134 95.7
Strictly controls promotional activities 86 61.4
Totally controls sales facilities 18 12.9
Source: Field Survey, 2013
Table 4.9 above reveals that most companies adopt certain control measures to checkmate the
activities of their channel members. Such measures include, hiring and firing of channel
members at will (91.4%), determining prices at will (95.7%), strictly controlling promotional
activities (61.4%). However, it was observed that control of sales facilities as a control
measure is not popular as it attracted only 12.9 percent response rate.

99
In discussing tables 4.10 to 4.15, the scale and decision rule stated below is used.
Scale:
Strongly Agree (SA) - 5
Agree (A) - 4
Indifferent (I) - 3
Disagree (D) - 2
Strongly Disagree (SD) - 1
Decision Rule:
If Mean ≥ 3.5, the respondents generally agree
If 2.5 ≤ Mean < 3.5, the respondents are generally indifferent
If Mean < 2.5, the respondents generally disagree
4.1.4 Relationship between length of distribution channel and control by the firm.
In determining the relationship between length of distribution channel and control by the
firm, responses of the respondents to questions 12, 13 and 16 are presented in table 4.10 and
discussed
Table 4.10: Length of Distribution channel and control by firm
Question SA
(%)
A
(%)
I
(%)
D
(%)
SD
(%)
Mean Std.
Dev.
The length of the channel influences its
control by the firm.
42
(30.0)
83
(59.3)
4
(2.9)
7
(5.0)
4
(2.9)
4.09 0.89
The degree of control exerted by the firm
on the channel depends on the channel’s
length.
58
(41.4)
70
(50.0)
4
(2.9)
5
(3.6)
3
(2.1)
4.25 0.85
The longer the channel, the more difficult
is the control by the firm
25
(17.9)
88
(62.9)
9
(6.4)
10
(7.1)
8
(5.7)
3.80 1.01
Overall Mean 4.05
Source: Field Survey, 2013
As presented in table 4.10, in determining whether the length of the channel influences its
control by the firm, responses from the respondents show that 42 (30%) respondents strongly

100
agree, 83 (59.3%) respondents agree, 4 (2.9%) respondents are indifferent, 7 (5%)
respondents disagree and another 4 (2.9%) respondents strongly disagree. With a mean value
of 4.09, the respondents generally agree that the length of a distribution channel influences its
control by the firm..
As to whether the degree of control exerted by the firm on the channel depends on the length
of the channel, 25 (17.9%) respondents strongly agreed, 88 (62.9%) respondents agreed, 9
(6.4%) respondents were indifferent, 10 (7.1%) respondents disagreed and 8 (5.7%)
respondents strongly disagreed. Having the mean score of 3.8, the respondents generally
agree that the degree of control exerted by the firm on the channel depends on the length of
the channel.
In responding to whether the longer the channel, the more difficult its control by the firm, 58
(41.4%) respondents strongly agreed, and 70 (50%) respondents agreed, 4 (2.9%)
respondents were indifferent, 5 (3.6%) respondents disagreed and 3 (2.1%) respondents
strongly disagreed. With a mean response score of 4.25, it is the general view of the
respondents that the longer the channel, the more difficult its control by the firm. Having an
overall mean response score of 4.05, with individual responses mean scores that are greater
than 3.5, it is the opinion of the respondents that a relationship exists between the length of
the channel and the control exerted by the firm..

101
4.1.5 The influence of hybrid channel conflict on distribution channel’s performance.
In ascertaining the influence of hybrid channel conflict on distribution channel’s
performance, the respondents’ responses to questions 17, 19 and 24 were obtained, presented
in table 4.7 and discussed below.
Table 4.11: Hybrid channel conflict and channel’s performance
Question SA
(%)
A
(%)
I (%) D
(%)
SD
(%)
Mean Std.
Dev.
Hybrid channel’s conflicts affect the
channel’s performance
48
(34.3)
62
(44.3)
13
(9.3)
11
(7.9)
6
(4.3)
3.96 1.07
The performance of the channel is highly
influenced by frequency of conflicts in the
channel.
49
(35.0)
70
(50.0)
8
(5.7)
7
(5.0)
6
(4.3)
4.06 1.00
It is most likely that the less conflict in the
channel, the better is the channel’s
performance
33
(23.6)
83
(60.7)
11
(7.9)
8
(5.7)
3
(2.1)
3.98 0.86
Overall Mean 3.60
Source: Field Survey, 2013
As presented in table 4.11, in examining the influence of hybrid channel’s conflict on
distribution channel’s performance, 48 (34.3%) respondents strongly agreed, 62 (44.3%)
respondents agreed, 13 (9.3%) respondents were indifferent, 11 (7.9%) respondents disagreed
and 6 (4.3%) respondents strongly disagreed. With a mean response score of 3.96, the
respondents generally agreed that hybrid channel conflict affects the channel’s performance.
In response to whether the performance of the channel is highly influenced by the frequency
of conflicts in the channel, shorter channels requires more customer support programs, 49
(35%) respondents strongly agree, 70 (50%) respondents agree, 8 (5.7%) respondents were
indifferent, 7 (5%) respondents disagree and 6 (4.3%) respondents strongly disagree. Having
a mean response score of 4.06, the respondents generally agree that the channel performance
is highly influenced by the frequency of conflicts in the distribution channel.
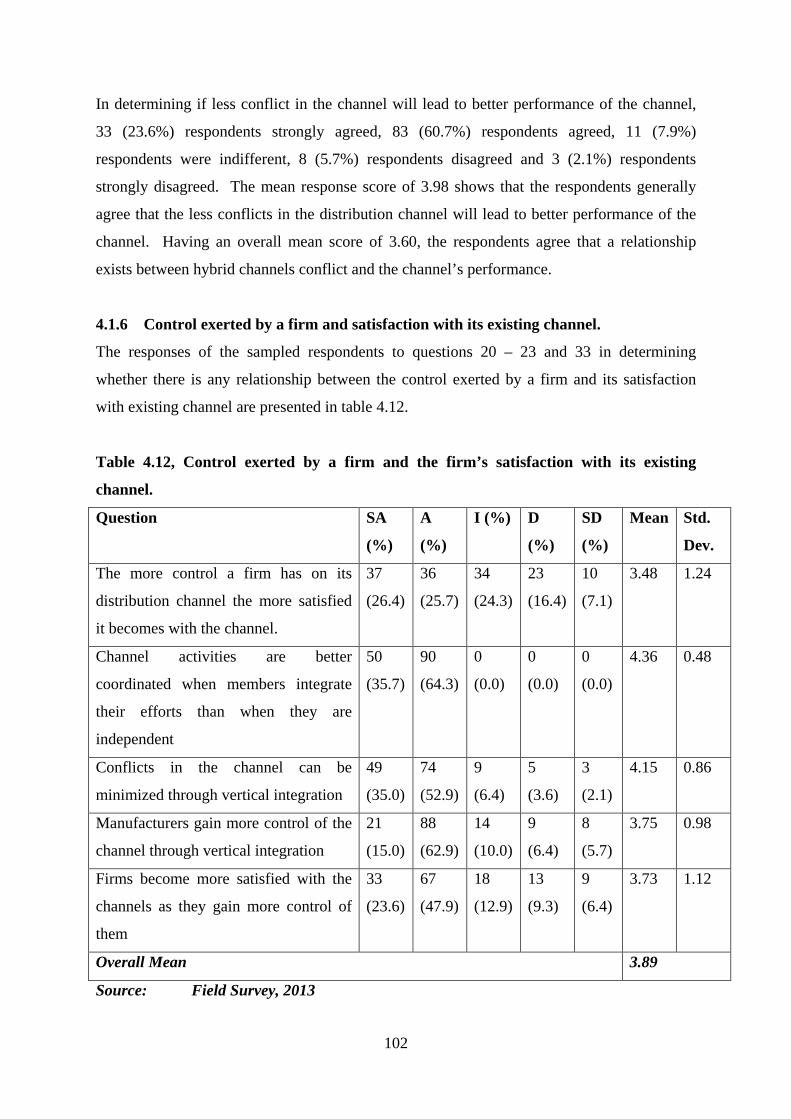
102
In determining if less conflict in the channel will lead to better performance of the channel,
33 (23.6%) respondents strongly agreed, 83 (60.7%) respondents agreed, 11 (7.9%)
respondents were indifferent, 8 (5.7%) respondents disagreed and 3 (2.1%) respondents
strongly disagreed. The mean response score of 3.98 shows that the respondents generally
agree that the less conflicts in the distribution channel will lead to better performance of the
channel. Having an overall mean score of 3.60, the respondents agree that a relationship
exists between hybrid channels conflict and the channel’s performance.
4.1.6 Control exerted by a firm and satisfaction with its existing channel.
The responses of the sampled respondents to questions 20 – 23 and 33 in determining
whether there is any relationship between the control exerted by a firm and its satisfaction
with existing channel are presented in table 4.12.
Table 4.12, Control exerted by a firm and the firm’s satisfaction with its existing
channel.
Question SA
(%)
A
(%)
I (%) D
(%)
SD
(%)
Mean Std.
Dev.
The more control a firm has on its
distribution channel the more satisfied
it becomes with the channel.
37
(26.4)
36
(25.7)
34
(24.3)
23
(16.4)
10
(7.1)
3.48 1.24
Channel activities are better
coordinated when members integrate
their efforts than when they are
independent
50
(35.7)
90
(64.3)
0
(0.0)
0
(0.0)
0
(0.0)
4.36 0.48
Conflicts in the channel can be
minimized through vertical integration
49
(35.0)
74
(52.9)
9
(6.4)
5
(3.6)
3
(2.1)
4.15 0.86
Manufacturers gain more control of the
channel through vertical integration
21
(15.0)
88
(62.9)
14
(10.0)
9
(6.4)
8
(5.7)
3.75 0.98
Firms become more satisfied with the
channels as they gain more control of
them
33
(23.6)
67
(47.9)
18
(12.9)
13
(9.3)
9
(6.4)
3.73 1.12
Overall Mean 3.89
Source: Field Survey, 2013

103
As shown in table 4.12, in response to whether the more control a firm has on its distribution
channel the more satisfied it will be with the channel, 37 (26.4%) respondents strongly
agreed, 36 (25.7%) respondents agreed, 34 (24.3%) respondents were indifferent, 23 (16.4%)
respondents disagreed and 10 (7.1%) respondents strongly disagreed. With a mean response
score of 3.48, the respondents were indifferent as to whether the shorter the channel, the
easier and more effective the channel coordination is.
With 50 (35.7%) respondents strongly agreeing, 90 (64.3%) respondents agreeing and a mean
response score of 4.36, it is the general view of the respondents that channel activities are
better coordinated when members integrate their efforts than when they are independent.
In responding to whether conflicts in the channel can be minimized through vertical
integration, 49 (35%) respondents strongly agreed, 74 (52.9%) respondents agreed, 9 (3.6%)
respondents were indifferent, 5 (3.6%) respondents disagreed and 3 (2.1%) respondents
strongly disagreed to this. With a mean response score of 4.15, the respondents agree that
conflicts in the channel can be minimized through vertical integration.
In establishing if manufacturers gain more control of the channel through vertical integration,
21 (15%) respondents strongly agree, 88 respondents (62.9%) agree, 14 respondents (10%)
were indifferent, 9 respondents (6.4%) disagreed and 8 respondents (5.7%) strongly
disagreed. Having a mean response score of 3.75, it is the opinion of the respondents that
manufacturers gain more control of the channel through vertical integration.
In determining whether firms become more satisfied as they gain more control of their
channel, 33 (23.6%) respondents strongly agreed, 67 (47.9%) respondents agreed, 18 (12.9%)
respondents were indifferent, 13 (9.3%) respondents disagreed and 9 respondents (6.4%)
strongly disagreed to this. Having a mean response score of 3.73, the respondents agree that
firms get more satisfied as they gain more control of their distribution channels.
With an overall mean response score of 3.89, the respondents agree that there is a relationship
between the control exerted by a firm and satisfaction with existing channel.

104
4.1.7 The influence of a channel’s length on its performance
Responses to questions 14, 15, 18, 25, 29, 30, 31 and 32 as presented in table 4.13 and
discussed below, show the view of respondents about whether the length of a distribution
channel influences its performance.
Table 4.13: Influence of The length of a channel on its performance
Question SA
(%)
A (%) I (%) D
(%)
SD
(%)
Mean Std.
Dev.
Direct distribution enables producers
maximum control of distribution of
their products
31
(22.1)
80
(57.1)
14
(10.0)
8
(5.7)
7
(5.0)
3.86 0.99
The length of a channel determines its
effectiveness
11
(7.9)
5
(3.6)
16
(11.4)
65
(46.4)
43
(30.7)
2.06 1.00
Indirect distribution cost more than
direct distribution
8 (5.7) 22
(15.7)
15
(10.7)
71
(50.7)
24
(17.1)
2.42 1.12
The performance of a channel depends
on its length.
7 (5.0) 18
(12.9)
63
(45.0)
32
(22.9)
20
(14.3)
2.71 1.03
Selling through wholesale middleman
to the retailer achieves greater
efficiency than selling directly to the
retailer
26
(18.6)
55
(39.3)
27
(19.3)
20
(14.3)
12
(8.3)
3.45 1.20
Direct delivery from central warehouse
to individual customer is not as
economical as delivery to them through
depots located near their market
30
(21.4)
88
(62.9)
12
(8.6)
10
(7.1)
0
(0.0)
3.99 0.77
The use of central distribution
warehouse costs more than using many
warehouse spread across the country
45
(32.1)
45
(32.1)
17
(12.1)
21
(15.0)
12
(8.6)
3.64 1.30
Distributing directly to retailers is more
cost saving than distributing through
wholesale middlemen
5 (3.6) 11
(7.9)
16
(11.4)
65
(46.4)
43
(30.7)
2.07 1.03
Overall Mean 2.7
Source: Field Survey, 2013

105
As presented in table 4.13, in ascertaining whether distributing directly to retailers is more
cost saving than distributing through wholesale middle, the responses of the respondents
show 5 (3.6%) respondents strongly agree, 11 (7.9%) respondents agreeing, 16 (11.4%)
respondents being indifferent, 65 (46.4%) respondents disagreeing and 43 (30.7%)
respondents strongly disagreeing. From the mean response score of 2.07, the respondents
disagree that distributing directly to retailers is more cost saving than distributing through
wholesale middle.
In comparing if indirect distribution costs more than direct distribution, 8 (5.7%) respondents
strongly agree, 22 (15.7%) respondents agree, 15 (10.7%) respondents are indifferent, 71
(50.7%) respondents disagree and 24 (17.1%) respondents strongly disagree. Having a mean
response score of 2.42, the respondents disagree that indirect distribution costs more than
direct distribution.
Having a mean response score of 2.42 and with 7 (5%) respondents strongly agreeing, 18
(12.9%) respondents agreeing, 63 (45%) respondents being indifferent, 32 (22.9%)
respondents disagreeing and 20 respondents (14.3%) strongly disagreeing, the respondent do
not agree that the length of a channel of distribution determines its performance. .
With a mean response score of 3.45 as well as 26 (18.6%) respondents, 55 (29.2%)
respondents, 27 (19.3%) respondents, 20 (14.3%) respondents and 12 (8.3%) respondents
strongly agreeing, agreeing, being indifferent, disagreeing and strongly disagreeing
respectively, the sampled respondents are indifferent as to whether selling through wholesale
middleman to the retailer achieves greater sales volume than selling directly to the retailer.
As to whether direct delivery from central warehouse to individual customer is not as
economical as delivery to them through depots located near their market, 30 respondents
(21.4%) strongly agree, 88 (62.9%) respondents agree, 12 (8.6%) respondents were
indifferent and 10 respondents (7.1%) disagree to this. Based on this and with a mean
response score of 3.99, the respondents agree that direct delivery from central warehouse to
individual customer is not as economical as delivery to them through depots located near
their market.

106
In showing if direct distribution ensures producers the control of distribution of the products,
31 respondents (22.1%) strongly agree, 80 (57.1%) respondents agree, 14 (10%) respondents
were indifferent, 8 (5.7%) respondents disagreed and 7 (5%) respondents strongly disagreed.
Having a mean response score of 3.86, the respondents agree that direct distribution ensures
producers the control of distribution of the products.
Having an overall mean response score of 2.7, the respondents disagree that the length of a
channel of distribution influences its performance.
4.1.8 Influence of the number of distributors on the channel’s performance.
In determining whether the number of distributors in a distribution channel influences the
channel’s performance, respondents’ responses to questions 27, 28 and 29 were obtained,
presented in table 4.10 and discussed below.
Table 4.14: Number of distributors in a channel versus the channel’s performance
Question SA
(%)
A
(%)
I (%) D
(%)
SD
(%)
Mean Std.
Dev.
The higher the number of appointed
distributors in a channel, the higher the
channel’s performance
11
(7.9)
20
(14.3)
6
(4.3)
73
(52.1)
30
(21.4)
2.35 1.19
As the number of intermediaries in the
channel increases, the channel
performance increases.
20
(14.3)
101
(72.1)
3
(2.1)
11
(7.9)
5
(3.6)
3.86 0.89
More distributors in the channel will
bring about more effectiveness of the
channel.
20
(14.2.
)
12
(8.0)
5
(4.1)
71
(51.7)
32
(21,5)
2.63 1.22
Overall Mean 2,9
Source: Field Survey, 2012
Table 4.14 shows that based on the mean response score of 2.35, the respondents disagree
that the higher the number of appointed distributors the higher the channel’s performance.
This is seen in their frequency responses that show 11 (7.9%) respondents who strongly

107
agreed, 20 (14.3%) respondents who agreed, 6 (4.3%) respondents who were indifferent, 73
(52.1%) respondents disagree and 30 (21.4%) respondents strongly disagree to this.
As shown in the responses of 20 (14.3%) respondents who strongly agreed, 101 (72.1%)
respondents who agreed, 3 (2.1%) respondents who were indifferent, 11 (7.9%) respondents
who disagreed and 5 (3.6%) respondents who strongly disagreed, as well as the mean
response score of 3.86, the respondents agree that as the number of intermediaries increases,
channel performance also increases.
20 (14.2%) respondents strongly agree, 12 (8.0%) respondents agree, 5 (4.1%) respondents
are indifferent, 71 (51.7%) respondents disagree and 32 (21.5%) respondents strongly
disagree that more distributors in the channel will bring about more effectiveness of the
channel. With a mean response score of 2.63, the respondents generally disagree to this.
Having an overall mean 2.9, the respondents do not agree that the number of distributors in a
distribution channel determines the channel’s performance.
4.2 TEST OF HYPOTHESES
The results of the test of the various study hypotheses are presented below.
4.2.1 Test of Hypothesis One
HO: There is no significant relationship between the length of a distribution channel and
the control exerted by the firm.
H1: There is a significant relationship between the length of a distribution channel and the
control exerted by the firm.
To test this hypothesis the data presented in table 4.10 were tested using the linear
regression test tool. The results are presented thus;
CC = 0.710 + 0.776LC + 0.098LDI
Where; CC = Channel control
LC = Length of channel
LDI = Level of Distribution Intensity
R = 0.911

108
R2 = 0.829
t = 4.997
F = 333.053 (sig. = 0.000) (see Appendix 3 for detailed results)
The regression sum of squares (83.149) is greater than the residual sum of squares (17.101)
which indicates that more of the variation in the dependent variable is explained by the
model. The significant value of the F statistics (0.000) is less than 0.05, which means that the
variation explained by the model is not due to chance.
R, the correlation coefficient, which has a value of 0.911, indicates that there is a strong
relationship between the channel control and the independent variables (Length of a
distribution channel). R square, the coefficient of determination, shows that 82.9% of the
variation in the dependent variable is explained by the model. With the linear regression
model, the error of estimate is low, with a value of about 0.35331.
With a constant of 0.710, the relationship between CC and the independent variables (LC and
LDI) is positive and statistically significant as t = 4.997. Based on this, we therefore reject
the null hypothesis and accept the alternate hypothesis accordingly. Hence, there is a
significant relationship between the length of a distribution channel and the control exerted
by the firm.
4.2.2 Test of Hypothesis Two
HO: There is no significant relationship between hybrid channel’s conflict and the
channel’s performance.
H1: There is a significant relationship between hybrid channel’s conflict and the channel’s
performance.
To test this hypothesis the data presented in table 4.11 were tested using the linear regression test tool. The results are presented thus;
HC = 0.771 + 0.665LC + 0.128FC
Where; HC = Hybrid channel conflict
CP = Channel Performance

109
FC = Frequency of channel’s conflict.
R = 0.924
R2 = 0.854
t = 6.452
F = 401.230 (sig. = 0.000) (see Appendix 4 for detailed results)
The regression sum of squares (87.925) is greater than the residual sum of squares (15.011)
which indicates that more of the variation in the dependent variable is explained by the
model. The significant value of the F statistics (0.000) is less than 0.05, which means that the
variation explained by the model is not due to chance.
R, the correlation coefficient, which has a value of 0.924, indicates that there is a strong
relationship between channel performance and the independent variables (hybrid channel’s
conflict). R square, the coefficient of determination, shows that 85.4% of the variation in the
dependent variable is explained by the model. With the linear regression model, the error of
estimate is low, with a value of about 0.33101.
With a constant of 0.771, the relationship between CP and the independent variables (HC and
FC) is positive and statistically significant as t = 6.452. Based on this, we therefore reject the
null hypothesis and accept the alternate hypothesis accordingly. Hence, there is a significant
relationship between hybrid channel’s conflict and the channel’s performance.
4.2.3 Test of Hypothesis Three
Ho: The control exerted by a firm does not influence the firm’s satisfaction with its
existing channels.
H1: The control exerted by a firm influences the firm’s satisfaction with its existing
channels.
To test this hypothesis the data presented in table 4.12 were tested using the t-test tool. The
results are presented thus;
tcalculated = 24.586
tcritical = 4.604

110
sig. (p) value = 0.000 (see Appendix 5 for detailed results)
Based on the set decision rule, since tcalculated (24.586) > tcritical (4.604). The null hypothesis is
rejected. This result is significant as sig. (p) value = 0.000 < 0.05. Therefore, the control
exerted by a firm influences the firm’s satisfaction with its existing channel. .
4.2.4 Test of Hypothesis Four
H0: The length of a distribution channel does not determine its performance.
H1: The length of a distribution channel determines its performance.
To test this hypothesis the data presented in table 4.13 were tested using the z-test tool. The
results are presented thus;
Zcalculated = 1.236
Zcritical = 1.96
sig. (p) value = 0.165 (see Appendix 6 for detailed results)
Based on the set decision rule, since Zcalculated (1.236) < Zcritical (1.96). The null hypothesis is
accepted. This result is not significant as sig. (p) value = 0.165 > 0.05. Therefore, the length
of a distribution channel does not determine its performance.
4.2.5 Test of Hypothesis Five
Ho: The number of distributors in a distribution channel does not determine the
performance of the channel.
H1: The number of distributors in a distribution channel determines the
performance of the channel.
To test this hypothesis the data presented in table 4.14 were tested using the z-test tool. The
results are presented thus;
Zcalculated = 1.53
Zcritical = 1.96
sig. (p) value = 0.19 (see Appendix 7 for detailed results)

111
Based on the set decision rule, since Zcalculated (1.53) < Zcritical (1.96). The null hypothesis is
accepted. This result is not significant as sig. (p) value = 0.19 > 0.05. Therefore, the number
of distributors in a distribution channel does not determine the performance of the channel
4.3 DISCUSSION OF FINDINGS
The various findings of the study are discussed based on the objectives of the study below.
4.3.1 Relationship between the length of a distribution channel and the control exerted
by the firm.
The study revealed that there is a significant relationship between the length of a distribution
channel and the control exerted by the firm on the channel. In other words the length of a
channel influences the firm’s control of the channel. The view is supported by Blue et al,
1970 when the stated that direct channels are the most simple distribution channel and they
involve direct contact between producer and user. According to them, direct distribution
ensures producers the whole control of distribution of products. Therefore producers must be
able to solve marketing and production problems and must gather know-how on direct sales
and retail operations due to engage in direct sales with large scales. Also in support of this
finding, Nebo (2011: 39) says that the degree to which a marketing channel member wishes
to control the marketing functions within the channel is determined to a great extent by the
distribution intensity strategy.
4.3.2 The influence of a hybrid channel’s conflict on the channel’s performance.
The test of hypothesis 2 revealed that hybrid channel’s conflict significantly influences the
channels performance. This view was supported by Webb and Hogan (2002) when they
stated that today’s dynamic markets are forcing firms to design increasingly complex channel
strategies involving multiple channels of distribution. As the complexity of these systems
increases so too does the opportunity for conflict between individual channel coalitions
within the firm. They stated further that whereas hybrid channel conflict can reduce channel
performance, it can also serve as a mechanism forcing internal channel coalitions to work
harder and smarter to serve their markets. From a study carried out, the findings indicate that
hybrid channel conflict is an important determinant of both channel performance and
satisfaction. The result suggested that the relation between hybrid channel conflict and
performance is moderated by the life cycle stage. Data support the view that frequency of
conflict but not its intensity has a negative effect on channel performance.

112
4.3.3 Channel control by a firm versus the firm’s satisfaction with its existing channels
The study revealed that there is a relationship between the control exerted by a firm and its
satisfaction with its existing channel. This finding was supported by Webb and Hogan (2002)
when they stated that channel satisfaction is influenced by the control which a firm exerts
over its channel operators. More control according to them is believed to allow the firm to
carry out its marketing program more fully and achieve better feedback from the market.
4.3.4 Relationship between the length of a channel and its performance
The length of a channel does not determine performance of the channel. This is the outcome
of the test carried out on hypothesis 4. Though it is an established fact that direct distribution
enables producers to maximally control the distribution of their products, the cost of such
undertaking is enormous and has the effect of significantly affecting profitability. According
to Gary (1996), small and moderate-sized customers cannot be economically served by
traditional direct channels because selling costs would surpass the revenues. Having
established that distributing directly to retailers is not more cost saving, the need to use
central distribution warehouse is highlighted. This is summarized in the point made by
Oyeke and Nebo (2000), when they noted that any manufacturer who eliminates the channel
intermediaries should be ready to perform their tasks of transferring the title to products or
moving goods from the producer to the consumer; and these tasks are capital intensive –
thereby affecting profitability.
4.3.5 The number of distributors in a channel and the channel’s performance
The result of the test carried out on hypothesis 5 shows that the number of distributors in a
channel does not determine the performance of the channel. This view was supported by
Berman and Thelen (2004) that all marketers should understand that distribution creates cost
to the organization. Some of these costs can be passed along to customers (e.g. shipping
costs), but others cannot (e.g need for additional salespeople to handle more distributors).
Thus, the process for determining the right level of distribution coverage often comes down
to an analysis of the benefit (e.g. more sales) versus the cost associated with the gain.
McCarthy and Perrault (1984) stated that the ideal distribution intensity would make a brand
available widely enough to satisfy but not exceed target customer’s needs because
oversaturation increases marketing costs without providing benefits.

113

114
CHAPTER FIVE
SUMMARY OF FINDINGS, CONCLUSION AND RECOMMENDATIONS
5.0 Introduction.
This research was designed to evaluate the distribution channels for consumer goods in the
manufacturing industry in Nigeria. This chapter therefore presents a summary of the findings,
conclusions and recommendations of the study.
5.1 Summary of Findings
The following are the summary of findings based on the analysis of the research questions
and the hypotheses.
• There is a significant relationship between the length of a distribution channel and the
control exerted by the firm on the channel (r = 0.911, r2 = 0.829, t = 4.997, F =
33.053, p < 0.05);
• There is a significant relationship between a hybrid channel’s conflict and the
performance of the channel. (r = 0.924, r2 = 0.854, t = 6.452, F = 401.23, p < 0.05);
• There is a significant relationship between the control exerted by a firm and the firm’s
satisfaction with the existing channel (t = 24.586, p < 0.05);
• The length of a distribution channel does not significantly influence its performance
(Z = 1.236, p > 0.05); and
• The number of distributors in a distribution channel does not determine the channel’s
performance (Z = 1.53, p > 0.05).
5.2 Conclusion
Based on the findings of the research enumerated above, the following conclusions are
drawn.
1. Consumer goods manufacturing companies in Nigeria adopt multi-channel
distribution strategy. Each company uses many portfolios of channels to reach the
market. However, it was observed that these channel approaches need to be improved
upon in order to achieve the much needed customer satisfaction and lower cost
objectives: bearing in mind that distribution intensity influences the manufacturer’s
support programs and cost of distribution

115
2. From the interviews conducted and questionnaire administered, it was seen that most
of the consumer goods manufacturing firms are trying to be innovative in distribution
channel system. However, there is still room for improvement as many have not
embraced the use of the internet or e-commerce in their operations.
5.3 Recommendation.
Having made a thorough research and stated the findings as above, it is necessary to make
recommendations aimed at ameliorating some shortcomings observed in the distribution
channel systems operated by companies in the manufacturing industry in Nigeria.
1. Consumer goods manufacturing companies in Nigeria should analyze and restructure
their sales and distribution approaches by performing activities in new ways which
increase value to customers and reduce costs. Manufacturers can gain competitive
advantage by;
- Determining which activities are valued by the end customers.
- Identifying new ways to perform high value sales and distribution activities so that
they increase customer satisfaction.
- Assessing alternative approaches to sales and distribution which lower costs and
working capital investments throughout the total channel.
2. Consumer goods manufacturing companies should strive to embrace or adopt
innovations in their channel management. E-commerce or sales through the internet is
becoming a means to serve larger numbers of customers at much lower costs.
Improved logistics and delivering time by FedEx and UPS are reducing the
requirement for local warehousing. Broader acceptance of electronic data interchange
to monitor sales and inventory levels throughout the total channel is reducing
inventories and speeding response to changing customer requirements.
3. Manufacturing firms should strive to adopt an ideal distribution intensity that is
commensurate with their level of activity or operation. Such level of intensity that
would make a brand available widely enough to satisfy but not exceed target
customers’ needs because over saturation increases marketing costs without providing
benefits.
4. Business executives should analyze ways to avoid the wrong use of the power in the
channel and also seek alternatives to equilibrate the power in the distribution channel.

116
This is because the use of the power for a member of the distribution channel can
interfere with the performance of other members of the channel.
5. For the overall channel to operate effectively, manufacturers must support their
distributors or wholesalers especially in the provision of selling tools and related
training in order for them to effectively perform the customer/product matching
activity. Other areas they may support include finance and logistic functions.
6. Marketers must take cognizance of the fact that distribution creates costs to the
organization. Some of these costs or expenses can be passed along to customers (e.g
shipping costs) but others such as need for additional salespeople to handle more
distributors cannot. Thus, the process for determining the right level of distribution
coverage often comes down to an analysis of the benefits (e.g. more sales) versus the
cost associated with the gain.
7. Government should provide the necessary infrastructural environment that will enable
free flow of goods from the point of production to the point of consumption.
8. Consumer goods manufacturing firms should first determine whether their level of
activity is such that warrants the use of company’s sales force and owned warehouse.
Otherwise, they should opt for sales agency and public warehouse. This is based on
the findings that it is more economical for firms whose output and market are limited
to spin-off the channel functions to other members of the channel.
5.4 Contribution to Knowledge
This research would enable the producer/supplier of consumer goods, the government as well
as the general public to be exposed to the different distribution channel systems and
structures that would ensure maximum savings in distribution costs, enhance product
availability and effective coordination of channel activities. It will enable marketers of
consumer goods to come to the realization that the design and management of an effective
and efficient distribution channel system offers significant competitive advantage.
Through the efforts of this research work, the researcher has developed below model which
may guide manufacturers/suppliers of consumer goods in choosing the ideal intensity of
distribution for their products.

117
Table 5.1: Selection Criteria for Distribution Intensity based on Product
Characteristics
Characteristic Product category
A
Product category
B
Product category
C
Time and effort spent purchasing by consumers
Low
Medium High
Replacement rate High Medium Low
Adjustment Low Medium High
Unit value Low Medium High
Intensity of distribution Intensive Selective Exclusive
Source: Researchers field work.
The results obtained from the field shows that Products which require a lot of time and efforts
on the part of the consumer, to purchase and are expensive and for which the rate of
replacement is low are candidates of exclusive distribution. Such products fall into the
classification of specialty goods as represented by product category C in the above table. The
reverse is the case for other categories of products which fall into selective and exclusive
distribution as shown in the table above. Marketers are therefore advised to consider their
products characteristic before deciding on the intensity of distribution mode to adopt.
5.5 Suggestion for Further Studies
Based on the limitations and delimitations of the study, the researcher was able to access the
distribution channel of consumer goods in the manufacturing industry in Nigeria and made
recommendations for improvement. Another area for which further study may be needed is
evaluation of distribution channels for industrial goods in Nigeria.

118
BIBLIOGRAPH
Abdellah, F.C. and Levine, E. (1979), Better Patience Care Through Nursing Research, New
York: Macmillan Publishing Company.
Achison C.B (2002), Strategic Marketing Management. Enugu: Precision Publishers Limited.
Agatz N. A. H., Fleischmann M. and Van Nunen J.A., (2008) “E-Fulfillment and Multi-
channel Distribution.” A Review, European Journal of Operational Research 339-
356.
Anderson R.E (1973) “Consumer Satisfaction: The Effect of Disconfirmed Expectancy on
Perceived Product Performance” Journal of Marketing Research 10 (February) 38 - 44
Alderson W. (1957) Marketing Behaviour and Executive Action. Functional Approach to
Marketing Theory, Irwin. Homewood.
Alderson W. (1954), Factors Governing the Development of Distribution Channels in
Clewett R.M. (ED) Marketing Channels for Manufactured Products, Irwin,
Homewood, 11: p.31.
Amarchard, D and Varad, H.B (1979) An Introduction to Marketing, New Delhi, Vikas
Publishing House Limited.
Anyanwu, A. (2000) Research Methodology in Business and Social Sciences, Owerri:
Cannun Publishers Nig. Ltd.
Asika, N. (2001) Research Methodology in Behavioral Sciences, Nigeria, Longman Nigeria
PLC.
Bacheldor, Beth and Gilbert, Alorie (2000), “The Big Squeeze.” Information Week.
Retrieved 5th September, 2011, from
http://www.informationweek.com/779/prchannel.htm.

119
Bailey, K.D (1982) Methods of Social Research, London: Collier Macmillan Ltd. Baridam,
D.M (2001) Research Methods in Administrative Sciences, Port Harcourt Shebrook,
3rd ed.
Beckman, J.N. Maynad, H.H and Davidson, W.R (1957) Principle of Marketing, New York,
The Ronald Press Company.
Bello, D.C., Lohtia R. and Sangtani V. (2004), An International Analysis of Supply Chain
Innovations in Global Marketing Channels, Industrial Marketing Management, vol
33, n 1, 57-64.
Bergen M., Levy D., Ray S., Rubin P.H. and Zeliger B.,(2008), “When Little Things Mean a
lot On the Inefficiency of Laws,” The Journal of Law and Economics, vol. 51, n 2,
209-250
Berman, B. (1996), Marketing Channels. Chichester John Willy & Sons, p. 663.
Berman, B. Thelen, S. (2004), “A guide to developing and Managing a Well integrated multi-
channel retail strategy”. International Journal of Retail & Distribution Management.
V 32, N 3, 147-157.
Bierstedt, R. (1950), “An Analysis of Social Power”. American Sociological Review: Vol. 15
No 6, 735.
Bordens, S.K and Abbot, B.B.(2002). Research Design and Methods; A Process Approach,
(5th ed), New York; McGraw-Hill Books.
Buel V.P., (1970), Handbook of Modern Marketing, New York: McGraw-Hill.
Bray, J.P. and Berger D., (2008), “Retail Innovation – The Never-Ending Road to Success? A
critical Analysis of Pitfalls and opportunities,” European Institute of Retailing and
Services Studies Annual Conference 14-17.
Brent Driver & Zach Evans (2004) Retrieved (2011) from http://www.mbafiles.com/wp-
content/uploads?

120
Brown S., (1988), “The Wheel of Retailing”. International Journal of Retailing, vol. 3, n 1,
16-37.
Brown J. and Frazier G., (1978) “The Application of Channel Power: Its effects and
Connotations in Research Frontiers in Marketing Dialogues and Directions,”
Subhash C. Jain ed Chicago American Marketing 266-270.
Brynjolfsson E. and Smith M., (2000) Frictionless Commerce? A Comparison of Internet and
Conventional Retailers. Management Science, n, 46, 563-585.
Bucklin, L.P (1966), A Theory of distribution Channel Structure, University of California,
Institute of Business and Economic research, Berkeley.
Bucklin, L.P. (1965), “Postponement, Speculation and Structure of Distribution Channels”
Journal of Marketing Research, 2.
Cartwright, Dorwin (1965), Influence, Leadership, Control in Handbook of Organizations,
James G. March ed. Chicago Rand McNally, 1-47.
Castaldo S. (2001) Retailing and Innovation. Egea, Milano. Chou Y., Lee C.W., Chung J.
(2004). “Understanding M-Commerce Payment Systems through the Analytic
Hierarchy Process,” Journal of Business Research, n. 57, 1423-1430
Christopher, M, (1997) “Logistics and the National Economy,” International Journal of
Physical Distribution & Materials Management, vol. 11 No 4.
Consoli, M.A, and Neves, M.F. (2008) “A method for building new marketing channels.
The case of “door-to-door” in diary products direct marketing:” An International
Journal vol. 2
Consoli, M.A (2005). Retrieved Sept., 2011 from http://www.pensaconference.org/ul-pensa-
conference.

121
Coughlan, A.T. et al (2002), Canais de Marketing and Distribution, 6th ed; Bookman, Porto
Alegre, p. 461.
Coughlan, A.T: Anderson, E, Stern, I.W, and El-Ansary, A, (2005) Marketing Channels, 7ed
Prentice Hall, 500p.
Coupey, Eloise (2001). Marketing and the Internet: Conceptual Foundations, Prentice Hall,
249.
Courty, P. and Pagliero M., (2008), “Responsive Pricing, Economic Theory,” vol. 34, n 2,
235-259.
Dahl, Robert A. (1957) “The Concept of Power” Behavioral Science, 2 July. 235-259.
Dahlberg T., Mallat N., Ondrus J. and Zinijewska A., (2008) “Past, Present and Future of
Mobile Payments Research:” A literature Review, Electronic Commerce Research
and Applications, vol 7,n2, 165-181.
Dawson J.A. (1979). The Marketing Environment, Croon Helm, London.
Dawson J.A (2001) “is there a New Commerce in Europe?” The International Review of
Retail, Distribution and Consumer Research vol. 11, n3 287-299.
Dhar S.K., Hoch S.J. and Kumar N., (2001), “Effective Category Management Depends on
the Role of Category.” Journal of Retailing, vol. 77, 165-184.
Dixon, D.F (1964). “Functionalism as an Approach to Marketing Theory.” Economics and
Business Bulletin. 28-34.
Dupuis M. (2000). “Retail Innovation: Towards a Framework of Analysis,” International
EAERCO Conference on Retail Innovation, ESADE, Barcelona, July, 13-14.
Dupuis M. and Tissier-Desbordes E., (1996). “Trade Marketing and Retail: A European
Approach,” Journal of Retailing and Consumer Services, vol. 3 n 1, 43-51.

122
Dwyer, F. Robert (1980), “Channel Member Satisfaction: Laboratory Insights” Journal of
Retailing. 56 (summer) 45-65.
Edward W. Smykay, Donald J. Bowersox and Frank i. Mossman (1961) Physical
Distribution Management., New York. Macmillan Company CH ,V.
Ehikwe, A.E. (2002) Transportation and Distribution Management. Enugu, Nigeria:
Precision Publishers Limited.
El-Ansary and Louis W. Stern (1972) “Power Measurement in the Distribution Channel.”
Journal of Marketing Research, 9(February), 47-52.
Emerson, R.W., (2009) “Franchise Contracts and Territoriality: A French Comparison.” The
Ohio State University Entrepreneurial Business Law Journal, n 315.
Emerson, Richard M. (1962) “Power Dependence Relations” American Sociological Review,
27 (February), 31-41.
Emery, F.E and Trist, E., (1969) The Causal texture of organizational Environments in
Emery F.E. (ed). Systems Thinking Penguin. Harmondsworth 241-257.
Eztel, M.J., Walker, B.J. and Stanton, W.J. (2001). Marketing (12th ed) Boston: McGraw Hill,
Irwin.
Forman C, Ghose A. and Goldfarb A. (2009) “Competition Between Local and Electronic
Markets. How the Benefit of Buying Online Depends on Where You live,”
Management Science, n55, January, 47-57.
Ganesan, S. George M., Jap S., Palmotier R. and Weitz B., (2009). “Supply Chain
Management and Retailer Performance: Emergent Trends, issues and implications for
Research and Practice,” Journal of Retailing, vol. 85, n 1, 84-94.

123
Gaski J.F., “The Theory of Power and Conflict in Channels of Distribution.” Retrieved Oct.
(2011) http://bear.warrington.ufi.edu/weitz/
Ghose, A., Smith M. and Telang R. (2006). “Internet Exchanges for use books: An Empirical
Analysis of Product Cannibalization and Welfare Implications,” Inform System
Resources vol. 17 n 1, 119.
Gillis W.E., and Combs J.G., (2009). “Franchisor Strategy and Firm Performance : Making
the Most of Strategic Resources Investment,” Business Horizons, vol. 52, n 6, Nov-
Dec, 553-561.
Gonzalez – Padron T., Hult G.T.M. and Calatone R., (2008) “Exploiting Innovative
Opportunities in Global Purchasing. An Assessment of Ethical Climate and
Relationship Performance”. Industrial Marketing Management, vol. 37, 69-82.
Gordon K.T. (2004) “Give It a Go: A “Hands-on” Approach to Marketing Your Product
Could Be Just the Thing to Win Customers.” Entrepreneur Magazine, vol. 32, n 9,
74-75.
Grayson, D. and Dodd T., (2007). “Small is Sustainable (and Beautiful). Encouraging
European Smaller Enterprises to be sustainable,” occasional Paper, The Doughty
Centre for Corporate Responsibility, Cranfield School of Management.
Green, P.E, Tull, D.S and Album, G. (1988) Research For Marketing Decisions, (5th ed),
Englewood Cliffs, Prentice Hall.
Gulati R. and Garino, J., (2000) “Get the right mix of bricks and clicks,” Harvard Business
Review, 78(3), 107-114.
Gundlach G.T., Bolumde Y.A., Eltantawy R.A. and Frankel R., (2006). “The Changing
Landscape of Supply Chain Management, Marketing Channels of Distribution,
Logistics and Purchasing,” Journal of Business 7 Industrial Marketing, vol. 21, n 7,
428-438.

124
Hamid R.I., Kamran S. and Gholamrezu J. (2011). Iranian Journal of Management Studies
(IJMS) vol. 4, No 1, 25-42.
Hardgrave B.C., Miles R.B. and Mitchell Y., (2009) “Item-level RFID for Apparel: The
Bloomingdale’s RFID Initiative,” Working Paper n. Information Technology
Research Institute, University of Arkansas .
Hogan, John E. and Webb, Kevin L., (2002)” Hybrid Channel Conflict, Causes and Effects
on Channel Performance.” The Journal of Business 7 Industrial Marketing. Santa
Barbara vol. 17(5).
Hollander, Stanley C. (1964). “Who Does the work of Retailing” Journal of Marketing, 28
(July) 18-22.
Hum S.H. and Sim H.H (1996) “Time Based Competition.” Literature Review and
Implications for Modeling, International Journal of Operations & Production
Management, vol. 16, n 1, 75-90.
Hunt, H. Keith, (1977) “Consumer Satisfaction/Dissatisfaction: Overview and Research
Direction” in conceptualization and Measurement of Consumer Satisfaction and
Dissatisfaction, Ed. H. Keith Hunt Cambridge, MA Marketing Science Institute, 455 –
488.
Iacobucci, D., (2001) in: “A comparative Analysis of The Main Food Distribution Structure
in Brazil.” Retrieved September, 2011 from http://www.pensa.conference.org/nl-
pensa-conference.
IBS Centre for Management Research (ICMR) in Evaluating Channel Performance,
Retrieved 2011 from http://www.icmrindia.org/
Ikeagwu, E.K (1998) Ground work of Research Methods and Procedures, Enugu, Institute of
Developmental Studies.
Jain, S.C., (2000) Marketing Planning & Strategy 6th ed. Cincinnati: Thomson Learning,
925p.

125
Johnston M.W., Ferrell O.C. and Darmon R., (2007) “Introduction; “Special Issue on Sales
Force Ethics – Strategic Implications and Leadership Challenges,” Journal of
Personal Selling and sales Management, vol. 27, n 4, fall, 289-290.
Kaipa R, and Tanskanen k. “Vendor Managed Category Management – an outsourcing
Solution in retailing,” Journal of Purchasing and Supply Management, vol 9, n 4, July
165-175.
Kaneshige, Tom (2001), “Avoiding Channel Conflict”, line 56. Retrieve August, 2011
www.line56.com.
Kaufman – Scarborough C and Forsythe S., (2009) “Current Issues in Retailing:
Relationships and Emerging Opportunities,” Journal of Business Research, n 62, 517-
520.
Kim D., Cavusgil S.T. and Calantone R.J., (2006) “Information System Innovations and
Supply Chain Management: Channel Relationships and Firm Performance.” Journal
of the Academy of Marketing Science, vol. 34, n 1, 40-54.
Kothari, G.R. (2008) Research Methodology: Methods and Techniques, (Revised Second
edition), New Delhi: New Age International Limited Publishers.
Kotler, P., & Armstrong G., (2006) Principles of Marketing. New Delhi: Prentice Hall of
India.
Kotler, P. & Keller K. (2006) Marketing Management, New Delhi: Prentice Hall of India.
Kotzab, H., (1999) “Improving Supply Chain Performance by Efficient Consumer Response?
A Critical Comparison of Existing ECR Approaches,” Journal of Business &
Industrial Marketing, vol 14,n 5/6, 364-377.
Kumar N, and Steenkamp J.B., (2007) “Private Label Strategy. How to meet the Store Brand
Challenges.” Boston: Harvard Business School Press.

126
Lambert, D.M. and Stock J.R (1992) Strategic Logistics Management, Boston: Irwin
McGraw Hill.
Lambin J.J. (2000) Marketing Strategy 4th ed, Lisboa: McGraw Hill, 756p.
Louis W.S. and Barton A.W. (1997). The Revolution in Distribution Challenges And
opportunities. USA, Elsevier Science Ltd.
MacDonald, Laura (1999) “Managing Channel Conflicts”, Mortgage Banking. Vol. 60.
Malhotra, N.K. (1999) Marketing Research: An applied Orientation, Upper SaddleRiver, N.J.
Prentice Hall.
Mallen, Bruce (1973), “Functional Spin-off: A key to Anticipating change in Distribution
Structure “Journal of 18-25.
Mallen, B.(1996) “Selecting Channels of Distribution & Logistics Management.” V 26, 5-
21
Mauri, C., (2003) Card Loyalty. “A New Emerging Issue in Grocery Retailing,” Journal of
Retailing and Consumer Services vol. 10 n1, 13-25.
Martinez, J.J. and Polo-Redondo Y., (2001) “Key Variables in the EDI Adoption by Retail
Firms,” Technovation, n 21, 385-394.
Malta, Eskander and Mehta, Neel (2004) “Turning Channel Conflict into Channel
Cooperation.” CCG.XM. February 2001. Accessed August, 12, 2011.
McCammon B.C. Jr., (1970) “Perspective for Distribution Programming,” L.P. Bucklin (ed).
Vertical Marketing Systems, Scott, Foresman & Co., Glenview.
Mcvey Philip (1960). “Are Channels of Distribution What the Textbooks Say:” Journal of
Marketing vol. 24.

127
Morash, Edward A. (1986) “Customer Service, Channel Separation and Transportation
Intermediaries” Journal of Business Logistics, (Oct), 89-107.
Moser, C.A. and Koltong (1971), Survey Methods in Social Investigation, London:
Heinemann 2nd edition, 185-186.
Musso, F. (2010) “Emerging issues in Management,” n.1, Accessed 2011
http://webdepot.gsi.unimib.it/symphonya/Repec/.
Nebo, O.G., (2011) Marketing Channels & Physical Distribution Management. Owerri:
Nation wide Printing & Publishing Co. Ltd. 42-45.
Neves, M.F., Zuurbier, P., & Camponcar, M.C. (2001). “A Model for the distribution
channels planning process,” Journal of Business & Industrial Marketing, 16(7), 518-
539.
Niehm, L.S., Fiore A.M., Jeong M. and Kim H.J., (2007) “Pop-up Retails, Acceptability as
an Innovation Business Strategy and Enhancer of the Consumer Shopping
Experience”, Journal of Shopping Centre Research, vol. 13, n 2.
Nnolim, D.A. (2003) “Organization and Structure of Distribution Channels For Agricultural
Outputs in Nigeria.” Journal of Marketing Management: The enviable millennium
journal.
Norris S., (1994). “Flash points,” Marketing Week, 1 July. 47-48.
Okeafor, U.S. (1998), Physical Distribution and Transportation Management: Port Harcourt:
Obichikel Publisher.
Oliver, Richard and John E, Swan (1989) “Equity and Disconfirmation Perceptions on
Markets and Products Satisfaction” Journal of Consumer Research 16 (December)
372 - 383

128
Onah, J.O and Thomas, M.J. (2004) Marketing Management: Strategies and Cases. Enugu.
Institute for Development Studies, University of Nigeria. Enugu Campus.
Ondrus J. and Pigneur Y.(2006). “Towards a Holistic Analysis of Mobile Payments: A
Multiple Perspectives Approach,” Electronic Commerce Research and Applications,
n 5, 246-257.
Onyeke, J.K. and Nebo, G.N. (2000). Principles of Modern Marketing. Enugu: Precious &
Queen (Nig) Ltd.
Pelton, L.E, Strutton, D. and Lumpkin, J.R (1997) Marketing Channels: A Relationship
Management Approach. Boston: McGraw-Hill, 728.
Pine, B.J., Peppers D. and Rogers M., (1995). “Do You Want To Keep Your Customers
Forever?” Harvard Business Review, March –April.
Porter, M.E (1985) Competitive Advantage: Creating and Sustaining Superior Performance,
New York: The tree Press.
Rangan, V.K., Zoltners, A.A & Becker, R.J (1986)”The Channel Intermediary Selection
Decision:” A Model and an Application Marketing Science, September. 1114-1122.
Raven, Bertram & Kruglanski, W. (1970) Conflict and Power in The Structure of Conflict,
Paul Swingle and New York Academic Press 69-109.
Raymond Corey (1991) Industrial Marketing: Case and Concepts, 4th ed. (Upper Saddle
River, N.J: Prentice Hall, ch. 5.
Rix, P. (2005) Marketing (a practical Approach) (5th ed.) Australia: McGraw – Hill.
Robicheaux, Roberts A and Adel El-Ansary (1975) “A General Model for Understanding
Channel Member Behaviour” Journal of Retailing 52 Winter) 13 – 30.
Rosen bloom, B. (2004) Marketing Channels: a Management View, 7th ed. South – Western
of Thomson.

129
Rosen bloom, B. (2007) “Multi-Channel Strategy in Business – to –Business Markets:
Prospects and Problems,” Industrial Marketing Management, n 36, 4-7.
Rosen bloom, B. and Larsen, T. (20O8) “Wholesalers as Global Marketer, Journal of
Marketing Channels, vol. 15, n 1, 235 – 252.
Rowland, T. M. and Ursula, M (1990) “Managing Hybrid Marketing Systems” Harvard
Business Review, Nov., 1990.
Rowley J. and Slack F., (2003) “Kiosks in Retailing: the Quiet Revolution,” Communication
and Computing Research Centre Papers. Sheffield Hallam University. Accessed
Sept., 2011 http://digitalcommons.shu.acuk/arc.
Shanahan L., (2005) “Bulbs (only) and Other Bring Ideals,” Brandweek, May 9, 2005.
Simon, Herbert (1953), “Notes on the observation and Measurement of Political Power
“Journal of Politics, 15 (November). 500-516.
Stapleton, J. and Thomas, M. (1998) “How to Prepare Marketing Plan.” A Guide to Reaching
the Consumer Market. (Fifth Edition).
Stern, L., El-Ansary, A.I and Coughlan, A.T (1996) Marketing Channels 5th ed., Prentice
Hall, Eaglewood Cliffs, NJ.
Stern L.W. and Adel, I. El-Ansary (1977), Marketing Channel Eaglewood Cliffs, NJ Prentice
Hall.
Stern, L.W and Ronald H. Gorman (1969) Conflict in Distribution Channels. An Exploration
In Distribution Channels Behavioral Dimension. Boston Houghton Mifflin. 156 –
175.
Szulanski G. and Jensen R.J., (2008) “Growing Through Copying: The Negative
Consequences of Innovation on Franchise NetworkGrowth,” Research Policy, vol. 37,
n. 10, December, 2008. 1732-1741.

130
Tate, Jr. C.E., Magginson, L.C., Scott, Jr. C.R and Trueblood, L.R. (1982). “Successful
Business Management, “Third Edition, Tex Business Publications Ltd. Trend
Watching. Being Space $ Brand Spaces, Retrieved, September, 2011.
www.trendwatching.com/trends/brand-spaces.htm.
Thierry, Henk and Agnes M.Koopman-Iwema (1984) “Motivation and Satisfactio” In
Handbook of works and organization Psychology volume 1Eds P.J.D Drenth, Henk
Thierry, P.J. Williams New York 131 – 174.
Tsay A.A. and Agrawal N., (2004) “Modeling Conflict and Coordination in Multi-Channel
Distribution Systems:” A Review, D. Simchi-Levi et al. (edu), Modeling in the E-
Business Era, Kluwer, Boston, 557- 606.
Tse, David k and Peter C. Wilton (1988) “Models of Consumer Satisfaction Formation: An
Extension” Journal Marketing Research 25(May) 204 – 212.
Tuckman, Bruce W. (1978). Conducting Educational Research 2nd (ed. HARCOURT Bruce,
Jovanovich, New York 37.
R.I. Van Hock, “The rediscovery of Postponement: a literature review and directions for
research:” Journal of Operations Management (2001) 161-184 accessed Sept., 2011,
http://www.latec.uff.br/mestrado.
Uduji, J.I. and Nnabuko, J.O. (2011) Marketing: A customer Relationship Management
Approach. Enugu, Southeast Nigeria. New Generation Books.
Ugwuonah, G.E. (2005) Data Analysis and Interpretations: A computer Based Approach,
Enugu. Cheston Limited, Uwani, Enugu.
Waller M, Johnson M.E. and Davis T. (1999) “Vendor-Managed Inventory in the Retail
Supply Chain,” Journal of Business Logistics, vol. 20,n.1.
Wang Y, Bell D.R and Padmanabhan V. (2009) “Manufacturer-Owned Retail Stores,”
Marketing Letters, vol. 20, n. 2, June, 2009, 107

131
Webb K.L., (2002) Managing Channels of Distribution in the Age of Electronic Commerce.
Industrial Marketing Management, vol. 31n 2, 95-102.
Westbrook, Robert A. and Michael D. Reilly (1983) “Value Percept Disparity: An
Alternative to the Disconfirmation of Expectation Theory of Consumer Satisfaction”
256 - 261
Wilemon, David i. (1972) “Power and Negotiation Strategies in Marketing Channels.” The
Southern Journal of Business 7 (February). 12-32.
Wilkinson, I.F., (1974) “Researching the Distribution Channels for Consumer and Industrial
Goods. The Power Dimension “Journal of the Market Research Society. 16, n 10, 12-
32.
Yamane, T. (1964) An Introductory Analysis (3rd edition), New York: Harper & Publishers.
[
Zbaracki M., Ritson M, Levy D., Dutta S. and Bergen M., (2004) “Managerial and Customer
Costs of Price Adjustment:” Review of Economics and statistics, vol. 86, n.2, May,
2004, 514-533.
Nigeria Breweries PLC (2011): Company Profile, Downloaded from official website
http://www.nbplc.com/our-company.html
Guinness Nigeria PLC (2011) Company Profile downloaded from
http://en.wikipedia.org/wiki
Unilever Nigeria PLC (2011) Company history downloaded from official website
http://www.unilever.nigeria.com/about
PZ Cussons Nigeria PLC (2011) Company Profile downloaded from
http://en.wikipedia.org/wiki/pz-cussons

132
APPENDIX 1
LETTER OF INTRODUCTION
Department of Marketing
Faculty of Business Administration
University of Nigeria
Enugu Campus.
Dear Respondent,
I am a graduate student of the Department of Marketing, Faculty of Business Administration,
University of Nigeria, Enugu Campus.
I am undertaking a research study on DISTRIBUTION CHANNELS FOR CONSUMER
GOODS IN SELECTED MANUFACTURING FIRMS IN NIGERIA in order to fulfill the
requirement for a Master of Science Degree in Marketing. This questionnaire is designed to
enable me collect information for the Research.
I would therefore be very grateful if you could complete the attached questionnaire. It is
purely an academic exercise and the information provided will be kept strictly confidential.
Yours faithfully,
Ejeta F.O.
133
APPENDIX 2
QUESTIONNAIRE
Please answer the questions by ticking the appropriate option (√) or state your opinion as
appropriate. Do not tick more than one option.
SECTION A: Bio-data
1. Name of firm (company)………………………………………………………… .
2. Sex: Male Female
3. Age: 20-29 30-39 40- 49 50-59 60–above
4. Qualification::
O’ Level certificate OND or its equivalent
HND/BSC. Professional/Post Graduate
5. What is your current rank/position in the company?
Sales Manager Distribution Manager
Financial Manager Customer Service Manger
Others………………………………………………………..
6.How long have you been working in the company?
1 – 4yrs 5 – 8yrs 8– 12yrs 1 13yrs & above
7.What grade are you in the company?
Senior staff junior staff
SECTION B:
Please tick as many options as you consider appropriate.
8.Which of the following levels of distribution channels is being used by your company?
(a)Zero –level (b) one -level (c) Two -levels
Three –levels Others…………………………………….
9.How does your company deliver products to her customers?
(a) Direct delivery to key account distributors
(b) Delivery through Depots located near the market.
(c) Delivery through a third party arrangement.
Others…………………………………………………………………
10. Which of the following support services does your company provide to her channel
members?
134
(a) Helping to advertise and promote products
(b) Granting of credit facilities
(c) Training of middlemen staff
(d) Inventory control and material handling
Others……………………………………………………………………….
11. Which of the following control measures does your company exercise over her
channel members?
(a) Hire and fire channel members
(b) Determine prices at will
(c) Strictly controls promotional activities
(d) Totally controls sales facilities
Others………………………………………………………………..
SECTION C
Please tick as appropriate and only one can be ticked for each question. This section is a
rating scale with (a) strongly agree (b) Agree (c) Indifference (d) Disagree (e) Strongly
disagree.
A b c d e
12 The length of the distribution channel influences its control by the
firm
13 The degree of control exerted by the firm on its channel depends on
the channel’s length.
14 Direct distribution enables producers’ maximum control of
distribution of their channels.
15 The length of a determines its effectiveness
16 The longer the distribution channel, the more difficult is the control
by the firm.
17 Hybrid channels conflicts affect the channel’s performance
18 Indirect distribution costs more than direct distribution
19 The performance of the channel is highly influenced by frequency of
conflicts in the channel.
20 The more control a firm has on its distribution channels, the more
satisfied it becomes with the channels.

135
21 Conflicts in the channel can be minimized through vertical
integration
22 Firms become more satisfied with their channels as they gain more
control of them.
23 Manufacturers gain more control of the channel through vertical
integration.
24 It is most likely that the less conflicts in the distribution channel, the
better is the channel’s performance.
25 The performance of a channel depends on its length
26 The shorter the channel, the easier and more effective the channel’s
coordination.
27 The higher the number of appointed distributors in a channel, the
better the channel’s performance.
28 As the number of intermediaries in the channel increases, the
channel’s performance also increases.
29 More distributors in the channel will bring about more effectiveness
of the channel.
30 Direct delivery from central warehouse to individual customer is not
as economical as delivery to them through depots located near their
market.
31 The use of central distribution warehouse costs more than using
many warehouses spread across the country.
32 Distributing directly to retailers is more cost saving than distributing
through wholesale middlemen
33 A large channel requires large efforts of coordination of activities and
functions.
34 The higher the number of distributors appointed by the manufacturer,
the more support programs required for effective distribution.
35 Sales agents display more sales drive than company’s sales force.

136
APPENDIX 3
ORAL INTERVIEW GUIDE
1. What type of products do you manufacture?
2. How do you get the goods across to the consumer?
3. How do you receive and respond to customer’s demands?
4. Do you operate your own transport fleet and warehousing?
5. If yes, how do you organize the Transportation of your goods?
6. How do you ensure control of the distribution channels?
7. To what extent has your company adopted e-commerce?
8. In your opinion, which factors could cause conflict in your distribution channel?
9. What steps have you taken to minimize conflicts in the channel?
10. How do you ensure effective coordination of your channel activities?
11 In your opinion, which factors affect performance of the channels?
12 What do you think is the relationship between channel control and satisfaction with the
channel?
13 What is the relationship between the length of a channel and the channel’s performance?
14 How does the number of appointed distributors affect the channel’s performance?
15 What is the relationship between the length of a channel and the control exerted by the
firm?

137
APPENDIX 4
REGRESSION RESULTS FOR TEST OF HYPOTHESIS ONE
Descriptive Statistics
Mean
Std.
Deviation N
the length of the channel significantly affects its control by the firm 4.250
0
.84925 140
the degree of channel’s control depends on the channel’s length 4.085
7
.88542 140
the longer the channel, the more control is required by the firm 3.800
0
1.00502 140
Correlations
the length of the
channel
significantly
affects its
control by the
firm
the degree of
channel’s control
by the firm
depends on the
length of the
channel
the longer the
distribution
channel, the more
control is
required by the
firm
Pearson
Correlat
ion
the length of the channel
significantly affects it control by
the firm
1.000 .909 .818
the degree of channel’s control
by the firm depends on the
length of the channel
.909 1.000 .868
the longer the channel, the more
control is required by the firm
.818 .868 1.000
Sig. (1-
tailed)
the length of the channel
significantly affects its control
by the firm.
. .000 .000

138
The degree of channel’s control
by the firm depends on the
length of the channel.
.000 . .000
.000 .000 .
N The length of the channel
significantly affects its control
by the firm.
140 140 140
The degree of channel’s control
by the firm depends on the
length of the channel.
140 140 140
the longer the channel, the more
control is required by the firm
140 140 140
Model Summaryb
Model R R Square
Adjusted R
Square Std. Error of the Estimate
Durbin-
Watson
1 .911a .829 .827 .35331 .365
a. Predictors: (Constant), the longer the channel , the more control is required by the
firm, the higher the number of appointed distributors the higher the cost of
distribution
b. Dependent Variable: the length of the channel significantly affects the channel’s
control.
ANOVAb
Model
Sum of
Squares df Mean Square F Sig.
1 Regression 83.149 2 41.574 333.053 .000a
Residual 17.101 137 .125
Total 100.250 139

139
a. Predictors: (Constant), the longer the channel, the higher the control required by the
firm, the higher the number of appointed distributors the higher the cost of distribution
b. Dependent Variable: the length of the channel significantly affects the control of the
channel.
Coefficientsa
Model
Unstandardized
Coefficients
Standardized
Coefficients
T Sig. B Std. Error Beta
1 (Constant) .710 .142
4.997 .00
0
the longer the channel,
the
.776 .068 .809 11.368 .00
0
the higher the degree of
control required by the
firm.
.098 .060 .115 1.623 .10
7
a. Dependent Variable: the length of the channel significantly affects the degree of control
required.
Residuals Statisticsa
Minimum Maximum Mean
Std.
Deviation N
Predicted Value 1.5834 5.0762 4.2500 .77343 140
Residual -.58344 .79698 .00000 .35076 140
Std. Predicted
Value
-3.448 1.068 .000 1.000 140
Std. Residual -1.651 2.256 .000 .993 140
a. Dependent Variable: the length of the channel significantly affects its
control.

140
APPENDIX 5
REGRESSION RESULTS FOR HYPOTHESIS TWO
Descriptive Statistics
Mean
Std.
Deviation N
The more control a firm has on its distribution channels, the more
satisfied it becomes with the channels.
3.978
6
.86055 140
Firms become more satisfied with their channels as they gain more
control of them.
4.064
3
.99792 140
Manufacturers gain more control of the channel through vertical
integration
3.964
3
1.06892 140
Correlations
The more control a
firm has on its
distribution channels,
the more satisfied it
becomes with the
existing channel
Firms become more
satisfied with the
channels as they
gain more control
of them
Manufacturers
gain more
control of the
channels
through
vertical
integration
Pearson
Correlati
on
the more control a firm has
on its distribution channels,
the more satisfied it becomes
with the existing channels.
1.000 .923 .899
Firms become more satisfied
with the channels as they
gain more control of them.
.923 1.000 .960

141
Manufacturers gain more
control of the channels
through vertical integration
.899 .960 1.000
Sig. (1-
tailed)
The more control a firm has
on its distribution channels,
the more satisfied it becomes
with the existing channels.
. .000 .000
Firms become more satisfied
with the channels as they
gain more control of them
.000 . .000
Manufacturers gain more
control of the channels
through vertical integration.
.000 .000 .
N The more control a firm has on its distribution channels, the more satisfied it becomes with the
existing channels.
Firms become more satisfied with the channels as they gain more control of them
Manufacturers gain more control of the channels through vertical integration.
140 140 140
140 140 140
140 140 140
Model Summaryb
Model R R Square
Adjusted R
Square
Std. Error of the
Estimate
Durbin-
Watson
1 .924a .854 .852 .33101 .400
a. Predictors: (Constant), Firms become more satisfied with their channels as they
gain more control of them.
b. Dependent Variable: the more control a firm has on its distribution channels, the
more satisfied it becomes with the channels.

142
ANOVAb
Model
Sum of
Squares df Mean Square F Sig.
1 Regression 87.925 2 43.962 401.230 .000a
Residual 15.011 137 .110
Total 102.936 139
a. Predictors: (Constant), Firms become more satisfied with their channels as they
gain more control of them
b. Dependent Variable: the more control a firm has on its distribution channels,
the more satisfied it becomes with them.
Coefficientsa
Model
Unstandardized
Coefficients
Standardized
Coefficients
t Sig. B Std. Error Beta
1 (Constant) .771 .119 6.452 .000
Firms become more satisfied
with their distribution channels
as they gain more control of
them.
Manufacturers gain more control
of the channels through vertical
integration.
.665 .100 .771 6.626 .000
.128 .094 .159 1.364 .175
a. Dependent Variable: The more control a firm has over its distribution channels, the more satisfied it
becomes with them.

143
Residuals Statisticsa
Minimum Maximum Mean
Std.
Deviation N
Predicted Value 1.5630 4.7329 3.9786 .79533 140
Residual -.81267 .64454 .00000 .32862 140
Std. Predicted
Value
-3.037 .948 .000 1.000 140
Std. Residual -2.455 1.947 .000 .993 140
a. Dependent Variable: the more control a firm has on its distribution
channels, the more satisfied it becomes with them.

144
APPENDIX 6
T-TEST RESULT FOR TEST OF HYPOTHESIS THREE
T-Test
One-Sample Statistics
N Mean Std. Deviation
Std. Error
Mean
mean response scores for
data in table 4.8
5 3.8940 .35416 .15839
One-Sample Test
Test Value = 0
T df
Sig. (2-
tailed)
Mean
Difference
95% Confidence Interval
of the Difference
Lower Upper
mean response scores
for data in table 4.8
24.586 4 .000 3.89400 3.4543 4.3337

145
APPENDIX 7
Z-TEST RESULT FOR TEST OF HYPOTHESIS FOUR
NPar Tests
One-Sample Kolmogorov-Smirnov Test
hypo4
N 140
Normal Parametersa,,b Mean 16.3643
Std. Deviation 4.55693
Most Extreme
Differences
Absolute .189
Positive .189
Negative -.175
Kolmogorov-Smirnov Z 1.236
Asymp. Sig. (2-tailed) .000
a. Test distribution is Normal.
b. Calculated from data.

146
APPENDIX 8
Z-TEST RESULT FOR TEST OF HYPOTHESIS FIVE
NPar Tests
One-Sample Kolmogorov-Smirnov Test
there is always
transport to deliver
goods on demand
by customers
N 420
Normal Parametersa,,b Mean 3.2300
Std. Deviation 1.17808
Most Extreme
Differences
Absolute .326
Positive .172
Negative -.326
Kolmogorov-Smirnov Z 1.530
Asymp. Sig. (2-tailed) .190
a. Test distribution is Normal.
b. Calculated from data.