title page usmanu danfodiyo university, sokoto
TRANSCRIPT

i
TITLE PAGE USMANU DANFODIYO UNIVERSITY, SOKOTO
(POSTGRADUATE SCHOOL)
PHYTOCHEMICAL SCREENING AND ANTIBACTERIAL STUDIES OF Euphorbia balsamifera LEAVES (Aguwa)
A DISSERTATION
SUBMITTED TO THE POSTGRADUATE SCHOOL,
USMANU DANFODIYO UNIVERSITY, SOKOTO, NIGERIA
IN PARTIAL FULFILMENT OF THE REQUIREMENTS FOR THE AWARD OF
THE DEGREE OF MASTER OF SCIENCE IN APPLIED CHEMISTRY
BY
BELLO LYDIA BASHIR 09211312008
APRIL, 2015.

ii
DEDICATION
This dissertation is dedicated to my late husband Femi Bello Bashir. May your soul
rest in peace, amen.

iii
CERTIFICATION
This dissertation by Bello Lydia Bashir has met the requirements for the award of
the degree of masters of Science in Applied Chemistry of the Usmanu Danfodiyo
University, Sokoto and is approved for its contribution to knowledge.
________________ Prof.S.M.Dangoggo (Major Supervisor) Date ______________ Dr.K.J.Umar (Co-Supervisor I) Date _______________ Prof.M.J.Ladan (Co-Supervisor II) Date
External Examiner Date _______________ Date H.O.D

iv
ACKNOWLEDGEMENTS
I thank God for the grace and opportunity given to me to pursue this work
and accomplish it successfully. I wish to express my sincere gratitude and
appreciation to my Supervisors Prof. S. M. Dangoggo, Dr K. J. Umar and Prof. M.
J. Ladan, for the academic and moral advice I received from them.
My special regards goes to the Head of Department Dr M. U. Dabai who has
been a true shepherd in the course of my studies. To the entire academic Staff of
the Department of Pure and Applied Chemistry, more especially; Prof. A. A. Zuru,
Prof. L. G. Hassan, Prof. U. A. Birnin Yauri, Dr. P. O. Ikeh Dr. A. I. Tsafe, Dr. A. B.
Muhammad, for the academic training given to me may God bless you all
I acknowledge my parents Deacon and Mrs S.A. Onifade for their supports
and advice; to my Siblings Funmi, Nike, Seyi, Femi and Wumi, I’m proud of you all
for your supports and encouragement that have given me serious inspiration all
along and my daughter Triumph you make me whole.
The following personalites cannot be left out for their immense contribution
in my academic pursuit Rev and Mrs J.A. Oyedepo and members of First Baptist
Church Birnin Kebbi for their prayer and contribution. God bless you all.
I cannot end this acknowledgement without mentioning my friends,
Colleagues, Course mates, well wishers such as Faith, Joshua, Musa, Mary, Bola,
Charity, Folake, Bunmi, Mulikat, Sola, my Colleagues at Old Prison Birnin-Kebbi,
Bridget, Aisha, Zainab, Hauwa, Teni, in- charge DCP Aliyu M. Bukar and others
whom their friendship, supports and encouragements have given me serious
inspiration. May God bless you all.

v
TABLE OF CONTENTS
TITLE PAGE ............................................................................................................. i
DEDICATION ........................................................................................................... ii
CERTIFICATION .................................................................................................... iii
ACKNOWLEDGEMENTS ....................................................................................... iv
TABLE OF CONTENTS ........................................................................................... v
LIST OF FIGURES................................................................................................ viii
LIST OF TABLES .................................................................................................... ix
LIST OF PLATE ....................................................................................................... x
ABSTRACT ............................................................................................................. xi
CHAPTER ONE
INTRODUCTION AND LITERATURE REVIEW ....................................................... 1
1.1 Introduction ................................................................................................... 1
1.2 LITERATURE REVIEW ................................................................................. 2
1.2.1 Description of Plants ..................................................................................... 2
1.2.2 Medicinal Uses of Euphorbia balsamifera ..................................................... 4
1.4 Phytochemicals ............................................................................................. 6
1.4.1 Tannins ......................................................................................................... 7
1.4.2 Saponins ....................................................................................................... 9
1.4.3 Steroids ....................................................................................................... 10
1.4.4 Flavonoids ................................................................................................... 12
1.4.5 Cardiac glycosides ...................................................................................... 14
1.4.6 Anthraquinones ........................................................................................... 16
1.4.7 Alkaloids ...................................................................................................... 17
1.4.8 Terpenoids .................................................................................................. 20
1.5 Soxhlet Extraction ....................................................................................... 24
1.6 Thin Layer Chromatography ........................................................................ 25
1.7 Column Chromatography ............................................................................ 25
1.8 Ultraviolet Spectroscopy .............................................................................. 26
1.9 Infrared (IR) Spectroscopy .......................................................................... 26

vi
1.10 GC – MS (Gas Chromatography – Mass Spectroscopy) ............................. 27
1.11 Justification ................................................................................................. 28
1.12 Aim and Objectives of the work ................................................................... 28
CHAPTER TWO
MATERIALS AND METHODS ............................................................................... 30
2.1 Plant Materials Collection and Identification ................................................ 30
2.1.1 Instruments.................................................................................................. 30
2.1.2 Chemicals ................................................................................................... 31
2.1.3 Preparation of Reagents ............................................................................. 31
2.2 Processing of Plant Samples ...................................................................... 33
2.3 Extraction of Plant Materials ........................................................................ 34
2.3.1 Ethanol Extracts .......................................................................................... 34
2.4 Melting Point................................................................................................ 34
2.5 Phytochemical Screening ............................................................................ 35
2.5.1 Test for Alkaloids ......................................................................................... 35
2.5.2 Test for Saponins ........................................................................................ 35
2.5.3 Test for Steroids .......................................................................................... 35
2.5.4 Test for Anthraquinones .............................................................................. 36
2 .5.5 Test for Flavonoids ...................................................................................... 36
2.5.6 Test for Tannins .......................................................................................... 37
2.5.7 Test for Cardiac Glycosides ........................................................................ 37
2.5.8 Test for Volatile Oils .................................................................................... 37
2.6 Quantitative Phytochemical Analysis ........................................................... 37
2.6.1 Determination of Total Alkaloids .................................................................. 37
2.6.2 Determination of Total Tannins ................................................................... 38
2.6.3 Determination of Total Phenolic Compounds .............................................. 39
2.6.4 Determination of Total Flavonoids ............................................................... 39
2.6.5 Determination of Total Saponins ................................................................. 40
2.7 Fractionation of Ethanol Extract .................................................................. 40
2.8 Tests for Antibacterial Activity ..................................................................... 41
2.8.1 Antibacterial Assay ...................................................................................... 41

vii
2.8.2 Minimum Inhibition Concentration (MIC) ..................................................... 42
2.8.3 Minimum Bactericidal Concentration (MBC) ................................................ 42
2.9 Thin Layer Chromatography ........................................................................ 42
2.10 Column Chromatography ............................................................................ 43
2.11 Isolation of Bioactive Compounds Using Preparative TLC .......................... 43
2.12 Ultra-violet (UV) ........................................................................................... 44
2.13 Infrared Spectroscopy IR ............................................................................. 45
2.14 GC-MS (Gas Chromatography-Mass Spectroscopy) .................................. 45
CHAPTER THREE
RESULTS AND DISCUSSION ............................................................................... 46
3.1 Results ........................................................................................................ 46
3.1.1 Percentage Yields of the Plant .................................................................... 46
3.1.2 Phytochemical Screening ............................................................................ 47
3.1.3 Melting point ................................................................................................ 47
3.1.4 Quantitative Estimation of Phytochemical Contents 48
3.1.5 The Yields of Fractionated Components 49
3.1.6 The Antibacterial Activities .......................................................................... 50
3.1.6.2 Minimum Bactericidal Concentration (MBC) .............................................. 51
3.1.7 Thin Layer Chromatography of Chloroform Fraction of Leaves ................... 52
3.1.8 Results of Ultra Violet/Visible Analysis 53
3.1.9 Infra-red Spectroscopy Analysis .................................................................. 54
3.1.10 GC-MS Analysis .......................................................................................... 55
3.2 Discussion ................................................................................................... 56
CHAPTER FOUR
CONCLUSIONS AND RECOMMENDATIONS ...................................................... 62
4.1 Conclusions ................................................................................................. 62
4.2 Recommendations ...................................................................................... 63
REFERENCES ............................................................................................ 64
APPENDICES ............................................................................................. 70

viii
LIST OF FIGURES
Figure 1.1 Structure of penta-galloyl glucose ...........................................................7
Figure 1.2- Catechin–(4-alpha-8) catechin ...............................................................8
Figure 1.3: Tetracyclic triterpenoids skeleton of saponin (R = sugar component). ...9
Figure 1.4: Pentacyclic triterpenoids skeleton of saponins ..................................... 10
Figure 1.5 Stigmasterol (Plant).............................................................................. 11
Figure 1.6 Cholesterol (Animals) .......................................................................... 11
Figure 1.7 Ergosterol (Fungus) .............................................................................. 12
Figure1.8: Skeleton structure of flavonoids ............................................................ 13
Figure1.9: Skeleton structure of isoflavonoids ....................................................... 13
Figure: 1.10: Skeleton structures of neoflavonoids ................................................ 14
Figure 1.11 Cardiac glycoside (R=Glycone) ........................................................... 15
Figure 1.12 (an S-Glycoside) ................................................................................. 15
Figure1.13 Anthracenedione .................................................................................. 16
Figure 1.14: Structure of Ephedrine ....................................................................... 18
Figure1.15 Structure of hygrine .............................................................................. 18
Figure 1.16 Structure of coniine ............................................................................. 19
Figure 1.17 Structure of nicotine ............................................................................ 19
Figure 1.18: Structure of Quinine ........................................................................... 19
Figure 1.19 Structure of papaverine ....................................................................... 20
Figure 1.20 Structure of gramine............................................................................ 20
Figure 1.21 Structure of limonene .......................................................................... 21
Figure 1.22 Structure of curcumenenene ............................................................... 22
Figure 1.24 Ceroplastol .......................................................................................... 23
Figure1.25 Structure of Gonane ............................................................................ 23
Figure 1.26 Structure of lycopene . ........................................................................ 24
Figure 3.1 6H-Indolo [3, 2, 1-de][1,5]naphthyridin-6-one ..................................... 61

ix
LIST OF TABLES
Table 2.1 List of instruments .............................................................................. 30
Table 3.1: Percentage Yields of the Plant ........................................................... 46
Table 3.2: Preliminary Phytochemical Screening of Ethanolic Extracts of
Euphorbia balsamifera leaves, stem and root .................................. 47
Table 3.3: Quantitative Estimation of` Phytochemical Contents of the
Chloroform Extract of the Leaves of Euphorbia balsamifera .............. 48
Table 3.4: Results of the Yields of Fractionated Components using various
Solvents ............................................................................................. 49
Table 3.5: Zone of Inhibition Results (mm) .......................................................... 50
Table 3.6 Minimum Inhibition Concentration of Tested Organism ...................... 51
Table 3.7 Minimum Bactericidal Concentration of Tested Organism .................. 51
Table 3.8 TLC of Chloroform Fraction ................................................................ 52
Table 3.9: Ultra Violet /Visible Spectroscopy Analysis Results ........................... 53
Table 3.10: Infra-red Spectroscopy Analysis Results ............................................ 54
Table 3.11: GC-MS Analysis Results .................................................................... 55

x
LIST OF PLATE
Plate1.1 a photograph showing section of Euphorbia balsamifera plant ..................3

xi
ABSTRACT
Euphorbia balsamifera plant belongs to the family of Euphorbiaceae. Leaves, stems and roots of Euphorbia balsamifera were extracted using ethanol and the extracts were screened for phytochemical components. The phytochemical results indicated that the plant contained tannins, flavonoids, saponins, steroids, glycosides, terpenoids, alkaloids, and anthraquinones. Ethanol extract of leaves and its fractions were tested for antibacterial activity using agar well diffusion method and were found to show inhibitory activity against Escherichia coli, Staphylococcus aureus, Micrococcus species and Pseudomonas aeruginosa. The sensitivity test results showed highest activity of 25mm zone of inhibition at 120mg/ml of chloroform fraction against Micrococcus species. The MIC and MBC of the chloroform fraction were 5mg/ml and 7mg/ml respectively. The TLC of chloroform fraction of leaves showed six components of different Rf value using benzene: ethyl acetate (3:1) solvent system. The chloroform fraction was further subjected to column chromatography, after which preparative TLC was carried out on the fraction obtained from column. The isolated compound was subjected to IR, UV and GC-MS Spectroscopy which revealed the presence of (6H-Indolo[3,2,1-de][1,5]naphthyridin-6-one) and fatty acid in the isolated compound. Therefore the bioactive of Euphorbia balsamifera leaves can be served as a lead for the development of new pharmaceutical therapeutic needs.

1
CHAPTER ONE
INTRODUCTION AND LITERATURE REVIEW
1.1 Introduction
Plants have long served mankind as sources of food, shelter and medical
agents. The medicinal plants have been used for many years in daily life to treat
diseases all over the world (Ates and Erzdogrul, 2003). According to reports of the
World Health Organisation, 80% of the world’s population relies mainly on
traditional therapies for their primary health care (WHO, 1993) because of better
cultural acceptability, fewer side effects and a steady rise in antibiotic resistance of
bacteria due to indiscriminate use of commercial drugs (Ahmed et al., 1998) and
these urgently calls for the discovery of alternative therapeutic agents by using
medicinal plants, which involve the use of plant extracts or their active substance.
Secondary plant metabolites (phytochemicals) have been extensively investigated
as sources of medicinal agents (Krishnaraju et al., 2005). The medicinal value of
plants lies in some chemical substances that produce definite physiological action
on the human body and the most important of these bioactive compounds of plants
are alkaloids, flavonoids, tannins and phenolic compounds, they have defence
mechanism and protection from various diseases (Chidambara et al., 2003).
Knowledge of the chemical constituents of plants is very important not only for the
discovery of drugs and other therapeutics agents but also in disclosing new
sources of such economic materials as tannins, oils, gums and precursors for the
synthesis of complex chemical substances (Mojab et al., 2003).

2
1.2 LITERATURE REVIEW
1.2.1 Description of Plants
Euphorbia balsamifera belongs to the family Euphorbiaceae commonly
known as balsam spurge in English and espurge in French; it is native to all
Canary Islands and is also present in West Africa including Senegal and Nigeria
popularly known as aguwa among Hausa in Nigeria (Burkill, 1985). The botanical
name Euphorbia derives from Euphorbous, the Greek Physician of king Juda II of
Numidia Botanist and Taxonomist Carl Linnaeus assigned the name Euphorbia to
the entire genus in honour of the physician (Nancy Dele, 1986). Euphorbia is
having almost 2000 species among which are Euphorbia albomarginata, Euphorbia
amygdaloides, Euphorbia decidue, Euphorbia elastica etc. (Bruyns et al., 2006)
These plants are found in dense community in rocky places and on less
mobile sand dune (Bruyns et al., 2006). The plants are annual or perennial herbs,
woody shrubs with caustic, poisonous milky sap latex. Euphorbia balsamifera plant
is thick, short and hardly rising above the ground to small trees up to five meter tall.
The plant is commonly grown as a hedge and field boundary marker in the
northern part of Nigeria. It is easily raised by cutting and is said to be one of the
best hedge plants for low rainfall area. The plant’s stem is thick, fleshy, semi-
succulent, spineless with bases and becoming very thick at minimum injure. It
gives out pungent smelling white latex. The leaves are long oval shaped green to
glaucous cluster at branches tip; the dioecious leave may be opposite or alternate.
The root is fine or thick and fleshy or tuberous. Euphorbia flower are tiny and the

3
collection of many flowers may be shaped and arranged to appear collectively as a
single individual flower. Majority of species are monoecious (bearing male and
female flower on the same plant) although some are dioecious with male and
female flower occurring on different plants. The fruits are three compartment
capsules, sometime fleshly but almost ripening to a woody container that then
splits open, the seed are oval or spherical in shape (Carter and Smith 1987).
Plate1.1 a photograph showing section of Euphorbia balsamifera plant

4
1.2.2 Medicinal Uses of Euphorbia balsamifera
Euphorbia balsamifera is used as a traditional antalgic in the treatment of
acute dental pulpits and as anti diabetic (Rau et al., 2006).
The latex has an anti eczema property and it is also used as antidotes for
venomous (snake) bites (Burkill, 1985). It promotes fertility and milk production in
cattle (Lin et al., 1983). The leaves and latex are used for insect bites and
treatment of erysipelas, cough, bronchial paroxysmal asthma, hay fever and
catarrh (Gill, 1992).The leaves are used in treating skin irritation. It promotes
healing in cases of fever by facilitating the production of platelets. It’s also known
for its antihelmintic properties and can be used to get rid of worms and other
parasitic organism (Burkill, 1985). Leaf also boost breast milk production in
lactating mothers and is used in treatment of venereal disease like gonorrhea,
impotence, premature ejaculation and other sexual disorders (Burkill, 1985).
The root of Euphorbia balsamifera can be made in paste and used for
healing stomach pain; it possesses antiviral properties and used in the treatment of
dysentery and diarrhea. In Chinese medicine, the herb is used as a diuretic and
laxative, it’s believed to expel water from the body and thus reduce edema and
inflammation on lymph nodes (Burkill, 1985). Euphorbia was reported to have anti-
bacterial activities against pathogenic strain of gram-positive and gram-negative
bacteria (Natarajan et al., 2005). Its ethanolic extract has anti-inflammatory
properties (Kamba and Hassan 2010).

5
1.3 Antimicrobial Agents
Plant medicines are the most widely used medicines in the world today.
The pharmaceutical industries have come to consider traditional medicine as a
source for identification of bioactive agents that can be used in the preparation of
synthetic medicine (Robbers et al., 1996). Many commercially proven drugs used
in modern medicine, were initially used in crude form in traditional healing
practices, or for other purposes that suggested potentially useful biological
activities. The primary benefits of using plant derived medicines are that, they are
relatively safer than synthetic alternatives, offering profound therapeutic benefits
and more affordable treatment (Donal, 2000).
Antimicrobial agents include naturally occurring antibiotic, synthetic
derivatives of naturally occurring antibiotic and chemical antimicrobial compounds.
Generally however the term antibiotic are used to described antimicrobial agents
(usually antibacteria) that can be used to combat infection (chemotherapy) and the
fundamental principle of chemotherapy, its collective toxicity (Cheesbrough, 2002).
Antibacteria is a drug that kills or slows down the growth of bacteria, it was labelled
magic bullet drugs which targeted disease without harming the host. Conventional
antibiotic are not effective in viral, fungal and other non-bacterial infection and
individual antibiotics can be categorized based on their target specific narrow-
spectrum antibiotics target particular types of bacteria such as gram-negative or
gram-positive bacteria, while wide-spectrum antibiotic affect a larger range of
bacteria. (www.en.wikipedia.org/wiki/antibiotic retrieved on 7/4/2006).

6
The effectiveness of individual antibiotics varies with the location of the
infection, the ability of the antibiotic to reach the side of infection and the ability of
bacteria to resist or inactivate the antibiotic. Some antibiotics usually kill the
bacteria (bactericidal) whereas others merely prevent the bacteria from multiplying
(bacteriostactics) so that the host immune system can overcome them
(www.en.wikipedia.org/wiki/antibiotic retrieved on 7/4/2006
1.4 Phytochemicals
Phytochemicals are chemical compounds produced by plants that have
pharmacological importance to human health’s. It is the studies of plant physiology
by determine the chemical structure of different plants constituents. It is concerned
with the enormous variety of organic substance that is elaborated accumulated by
plants. They are divided into two groups, namely primary and secondary
metabolites (Donal, 2000).
(a) Primary metabolites: Primary metabolites are organic compounds that are
directly involved in the normal growth, development or reproduction of organism,
their absences may result in immediate death of the organism e.g. proteins, fats,
etc
(b) Secondary metabolites: Secondary metabolites are synthesized during
secondary metabolism of plants, they work as biocatalysts they are the basic
source for the establishment of several pharmaceutical industries since they have
enormous medicinal properties many of these are known to provide protection

7
against insect attacks and plant diseases Examples are: tannins, saponins,
flavonoids, alkaloids and phenolic compounds (Harborne, 1999).
1.4.1 Tannins
Tannins are defined as substances of plant origin which because of their
ability to cross-link with protein are capable of transforming raw animal skin into
leather (Zaki, 2000). They are non-crystallizable complex compounds, which
normally form colloidal solution in water. They are usually of high molecular weight
(1000 - 5000) with the ability to react with protein forming stable water insoluble
copolymers. They are located in the vacuoles or surface wall of the plants. Tannins
are usually divided into hydrolysable and condensed tannins (Pro anthocyanidins)
(Calvi et al., 1995).
(a) Hydrolysable tannins: Hydrolysable tannins are esters of gallic acid.
Glycosides of these esters are hydrolyzed upon heating with dilute acid, giving
glucose and gallic acid, gallitannins or ellagitannins (Zaki, 2000). A structural unit
of hydrolysable tannin is shown in figure 1.1 (Zaki, 2000).
CH2OR
H
OR
H
H
RO
OR
OR
H
O
Figure 1.1 Structure of penta-galloyl glucose

8
(b) Condensed tannins: Condensed tannins are polymers derived from various
flavonoids. They do not hydrolyze on heating with dilute acids but oxidize and
polymerize giving insoluble red amorphous precipitate (El-Olemy, et al., 1994).
They are polymers of 2 to 50 (or more) flavonoid units that are joined by carbon
bonds. A structural unit of condensed tannin is shown in figure 1.2 (Zaki, 2000).
O
O
OH
OH
OH
OHOH
OH
OH
OH
OH
Figure 1.2- Catechin–(4-alpha-8) catechin
Uses
Tannins play an active anti nutritional role in the body where they affect the
gastrointestinal tract, interfere with the absorption of iron and with a possible
carcinogenic effect (Ademoroti, 1996). It also shows potential antiviral, antibacterial
and anti parasitic effects (Calvi et al., 1995). It is very important ingredient in the
process of tannin leather e.g. oak bark is a source of tannery tannins.

9
1.4.2 Saponins
Saponins are secondary plant metabolites that occur in a wide range of
plant species. They are group of steroidal glycosides that has the properties of
forming foam in water like soap (Finar, 1975). As glycosides they are hydrolyzed
by acid to give an aglycone (sapogenin) and various sugar related uranic acid
(Figen, 2005).
Classification of Saponins
Saponins are classified into two major groups; steroidal glycoside,
commonly called tetracylic triterpenoids and triterpenoid saponins called
pentacyclic triterpenoid. Saponins have bitter acid taste and drugs containing them
are usually sternutatory and irritating to the mucous membrane of eye and nose.
All saponins have ability to cause haemolysis of red blood corpuscles or cells
(RBC) and destroy them (Trease & Evan, 1989).
O
R
O
Figure 1.3: Tetracyclic triterpenoids skeleton of saponin (R = sugar component).

10
O
R
Figure 1.4: Pentacyclic triterpenoids skeleton of saponins
Uses of saponins
Saponins were reported to have many health benefits including effects on
blood cholesterol levels, cancer, bone and stimulation of the immune system
(Nassiri and Hosseinzedeh, 2008).
1.4.3 Steroids
The term steroid applies to compounds containing a hydrogenated
cyclopentanophenanthrene carbon skeleton. Most steroids are alcohols, and
accordingly are named as sterols. Important examples include cholesterol,
ergosterol, estradiol, and stigmasterol. `As you can see from their structures, most
possess the same ring skeleton but vary considerably in their peripheral structural
features, stereochemistry, and in the degree of ring unsaturation. Sterols are
widely distributed in plants, fungus and animals. Many are of vital importance to
animal physiology such as cholesterol, the bile acids, vitamin D, sex hormones,
and corticoid hormones. Many are medicine, such as cardiac glycosides,
hormones, and steroidal antibiotics. Examples of steroids include the dietary fat

11
cholesterol, the sex hormones; estradiol, testosterone, and the anti-inflammatory
drug, dexamethasone (Dussourd, 2000).
Classification of Steroids
Steroids are classified in to three based on their source as follows:-
(a) Animal steroids, example insect steroids: such as ecdysteroid, vertebrate
steroids: such as steroidal hormones (e.g. sex steroids like progesterone,
testosterone, estrone, cortisone and androsterone) and cholesterone.
(b) Plant steroids, example stigmasterols.
(c) Fungus steroids or mycosteroids, example ergosteroids (Dusssourd,
2000).
C2H
5
HO
Figure 1.5 Stigmasterol (Plant)
H
OH
H
C8H
17
Figure 1.6 Cholesterol (Animals)

12
CH3
OH
CH3
CH3CH
3 CH3CH
3
Figure 1.7 Ergosterol (Fungus)
Uses of steroids
Plants and fungus steroids are used in pharmaceuticals as medicine especially
Vitamin D2 formed by ultraviolet radiation of ergosterol from yeast is used to
regulate heart action. Some steroids are naturally occurring in plants and animals,
as hormones to regulate and develop sex and reproductions (Dussourd, 2000). β-
sitosterol reduces carcinogen-induced cancer of the colon. It shows anti-
inflammatory, anti-pyretic, antiarthritic, anti-ulcer, insulin releasing and oestrogenic
effects and inhibition of spermatogenesis. β-sitosterol is mainly known and used for
its cholesterol lowering property (Arjun et al., 2010). But studies have shown that
the phytochemicals may have other health benefits: such as easing symptoms of
prostatic enlargement, reducing risk of cancer and prevention of oxidative damage
through its antioxidant activity (Dussourd, 2000).
1.4.4 Flavonoids
Flavonoids are the largest group of naturally occurring phenols and occur in
the plant both in the free state and as glycoside. They consist of 15 carbon atoms

13
arranged in C6 – C3 – C6 orders. They are phenolic compounds consisting of two
benzene rings linked together through a heterocyclic pyrol-ring (Okeke, 2005).
Flavonoids are more abundant in leaves and flowers; they are responsible for
colour appearance in the petal of flower and leaves of plants (Herbone, 1984).
Types of flavonoids
They are categorized into three major classes depending on the position of
the linkage of the aromatic ring to the benzopyrans (chromano) moiety; 1.the
flavonoids (2-phenylbenzopyrans) 2.isoflavonoids (3-benzopyrans) and
3.neoflavonoids (4-benzopyrans) 3. These groups usually share a common
chalcone precursor, and therefore are biogenetically and structurally related.
(Erich, 2006)
O
Figure1.8: Skeleton structure of flavonoids
O
Figure1.9: Skeleton structure of isoflavonoids

14
O
Figure: 1.10: Skeleton structures of neoflavonoids
Uses of flavonoids
Flavonoids prevent cancers and cardiovascular diseases. Although
physiological evidence is not yet establishedthe beneficial effects of fruits,
vegetables and tea or even red wine have been attributed to flavonoid compounds.
Flavonoids are known for their antioxidant activity in vitro and they also protect
plant from attacks by microbes, fungi and insects (Njoku and Akumefula, 2007).
1.4.5 Cardiac glycosides
Cardiac glycosides are plant steroids which occur as glycosides, they are
colourless non-volatile crystalline and mostly bitter tasting solid compounds.
Chemically, glycosides are group of organic compound which can be resolved by
hydrolysis into sugar component (glycone) and other organic substances known as
aglycones. They have the properties of stimulating heart muscles and are
sometimes referred to as the cardiac active or cardiotonic glycosides (Zaki, 2000).
Cardiac glycosides are used as diuretic and heart tonics. Cardiac glycosides are
found in seeds, leaves, stem, roots or barks of plant of wide geographical
distribution in which tobacco plant is one of them (Conn, 1981).
15
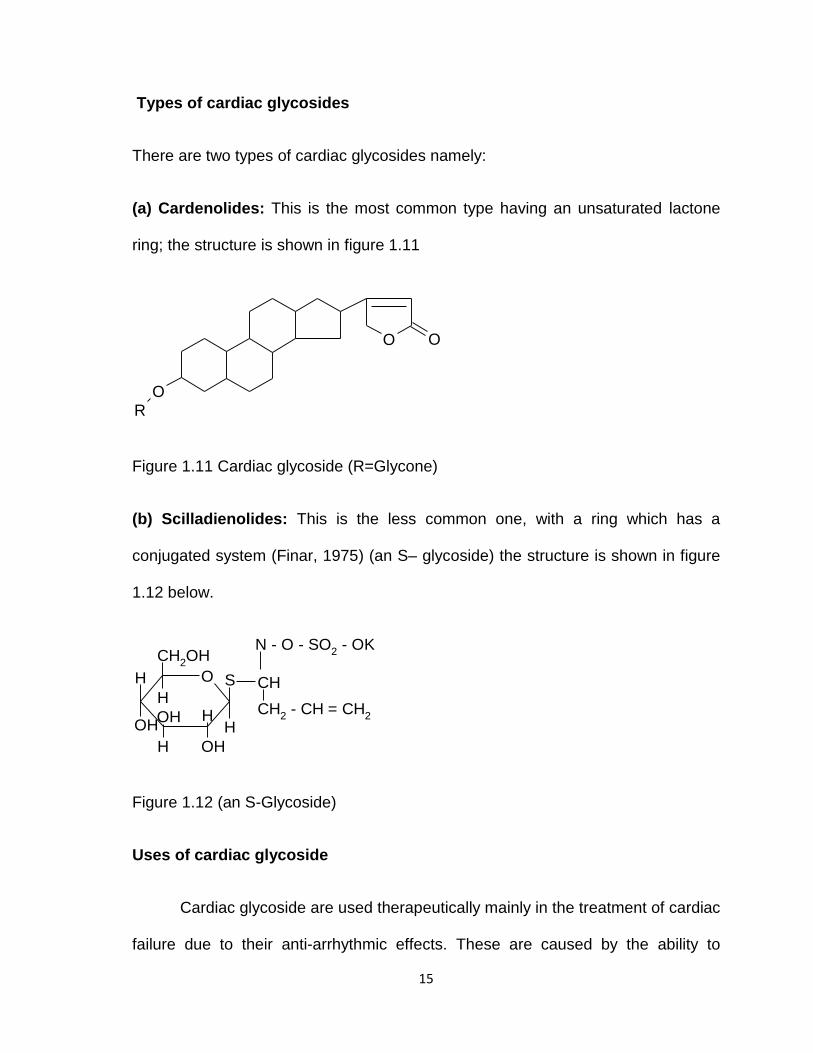
Types of cardiac glycosides
There are two types of cardiac glycosides namely:
(a) Cardenolides: This is the most common type having an unsaturated lactone
ring; the structure is shown in figure 1.11
O
OR
O
Figure 1.11 Cardiac glycoside (R=Glycone)
(b) Scilladienolides: This is the less common one, with a ring which has a
conjugated system (Finar, 1975) (an S– glycoside) the structure is shown in figure
1.12 below.
O
CH2OH
H
H
OH
H
OH
OH
HH
S CH
CH2 - CH = CH
2
N - O - SO2 - OK
Figure 1.12 (an S-Glycoside)
Uses of cardiac glycoside
Cardiac glycoside are used therapeutically mainly in the treatment of cardiac
failure due to their anti-arrhythmic effects. These are caused by the ability to

16
increase cardiac output by increasing force of contraction by prolonging the plateau
phase of cardiac depolarization thus slowing ventricular filling (Harbone, 1984).
1.4.6 Anthraquinones
Anthraquinones are tricyclic in structure, having weak reducing properties
which may account for the use of anthranols and anthrones as antiseptic in certain
skin diseases (Balbaa, 1976). They are one of the four major groups of quinones
that have phenolic properties. They may occur either in combined form with sugar
as glycoside or in a colourless dimeric quinol form (Harbone, 1984).
Anthraquinones occurred most frequently in plants. Emodin is an example of
anthraquinones that is widely distributed in many plant families the structure is
shown in figure 1.13 below (Harbone, 1984).
O
O
Figure1.13 Anthracenedione
Toxicity of Anthraquinones
Anthraquinones are toxic as other groups of glycosides like saponins and
cardiac glycosides. It damages the red blood cells, destroys the heart muscles, and
increases the blood pressure and also leads to sudden death (Harbone, 1984).

17
Uses of Anthraquinones
They are used in the production of dye such as alizarin. They are used as
catalysts in the production of chemical pulp, repellant on seeds and also used as a
laxative (Witte 1993)
1.4.7 Alkaloids
Alkaloids are organic nitrogenous compounds that have complex molecular
structure and show significant pharmacological activity. They have bitter taste and
most of them are basic in nature and contain nitrogen in heterocyclic ring (Bahl and
Bahl, 1980).
Alkaloids occur naturally in seeds, root, leaves and barks of plants, they
generally occur as salts of various plant acids like acetic oxalic acid etc. (Finar,
1975). They are colourless, crystalline, non-volatile solid which are insoluble in
water but soluble in ethanol, ether and chloroform. Some are liquid which are
soluble in water e.g. conine and nicotine, a few are coloured e.g. berberine is
yellow (Finar, 1975).
Classification of Alkaloids
Alkaloids have been classified based on source or origin, nucleus present,
structures, pharmacological activities and chemical nature. The most chemically
satisfactory way to classify alkaloids is according to the nature of the nucleus
present in the molecules. Some of the types are:

18
(a) Phenyl ethyl amine group e.g. Ephedrine, many compounds of this group are
naturally occurred, their outstanding physiological action is to increase the blood
pressure hence they are often referred to as the pressure drug. Ephedra is one of
the most important drugs in action similar to that of adrenaline and can be taken
orally. It is used in treatment of hay fever and asthma. The molecular formular is
C10H15N (Finar, 1975) the structure is shown in Figure 1.14.
CH3
N
CH3
CH3
Figure 1.14: Structure of Ephedrine
(b) Pyrrolidine group e.g. Hygrine is one of the coca alkaloids, its reaction shows
the presence of keto group and tertiary nitrogen atom, the structure is shown in
Figure1.15
N CH2 COCH
3
CH3
Figure1.15 Structure of hygrine
(c) Pyridine and piperidine group e.g. Coniine, it is the first alkaloid to be
synthesized; the structure is shown in Figure 1.16

19
N
H
Figure 1.16 Structure of coniine
(d) Pyrrolidine – pyridine group: Many alkaloids have been isolated from
the tobacco leaf e.g. nicotine (C10H14N2). It is best known and most widely
distributed of the tobacco alkaloids, it occurs naturally. The structure is shown in
Figure 1.17.
N
CH3
Figure 1.17 Structure of nicotine
(e) Quinoline group e.g. Quinine: Quinine (C2OH24N2O2) is used as anti malaria,
the structure is shown in Figure 1.18 below
OHN
CH3O
Figure 1.18: Structure of Quinine

20
(f) Isoquinoline e.g. papaverine. Isoquinoline is a type of alkaloids that have been
isolated from opium e.g. papaverine, the structure is shown in Figure 1.19 below.
N
CH2
CH3O
CH3O
CH3O
CH3O
Figure 1.19 Structure of papaverine
(g) Indole group e.g. Gramine (C11H14N2) has been found in barley mutant. It
raises the blood pressure in dogs when administered in small doses.The structure
is shown in Figure 1.20 below.
N
CH2N(CH
3)2
H
Figure 1.20 Structure of gramine
1.4.8 Terpenoids
Terpenoids are groups of organic natural product compounds which occur
widely in both plants and animals. They can be found in nature either in their free
forms, or conjugated with one or more sugar units through the hydroxyl group at

21
the C-3 (Morrison and Boyd, 2007). They are produced by the cyclization of
squalene epoxide in different arrangements. It comprises framework of five-carbon
isoprene units. The isoprene unit is considered as one of nature’s favourite building
block in terpene’s biosynthesis. The isoprene unit is 2-methylbuta-1, 3-diene.
Isoprene units can easily be recognized by ‘’ head- to- tail’’ bonds, as well as
supplementary bonds. Isoprenes are compounds which appear to be formed by the
polymerisation of multiple unit of isoprene (Morrison and Boyd, 2007).
Classification of Terpenes
Terpenoids can be classified based on the number of isoprene units (methybuta -1,
3 – diene) incorporated in the basic molecular skelton (Morrison and Boyd, 2007).
(a) Monoterpenes
They are 10 carbon compounds derived by assembly of 2 isoprene units. Terpenes
have been known for several centuries as components of fragrant oil obtain from
leaves, flowers and fruits. The structure is shown in Figure 1.21 below.
Figure 1.21 Structure of limonene

22
(b) Sesquiterpenes
They are 15 carbon compounds derived by assembly of 3 isoprene units
and they are found mainly in higher plants e.g. curcumene the structure is shown in
Figure 1.22
Figure 1.22 Structure of curcumene
(c) Diterpenes: They are 20 carbon compounds derived by assembly of 4 isoprene
units. They are found mainly in fungal or plant e.g. abietadiene. The structure is
shown in Figure 1.23
H
Figure 1.23: Abietadiene

23
(d) Sesterpenes
They are derived from geranyl farnesol pyrophosphate by assembly of 5
isoprene units and have 25 carbon atoms. They are isolated from insect protective
waxes and from fungal sources (Zaki, 2000)
CH2OH
Figure 1.24 Ceroplastol
(e) Triterpenes: They form a large group of natural substances which includes
steroids and consequently sterols (Zaki, 2000). They have 30 carbon atoms and 6
isoprene units
R
CH3
H
CH3
H
Figure1.25 Structure of Gonane (Zaki, 2000)

24
(f) Carotenes: Carotenoids are derivatives of lycopene found in tomatoes, fruits
and flowers. Its long chain is highly unsaturated.
Figure 1.26 Structure of lycopene (Balbaa, 1976).
1.5 Soxhlet Extraction
When a compound of low solubility needs to be extracted from a solid
mixture a soxhlet extraction can be carried out. A soxhlet extractor is a piece of
laboratory apparatus that was originally designed for the extraction of a lipid from a
solid material. However it is not limited to the extraction of lipid but is required
when the desired compound has a limited solubility in a solvent and the impurity is
insoluble in that solvent. Normally a solid material is placed in a porous bag or
“thimble” made of strong filter paper, which is placed in chamber of the soxhlet
apparatus. The extracting solvent in round bottom flask is heated, and its vapors
condense in condenser. The condensed extractant drips into the thimble containing
the solid, and extracts it by contact. When the level of liquid in chamber rises to the
top of siphon tube, the liquid contents of chamber siphon into the round bottom
flask. This process is continuous and is carried out until a drop of solvent from the
siphon tube does not leave residue when evaporated (Taylor, 1996). The
advantage of this method, compared to other methods, is that large amounts of

25
solid can be extracted with a much smaller quantity of solvent (Abraham and
Sunol, 1997).
1.6 Thin Layer Chromatography
Thin layer chromatography is a chromatographic technique used to separate
mixture (Reich and Schiba, 2007). It is performed on a sheet of glass, plastic or
aluminium foil which is coated with a thin layer of adsorbent material, usually silica
gel, aluminium oxide or cellulose. This layer of adsorbent is known as the
stationary phase. After the sample has been applied on the plate, a solvent mixture
(mobile phase) is drawn up the plate via capillary action because different
compound ascend the thin layer chromatography plate at different rates,
separation is achieved. The more strongly a component of a mixture is absorbed
onto the stationary phase, the less time it will spend in the mobile phase and the
more slowly it will migrate up the plate (Skoog et al., 2004).
1.7 Column Chromatography
Column chromatography in chemistry is a method used to purify individual
chemical compounds from a mixture of compounds. There is dry and wet method,
for the wet method slurry is prepared of the eluent with the stationary phase
powder and then carefully poured into the column. Care must be taken to avoid air
bubbles. A solution of organic materials is pipette on top of stationary phase.
Eluent is slowly passed through the column to advance the organic materials. The
individual components are retained by the stationary phase differently and
separate from each other while they are running at different speeds through the

26
column with eluent and collected in a series of fractions. The composition of the
eluent flow can be monitored and each fraction is analyzed (Harrison, 2003).
1.8 Ultraviolet Spectroscopy
Ultraviolet Spectroscopy is one of the most important quantitative
spectroscopic techniques. The wavelength ranges from about 190nm to 750nm
which corresponds to electronic transitions of different origins. The ultraviolet (UV)
region scanned is normally from 200 to 400nm and the visible portion is from 400
to 800nm (Skoog, et al., 2004).
1.9 Infrared (IR) Spectroscopy
Infrared (IR) Spectroscopy is a chemical analytical technique, which
measure the infrared intensity versus wavelength. Infrared used for IR
spectroscopy falls between 400 and 4000cm-1 When an infrared light interacts with
matter chemical bonds will stretch, contract and bend, as a result a chemical
functional group tends to absorb infrared radiation in a specific wave number
range, regardless of the structure of the test molecular. The wave number positions
where functional groups absorb are consistent despite the effect of temperature,
pressure, sampling or change in the molecular structure in other parts of the
molecule (Gary, 2004).
In infrared spectroscopy, an infrared radiation is passed through a sample,
some of the infrared radiation is absorbed by the sample and some of it is passed
through (transmitted). The difference between the incident and transmitted

27
radiation is recorded by the machine and displayed as absorption bonus (peaks)
which result in a positive identification (qualitative analysis) of every different kind
of compounds and the size of the peaks in the spectrum is a direct indication of the
amount of compounds present (Gary, 2004).
1.10 GC – MS (Gas Chromatography – Mass Spectroscopy)
Gas chromatography mass spectroscopy: GC-MS is one of the so called
hyphenated analytical techniques. It is two techniques that are combined to form a
single method of analyzing mixture of chemicals. Gas chromatography separates
the component of mixture and mass spectroscopy characterized each of the
components individually by combining the two techniques. An analytical chemist
can both qualitatively and quantitatively evaluate a solution containing chemicals
(Skoog, et al., 2004). When GC is combined with MS, a powerful analytical tool is
created. Organic solution injected into the instrument will be separated into
individual components and identified. As individual compounds elute from GC
column they enter the mass spectrometer where they are bombarded with a
stream of electrons causing them to break apart into fragments. The mass of each
fragment divided by the charge is called the mass to charge ratio (M/Z). The
computer on GC – MS has a library of spectra that can be used to identify an
unknown chemical in the sample mixture based on its fragmentation characteristics
(Khopkar, 2008).

28
1.11 Justification
It is well known that infectious diseases account for high proportion of health
problems especially in the developing countries. Microorganisms have developed
resistance to the treatment of infectious diseases (Donal, 2000). This resistance
has increased due to indiscriminate use of commercial antimicrobial drugs
commonly used in the treatment of infectious diseases. This situation forced
various Scientists to search for new antimicrobial substance from various sources,
such as medicinal plant (Ahmed et al.,1998 ) and make entire world to shift its
interest to the development of alternative or new drug from medicinal plant (Abdul,
1990). Therefore this research work deemed it important to investigate the active
bioactive component of Euphorbia balsamifera with the view to verifying the
traditional claims of its medicinal activities for treating insect bites, venereal
diseases, cough, hay fever and boosts breast milk production (Burkill, 1985) and
identification of the active compounds for further development into full drug for the
benefit of all.
1.12 Aim and Objectives of the work
The main aim of this work is to extract, identify, assess the invitro antibacterial
activity, isolate and characterize the bioactive compounds in Euphorbia
balsamifera plant.

29
The objectives are:-
1. To extract the roots, stem and leaves of Euphorbia balsamifera with ethanol.
2. To conduct preliminary phytochemical screening of the ethanol extracts
3. To test for the antibacterial activity of the crude extract and fractions
4. To isolate bioactives compound(s)
5. Characterize the compound(s) isolated from Euphorbia balsamifera plant
UV, IR and GC-MS techniques

30
CHAPTER TWO
MATERIALS AND METHODS
2.1 Plant Materials Collection and Identification
The plant sample of leaves stems and root of Euphorbia balsamifera was
obtained from Birnin-Kebbi in Kebbi state, Nigeria during the month of August
2013. The leave of plant was identified at the Taxonomy unit of the Department of
Biological Sciences Usmanu Danfodiyo University, Sokoto, Nigeria by A.M. Umar.
A Voucher Specimen No (UDUH/ANS/0039) was deposited at the Herbarium of
Botany Unit Department of Biological Science.
2.1.1 Instruments
The instruments used in this research work are listed in Table 2.1 blow in
addition, the routine laboratory glass wares, common apparatus were also used
Table 2.1 List of instruments
Name of Instruments Model Manufacturers Source
Infrared
Spectrophotometer
FTIR-8400S Shimadzu, Japan Central Lab. Udus
Gas-
Chromatography/Mass-
Spectrometry
G890N Agilent
Technologies
Central Lab. Udus
Ultraviolet Visible UV 20550 Shimadzu, Japan Central Lab. Udus
Oven BS OV-160 Gallen Kamp,
England
Central Lab. Udus
Weighing balance PM 16-K Mettler Central Lab. Udus
Soxhlet extractor 24/29 Joint Quick fit brant
Germany
Central Lab. Udus

31
2.1.2 Chemicals
The chemicals used for this research work were of laboratory and analytical grades
as shown in Appendix 1
2.1.3 Preparation of Reagents
(a) Mayer’s Reagents
HgCl2 (1.3g) and KI (5g) were added into 6cm3 and 10cm3 of distilled water
respectively. The two solutions were then mixed and diluted to 100cm3 with distilled
water (El-Olemay et al., 1994).
(b) Dragendoff’s Reagents
Bismuth-nitrate (0.5g) was dissolved in 2cm3 of conc. HCl and diluted with 10cm3
of distilled water. 5.0g of KI was dissolved in 10cm3 of distilled water. The two
solutions were mixed together with 7cm3 conc. HCl then 15cm3 of water were
added and stirred. The solution was then made up to 100cm3 in a volumetric flask
(El-Olemay et al., 1994).
(c) Wagner’s Reagent
Iodine (1.3g) and 2.0g of KI were dissolved in 5cm3 of distilled water and diluted to
100cm3 in a volumetric flask (El-Olemay et al., 1994).

32
(d) Hydrochloric Acid (1%v/v) solution.
Conc. HCl (2.3cm3) of 36% purity and 1.19 density was diluted to 100cm3 in a
volumetric flask with distilled water (El-Olemay et al., 1994).
(e) Sodium Hydroxide (20%w/v) Solution Sodium hydroxide pellet (20%) was
dissolved in 50cm3 of distilled water in a beaker, allowed to cool, transferred to
100cm3 volumetric flask and made up to the mark with distilled water.
(f) Lead acetate (10%w/v) solution
The solution was prepared by dissolving 10g of lead acetate in 20cm3 of distilled
water and the content transferred into 100cm3 volumetric flasks and made up to the
mark.
(g) Ferric Chloride 5% (w/v) Solution
Ferric chloride (1.41g) was dissolved in 20cm3 of distilled water and the solution
was made up to the mark of volumetric flask.
(h) Acetic acid 5% v/v solution
The solution was prepared by adding 5cm3 of glacial acetic acid into 95cm3 of
distilled water in volumetric flask and mix thoroughly.

33
(i) Ammonia Solution 10% v/v
It was prepared by diluting 10cm3 of ammonia stock reagent in 30cm3 distilled
water, and transferred into 100cm3 volumetric flasks then made up to the 100cm3
mark of volumetric flask.
(j) Sodium Carbonate (10% w/v)
sodium carbonate (10g) was dissolved in 50cm3 of distilled water in a beaker,
transferred to a 100cm3 volumetric flask and then made up to the mark of
volumetric flask.
(h) Folin-Denis Reagent
Phosphomolybdic acid (10g), 50g sodium tungstate and 25cm3 orthophosphoric
acid were dissolved in 375cm3 of distilled water and it was refluxed for 2 hours, the
solution was allowed to cool and made up to the mark of 500cm3 volumetric flask
with distilled water (Gabriel et al.,2014)
2.2 Processing of Plant Samples
The fresh plant samples were properly washed with tap water and air dried
under shade. The dried samples were then pulverized in a wooden mortar and
stored in polythene bag for analyses (African pharmacopoeia, 1985).

34
2.3 Extraction of Plant Materials
2.3.1 Ethanol Extracts
The leaves (300g), stem (300g) and root (300g) of Euphorbia balsamifera
plant were extracted with 1200cm3 ethanol using soxhlet extractor for 6 hours at
temperature of 850C. The extracts were concentrated by using hot air sterilizing
cabinet at 600C and yields 35.28g of leaves, 25.51g of stem and 29.82g of root.
The crude ethanol extracts were used for preliminary qualitative test for
phytochemicals, antibacterial evaluation and further fractionation into different
fractions.
2.4 Melting Point
Melting Point Apparatus (Intech make) is comprises of 3600C thermometer,
capillary tube and apparatus, the apparatus has socket that connect to power
supply, four holes and viewing point. The three holes for three capillary tubes while
the other one is for thermometer. The crude ethanol extract was injected into the
capillary tube and the tube was placed in the hole at the same time with the
thermometer, then it was set at 500C. The thermometer reading was recorded
when the sample start to melt. The initial temperature was subtracted from the final
temperature of the thermometer.

35
2.5 Phytochemical Screening
2.5.1 Test for Alkaloids
(a) Mayer’s Test: five (5) drops of Mayer’s reagent were added into 2cm3 of each
extract in a test tube. Appearance of a yellowish precipitate was taken as indication
for presence of alkaloids (El-Olemay et al., 1994).
(b) Dragendorff’s Test: Five (5) drops of Dragendorff’s reagent were added to
2cm3 of each extract in a test tube. Formation of a brown precipitate was taken as
indication for the presence of alkaloids (El-Olemay et al., 1994).
(c) Wagner’s Test: Five (5) drops of Wagner’s reagent were added to 2cm3 of
each extract in test tube. Formation of dark brown precipitate was taken as
indication for the presence of alkaloids (El-Olemay et al., 1994).
2.5.2 Test for Saponins
2cm3 of each filtrate was diluted with 5cm3 of distilled water and vigorously shaken,
then allowed to stand for 30 minutes. Persistent frothing indicated the presence of
saponins. To the foam, 3 drops of olives oil were added and shaken vigorously.
Formation of an emulsion was considered as a confirmation for saponins
(Sofowora, 1984).
2.5.3 Test for Steroids
(a) Liebermann’s Test: Anhydrous acetic acid (5cm3) and 5cm3 of chloroform
were combined together with the extract and cooled in ice, then few drops of

36
concentrated sulphuric acid was added down the side of the test tube. A violet or
pink colour which changed gradually to blue and to bluish green was taken as
positive test (Abubaker 2009).
(b) Salkowski Test: A little quantity of each of the extracts was dissolved in 2cm3
of chloroform and few drops of concentrated H2SO4 was added down the test tube
to form two layers. A red or yellow colour was taken as indication for the presence
of sterol (Abubakar 2009).
2.5.4 Test for Anthraquinones
The extract (0.5g) was boiled with 10cm3 of sulphuric acid (H2SO4) and the filtered
using Whatman filter paper. No 1. The filtrate was shaken with 5cm3 of chloroform.
The chloroform layer was pipetted into another test tube and 1cm3 of 10% of dilute
ammonia was added. The resulting solution was observed for colour changes
(Trease and Evans, 1989).
2 .5.5 Test for Flavonoids
(a) Sodium Hydroxide Test: Each filtrate (2cm3) was acidified with 1% HCl
followed by drops of 20% of NaOH canary yellow colour indicates presence of
flavonoids (Gariapathi et al., 2011)
(b) Lead Acetate Test: Each filtrate (2cm3) was treated with 3 drops of 10% lead
acetate solution. A coloured precipitate indicates the presence of flavonoids
(Harbone, 1984).

37
2.5.6 Test for Tannins
Each extract (0.5g) was boiled in 100cm3 of water in a test tube and then filtered. A
few drops of 0.1% ferric chloride were added and observed for brownish –green or
a blue-black colouration (Sofowora, 1984).
2.5.7 Test for Cardiac Glycosides
Each extract (0.5g) was dissolved in 2cm3 of glacial acetic acid containing one drop
of ferric chloride solution and shaken vigorously. Then, 1cm3 of concentrated
sulphuric acid was added and carefully shaken. A positive test was indicated by a
blue layer at the interface (Trease and Evans, 1989).
2.5.8 Test for Volatile Oils
Each extract (1cm3) was mixed with dilute hydrochloric acid. Formation of white
precipitate confirmed the presence of volatile oil (Trease and Evans, 1989).
2.6 Quantitative Phytochemical Analysis
Quantitative phytochemical estimation was carried on the leaves of Euphorbia
balsamifera to know the percentage of secondary metabolites present, (Burkill,
1985) and (Natarajan et al., 2005) reported that the leaves of the plant is the most
useful part, having antiviral, antibacterial and anti parasitic effect.
2.6.1 Determination of Total Alkaloids
Powdered leaves of Euphorbia balsamifera (5g) was extracted with 100cm3
of methanol: water (1:1 v/v) mixture and the solvent was evaporated. The residue

38
was then mixed with 20cm3 of H2SO4 (0.0025M) and partitioned with ether to
remove unwanted plants material. The aqueous fraction was basified with NH4OH
solution and then extracted with excess chloroform to obtain the alkaloid fraction
and separated. The process was repeated several times, the extract was
concentrated to dryness. The remaining alkaloids were weighed and the
percentage was calculated with reference to the initial weight of the powder
(Trease and Evans, 1989).
% Alkaloid = Weight of Alkaloid Residue x 100………………………………… (2.1) Weight taken
2.6.2 Determination of Total Tannins
The powdered sample (0.1g) was transferred into a 100cm3 conical flask
containing 50cm3 of distilled water; it was heated for one hour and filtered. The
filtrate was kept, while the residue was washed several times with distilled water
and the combined solution made to the volume with distilled water in a volumetric
flask. To 0, 1, 2, 3, 4 and 5cm3 of the standard tannic acid in a 50cm3 volumetric
flask; 2.5cm3 Folin-Denis reagent and 10cm3 Na2CO3 solutions were added and
made to volume with distilled water. Similarly, 10cm3 of the sample solution was
treated in the same way. The flasks were allowed to stand for 20 minutes after
which optical density was measured at 760nm using a spectrophotometer. A
calibration curve was plotted from which the concentration of tannic acid (x) in the
sample was extrapolated and tannins content in the sample was calculated using
equation (2.2) below (Edeoga, et al., 2005).

39
Tannin acid (mg/100g) = x(ppm) Extracted volume …………………………(2.2) Aliquot (10cm3) x Sample weight (0.1g)
2.6.3 Determination of Total Phenolic Compounds
Total phenolic content was determined with the Folin-Denis reagent, extract
was mixed with 0.4 cm3 Folin-Denis, and after 5minutes 4 cm3 of Na2CO3 was
added. The final volume of the tubes were made up to 100cm3 with distilled water
and allowed to stand for 90 minutes at room temperature. Absorbance of sample
was measured against the blank at 750nm using a spectrophotometer. Total
phenolic content was expressed as gallic acid equivalent based on calibration
curve (Katasani and Damodar 2011).
2.6.4 Determination of Total Flavonoids
Total flavonoids content was determined by taking 1cm3 of leave sample and add
4cm3 of distilled water and 0.3cm3 of 5% sodium nitrite and 0.3cm3 of 10% AlCl3
were also added. After 6 minutes incubation at room temperature, 2cm3 of 1M
NaOH was added to the reaction mixture. Immediately the final volume was made
up to 100cm3 with distilled water. The absorbance of the reaction mixture was
measured at 420nm. Yellow colour indicates the presence flavonoids while total
flavonoids were expressed as gallic acid equivalent based on calibration curve
(Katasani and Damodar 2011).

40
2.6.5 Determination of Total Saponins
The powdered leaves of the plant were placed in a 100cm3 flask containing 60cm3
of 50% ethanol. The mixture was boiled for 15 minutes and filtered; 2g of charcoal
was also added. The solution was boiled and filtered. The filtrate was allowed to
cool and equal volume of acetone was added to complete the precipitation of
saponins. The separated saponins were collected by decantation and dissolved in
boiling ethanol and filtered to remove any insoluble substances. The filtrate was
allowed to cool at room temperature which the result is the precipitation of
saponins. The separated saponins were collected by decantation method and
20cm3 of ethanol was added and filtered. The filtrate was heated in a water bath,
after evaporation, the sample was dried in the oven into a constant weight. The
saponin content was calculated in percentage (Edeoga, et al., 2005).
% Saponins = weight of Saponins residues x 100 ………………………………. (2.3) Weight of Sample
2.7 Fractionation of Ethanol Extract
Crude ethanol extract of leave of Euphorbia balsamifera was not soluble in
water; split method of separation was adopted according to (Abubakar, 2009). n-
hexane was directly added to crude ethanol extract and with vigorous stirring
before filtration and the filtrate is n-hexane fraction, the residue was allowed to dry
and same method was repeated with chloroform, ethyl acetate and finally ethanol
to obtain n-hexane, chloroform, ethyl acetate and ethanol fractions. They were
concentrated at 600C in hot air sterilizing cabinet.

41
2.8 Tests for Antibacterial Activity
Bacteria culture used in this study were obtained from the Microbiology
Departement of Usmanu Danfodiyo University Teaching Hospital (UDUTH),
Sokoto. Clinical bacterial cultures used in this study were Escherichia coli,
Staphylococcus aureus, Micrococcus species and Pseudomonas aeruginosa. All
the cultures were grown in Mueller-Hinton. The innoculum was used for
antibacterial assay.
2.8.1 Antibacterial Assay
The extract and fractions (ethanol extract, ethanol fraction, ethyl acetate fraction,
chloroform fraction and n-hexane fraction) of leave of Euphorbia balsamifera were
tested for antibacterial activities by agar well diffusion assay (Pelezer et al 1993)
Bacteria isolated were prepared to match 0.5 McFarland standards. Using the
micropipette, 100µ of organism was spread over the surface of an agar plate. The
procedure was the same for all test organisms. Using a sterile cork borer of 6mm
diameter, four holes were made, in each of culture plates, each of the four holes
were filled with a given concentration (60mg/ml, 90mg/ml and 120mg/ml) of ethanol
extract, ethanol fraction, ethyl acetate fraction, chloroform fraction, and n-hexane
fraction of fixed volumes (0.1 ml). One hole was punched in the centre of the plate
where 0.5µ steptomycin was added as positive control. The cultures were then
incubated at 37oC for 24 hour. The clear zones of inhibition were observed after the
incubation period (Cheesbrough, 2002). Diameter of the zones of growth inhibition
were measured in millimetre for each concentration of the extract and fractions

42
used, using a meter rule and diameter < 8.0mm indicates low sensitivity while >
8.0mm indicates high sensitivity (Collee et al., 1989).
2.8.2 Minimum Inhibition Concentration (MIC)
The MIC of the extract and fraction were determined on solid medium (Nutrient
agar) using method of (Siddiqui and Ali 1997). Standardized suspension of the test
organism was inoculated into a series of sterile tubes of nutrient broth containing
two-fold dilution of extract and fraction of leave and incubated at 37oC for 24h.The
MICs were read as the least concentration that inhibited the growth of the test
organisms
2.8.3 Minimum Bactericidal Concentration (MBC)
The minimum bactericidal concentrations were determined by first selecting tubes
that showed no growth during MIC determination; a loopful from each tube was
subcultured onto extract free agar plates, incubated for another 24h at 37oC. The
minimum bactericidal concentration was considered as the lowest concentration
that could not produce a single bacterial colony (Richard, et al., 2004)
2.9 Thin Layer Chromatography
Commercially pre-coated TLC silica gel plate was used; a line was drawn with a
pencil 2cm at the bottom from one end of the plate. The sample(s) were dissolved
in little chloroform and was spotted on the line drawn on the plate coated with silica
gel by capillary tube and then allowed to dry. The dry plates were placed into a
chromatographic tank containing benzene and ethyl acetate in a ratio of 3:1 as

43
mobile phase and the tank was covered. The solvent rose up on the plate by
capillary action, when the solvent front was just about 2cm to the upper end of the
plate, the plate was removed and a line was drawn to mark the position of the
solvent front. The plates were allowed to dry. Visualization and identification of the
spots that indicate constituents of fraction was done by using a ultra- violet lamp at
a wave length of 254nm, kept in iodine chamber, spray with sulphuric acid and
heat at 1050 C. The Rf value of the spots were measured using meter rule.
2.10 Column Chromatography
100cm3 burette was used as a column with 50g of silica gel as a stationary phase
while mobile phase was petroleum ether hundred percent, followed by 9:1 ratio of
petroleum ether and ethyl acetate as eluting solvents. The column was parked by
wet packing method, after packing was allowed overnight, 0.5g of concentrated
chloroform fraction was dissolved in chloroform solution and soaked with cotton
wool, was placed on top of silica gel in the column. Between the cotton and the top
of silica gel there was disc made of filter paper and the bottom of the column there
was also another cotton wool. 2.4cm3 per minute each were collected in collection
bottles range from 1 to 25. The column fraction’s profiles were monitored by TLC to
confirming the similarities of elutes based on the number and colour (s) of the
spot(s).
2.11 Isolation of Bioactive Compounds Using Preparative TLC
The fraction from the column chromatography was evaporated by using
rotary evaporator, further subjected to preparative TLC for the isolation of bioactive

44
compounds. The sample was dissolved in chloroform for analysis; a line was
drawn with pencil about 2cm from the bottom of the plate. Plate with thickness of
1mm were prepared using stationary phase silica gel and mobile phase benzene:
ethyl acetate 3:1 the glass plate was allowed to dry then the dry plate was placed
in the developing tank of mobile phase. The solvent rose up on the plate by
capillary action, when the solvent front was just about 2cm to the upper end of the
plate. The plate was removed from the tank and mark the solvent front with a
pencil and the plate is dry by using a flow of dry nitrogen and the band is visualize
by using UV light, mark them lightly with a pencil. The edge of a spatula was used
to scrape the bands off onto a lengthwise folded piece of clean white paper, the
scrapings was dissolved in 3cm3 of methanol and silica gel was settled at the
bottom of the beaker, while the isolate was decanted, solvent was removed by
rotary evaporation and the purification is done by recrystallisation process, that is,
dissolving isolate in methanol, filtered and allow the solution to crystallise and
dried. Finally the melting point of crystal was taken and the crystal was kept for
spectroscopic analysis (Mohanlall, et al., 2011).
2.12 Ultra-violet (UV)
Fourier Transform UV-visible spectrophotometer experiment were
performed using Shimadzu (Model 20550) instrument controlled by UV-visible
solution software set at different wavelength from 200nm to 280nm. Cell containing
chloroform was first prepared to serve as a blank then; the crystal was dissolved in
chloroform followed by adding of 2cm3 hydroxylamine and 5cm3 of standard

45
phenolphthalein solution were also added. Window sample were scan and value of
absorption maxima and blank were recorded.
2.13 Infrared Spectroscopy IR
Fourier Transform Infrared spectroscopy (FTIR) experiment were performed
using Shimadsu (Model 8400S) instrument controlled by IR solution software set at
spectra resolution of 4cm-1. A KBr disc was first prepared to serve as blank then,
the crystal was grounded with KBr and pressed to make the sample disc (window).
The prepared sample window was scanned between 400-4000m-1 20 times and
the means were printed.
2.14 GC-MS (Gas Chromatography-Mass Spectroscopy)
Gas Chromatography-Mass Spectroscopy GC-MS experiment was
performed using Shimadzu (G890N Modern). The instrument settings were column
oven and injection temperature at 60oC and 25oC respectively, injection mode was
split, the total flow and column flow were set at 6.1ml/min and 1.55ml/min
respectively, the flow control mode set at linear velocity. The ion source and
interference temperature were set at 200oC and 250oC and the solvent cut time
was set at 2.5minutes and total run time of 47minutes. The sample for analysis
was prepared by dissolving in ethyl acetate. The solution was injected into the Gas
-Chromatographic column through the injection point, the individual components
eluted from the column and then enter the electron analyzer (Mass -
spectrophotometer) detector. They are bombarded with stream of electrons
causing them to break apart into fragment which is readout and compared with
different compounds in the spectrum library

46
CHAPTER THREE
RESULTS AND DISCUSSION
3.1 Results
3.1.1 Percentage Yields of the Plant
The result of the percentage yields of the leaves, stem and root of
Euphorbia balsamifera extracts are presented in Table 3.1
Table 3.1: Percentage Yields of the Plant
Sample Solvent
Used
Volume of
Solvent
Weight of
Sample
Weight of
Extracts
(%) Yields
Leaves
Stem
Root
Ethanol
Ethanol
Ethanol
1200cm3
1200cm3
1200cm3
300g
300g
300g
35.28g
25.51g
29.82g
11.76
8.5
9.94

47
3.1.2 Phytochemical Screening
The crude extracts of leaves, stem and root of Euphorbia balsamifera plant
were screened for the following metabolites: cardia glycosides, saponin, tannis,
terpenoids, anthraquinones, steroids flavonoids, alkaloids and volatile oil are
shown in Table 3.2
Table 3.2: Preliminary Phytochemical Screening of Ethanolic Extracts of
Euphorbia balsamifera leaves, stem and root
Chemical Composition Ethanolic extracts Leaves Stem Root
Cardiac glycosides ++ + + Saponin ++ + + Tannins ++ ++ + Terpenoids + + + Anthraquinones + + + Steroids a) Lieberman's Test + + + b) Salkowski Test + + + Flavonoids a)Sodium hydroxide + + + b) Lead Acetate Test + + + Alkaloids a) Mayer's reagent + + + b) Wagner's reagent + + + Violite oil ++ + +
Key + = Present ++ = Appreciably Present
3.1.3 Melting point
The crude ethanol extract of leaves of Euphorbia balsamifera plant was
analyzed using melting point apparatus, was melted at range of 1400C – 145 0C.

48
3.1.4 Quantitative Estimation of Phytochemical Contents
The results of quantitative estimation of alkaloids, tannins, flavonoids and
saponins contents of the chloroform extract of the leaves of Euphorbia balsamifera
plant are presented in Table 3.3
Table 3.3: Quantitative Estimation of Phytochemical Contents of the
Chloroform Extract of the Leaves of Euphorbia balsamifera
Phytochemical Percentage (%)
Alkaloids 9
Tannins 11
Flavonoids 8
Saponins 8

49
3.1.5 The Yields of Fractionated Components
The results of the yields of fractionated components using various solvents
on the leaves extracts of Euphorbia balsamifera plant are shown in Table 3.4
Table 3.4: Results of the Yields of Fractionated Components using various
Solvents
Fraction Weight
n-hexane 0.2g
Chloroform 0.5g
Ethyl acetate 0.25g
Ethanol 0.32g

50
3.1.6 The Antibacterial Activities
The antibacterial activities of different concentrations of chloroform fraction
of leaves against Escherichia coli, Staphylococcus aureus, Micrococcus species
and Pseudomonas aeruginosa are presented in Table 3.5
Table 3.5: Zone of Inhibition Results (mm)
Conc. mg/ml
Escherichia coli (mm)
Staphylococcus aureus (mm)
Micrococcus species (mm)
Pseudomonas aeruginosa (mm)
Ethanol extract
60 07 09 07 10
90 17 19 18 14 120 20 18 21 19 Ethanol fraction
60 11 14 11 10
90 17 19 18 14 120 18 19 19 21 Ethyl acetate fraction
60 13 07 10 09
90 13 16 15 10 120 20 19 21 17 Chloroform fraction
60 18 15 19 21
90 21 20 20 15 120 24 20 25 20 n-hexane fraction
60 07 08 10 11
90 12 14 10 13
120 15 18 20 19 Control 0.5µ streptomycin
20 24 21 27

51
3.1.6.1 The Minimum Inhibitory Concentration (MIC)
The results of MIC on Escherichia coli, Staphylococcus aureus Micrococcus
species, and Pseudomonas aeruginosa are shown in Table 3.6
Table 3.6 Minimum Inhibition Concentration of Tested Organism
Fractions Escherichia coli (mm)
Staphylococcus aureus (mm)
Micrococcus species (mm)
Pseudomonas aeruginosa (mm)
n-hexane 10 8 8 7
Chloroform 12 6 5 7
Ethyl acetate 7 6 7 9
Ethanol 8 7 10 8
3.1.6.2 Minimum Bactericidal Concentration (MBC)
The results of MBC on Escherichia coli, Staphylococcus aureus
Micrococcus species, and Pseudomonas aeruginosa are shown in Table 3.7
Table 3.7 Minimum Bactericidal Concentration of Tested Organism
Fractions .
Escherichia coli (mm)
Staphylococcus aureus (mm)
Micrococcus species (mm)
Pseudomonas aeruginosa (mm)
n-hexane 8 7 11 9 Chloroform 7 10 12 11 Ethyl acetate 10 11 10 9 Ethanol 8 10 9 10

52
3.1.7 Thin Layer Chromatography of Chloroform Fraction of Leaves
The results of TLC carried out on the chloroform fraction of the leaves of
Euphobia balsamifera using the following solvent system benzene: ethyl acetate
(3:1) are shown in Table 3.8 below
Table 3.8 TLC of Chloroform Fraction
Fraction Solvent System Number of component
Rf values
Chloroform Benzene : Ethyl acetate (3:1)
6
0.61
0.59
0.76
0.86
0.89
0.91

53
3.1.8 Results of Ultra Violet/Visible Analysis
The results of ultra-violet/Visible spectroscopy analysis on component is
presented in Table 3.9
Table 3.9: Ultra Violet /Visible Spectroscopy Analysis Results
Wavelength (nm) Inference
338.50 Polynuclear aromatic compounds
279.50 Six membered double bond extended
conjugation or six membered enone double
extended conjugation
265.50 Conjugated benzene derivatives eg phenyl
benzonic acid

54
3.1.9 Infra-red Spectroscopy Analysis
The results of infra-red spectroscopy analysis of isolated chloroform fraction
of leave of Euphorbia balsamifera plant is shown in Table 3.10
Table 3.10: Infra-red Spectroscopy Analysis Results
Frequency (cm-1)
Assigned Functional Group
Inference
1689.70 C=Ostr Carbonyl group
2816.16 CHstr Overtone bands
1012.66 C-Nstr Amine group
3443.05 O-Hstr OH for carboxylic acid
1689.70 C=Nbd Imines
1192.06 C-Ostr Anhydrides/acid
2816.10 (CH3)n Alkyls

55
3.1.10 GC-MS Analysis
GC-MS analysis of isolated chloroform fraction of leave of Euphorbia
balsamifera plant was carried out using (G89ON Modern). Peak identification was
carried out by comparism of the mass spectral obtained with mass spectral data
available on NIST Version shown in Table 3.11 below
Table 3.11: GC-MS Analysis Results
Peak
No
R.
Time
Area % Base
Peak
Molecular
Weight
Compound
1 22.00 3.19 129 214 Dodecanoic acid
2 24.40 1.84 185 228 Tetradecanoic acid
3 25.89 3.65 116 284 Octadecanoic acid
4 26.57 2.75 213 220 (6H-Indolo[3,2,1-
de][1,5]naphthyridin-6-one)
5 27.95 3.05 129 274 Octadecanoic acid 2-hydroxyl
1,3-propanedlyl ester
6 28.06 8.43 183 274 Dodecanoic acid 2,3-
dihydroxypropyl ester
7 28.38 7.48 55 282 Oleic acid
8 28.56 4.48 284 442 Ascorbic acid 6
octadecanoate
9 29.83 5.63 129 568 Hexadenoic acid 1,2,
ethanediyl ester
10 29.96 3.12 212 326 Dinobulon
11 31.60 25.27 129 340 Docosanoic acid
12 31..83 15.03 129 284 Octadecanoic acid
13 32.02 4.08 129 207 Ethylacridine
14 34.51 12.00 207 562 Oleic acid elcosyl ester

56
3.2 Discussion
Table 3.1 showed the results of extraction of 300g of ground leaves, stems
and root. The leaves had the highest yield (35.28g) representing 11.76% followed
by roots with 29.82g having 9.94% and the least is stems with 25.51g representing
8.5%. This implies that leaves are the most soluble components in the solvent.
The result of phytochemical screening is shown in Table 3.2 which indicates
that the leaves of this plant are very rich in many secondary metabolites. The
results also agreed with the work of (Kamba and Hassan 2010) who reported that
the leaves, stems and the root of Euphorbia balsamifera are rich in secondary
metabolites. Tannins were known for their oxidation inhibiting activity which had
been known for a long time (Calvi et al., 1995). Tannins were found to be present
in high quantity. These are in line with the earlier report by (Gill, 1992) who said
that herbs that contain tannin as their main components are astringent in nature
and are used for treating intestinal disorder. The presence of tannins in the plant
could be responsible for its traditional use in treating intestinal disorder such as
diarrhea, dysentery and inflammatory condition of the digestive tract (Burkill, 1985).
Tannins are widely used in herbal medicine to treat wounds and to arrest bleeding
that is probably the reason why the plant is used in treating skin irritation (Nguyi,
1988). Flavonoids are phenolic compounds that protect plants from the damaging
effect caused by ultra-violet light and microbial infection (Allan and Miller, 1996).
Flavonoids also possess many pharmacological properties such as antioxidant
activities and anti-inflammatory activities. The potent antioxidant activity of
flavonoids; their ability to scavenge hydroxyl radicals’ superoxide anions and lipid

57
peroxide radicals may be the most important function of flavonoids (Alan and
Miller, 1996). These could be the reason why the plant can withstand many climatic
conditions and also its use for pharmacological purposes (Linuma et al., 1994).
Saponins are well known for their antioxidant properties (Beak et al., 1996).
Saponins exhibit cytotoxic effect and growth inhibition against a variety of cells,
making them have anti-inflammatory and anti-cancer properties (`Akindahusi and
Salawu 2005). They have a property of precipitating and coagulating red blood
cells (Okwu and Josiah 2006). Saponins have been reported to have antibacterial,
antifungal and antiviral activities (Soetan et al., 2006). The presence of saponins in
the plant could be responsible for their traditional use in the treatment of skin
diseases and venereal diseases. The presence of steroids has been reported by
(Okwu, 2001) that steroids were found to be present in the leave of the plant; this is
not surprising because the plant’s leaves and latex are used to promote fertility and
increase milk production.
Cardiac-glycosides are non-reducing substances that are composed of
sugar and non sugar parts. They are used therapeutically mainly in the treatment
of cardiac failure due to their anti-arrhythmic effects (Harbone, 1984). Also the
presence of Cardiac- glycosides could be responsible for the traditional use of
plant as a diuretic and laxative (Burkill, 1985)
Terpenoids are generally essential oils obtained from sap, tissue and different
parts of plants and trees. The ethanol extract of Euphorbia balsamifera leaves,
stem or root has high oily, gum and mucilage (mucilage is a type of soluble fibre of
viscous nature). There is a growing interest in natural terpenoids because of their

58
wide spectrum of biological activities. These include bactericidal, fungicidal,
antiviral, cytotoxic, analgestic, anticancer, spermicidal, cardiovascular and anti-
allergic activities. The presence of terpenoids in the plant could be responsible for
their traditional use in the treatment of skin diseases and insect bites (Edeoga and
Gomina 2002)
Alkaloids are naturally occurring organic bases. Table 3.2 shows their
presence in all plant parts. Alkaloids are use as anaesthetic agent. The presence
of anthraquinones in the plant could be responsible for the use of Euphorbia
balsamifera as a diuretic and laxative in Chinese medicine (Burkill, 1985)
The result of antibacterial assay is consistent with the report of (Gill 1992)
who earlier confirmed the antibacterial effects of the ethanol extract of Euphorbia
balsamifera. The result of antibacterial activity shows that the inhibitory activities
exhibited by the extract agree with the report of (Kamba and Hassan 2010) and
(Gill, 1992), all of whom linked antimicrobial properties of plants to the presence of
bioactive secondary metabolites. It was demonstrated that the activity of the extract
was concentration dependent. An increase in the concentration of the fraction
yielded higher activity as shown by the diameter of zone of inhibition (Table 3.5).
Highest activities were observed with the standard antibiotic streptomycin (control)
probably because the antibiotic was in the pure form (Prescott et al., 2002). The
fact that organism may need higher concentration of extracts to inhibit or kill them
may be due to their cell wall components (Banso, 2009). The results in Table 3.6
indicate that the minimum inhibition concentration (MIC) of the leaves fractions of
Euphorbia balsamifera plant ranges between 5mg/ml and 10mg/ml. The effect of

59
the plant fractions on the MIC for the test microorganisms is in line with the report
that microorganisms varied widely in the degree of their susceptibility (Aboaba and
Efuwape, 2001). The fraction finally prevent the growth and killed the organism
completely at MBC of 7mg/ml. The MIC and MCB is normally used to evaluate the
efficacy of the agent and show that the fraction can inhibit the growth of some
microorganism. Several studies had documented the scientific basis that bioactive
constituents inhibit the growth of various microorganism at different concentration
(Kambal and Hassasn) (Simone et al., 1998) plant. The activity of the plant extract
against both gram positive and gram negative bacteria is an indication of the
presence of broad spectrum antibiotic compound in the plant (Parekh and Chanda,
2007). The large zone of inhibition indicates the potency of the active principle of
the plant in Table 3.5. The large zone of inhibition exhibited by the extract and
fractions of Euphorbia balsamifera on Escherichia coli, Staphylococcus aureus,
Micrococcus species, Pseudomonas aeruginosa suggest that the plant can be
used in the treatment of infections commonly associated with the bacteria.
The chloroform fraction showed the highest activity from the sensitivity test
and was subjected to TLC to ascertain the number of compounds it has based on
the number of spot. TLC result presented Table 3.8 shows that chloroform has six
spot with clear separation as shown in Appendix 4. The chloroform fraction was
further subjected to column chromatography for isolation in to pure compound.
Three compounds were isolated; the fraction with clear separation was finally
subjected to preparative TLC for isolation in to a pure compound.

60
IR absorptions bands in Table 3.10 appeared at 3443.05 cm-1 for (O-H
stretching) in acid, alcohol or phenol. The absorption band for(C-H stretching) is
observed at 2816. 6cm-1, 1192.06cm-1 (C-O stretching) due to anhydrides, 1012.66
cm-1 (C-N stretching) due to amine group, 1689.70cm-1 (C=N bending) due to
alcohol group, 1689.70cm-1 (C=O stretching) due to carbonyl group attached to
carboxylic acid. 2833.52cm-1 (C-H stretching ) due to overtone of CH in the
compound, 1422.55cm-1 (C=C bending) due to aromatic ring, 1018.45cm-1 (C-N
stretching) due to amine group, 1622.19cm-1 (C=N bending) due to Imines group,
2954.08cm-1 (CH3 bending) due to alkyls groups.
Summary of the GC-MS analysis of the bioactive compound isolated from
the chloroform fraction of the leaves is given in Table 3.11. The GC chromatogram
gave 14 peaks (Appendix 7) of varying intensities and the chemical constituents
are fatty acid, and alkaloid. The major peak is peak 11 with retention time 31.60
minutes with molecular ion at m/z 340, base peak 129 the compound is docosanoic
acid, (Burkil,1985) reported the presence of the compound in plant extract.
Docosanoic acid is a fatty acid, it regulates blood pressure, is used in the treatment
of wounds and preventing infection and have antioxidants and antimicrobial
properties (Lim, 2013) which is the one of uses of the plant to treat wound and skin
infection (Burkill, 1985). Peak 3 that has retention time 26.57 minutes and gave
the mass spectra of unknown compound with molecular ion at m/z 220, base
peak at m/z 213 when it was compared to the NIST02 Reference Spectral Library
in MS spectral it suggested that the compound is alkaloid (6H-Indolo[3,2,1-
de][1,5]naphthyridin-6-one) with molecular formula C14 H8N2O. (Kamba and

61
Hassan 2010) reported the presence of alkaloid in the extract. Plant contains
indoles are used to treat snake bites, has antimicrobial activities against gram
negative and positive bacteria, use to treat sexual dysfunction and anti-asthmatic
drug (Biswal and Sahoo 2012) which are the some of the uses of the plant for
curing insect bites, asthma, venereal disease (Gill,1992) and has anti-inflammatory
property (Natarajan et al., 2005)
Figure 3.1 6H-Indolo [3, 2, 1-de][1,5]naphthyridin-6-one
The above UV, I.R and GC- MS spectral data and their comparison with those
described in the literatures showed the compounds isolated to be consituents of
(6H-Indolo[3,2,1-de][1,5]naphthyridin-6-one) and fatty acids

62
CHAPTER FOUR
CONCLUSIONS AND RECOMMENDATIONS
4.1 Conclusions
From the analysis carried out in this research work, the results offers a
scientific basis for the traditional uses of plant extract, which phytochemical
analysis revealed the presence of saponins, tannins, cardiac glycosides,
flavonoids, steroids, anthraquinones, alkaloids and terpenoids in the leaves, stems
and root of the plant and also showed varying degrees of antibacterial activities on
the microorganisms tested. The plant understudy gave a promising result of its
potential application in treatment of diseases caused by Escherichia coli,
Staphylococcus aureus, Micrococcus species and Pseudomonas aeruginosa, this
agreed with the work of (Natarajan et al., 2005) that Euphorbia balsamifera
possess antibacterial activities against some gram positive and gram negative.
This is why the plant could be employed in the treatment of microbial induced
ailments.
Three compounds were isolated from chloroform fraction as bioactive but
only one is characterized which point out to be simple compound (6H-Indolo [3, 2,
1-de][1,5]naphthyridin-6-one) and fatty acids. The presence of bioactive compound
justified the use of plant for various ailments. Euphorbia balsamifera is listed as
one of the medicinal plants commonly use in Africa (Ndukwe et al., 2005).

63
4.2 Recommendations
There is need for further studies on the plant parts in order to take the work to
beneficial level to humanity therefore; the researchers should carry out further
investigations on the following:
1. To isolate the remaining bioactive compounds, identify and characterize
them as addition to the plant chemical compounds bank.
2. The isolated and characterized compounds from the plant should be
explored for their medicinal application.
3. To investigate the toxicity of the plant for direct use in the treatment of
infections commonly associated with the above tested microorganisms.

64
REFERENCES
Aboaba, O.O. Efuwape, B.M. (2001). Antibacterial properties of some Nigerian Species Biotechnology Research Committee 13: 183-188
Abdul, A. (1990): Introduction to Pharmacology 1st Edition Ahmadu Bello University Press Limited, Zaria pp1-6.
Ademoroti, C.M.A. (1996): Environmental Chemistry and Toxicology. Foludex
Press Ltd, Ibadan, pp 2009 -214.
Abraham, M. A., Sunol, A. K., (1997): Supercritical Fluids: Extraction and Pollution
Prevention, ACS Symposium Series, 670, Washington
Abubakar, M.S., (2009): Practical Manual of Pharmacognosy and Ethnomedicine. Sokoto: Usmanu Danfodiyo University press pp.15 – 44.
African Pharmacopoeia (1985) Pharmacopee Africanine OAU/STR, Scientific Publication Prepared by Inter African Committee on medicinal plants and African Traditional medicine. 1st Edition: vol 1 pp .23 Lagos – Nigeria.
Ahmed I., Memood Z., Mohammed F. (1998): Screening of some Indian Medicinal plants for their Antimicrobial properties J Ethnopharmacol. 62: 183-193.
Akindahusi, A.A. and Salawo, S.O. (2005): Phytochemical Screening and nutrient-Antinutrient composition of selected tropical green leafy vegetables; African Journal of Biotechnology 4:497-501
Alan, L. and Miller, N.D. (1996): Antioxidant flavonoids: Structure, function and clinical usage Med Rev, 1 (2): 103-111
Arjun, P., Jha, S., Murthy, P.N., Manik, M., and Sharone, A. (2010): Isolation and Characterization of β – Sitosterol from the leaves of Hygrophila spinosa International Journal of Pharma Science & Research: vol.1 (2) pp 95 -100
Ates, D.A. and Erzdogrul, O.T. (2003): .Antimicrobal activities of various medicinal and commercial plant extracts. Turk. J. Biol. 27:157-162
Bahl, B.S. and Bahl A. (1980): A Test Book of Organic Chemistry 12th edition S Chand & Company, New Delhi, pp 909 – 918.
Balbaa, S.I. (1976): Medicinal Plant Constitunents 2nd Edition. University: School
Books Cairo Egypt pp 264 -385.
Banso, A. (2009): Phytochemical and antibacterial investigation of bark of extracts of Acacia nilotica Journal of medicinal plant Research, 3(2): 082-085

65
Beak, N.L., Kim Y.S., Kyung J.S. and Park K. H. (1996): Isolation of
antihepatotoxin Agent from the roots of Astragalus membranaceous Korean J
Pharmacog; 27:111-117
Biswal, S.and Sahoo, U. (2012): Indole the molecule of diverse biological activities
Asian Journal of pharmaceutical and clinical research vol 5
Bruyns, P. V. (2006): A New Subgeneric Classification for Euphorbia in Southern
Africa Taxon 55: (2) 397 -420.
Burkill H. M. (1985): The Useful Plants of West Tropical AfricanVol. 2 The Royal Botanic Garden pp336
Calvi L., Mwalango GCJ, Mwaingira B.A, Riedl B, Shield JA (1995), ‘’Characterisation of Wattle – Tannin – Based adhensives for Tanzania Holzforchung 49 (2)
Carter, S. and Smith, T., (1987): Flora of Tropical East African, Euphorbiacea.
11:26 -28
Cheesbrough.M. (2002): District Laboratory Practice in Tropical Countries Part 11 Cambridge University press UK.pp 136-142
Chidambara, K., Vanitha, A., Mahacleva, M., and Ravishankar, G. (2003):
Antioxidant and antimicrobial activity of Cissus quandrangularisl.Journal of
medicinal food 6:2
Collee, J.G., Grulo J.P., Frasar, A.G. and Marmion, B. P. (1989): Markie and McCartney Practical medical microbiology 13th edition Churchill and Livingstone, New York pp76
Conn, E. C. (1981): Cyanogenic glycoside Biochemistry of plants 7:479-500
Donal, B.P. (2000): Medicinal Plants and Phytomedicine. Linking Plant Biochemical and Physiology to Human Health African Journal of Traditinal Complementary Medicine 2(1):46-61
Dussourd, J.M. (2000), Steroids chemoecology online. Edeoga, H.O. Okwu, D.E and Mbaebic, B.O. (2005): Phytochemical constituents of some Nigerian Medical Plants. Africa Journal of Biotechnology 47:685-688. http://www.scholarsresearchlibrary.com (retrieved 18/06/2012 @ 4:37pm) Edeoga, H.O., Okwu, E. & Mbaebie, B.O. (2005): Phytochemical Constituents of
some Nigerian Plants African Journal of Biotechnology Vol. 4 sec. 6 pp 685 – 688.

66
El-Olemy, M.M., Almuhtadi, F.J. and Afifi, A.A (1994): Experimental Phytochemistry, a Laboratory manual, King Saud University press Pp 8 – 9.
Erich, G., (2006), The Science of Flavonoids: Springer Science Inc., 233 spring street, New York, NY10013, USA: ISBN-10:0-387-28821-X: pp 213-215.
Figen, M.T (2005), Saponins versus plant fungul pathogen, Journal of cell and Molecular Biology. Vol.5 pp13 - 17
Finar, I.L. (1975): Organic Chemistry volume 2 Stereochemistry and Chemistry of Natural Products 5th Edition, Person Education Limited pp 342 -879
Gabriel, A., Joel, V. and Patrick, E. (2014): Folin-Ciocalteau Reagent for polyphenolic Assay Inrernational Journal of food Science, Nutrition and Dieteties 2326-3350
Ganapathi, S.R., Kumar, D.S., Harami, A., Pathiban, M.P., Venkateshwarlu, G. (2011),Comparison Studies of Phytochemical Screening and Antibacterial Activities of Allium cepa Bulb and Allium sativum Bulb Extracts, Asian Journal of Pharmaceutical and Health Sciences. 1(3): 133 – 134.
Gary, D.C. (2004): Analytical Chemistry, Six edition, publishing by John wiley and sons (Asia) PTE Ltd, Singapore. Pp 460 – 468. Harrison, A (2003): Biospeparatus Science and Engineering Oxford University press New York
Gill, L. S., (1992): Ethnomedical uses of plants in Nigeria. Printed & Published by Uniben Press, ISBN 978 – 2027 – 20 – 0 pp 231. Giner, R.M., Manez, S., Rios, J.L., (1995), Planta Med., (61) 182
Harbone, J.B. (1984): Phytochemical methods. A Guide to Modern Techniques of plants analysis John Willey and Sons Inc. New York pp 1 - 26.
Harborne, E.H. (1999) Phytochemistry Definition online at http://www.wikipidia.com (Date Retrieved 14/05/2012 @ 2:30pm).
Harrison, A (2003): Biospeparatus Science and Engineering Oxford University press New York.
Kamba, A.S. and Hassan L.G. (2010): Phytochemical screening and antimicrobial activities of Euphorbia balsamifera ieaves, stems and root against some pathogenic microorganisms. African Journal of Pharmacy Pharmacology vol 4 (9) pp 645-652.
Katasani and Damodar, (2011): Phytochemical screening, quantitative estimination of total phenolic, flavanoids and antimicrobial evaluation of Trachyspermum amm. J.Atom and Molecule

67
Krishnaraju, A.V. Rao, T.U. and Sundararaju, U. (2005): Assessment of
Bioactivities of Indian Medicinal Plants Using Brine Shromp (Altenaila
Salania) Lethality Assay. International Journal of Applied Science 2: 125 -13.
Khopkar, S.M., (2008): Basic Concept of Analytical Chemistry, 3rd edition, New Age
International Ltd. pp 178 – 179.
Lim, T.K., (2013): Medicinal and non medicinal plant Asian Journal of plant Science
and Research vol. 5.
Lin, L. J., Marshall, G. T. and Kinghorn, A. D. (1983): The Dermatitis Producing
Constituents Euphorbia hermentiana latex. Journal of National Production.46
:( 5) 723-731.
Linuma, M.,Tsuchiya, H., Sato, M., Yokotama, J., Ohyuma M., Ohkama, Y.,
Fujiwara, S. and Fuji, T. (1994): Flavonones with potent antibacterial activity
Against Methicillin-resistant Staphlococcus aureus J. Pharmacol: 46
(11):892-895
Mohanlall V., Steenkamp, P.and Odhau, B. (2011): Isolation and characterization of Anthraquinone derivatives from ceratotheca triuloba (Berah) Hook F Journal of medicinal plants Research vol. 5 (14) Durban South Africa
Mojab, F., Kamalinejad, M., Ghaderi, N. Vahidipour H. (2003): Phytochemical Screening of Some Iranian Plant. Iranian J. Phama Res. pp 77-82.
Morrison, R.T. and Boyd, R.N. (2007): Organic Chemistry text book, six editions.Prentice – Hall of India private Ltd, New Delhi. ISBN – 978 – 81- 203 – 0765 – 0, Pp 600 – 630.
Nancy Dele (1986): Flowering plants of Santa Monica mountains.California Native plant Society pp107
Nassiri, A.M, Hosseinzadeh, H. (2005), Review of pharmacological effects of Glycyrrhiza species and its bioactive compounds: Phytotherapy Research Articles 22 (6).
Natarajan, D., Britto, S. J., Scinvasan, K., Nagamurugan, N., Mohanasundas, C. and Porymal, G. (2005): Antibacterial activity of Euphorbia fusiforms. A rare medicinal herb Journal of Enthnopharmacology 1:123-126
Ndukwe, K.C., Okeke, I.N., Lamikanra, A., Adesina, S.K., Aboderin, O. (2005), Antibacterial Activity of Aqueous Extracts of Selected Chewing Sticks. J. Comtemp. Devt. Pract. (6)3 pp086 – 094.
Nguyi, A.A. (1988): Tannins of some Nigerian flora.Niger.J.Biotechiol; 6:221-226.

68
Njoku P. C. and Akumetula, M. I. (2007): Phytochemical and Nutrient Evalution of Spandias Mombin Leaves Pakistan Journal of nutrition 6(6): 613 -615.
Okeke, C.U. (2005): Pytochemical Investigation into Sacoglottis gabenenisis (Balan): Internation Journal of Science and Technology vol. 1&2 Pp (965 -969).
Okwu, D.E. (2001): Evaluation of the chemical composition of indigenous spices and Flavouring Agent Global J. Pure Appl.Sci.7 (3) 455-459.
Okwu, D.E. and Josiah, C.(2006):Evaluation of the chemical composition of two Nigerian medicinal plants. African Journal of Biotechnology,5 (4): 357-361
Okeke, C. U. (2005): Pytochemical Investigation into Sacoglottis gabenenisis (Balan): Internation Journal of Scence and Technology vol. 1&2 Pp (965 -969):
Pandey, B.P and Chand, S. (2007), Plants Anatomy Text book & Company Ltd, ISBN: 81-219- 0145-6 Code: 03016. pp71.
Prescott, M.L., Harley, P.J. and Klein, A .D. (2002):Microbiology.5ed McGraw Hill Inc., pp 39 11.
Rau, O., Wurglics, M., Dingermann, T., Abdel –Tawab, M. and Schubert-Zsilavecz’ M. (2006): Screening of Herbal Extracts for Activation of The Human Peroxisome Proliferator-activated receptor Pharmacy. 66 (11): 952 -956.
Reich, E. Schibi, A. (2007) High Performance Thin –layer Chromatography for the Analysis of Medicinal plants (illustrated Edition): Thieme, New York.
Richard, A.H., Pamela, C.C., Bruce, D.F., (2004), Microbiology Text book 2nd edition, Lippincott Williams and Wilkins, a Wolters Kluwer Business Publisher. Pp 19 -27, 68 – 119.
Robbers, J., Speedie, M., Tyler, V. (1996: Pharmacognosy and Pharmacobiotechnology Willisms and Wilkins, Bactemore pp 1-14.
Siddiqui, A. A. and Ali M. (1987): Practical Pharmaceutical chemistry 1st ed. CBS Publishers and distribution, New Delhi pp126-131.
Simone, C.O., Adukwu, M.U. and Okenta J.M. (1998) Preminary Antimicrobial Screening of the ethanolic extract from the Lichen usnea Subfloridans J Pharmaceutical. Res. Dev 3(2):99-102
Skoog, D.A., West, D.M., Holler, J.F. and Crouch, S.R., (2004): Fundamentals of Analytical chemistry 8th edition, Brooks/cole. Pp 1000 – 1002.

69
Soetan, K.O., Oyekunle, M.A., Aiyelaagbe O.O and Fafunso, M.A. (2006): Evaluation of the antimicrobial activity of Saponins extract of Sorgum bicolor l Moench. African Journal of Biotechnology, 5(23).
Sofowora, E.A. (1984), Medicinal plant and Traditional medicine in Africa, Wiley and Sons Chi Chester. pp 178.
Taylor, L. T, (1996): Supercritical Fluid Extraction, Wiley, New York.
Trease, C. and Evan, C.W. (1989): A Text book of Pharmacology 13th edition Brilliers Tindal Limited London pp 40-58.
Witte, D.P. (1993): Metabolism and Pharmacokinetics of Antrhanoibs Pharmacology 47 Supplement 1 pp 86-97.
World Health Organisation WHO (1993) Summary of WHO guidelines for the assessment of herbal medicines Herbal Gram 28:13-14.
www.en.wikipedia.org/wiki/antibiotic retrieved on 7/4/2006.
Zaki, U. F. (2000): Investigating the Efficacy of Three Plant Species (Sclerocary birrea, Neocarya macrophylla and Grewia mollis) as Anti Snake Venom. MSc. Thesis (Unpublished), submitted to Postgraduate School Usmanu Danfodiyo University, Sokoto.

70
APPENDICES
Appendix 1
Chemical Name Formula Grade % Purity Manufacturer
Ferric Chloride FeCl3 LR 99.5 Sigma
Lead acetate (CH3COO)2Pb LR 99.5 Sigma
Ammonia Solution NH3 LR 35 Sigma
Sodium hydroxide NaOH LR 96 Sigma
Hydrochloric Acid HCl LR 36 Sigma
Sodium Carbonate Na2CO3 LR 99.5 Sigma
Bismuth nitrate Bi(NO3)3.5H2O Analar Sigma
Nitric Acid HNO3 LR 70 Sigma
Potassium iodide KI 99.5 BDH
Mercuric Chloride HgCl2 97 BDH
Acetic Acid CH3COOH Sigma
Iodine (crystals) I2 Sigma
Sulphuric Acid H2SO4 99.8 Sigma
Benzene C6H6 Sigma
Acetic anhydride (CH3CO)2O 99.5 Scietific & Chemical Supplies Ltd.
Nutrient agar LR
Ethanol C 2H5OH Analar 99.8 Sigma
Chloroform CHCl3 Analar 99.8 Sigma
Ethyl Acetate CH3COOC2H5 Analar 99.5 Sigma
n- Hexane C6H14 Analar 99.5 Sigma
Petroleum Ether Analar 99.8 Sigma
Silica Gel 60 – 120 mesh
SiO2 LR _ Qualikems

71
Appendix 2: Computation of Extracts yield
Weight of extract x 100 Weight of sample Leave 35.8 x 100 = 11.76% 300
Stem 25.51 x 100 = 8.50% 300
Root 29.82 x 100 = 9.94% 300
Calculation of Rf Value using benzene: ethylacetate
Rf 1 = 4.0 = 0.61 6.5
Rf 2 = 4.5 = 0.59 6.5
Rf 3 = 5.0 = 0.76 6.5
Rf 4 = 5.6 = 0.80 6.5
Rf 5 = 5.8 = 0.89 6.5
Rf 6 = 5.9 = 0.91 6.5

72
Appendix 3: Zone of Inhibition

73
Appendix 4: TLC Plates of chloroform fraction

74
Appendix 5: UV Spectra

75
Appendix 6: IR Spectra
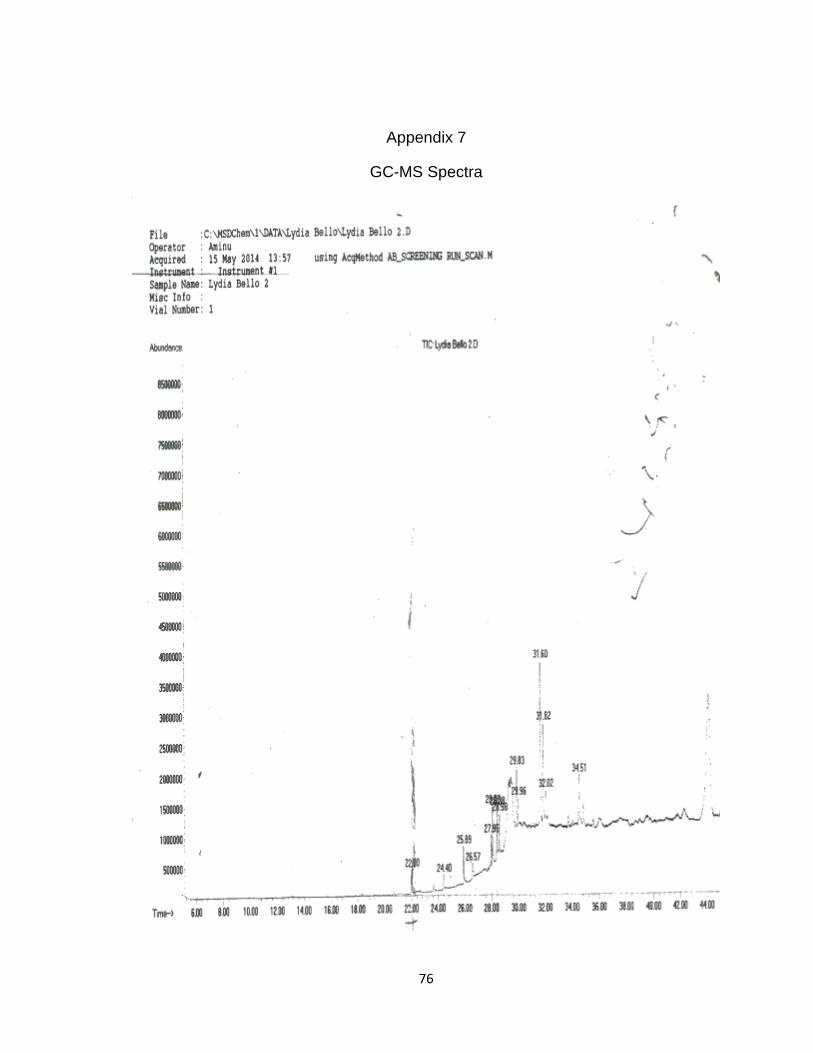
76
Appendix 7
GC-MS Spectra

77