title suitable for the running head: moca: rasch analysis
TRANSCRIPT

MoCA: Rasch analysis _ 1
Title: Psychometric properties of the Montreal Cognitive Assessment (MoCA): An
analysis using the Rasch model
Title suitable for the running head: MoCA: Rasch analysis
Authors:
Sandra Freitas1,2, Gerardo Prieto3, Mário R. Simões 2,4 & Isabel Santana 1,5,6
1 Centre for Neuroscience and Cell Biology (CNC), University of Coimbra, Coimbra,
Portugal
2 Centro de Investigação do Núcleo de Estudos e Intervenção Cognitivo
Comportamental (CINEICC), University of Coimbra, Coimbra, Portugal
3 Departamento de Psicología Básica, Psicobiología y Metodología de las Ciencias del
Comportamiento, Universidad de Salamanca, Salamanca, Spain
4 Psychological Assessment Lab., Faculty of Psychology and Educational Sciences,
University of Coimbra, Coimbra, Portugal
5 Neurology Unit, Centro Hospitalar e Universitário de Coimbra, Coimbra, Portugal
6 Faculty of Medicine, University of Coimbra, Coimbra, Portugal
Corresponding Author:
Sandra Freitas
Centre for Neuroscience and Cell Biology (CNC), University of Coimbra, Largo
Marquês de Pombal 3004-517 Coimbra, Portugal
E-mail: [email protected]
Phone: +351 239820190
Fax: +351 239822776

MoCA: Rasch analysis _ 2
Funding
This work was supported by the Fundação para a Ciência e Tecnologia
[Portuguese Foundation for Science and Technology; SFRH/BPD/91942/2012 to S.F.].
Conflict of Interest
None declared.
MoCA: Rasch analysis _ 3
Abstract
In the present study, we analyzed the psychometric characteristics of the MoCA
(Portuguese version) using the Rasch model for dichotomous items. The total sample
comprised 897 participants distributed between two main subgroups: (I) healthy group
that was comprised of 650 cognitively healthy community dwellers and (II) clinical
group that was comprised of 90 patients with Mild Cognitive Impairment, 90 patients
with Alzheimer’s Disease, 33 patients with frontotemporal dementia, and 34 patients
with vascular dementia recruited at a reference dementia clinic. All patients were
investigated through a comprehensive neuropsychological assessment, laboratory tests
essential to exclude a reversible form of dementia, imaging studies (CT or MRI and
SPECT or FDG-PET), Apolipoprotein E allele genotyping and CSF biomarker
(A42,Tau, and P-tau) analyses. The clinical diagnosis was established through the
consensus of a multidisciplinary team, based on international criteria. The results
demonstrated an overall good fit of both items and the persons values, a high variability
on cognitive performance level, and a good quality of the measurements. The MoCA
scores also demonstrated adequate discriminant validity, with high diagnostic value.
DIF analyses indicated the generalized validity of the MoCA scores. In conclusion, the
results of this study show the overall psychometric adequacy of the MoCA and verify
the discriminant and generalized validity of the obtained results.
Keywords: MoCA; Assessment; Cognitive Impairment; Rasch Model

MoCA: Rasch analysis _ 4
Introduction
Increased life expectancy is one of the most significant demographic trends of
the last decades. Population aging is a reality, and the proportion of elders has rapidly
increased in most countries (Federal Interagency Forum on Aging-Related Statistics,
2000). Moreover, aging is a crucial risk factor for cognitive impairment and dementia
(Chen, Lin, & Chen, 2009), which is one of the most significant health issues among
older people, with a serious impact in health-care systems worldwide (Comas-Herrera,
2011; Federal Interagency Forum on Aging-Related Statistics, 2010).
Therefore, early diagnosis and screening for cognitive impairment are of
extreme importance. Cognitive screening instruments remain the best method for the
early detection of dementia in population studies (Cullen, O’Neill, Evans, Coen, &
Lawlor, 2007; Ismail & Shulman, 2006), facilitating the identification of individuals in
preclinical stages (Fabrigoule, Barberger-Gateau, & Dartigues, 2006). However, the
accuracy of the results from these evaluations can be compromised if the versions of the
instruments from different cultures are not subject to rigorous translation and adaptation
studies to the new cultural background. The lack of psychometric validation studies of
the instruments used is also an important issue.
The Montreal Cognitive Assessment (MoCA; Nasreddine et al., 2005) was
specifically developed as a brief cognitive screening test for the identification of milder
forms of cognitive impairment among older people. Previous studies have confirmed
the adequate psychometric properties (evaluated according to the Classical Test
Theory), and excellent sensitivity, utility and accuracy of the MoCA for the
identification of patients with Mild Cognitive Impairment (MCI) and Alzheimer’s
Disease (AD) (Freitas, Simões, Alves & Santana, 2013; Fujiwara et al., 2010; Lee et al.,
2008), and cognitive impairment associated with other clinical conditions (e.g.,

MoCA: Rasch analysis _ 5
Vascular Cognitive Impairment, Parkinson Disease, Huntington Disease, tumors, and
multiple sclerosis; see studies in http://www.mocatest.org). The consistent achievement
of good results has led to the widespread use, international recognition, acceptance in
various guidelines and subsequent recommendation of the MoCA as a cognitive
screening tool (e.g., Arnold et al., 2007; Gauthier et al., 2011; Hachinski et al., 2006).
The MoCA has been commonly used to measure global cognitive function in
both clinical and research contexts. However, the accuracy of the results of this
cognitive screening instrument must be supported by psychometric validation studies.
The Rasch model (Andrich, 1988; Rasch, 1960; Wright & Mok, 2004) is a
psychometric method appropriated for the analysis of neuropsychological assessment
instruments with this purpose (Conrad & Smith, 2004; Prieto, Contador, Tapias-Merino,
Mitchell & Bermejo-Pareja, 2012; Prieto, Delgado, Perea & Ladera, 2010). Indeed, the
Rasch model plays an important role in modern psychometric studies, with relevant
applications for the development and evaluation of measures for the quantification of
cognitive impairment. Among other uses and strengths, the Rasch model estimates the
specific precision of the cutoff values for the classification of patients, examines the
differential functioning of an item according to different groups, and generates a linear
estimate of cognitive status. Few previous studies have examined the psychometric
properties of the MoCA using the Rasch model. Koski and collaborators (2009)
demonstrated that the MoCA provides a reliable and valid quantitative estimate of the
cognitive function based on the collective evaluation of cognition as a unidimensional
construct. These results validated the utility of the MoCA, beyond qualitative screening
classifications, for use in monitoring changes in global cognition over time.
Subsequently, Koski and collaborators (2011) presented an algorithm, combining the
items of the Mini Mental State Examination (MMSE; Folstein, Folstein, & McHugh,

MoCA: Rasch analysis _ 6
1975) and the MoCA to improve the measurement precision of the cognitive ability in
milder forms of impairment. In another study based on Rasch’s analysis, Konsztowicz
and collaborators (2011) proposed a simplified adaptive approach to cognitive
assessment (Geriatric Rapid Adaptive Cognitive Estimate - GRACE method), which
reduces the test burden and facilitates the assessment of individuals across a broader
range of the cognitive ability continuum compared with the MMSE and MoCA.
After translation and adaptation studies (Freitas, Simões, Martins, Vilar &
Santana, 2010) and the normative study of the MoCA regarding the Portuguese
population (Freitas, Simões, Alves & Santana, 2011), we have conducted various
validation studies. Some of these studies further emphasize the psychometric
characteristics of the instrument (Freitas, Simões, Marôco, Alves & Santana, 2012;
Freitas, Simões, Alves & Santana, 2012), while others primarily focus on specific
clinical groups (MCI and AD – Freitas et al., 2013; Frontotemporal dementia – Freitas,
Simões, Alves, Duro & Santana, 2012; Vascular dementia – Freitas, Simões, Alves,
Vicente & Santana, 2012). The present study was undertaken with the aim of further
assessing the psychometric characteristics of the MoCA using the Rasch model for
dichotomous items. Moreover, this is the first proposed study with the MoCA
Portuguese version using the Rasch model. We initially examined the fit of the data to
the model and the reliability values for the estimation of the items and persons. After
testing the data fit, we performed DIF analyses to explore the likelihood that individual
items of the MoCA might work differently as a function of pathology, gender, age and
educational level. Thus, this study contributes to overcoming a significant gap in the
evaluation of the psychometric properties of this instrument.
Method

MoCA: Rasch analysis _ 7
Participants and procedures
The total sample comprised 897 participants distributed between two main
subgroups:
I) Healthy Group
The healthy group was comprised of 650 cognitively healthy community
dwellers living in all geographic regions of the Portuguese continental territory recruited
through the national health and social security services. The inclusion criteria were:
individuals 25 years and over that spoke Portuguese as their native language and had
undergone schooling in Portugal; an absence of significant motor, visual or auditory
deficits - all of which may influence performance on tests; and to ensure that
participants were cognitively healthy: autonomy in daily activities; no history of
alcoholism or substance abuse; absence of neurological or psychiatric diseases and
chronic unstable systemic disorders that have an impact on cognition (e.g., vitamin
deficits, hypothyroidism, uncontrolled diabetes, hypertensive encephalopathy, systemic
infections, abstinence syndromes and delirium); and absence of significant depressive
complaints and medication with possible impact in cognition (e.g., psychotropic or
psycho-active drugs). A psychologist confirmed the presence of these criteria in an
interview using a standard questionnaire that included a complete socio-demographic
questionnaire, an inventory of the current clinical health status, and past habits and
medical history. Regarding older participants, this information was also verified through
general practitioners, community center directors and/or informants, typically a close
relative or an individual living with the participant. In this group, given the sample size
and geographical distribution of the participants, it was not possible to perform a
neurological consultation or additional diagnostic tests, such as neuroimaging or
biomarker analyses. After this initial selection, a global assessment was conducted using

MoCA: Rasch analysis _ 8
the following set of instruments: the MMSE (Folstein et al., 1975; Guerreiro, Silva,
Botelho, Leitão, Castro-Caldas & Garcia, 1994); the Clinical Dementia Rating scale
(CDR - Hughes, Berg, Danziger, Coben & Martin, 1982; Garret, Santos, Tracana,
Barreto, Sobral & Fonseca, 2008), for participants over 49 years old; the Irregular
Word Reading Test (TeLPI: Teste de Leitura de Palavras Irregulares - Alves, Simões &
Martins, 2009), for pre-morbid intelligence estimation; the Subjective Memory
Complaints scale (SMC - Schmand, Jonker, Hooijer & Lindeboom, 1996; Ginó,
Mendes, Ribeiro, Mendonça, Guerreiro & Garcia, 2008); and the Geriatric Depression
Scale (GDS-30 - Yesavage, Brink, Rose, Lum, Huang, Adey & Leirer, 1983; Barreto,
Leuschner, Santos & Sobral, 2008). Only participants with normal performance on the
MMSE (according Portuguese cutoff points – Guerreiro et al., 1994), a zero score on the
CDR and a GDS-30 score below 20 points were eligible for participation in this study.
This sample served as the basis for the MoCA normative study for the Portuguese
population (Freitas, Simões, Alves & Santana, 2011), where can be found more details
about the recruitment process.
II) Clinical Group
The clinical group was recruited at the Dementia Clinic, Neurology Unit of the
Centro Hospitalar e Universitário de Coimbra and included 90 patients with MCI, 90
patients with AD, 33 patients with frontotemporal dementia (FTD), and 34 patients with
vascular dementia (VaD). All patients were investigated through a comprehensive
neuropsychological assessment, laboratory tests essential to exclude a reversible form of
dementia or significant comorbidities, imaging studies (CT or MRI and SPECT or
FDG-PET), Apolipoprotein E allele genotyping and eventually CSF analyses
(A42,Tau, and P-tau) and biomarker profiles for neurodegenerative diseases. This

MoCA: Rasch analysis _ 9
comprehensive evaluation was considered essential to exclude non-degenerative or
vascular forms of cognitive decline and for the differential diagnosis of these situations.
The final diagnosis was established through a consensus reached by a multidisciplinary
team based on the international criteria for (i) MCI (Petersen, 2004, 2007), (ii) probable
AD (American Psychiatric Association, 2000; McKhann, Drachman, Folstein, Katzman,
Price & Stadlan, 1984), (iii) FTD (Neary et al., 1998); and (iv) VaD (Román et al.,
1993). The MCI group included patients classified as “amnestic MCI” (single or
multidomain) (Petersen, 2007), with a classification of 0.5 on the CDR. The AD, FTD
and VaD groups included only patients with mild to moderate severity (classified with
CDR ≤ 2 and MMSE ≥ 12 points). The FTD group only included patients with
behavioral variant of disease. Patients with Vascular Mild Cognitive Impairment or
mixed dementia were not included in the VaD group. In addition, only patients with a
complete clinical evaluation, a well-established diagnosis at the time of the data
collection according to the above international criteria and a stable clinical condition,
without significant comorbidities were eligible for this study. At the outset, the
exclusion criteria included high-dementia severity; recent pharmacotherapy changes;
recent psychiatric comorbidity (a clinical diagnosis in the 6 months prior to the current
neuropsychological evaluation); and significant motor or sensorial deficit, which could
influence neuropsychological assessment.
Each participant was assessed in a single session by one of two psychologists
with expertise in neuropsychological assessment. Informed consent was obtained from
all participants after the research aims and procedures and the confidentiality
requirements were fully explained by a member of the research team. For patients who
were not capable of providing informed consent, a legal representative fulfilled this
requirement on their behalf. The present study complies with the ethical guidelines on

MoCA: Rasch analysis _ 10
human experimentation stated in the Declaration of Helsinki and was approved through
the Portuguese Foundation for Science and Technology and the Faculty of Psychology
and Educational Sciences Scientific Committee.
Measure: Montreal Cognitive Assessment
The MoCA is a brief cognitive screening instrument developed to screen milder
forms of cognitive impairment, providing a quick indication of the global cognitive state
of an individual. The MoCA includes a one-page test, which requires a short
administration time (10 to 15 minutes), and a manual explicitly describing the
instructions for administering the tasks and objectively portraying the defined scoring
system. The MoCA covers a wide range of cognitive functions, such as short-term
memory, executive functions, visuospatial abilities, language, attention, concentration,
working memory, and temporal and spatial orientation. A MoCA score is generated
through the summation of the points of each successfully completed task, in a range
from 0 to 30 points, with higher scores indicating better cognitive performance
(Nasreddine et al., 2005). In the present study, the MoCA was not used as a diagnostic
tool. Furthermore, the MoCA total score refers to the raw score without a correction
point for the educational effects proposed in the original study (Nasreddine et al., 2005)
because this correction point is not used in the Portuguese population (Freitas et al.,
2011). The cultural adaptation of MoCA to the Portuguese population involved
translation, linguistic improvement of the instrument and manual, studies with the
experimental version, revision and adjustments required to finalize the Portuguese
version, and an analysis of the equivalence to the original version. The equivalence
between the original and the Portuguese final version at six levels (conceptual, of item,
MoCA: Rasch analysis _ 11
semantic, operational, of measurement and functional) was verified according to
Herdman and collaborators (1998) (Freitas et al., 2010).
Statistical Analysis
Descriptive statistics were used to characterize the sample, performed using the
Statistical Package for the Social Sciences (SPSS, version 19.0) (IBM SPSS, Chicago,
IL).
The Rasch analysis was computed using the WINSTEPS 3.70.1 package
(Linacre, 2011). The dichotomous Rasch model states that the probability of success, in
terms of hitting an item (X=1), is a logistic function of the difference between the
person’s ability (Bn) and the difficulty of the item (Di). According to Wright and Mok
(2004):
Pni = exp(Bn – Di) / [1+ exp(Bn – Di)]
The values for the individuals and items are typically expressed into a logits
(units of measurements) scale with interval-level properties (Conrad & Smith, 2004).
The accuracy of the item-persons estimations was assessed using the standard
error of parameters (standard deviation of estimates), item-person separation index,
Person Separation Reliability (PSR) and Item Separation Reliability (ISR) statistics.
PSR and ISR statistics (range: 0-1) are similar to the classical reliability coefficient (the
ratio between true variance and observed variance of persons or items). To achieve a
suitable measure, a value above 0.70 is recommended. The Item or Person Separation
Index (G) is a ratio of true standard deviation and standard error of items or persons (an
estimate of the spread of separation of persons or items on variable expressed in
standard error units). The Separation Index ranges from 0 to infinity; a higher G value
indicates that measures are more dispersed on the variable (Schumacker, 2004). An

MoCA: Rasch analysis _ 12
important use of the G value is the calculation of the number of distinct ability levels
separated by 3 errors of measurement (strata). Strata are computed according to the
formula ([4G + 1] / 3). The number of strata indicates the utility of an assessment
instrument to determine group differences.
The major assumption of the Rasch model is unidimensionality, represented on a
single dimension where subjects and items are conjointly located. Analysis with the
Rasch model of MoCA was validated through previous analyses showing that the data
have a good fit to a proposed dominant second order-factor (Freitas, Simões, Marôco, et
al., 2012), thus ensuring the assumption of fundamental unidimensionality. In the
context of the Rasch model, the unidimensionality test was performed using a principal
component analysis of the residuals (Chou and Wang, 2010). Although strict
unidimensionality is never achieved in practice (Zickar and Broadfoot, 2009), a
principal component analysis of the residuals allows an assessment of whether the lack
of unidimensionality is large enough to threaten the score validity. According to Linacre
(2011), fundamental unidimensionality is achieved when the variance explained by the
model measures is greater than 50 percent and if the eigenvalue of the first component of
residuals is small (usually less than 2.0). Reckase (1979) proposed a less stringent
criterion, suggesting that the percent of variance explained should be greater than 20%
and that there should not be a second dominant factor (the eigenvalue of the first
component of residuals less than 3.0).
The properties of the Rasch model can only be attained if the empirical data fit
the model predictions. Thus, a fit analysis was performed based on two main indicators:
the means of the residuals (Infit and Outfit) and Differential Item Functioning (DIF)
analysis.

MoCA: Rasch analysis _ 13
The statistics Infit and Outfit quantify the means of the squared residuals
(differences between the observed responses and those predicted in the model). Person
fit statistics measure the extent to which a person’s pattern of responses to the items
corresponds with that predicted by the model. Item fit statistics are used to identify
items that might not contribute to a unitary scale. Misfit items should be examined to
determine whether a second dimension might exist. These items should be eliminated
when a one-dimensional measure of the construct is required (Conrad & Smith, 2004).
Infit and Outfit have an expected value of 1.0. Values larger than 1 indicate noise. A
rule of thumb for assessing item fit has been to discard any item with Infit or Outfit
values greater than 2.0 (severe noise) (Smith, 2000). Other authors suggest that values
greater than 1.4 indicate a moderate misfit (Gardizi, Millis, Hanks, & Axelrod, 2012).
Conventionally, the misfit is considered to be moderately high if these statistics range
between 1.5 and 2.0, and severe if the statistics are higher than 2.0 (Linacre, 2011).
A test item is considered to have Differential Item Functioning (DIF) when
individuals with the same level in the variable being measured, belonging to different
groups (e,g., gender, pathologies), do not have the same likelihood of producing a
correct answer. The presence of DIF can have adverse consequences for the validity of
scores, as DIF reveals the inclusion of construct-irrelevant variance in the scores, given
that there are factors having nothing to do with the measured attribute affecting the
responses. The presence of DIF likely suggests that factors outside the construct
measured are spuriously affecting the MoCA scores.
The hypothesis of the absence of DIF was tested on persons with different
pathology, gender, age and education levels by comparing two groups (focal and
reference) of these variables (pathology: healthy / clinical; gender: male / female; age: <
65 years old / > 64 years old; education: 1-4 years / > 4 years). In this study, we
MoCA: Rasch analysis _ 14
employed two methods with different characteristics (Potenza & Dorans, 1995): the
Mantel-Haenszel procedure (a non-parametric method based on direct scores) and
Rasch-based DIF analysis (a parametric method based on values in a latent variable).
The Mantel-Haenszel (MH) method compares the answers given to an item by
focal and reference groups whose members have the same level in the attribute
measured. The total score in the variable is used as an internal matching criterion
(Holland & Thayer, 1988). The procedure is based on an analysis of the contingency
tables corresponding to the different levels in which the variable has been divided. For
each level j, the odds ratio () is calculated as:
= (pRj/1-pRj) / (pFj/1-pFj),
where pRj and pFj are the odds of a correct answer to the item in the reference and focal
groups, respectively. There will be no DIF on a specific level j if = 1 (the likelihood
of responding to the item correctly is equal in the focal group and the reference group).
The MH statistic reports an average weighted odds-ratio across an entire score level
(Dorans & Holland, 1993; Holland & Thayer, 1988). The usual interpretation of the
MH statistic is that values close to 1 indicate an absence of DIF; values notably greater
than 1 indicate a DIF in favor of the reference group; and values closer to 0 reveal a DIF
in favor of the focal group. The null hypothesis of the absence of DIF (MH=1) can be
tested using the MH2 statistic (Holland & Thayer, 1988), which is distributed as 2
with one degree of freedom. Testing the absence of DIF on a test involves multiple
comparisons (at least one for each item). It is therefore logical to use the Bonferroni’s
adjustment to maintain the family wise error rate (usually .05). As a result, each
individual hypothesis is tested at a statistical significance level of p<.05/number of
contrasts (Benjamini & Hochberg, 1995).
Given that the MH is not symmetrical, Holland and Thayer (1988) proposed a

MoCA: Rasch analysis _ 15
logarithmic transformation called Delta-MH (MH), whose values oscillate
symmetrically around zero. A zero value indicates the absence of DIF; a negative value
shows that the item favors the reference group; and a positive value indicates the focal
group. Delta-MH is obtained through the transformation MH = -2.35 ln (MH).
Based on the Delta-MH statistic, Zwick and Ercikan (1989) proposed a classification of
DIF magnitude into three categories (adopted by the Educational Testing Service):
Type A items-negligible DIF: MH < |1|.
Type B items-moderate DIF: |1| ≤MH ≤ |1.5|, and the MH test statistically
significant.
Type C items-large DIF: MH > |1.5|, and the MH test statistically significant.
In addition to the MH method, we have also used a detection method derived
from the Rasch model (1960). The most important property of the model, specific
objectivity (Andrich, 1988), indicates that individuals with the same ability (B) will
have the same likelihood of correctly answering an item, regardless of whether they
belong to groups with different pathology, gender, age or education. The DIF detection
procedure in the RM is based on the Item Characteristic Curve (ICC), the proportion of
individuals at the same ability level who answer a given item correctly: if the item
measures the same ability across groups, then, except for random variations, the same
proportion is observed irrespective of the nature of the group. That is, in the absence of
DIF, the ICC in the different groups and the item parameter of difficulty (D) will be
invariable. As a result, the hypothesis of the absence of DIF was tested by calculating the
difference between the estimators of the item parameter of difficulty for each group (Df
– Dr), thus controlling for potential differences between the groups in the latent variable.
Wright and Douglas (1976) observed that differences lower than 0.50 logits had
negligible consequences regarding the validity of the measures. Thus, the DIF is
MoCA: Rasch analysis _ 16
considered substantial if the absolute difference is higher than 0.50 logits and
statistically significant. The t test with Bonferroni’s adjustment (Benjamini &
Hochberg, 1995) was used to test the significance and is described below.
t = Df – Dr / (SEDf 2 + SEDr
2)1/2
That is, SEDf and SEDr are the standard errors of both parameters of difficulty. If
any of the t-tests in the list have p <.05/(number of t-tests in the list), then the
hypothesis of No DIF is rejected (Bonferroni’s correction).
Results
Sample Characterization
The total sample was comprised of 897 participants. The characterization of the
study sample is presented in Table 1, in more detail for all subgroups. For this
description, the following variables were considered: sample size, gender, age,
educational level and MoCA score.
(Insert Table 1 about here)
Unidimensionality
First, the unidimensionality of the data were analyzed through a principal
component analysis of residuals. The results show that the data fulfill the criteria of
Reckase (1979) to uphold the assumption of basic unidimensionality: the percentage of
variance explained by measures (41.8%) is higher than 20%, and the eigenvalue of the
first component of the residuals (2.4%) is low (4.3% of the variance), indicating that a
second dominant factor does not exist.
Item Analysis

MoCA: Rasch analysis _ 17
The Infit and Outfit statistics show the validity of the items and persons values.
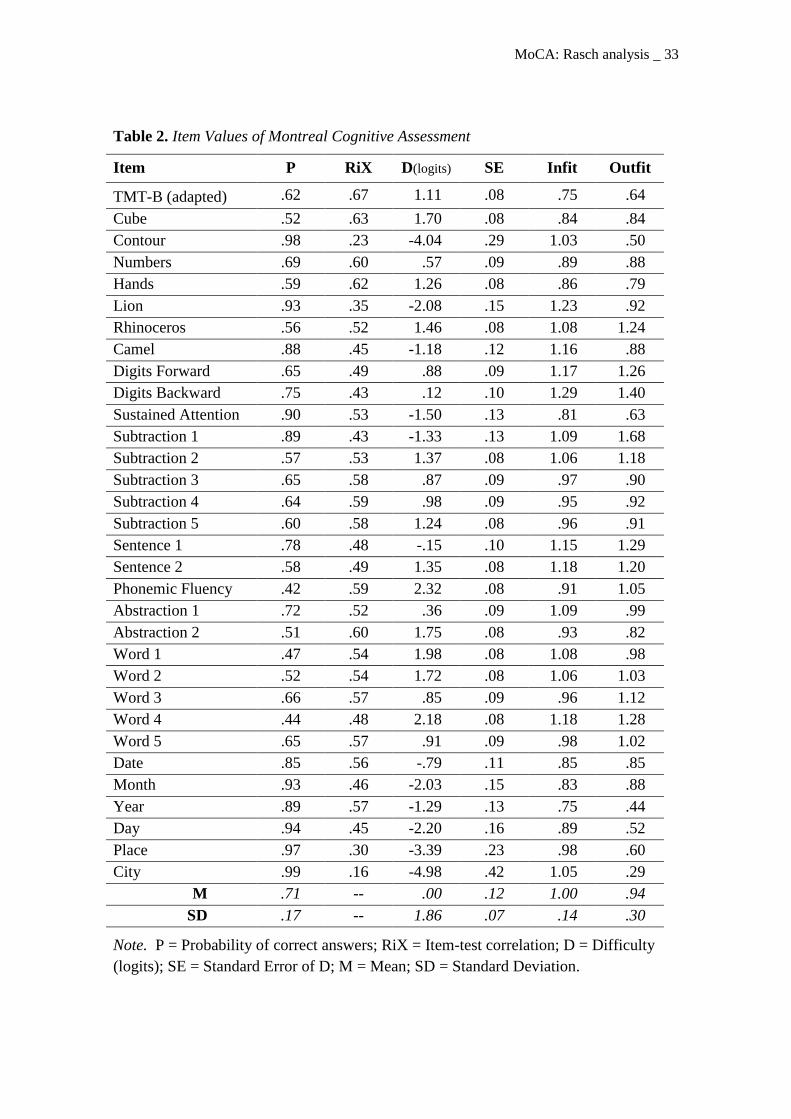
The statistics for the item fit are provided in Table 2. We can observe that the Infit
values range between .75 and 1.29, and the Outfit values oscillate between .29 and 1.68.
According to Linacre (2011), values between .50 and 1.50 indicate a suitable fit, while
values higher than 2.0 indicate a severe misfit. Thus, no items revealed a severe misfit;
only the first subtraction item showed a moderate misfit (Outfit value > 1.5). As
observed in the Figure 1, the items showed a high variability at the cognitive
performance level, ranging between -4.98 and 2.32 (SD=1.86); the extreme items were
City and Phonemic Fluency, respectively. From the perspective of classical test theory,
most of the items had proper discrimination (RiX>.30). Indeed, the average of item-test
correlations was .50 (SD=.11). Only the extremely easy items (Contour and City)
showed low levels of discrimination.
(Insert Table 2 about here)
(Insert Figure 1 about here)
Person Analysis
Table 3 summarizes the descriptive statistics of the participants’ scores (n=897).
Both the classic scores and the logits values revealed a high variability between subjects
on the scale. It was observed that no individual possessed the extreme minimum score
and only 5.7% of individuals possessed the maximum extreme score. The mean of logits
(1.78) showed that the average cognitive performance of the total sample is high. This
fact is a consequence of the large number of cognitively healthy participants in the
sample (72%). The presence of subjects with a severe model misfit is low (5.2%). The
person values have been estimated with high reliability in both hits (α = .92) and logits
(Person Separation Reliability = .85). The Person Separation Index (2.39) separates

MoCA: Rasch analysis _ 18
individuals into a 3.5 strata in the variable, indicating that the MoCA is useful for
assessing individual differences in the measured variable.
(Insert Table 3 about here)
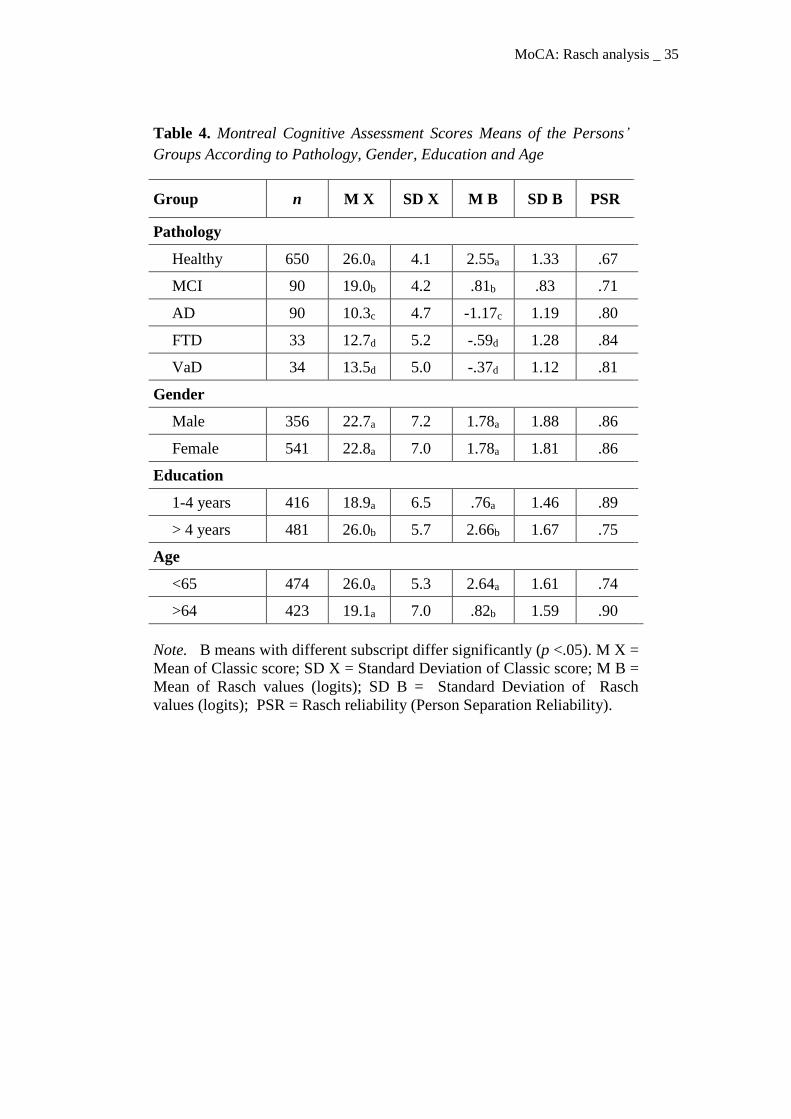
The means of the persons groups classified according to pathology, gender,
educational level and age are presented in Table 4. The MoCA scores showed good
discriminant validity with high diagnostic utility, as indicated by the large and
significant differences observed between control and clinical groups. The effect size
(Cohen’s d) (1988) ranged between 1.57 (in MCI group) and 3.22 (in FTD group).
Moreover, with the exception of the comparisons between FTD and VaD, the group
means differed significantly among all clinical groups. As expected, according to a
previous study (Freitas, Simões, Alves & Santana, 2012), the mean cognitive
performance was similar in both genders. However, the mean cognitive performance of
participants with primary educational level (1 to 4 years) was significantly lower than
the mean of the group with higher educational level (> 4 years) (t=15.8; df=839; p<.01;
d=1.21). Similarly, the MoCA performance differed significantly according to age; the
group of older participants (more than 64 years old) had a lower performance (t=17.0;
df=886; p<.01; d=1.14).
(Insert Table 4 about here)
Differential Item Functioning
The absence of DIF tendency is a requisite for screening tests, essentially
because we would not be able to compare the performance of different groups (healthy
vs. clinical) if the MoCA did not have the same metric properties (Prieto et al., 2012).
After testing the data fit, DIF analyses were conducted to explore the likelihood that
individual items of the MoCA might work differently as a function of pathology,
MoCA: Rasch analysis _ 19
gender, age and educational level. Table 5 displays the items that showed DIF according
to these variables. It was considered that an item showed appreciable DIF if the
following criteria were met: (a) a difference greater than .50 logits and statistically
significant difference (Bonferroni’s correction) between the difficulty parameters of the
reference group and the focal group (Prieto et al., 2010) (PBonferroni = .05/32 = .0016) and
(b) a Delta MH value classified as C, consistent with the criteria of the Educational
Testing Service (Padilla, Hidalgo, Benitez & Gómez-Benito, 2012) (C in logits:
size>.64). According to the established criteria, the items showed no age-related DIF.
Nevertheless, there were a few items that revealed DIF associated with pathology (7
items), education (7 items) and gender (4 items). Notably, the benefits of these items are
balanced in these three variables: half of the items with DIF favor the reference group
and the remaining items favor the focal group (control vs. clinical; female vs. male; low
education vs. high education). This phenomenon is known as bias cancellation because
at the overall test score level the respective biases might cancel each other out
(Drasgow, 1987; Nandakumar, 1993; Roznowski, 1987).Therefore, it is reasonable to
assume that the items with DIF do not spuriously change the differences in MoCA
according to pathology, education and gender.
Discussion
The MoCA is a brief cognitive screening test that was specifically developed to
screen for milder forms of cognitive impairment, and this test has been extensively
validated for many disorders (see studies in http://www.mocatest.org). Several studies
have reported the good psychometric properties (e.g., excellent levels of internal
consistency; good correlations with others measures of global cognitive status, which
suggests good convergent and construct validity; and high discriminant validity between

MoCA: Rasch analysis _ 20
controls and several clinical groups) and excellent sensitivity of the MoCA to cognitive
impairment (e.g., Damian et al., 2011; Freitas et al., 2013; Fujiwara et al., 2010), which
has resulted in the rapid international dissemination and recommendation of this test as
a cognitive screening tool in various guidelines (e.g., Arnold et al., 2007; Gauthier et al.,
2011; Hachinski et al., 2006). Few previous studies have examined the psychometric
properties of the MoCA using the Rasch model. The Rasch model (Andrich, 1988;
Wright & Mok, 2004) is a psychometric method that has been used for the analysis of
neuropsychological assessment instruments (Conrad & Smith, 2004; Prieto et al., 2012;
Prieto et al., 2010). The overall aims of the present study was to analyze the
psychometric characteristics of the MoCA using the Rasch model for dichotomous
items, through the evaluation of the data fit and the reliability values and to determine
the presence of DIF in individual items of the MoCA according to pathology, gender,
age and educational level.
The results of this study reveal an overall good fit of both the items and the
persons values. The item analysis revealed the overall psychometric adequacy of the
items of the MoCA. No items revealed a severe misfit. The subtraction items of the
MoCA are the only task that is inter-related. However, we choose treat all items
separately, since the results of our study show that infit and outfit values of these items
do not reveal a severe misfit. Although the first subtraction item showed a moderate
misfit (Outfit value > 1.5; Linacre, 2011), the other items of this task adequately fit the
model. A high variability on cognitive performance level also indicated the validity of
the MoCA items. Considering the results of the person analysis, the psychometric
characteristics of the measures are appropriate. Both the classic scores and the logits
values revealed a high variability between the subjects, and the person values have been
estimated with high reliability in both hits and logits.

MoCA: Rasch analysis _ 21
The MoCA scores also demonstrated good sensitivity and specificity. This
discriminant validity is supported by the large and significant mean differences between
the control group and the clinical groups and between the clinical groups with different
diagnoses, except for the comparison of FTD and VaD, which are groups with small
sizes (33 and 34 patients, respectively). Statistically significant differences in the mean
cognitive performance between educational level groups were also observed, with poor
MoCA scores in participants with the lowest educational level. Similarly, the MoCA
performance differs significantly according to age, with the lowest MoCA scores for the
older participants. However, the mean cognitive performance was similar in both
genders. These results are consistent with previous studies in the Portuguese population
(Freitas et al., 2011; Freitas, Simões, Alves & Santana, 2012).
DIF analyses were conducted to explore the possibility that individual items of
the MoCA might work differently as a function of pathology, gender, age and
educational level. The MoCA items have invariance properties for young and older
adults, as no items showed an age-related DIF. Regarding the other variables, there were
few items that revealed DIF, verifying a balance pattern between the items that benefit
the focal group and the items that benefit the reference group (control vs. clinical;
female vs. male; low education vs. high education).
The overall good fit of both items and persons values, the high variability of
both cognitive performance level of the items and between subjects on the scale, the
high reliability in estimation of person values, the good sensitivity and specificity
observed, and the balance pattern verified in the DIF analyses demonstrate the
suitability of the instrument for the brief cognitive assessment of both cognitively
healthy adults and patients with cognitive decline. Thus, our results suggest the utility of
the MoCA in the cognitive screening of the adults from the community and in global

MoCA: Rasch analysis _ 22
cognitive status assessment and follow-up of dementia spectrum patients in primary
clinical settings and geriatric health care facilities.
We propose that the added value of the present study is the rigorous
methodology used, including I) rigorous MoCA application, with no inter-rater
variability (all participants were assessed by one of two expert neuropsychologists); II)
well-validated study samples (diagnosis of clinical groups were established by a
multidisciplinary team using standard criteria and based on a full investigation); III)
homogeneity of the clinical groups (patients with misclassification and more advanced
dementia cases were excluded); and IV) a control sample with subjects recruited from
the community that were well-characterized as cognitively healthy adults.
Some limitations of the current study must be addressed. One of the main
weaknesses of this study was the classification of participants as cognitively healthy
subjects. To ensure cognitive health, we established strict criteria for inclusion and
exclusion in the sample, as previously explained, and these criteria were confirmed in
the clinical interview and neuropsychological evaluation. Furthermore, for older
participants, confirmatory information was also obtained through a general practitioner,
community center director and/or an informant. However, given the sample size and
geographical distribution of the participants, it was not possible to perform a
neurological consultation or additional diagnostic tests, such as neuroimaging, which
would have further ensured the normal cognitive status of the participants. Another
point is the clinical samples size, which did not allow a more detailed analysis
considering the clinical groups separately. Moreover, due to the lack of other studies
using DIF analyses, a comparative analysis of these results with other studies cannot be
performed, and the specific comparison of this investigation with other MoCA studies
using the Rasch model is not feasible given the differences in the objectives and

MoCA: Rasch analysis _ 23
methodologies of the studies. Although all studies are converging to further emphasize
the good psychometric properties and high utility of this test for the brief assessment of
global cognitive status.
Lastly, some future considerations should be taken into account when analyzing
the present results. Although the MoCA Portuguese version resulted in a rigorous
process that followed the methodological guidelines for cultural adaptation studies, and
the maximum equivalence between the original instrument and the Portuguese final
version of the MoCA was pursued (Freitas et al., 2010), the generalization of these
results to other target populations should be cautiously considered.
In conclusion, the results of this study highlight the overall psychometric
adequacy and the discriminant and generalized validity of the results of the MoCA.
References
Alves, L., Simões, M. R., & Martins, C. (2009). Teste de Leitura de Palavras
Irregulares (TeLPI) [Reading Word Irregular Test]. Coimbra, Portugal: Serviço
de Avaliação Psicológica da Faculdade de Psicologia e de Ciências da Educação
da Universidade de Coimbra [Psychological Assessment Department, Faculty of
Psychology and Educational Sciences, University of Coimbra].
American Psychiatric Association (2000). Diagnostic and Statistical Manual of
Mental Disorders (4th ed. – Text Revised). Washington, DC: American
Psychiatric Association Press.
Andrich, D. (1988). Rasch models for measurement. London: Sage.
Arnold, J. M., Howlett, J. G., Dorian, P., Ducharme, A., Giannetti, N., Haddad, H., …
White, M. (2007). Canadian Cardiovascular Society Consensus Conference
recommendations on heart failure update 2007: Prevention, management during

MoCA: Rasch analysis _ 24
intercurrent illness or acute decompensation, and use of biomarkers. Canadian
Journal of Cardiology, 23(1), 21-45.
Barreto, J., Leuschner, A., Santos, F., & Sobral, M. (2008). Escala de Depressão
Geriátrica [Geriatric Depression Scale]. In Grupo de Estudos de Envelhecimento
Cerebral e Demências [Study Group on Brain Aging and Dementia] (Ed.),
Escalas e testes na demência [Scales and tests in dementia] (pp. 69-72). Lisbon:
GEECD.
Benjamini Y., & Hochberg Y. (1995). Controlling the false discovery rate: A practical
and powerful approach to multiple testing. Journal of the Royal Statistical Society
B, 57(1), 289-300.
Chen, J., Lin, K., & Chen, Y. (2009). Risk factors for Dementia. Journal of Formosan
Medical Association, 108(10), 754-764.
Chou, Y., & Wang, W. (2010). Checking dimensionality in item response models with
principal component analysis on standardized residuals. Educational and
Psychological Measurement, 70, 717-731.
Comas-Herrera, A., Northey, S., Wittenberg, R., Knapp, M., Bhattacharyya, S., &
Burns, A. (2011). Future costs of dementia-related long-term care: Exploring future
scenarios. International Psychogeriatrics, 23(1), 20-30.
Conrad, K. J., & Smith, E. V. (2004). International conference on objective
measurement: Applications of Rasch analysis in health care. Medical Care, 42, 1-
6.
Cullen, B., O’Neill, B., Evans, J. J., Coen, R. F., & Lawlor, B. A. (2007). A review of
screening tests for cognitive impairment. Journal of Neurology, Neurosurgery &
Psychiatry, 78, 790-799.
Damian, A. M., Jacobson, S. A., Hentz, J. G., Belden, C. M., Shill, H. A., Sabbagh, M.

MoCA: Rasch analysis _ 25
N., … Adler, C H. (2011). The Montreal Cognitive Assessment and the Mini-
Mental State Examination as screening instruments for cognitive impairment:
Item analyses and threshold scores. Dementia and Geriatric Cognitive Disorders,
31(2), 126-131.
Dorans, N. J., & Holland, P. W. (1993). DIF detection and description: Mantel-
Haenszel and standardization. In P. W. Holland & H. Wainer (Eds.), Differential
item functioning (pp. 35-66). Hillsdale, NJ: Lawrence Erlbaum.
Drasgow, F. (1987). Study of measurement bias of two standardized psychological tests.
Journal of Applied Psychology, 72, 19–29.
Fabrigoule, C., Barberger-Gateau, P., & Dartigues, J. F. (2006). The PAQUID study. In
H. A. Tuokko & D. F. Hultsch (Eds.), Mild Cognitive Impairment: International
perspectives (pp. 31-56). New York: Taylor & Francis.
Federal Interagency Forum on Aging-Related Statistics. (2000). Older americans 2000:
Key indicators of well-being. Retirado de
http://www.agingstats.gov/agingstatsdotnet/Main_Site/Data/2000_Documents/enti
re_report.pdf
Federal Interagency Forum on Aging-Related Statistics. (2010). Older americans 2010:
Key indicators of well-being. Retirado de:
http://www.agingstats.gov/agingstatsdotnet/Main_Site/Data/2010_Documents/Do
cs/OA_2010.pdf.
Folstein, M., Folstein, S., & McHugh, P. (1975). Mini-Mental State: A practical method
for grading the cognitive state of patients for the clinician. Journal of Psychiatric
Research, 12(3), 189-198.
MoCA: Rasch analysis _ 26
Freitas, S., Simões, M. R., Alves, L., & Santana, I. (2011). Montreal Cognitive
Assessment (MoCA): Normative study for the Portuguese population. Journal of
Clinical and Experimental Neuropsychology, 33(9), 989-996.
Freitas, S., Simões, M. R., Alves, L., & Santana, I. (2012). Montreal Cognitive
Assessment (MoCA): Influence of sociodemographic and health variables.
Archives of Clinical Neuropsychology, 27, 165-175.
Freitas, S., Simões, M. R., Alves, L., & Santana, I. (2013). Montreal Cognitive
Assessment (MoCA): Validation study for Mild Cognitive Impairment and
Alzheimer’s disease. Alzheimer Disease and Associated Disorders, 21(1), 37-43.
Freitas, S., Simões, M. R., Alves, L., Duro, D., & Santana, I. (2012). Montreal
Cognitive Assessment (MoCA): Validation study for Frontotemporal Dementia.
Journal of Geriatric Psychiatry and Neurology, 25(3), 146-154.
Freitas, S., Simões, M. R., Alves, L., Vicente, M., & Santana, I. (2012). Montreal
Cognitive Assessment (MoCA): Validation study for Vascular Dementia. Journal
of International Neuropsychology Society, 18(6), 1031-1040.
Freitas, S., Simões, M. R., Marôco, J., Alves, L., & Santana, I. (2012). Construct
validity of the Montreal Cognitive Assessment (MoCA). Journal of International
Neuropsychology Society, 18, 242-250.
Freitas, S., Simões, M. R., Martins, C., Vilar, M., & Santana, I. (2010). Estudos de
adaptação do Montreal Cognitive Assessment (MoCA) para a população
portuguesa [Montreal Cognitive Assessment (MoCA): Adaptation studies for the
Portuguese population]. Avaliação Psicológica, 9(3), 345-357.
Fujiwara, Y., Suzuki, H., Yasunaga, M., Sugiyama, M., Ijuin, M., Sakuma, N., …
Shinkai, S. (2010). Brief screening tool for mild cognitive impairment in older
MoCA: Rasch analysis _ 27
Japanese: Validation of the Japanese version of the Montreal Cognitive
Assessment. Geriatrics & Gerontology International, 10, 225-232.
Garret, C., Santos, F., Tracana, I., Barreto, J., Sobral, M., & Fonseca, R. (2008).
Avaliação Clínica da Demência [Clinical Dementia Rating Scale]. In Grupo de
Estudos de Envelhecimento Cerebral e Demências [Study Group on Brain Aging
and Dementia] (Ed.), Escalas e testes na demência [Scales and tests in dementia]
(pp. 17-32). Lisbon: GEECD.
Gauthier, S., Patterson, C., Gordon, M., Soucy, J., Schubert, F., & Leuzy, A. (2011).
Commentary on “Recommendations from the National Institute on Aging-
Alzheimer’s Association workgroups on diagnostic guidelines for Alzheimer’s
disease”: A Canadian perspective. Alzheimer’s & Dementia, 7, 330-332.
Ginó, S., Mendes, T., Ribeiro, F., Mendonça, A., Guerreiro, M., & Garcia, C. (2008).
Escala de Queixas de Memória [Memory Complaints Scale]. In Grupo de Estudos
de Envelhecimento Cerebral e Demências [Study Group on Brain Aging and
Dementia] (Ed.), Escalas e testes na demência [Scales and tests in dementia] (pp.
117-120). Lisbon: GEECD.
Guerreiro, M., Silva, A. P., Botelho, M., Leitão, O., Castro-Caldas, A., & Garcia, C.
(1994). Adaptação à população portuguesa da tradução do Mini Mental State
Examination [Adaptation of the Mini Mental State Examination translation for the
Portuguese population]. Revista Portuguesa de Neurologia, 1, 9.
Hachinski, V., Iadecola, C., Petersen, R. C., Breteler, M. M., Nyenhuis, D. L., Black, S.
E., … Leblanc, G. G. (2006). National Institute of Neurological Disorders and
Stroke – Canadian Stroke Network Vascular Cognitive Impairment
Harmonization Standards. Stroke, 37, 2220-2241.
Holland, P., & Thayer, D. (1988). Differential item performance and the Mantel-
MoCA: Rasch analysis _ 28
Haenszel procedure. In H. Wainer and H. I. Braun (Eds.), Test Validity (pp.129-
145). Hillsdale, NJ: LEA.
Hughes, C. P., Berg, L., Danziger, W. L., Coben, L. A., & Martin, R. L. (1982). A new
clinical scale for the staging of dementia. The British Journal of Psychiatry, 140,
566-572.
Ismail, Z., & Shulman, K. (2006). Avaliação cognitiva breve para a demência
[Cognitive screening assessment for dementia]. In H. Firmino (Ed.),
Psicogeriatria [Psychogeriatry] (pp. 513-530). Coimbra: Psiquiatria Clínica.
Konsztowicz, S., Xie, H., Higgins, J., Mayo, N., & Koski L. (2011). Development of a
method for quantifying cognitive ability in the elderly through adaptive test
administration. International Psychogeriatrics, 23(7), 1116-1123.
Koski, L., Xie, H., & Finch, L. (2009). Measuring cognition in a geriatric outpatients
clinic: Rasch analysis of the Montreal Cognitive Assessment. Journal of Geriatric
Psychiatry and Neurology, 32(3), 151-160.
Koski, L., Xie, H., & Konsztowicz, S. (2011). Improving precision in the quantification
of cognition using the Montreal Cognitive Assessment and the Mini-Mental State
Examination. International Psychogeriatrics, 23(7), 1107-1115.
Lee, J., Lee, D. W., Cho, S., Na, D. L., Jeon, H. J., Kim, S., … Cho, M. (2008). Brief
screening for mild cognitive impairment in elderly outpatient clinic: Validation of
the Korean version of the Montreal Cognitive Assessment. Journal of Geriatric
Psychiatry and Neurology, 21, 104-110.
Linacre, J. M. (2011). A user’s guide to WINSTEPS & MINISTEPS: Rasch model
computer programs. Chicago, IL: Winsteps.com.
McKhann, G., Drachman, D., Folstein, M., Katzman, R., Price, D., & Stadlan, E. M.
(1984). Clinical diagnosis of Alzheimer’s disease: Report of the NINCDS-

MoCA: Rasch analysis _ 29
ADRDA Work Group under the auspices of the Department of Health and Human
Services Task Force on Alzheimer’s disease. Neurology, 34, 939–944.
Nandakumar, R. (1993). Simultaneous DIF Amplification and Cancellation: Shealy-
Stouts´s Test for DIF. Journal of Educational Measurement, 30 (4), 293-311.
Nasreddine, Z., Phillips, N. A., Bédirian, V., Charbonneau, S., Whitehead, V., Collin, I.,
… Chertkow, H. (2005). The Montreal Cognitive Assessment, MoCA: A brief
screening tool for Mild Cognitive Impairment. American Geriatrics Society,
53(4), 695-699.
Neary, D., Snowden, J. S., Gustafson, L., Passant, U., Stuss, D., Black, S., … Benson,
D. F. (1998). Frontotemporal lobar degeneration: A consensus on clinical
diagnostic criteria. Neurology, 51, 1546–1554.
Petersen, R. C. (2007). Mild cognitive impairment. Continuum Lifelong Learning in
Neurology, 13(2), 15–38.
Petersen, R. C. (2004). Mild Cognitive Impairment as a diagnostic entity. Journal of
Internal Medicine, 256(3), 183-194.
Potenza, M., & Dorans, N. (1995). DIF assessment for politomously scored items: A
framework for classification and evaluation. Applied Psychological Measurement,
19, 23-37.
Prieto, G., Delgado, A. R., Perea, M. V., & Ladera, V. (2010). Scoring
neuropsychological tests using the Rasch model: An illustrative example with the
Rey-Osterreith Complex Figure. The Clinical Neuropsychologist, 24, 45-56.
Prieto, G., Contador, I., Tapias-Merino, E., Mitchell, A. J., & Bermejo-Pareja, F.
(2012). The Mini-Mental-37 Test for dementia screening in the Spanish
population: An analysis using the Rasch model. The Clinical Neuropsychologist,
26(6), 1003-1018.

MoCA: Rasch analysis _ 30
Rasch, G. (1960). Probabilistic models for some intelligence and attainment tests.
Copenhagen: Danish Institute for Educational Research. (Expanded edition, 1980.
Chicago: University of Chicago Press).
Reckase, M. D. (1979). Unifactor latent trait models applied to multifactor tests: Results
and implications. Journal of Educational Statistics, 4, 207-230.
Román, G. C., Tatemichi, T., Erkinjuntti, T., Cummings, J. L., Masdeu, J. C., Garcia, J.
H., … Scheinberg, P. (1993). Vascular dementia: Diagnostic criteria for research
studies: report of the NINDS-AIREN International Workshop. Neurology, 43, 250–
260.
Roznowski, M. (1987). Use of tests manifesting sex differences as measure of
intelligence: Implications for measurement bias. Journal of Applied Psychology, 72,
480-483.
Schmand, B., Jonker, C., Hooijer, C., & Lindeboom, J. (1996). Subjective memory
complaints may announce dementia. Neurology, 46(1), 121-125.
Schumacker, R.E. (2004). Rasch measurement using dichotomous scoring. Journal of
Applied Measurement, 5, 328-349.
Smith, R. M. (2000). Fit analysis in latent trait measurement models. Journal of Applied
Measurement, 1, 199-218.
Wright, B. D., & Mok, M. M. (2004). An overview of the family of Rasch measurement
models. In E. V. Smith Jr & R. M. Smith (Eds.), Introduction to Rasch
measurement (pp. 1-24). Maple Grove, MN: JAM Press.
Yesavage, J. A., Brink, T. L., Rose, T. L., Lum, O., Huang, V., Adey, M., & Leirer, V.
O. (1983). Development and validation of a geriatric depression screening scale:
A preliminary report. Journal of Psychiatric Research, 17(1), 37-49.

MoCA: Rasch analysis _ 31
Zickar, M. J., & Broadfoot, A. A. (2009). The partial revival of a dead horse?
Comparing classical test theory and item response theory. In C. E. Lance and
R.J. Vandenberg (Eds.) Statistical and methodological myths and urban legends
(pp. 37-61). New York: Routledge.
Zwick, R., & Ercikan, K. (1989). Analysis of differential item functioning in the NAEP
history assessment. Journal of Educational Measurement, 26, 55-66.

MoCA: Rasch analysis _ 32
Table 1. Sample Characterization: Descriptive Statistics for the Total Sample and
Subgroups
N/n Gender
f (%)
Age
M ± SD
[Min.-Max.]
Education
M ± SD
[Min.-Max.]
MoCA
M ± SD
[Min.-Max.]
Total Sample 897 541 (60.3) 60.3 ± 15.4
[25-91]
7.6 ± 4.6
[1-27]
21.7 ± 6.5
[2-30]
Healthy Group 650 408 (62.8) 55.8 ± 15.1
[25-91]
8.2 ± 4.7
[1-27]
24.7 ± 3.7
[15-30]
Clinical Group 247 133 (53.8) 72.0 ± 8.2
[46-91]
6.2 ± 4.1
[1-20]
13.8 ± 5.6
[2-25]
MCI 90 55 (61.1) 70.5 ± 8.0
[46-91]
6.5 ± 4.6
[1-20]
18.3 ± 3.9
[10-25]
AD 90 52 (57.8) 74.2 ± 8.2
[54-91]
6.2 ± 4.1
[1-17]
10.1 ± 4.4
[2-21]
FTD 33 14 (42.4) 68.4 ± 7.0
[55-79]
6.4 ± 3.8
[3-15]
12.2 ± 4.8
[4-24]
VaD 34 12 (35.3) 73.2 ± 7.9
[51-86]
5.0 ± 2.8
[2-15]
13.0 ± 4.6
[5-24]
Note. f = feminine gender; M = Mean; SD = Standard Deviation; Min. = Minimum
value; Max. = Maximum value; MoCA = Montreal Cognitive Assessment (maximum
score = 30); Health Group: all cognitively health participants; Clinical Group: all
patients with MCI, AD, FTD and VaD; MCI = Mild Cognitive Impairment; AD =
Alzheimer’s Disease; FTD = Frontotemporal dementia; VaD = Vascular dementia.
MoCA: Rasch analysis _ 33
Table 2. Item Values of Montreal Cognitive Assessment
Item P RiX D(logits) SE Infit Outfit
TMT-B (adapted) .62 .67 1.11 .08 .75 .64
Cube .52 .63 1.70 .08 .84 .84
Contour .98 .23 -4.04 .29 1.03 .50
Numbers .69 .60 .57 .09 .89 .88
Hands .59 .62 1.26 .08 .86 .79
Lion .93 .35 -2.08 .15 1.23 .92
Rhinoceros .56 .52 1.46 .08 1.08 1.24
Camel .88 .45 -1.18 .12 1.16 .88
Digits Forward .65 .49 .88 .09 1.17 1.26
Digits Backward .75 .43 .12 .10 1.29 1.40
Sustained Attention .90 .53 -1.50 .13 .81 .63
Subtraction 1 .89 .43 -1.33 .13 1.09 1.68
Subtraction 2 .57 .53 1.37 .08 1.06 1.18
Subtraction 3 .65 .58 .87 .09 .97 .90
Subtraction 4 .64 .59 .98 .09 .95 .92
Subtraction 5 .60 .58 1.24 .08 .96 .91
Sentence 1 .78 .48 -.15 .10 1.15 1.29
Sentence 2 .58 .49 1.35 .08 1.18 1.20
Phonemic Fluency .42 .59 2.32 .08 .91 1.05
Abstraction 1 .72 .52 .36 .09 1.09 .99
Abstraction 2 .51 .60 1.75 .08 .93 .82
Word 1 .47 .54 1.98 .08 1.08 .98
Word 2 .52 .54 1.72 .08 1.06 1.03
Word 3 .66 .57 .85 .09 .96 1.12
Word 4 .44 .48 2.18 .08 1.18 1.28
Word 5 .65 .57 .91 .09 .98 1.02
Date .85 .56 -.79 .11 .85 .85
Month .93 .46 -2.03 .15 .83 .88
Year .89 .57 -1.29 .13 .75 .44
Day .94 .45 -2.20 .16 .89 .52
Place .97 .30 -3.39 .23 .98 .60
City .99 .16 -4.98 .42 1.05 .29
M .71 -- .00 .12 1.00 .94
SD .17 -- 1.86 .07 .14 .30
Note. P = Probability of correct answers; RiX = Item-test correlation; D = Difficulty
(logits); SE = Standard Error of D; M = Mean; SD = Standard Deviation.

MoCA: Rasch analysis _ 34
Table 3. Descriptive Statistics of the Participants Scores on Montreal
Cognitive Assessment
Statistic X B SE B
M 22.7 1.78 .61
SD 7.1 1.84 .33
Min. 2 -4.31 .43
Max. 32 5.62 1.84
α .92 -- --
PSR -- .85 --
% D 5.2 --
Note. X = Classic score (sum of the correct answers); B = Rasch
values (logits); SE B = Standard Error of the Rasch values; M = Mean;
SD = Standard Deviation; Min. = Minimum value; Max. = Maximum
value; α = Cronbach alpha coefficient of the scores (classic reliability);
PSR = Rasch reliability (Person Separation Reliability); % D =
Percentage of subjects with severe misfit (Outfit or Infit >2).
MoCA: Rasch analysis _ 35
Table 4. Montreal Cognitive Assessment Scores Means of the Persons’
Groups According to Pathology, Gender, Education and Age
Group n M X SD X M B SD B PSR
Pathology
Healthy 650 26.0a 4.1 2.55a 1.33 .67
MCI 90 19.0b 4.2 .81b .83 .71
AD 90 10.3c 4.7 -1.17c 1.19 .80
FTD 33 12.7d 5.2 -.59d 1.28 .84
VaD 34 13.5d 5.0 -.37d 1.12 .81
Gender
Male 356 22.7a 7.2 1.78a 1.88 .86
Female 541 22.8a 7.0 1.78a 1.81 .86
Education
1-4 years 416 18.9a 6.5 .76a 1.46 .89
> 4 years 481 26.0b 5.7 2.66b 1.67 .75
Age
<65 474 26.0a 5.3 2.64a 1.61 .74
>64 423 19.1a 7.0 .82b 1.59 .90
Note. B means with different subscript differ significantly (p <.05). M X =
Mean of Classic score; SD X = Standard Deviation of Classic score; M B =
Mean of Rasch values (logits); SD B = Standard Deviation of Rasch
values (logits); PSR = Rasch reliability (Person Separation Reliability).

MoCA: Rasch analysis _ 36
PERSON - MAP - ITEM 5 .####### + T| | | .###### | | 4 + | ####### |T | | .###### S| 3 + .########### | | .####### | | PHONEMIC ------------------------Normative Group Mean .######## | CRAVO 2 .########## + BOCA .###### |S | ABSTRACT2 CUBE LINHO ###### M| RHINOCER .#### | HANDS SENTENCE2 SUBTRACT2 .##### | SUBTRACT5 TRAIL 1 .##### + SUBTRACT4 .#### | AZUL DIGITS-F IGREJA SUBTRACT3 .### | --------------------------------DCL Group Mean .### | NUMBERS | ABSTRACT1 .## | DIGITS-B 0 .## S+M .# | SENTENCE1 .## | | .# | .## | DATE -1 .# + | CAMEL ------------------------------DA Group Mean .# | SUBTRACT1 YEAR | SUSTAINE .# T| |S -2 .# + LION MONTH | DAY ## | | .# | | -3 + . | | PLACE | . |T | -4 + CONTOUR | . | | | | -5 + CITY (EACH "#" IS 7. EACH "." IS 1 TO 6)
Figure 1. Variable Map: Conjoint Measurement (Persons and Items)

MoCA: Rasch analysis _ 37
Table 5. Montreal Cognitive Assessment: Differential Item Functioning (DIF)
Related with Pathology, Gender and Education
Item Pathology Gender Education
Cube Df > Dm D1 > D2
Hands Df > Dm
Rhinoceros Dh > Dc
Digits Backward Dh > Dc
Sustained Attention Dh < Dc
Subtraction 1 Dh > Dc Df > Dm
Abstraction 1 D1 > D2
Abstraction 2 D1 > D2
Word 3 Dh < Dc
Word 4 D1 < D2
Word 5 Dh < Dc Df < Dm D1 < D2
Date Dh < Dc D1 < D2
City D1 < D2
Note. Healthy group: n=650; Clinical group: n=247; Female group: n=541; Male
group: n=356; Low education group (1-4 years): n=416; High education group
(>4years): n=481. Dh = Item difficulty in healthy group; Dc = Item difficulty in
clinical group; Df = Item difficulty in female group; Dm = Item difficulty in male
group; D1 = Item difficulty in low education group (1-4 years); D2 = Item
difficulty in high education group (>4years).