tittel increased performance and safety
TRANSCRIPT

Tittel
av Navn
Increased performance and safety by means of subsea instrumentation Olav Brakstad ClampOn AS
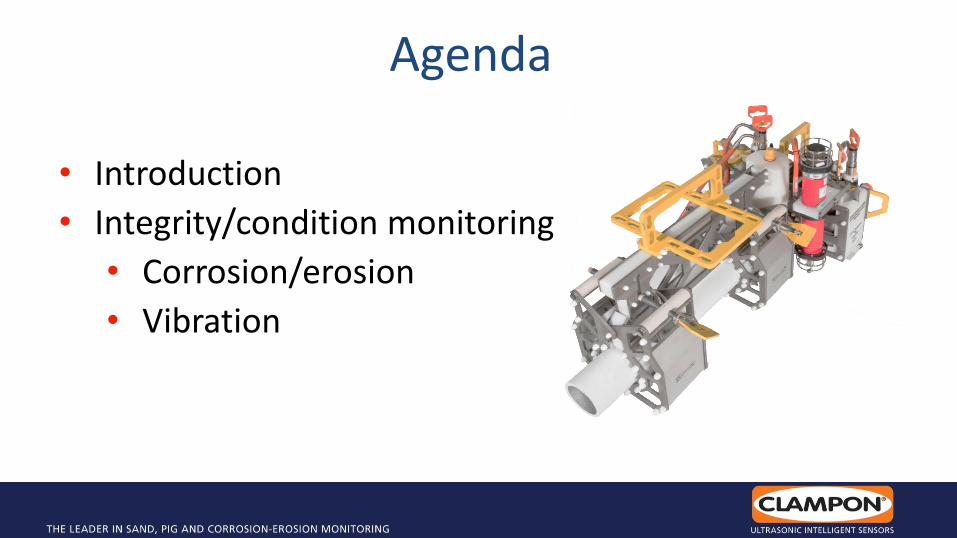
Agenda
• Introduction
• Integrity/condition monitoring
• Corrosion/erosion
• Vibration

Introduction
Industry focus on safety and integrity
Subsea requirements
• More information
• Reliability
• Long lifetime
ClampOn
• “Sand monitoring experts”
• Wide range of ultrasonic instruments and capacities

• Sand Monitor
• PIG detector
• Leak Monitor
• Well Collision Detector
• Cracking detector
• Wall Thickness Monitor
• Corrosion Under Insulation
• Vibration Monitor
• Corrosion-Erosion Monitor
One technology, different applications
Corrosion-erosion
monitoring
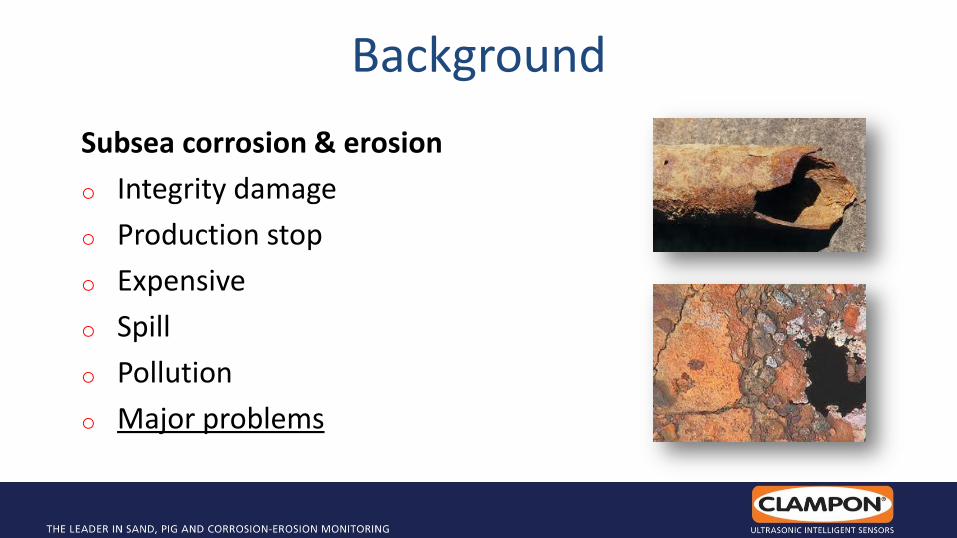
Background
Subsea corrosion & erosion
o Integrity damage
o Production stop
o Expensive
o Spill
o Pollution
o Major problems
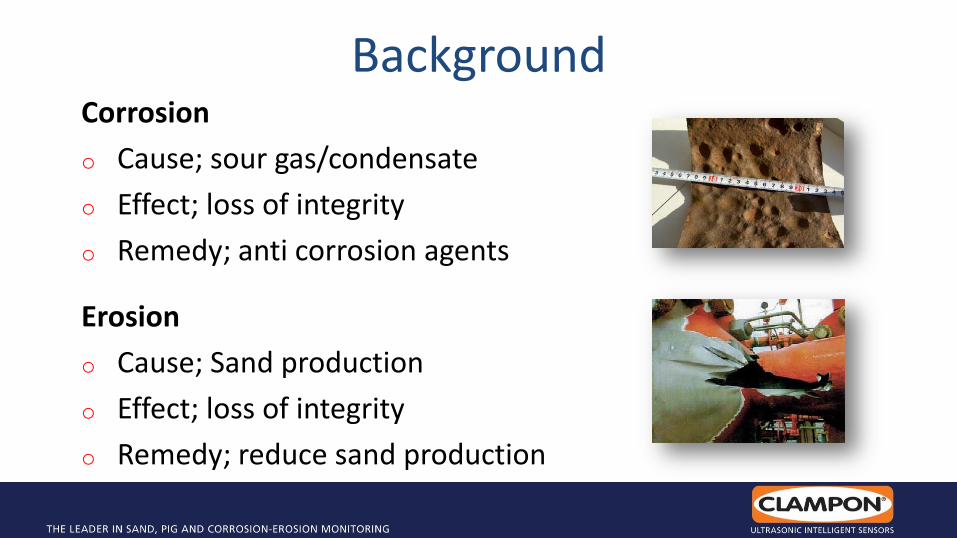
Background Corrosion
o Cause; sour gas/condensate
o Effect; loss of integrity
o Remedy; anti corrosion agents
Erosion
o Cause; Sand production
o Effect; loss of integrity
o Remedy; reduce sand production
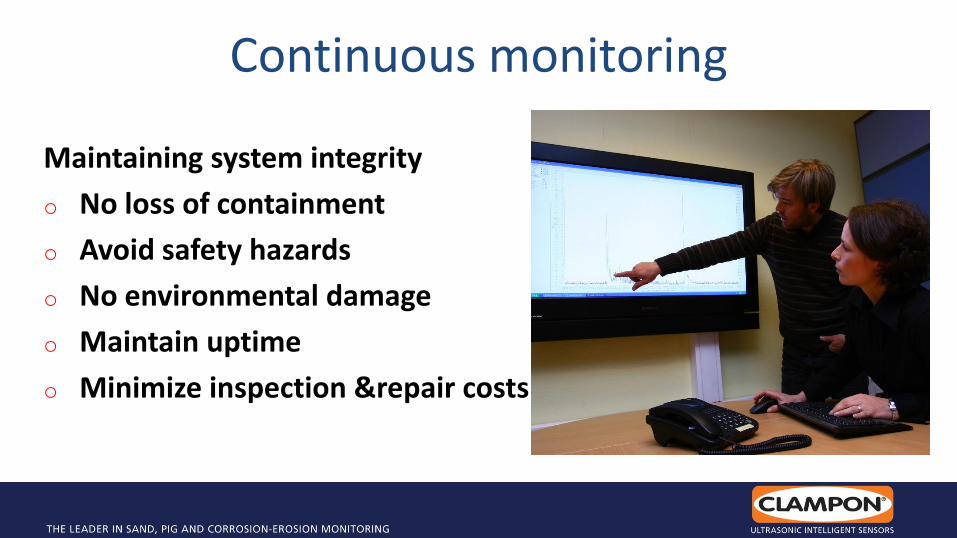
Continuous monitoring
Maintaining system integrity
o No loss of containment
o Avoid safety hazards
o No environmental damage
o Maintain uptime
o Minimize inspection &repair costs
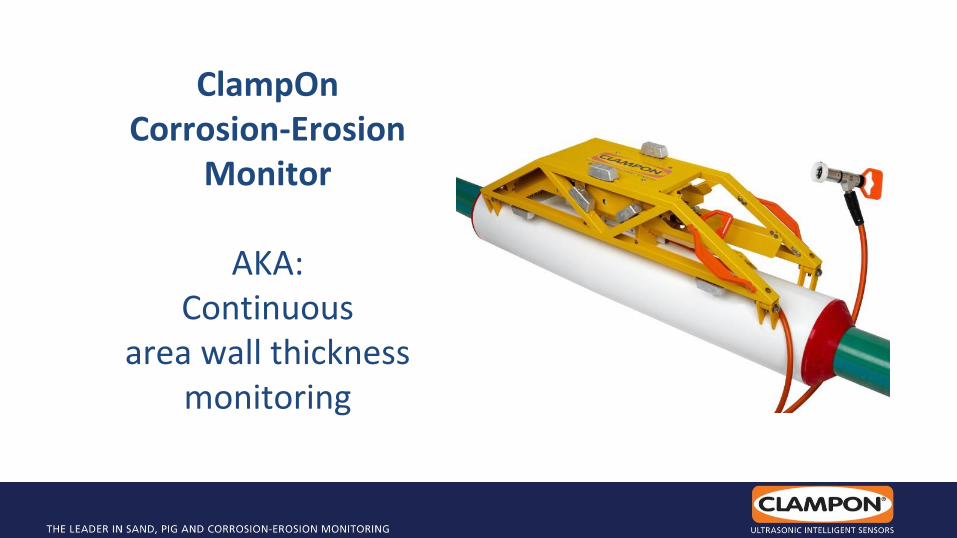
ClampOn Corrosion-Erosion
Monitor
AKA: Continuous
area wall thickness monitoring
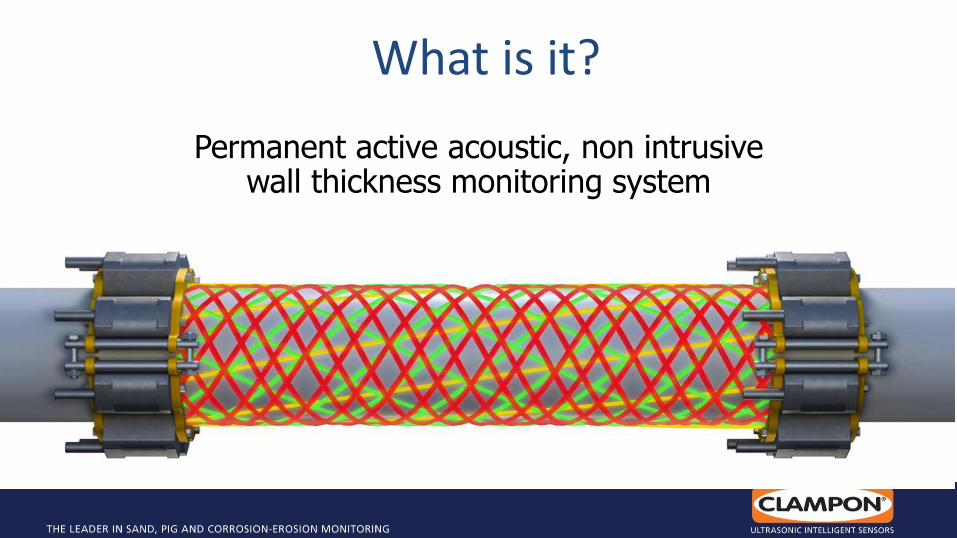
What is it?
Permanent active acoustic, non intrusive wall thickness monitoring system
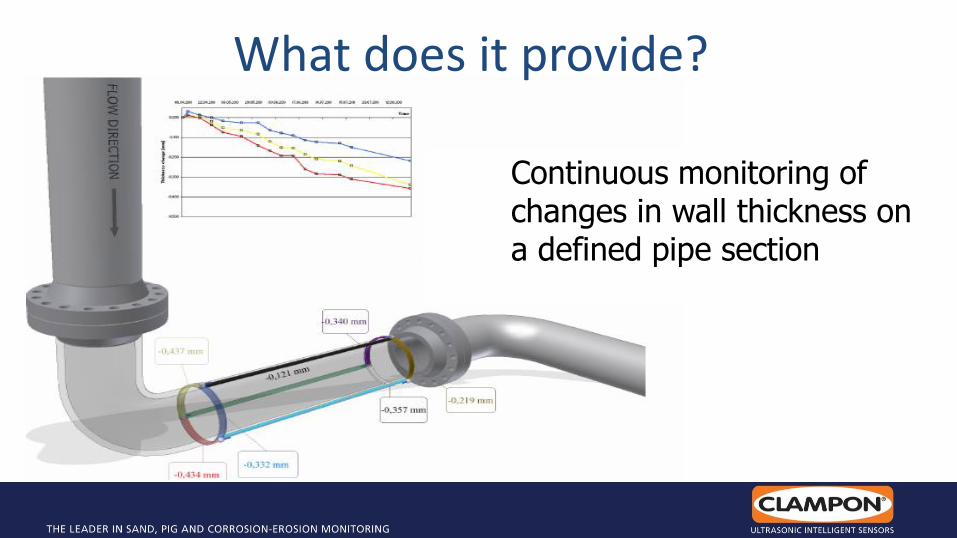
What does it provide?
Continuous monitoring of changes in wall thickness on a defined pipe section
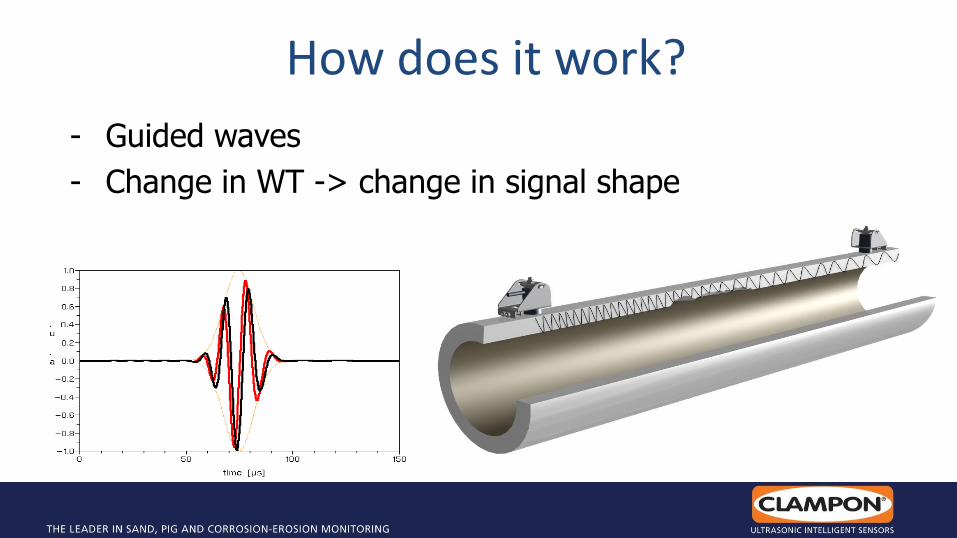
How does it work?
- Guided waves
- Change in WT -> change in signal shape
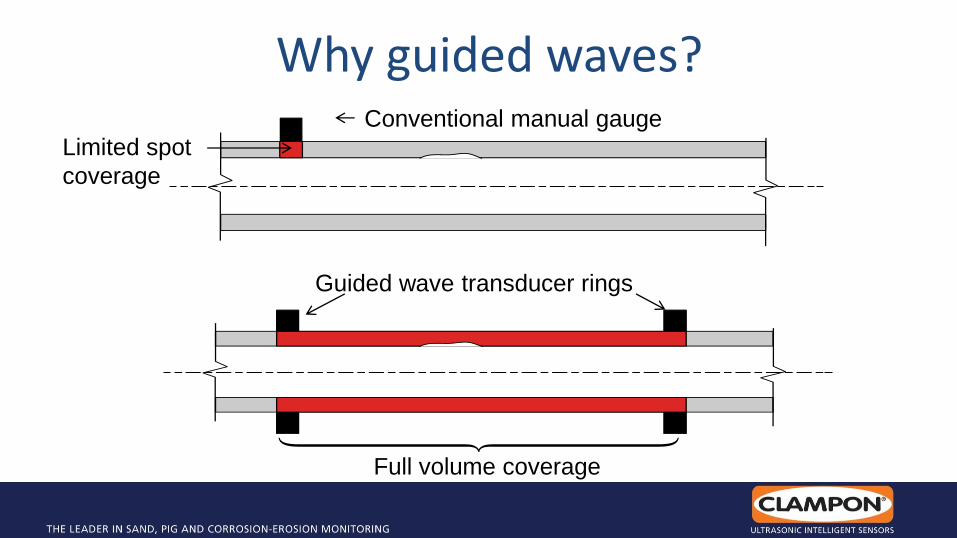
Conventional manual gauge
Limited spot
coverage
Guided wave transducer rings
Full volume coverage
Why guided waves?
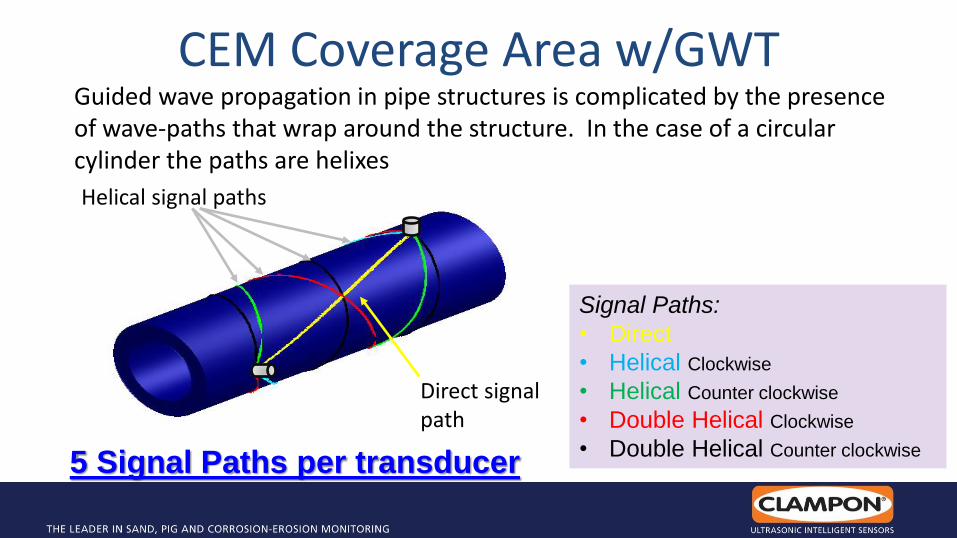
CEM Coverage Area w/GWT Guided wave propagation in pipe structures is complicated by the presence of wave-paths that wrap around the structure. In the case of a circular cylinder the paths are helixes
Direct signal path
Helical signal paths
Signal Paths:
• Direct
• Helical Clockwise
• Helical Counter clockwise
• Double Helical Clockwise
• Double Helical Counter clockwise 5 Signal Paths per transducer
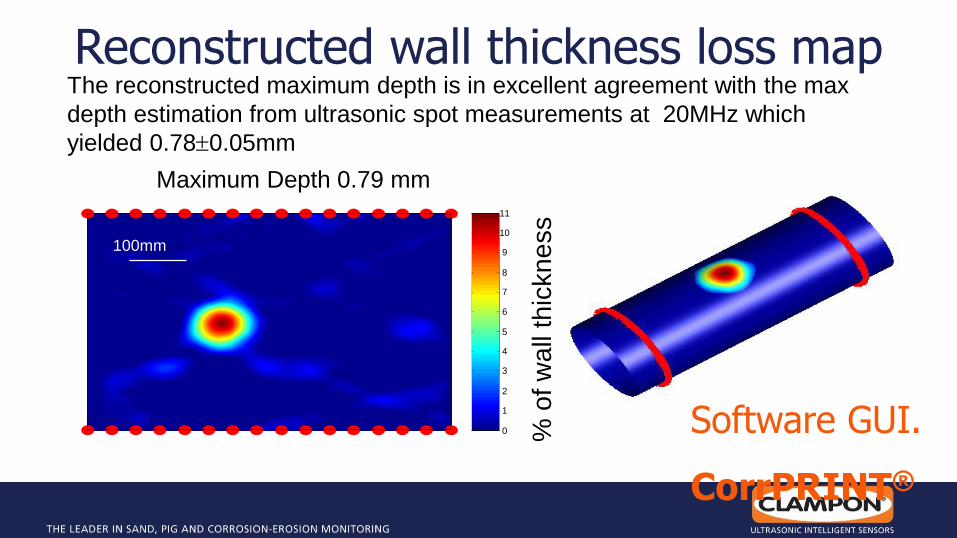
Reconstructed wall thickness loss map
Maximum Depth 0.79 mm
% o
f w
all
thic
kn
ess
The reconstructed maximum depth is in excellent agreement with the max
depth estimation from ultrasonic spot measurements at 20MHz which
yielded 0.780.05mm
0
1
2
3
4
5
6
7
8
9
10
11
100mm
Software GUI.
CorrPRINT®
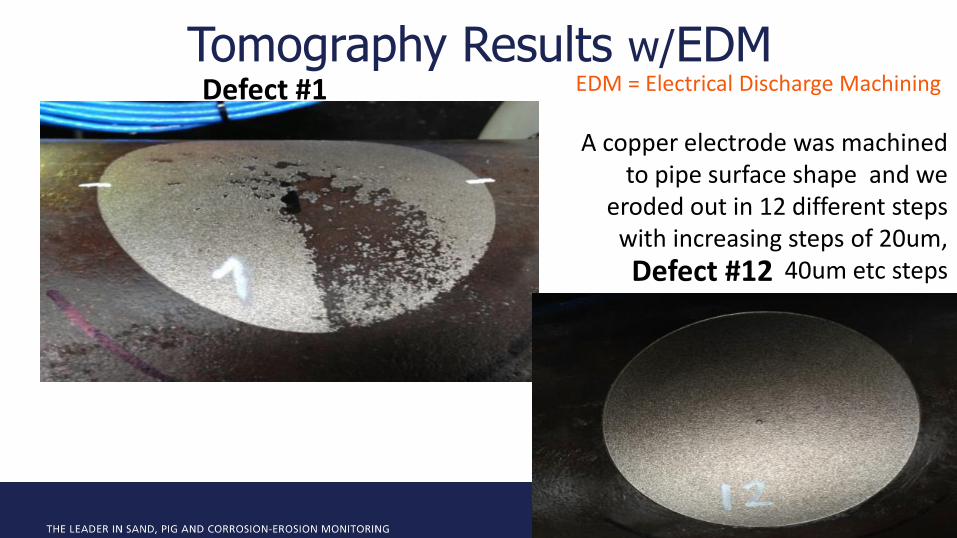
Defect #1
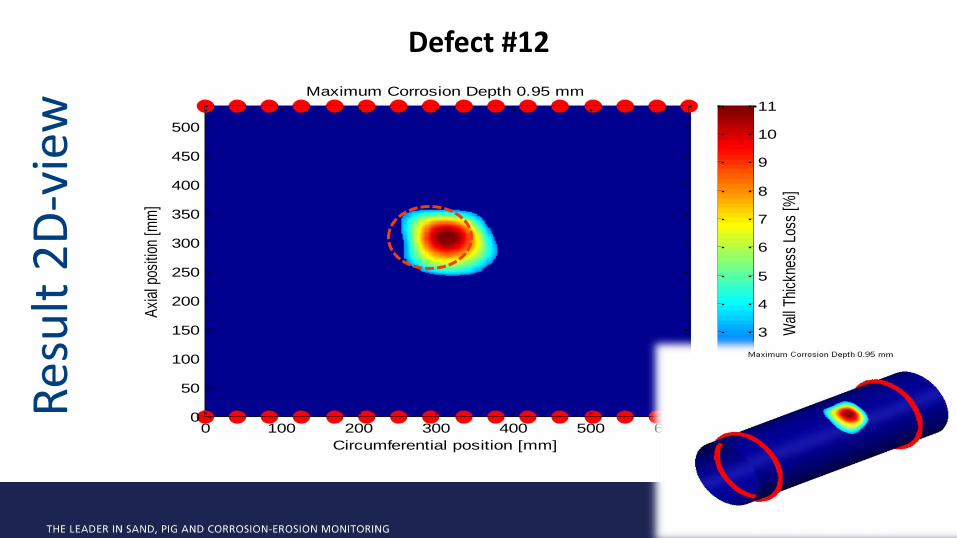
Defect #12
Tomography Results w/EDM EDM = Electrical Discharge Machining
A copper electrode was machined to pipe surface shape and we
eroded out in 12 different steps with increasing steps of 20um,
40um etc steps
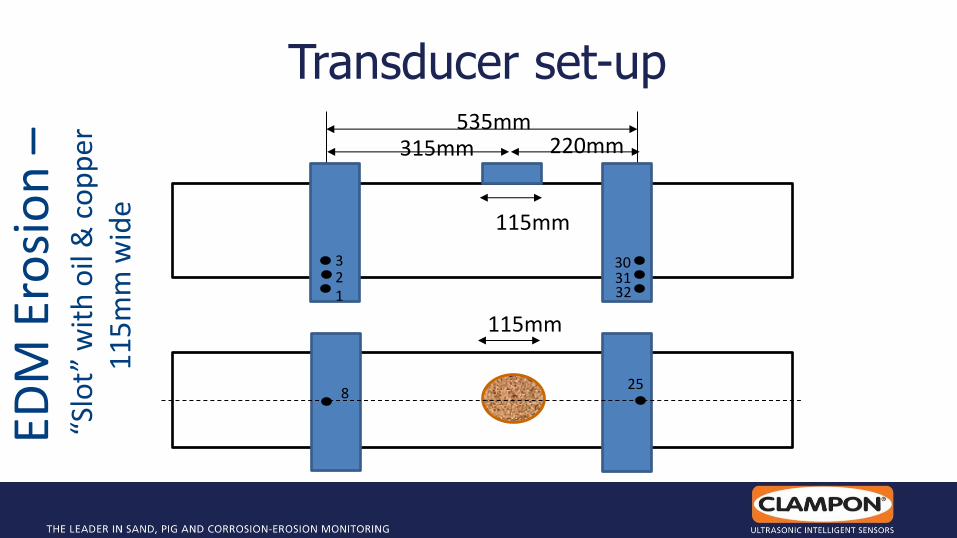
535mm
1 2 3
32 31 30
115mm
315mm 220mm
8 25
115mm
EDM
Ero
sio
n –
“
Slo
t” w
ith
oil
& c
op
per
1
15
mm
wid
e
Transducer set-up
Circumferential position [mm]
Axi
al p
ositi
on [m
m]
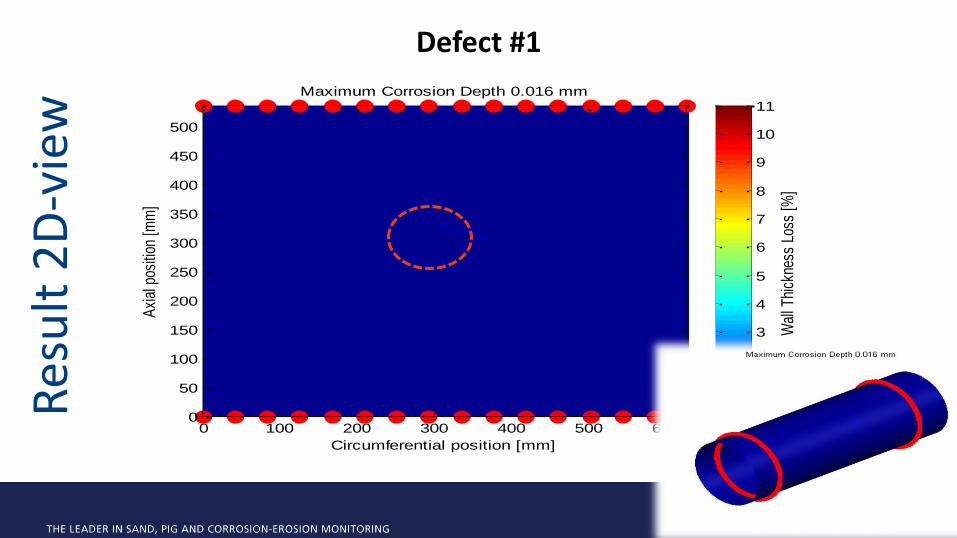
Maximum Corrosion Depth 0.016 mm
0 100 200 300 400 500 6000
50
100
150
200
250
300
350
400
450
500
Wal
l Thi
ckne
ss L
oss
[%]
0
1
2
3
4
5
6
7
8
9
10
11
Defect #1 R
esu
lt 2
D-v
iew
Circumferential position [mm]
Axi
al p
ositi
on [m
m]
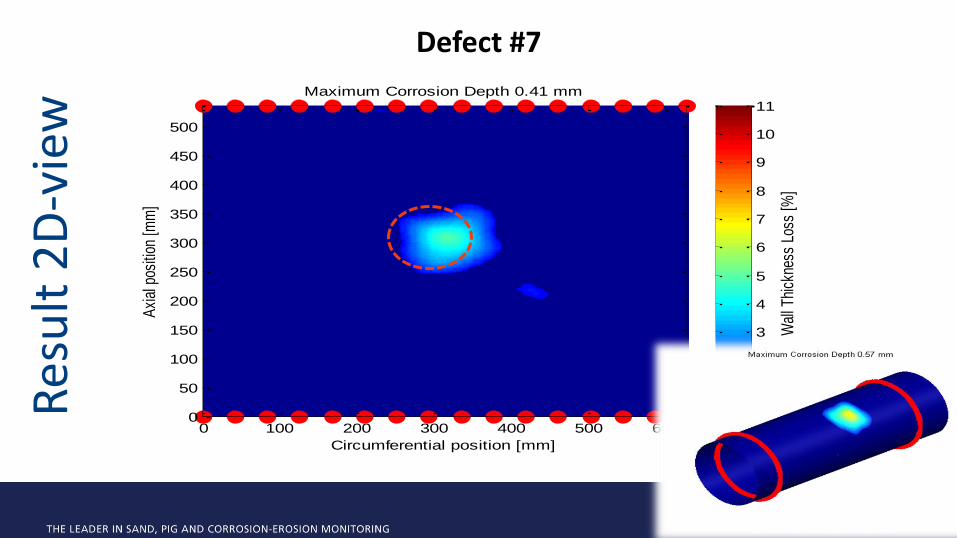
Maximum Corrosion Depth 0.41 mm
0 100 200 300 400 500 6000
50
100
150
200
250
300
350
400
450
500
Wal
l Thi
ckne
ss L
oss
[%]
0
1
2
3
4
5
6
7
8
9
10
11
Defect #7 R
esu
lt 2
D-v
iew
Circumferential position [mm]
Axi
al p
ositi
on [m
m]
Maximum Corrosion Depth 0.95 mm
0 100 200 300 400 500 6000
50
100
150
200
250
300
350
400
450
500
Wal
l Thi
ckne
ss L
oss
[%]
0
1
2
3
4
5
6
7
8
9
10
11
Defect #12 R
esu
lt 2
D-v
iew
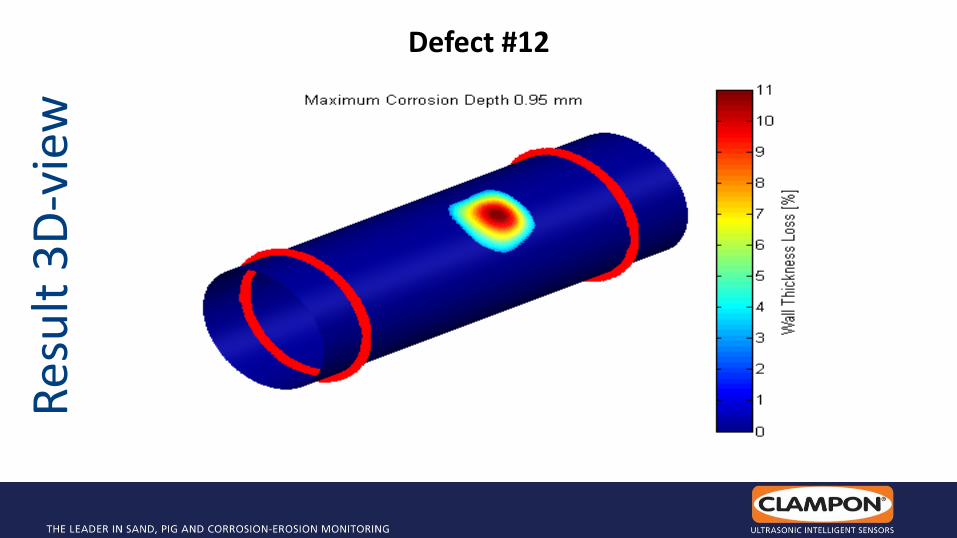
Defect #12 R
esu
lt 3
D-v
iew
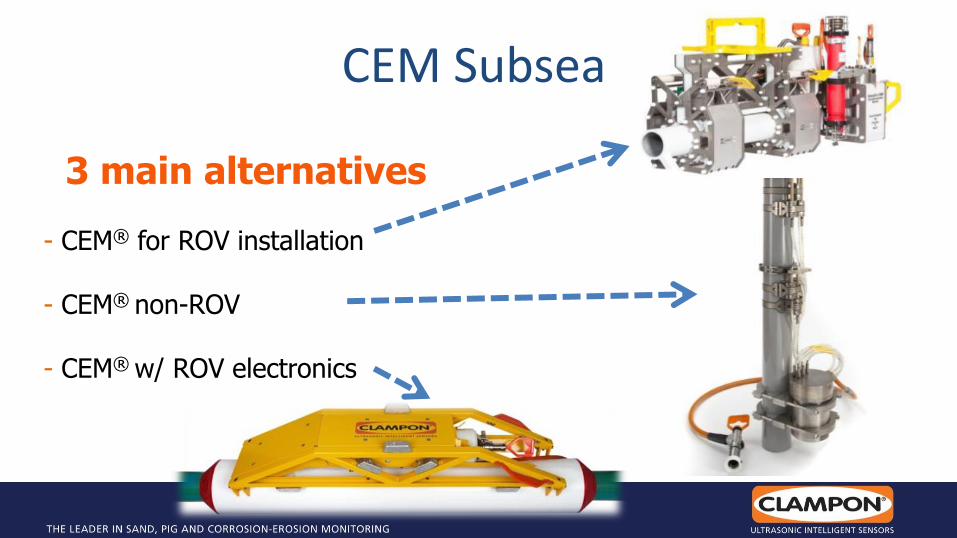
CEM Subsea
3 main alternatives - CEM® for ROV installation - CEM® non-ROV - CEM® w/ ROV electronics
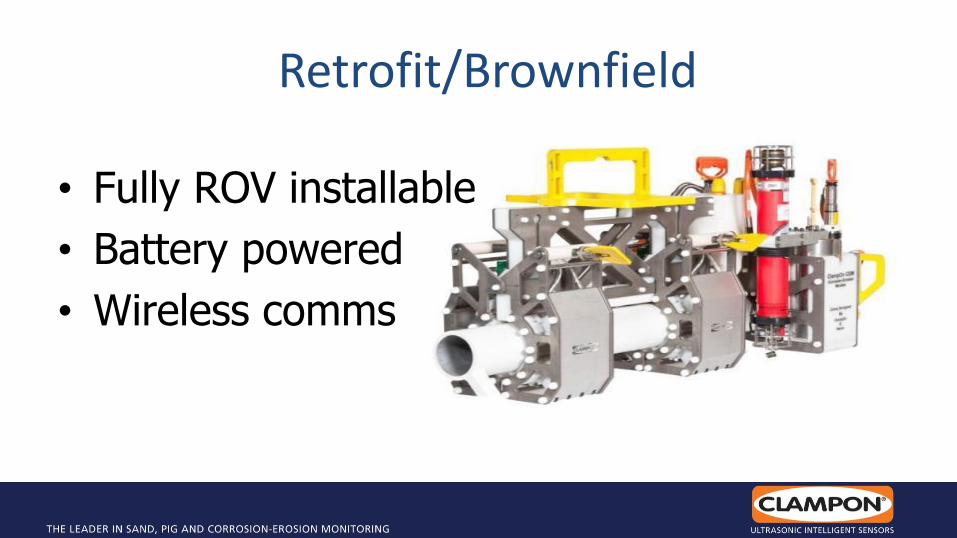
• Fully ROV installable
• Battery powered
• Wireless comms
Retrofit/Brownfield
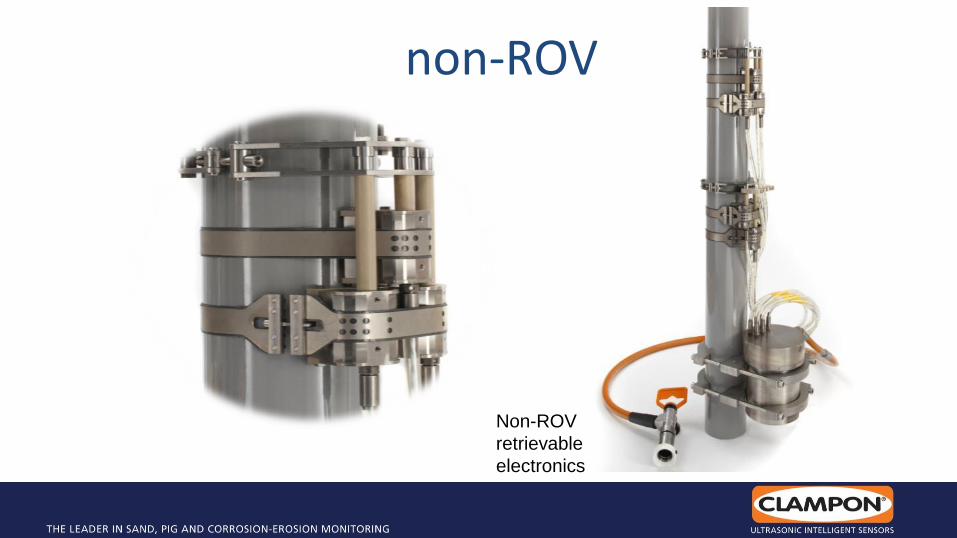
non-ROV
Non-ROV
retrievable
electronics
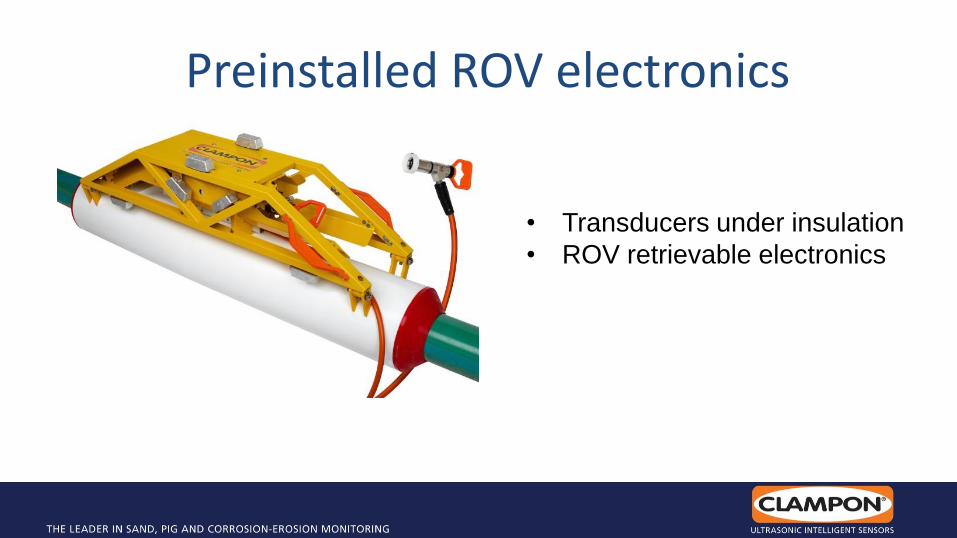
• Transducers under insulation
• ROV retrievable electronics
Preinstalled ROV electronics
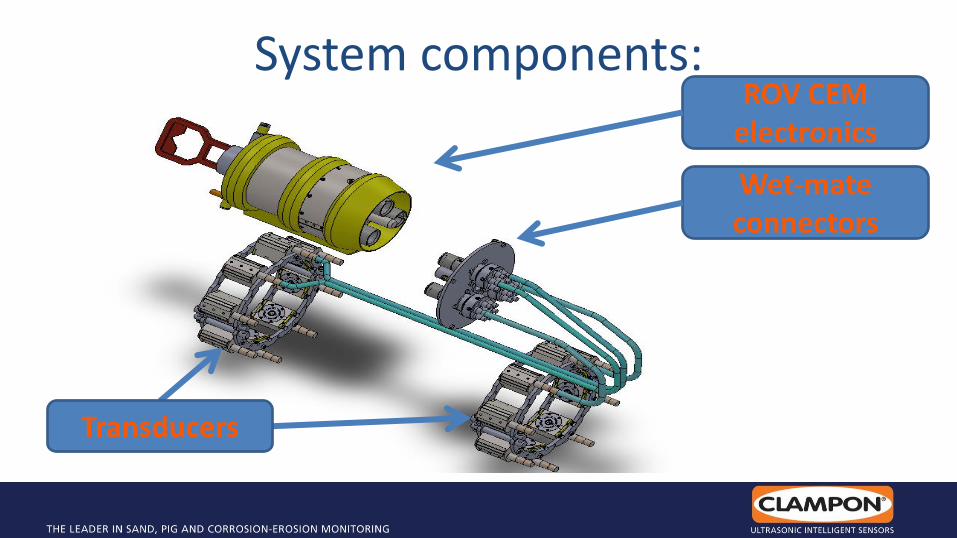
ROV CEM electronics
Wet-mate connectors
Transducers
System components:

Technical data • Pipe outer diameter (OD): min 4” (100mm) • Pipe wall thickness (WT): 2 mm to 35 mm (0,08” to 1,38”) • Distance between transducers: 0.15 m – 2 m (78”) typical • Temperature : -40 to 180 °C (-40 to 356 °F)
• Power consumption: Max 2.5 Watt
• Sensitivity: better than 1% of the pipe wall thickness (typical 0.1%)
• Repeatability: 0.04% • Operation life: 220 000 hours • Frequency range: 30 to 300 kHz • Power Consumption: Avg 6 Watt – Max 10 Watt (during operation) • Sensor electronics: DSP 66-MIPS, A/D con. 24bit, 25-Years • Water depth: 3000 Meters • Test pressure: 345 BarA
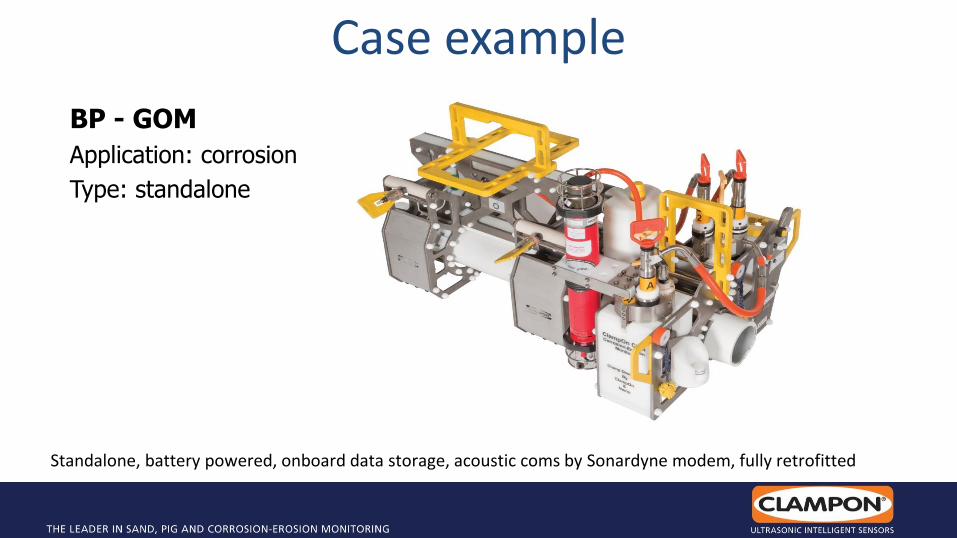
Case example
BP - GOM
Application: corrosion
Type: standalone
Standalone, battery powered, onboard data storage, acoustic coms by Sonardyne modem, fully retrofitted
Case example
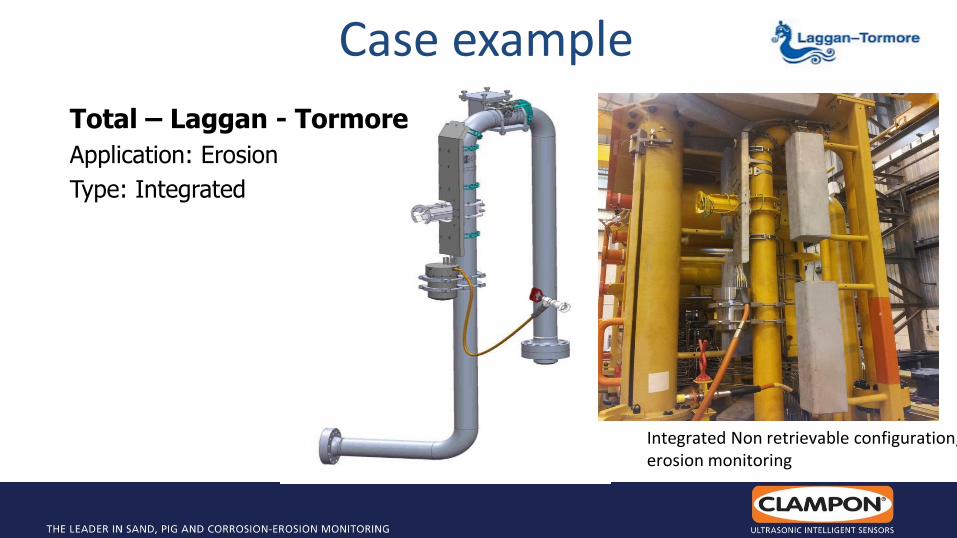
Total – Laggan - Tormore
Application: Erosion
Type: Integrated
Integrated Non retrievable configuration, erosion monitoring
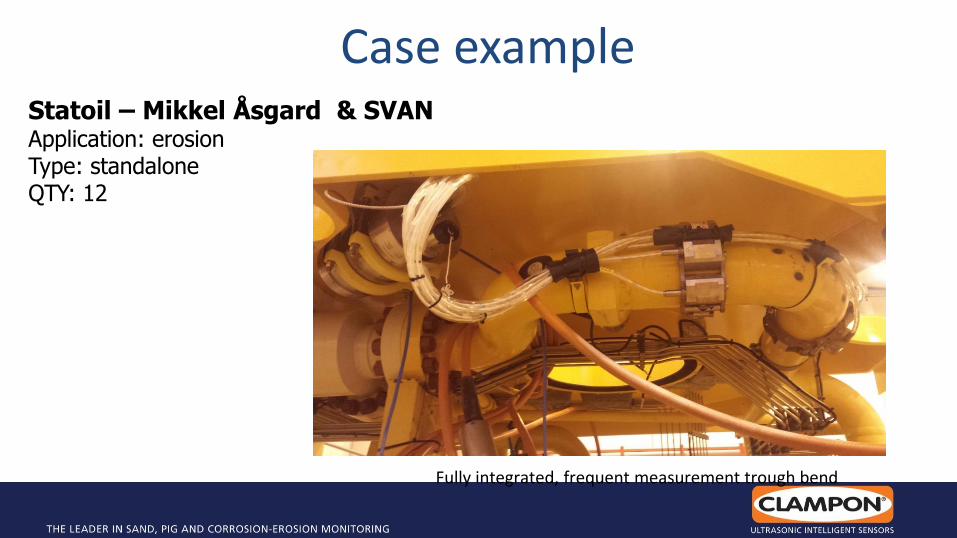
Case example Statoil – Mikkel Åsgard & SVAN Application: erosion Type: standalone QTY: 12
Fully integrated, frequent measurement trough bend
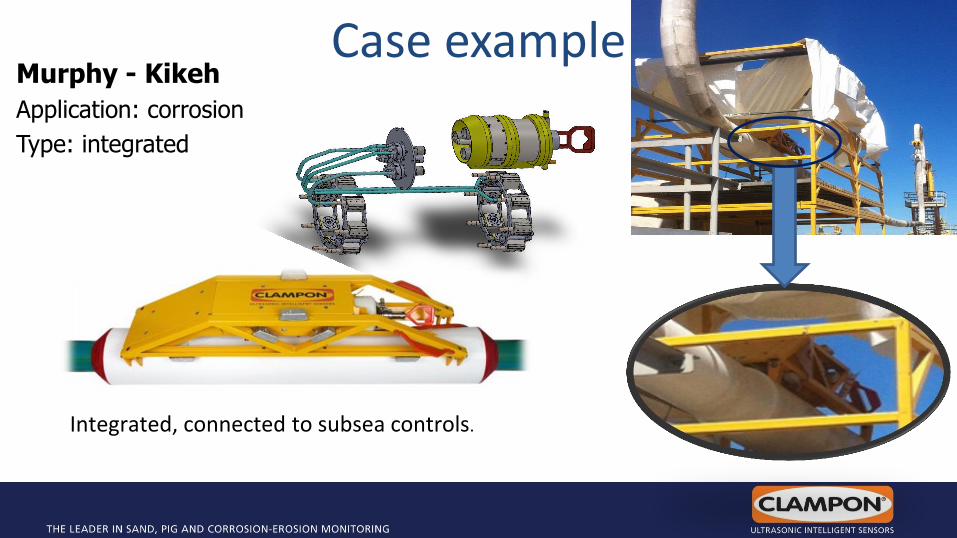
Case example Murphy - Kikeh
Application: corrosion
Type: integrated
Integrated, connected to subsea controls.
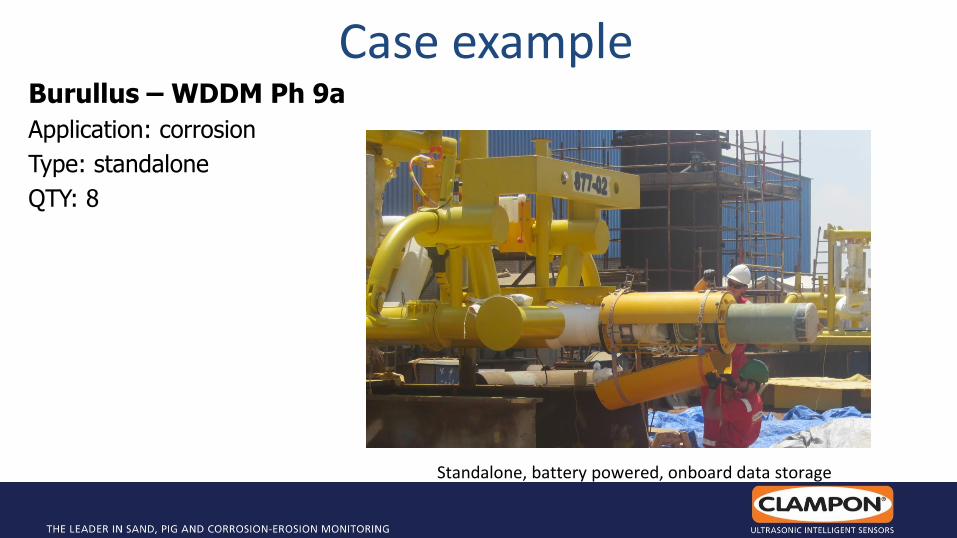
Case example Burullus – WDDM Ph 9a
Application: corrosion
Type: standalone
QTY: 8
Standalone, battery powered, onboard data storage
Case example
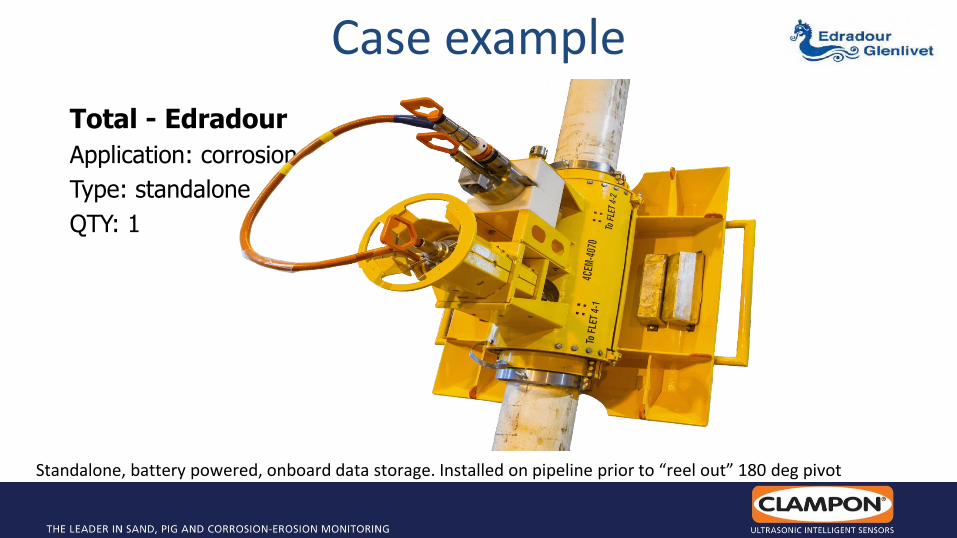
Total - Edradour
Application: corrosion
Type: standalone
QTY: 1
Standalone, battery powered, onboard data storage. Installed on pipeline prior to “reel out” 180 deg pivot
Case example
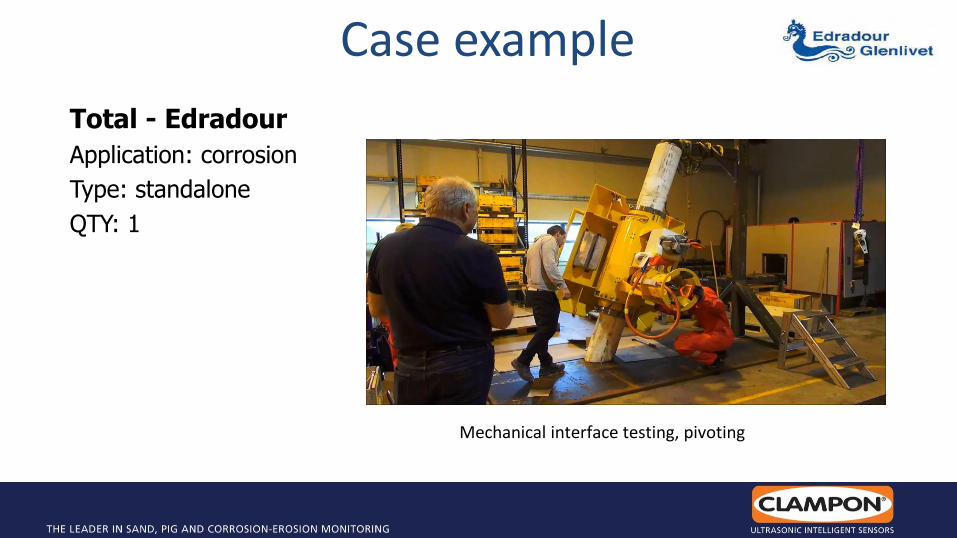
Total - Edradour
Application: corrosion
Type: standalone
QTY: 1
Mechanical interface testing, pivoting
Vibration
monitoring
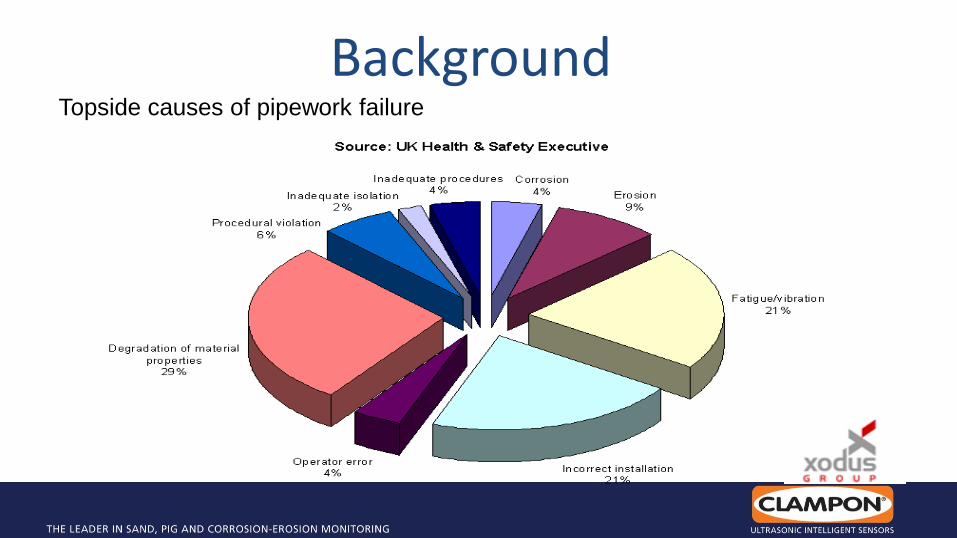
Background Topside causes of pipework failure
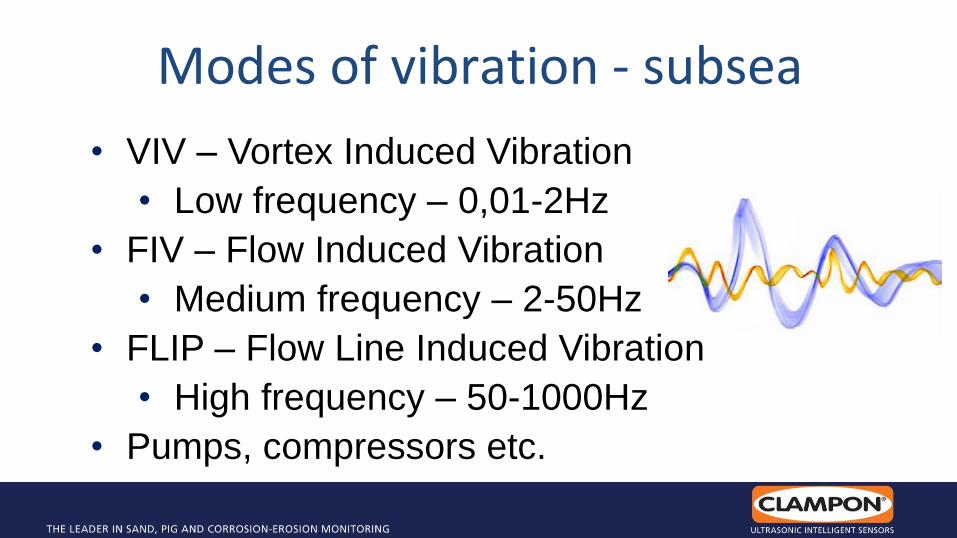
• VIV – Vortex Induced Vibration
• Low frequency – 0,01-2Hz
• FIV – Flow Induced Vibration
• Medium frequency – 2-50Hz
• FLIP – Flow Line Induced Vibration
• High frequency – 50-1000Hz
• Pumps, compressors etc.
Modes of vibration - subsea
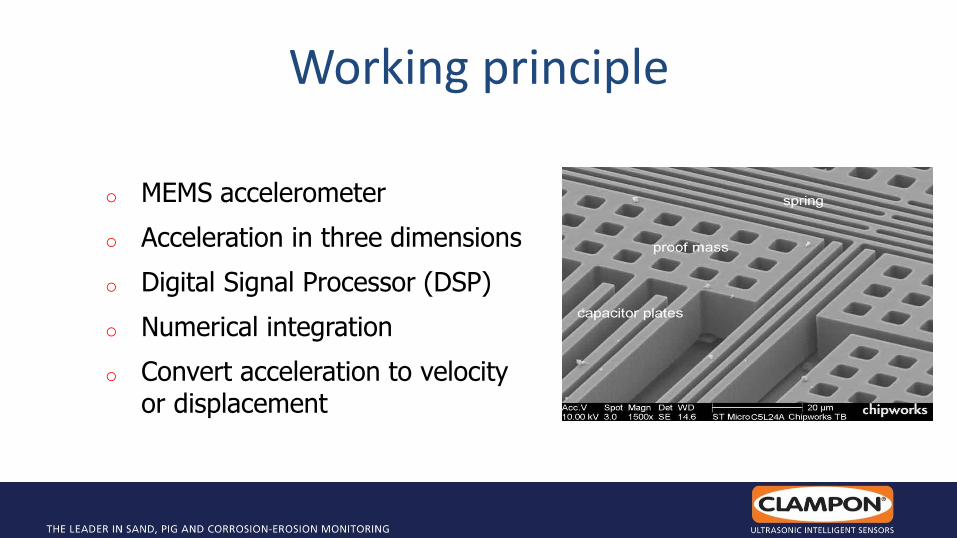
Working principle
o MEMS accelerometer
o Acceleration in three dimensions
o Digital Signal Processor (DSP)
o Numerical integration
o Convert acceleration to velocity or displacement

Data processing ClampOn vibration monitors
Accelerometer Analog to
digital conversion
Analog low-pass filter
Digital decimation
FFT spectrum analysis
Unit conversion RMS calculation
RMS output Spectrum output Raw data
output
Anti-aliasing
o Real-time data
o Instant alarm
o Always present
o Data from 0-day
o Fatigue estimate
o No running costs
o SIIS L2 and 3
Integrated/permanent solution
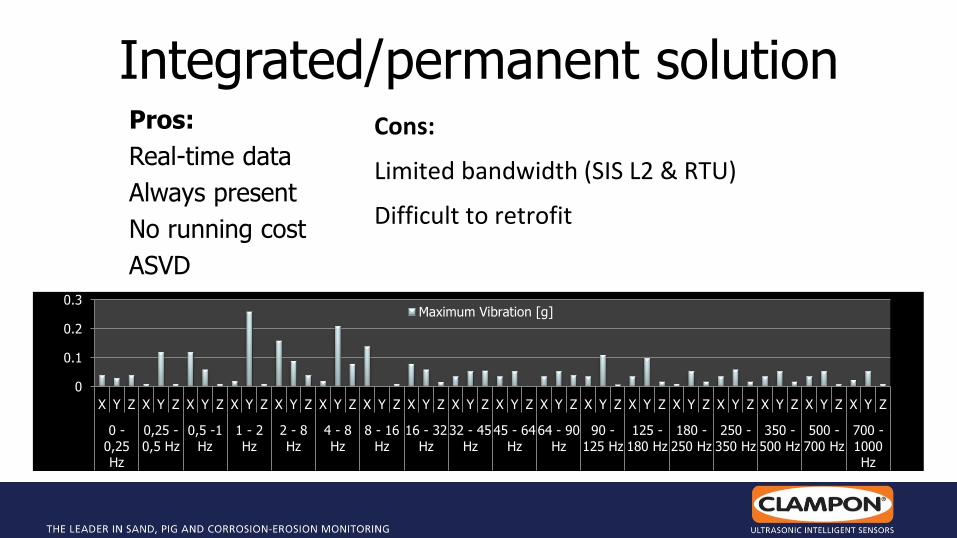
Integrated/permanent solution Pros:
Real-time data
Always present
No running cost
ASVD
0
0.1
0.2
0.3
X Y Z X Y Z X Y Z X Y Z X Y Z X Y Z X Y Z X Y Z X Y Z X Y Z X Y Z X Y Z X Y Z X Y Z X Y Z X Y Z X Y Z X Y Z
0 -
0,25Hz
0,25 -
0,5 Hz
0,5 -1
Hz
1 - 2
Hz
2 - 8
Hz
4 - 8
Hz
8 - 16
Hz
16 - 32
Hz
32 - 45
Hz
45 - 64
Hz
64 - 90
Hz
90 -
125 Hz
125 -
180 Hz
180 -
250 Hz
250 -
350 Hz
350 -
500 Hz
500 -
700 Hz
700 -
1000Hz
Maximum Vibration [g]
Cons:
Limited bandwidth (SIS L2 & RTU)
Difficult to retrofit
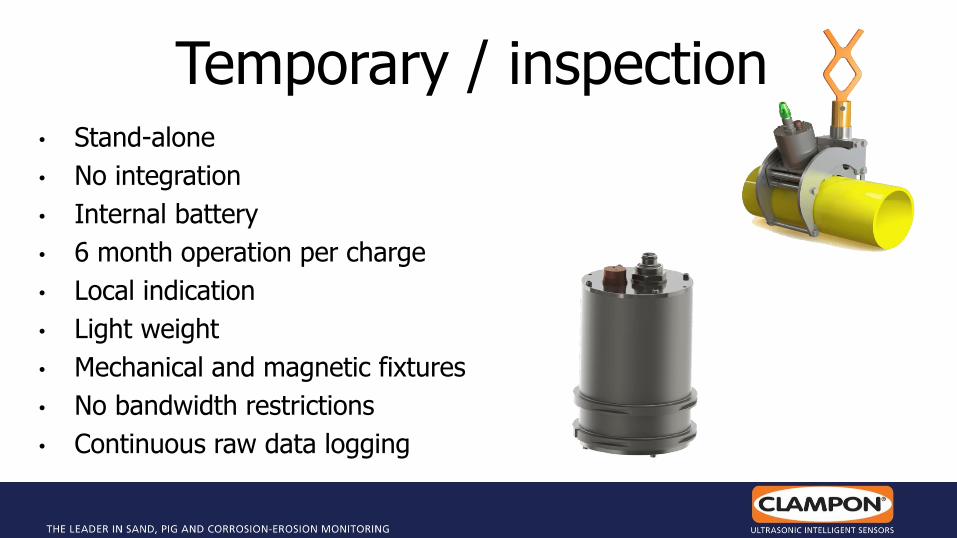
Temporary / inspection • Stand-alone
• No integration
• Internal battery
• 6 month operation per charge
• Local indication
• Light weight
• Mechanical and magnetic fixtures
• No bandwidth restrictions
• Continuous raw data logging
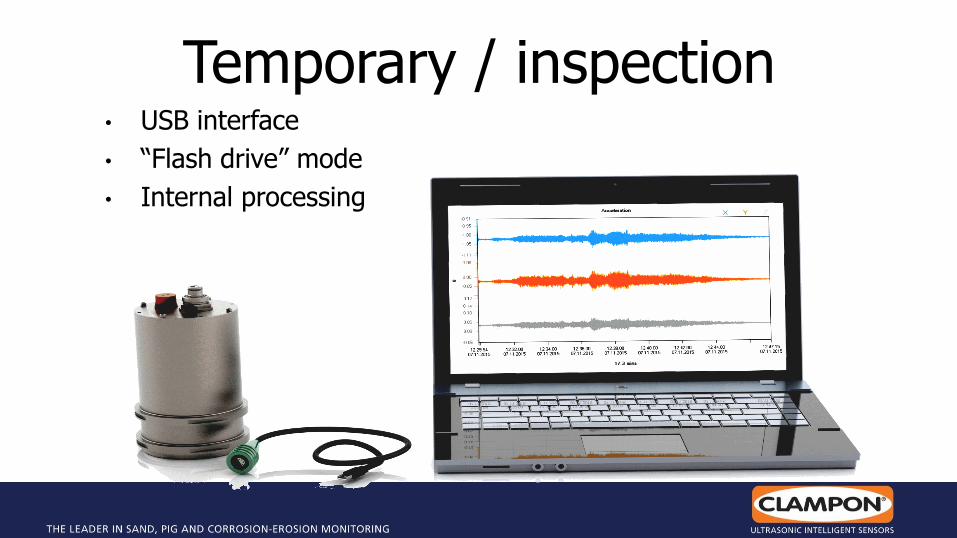
Temporary / inspection • USB interface
• “Flash drive” mode
• Internal processing
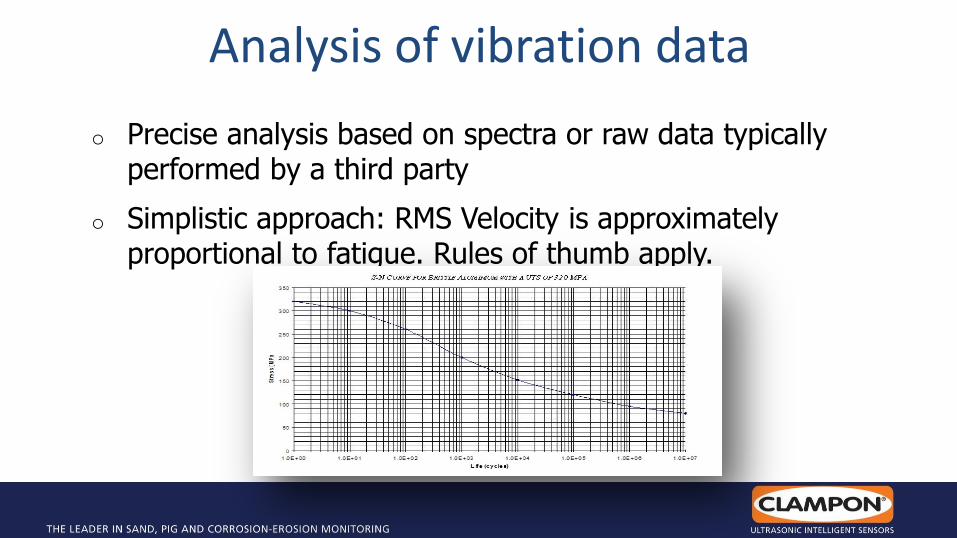
Analysis of vibration data
o Precise analysis based on spectra or raw data typically performed by a third party
o Simplistic approach: RMS Velocity is approximately proportional to fatigue. Rules of thumb apply.
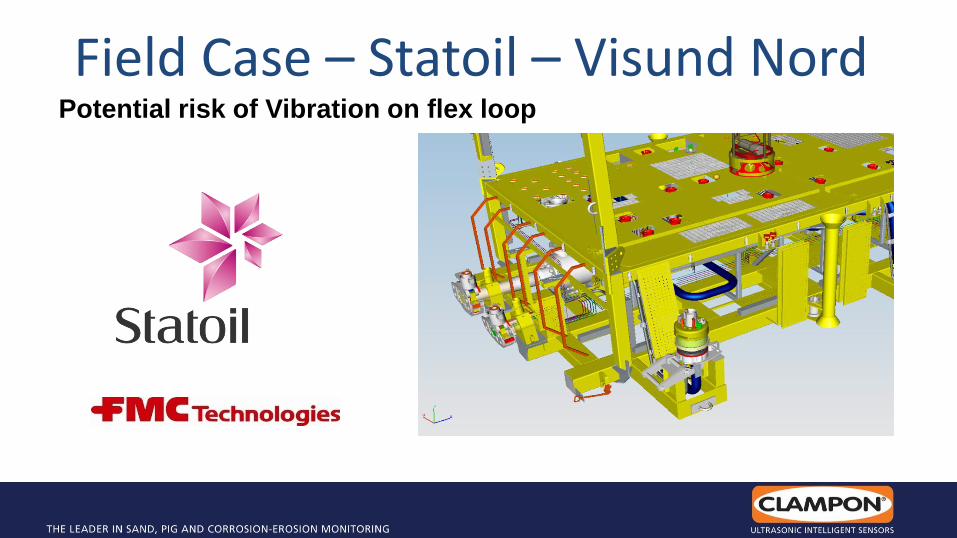
Field Case – Statoil – Visund Nord Potential risk of Vibration on flex loop
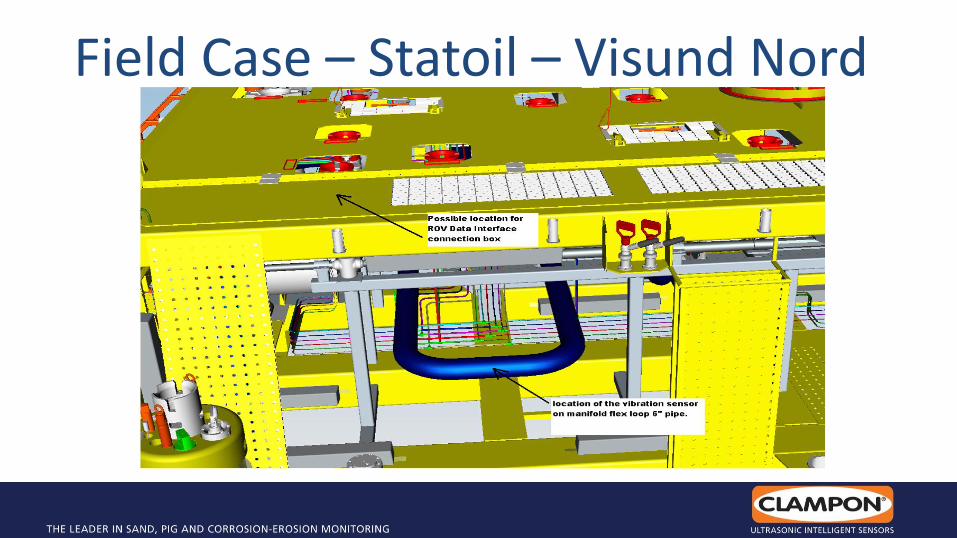
Field Case – Statoil – Visund Nord
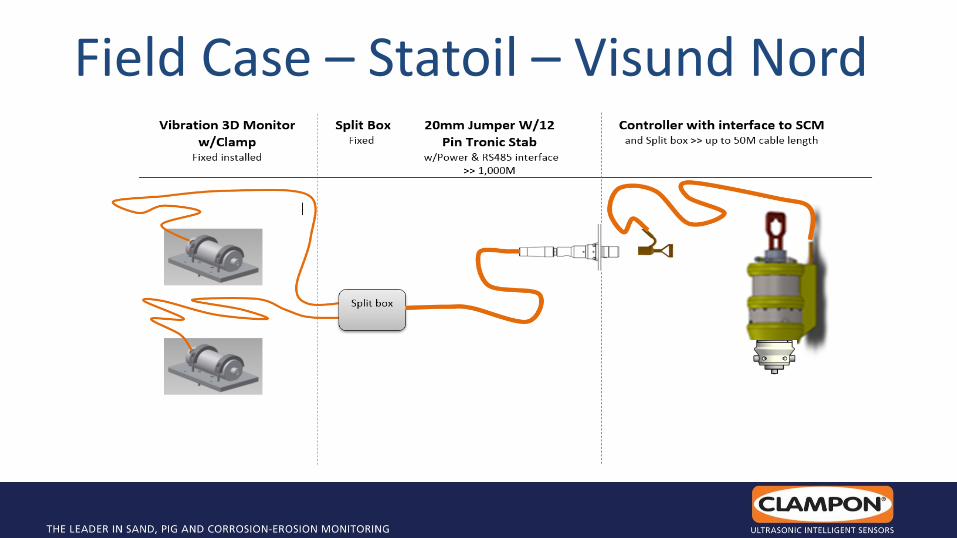
Field Case – Statoil – Visund Nord
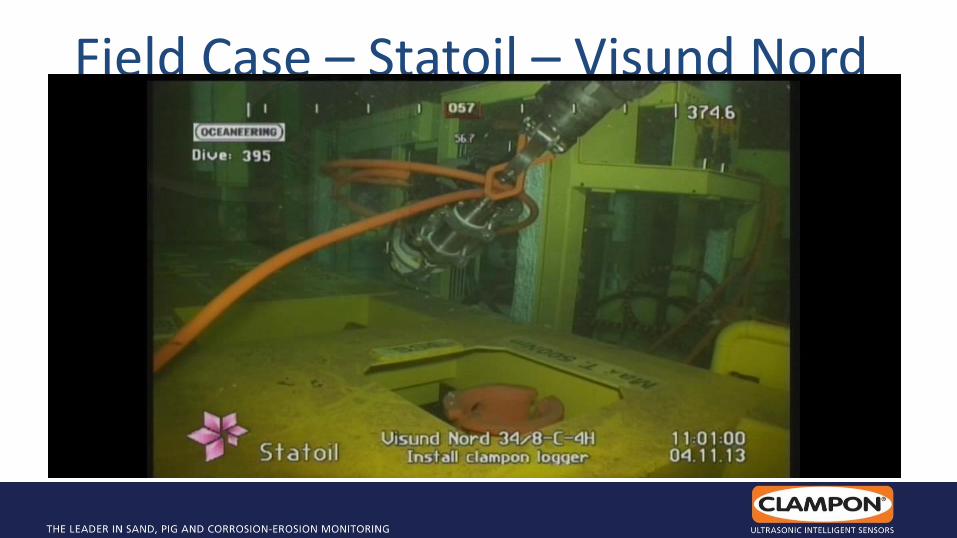
Field Case – Statoil – Visund Nord
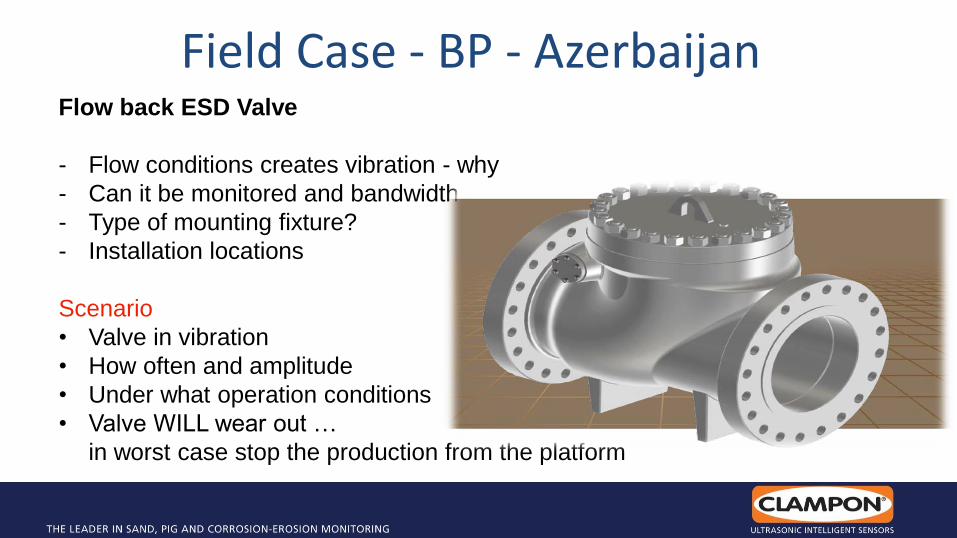
Field Case - BP - Azerbaijan Flow back ESD Valve
- Flow conditions creates vibration - why
- Can it be monitored and bandwidth
- Type of mounting fixture?
- Installation locations
Scenario
• Valve in vibration
• How often and amplitude
• Under what operation conditions
• Valve WILL wear out …
in worst case stop the production from the platform
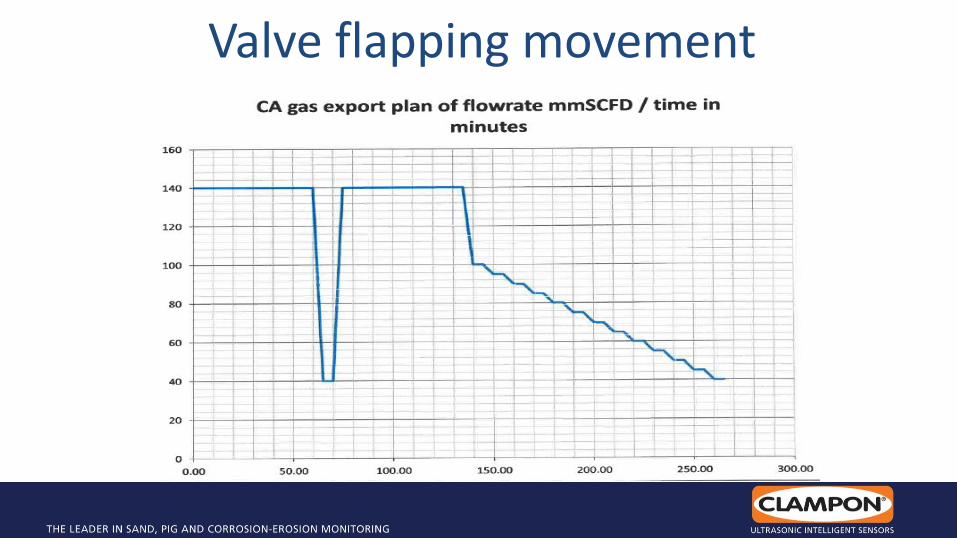
Valve flapping movement
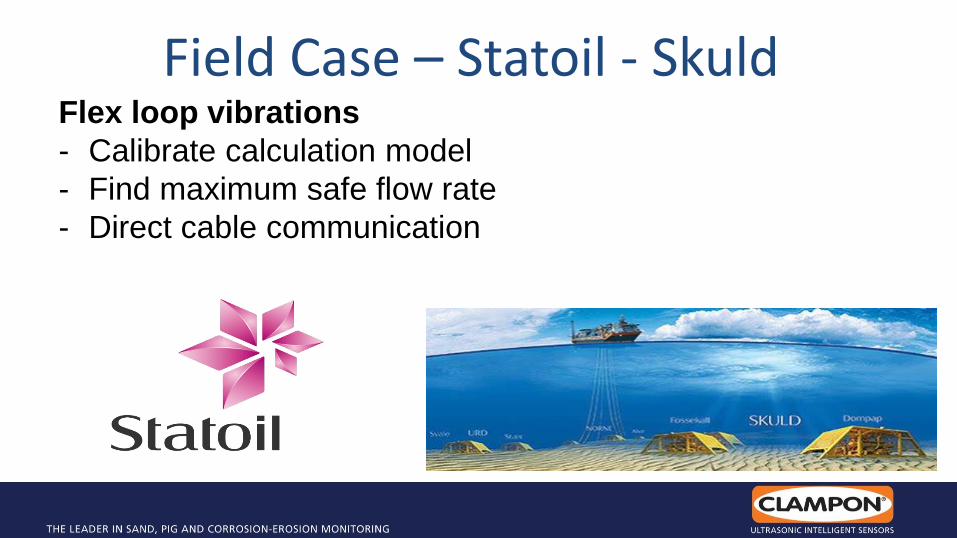
Field Case – Statoil - Skuld Flex loop vibrations
- Calibrate calculation model
- Find maximum safe flow rate
- Direct cable communication

Conclusions
Online monitoring of corrosion/erosion;
• Greater control
• Increased uptime
• Reduced risk
Vibration monitoring;
• Complement vibration modelling
• Actual situation report
• Online/permanent
• Standalone/inspection

Questions?
Olav Brakstad ClampOn
www.clampon.com