tivoli enterprise portal · 2020-01-02 · the ibm ®tivoli monitoring tivoli enterprise portal...
TRANSCRIPT
IBM Tivoli MonitoringVersion 6.2.3 Fix Pack 1
Tivoli Enterprise PortalUser's Guide
SC32-9409-05
���

IBM Tivoli MonitoringVersion 6.2.3 Fix Pack 1
Tivoli Enterprise PortalUser's Guide
SC32-9409-05
���
NoteBefore using this information and the product it supports, read the information in “Notices” on page 449.
This edition applies to version 6, release 2, modification 3, fix pack 1 of IBM Tivoli Monitoring (product number5724-C04 ) and to all subsequent releases and modifications until otherwise indicated in new editions.
© Copyright IBM Corporation 2005, 2012.US Government Users Restricted Rights – Use, duplication or disclosure restricted by GSA ADP Schedule Contractwith IBM Corp.
Contents
About this information . . . . . . . . vii
Chapter 1. Getting started . . . . . . . 1New in this release . . . . . . . . . . . . 1
New in Version 6.2.3 Fix Pack 1 . . . . . . . 1New in Version 6.2.3. . . . . . . . . . . 1New in Version 6.2.2 Fix Pack 2 . . . . . . . 3New in Version 6.2.2. . . . . . . . . . . 4
Tivoli Management Services architecture . . . . . 6Tivoli Enterprise Portal window . . . . . . . . 6Browser client differences. . . . . . . . . . 11Monitoring agents . . . . . . . . . . . . 12Features . . . . . . . . . . . . . . . 13Predefined workspaces, situations, and more . . . 16Tivoli Enterprise Portal tour . . . . . . . . . 18
Navigator . . . . . . . . . . . . . . 18Workspaces . . . . . . . . . . . . . 18Views . . . . . . . . . . . . . . . 19Situations . . . . . . . . . . . . . . 20Properties . . . . . . . . . . . . . . 21Conclusion . . . . . . . . . . . . . 21
Chapter 2. Using the Navigator . . . . 23Navigator overview . . . . . . . . . . . 23Navigator tools . . . . . . . . . . . . . 24Situation event indicators. . . . . . . . . . 25More... indicators . . . . . . . . . . . . 26Expanding the Navigator in increments . . . . . 26Collapsing and expanding the Navigator . . . . 28Finding Navigator items . . . . . . . . . . 28Opening a Navigator view . . . . . . . . . 30Refreshing the Navigator . . . . . . . . . . 31Responding to an application support event . . . 31Removing an event item . . . . . . . . . . 33Removing an offline managed system Navigatoritem . . . . . . . . . . . . . . . . . 33
Chapter 3. Using workspaces . . . . . 35Workspace characteristics . . . . . . . . . . 35Opening a workspace . . . . . . . . . . . 36Opening a new window . . . . . . . . . . 37Tabbed workspaces . . . . . . . . . . . . 38Refreshing a workspace . . . . . . . . . . 39Suspending and stopping refresh . . . . . . . 40Linking to a workspace . . . . . . . . . . 40View title bar and toolbar . . . . . . . . . 41Setting a time span to display . . . . . . . . 41Moving a view . . . . . . . . . . . . . 43Reordering columns and rows . . . . . . . . 43Zooming a chart view . . . . . . . . . . . 44Exporting a query-based view . . . . . . . . 44Finding text in a browser view or notepad view . . 45Finding table data . . . . . . . . . . . . 46Printing a view or workspace . . . . . . . . 48
Chapter 4. Responding to events . . . 49Understanding situation events . . . . . . . . 49Opening the situation event results workspace . . 51Enterprise Status workspace . . . . . . . . . 53Acknowledging an event . . . . . . . . . . 55
Acknowledgement status . . . . . . . . . 56Reviewing the acknowledgement and addingnotes . . . . . . . . . . . . . . . 56Adding notes to an acknowledged event . . . 57Removing an acknowledgement . . . . . . 58
Closing a situation event . . . . . . . . . . 58Turning off the sound . . . . . . . . . . . 59Event reporting . . . . . . . . . . . . . 60
Chapter 5. Customizing workspaces . . 61Custom workspace options and guidelines . . . . 61Tutorial: Defining a workspace . . . . . . . . 62Starting workspace administration mode . . . . 65Workspace properties . . . . . . . . . . . 66Creating a new workspace . . . . . . . . . 67Saving a workspace . . . . . . . . . . . 68Editing a workspace . . . . . . . . . . . 69Renaming a workspace . . . . . . . . . . 69Deleting or restoring a workspace . . . . . . . 70
Deleting a workspace . . . . . . . . . . 70Restoring the original workspace . . . . . . 70
Defining links between workspaces . . . . . . 71Creating a new link . . . . . . . . . . 71Testing the link . . . . . . . . . . . . 74Editing a link definition . . . . . . . . . 74Deleting a link definition . . . . . . . . . 75Adding or editing a link anchor . . . . . . 75Link examples . . . . . . . . . . . . 76
Chapter 6. Customizing workspaceviews . . . . . . . . . . . . . . . 81Creating a new view . . . . . . . . . . . 81Editing a view . . . . . . . . . . . . . 82Query-based views . . . . . . . . . . . . 83
Selecting a query for a view . . . . . . . . 84Filtering a query-based view . . . . . . . 85Properties editor. . . . . . . . . . . . 86
Table view. . . . . . . . . . . . . . . 94Adding a table view . . . . . . . . . . 94Table view features . . . . . . . . . . . 95Adding column thresholds . . . . . . . . 96Guidelines for threshold icons . . . . . . . 98
Chart views . . . . . . . . . . . . . . 98Creating a new chart . . . . . . . . . . 99Pie chart . . . . . . . . . . . . . . 102Bar chart . . . . . . . . . . . . . . 104Plot chart. . . . . . . . . . . . . . 105Area chart . . . . . . . . . . . . . 106Circular gauge chart . . . . . . . . . . 108Linear gauge chart . . . . . . . . . . 109
© Copyright IBM Corp. 2005, 2012 iii
Chart style . . . . . . . . . . . . . 111Chart baselines . . . . . . . . . . . . 120
Topology view . . . . . . . . . . . . . 127Creating a topology view . . . . . . . . 128What the topology view shows . . . . . . 129Topology view style properties . . . . . . 131TMS Infrastructure view. . . . . . . . . 133
Event views . . . . . . . . . . . . . . 135Adding a message log view . . . . . . . 135Adding a Universal Message Console view . . 138Adding a graphic view . . . . . . . . . 139Adding a situation event console view . . . . 145Adding a common event console view . . . . 150Adding a Tivoli Enterprise Console eventviewer. . . . . . . . . . . . . . . 156
Creating a browser view . . . . . . . . . 159Browser view toolbar. . . . . . . . . . 159URL to files on the portal server . . . . . . 160Link symbols in the URL address. . . . . . 160Link to external browser. . . . . . . . . 160
Adding a notepad view . . . . . . . . . . 161Creating a take action view. . . . . . . . . 161Terminal view . . . . . . . . . . . . . 162
Adding a terminal view to the workspace . . . 162What the terminal view shows . . . . . . 163Terminal view properties . . . . . . . . 164Running a script . . . . . . . . . . . 166Recording a script . . . . . . . . . . . 166Managing scripts . . . . . . . . . . . 167Terminal Emulator Scripting Language . . . . 168
Chapter 7. Custom queries . . . . . 191Understanding queries . . . . . . . . . . 191Queries to the monitoring server . . . . . . . 192
Creating a query to the monitoring server . . . 193Creating another query to the monitoring server 195Adding symbols in queries to the monitoringserver . . . . . . . . . . . . . . . 196
Queries to a database. . . . . . . . . . . 197Creating a query to a JDBC or ODBC database 197Notes on queries to a JDBC or ODBC database 198Creating another query to a JDBC or ODBCdatabase . . . . . . . . . . . . . . 199Symbols in creating queries to JDBC or ODBCdata sources . . . . . . . . . . . . . 200Adding a database to the Data Source list . . . 200
Editing a query. . . . . . . . . . . . . 201Deleting a query . . . . . . . . . . . . 203Tivoli Enterprise Monitoring Server predefinedqueries . . . . . . . . . . . . . . . 204
Chapter 8. Historical reporting . . . . 207Overview of historical data collection andreporting . . . . . . . . . . . . . . . 207Setting a time span to display . . . . . . . . 208Discontinuing historical reporting . . . . . . 209Turning on historical navigation mode . . . . . 210Historical collection configuration . . . . . . 211
Understanding historical configuration . . . . 211Creating a historical collection. . . . . . . 214
Distributing a historical collection . . . . . 217Configuring summarization and pruning forattribute groups . . . . . . . . . . . 219Creating another historical collection . . . . 220Creating a historical configuration group . . . 221Stopping data collection . . . . . . . . . 222Starting data collection . . . . . . . . . 223Changing the distribution method . . . . . 224Removing a historical data collection . . . . 225
Chapter 9. Navigator views for logicalorganization . . . . . . . . . . . . 227Custom Navigator view characteristics . . . . . 227Creating a new Navigator view . . . . . . . 228Adding a child item . . . . . . . . . . . 230Editing a Navigator view . . . . . . . . . 231Editing Navigator item properties . . . . . . 232Renaming a Navigator view or item. . . . . . 233Deleting a Navigator view or item . . . . . . 234Navigator editor and properties . . . . . . . 234
Edit Navigator view . . . . . . . . . . 235Navigator item properties . . . . . . . . 236Assigned member options . . . . . . . . 238Navigator List . . . . . . . . . . . . 239
Chapter 10. Situations for eventmonitoring . . . . . . . . . . . . 241Overview. . . . . . . . . . . . . . . 241Opening the Situation editor . . . . . . . . 243Filtering the situations tree . . . . . . . . . 244Situation editor . . . . . . . . . . . . . 245Predefined situations . . . . . . . . . . . 255
All Managed Systems situations . . . . . . 255Tivoli Enterprise Monitoring Server situations 256
Creating a situation . . . . . . . . . . . 257Defining the condition . . . . . . . . . 257Distributing the situation . . . . . . . . 261Writing expert advice. . . . . . . . . . 262Specifying an action . . . . . . . . . . 264Adding an Until modifier . . . . . . . . 266Forwarding the event to an EIF receiver . . . 267
Starting or stopping a situation . . . . . . . 273Situation association with Navigator items . . . 274
Associating a situation . . . . . . . . . 275Dissociating a situation . . . . . . . . . 276
Modeling conditions for situations . . . . . . 276Understanding situation modeling . . . . . 277Modeling a situation with view data . . . . 278Modeling with an existing situation . . . . . 279Model Situation . . . . . . . . . . . 279
Editing a situation. . . . . . . . . . . . 284Deleting a situation . . . . . . . . . . . 285Situation overrides for dynamic thresholding . . . 286
Creating a situation override . . . . . . . 286Adaptive monitoring considerations . . . . . 288Disabling and enabling situation overrides . . 290Removing override definitions. . . . . . . 290Expression override and scheduling windows 291
Embedding a situation . . . . . . . . . . 300Correlating situations. . . . . . . . . . . 301
iv IBM Tivoli Monitoring: Tivoli Enterprise Portal User's Guide
Situation examples . . . . . . . . . . . 307Situation troubleshooting . . . . . . . . . 309
Chapter 11. Automating actions andresponses . . . . . . . . . . . . . 315Automation with policies . . . . . . . . . 315
Viewing policy details . . . . . . . . . 316Creating a policy . . . . . . . . . . . 316Editing a policy . . . . . . . . . . . 318Copying a policy . . . . . . . . . . . 319Deleting a policy . . . . . . . . . . . 320Starting and stopping policies . . . . . . . 321Policy distribution . . . . . . . . . . . 322Workflows . . . . . . . . . . . . . 322Tivoli Application Dependency DiscoveryManager policies . . . . . . . . . . . 340
Take action commands . . . . . . . . . . 344Creating a take action command . . . . . . 344Editing a take action command . . . . . . 346Sending a take action command . . . . . . 346Creating a take action view. . . . . . . . 348Rules and guidelines for take action commands 348
Launch application . . . . . . . . . . . 349Creating a launch definition . . . . . . . 349Copying or editing a launch definition . . . . 351Deleting a launch definition . . . . . . . 351Launch application examples . . . . . . . 352
Chapter 12. User administration . . . 355Managing user IDs . . . . . . . . . . . 355
Viewing and editing a user ID. . . . . . . 356Adding a user ID . . . . . . . . . . . 357Removing a user ID . . . . . . . . . . 358Default user . . . . . . . . . . . . . 358
Managing user groups . . . . . . . . . . 359Viewing user group memberships . . . . . 359Adding a user group . . . . . . . . . . 359Reviewing and editing a user group. . . . . 360Removing a user group . . . . . . . . . 361
Administer Users . . . . . . . . . . . . 362Users and User Groups . . . . . . . . . 362Permissions . . . . . . . . . . . . . 362Applications. . . . . . . . . . . . . 366Navigator views . . . . . . . . . . . 366Member Of and Members . . . . . . . . 367
Notes on user administration . . . . . . . . 367Troubleshooting logon error messages . . . . . 369
Chapter 13. Managing theenvironment . . . . . . . . . . . . 373Grouping objects . . . . . . . . . . . . 373
Object group editor . . . . . . . . . . 373Managed system groups. . . . . . . . . 375Creating a historical configuration group . . . 378Creating a situation group . . . . . . . . 379
Managed system status . . . . . . . . . . 380Managed System Status workspace . . . . . 380EIB Change Log workspace . . . . . . . 384Self-Monitoring Topology workspace . . . . 384
Tivoli Enterprise Monitoring Server status . . . . 385
Manage Tivoli Enterprise Monitoring Serversworkspaces . . . . . . . . . . . . . 385Manage Tivoli Enterprise Monitoring Serversituations. . . . . . . . . . . . . . 387
Managing monitoring agents . . . . . . . . 387Agent deployment workspaces . . . . . . 388Stopping a monitoring agent . . . . . . . 393Recycling a monitoring agent . . . . . . . 393Starting an offline monitoring agent . . . . . 393Adding a managed system through the TivoliEnterprise Portal . . . . . . . . . . . 394Configuring a managed system . . . . . . 395Updating a monitoring agent . . . . . . . 396Removing a managed system and monitoringagent . . . . . . . . . . . . . . . 397
Optimizing IBM Tivoli Monitoring resources . . . 397Organization of predefined workspaces . . . . 398Tivoli Enterprise Monitoring Server situations . . 399
Appendix A. Formula functions. . . . 401Formula function types . . . . . . . . . . 401Attribute and attribute group characteristics . . . 403Boolean AND and OR . . . . . . . . . . 404Formula editor menu. . . . . . . . . . . 405Cell functions . . . . . . . . . . . . . 406
BETWEEN: See if value is within a range . . . 406CHANGE: Change in value . . . . . . . 407DATE: Compare Date and Time . . . . . . 407ISNULL: See if Null has been detected . . . . 408MISSING: Check for missing items . . . . . 408PCTCHANGE: Percent change in value . . . 409REGEX: Scan for a string based on RegularExpression pattern. . . . . . . . . . . 409SCAN: Scan for string within a string . . . . 411STR: Return a subset of the string . . . . . 411TIME: Compare to a time +/- delta . . . . . 412TIMESPAN: See if a time is within a range . . 412VALUE: Value of expression . . . . . . . 412
Group functions . . . . . . . . . . . . 413AVG: Average of group . . . . . . . . . 414COUNT: Count of group members . . . . . 414MAX: Maximum in group . . . . . . . . 415MIN: Minimum in group . . . . . . . . 415SUM: Sum of group . . . . . . . . . . 415
Appendix B. Tivoli EnterpriseMonitoring Server and globalattributes . . . . . . . . . . . . . 417Agent Operations Log attributes . . . . . . . 418Catalog Check attributes. . . . . . . . . . 418Deploy Status attributes . . . . . . . . . . 419Deploy Summary attributes . . . . . . . . 421Depot Inventory attributes . . . . . . . . . 422EIB Change Log attributes . . . . . . . . . 423ITM Audit attributes . . . . . . . . . . . 424Local Time attributes . . . . . . . . . . . 429Managed Systems attributes . . . . . . . . 430Situation Definition attributes . . . . . . . . 431Situation State Event attributes . . . . . . . 433Situation Status Current attributes . . . . . . 435
Contents v
Situation Status Log attributes . . . . . . . . 436Universal Messages attributes . . . . . . . . 438Universal Time attributes . . . . . . . . . 439
Documentation library . . . . . . . 441IBM Tivoli Monitoring library . . . . . . . . 441
Documentation for the base agents . . . . . 442Related publications . . . . . . . . . . . 443Other sources of documentation . . . . . . . 443
Support information . . . . . . . . 445
Notices . . . . . . . . . . . . . . 449
Glossary . . . . . . . . . . . . . 453
Index . . . . . . . . . . . . . . . 463
vi IBM Tivoli Monitoring: Tivoli Enterprise Portal User's Guide
About this information
The IBM®Tivoli® Monitoring Tivoli Enterprise Portal User's Guide describes the TivoliEnterprise Portal features for working with your IBM Tivoli Monitoring products.
Users of this book should be familiar with performance monitoring concepts. Ifyou use the IBM Tivoli Data Warehouse, you need to be familiar with theoperating system that hosts the warehouse. For a list of what is new see “New inVersion 6.2.3” on page 1.
The document assumes no previous experience with IBM Tivoli Monitoring. Tolearn more about this family of products: http://www.ibm.com/software/tivoli/solutions/service-availability/index.html.
© Copyright IBM Corp. 2005, 2012 vii

viii IBM Tivoli Monitoring: Tivoli Enterprise Portal User's Guide
Chapter 1. Getting started
The Tivoli Enterprise Portal is the window into your Tivoli monitoredenvironment. The portal lets you explore your enterprise in the same way thatyour browser lets you explore the Internet. Consult the topics here to answer thequestions, Where do I start? and What can I do here?.
New in this releaseReview the latest enhancements to the Tivoli Enterprise Portal.
New in Version 6.2.3 Fix Pack 1No major changes were made to the Tivoli Enterprise Portal client for Version 6.2.3Fix Pack 1. Minor changes were made for content improvements.
See the following new in this release topics:New in this release in the IBM Tivoli Monitoring Administrator's Guide
New in this release in the IBM Tivoli Monitoring Installation and Setup Guide
New in Version 6.2.3The following enhancements have been made to the Tivoli Management Servicescomponents that affect the system administrator since the release of Version 6.2.2Fix Pack 2.
Application Support Mismatch tool shows version discrepanciesShow new or updated application support event is a new addition to
the Navigator view toolbar. A count of version mismatch messages isdisplayed next to the tool. Select the tool to see the list of applicationsupport version mismatches between the Tivoli Enterprise Portal client andserver, and to see instructions for correcting the discrepancy. See“Responding to an application support event” on page 31 for moreinformation.
Apply pending updates tool shows the number of updatesThe tool for refreshing the Navigator view now includes a count of themonitoring agent changes (added or removed) that are waiting to beupdated. For example, six pending updates are shown as 6 Applypending updates. See “Navigator tools” on page 24 for more information.
Tivoli Performance AnalyzerTivoli Performance Analyzer is now a base component of IBM TivoliMonitoring. Tivoli Performance Analyzer adds predictive capability toTivoli Monitoring so you can monitor resource consumption trends,anticipate future performance issues, and avoid or resolve problems morequickly. Click Performance Analyzer Configuration on the toolbar toconfigure analytic tasks. See the IBM Tivoli Performance Analyzer User’sGuide.
Situation event console and Common event console tools show the number ofevents The tools for filtering by event severity now include a count of the open
events. For example, nine informational events are shown as 9
© Copyright IBM Corp. 2005, 2012 1
Informational. See “What the situation event console shows” on page 146and “What the common event console view shows” on page 151 for moreinformation.
Manually started situationsSituations that are not set to Run at startup must be started manually. Inprevious versions, if a managed system was added to the distribution afterthe situation was started manually, the situation would not start on thenewly added managed system. Now, after the situation is started manually,it starts automatically on any managed systems that are subsequentlyadded to the distribution. See Start situations manually or automaticallyfor more information.
Historical data compression before upload to Tivoli Data WarehouseTo reduce network traffic, data collected from distributed monitoringagents is now compressed in memory at the collection location beforebeing sent to the Warehouse Proxy agent for storage on the Tivoli DataWarehouse. Database tables are compressed, which reduces storagerequirements, increases the buffer pool hit ratios, and improves theefficiency of the Summarization and Pruning agent and Warehouse Proxyagent.
See the topic about compressing historical data under Tivoli DataWarehouse solutions in the IBM Tivoli Monitoring Installation and SetupGuide.
Filtering capabilities on the names of processes in Linux and UNIXThe Linux OS and UNIX OS agents now provide additional filteringcapabilities on names of processes that enable you to distinguish processnames that are longer than 768 characters. For details, see the TivoliMonitoring Linux OS Agent User's Guide New in this release topic or theTivoli Monitoring UNIX OS Agent User's Guide New in this release topic.
New and enhanced CLI tacmd commandsThe CLI has new options for many of the tacmd commands and thefollowing new commands:v tacmd checkprereq to check for prerequisites on the target system before
deploying a monitoring agent there. You can review the results with thetacmd getdeploystatus command or with the “Deployment StatusSummary workspace” on page 388.
v tacmd restartFailedDeploy to restart failed deployments.v KinCli.exe to generate response files.
See the “New in this release” topic of the IBM Tivoli Monitoring CommandReference for details.
Tivoli Application Dependency Discovery Manager policiesYou can create policies that interact with your Tivoli ApplicationDependency Discovery Manager (TADDM) environment. These policiescan forward events such as, new, changed, or destroyed resources to yourTivoli Application Dependency Discovery Manager server. See “TivoliApplication Dependency Discovery Manager policies” on page 340 formore details.
ITM Audit attributes and workspaceThe ITM Audit attributes give information on critical state-changing eventsin the monitoring environment. See “ITM Audit attributes” on page 424and “Managed System Status workspace” on page 380 for moreinformation.
2 IBM Tivoli Monitoring: Tivoli Enterprise Portal User's Guide
New in Version 6.2.2 Fix Pack 2Several enhancements were made to the Tivoli Enterprise Portal since the release ofVersion 6.2.2. No changes were made to the Tivoli Enterprise Portal client forVersion 6.2.2 fix pack 1.
You can also view the What's New in Tivoli Monitoring 6.2.2 Fix Pack 2 video onthe developWorks Tivoli Media Gallery.
Dynamic items for custom Navigator viewsThe Navigator Physical view is a discovered view and the NavigatorLogical view is a predefined, customizable view. You can also createcustom Navigator views for different logical hierarchies. Because customNavigator views are user-defined, these views are not updated in the TivoliEnterprise Portal when new managed systems come online. You mustmanually add them using Navigator editor.
Now you can assign managed system groups to Navigator items asdynamic members in the new Dynamic items tab of the Navigator itemproperties editor. As managed systems are added or removed from thegroup, the constituent members change dynamically within this branch ofthe Navigator. New managed systems that fit the filter criteria of themanaged system group are added automatically.
See “Navigator item properties” on page 236.
Filtered historical data collectionThe Tivoli Monitoring Version 6.2.2 release included the added capabilityof configuring multiple data collections for the same attribute groups withdifferent settings and managed system distributions. Also added was theability to create historical groups of historical collections that share thesame managed system distribution.
Now you can write filter criteria to specify the data to collect. The newFilter tab in the Historical Collection Configuration editor has a formulaeditor much like what you have in the Situation editor. Historical collectionof a data sample occurs only if the values in the data row fulfill the filtercriteria. For example, if the data sample has % Disk Write Time greaterthan 50%, it is saved to short-term history; otherwise the sample is notsaved. See step 9 on page 215 of the “Creating a historical collection” topic.
The command-line interface tacmd histcreatecollection and tacmdhisteditcollection commands have been updated to include the filteroption for adding a filter formula; the tacmd histviewcollection and tacmdhistlistcollections commands display any defined filter for a historicalcollection; and tacmd histviewattributegroup has been updated to add the-v verbose option to include the table name and attribute names in thedisplay. See IBM Tivoli Monitoring Command Reference (http://publib.boulder.ibm.com/infocenter/tivihelp/v15r1/topic/com.ibm.itm.doc_6.2.3fp1/itm623fp1_cmdref.htm).
Define schedules for running situation overridesIn previous releases you could apply a predefined schedule, such asWeekend, to specify when the situation expression override is run. You cannow create your own calendar-based schedule or hourly schedule for eachexpression override that you create for a situation.
Also in previous releases, the only way to define a schedule for a situationexpression override was through the command-line interface tacmd
Chapter 1. Getting started 3
addCalendarEntry. As well as shared calendar-based schedules in theSituation editor, you can define repeating hourly schedules that apply tospecific hourly time ranges.
See “Creating a situation override” on page 286.
The CLI tacmd setOverride, tacmd deleteOverride, tacmdsuggestBaseline, and tacmd acceptBaseline commands have been updatedto include the inlinecal option for specifying the inline (hourly) calendarschedule. See IBM Tivoli Monitoring Command Reference(http://publib.boulder.ibm.com/infocenter/tivihelp/v15r1/topic/com.ibm.itm.doc_6.2.3fp1/itm623fp1_cmdref.htm).
Model Expression dialog for testing situation override scenariosTivoli Monitoring V6.2.2 introduced the expression modeling feature tovisually assist the situation author in establishing proper threshold valuesbased on historical data and statistical analysis (see “Model Situation” onpage 279). That same capability has now been added for situationexpression overrides.
This new visual modeling capability also integrates the ability todynamically build and associate daily schedules to expression overridesusing drag-and-drop gesturing. See “Model Expression” on page 296.
Monitored baselining for charts indicate situation override expressionsThe Add Monitored Baseline tool was added to the chart views inTivoli Monitoring V6.2.2 for you to visualize the attribute threshold valuesfrom associated situations alongside the historical or real-time informationdisplayed. If expression overrides are associated with the situation, youcan now visualize them in the chart as well. You can optionally filter outsituation and expression overrides that are inactive based on the datasample and time span being rendered in the view.
See “Adding monitored baselines to a chart” on page 120.
New in Version 6.2.2This topic describes enhancements to the Tivoli Enterprise Portal since the releaseof Version 6.2.1. Many of the changes are obvious as soon as you log on, such asthe new toolbar icons. Others are changes in behavior or changes that are notapparent until you open workspaces or one of the editors.
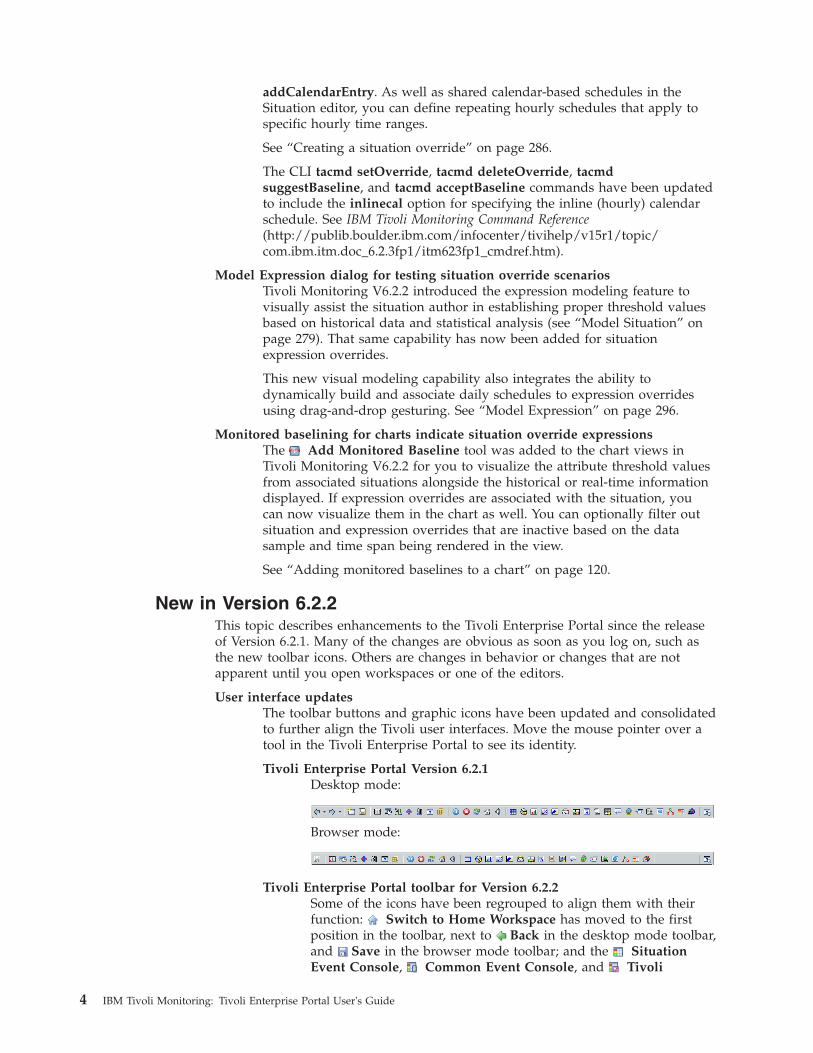
User interface updatesThe toolbar buttons and graphic icons have been updated and consolidatedto further align the Tivoli user interfaces. Move the mouse pointer over atool in the Tivoli Enterprise Portal to see its identity.
Tivoli Enterprise Portal Version 6.2.1Desktop mode:
Browser mode:
Tivoli Enterprise Portal toolbar for Version 6.2.2Some of the icons have been regrouped to align them with theirfunction: Switch to Home Workspace has moved to the firstposition in the toolbar, next to Back in the desktop mode toolbar,and Save in the browser mode toolbar; and the SituationEvent Console, Common Event Console, and Tivoli
4 IBM Tivoli Monitoring: Tivoli Enterprise Portal User's Guide
Enterprise Console views are grouped near the end of the toolbar.Desktop mode:
Browser mode:
Workspace gallery for identification and selectionAs well as the default workspace that opens when you click a Navigatoritem, additional workspaces are often available for the item and selectablethrough the Navigator pop-up menu or the View menu. Now you have theWorkspace Gallery tool for showing you the workspaces that you can openfor the current Navigator item. See “Opening a workspace” on page 36.
Manage Tivoli Enterprise Monitoring Server workspaces and situationsNew self-monitoring workspaces and situations have been added and areaccessible through the Enterprise Navigator item to help you monitor forand diagnose typical monitoring server configuration issues. See “TivoliEnterprise Monitoring Server status” on page 385.
Configure historical data collection with distribution listsThe Historical Collection Configuration window has been redesigned. Itlooks similar to the Situation editor, with a tree on the left and userassistance on the right until you select a tree item: The summarization andpruning settings are displayed when you select a managed application;and the historical collection configuration is displayed when you select acollection name within the managed application branch.
You can now have multiple collection configurations for an attribute group.There is also a new distribution method called Managed System (TEMA)that enables you to specify the managed systems that data collection willoccur on. (With this method, the managed systems must connect to aV6.2.2 Tivoli Enterprise Monitoring Server.) See “Historical collectionconfiguration” on page 211.
Several tacmd commands have been added for creating, deleting, editing,listing, viewing the configuration of historical data collections. Althoughnot new for this release, the bulkExportSit -h and bulkImportSit -h commandscan be used to export and import historical collection configurations. Seethe IBM Tivoli Monitoring Command Reference.
Granular data collection with historical configuration object groupsObject grouping was introduced in the previous release for situations andmanaged systems. Now you can create historical configuration objectgroups, which can include managed system distribution, and assignhistorical collections to them. See “Object group editor” on page 373.
Managed system lists renamed to managed system groupsThe term managed system list has been renamed to managed system group tofollow the naming used in the Object Group editor.
Modeling conditions for situationsNow you can capture data from a query-based view and use it to modelpossible threshold scenarios, then apply the results to a situation. You canalso select a situation from the Manage Situations at Managed Systemwindow, compare the criteria with current and historical data samples, formodeling, and use the results to edit the situation thresholds. See“Modeling conditions for situations” on page 276.
Chapter 1. Getting started 5

Baselining added to charts for trend analysisThe bar chart, plot chart, and area chart have a new Add MonitoredBaseline tool for selecting a situation to compare with the currentsampling and anticipated values. The plot chart and area chart also have anew Add Statistical Baseline tool with statistical functions. In addition,the plot chart has a new Add Historical Baseline tool for comparingcurrent samplings with a historical period. See “Chart baselines” on page120.
Situation overrides can be assigned to subnodesSituation overrides for dynamic thresholding has been extended to includesubnodes. For situations that are distributed to managed systems that aresubnodes of other managed systems, you can now apply expressionoverrides to the managed system subnodes. See “Situation overrides fordynamic thresholding” on page 286.
Tivoli Management Services architectureThe Tivoli Enterprise Portal is based on a client-server-agent architecture.
Client
The Tivoli Enterprise Portal client is a Java-based user interface for viewing andmonitoring your enterprise network. Depending on how it was installed, you canstart Tivoli Enterprise Portal as a desktop application, a web application throughyour browser, or Java Webstart, which downloads the installable software from theTivoli Enterprise Portal Server, installs it, and then makes it available as a desktopapplication.
Server
The Tivoli Enterprise Portal client connects to its application server, the TivoliEnterprise Portal Server. The Tivoli Enterprise Portal Server is a collection ofsoftware services for the client that enables retrieval, manipulation and analysis ofdata from the monitoring agents on your enterprise. This server connects to theTivoli Enterprise Monitoring Server, which acts as a collection and control point foralerts received from the monitoring agents, and collects performance andavailability data. The main, or hub, Tivoli Enterprise Monitoring Server correlatesthe monitoring data collected by agents and remote servers and passes it to theTivoli Enterprise Portal Server for presentation and your evaluation.
Agent
Tivoli Enterprise Monitoring Agents are installed on the systems whose applicationsor resources you want to monitor. The monitoring agent collects the monitoreddata, and passes it to the Tivoli Enterprise Monitoring Server to which it isconnected. The client gathers the current values of the monitored properties, orattributes, and displays them in views. It can also test the values against athreshold and display an event indicator when that threshold is exceeded.
Tivoli Enterprise Portal windowUse this topic to familiarize yourself with the elements of the Tivoli EnterprisePortal window.
6 IBM Tivoli Monitoring: Tivoli Enterprise Portal User's Guide
The Tivoli Enterprise Portal window displays information about monitoredresources in your enterprise. On the left is the Navigator, which shows thearrangement of your monitored network and allows you to access informationcollected by different agents on your monitored systems. On the right is aworkspace. The workspace can be divided into as many smaller frames, or panes,as you can reasonably fit inside the window. When you select an item in theNavigator, a new workspace opens with a set of views for that item.
The window comprises the following elements:
Title bar
In browser mode (as shown), the title bar shows the name of theworkspace.
In desktop mode, the title bar shows the name of the workspace, the nameand port number of the Tivoli Enterprise Portal Server, and the user name.For example, NT Cache Details - mars:14000 - JONDO tells us that the NTCache Details workspace is open and the user JONDO is connected to theTivoli Enterprise Portal Server named mars through port number 14000.
Banner
The banner is displayed when you run Tivoli Enterprise Portal in browsermode. You can replace it with your own .GIF graphic, such as yourcompany logo. See IBM Tivoli Monitoring: Administering Tivoli EnterprisePortal at the Tivoli software information center for more information.
Menu bar
Tivoli Enterprise Portal has a menu bar that includes the following fourmenus:
File The File menu has options for working with workspaces, setting a trace, andexiting the Tivoli Enterprise Portal. The Trace Options are used only as instructedby a IBM customer support representative.
Edit The Edit menu has editing options for workspace properties, historical datacollection configuration, policies, situations, user IDs, queries, and object groups.
View The View menu has options for opening other workspaces for a Navigator item,hiding or showing the toolbars and status bar, refreshing the data in thisworkspace, turning off sound for events, and for opening other Navigator views.
Help The Help menu opens the Tivoli Enterprise Portal Help, a 10-minute tour to giveyou some hands-on experience, and links to the IBM website.
Also available are menus that open when you right-click an item in theNavigator or a view in the workspace.
In browser mode you can also use the browser menu bar, which isdisplayed just below the title bar.
If your user ID does not have View or Modify permission for a function ordoes not have Workspace Author Mode permission, you will not seecertain items in the menus, including the pop-up menus. For example, ifyou have no Workspace Author Mode permission, the Properties menuitem is not displayed.
Toolbar
Chapter 1. Getting started 7
Your user ID requires Workspace Author Mode permission to create andmaintain workspaces, including links.
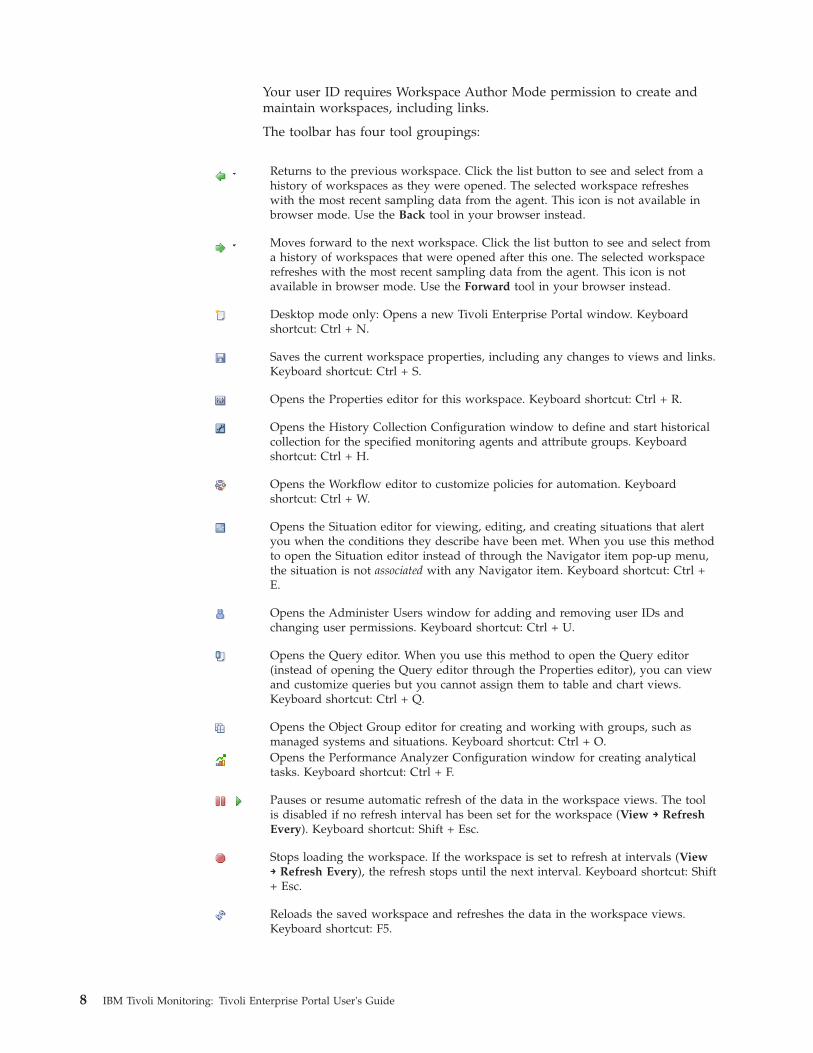
The toolbar has four tool groupings:
Returns to the previous workspace. Click the list button to see and select from ahistory of workspaces as they were opened. The selected workspace refresheswith the most recent sampling data from the agent. This icon is not available inbrowser mode. Use the Back tool in your browser instead.
Moves forward to the next workspace. Click the list button to see and select froma history of workspaces that were opened after this one. The selected workspacerefreshes with the most recent sampling data from the agent. This icon is notavailable in browser mode. Use the Forward tool in your browser instead.
Desktop mode only: Opens a new Tivoli Enterprise Portal window. Keyboardshortcut: Ctrl + N.
Saves the current workspace properties, including any changes to views and links.Keyboard shortcut: Ctrl + S.
Opens the Properties editor for this workspace. Keyboard shortcut: Ctrl + R.
Opens the History Collection Configuration window to define and start historicalcollection for the specified monitoring agents and attribute groups. Keyboardshortcut: Ctrl + H.
Opens the Workflow editor to customize policies for automation. Keyboardshortcut: Ctrl + W.
Opens the Situation editor for viewing, editing, and creating situations that alertyou when the conditions they describe have been met. When you use this methodto open the Situation editor instead of through the Navigator item pop-up menu,the situation is not associated with any Navigator item. Keyboard shortcut: Ctrl +E.
Opens the Administer Users window for adding and removing user IDs andchanging user permissions. Keyboard shortcut: Ctrl + U.
Opens the Query editor. When you use this method to open the Query editor(instead of opening the Query editor through the Properties editor), you can viewand customize queries but you cannot assign them to table and chart views.Keyboard shortcut: Ctrl + Q.
Opens the Object Group editor for creating and working with groups, such asmanaged systems and situations. Keyboard shortcut: Ctrl + O.Opens the Performance Analyzer Configuration window for creating analyticaltasks. Keyboard shortcut: Ctrl + F.
Pauses or resume automatic refresh of the data in the workspace views. The toolis disabled if no refresh interval has been set for the workspace (View → RefreshEvery). Keyboard shortcut: Shift + Esc.
Stops loading the workspace. If the workspace is set to refresh at intervals (View→ Refresh Every), the refresh stops until the next interval. Keyboard shortcut: Shift+ Esc.
Reloads the saved workspace and refreshes the data in the workspace views.Keyboard shortcut: F5.
8 IBM Tivoli Monitoring: Tivoli Enterprise Portal User's Guide
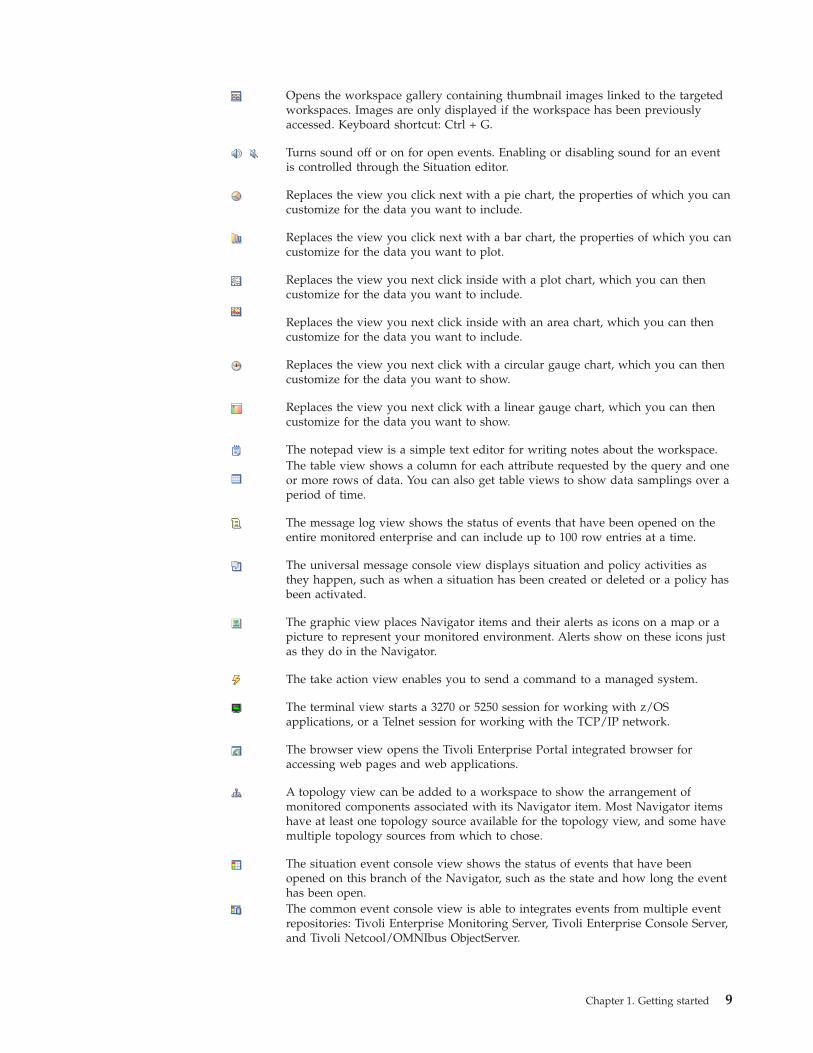
Opens the workspace gallery containing thumbnail images linked to the targetedworkspaces. Images are only displayed if the workspace has been previouslyaccessed. Keyboard shortcut: Ctrl + G.
Turns sound off or on for open events. Enabling or disabling sound for an eventis controlled through the Situation editor.
Replaces the view you click next with a pie chart, the properties of which you cancustomize for the data you want to include.
Replaces the view you click next with a bar chart, the properties of which you cancustomize for the data you want to plot.
Replaces the view you next click inside with a plot chart, which you can thencustomize for the data you want to include.
Replaces the view you next click inside with an area chart, which you can thencustomize for the data you want to include.
Replaces the view you next click with a circular gauge chart, which you can thencustomize for the data you want to show.
Replaces the view you next click with a linear gauge chart, which you can thencustomize for the data you want to show.
The notepad view is a simple text editor for writing notes about the workspace.The table view shows a column for each attribute requested by the query and oneor more rows of data. You can also get table views to show data samplings over aperiod of time.
The message log view shows the status of events that have been opened on theentire monitored enterprise and can include up to 100 row entries at a time.
The universal message console view displays situation and policy activities asthey happen, such as when a situation has been created or deleted or a policy hasbeen activated.
The graphic view places Navigator items and their alerts as icons on a map or apicture to represent your monitored environment. Alerts show on these icons justas they do in the Navigator.
The take action view enables you to send a command to a managed system.
The terminal view starts a 3270 or 5250 session for working with z/OSapplications, or a Telnet session for working with the TCP/IP network.
The browser view opens the Tivoli Enterprise Portal integrated browser foraccessing web pages and web applications.
A topology view can be added to a workspace to show the arrangement ofmonitored components associated with its Navigator item. Most Navigator itemshave at least one topology source available for the topology view, and some havemultiple topology sources from which to chose.
The situation event console view shows the status of events that have beenopened on this branch of the Navigator, such as the state and how long the eventhas been open.The common event console view is able to integrates events from multiple eventrepositories: Tivoli Enterprise Monitoring Server, Tivoli Enterprise Console Server,and Tivoli Netcool/OMNIbus ObjectServer.
Chapter 1. Getting started 9
The Tivoli Enterprise Console® event viewer integrates events from the TivoliEnterprise Console Server with those from the Tivoli Enterprise MonitoringServer.For performance analysis, you can specify a time span to use for the workspacesthat get opened. Historical navigation mode is easily started and stopped, andyou can adjust the time span.
You can hide the toolbar with View →Toolbar.
Each view in the workspace also has a title bar that includes these buttons:
Brings up the Properties editor for the view. This button does not display if theview has no properties.Shows or hides the view toolbar. This button does not display if the view has notoolbar.Splits the view horizontally into two separate views.Splits the view vertically into two separate views.Maximizes the view, at which time the button becomes a Restore button so youcan restore the view to its original size.Removes the view from the workspace.
Many views have a toolbar of functions that are applicable to that view.For example, the Time Span tool is displayed for table views, bar charts,and plot charts that query attribute groups that are historical in nature orthat have been configured for historical data collection.
You can turn off the display of both the view title bar and toolbar throughView →View Toolbars.
Navigator
The Navigator Physical view shows the hierarchy of your monitoredenterprise, from the top level ( Enterprise) down to individual groupingsof information collected by monitoring agents. Every item in the Navigatorhas at least one workspace associated with it. When you click an item inthe Navigator the default workspace is displayed in the applicationwindow.
The Navigator provides a physical view of your monitored network,organized by operating system platform, system type, Tivoli EnterpriseMonitoring product (agents), and the attribute groups from which theagents can collect information.
Small colored event indicator (such as , , and ) icons overlay Navigatoricons when a situation (a test of certain conditions) becomes true. As youmove up the Navigator hierarchy, multiple events are consolidated to showonly the indicator with the highest severity.
You might see More... indicators in the Navigator. These indicators keepthe tree compact so you can see more alerts in the viewable area withouthaving to scroll. Click More... to expand that branch of the tree.
The tool for refreshing the Navigator view includes a count of themonitoring agent changes (added or removed) that are waiting to beupdated. For example, six pending updates are shown as 6 Applypending updates.
Tivoli Enterprise Portal also comes with a Navigator Logical view thatinitially shows one Navigator item. To change to the Navigator Logicalview, select it from the Navigator view list . You can also edit the
10 IBM Tivoli Monitoring: Tivoli Enterprise Portal User's Guide
Logical view and define new Navigator views for any logical hierarchy.For example, you might have a Navigator view for Manufacturing andanother for Marketing.
The right border of the Navigator view has a button that hides theNavigator and expands the adjacent workspace views to fill the gap. Click
to restore its original size. You can also click <Navigator name> in theright-most section of the status bar to restore the Navigator view; orright-click it to see a list of Navigator views to select from.
Workspace
The workspace is the working area of the application window and consistsof one or more views.
A view is a pane in the workspace, typically a chart or table showing datacollected from a monitoring agent, such as the process detail running onthe UNIX operating system. A view can be split either vertically orhorizontally into two separate, independent views.
Every item in the Navigator has a default workspace associated with it.Some items might have multiple workspaces, which are accessible from the
Workspace gallery or from the Navigator item pop-up menu.
A workspace can be linked to other workspaces. A link can becontext-sensitive, whereby you click a link in a table row or right-click atable row or a chart data series to link to more detailed information aboutone of the attributes in the row or data series.
Status bar
The status bar has several sections showing the following, starting from theleft:v Hub Time, which is the local time at the hub monitoring serverv Server Available (or offline if you see a red "X" over the server icon),
which is the status of the connection to the portal serverv Workspace name, portal server name, and port number, and the user
name. If the user is in workspace administration mode, *ADMINMODE* is displayed.
v If the Navigator view is minimized, a Navigator button is displayedfor you to click to restore the named Navigator.
You can turn off the display of the status bar through the View menu.
Browser client differencesThe Tivoli Enterprise Portal can be started as a desktop application or throughyour browser by entering the URL for the Tivoli Enterprise Portal Server. There area few differences in operation between the two clients.
Tivoli Enterprise Portal can be used with either a desktop or a browser client. For adesktop client, the application software is installed on your system and you start itas you would any other application; for a browser client, the application softwareis installed on the web server that is integrated with the Tivoli Enterprise PortalServer and users log on from their browsers. The software is downloaded to yoursystem the first time you log on to Tivoli Enterprise Portal, and thereafter onlywhen software updates are available.
Chapter 1. Getting started 11
Portal toolbarTivoli Enterprise Portal functionality is the same for both types of clientsexcept for the Back, Forward, New Window, and Stop tools,which are not on the portal toolbar because they are already availablebrowser toolbar. As well, keyboard shortcuts also used by Internet Explorersuch as F1 for Help and Ctrl+H for the History Configuration window arenot available in browser mode.
Workspaces have URLsWhen you are logged on to the Tivoli Enterprise Portal Server throughyour browser, the address bar displays a URL for each workspace. You canlog on and open to the workspace of your choice by adding the workspaceURL to the logon URL. You can also send the URL in an email, include itin a hypertext link in an HTML page or other document, or bookmark it.
Tabbed workspacesEvery workspace has properties that control how it accessed anddisplayed. One of the options enables you to open the workspace in a newwindow instead of replacing the previous workspace in the same window.For browsers that are enabled for tabbed web pages, the browser clientuses those settings and opens the workspace in a new tab.
Launch in context and with single sign-onYou can launch products in context, such as to the IBM Tivoli ApplicationDependency Discovery Manager from the browser client. If yourenvironment and user ID are configured for single sign-on, you do notneed to re-authenticate as you launch into other applications.
Custom bannerThe browser client has a banner image and text that you can customize foryour organization. See Adding your company logo and URL in the IBMTivoli Monitoring Administrator's Guide for details.
Note: As an alternative to the browser client, you can use IBM Web Start for Java todownload the Java Web Start client from the Tivoli Enterprise Portal Server.
Monitoring agentsTivoli Enterprise Monitoring Agents are installed where you have resources youwant to monitor. The agents and the operating system, subsystem or computer thatthey are running on are referred to as managed systems.
The Navigator Physical view shows the types of agents installed and running oneach managed system.
Some agents also have subagents. In such instances the agent is the managing agent.For example, the WebSphere® MQ Integrator Series agent has MQSI Brokersubagents. Subagents are displayed in the Navigator below the managing agentand its attribute groups.
MQSI Agent - ::KQIAv MQSI Componentsv Product Eventsv MQSI Broker MQSIBroker1::KQIB
Broker EventsFlow Events
12 IBM Tivoli Monitoring: Tivoli Enterprise Portal User's Guide
Broker InformationBroker StatisticsExecution Group StatisticsMessage Flow StatisticsNeighborsTopics
The agent gathers the current values of the attributes (elements) specified in aview. Gathered attribute values can also be tested against a threshold and displayan event indicator when conditions exceed the threshold.
Some agents have fewer than 100 attributes, and many have several hundred.These attribute values are displayed in the table and chart views of workspaces atthe system, agent, and attribute group level of the Navigator Physical view.
When an attribute value (or range of values) is specified in a situation, as a tablethreshold, or as a chart or table view filter, Tivoli Enterprise Portal compares thecurrent value with the value specified and does the following:v If the comparison in the situation is met, then the situation is true and event
indicators are displayed in the Navigator.v If the compared value exceeds the threshold specified for the table, the cell is
highlighted in red, yellow, or blue.v If the compared value meets the filter condition, it is included in the chart or
table display.
FeaturesThe Tivoli Enterprise Portal gives you a single point of control for managing theresources your applications rely on, including a range of operating systems,servers, databases, platforms, and web components.
For example, a typical IT network might have a web server on Windows, anapplication server and database on UNIX, and a transaction processor on CICS® onthe mainframe. The Tivoli Enterprise Portal brings all these views together in asingle window so that you can see when any aspect of your network is notworking as expected.
Your IBM Tivoli Monitoring products use the portal interface with these majorfeatures and you can find demos for many of them on developerWorks in theTivoli Media Gallery:
Customizing workspacesTivoli Enterprise Portal presents information in a single pane of glass called aworkspace, which consists of one or more views. Monitoring data is retrieved at regularintervals and the results sent to the workspace in the form of chart and table views.You can start monitoring activity and system status immediately with the predefinedworkspaces. with just a few clicks of the mouse, you can tailor your own workspacesto look at specific conditions, display critical threshold values in red, and filterincoming data so you see only what matters.
See “Custom workspace options and guidelines” on page 61.
Chapter 1. Getting started 13
Customizing workspaceviews The charts display data that the monitoring agents have gathered
from the systems where they are running. They can also show data from anyODBC-compliant database you write a custom query for. See “Chart views” on page98.
The notepad view opens a simple text editor for writing text that can be saved withthe workspace. See “Adding a notepad view” on page 161.
The table view displays data that the monitoring agents have gathered from thesystems where they are running. See “Table view” on page 94.
The message log shows the status of all situations distributed to the managedsystems in your enterprise. (Your user ID requires View permission for the Eventfeature.) See “Adding a message log view” on page 135.
The universal message console view shows situation and policy activity, andmessages received as the result of universal message generation. See “Adding aUniversal Message Console view” on page 138.
The graphic view places Navigator items as icons on a map or picture of yourchoosing. (User ID requires View permission for the Event feature.) See “Adding agraphic view” on page 139.
The action enables you to send a command to a managed system. (User ID requiresView permission for the Action feature.) See “Creating a take action view” on page 161.
The terminal view starts a 3270, 5250, or Telnet session, and enables you to writescripts for working with z/OS® applications. See “Adding a terminal view to theworkspace” on page 162.
The browser view opens the integrated browser for accessing web pages. See“Creating a browser view” on page 159.
The topology view can be added to a workspace to show the arrangement ofmonitored components associated with the Navigator item. See “Creating a topologyview” on page 128.
The situation event console view shows the status of all situations associated withitems on this branch of the Navigator view, and has tools for instant filtering and eventhandling. (Your user ID requires View permission for the Event feature.) See “Adding asituation event console view” on page 145.
The common event console view enables you to see events from the TivoliEnterprise Monitoring Server in the same way as the situation event console, plus itincorporates events from the Tivoli Enterprise Console Server and the TivoliNetcool/OMNIbus ObjectServer if your managed environment is configured for thoseservers. See “Adding a common event console view” on page 150.
The Tivoli Enterprise Console view displays events from the Tivoli EnterpriseConsole Server and can integrate them with situation events from the Tivoli EnterpriseMonitoring Server. See “Adding a Tivoli Enterprise Console event viewer” on page 156.
Links between workspacesIf you often go from one workspace to another, and from one Navigator view toanother, you can build a link from one to the other to get there more quickly. You canalso build links that originate from a query-based view or a graphic view and userelevant data from the source to determine the link target. See “Defining links betweenworkspaces” on page 71.
14 IBM Tivoli Monitoring: Tivoli Enterprise Portal User's Guide
Configuring historical datacollection Configure IBM Tivoli Monitoring to retain data samplings in history files and, if you
have the Tivoli Data Warehouse configured, roll off to a historical database at selectedintervals, from every 15 minutes to once a day. In chart and table views you can thenlook over what happened hours or days ago, or as far back as you have data stored tofind a pattern, and you can filter out unwanted data to speed up data retrieval and toshow specific areas of interest. Pruning and summarization features enable you to keepthe data stored on the warehouse at a manageable level. See “Historical collectionconfiguration” on page 211.
Creating custom queriesEvery monitoring agent comes with a set of predefined queries for every attributegroup. These queries tell the monitoring server what monitoring data to retrieve fromthe monitoring agent to display in a chart or table view. You can create your ownqueries to specify exactly which attributes to retrieve to the table or chart. This savesvaluable resources by retrieving only the data you want and nothing more. Forexample, you can use filters in the query to retrieve only the records with a file sizethat is greater than five megabytes.
Additionally, you can write SQL queries to ODBC data sources and apply the results toany chart or table. This enables you to show Tivoli data and data from other sources(such as third-party databases) in a single workspace. See Chapter 7, “Custom queries,”on page 191.
Take ActionThe take action feature lets you enter a command or select from one of the predefinedcommands for your product and run it on any system in your managed network eithermanually or automatically in response to reported conditions. See “Take actioncommands” on page 344.
Launch ApplicationThe launch application feature enables you to write definitions that start applicationson your computer. A launch definition can include arguments that are passed to theapplication when it is started. You can invoke a definition at any time from the portalinterface to launch the specified application. See “Launch application” on page 349.
Condition-based alertsYou can define conditions that are tested against monitored data at regular intervals.When matching values (or values that fall within a specified range) are found, asituation event is open and a visual indicator alerts you. You can automate a responseto the event.
Object groups andmanaged system groups The object group editor enables you to create named lists of managed systems,
historical data collection distribution lists, and situation lists.
You can create and maintain named lists of managed systems that can be applied tosituation distribution lists, queries, custom Navigator managed system assignments,policies correlated by business application group.
See Chapter 13, “Managing the environment,” on page 373.
User administrationThe user administration feature is for adding and maintaining user IDs and usergroups, assigning permissions for the major features, and restricting access to specificmanaged systems and Navigator views. See “Administer Users” on page 362.
Customizing the NavigatorThe portal interface comes with the Navigator Physical view, which organizes yourmanaged enterprise by operating platform and agent type, and the Navigator Logicalview, which initially shows one Navigator item. You can also define Navigator viewsfor any logical grouping, such as a departmental or site hierarchy. See “Edit Navigatorview” on page 235.
Chapter 1. Getting started 15
PoliciesThe Workflow editor enables you to design sets of automated system processes, calledpolicies, to resolve system problems. A policy performs actions, schedules work to beperformed by users, or automates manual tasks. See “Automation with policies” onpage 315.
Universal Agent supportThe Tivoli Universal Agent is a monitoring agent you can configure to monitor anydata you collect. It lets you integrate data from virtually any platform and any source,such as custom applications, databases, systems, and subsystems. Your defined dataproviders are listed in the Navigator, and default workspaces automatically created forthem. You can display data from your Universal Agent attributes in workspace viewsand use them in situations.
When you create custom queries for these universal agents you can display andmonitor data from any application, including APIs and third-party software.
Agent Builder supportThe Agent Builder is a wizard that makes it easier to build custom monitoringsolutions. Using mostly point and click capabilities, the Agent Builder allows you tocreate a monitoring agent using multiple data providers such as WMI, Perfmon, Logscraping, scripts, and process monitoring. Over time additional data providers will beadded to the Agent Builder.
Monitoring agents created using the Agent Builder have two advantages over agentsbased on the Tivoli Universal Agent. First, the Agent Builder monitoring agents tend torun with lower CPU utilization than an equivalent Tivoli Universal Agent. Second, youdo not need to worry about Tivoli Universal Agent versioning.
However, the Agent Builder is not a complete replacement for the Tivoli UniversalAgent. The Tivoli Universal Agent has some key capabilities that Agent Buildermonitoring agents do not have. For example, the Tivoli Universal Agent has an ODBCdata provider; the Agent Builder does not. A single Tivoli Universal Agent can beconfigured to monitor multiple remote systems, using several types of data providers.The Agent Builder can be configured to monitor multiple remote systems, but youmust create one agent instance for each remotely monitored server.
Multiple applications inone workspace In one workspace you can build a table or chart with data from one type of monitoring
agent, and another table or chart with data from a different agent, showing views fromas many different agent types as are included on that branch of the Navigator.
Link between applicationsYou can define a link from a workspace associated with one monitoring agent to theworkspace of another.
Linking betweenNavigators You can link from a workspace in one Navigator view to a workspace in a different
Navigator view.
Predefined workspaces, situations, and moreEvery agent is designed to monitor specific attributes of an operating system orother type of software. With these attributes, come definitions for use with theTivoli Enterprise Portal functions.
Use the definitions that have been designed for your product to begin monitoringand visualizing data immediately. Some definitions are ready to use; others aredormant until activated:
WorkspacesThe workspaces that open when you click a Navigator item or select fromthe Workspace Gallery, are predefined. They provide visual feedback of
16 IBM Tivoli Monitoring: Tivoli Enterprise Portal User's Guide
real-time values from managed systems, and historical values whenhistorical data collection has been configured. They provide a startingpoint for designing your own workspaces.
QueriesThe predefined workspaces are populated with data gathered as a result ofqueries, which are also predefined. Creating your own queries from thesepredefined queries enables you to add or remove attributes, apply a sortorder, and pre-filter the data to keep data retrieval at a manageable leveland to enable you to more easily see data of interest.
Take action commandsSome agents have predefined take action commands, such as the WindowsOS agent Start Service and Stop Service commands. They are available forselection and they provide examples of the kinds of actions that you mightwant to define for maintaining managed systems.
SituationsThe tests for conditions that you want to be alerted for are available in thepredefined situations. To avoid an overwhelming number of eventsopening in a newly managed environment and, conversely to avoidmissing important events because the comparison criteria was set too low,many of the predefined situations for an agent are not set to startautomatically. They remain stopped until you either start them manually orset them to Run at startup. A good way to find out which situations areset to run at startup and which ones are not, is to filter the Situation editortree with Show Situations, which is available when the Situation editoris opened from the Navigator pop-up menu. As agents report monitoringdata, and especially when that data is being collected and stored in a TivoliData Warehouse, you can better determine the values and circumstancesthat are worthy of an alert, such as high CPU activity on a transactionserver at peak times.
PoliciesThe predefined policies that are available with some products are not set tostart automatically. This is primarily because policies automate activities, asdescribed in the policy workflow.
Managed system groupsThe Tivoli Enterprise Monitoring Server and every IBM Tivoli Monitoringproduct has at least one predefined managed system group, indicated byan asterisk at the beginning of the list name, such as *NT_SYSTEM for theWindows OS agent. When you assign one of these managed system groupsto a situation, policy, historical collection configuration, or customNavigator, all managed systems with that agent installed are selected.
Navigator viewsSome products have custom Navigator views for access to special features.
Chapter 1. Getting started 17
Related concepts:Using workspacesCustom queriesSending action commandsSituations for event monitoringAutomation with policiesGrouping objectsNavigators views for logical organization
Tivoli Enterprise Portal tourWelcome to the Tivoli Enterprise Portal tour. In under 10 minutes, this hands-onpractice introduces you to some of the major features.
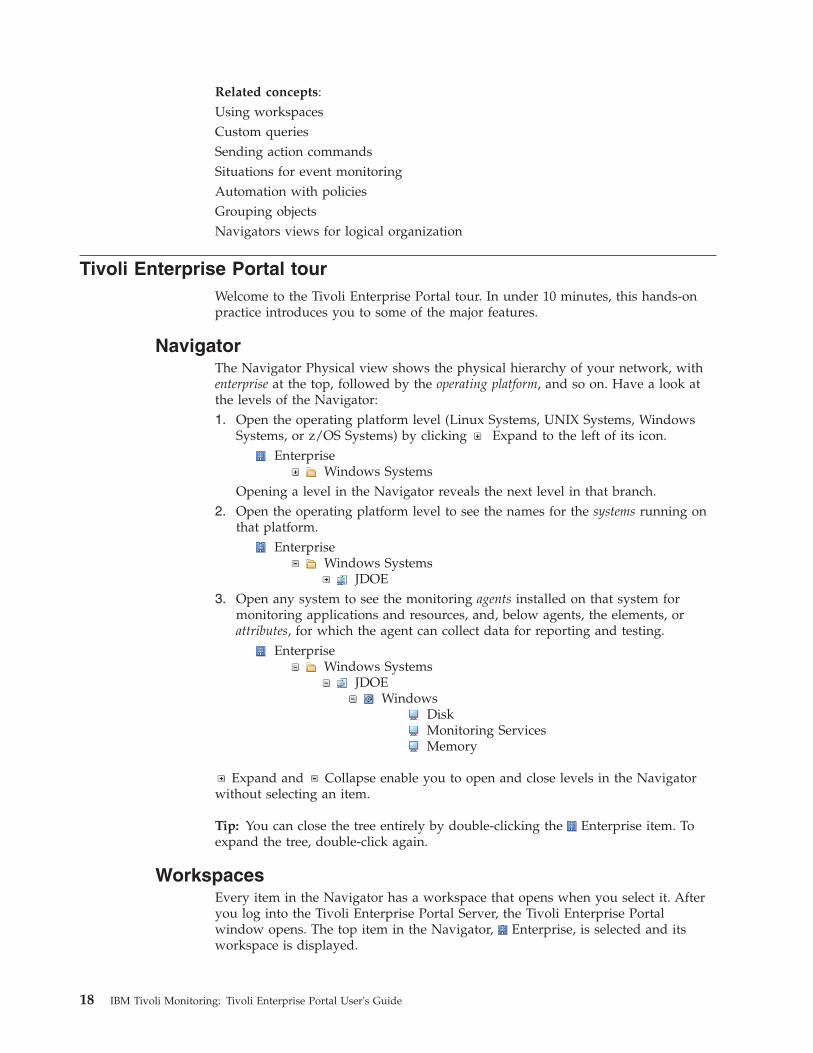
NavigatorThe Navigator Physical view shows the physical hierarchy of your network, withenterprise at the top, followed by the operating platform, and so on. Have a look atthe levels of the Navigator:1. Open the operating platform level (Linux Systems, UNIX Systems, Windows
Systems, or z/OS Systems) by clicking Expand to the left of its icon.Enterprise
Windows SystemsOpening a level in the Navigator reveals the next level in that branch.
2. Open the operating platform level to see the names for the systems running onthat platform.
EnterpriseWindows Systems
JDOE3. Open any system to see the monitoring agents installed on that system for
monitoring applications and resources, and, below agents, the elements, orattributes, for which the agent can collect data for reporting and testing.
EnterpriseWindows Systems
JDOEWindows
DiskMonitoring ServicesMemory
Expand and Collapse enable you to open and close levels in the Navigatorwithout selecting an item.
Tip: You can close the tree entirely by double-clicking the Enterprise item. Toexpand the tree, double-click again.
WorkspacesEvery item in the Navigator has a workspace that opens when you select it. Afteryou log into the Tivoli Enterprise Portal Server, the Tivoli Enterprise Portalwindow opens. The top item in the Navigator, Enterprise, is selected and itsworkspace is displayed.
18 IBM Tivoli Monitoring: Tivoli Enterprise Portal User's Guide
v Select another Navigator item by clicking the icon for the operating platformor the name.
The workspace for the operating platform you selected replaces the one that waspreviously displayed. The workspace displayed when you click a Navigator item isthe default workspace for that item. Your IBM Tivoli Monitoring product might comewith multiple workspaces for some items, and you can create additionalworkspaces of your own.v Click Workspace gallery to see thumbnail graphics of all the workspaces that
you can open for this Navigator item.
If this is a new installation, you will see the splash screen instead of a thumbnailversion of the workspace in the gallery until you or another user who is logged onto the same Tivoli Enterprise Portal Server opens the workspace for the first time.A check mark by a workspace name indicates that it is the default workspace forthis Navigator item. You can reorder the workspaces in your copy of the gallery byclicking a thumbnail graphic and dragging it on top of the workspace to swappositions with.
Together, the Navigator and workspaces show the facets of your Tivoli managedenterprise from the highest level to the most detailed.
ViewsTivoli Enterprise Portal offers many different views that you can add to yourworkspaces.
The view title bar has buttons for creating another view by splitting the view
horizontally or vertically, for maximizing the view, and for deleting theview.
To add a different view complete the following steps:1. Select a view, then click Split Horizontally.
This tool divides the view space in half horizontally to create a copy of theoriginal view.If you cannot split a view and the tools for the notepad and other views aredisabled (dimmed), your user ID does not have Workspace Author Modepermission.
2. Click your desired view type from the toolbar. For example click Notepad
When you click a view tool, the mouse pointer changes to an icon of thechosen view type (hand icon on Linux).
3. Click inside the view pane. The new view replaces the previous view.
To rearrange views complete the following steps:1. Drag the title bar of one view and drop over another view.
While dragging the title bar, you should see a semi-transparent copy of theview.
2. Release the mouse button to switch the views.
Query-based views
The table and chart views are the first step to getting meaningfulinformation from the data being collected. When you understand whatvalues and states are causing problems, you can refine your views to showwhat is important. For attribute groups with attributes that can be
Chapter 1. Getting started 19
expressed meaningfully as objects and show their relationship to otherattributes in the same group, there is also the Relational Table Basedtopology view.
The table view and chart views display data themonitoring agents have gathered from the systems where they are running.
The topology shows the arrangement of monitored componentsassociated with its Navigator item.
Event views
The message log view and console views (universal message, situationevent, common event, and Tivoli Enterprise Console) update automaticallyto show new events as they arrive and changes in event status as theyoccur. The graphic view gives you a pictorial alternative to the Navigatorfor indicating alerts.
The message log view shows the status of events that have been openedon the entire monitored enterprise and can include up to 100 row entries ata time.
The universal message console view displays situation and policyactivities as they happen, such as when a situation has been created ordeleted or a policy has been activated.
The graphic view places Navigator items and their alerts as icons on amap or a picture to represent your monitored environment.
The situation event console view shows the status of situation eventsthat have been opened on this branch of the Navigator. The console has atoolbar for quick filtering and a menu for responding to alerts.
The common event console view integrates events from multiple eventrepositories: Tivoli Enterprise Monitoring Server, Tivoli Enterprise Consoleevent server, and Netcool/OMNIbus ObjectServer. This view has the samefunctional capabilities as the situation event console view, such as theability to sort and filter events.
The Tivoli Enterprise Console event viewer can integrate events fromthe Tivoli Enterprise Console Server with those from the Tivoli EnterpriseMonitoring Server.
Other views
Tivoli Enterprise Portal workspaces can also have any of the followingspecialized views:
The notepad view opens a simple text editor for writing notes or othertext that can be saved with the workspace.
The take action view enables you to send a command to a managedsystem.
The terminal view starts a 3270 or 5250 session for working with z/OSapplications, or a Telnet session for working with the TCP/IP network.
The browser view opens the integrated browser for accessing web pages.
SituationsIn addition to providing a map of your enterprise, the Navigator can alert you ofchanging conditions in the systems you are monitoring. When a condition changes,the associated item is marked with an icon: Fatal, Critical, Minor,
20 IBM Tivoli Monitoring: Tivoli Enterprise Portal User's Guide
Warning, Harmless, Informational, or Unknown. The Navigator places oneof these icons, called alert indicator or event indicator, at every level of the hierarchyso you can see an alert even if a Navigator branch is closed.
If you see any of these icons in the Navigator now, move the mouse pointer overan event indicator to open a flyover listing of the situations that caused the eventsat that level of the Navigator and below.
Tivoli Enterprise Portal runs tests called situations on systems where monitoringagents are installed. When the conditions of a situation have been met, an eventoccurs and an event indicator is displayed over the applicable items in theNavigator.
Open a situation using the following steps:1. Right-click a system name in the Navigator and click Situations. The
Situation editor opens with a list of situations on the left. This is where you canview and edit situations or create new ones.
2. Click a situation name in the tree to see the Situation editor tabs. Formula toview, add, and change the conditions being tested; Distribution to view andspecify the systems on which to run the situation; Expert Advice to writecomments or instructions to be read in the event results workspace; Actionto send a command to the managed system; and Until to close the eventafter a period of time or when another situation is true.
3. Click Cancel to close the Situation editor.
You cannot open the Situation editor if your user ID does not have permission toView Situations.
PropertiesIn this last part of the tour, open the Properties editor, where you can edit theappearance and content of the views chosen for a workspace.1. Click Properties. The Properties editor opens with a list of the views on the
left, grouped by type. The general workspace properties appear on the right.2. Select one of the views in the Properties tree. All types of views have a Style
tab, with different options for the type of view. The table, charts, and topologyviews have Query and Filters tabs, table and topology have aThresholds tab, and terminal emulators have a Configuration tab. Wheneveryou want to change the data elements that display for a chart or table orchange the styling of a view, go to the Properties editor.
3. Click Cancel to close the Properties editor.
ConclusionYou now know the basics on the main functionality of the Tivoli Enterprise Portal.For practice, try splitting this view and apply a Browser view.
Chapter 1. Getting started 21

22 IBM Tivoli Monitoring: Tivoli Enterprise Portal User's Guide
Chapter 2. Using the Navigator
The Navigator provides a hierarchical view of your enterprise. At the highest levelyou can get a high level overview of the status of your monitored environment.From there you can navigate to specific monitored resources to check activity andinvestigate problems.
At every level, event indicators alert you to changes in system or applicationconditions.
Navigator overviewThe Navigator provides a hierarchical view of your enterprise. At the highest levelyou can get a high level overview of the status of your monitored environment.From there you can navigate to specific monitored resources to check activity andinvestigate problems.
Types of Navigator views
Navigator Physical viewThe default Navigator view is Physical and shows the hierarchy of yourmonitored enterprise. The Navigator Physical view is a discovered view: asnew managed systems come online or when they become disconnected, theview is adjusted accordingly.
Enterprise, or root, level contains all managed systemsPlatform is the operating system
System, or node, is the name of the computer or z/OS imageAgent type. Multiple instance agents have child items;
some are grouped into one folderAttribute category being monitored
Here is an example of a system named JDOE, running on Windows, withthe Windows OS agent.
EnterpriseWindows Systems
JDOEWindows OS
DiskMonitoring ServicesMemory
You can collapse the tree by double-clicking the Enterprise item, andexpand it by double-clicking again.
Custom Navigator viewsYour Tivoli Enterprise Portal configuration can also have custom-designedNavigator views. These views are selectable from the Navigator toolbar,navigable and show event indicators (described below) in the same way asthe Navigator Physical view. Unlike the Navigator Physical view, customNavigator views can be edited. You can, for example, design a Navigatorview for Manufacturing and another for Marketing.
© Copyright IBM Corp. 2005, 2012 23
Your user ID can be assigned to all or a subset of the defined Navigatorviews, and your access in any of these views can be restricted to a certainbranch. To see the list of available Navigator views, click the list box inthe Navigator toolbar.
A small white cross over a Navigator item icon means one or more otherNavigator items share the characteristics of that item. This happens whenan item from one Navigator view has been copied to another Navigatorview. All the managed systems, workspaces, link definitions, situations,and policies associated with the original (source) item are applied to thenew item. And from then on, changes to one item (such as a newworkspace is added) are applied to the other. Right-click a Navigator itemand click Show Navigator List to see the other Navigator views it iscontained in.
Navigator Logical viewUsers initially have one custom Navigator view called Logical with a singleNavigator item for Enterprise. Click the list box and select theNavigator Logical view from the list.
Workspaces
The workspace is the working area of the application window. Selecting an item inthe Navigator opens its default workspace. The workspace contains views ofinformation for that item in the Navigator.
If the item has multiple workspaces created for it, you can click WorkspaceGallery to see thumbnail images of them and select another workspace to open.
You can move around the Navigator without selecting workspaces by using thevertical scroll bars and clicking to expand a list or to collapse it.
Use and to return to previously viewed workspaces in the order they wereinitially visited. The data in those workspaces is not cached, so any chart or tableviews are refreshed with the most recent data samplings when you revisit them.
Navigator toolsUse the tools in the Navigator view toolbar to update the display when managedsystems have come online or gone offline, to open another Navigator view, to editcustom Navigator views, and to collapse the view.
2 Apply pending updatesThe Apply pending updates tool updates the Navigator tree with thecorrect status of agents, in response to the count of agents that have beenremoved from or added to the Tivoli Enterprise Monitoring Server. Thecounter is displayed next to the tool and in the status bar. Refresh isenabled when the Navigator view has been edited, such as a new item hasbeen added, so that you can update the view with the changes. This tool isdimmed when no updates are required. (See “Refreshing the Navigator”on page 31.)
6 Application support eventAfter you start the Tivoli Enterprise Portal, the application support versionis read from the portal client and the portal server. Any discrepancies inversions between client and server are noted in the Application SupportMismatch list. (See “Responding to an application support event” on page31.)
24 IBM Tivoli Monitoring: Tivoli Enterprise Portal User's Guide
Find Navigator itemUse Find in the Navigator toolbar to look for a Navigator item by suchcriteria as managed system name or associated situation name. When thesearch has completed, any items that match the criteria are listed in theFind results table where you can switch to the default workspace for afound item or open it in a new window.
Edit navigator viewOpens the Navigator editor for creating, deleting, and modifyingNavigator views. (See Chapter 9, “Navigator views for logicalorganization,” on page 227.)
If the tool is disabled (dimmed), your user ID does not have Modifypermission for Custom Navigator Views.
Opens a list that you can select a Navigator view from. The viewsavailable are those assigned to your user ID. When you select anotherNavigator view, a tab is added to the bottom of the Navigator so youcan quickly switch among the views by clicking the tab. (See “Opening aNavigator view” on page 30.)
Minimizes the Navigator and expands the adjacent workspace views to fillthe gap. Click to restore its original size. You can also click <Navigatorname> in the right-most section of the status bar to restore the Navigatorview; or right-click it to see a list of Navigator views to select from.
Splits the Navigator horizontally to create a new workspace view. (SeeChapter 6, “Customizing workspace views,” on page 81.)
If the tool is disabled your user ID does not have Author Modepermission.
Splits the Navigator vertically to create a new workspace view. (SeeChapter 6, “Customizing workspace views,” on page 81.)
If the tool is disabled your user ID does not have Author Modepermission.
Situation event indicatorsWhen you see a small colored icon overlay the Navigator icons, you are seeing anevent indicator . An event indicator is displayed when a situation (a test of certainconditions) running on a system becomes true.
These indicators alert you that conditions have changed and need attention.
Event indicators can be, from highest severity to lowest, Fatal, Critical,Minor, Warning, Harmless, Informational, or Unknown. As you move upthe Navigator hierarchy, multiple events are consolidated to show only theindicator for the event with the highest severity. Go to the lowest level of thehierarchy to see individual event indicators over attribute groups with values thathave met situation definitions.
Move the mouse pointer over an indicator to open a flyover listing of thesituations that are true for the Navigator item and any branching items. Thisflyover list might also show a status icon on the right:
Acknowledged The situation event has been acknowledged.
Chapter 2. Using the Navigator 25
Expired The acknowledgement has expired and the situation is still true.
Reopened The acknowledgement was canceled before it had expired and thesituation is still true.
Stopped The situation has been stopped.
Error The situation is not functioning properly.
Status Unknown The monitoring server detects that an agent is offline. The agentmight have been taken offline intentionally, there might be acommunication problem, or the agent or the system it is running onmight have stopped or be failing. The situation flyover listing onthis icon shows *STATUS_UNKNOWN, which is not actually asituation, but the notation for a problem on the managed system.Consider recycling the agent, described in “Managing monitoringagents” on page 387.
More... indicatorsYou might sometimes see More indicators in the Navigator. These indicators areused to keep the Navigator tree compact so that you can see more in the viewablearea without having to scroll.
Click More to open that branch of the tree.
When clicking Expand on a Navigator branch of more than, by default, 25 childitems, you are prompted to enter the number to expand at one time. You can alsoright-click a Navigator item and click Expand to open the Expand child itemswindow. After you enter the number to expand, a group of child items opens.Click More to open the next group of child items.
In large managed environments this feature helps you control the Navigatordisplay and its performance. In this example, the expansion limit of 4 was chosenfor the Windows Server branch:
MYCOMPUTERWindows Server
DiskEnterprise ServicesMemoryNetworkMore... 4 : 8
Expanding the Navigator in incrementsMore indicators in the Navigator keep the tree compact. Click the indicator to
open that branch of the tree. You can specify how many items to expand at onetime.
About this task
When clicking Expand on a Navigator branch of more than, by default, 25 childitems, you are prompted to enter the number to expand at one time.
26 IBM Tivoli Monitoring: Tivoli Enterprise Portal User's Guide
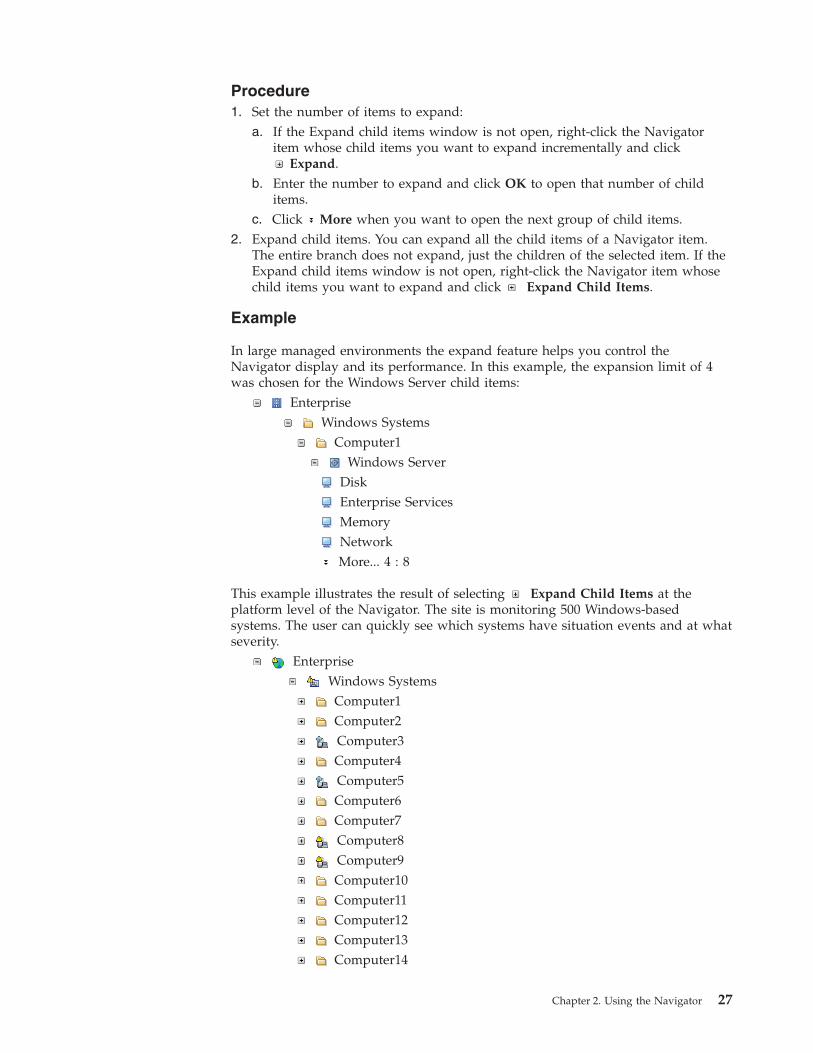
Procedure1. Set the number of items to expand:
a. If the Expand child items window is not open, right-click the Navigatoritem whose child items you want to expand incrementally and click
Expand.b. Enter the number to expand and click OK to open that number of child
items.c. Click More when you want to open the next group of child items.
2. Expand child items. You can expand all the child items of a Navigator item.The entire branch does not expand, just the children of the selected item. If theExpand child items window is not open, right-click the Navigator item whosechild items you want to expand and click Expand Child Items.
Example
In large managed environments the expand feature helps you control theNavigator display and its performance. In this example, the expansion limit of 4was chosen for the Windows Server child items:
EnterpriseWindows Systems
Computer1Windows Server
DiskEnterprise ServicesMemoryNetworkMore... 4 : 8
This example illustrates the result of selecting Expand Child Items at theplatform level of the Navigator. The site is monitoring 500 Windows-basedsystems. The user can quickly see which systems have situation events and at whatseverity.
EnterpriseWindows SystemsComputer1Computer2Computer3Computer4Computer5Computer6Computer7Computer8Computer9Computer10Computer11Computer12Computer13Computer14
Chapter 2. Using the Navigator 27
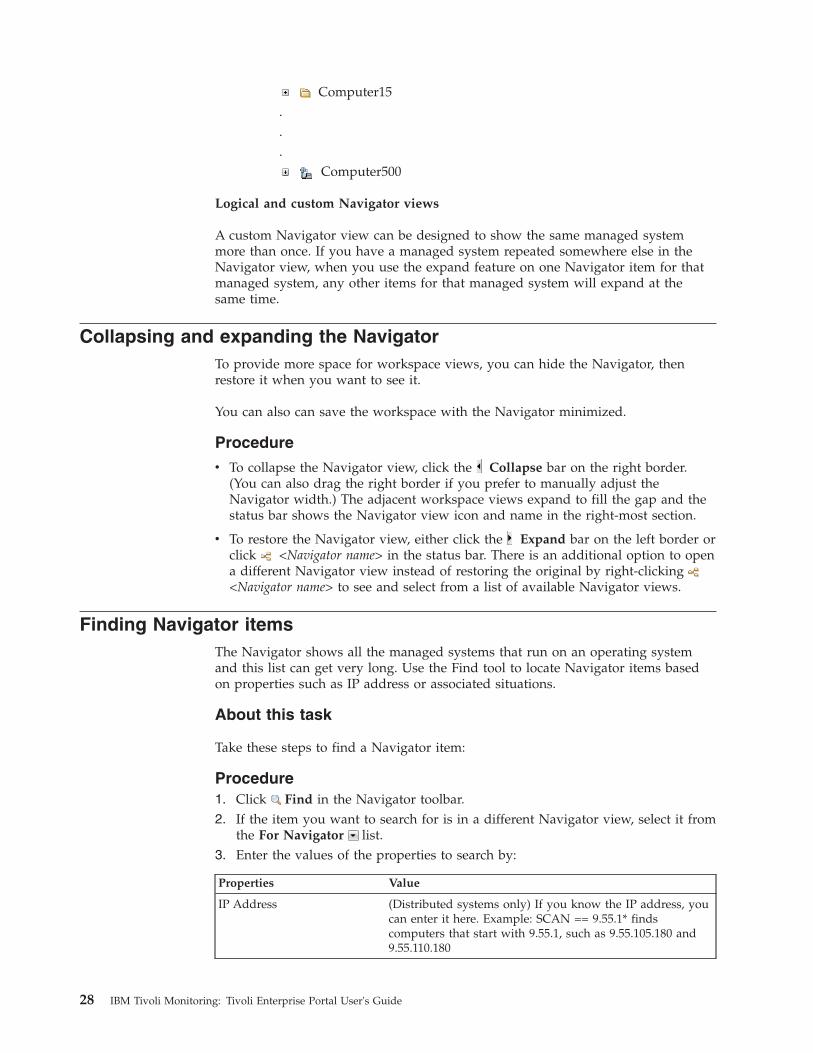
Computer15...
Computer500
Logical and custom Navigator views
A custom Navigator view can be designed to show the same managed systemmore than once. If you have a managed system repeated somewhere else in theNavigator view, when you use the expand feature on one Navigator item for thatmanaged system, any other items for that managed system will expand at thesame time.
Collapsing and expanding the NavigatorTo provide more space for workspace views, you can hide the Navigator, thenrestore it when you want to see it.
You can also can save the workspace with the Navigator minimized.
Procedure
v To collapse the Navigator view, click the Collapse bar on the right border.(You can also drag the right border if you prefer to manually adjust theNavigator width.) The adjacent workspace views expand to fill the gap and thestatus bar shows the Navigator view icon and name in the right-most section.
v To restore the Navigator view, either click the Expand bar on the left border orclick <Navigator name> in the status bar. There is an additional option to opena different Navigator view instead of restoring the original by right-clicking<Navigator name> to see and select from a list of available Navigator views.
Finding Navigator itemsThe Navigator shows all the managed systems that run on an operating systemand this list can get very long. Use the Find tool to locate Navigator items basedon properties such as IP address or associated situations.
About this task
Take these steps to find a Navigator item:
Procedure1. Click Find in the Navigator toolbar.2. If the item you want to search for is in a different Navigator view, select it from
the For Navigator list.3. Enter the values of the properties to search by:
Properties Value
IP Address (Distributed systems only) If you know the IP address, youcan enter it here. Example: SCAN == 9.55.1* findscomputers that start with 9.55.1, such as 9.55.105.180 and9.55.110.180
28 IBM Tivoli Monitoring: Tivoli Enterprise Portal User's Guide
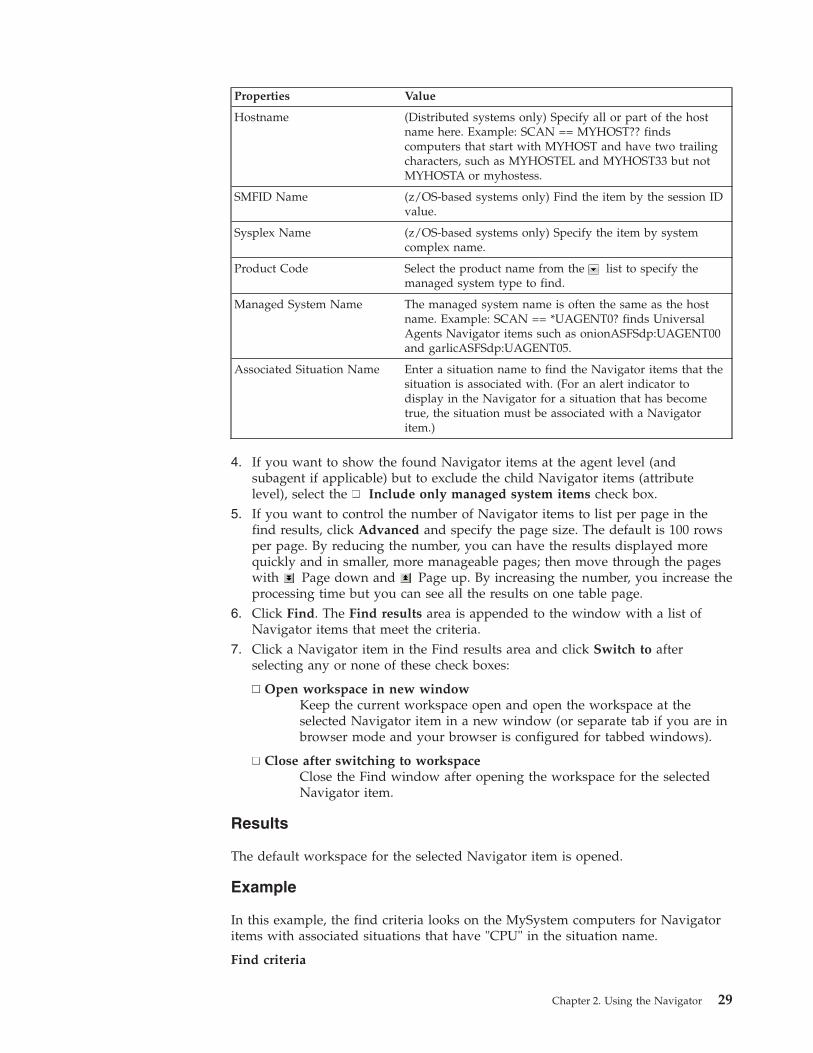
Properties Value
Hostname (Distributed systems only) Specify all or part of the hostname here. Example: SCAN == MYHOST?? findscomputers that start with MYHOST and have two trailingcharacters, such as MYHOSTEL and MYHOST33 but notMYHOSTA or myhostess.
SMFID Name (z/OS-based systems only) Find the item by the session IDvalue.
Sysplex Name (z/OS-based systems only) Specify the item by systemcomplex name.
Product Code Select the product name from the list to specify themanaged system type to find.
Managed System Name The managed system name is often the same as the hostname. Example: SCAN == *UAGENT0? finds UniversalAgents Navigator items such as onionASFSdp:UAGENT00and garlicASFSdp:UAGENT05.
Associated Situation Name Enter a situation name to find the Navigator items that thesituation is associated with. (For an alert indicator todisplay in the Navigator for a situation that has becometrue, the situation must be associated with a Navigatoritem.)
4. If you want to show the found Navigator items at the agent level (andsubagent if applicable) but to exclude the child Navigator items (attributelevel), select the Include only managed system items check box.
5. If you want to control the number of Navigator items to list per page in thefind results, click Advanced and specify the page size. The default is 100 rowsper page. By reducing the number, you can have the results displayed morequickly and in smaller, more manageable pages; then move through the pageswith Page down and Page up. By increasing the number, you increase theprocessing time but you can see all the results on one table page.
6. Click Find. The Find results area is appended to the window with a list ofNavigator items that meet the criteria.
7. Click a Navigator item in the Find results area and click Switch to afterselecting any or none of these check boxes:
Open workspace in new windowKeep the current workspace open and open the workspace at theselected Navigator item in a new window (or separate tab if you are inbrowser mode and your browser is configured for tabbed windows).
Close after switching to workspaceClose the Find window after opening the workspace for the selectedNavigator item.
Results
The default workspace for the selected Navigator item is opened.
Example
In this example, the find criteria looks on the MySystem computers for Navigatoritems with associated situations that have "CPU" in the situation name.
Find criteria
Chapter 2. Using the Navigator 29
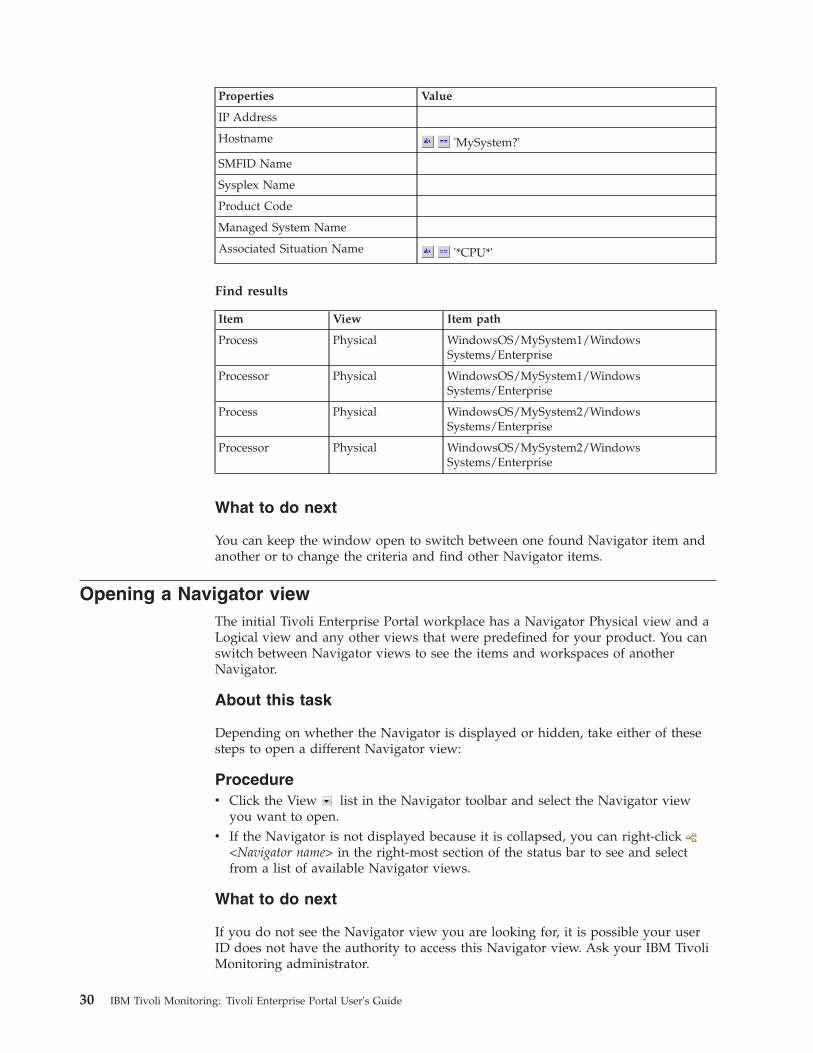
Properties Value
IP Address
Hostname 'MySystem?'
SMFID Name
Sysplex Name
Product Code
Managed System Name
Associated Situation Name '*CPU*'
Find results
Item View Item path
Process Physical WindowsOS/MySystem1/WindowsSystems/Enterprise
Processor Physical WindowsOS/MySystem1/WindowsSystems/Enterprise
Process Physical WindowsOS/MySystem2/WindowsSystems/Enterprise
Processor Physical WindowsOS/MySystem2/WindowsSystems/Enterprise
What to do next
You can keep the window open to switch between one found Navigator item andanother or to change the criteria and find other Navigator items.
Opening a Navigator viewThe initial Tivoli Enterprise Portal workplace has a Navigator Physical view and aLogical view and any other views that were predefined for your product. You canswitch between Navigator views to see the items and workspaces of anotherNavigator.
About this task
Depending on whether the Navigator is displayed or hidden, take either of thesesteps to open a different Navigator view:
Procedurev Click the View list in the Navigator toolbar and select the Navigator view
you want to open.v If the Navigator is not displayed because it is collapsed, you can right-click
<Navigator name> in the right-most section of the status bar to see and selectfrom a list of available Navigator views.
What to do next
If you do not see the Navigator view you are looking for, it is possible your userID does not have the authority to access this Navigator view. Ask your IBM TivoliMonitoring administrator.
30 IBM Tivoli Monitoring: Tivoli Enterprise Portal User's Guide
If there are many Navigator views in the list, you can have them reorderedthrough the Navigator Views tab of the Administer Users window.Related tasks:“Adding a user ID” on page 357
Refreshing the NavigatorThe Navigator refreshes automatically whenever the status of agents changesbetween offline and online. The Navigator does not update automatically when anagent is removed from or a new agent is added to the managed network. Whenthe tool is enabled, click Apply pending updates to manually refresh theNavigator.
Before you begin
If an agent name is dimmed (grayed out), the agent has stopped or is notresponding. It might also indicate that Tivoli Enterprise Portal has timed out beforedetecting the availability of the agent.
For custom Navigator views, Apply pending updates is enabled in theNavigator toolbar whenever you have edited the view in the Navigator editor(added, removed, or renamed items). The tool is not enabled in the Navigator viewwhen an agent has been removed from the Tivoli Enterprise Monitoring Server. Inthese cases, the agent appears to be offline. To remove this agent from theNavigator display, delete the Navigator item through the Navigator editor.
About this task
A count of changes to the Navigator view is kept as agents are removed from,disabled, or added to the monitoring server. The counter shows as a superscriptednumber next to the tool (such as 9 for nine updates) and in the Navigator viewstatus bar. You must refresh the Navigator to show these changes. Take one of thefollowing steps:
Procedurev Click Apply pending updates in the Navigator toolbar.v Click Navigator update pending in the Navigator status bar.
Results
The agent status is updated in the Navigator. (You might not see any change if thebranch containing the agent is collapsed.) The tool is disabled until the anotherstatus change is detected, at which time the counter starts again. If the workspacehas automatic refresh turned on, the Navigator is updated at the end of the refreshinterval.
Responding to an application support eventUse the Show new or updated application support tool to see a count of theversion mismatch messages, to view a list of application support versionmismatches between the Tivoli Enterprise Portal client and server, and to seeinstructions for correcting the discrepancy.
The number that is displayed after the tool, such as 8 for eight mismatch events,is a count of the events that have accumulated.
Chapter 2. Using the Navigator 31
Procedure1. When the Application support event tool is enabled in the Navigator
toolbar, click it. The dialog box shows the list of mismatched applications andtheir support versions. Each event shows a Warning or Informational indicatorfollowed by the name of the monitoring agent, the version of applicationsupport applied at the portal client, and the version applied at the portalserver. No portal client version information is available when a new monitoringapplication is initially installed.
2. Complete the instructions that are displayed after the mismatch event list:
Browser client and Java WebStart clientIf you are running the browser client or Java WebStart, any requiredapplication support updates are downloaded automatically after youlog on to the portal server.
An application support version mismatch has been detected. Click Help formore information on possible causes and actions. Warning events indicatethat the mismatch was found at client startup.
New or updated application support is available. Restart the TivoliEnterprise Portal client to update your application support. If applicationsupport updates become available while you are logged on, anInformational event occurs to show that application support is waitingto be applied. Log out and restart the client to have application supportupdates applied.
Desktop clientApplication support updates to the desktop client must be made byrunning the installer on the Tivoli Monitoring Agent installation media.
An application support version mismatch has been detected. Use the TivoliMonitoring installer to add the associated application support to the portaldesktop client. Warning events indicate that the mismatch was found atclient startup.
New or updated application support is available. Use the Tivoli Monitoringinstaller to add the associated application support to the portal desktop client.Informational events indicate that the mismatch was found after logonto the portal server.
Results
After logging off and logging onto the Tivoli Enterprise Portal, the Applicationsupport event tool is disabled. If it is not, contact your network administrator orIBM Support.
The first time the Show new or updated application support tool is enabled andafter a new event arrives, a “New” indicator is displayed on the tool: . After youopen and then close the dialog box, the indicator is no longer shown: . Theindicator provides a convenient visual cue when new events arrive that you havenot yet seen.
Usage note
If the client application support version is greater than the portal server'sapplication support version, there is no need to recycle the client. The new supportwill work with the earlier support that is present on the portal server. Recyclingthe client does not collect the earlier version of support from the portal server
32 IBM Tivoli Monitoring: Tivoli Enterprise Portal User's Guide
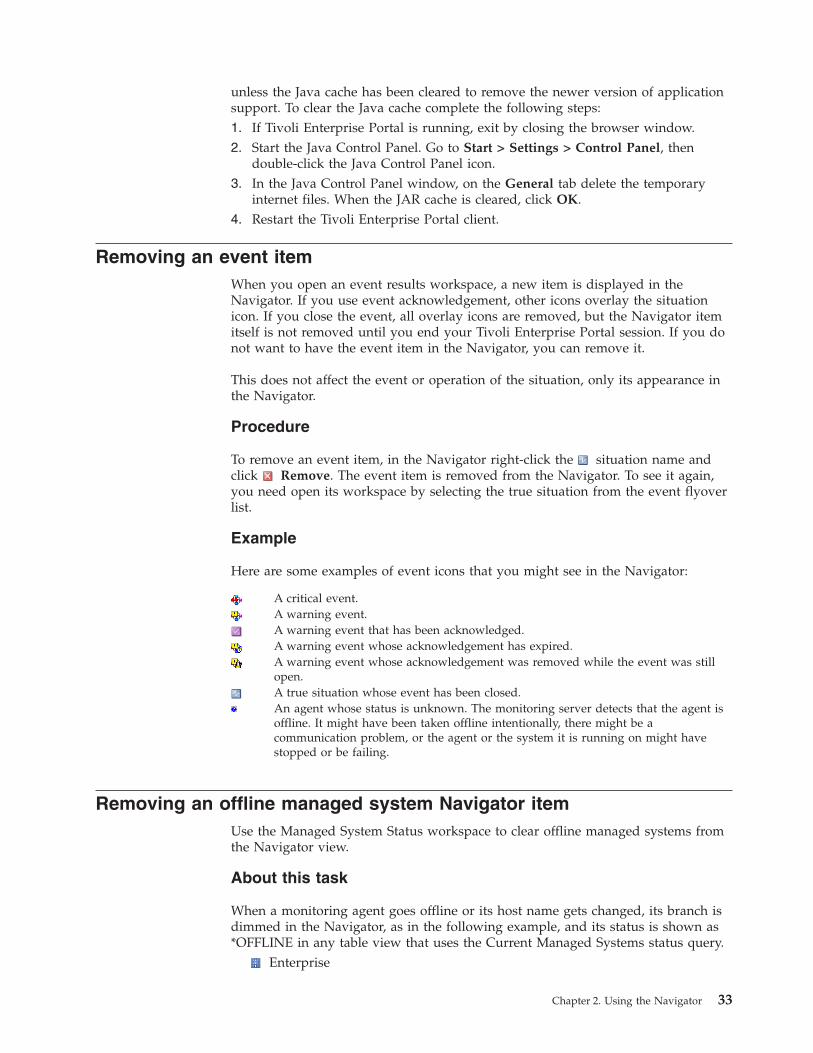
unless the Java cache has been cleared to remove the newer version of applicationsupport. To clear the Java cache complete the following steps:1. If Tivoli Enterprise Portal is running, exit by closing the browser window.2. Start the Java Control Panel. Go to Start > Settings > Control Panel, then
double-click the Java Control Panel icon.3. In the Java Control Panel window, on the General tab delete the temporary
internet files. When the JAR cache is cleared, click OK.4. Restart the Tivoli Enterprise Portal client.
Removing an event itemWhen you open an event results workspace, a new item is displayed in theNavigator. If you use event acknowledgement, other icons overlay the situationicon. If you close the event, all overlay icons are removed, but the Navigator itemitself is not removed until you end your Tivoli Enterprise Portal session. If you donot want to have the event item in the Navigator, you can remove it.
This does not affect the event or operation of the situation, only its appearance inthe Navigator.
Procedure
To remove an event item, in the Navigator right-click the situation name andclick Remove. The event item is removed from the Navigator. To see it again,you need open its workspace by selecting the true situation from the event flyoverlist.
Example
Here are some examples of event icons that you might see in the Navigator:
A critical event.A warning event.A warning event that has been acknowledged.A warning event whose acknowledgement has expired.A warning event whose acknowledgement was removed while the event was stillopen.A true situation whose event has been closed.An agent whose status is unknown. The monitoring server detects that the agent isoffline. It might have been taken offline intentionally, there might be acommunication problem, or the agent or the system it is running on might havestopped or be failing.
Removing an offline managed system Navigator itemUse the Managed System Status workspace to clear offline managed systems fromthe Navigator view.
About this task
When a monitoring agent goes offline or its host name gets changed, its branch isdimmed in the Navigator, as in the following example, and its status is shown as*OFFLINE in any table view that uses the Current Managed Systems status query.
Enterprise
Chapter 2. Using the Navigator 33
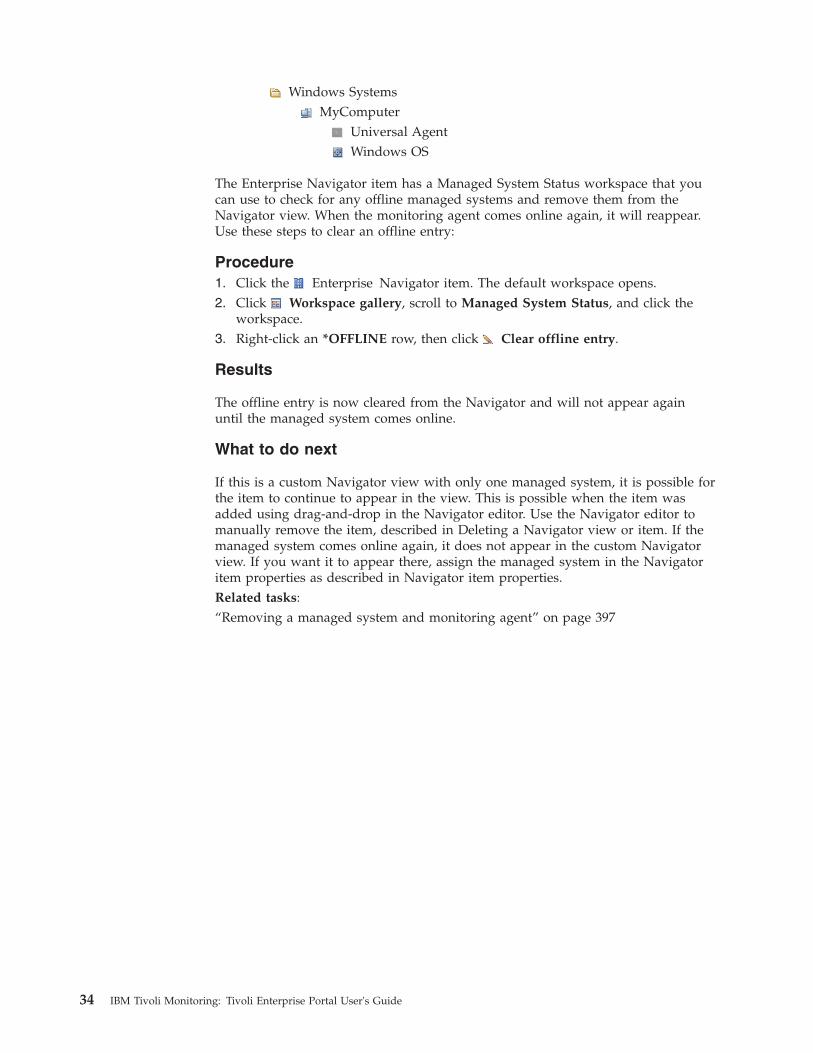
Windows SystemsMyComputer
Universal AgentWindows OS
The Enterprise Navigator item has a Managed System Status workspace that youcan use to check for any offline managed systems and remove them from theNavigator view. When the monitoring agent comes online again, it will reappear.Use these steps to clear an offline entry:
Procedure1. Click the Enterprise Navigator item. The default workspace opens.2. Click Workspace gallery, scroll to Managed System Status, and click the
workspace.3. Right-click an *OFFLINE row, then click Clear offline entry.
Results
The offline entry is now cleared from the Navigator and will not appear againuntil the managed system comes online.
What to do next
If this is a custom Navigator view with only one managed system, it is possible forthe item to continue to appear in the view. This is possible when the item wasadded using drag-and-drop in the Navigator editor. Use the Navigator editor tomanually remove the item, described in Deleting a Navigator view or item. If themanaged system comes online again, it does not appear in the custom Navigatorview. If you want it to appear there, assign the managed system in the Navigatoritem properties as described in Navigator item properties.Related tasks:“Removing a managed system and monitoring agent” on page 397
34 IBM Tivoli Monitoring: Tivoli Enterprise Portal User's Guide
Chapter 3. Using workspaces
The workspace is the working area of the Tivoli Enterprise Portal window, dividedinto panes to show different types of views. You can start monitoring activity andsystem status immediately with the predefined workspaces.
You can tailor your own workspaces to give you summary overviews or to look atspecific conditions.
Workspace characteristicsEvery Navigator item has at least one predefined workspace that you can open.Every workspace characteristics such as editable properties and views.
Views
A view is a windowpane, or frame, in the workspace containing a chart or tableshowing data from one or more monitoring agents. Other types of views such asthe topology view and graphic view can give a broader overview of the network.Specialized view such as the browser view and terminal view are also available.You can increase the number of views in a workspace by splitting a view into twoseparate views.
The data for a table, chart, or relational table-based topology view is chosen by thequery it uses. Collectively, they are called query-based views. The query specifies theattributes to include in the view. Although each view uses one query, you can addmore views to the workspace, and each can use a different query. The queries canbe for different monitoring agents, including those for the Tivoli EnterpriseMonitoring Server for showing information that is common to your monitoredenvironment (such as all the managed systems and all the situation events). Youcan also include queries of JDBC or ODBC data sources by writing custom SQLqueries.
Properties
Every workspace has a set of properties associated with it: general properties thatapply to the entire workspace, and properties for each view in the workspace. Usethe Properties editor to customize the workspace characteristics and to change thestyle and content of each view.
You can also keep the original workspace intact and create another workspace forthe same item in the Navigator, customizing it for the types of views you wantand the information reported in charts and tables.
Changes you make to a workspace are available only to your user ID. Systemadministrators can work in Administration mode to create and edit workspacesthat will be available to all users on the managed network.
Links
The link feature enables you to define a link from one workspace to another. Thenyou can quickly jump to a related or more detailed workspace to investigatesystem conditions.
© Copyright IBM Corp. 2005, 2012 35
The simplest type of a link originates from the Navigator item: When youright-click that Navigator item, the pop-up menu shows the defined links for theitem. Select one to open the linked workspace.
A more specific link originates from a table or from a chart data point to anotherworkspace. Information from one of the attributes in the selected row, bar, piesegment, or plot point is used to determine the content of the target workspace.
You can also define more complex links and use the predefined links that comewith your IBM Tivoli Monitoring product.
Navigator level
The monitoring agents available for reporting in a workspace are those assigned tothat branch of the Navigator. If you are not sure which monitoring agents areincluded, do one of the following:v Expand the branch of the Navigatorv Right-click the Navigator item and select Properties to see which managed
systems are assigned.v Open one of the workspaces at the enterprise, platform, or system level of the
Navigator Physical view
This same principle applies to attribute groups. The lowest level of the NavigatorPhysical view, for example, is the attribute level. The views you can show for theworkspaces at that level can draw only from the attribute groups represented bythat level. If you were to build a workspace for the Disk Navigator item, forexample, you could create a chart with data from the Logical Disk attributes andanother with data from the Physical Disk attributes.
Opening a workspaceUse the Navigator to open the default workspace for the selected item, then theWorkspace Gallery to see and select from a thumbnail display of availableworkspaces.
Before you begin
As well as a convenient way to open workspaces, you can also move theworkspaces around the gallery to change their order. The changes you make aresaved with the workspace definition for the Navigator item. If you are inworkspace administration mode when you reorder the thumbnail graphics, thereorganization will be reflected in the workspace gallery of all Tivoli EnterprisePortal clients connected to this Tivoli Enterprise Portal Server.
About this task
Every item in the Navigator has a workspace associated with it, called the defaultworkspace. Some items have multiple workspaces that you can open, although onlyone workspace can be open in the Tivoli Enterprise Portal window at one time.Some workspaces are only accessible by linking to them from another workspace.
Procedurev To open the default workspace, click the item name or icon in the Navigator:
– Physical view: , , , , or .
36 IBM Tivoli Monitoring: Tivoli Enterprise Portal User's Guide
– Logical view or other custom Navigator view: .
The default workspace for that item is displayed, replacing the workspace of thepreviously selected item. If the workspace shows no data for a chart or tableview, it means there is no data to display. This can occur with monitoring datathat is not constantly generated, such as Archive Errors, which collects data onlywhen archive errors occur.
v To open another workspace associated with the Navigator item:1. Click Workspace gallery.2. Click the thumbnail graphic of the workspace to open. (To open the
workspace in a new window instead of replacing the current workspace, useCtrl + Shift + click the thumbnail graphic.)
If this is a new installation, you will see the splash screen instead of a thumbnailversion of the workspace in the gallery until you or another user who is loggedon to the same Tivoli Enterprise Portal Server opens the workspace for the firsttime. A check mark by a workspace name indicates that it is the defaultworkspace for this Navigator item. You can reorder the workspaces in your copyof the gallery by clicking a thumbnail graphic and dragging it on top of theworkspace to swap positions with.
Related tasks:Starting workspace administration mode“Opening a new window”Related reference:“Tabbed workspaces” on page 38
Opening a new windowHave multiple workspaces open on your desktop at the same time by openingmultiple Tivoli Enterprise Portal windows.
About this task
You can add more dashboard views to your desktop by opening more TivoliEnterprise Portal windows. Any changes you make these window are saved withthe application.
Procedurev To open a new window in the desktop client, click New Window.v To open a new window in the browser client running in Internet Explorer, press
Ctrl + N.v To open another workspace in a new window and keep the original intact in this
window, click Workspace gallery and Ctrl + Shift + click the workspace.
Results
The new window is opened as a duplicate of the original; any changes you maketo the new window are independent of the original.
What to do next
Any previously visited workspaces are retained from the parent window; useand to revisit them. Further navigation to other workspaces in either window,however, is independent of the other window.
Chapter 3. Using workspaces 37
You can close duplicate windows (click File > Close) or the original; the worksession remains active as long as one window is open.Related tasks:“Opening a workspace” on page 36Related reference:“Tabbed workspaces”
Tabbed workspacesUse the tabbed pages capability of your browser to open workspaces, linkedworkspaces, and Navigator views in new tabs.
Browser client and browser settingsWhen your browser supports tabbed web pages, the Tivoli EnterprisePortal browser client uses the browser's tab settings to determine how toopen a workspace: When tabs are enabled, the workspace is opened in anew tab. You can set the properties of a workspace or the target of aworkspace link to always open in a new tab, or you can open a workspacein a new tab by holding down the Ctrl + Shift keys while selecting theworkspace with a mouse click. Then use the Ctrl + Tab keys to switchfocus to the next tabbed workspace.
The desktop client and Java Web Start client use these same features toopen a workspace, but it is always opened in a new window.
Workspace propertiesEvery Tivoli Enterprise Portal workspace has properties that control theaccess and method of display when it is opened. The workspace will openin a new tab on browsers that are set to use tabbed pages when Alwaysopen workspace in new window is enabled.
Link targetThe link wizard Target Workspace page has an option to Always opentarget workspace in new window. It shows in the link wizard Parameterspage as openTargetInNewWindow. When enabled, this option opens thetargeted workspace in a new tab if you are logged on from a tab-enabledbrowser.
Navigator item findFind in the Navigator toolbar enables you to locate any Navigator item
using simple or advanced search criteria. The Find window has an optionto Open workspace in new window that will open the defaultworkspace for the found Navigator item in a new tab if you are logged onfrom a tab-enabled browser.
On demandYou can open a workspace in a new tab from any context:
Open a workspacev Ctrl + Shift + click a Navigator item to open its default workspace.v Click Workspace gallery and Ctrl + Shift + click the workspace.v Right-click the active Navigator item, point to Workspace, and Ctrl +
Shift + click the workspace that you want to open.v View > Workspace > Ctrl + Shift + click the workspace that you want to
open.
Link to a workspacev Ctrl + Shift + click the link anchor. If there are multiple choices, click the
one you want.
38 IBM Tivoli Monitoring: Tivoli Enterprise Portal User's Guide
v Right-click the source of a defined link (Navigator item, table view row,pie chart slice, bar chart bar, plot chart point, area chart point), point toLink to, and Ctrl + Shift + click the link name.
Open a found Navigator item at its default workspace1. In the Navigator view toolbar, click Find, enter the find criteria and
click Find.2. From the list of Navigator items that is displayed in the Find results
area, point to a row and Ctrl + Shift + click to open the defaultworkspace for that Navigator item in a new tab.
Open a Navigator view at its default workspacev In the Navigator view toolbar, click the View list box and Ctrl + Shift
+ click the Navigator view.v View > Navigator View > Ctrl + Shift + click the Navigator view.v Ctrl + Shift + click a Navigator tab.
TroubleshootingIf the workspace or Navigator view opens in a new window rather than anew tab, review the tab options in your browser to ensure that the tabfeature is enabled. If you are using Microsoft Internet Explorer 7, be awarethat tabbed workspaces are treated as pop-ups: In the Tabbed BrowsingSettings window (Tools > Internet Options > General > Tabs > Settings),
Always open pop-ups in a new tab must be selected.
Refreshing a workspaceYou can refresh the data that is displayed in the workspace on demand or at a setinterval.
About this task
The Tivoli Enterprise Portal client receives monitoring data from monitoring agentswhenever you open a workspace that includes query-based views. The defaultsetting for most predefined workspaces is On Demand, which means retrieved dataremains static until you refresh manually.
Procedurev To refresh a workspace manually, click Refresh Now.v To set a refresh interval, click View > Refresh Every, and select one of the
intervals: 30 seconds; 60 seconds; 5 minutes; 15 minutes; 60minutes; or On Demand .
What to do next
Note: In order for your refresh settings to persist, you must save the workspaceand optionally select "Assign as default for this Navigator item" in the SaveWorkspace As dialog.
If the workspace includes any plot charts or area charts, you can refresh thoseviews independent of the rest of the workspace by editing the Style properties ofthe plotted area to specify a refresh rate.
Be aware that the more frequent the automatic refresh, the more network trafficyou create. These requests travel from the portal client to the portal server and tothe hub monitoring server before reaching the monitoring agent. They might alsopass through a remote monitoring server to reach the monitoring agent. The
Chapter 3. Using workspaces 39
information is returned by the same route.Related tasks:“Suspending and stopping refresh”
Suspending and stopping refreshIf the workspace is set to refresh automatically at timed intervals or it includesevent status views, you can suspend refreshes to keep the data from changingwhile you investigate a problem.
About this task
When you open a workspace that includes table or chart views, the TivoliEnterprise Portal receives the most recently sampled monitoring data from theagents. Take one of these steps to suspend data refreshes or to stop receiving thedata that populates the workspace.
Procedurev To suspend automatic refreshing of the workspace, click Pause Refresh; click
Resume Refresh to turn on automatic refresh again.v To stop loading the workspace, click Stop.Related tasks:“Refreshing a workspace” on page 39
Linking to a workspaceUse these steps to link to a workspace that has been targeted from the currentNavigator item or view.
About this task
Many monitoring agent products have workspace links available through theirpredefined workspaces. You can also create and use links to workspaces thatfollow a logical progression of investigation into performance and operation issues.
Procedure1. Open the workspace from where you will launch the link. This is the source
workspace.2. Do one of the following, depending on where the link originates:
v Right-click the current (highlighted) Navigator item.v Click the link indicator on a table row or the graphic view, then skip to
step 4. (A dimmed link indicator means the link is not available from thatrow.)
v Right-click a pie chart slice, bar chart bar, plot chart point, table row, graphicview icon, or TMS Infrastructure object.
3. Click Link To and click the target workspace in the list. The target filter orlink expression is used to select the information displayed in the views of thetarget workspace. If, instead of the workspace opening, you get a "Target notfound" message, the definition of the target workspace could not be resolved.
4. If there is more than one workspace you can link to, the Select Target windowopens: Select the Navigator item for the workspace and click OK.
40 IBM Tivoli Monitoring: Tivoli Enterprise Portal User's Guide
5. If a message asks you to select a leaf node, click OK, then select an item deeperin the tree hierarchy.
Results
The target workspace is displayed. If the link was defined to open the workspacein a new window, it is opened in its own window. If you are using the browserclient and your browser supports tabs, the workspace is in a new tab next to thesource workspace.
Note: Navigation using and to visited workspaces retains the link context.As an example, consider a link to a workspace from a table row. The row fromwhich you linked is remembered when you revisit the target workspace.Related concepts:“Defining links between workspaces” on page 71
View title bar and toolbarEvery workspace view and the Navigator view has a title bar with some or all ofthese controls.
Opens the Properties editor to the properties for the view.
Shows or hides the view toolbar. This button does not display if the view has notoolbar.
Splits the Navigator horizontally to create a new workspace view.
Maximizes a view for a closer look. Click Restore to return to the original size.You can save the workspace with the view maximized.
Removes a view. There is no undo for this action except to open a differentworkspace and answer No when a message asks if you want to save theworkspace; -OR- Select File > Save As to keep the original workspace with theview intact and create a new workspace without this view.
Most view types have a toolbar for performing specific actions in the view. Acommon tool is Find, which is available for finding values in the browser view,notepad view, table view, message log view, and the event console views. Anothertool, Time span, is for specifying the time period to be displayed in aquery-based view when historical data is being collected for it.
Setting a time span to displayYou can have the Tivoli Enterprise Portal log data samplings into history files or adatabase for display in a table or chart. These historical data enabled views have atool for setting a range of previous data samples to be reported.
Before you begin
Historical data collection must be configured and distributed to the managedsystems that you are querying data from. Otherwise, Time Span is not displayedin the toolbar of the query-based view.
Some attributes groups, such as Situation Status and the Windows Event Log, arehistorical in nature and show all their entries without you having to specify a timespan. For these types of attribute groups, you do not need to configure historycollection unless you want to roll off to a data warehouse for long-term storage or
Chapter 3. Using workspaces 41
limit the amount of data displayed. Thus, the time span feature, rather thanshowing more data, limits the data reported to the time period indicated.
Even if data collection has been started, you cannot use the time span feature if thequery for the chart or table includes any column functions. If this is the case, youcan select or create another query to enable Time Span.
About this task
Take these steps to broaden the time range of data beyond the current datasamplings.
Procedure1. Open the workspace containing the chart, table, or relational table-based
topology view where you want to see historical data.2. Click Time Span in the view's toolbar.3. Select a time frame: Real time plus Last _ Hours (enabled for bar, plot, and
area charts only), Last _ Hours (or Days, Weeks, or Months, if the data iswarehoused), or Custom.
4. If you selected Last or Custom, specify the range of data:v Detailed data is all the data collected for the agent.v Summarized data is data that is aggregated across the specified time frame.
Set the time frame interval, work shift, and the days. This option is disabledif no data warehouse and summarization schedule were configured for thisattribute group.
v To set a custom time frame, click inside the Start Time and End Time fieldsto open the date editor. Use the spin boxes to adjust the time, year, ormonth; and click the calendar day. HH:MM:SS AM/PM is initially set to thecurrent time.
v To apply the time span to all views that use the same query as this view,select Apply to all views associated with this view's query. When thisoption is enabled, the query is modified to include the time span set here, soany other views using this query report the same time range.
v The Timestamp column that is added to the historical view can show eitherthe global timestamp (the default) or local. Select Use Hub time to reflectthe time at the Hub Tivoli Enterprise Monitoring Server rather than at theTivoli Enterprise Portal Server or portal client.
Results
After you click OK, the view shows data from the time span you specified. If theview is a table, a timestamp is displayed as the first column and is accurate to thenearest minute; seconds are displayed as 00.
If you see null as the value of a table cell or chart point, it means that no valuewas stored in the Tivoli Data Warehouse. This happens when values that wereidentified as invalid are reported from a monitoring agent for a givensummarization period.
42 IBM Tivoli Monitoring: Tivoli Enterprise Portal User's Guide
What to do next
The sort function is incompatible with the historical reporting feature. If you areusing Time Span to retrieve historical data, the chart or table is not sorted evenif you have specified a sort order in the query. You can still sort a table by clickinga column heading.
After support for an updated product has been applied to the portal server, it ispossible to get a request error message about a missing or unknown column namein the view's status bar after you set a time span with Use summarized dataselected. Wait until after the next scheduled summarization and pruning procedurehas taken place before viewing the summarized data. If need be, you canreschedule summarization and pruning to run sooner.Related concepts:“Overview of historical data collection and reporting” on page 207Related tasks:“Discontinuing historical reporting” on page 209
Moving a viewMove a view to a different position in the workspace to take best advantage of theavailable space.
Before you begin
Your user ID must have Workspace Author Mode permission to use this function.
About this task
You can easily rearrange the views in a workspace to take advantage of the greaterwidth available below the Navigator view and the narrow area to the right.
Procedure1. Move the mouse pointer over the title bar of the view you want to relocate.2. Click and drag the view over the space you want it to occupy. While dragging
the title bar, you should see a semi-transparent copy of the view.3. Release the mouse button to swap the views.
Reordering columns and rowsChange how a table view is sorted temporarily to focus on specific column detailsor in a more permanent way if it should always appear sorted in this manner. Youcan also reposition columns for a more logical organization or to emphasizecolumns of interest.
About this task
You can set the sort order in three ways. Take one of the following steps
Procedurev Reorder the table view columns or chart view data series by clicking the column
heading and dragging to the new position:– If you open a workspace and drag the column heading in a workspace table
view, the change is temporary unless you save the workspace. You can also
Chapter 3. Using workspaces 43
right-click a column heading and click Lock this Column to fix the columnand any columns to the left of it so that they do not move off the viewablearea of the pane when you scroll horizontally.
– If you click Edit properties in the table- or chart view title bar and drag acolumn heading in the Filters tab, the change is temporary unless you savethe workspace.
– If you click Query Editor and drag a column heading in the Specificationtab, the changes are saved with the query and applied to any views that usethat query. Column reordering must be done in a custom query becausepredefined queries are not editable.
v Sort the row data in a table view:– Click Query Editor, open a custom query, click Advanced, and select a Sort
By attribute from the list.– In a table view, click a column heading to sort all rows by that column in
ascending order, descending order, and back to the original order the thirdtime you click. You can save the view's sort order with the workspace.
Zooming a chart viewZoom in on part of a bar chart, plot chart, or area chart to see a subset of the datain greater detail.
About this task
Zooming expands the chart along the category axis; for example, you can zoom abar chart to show just a few bars, or zoom a plot or area chart to show a shorterspan of time. While displaying the chart, complete the following steps to zoom:
Procedure1. Select an area of the chart by clicking and dragging the mouse pointer. The
selected area immediately expands to fill the available view space. Each timeyou click and drag, the chart zooms to show more detail.
2. Press Esc for each zoom step to undo. The plot area returns to the previoussize.
Exporting a query-based viewSave some or all of the data that was retrieved by the query for a view in a text(.txt) file or comma separated value (.csv) file for further manipulation in anothersoftware application.
About this task
When you open or refresh a workspace, the queries assigned to the table and chartviews are sent to the Tivoli Enterprise Monitoring Server, which returns therequested data from the managed systems. Any filters applied to views reducewhat displays, such as only the relevant four columns of a seven-column table oronly the processes that are using the most memory.
When you export a query-based view, you can save everything returned by thequery before any filters are applied. This includes every column queried or onlythose you select; every row returned or, if there are multiple pages, only the rowsfrom the displayed page. Also, if you save the data to an existing file, you canchoose to append the data or to overwrite the previous version. Take these steps to
44 IBM Tivoli Monitoring: Tivoli Enterprise Portal User's Guide
save the data you select from the view to a .txt or .csv file:
Procedure1. Open the workspace with the query-based view whose results you want to
save.2. Because the current data display is exported, click Refresh if you want the
latest results.3. If this is a table, pie chart or bar chart view with multiple pages and you want
to save a particular page rather than all rows, click or at the ends of thevertical scroll bar (or type the number in the Page text box) until it displays. Apage is 100 rows by default. You can change the view's page size by clicking
and changing the View-level Page Size value in the Query tab.4. Right-click inside the query-based view and click Export.5. In the Export to Disk window, select the location for the exported data, select a
file type, and type a file name.6. To export the rows that are visible in the view space and all the columns
shown in the Assigned list, click OK; or, to specify otherwise, do any of thefollowing:v For the all pages returned by the query, click All rows.v To exclude a column from those being exported, select from the Assigned list
and click ; to include a column, select it from the Available Columns listand click . Use Ctrl+click to select multiple columns or Shift+click to selectall columns from the first one selected to this one.
v To change the order, select a column and click or .
If this is a new, unsaved table or chart view, Visible rows is selected foryou.
7. If the file you are saving already exists, you can choose to overwrite the filewith the current data selection, append the data to the file, or cancel.
Finding text in a browser view or notepad viewUse the find function to locate text in the selected notepad view or browser view.
About this task
Take these steps to find specific text or values in a notepad view or browser view.
Procedure1. Open the workspace that contains the notepad view to search.2. Click Find in the toolbar of the view you want to search. (If the tool is
hidden, click Show toolbar in the view's title bar.)3. In the Find window that opens, type the beginning or all of the text to find.4. Select or clear any of the following check box options, then click Find.
v Case Sensitive to find only spellings that match the letter casing as typed.When the check box is disabled, all variations of the letter casing can befound.
v Backwards to search from the cursor point backwards. When the checkbox is disabled, the default, the search will be from this point forward.
v Wrap Search, instead of stopping the search when the end of thedocument is reached, continues to search from the beginning and stops when
Chapter 3. Using workspaces 45
it reaches the point where the search began. Clear the check box if you wantthe search to stop at the end of the document (or the beginning of thedocument if the search is backwards).
5. Click Find Again to search for the next instance.
What to do next
You can click Close when you are done or leave the Find window open for thisview while you continue working with the workspace.
Finding table dataUse the find function to locate a text or numeric value in the selected table view,message log, or event console view.
About this task
Take these steps to use the Find tool for quickly locating values.
Procedure1. Open the workspace that contains the view you want to search.2. Click Find in the table view toolbar. If the tool is hidden, click Show
toolbar in the view's title bar. The Find window opens with the first twocolumn headings (attributes) filled in and fields for entering up to five values.
3. Click an arrow and select the column to search within. To clear a columnname, select the first entry (which is empty) from the list.
4. Click inside the corresponding Value field and enter the value to find.v The default function is Value of expression ( Compare Date and Time for
time attributes); the default operator is . If you need to change thefunction or operator, click the or button and select from the list.
v You can enter a partial value to find all occurrences of the text or numberthat begin with those characters. For example, 500 will find 500 and 5000;and West will find West, West006, and Western. You can also use an *asterisk wildcard for any number of characters beginning at that position;use a ? question mark wildcard for a single character at that position. Youcan also use wildcards with the Scan for string within a string and
Return a subset of the string functions. See the formula function topics fora description of attribute types and other formula functions, includingexamples. When using the ? question mark wildcard with the Value ofexpression function, append the text with an * asterisk. For example, enterSa?e* to find Safe and Sale.
v Most special characters are processed correctly. If you attempt to find textthat includes a special character and it is not found, but you know it exists inyour environment, precede it with the \ backslash escape character.These are some of the special characters that require the \ escape characterprefix: # pound sign; $ dollar sign; ^ circumflex; \ backslash; ( open and )close parentheses; + plus sign; [ open square bracket; { open and } close curlybraces. For example, \#my_situation to find #my_situation in the MessageLog view.These special characters do not need the escape character: ! exclamationpoint; @ at sign; % percentage; & ampersand; = equal sign; < open and >close pointed bracket; _ underscore; - hyphen; ] close square bracket; / slash;: colon; and ; semicolon.
5. Select or clear any of the check boxes and click Find.
46 IBM Tivoli Monitoring: Tivoli Enterprise Portal User's Guide
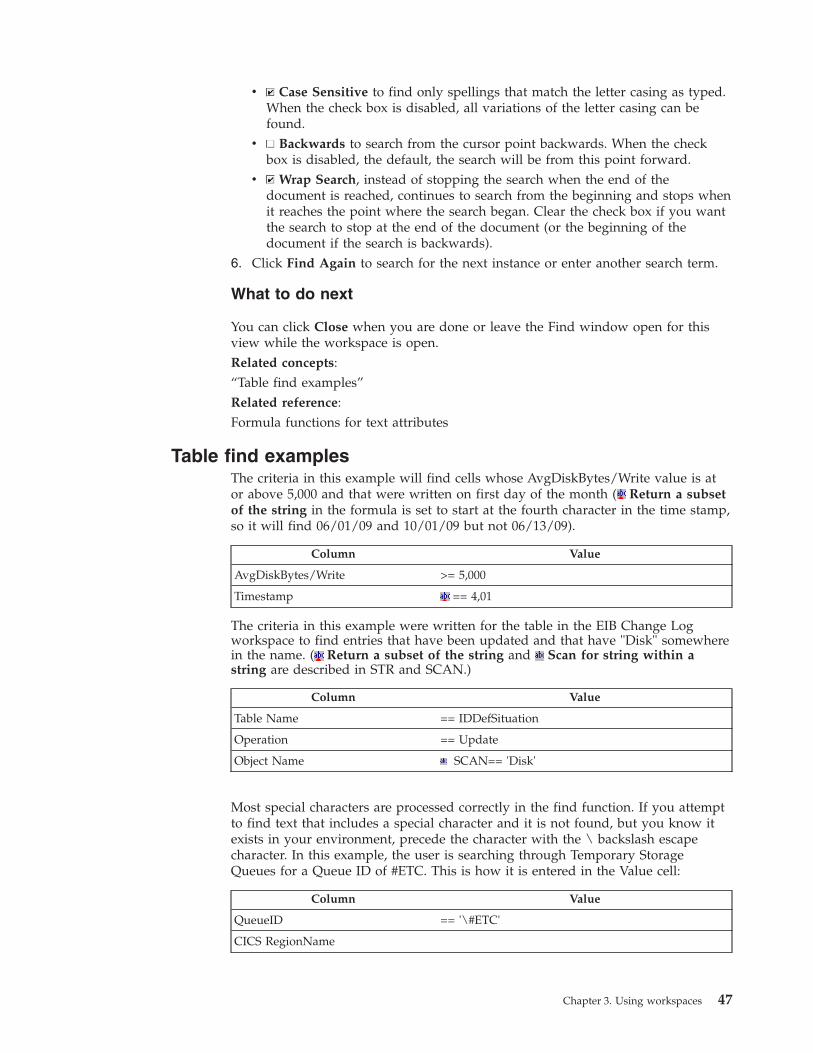
v Case Sensitive to find only spellings that match the letter casing as typed.When the check box is disabled, all variations of the letter casing can befound.
v Backwards to search from the cursor point backwards. When the checkbox is disabled, the default, the search will be from this point forward.
v Wrap Search, instead of stopping the search when the end of thedocument is reached, continues to search from the beginning and stops whenit reaches the point where the search began. Clear the check box if you wantthe search to stop at the end of the document (or the beginning of thedocument if the search is backwards).
6. Click Find Again to search for the next instance or enter another search term.
What to do next
You can click Close when you are done or leave the Find window open for thisview while the workspace is open.Related concepts:“Table find examples”Related reference:Formula functions for text attributes
Table find examplesThe criteria in this example will find cells whose AvgDiskBytes/Write value is ator above 5,000 and that were written on first day of the month ( Return a subsetof the string in the formula is set to start at the fourth character in the time stamp,so it will find 06/01/09 and 10/01/09 but not 06/13/09).
Column Value
AvgDiskBytes/Write >= 5,000
Timestamp == 4,01
The criteria in this example were written for the table in the EIB Change Logworkspace to find entries that have been updated and that have "Disk" somewherein the name. ( Return a subset of the string and Scan for string within astring are described in STR and SCAN.)
Column Value
Table Name == IDDefSituation
Operation == Update
Object Name SCAN== 'Disk'
Most special characters are processed correctly in the find function. If you attemptto find text that includes a special character and it is not found, but you know itexists in your environment, precede the character with the \ backslash escapecharacter. In this example, the user is searching through Temporary StorageQueues for a Queue ID of #ETC. This is how it is entered in the Value cell:
Column Value
QueueID == '\#ETC'
CICS RegionName
Chapter 3. Using workspaces 47
Related tasks:“Finding table data” on page 46Related reference:Formula functions for text attributes
Printing a view or workspaceYou can print the workspace or an individual view and display a previewbeforehand.
About this task
Do any of the following to see a print preview or print the workspace or selectedview:
Procedurev To see a print preview of the workspace, click File > Print Preview.v To print the current workspace, click File > Print.v To see a print preview of the view, right-click in the view and click Print
preview,v To print the view, right-click in the view and click Print.
Results
When you print a table that has more columns than will fit the width of the page,they will wrap to the next page. If there are more rows than will fit on the page,they are displayed on subsequent pages.
What to do next
The printing mechanism used by Tivoli Enterprise Portal is provided by Java, andhas some limitations. When you print a notepad view, the text prints as an image.If you want a better quality, try selecting and copying the text (Ctrl+C), thenpasting into your favorite text editor for formatting and printing. When you print aworkspace or chart, try sizing the application window or view pane smaller toimprove the clarity of the printed copy. You can also use the Print Screen key.
As an alternative to printing in Tivoli Enterprise Portal, you can export the view toa comma separated value (.csv) file or text (.txt) file, then import it into theprogram of your choice, and print there.Related tasks:“Exporting a query-based view” on page 44
48 IBM Tivoli Monitoring: Tivoli Enterprise Portal User's Guide
Chapter 4. Responding to events
Event indicators such as or appear on Navigator items when an event isopened for a true situation.
A situation is a test for certain conditions on managed systems that, when met,change the situation status to true. The situation can include a take actioncommand (reflex automation) that will be carried out when the situation is true.
Understanding situation eventsThe products that run in the Tivoli Monitoring environment come with their ownset of situations. These predefined situations serve as models for defining customsituations for your environment.
Situation formulaSituations formulas are constructed of one or more expressions. Forexample, a situation that checks for free disk space below 20% on aWindows system has an expression that uses the Logical Disk attribute"Free Megabytes" and reads as Free Megabytes < 20.The situation will readdata samples taken at the managed system at set intervals, such as once aday for the disk space situation in our example.
Other situations might be more elaborate, such as the predefined WindowsOS situation, Bottleneck Memory. It embeds two situations: one that testsfor excessive memory paging activity (>100 pages per second), and onethat tests for processor time over 70%. If both of these situations are true atthe same time, the Bottleneck Memory situation becomes true and opensan event.
Situation event indicators
When a situation is associated with a managed system, it also has a statesetting that determines which “light, is displayed on the Navigator itemwhen the situation becomes true. From highest severity to lowest, they are
Fatal, Critical, Minor, Warning, Harmless, Informational, andUnknown. As you move up the Navigator hierarchy, multiple events are
consolidated to show only the indicator of the highest severity. Go to thelowest level of the hierarchy in the Navigator and you see the eventindicator over the attribute category for which it was written.The situationevent console and graphic view also show situation event indicators andenable you to respond to events. The Enterprise Status workspace includesthe situation event console view.
Enterprise Status workspaceThe initial default workspace is the Enterprise Status workspace. The viewsin this workspace give an excellent overview of situation events in yourmonitored environment and their status. One of the views, Situation EventConsole, lists the open events and their severities.
Event flyover listIn the Navigator view or a graphic view, you can hover the mouse over anevent indicator to open a flyover listing of open situation events with thisinformation:
Event state
© Copyright IBM Corp. 2005, 2012 49
Situation nameName of the system on which the event occurredTwo-letter code for the monitoring agentEvent timestampDisplay item, if one was specifiedSituation status icon if: the event has been acknowledged; theacknowledgement has expired; the acknowledgement was removedbefore it had expired and the situation is still true; the situation isnot functioning properly and you will not be able to open its eventresults workspace; or the situation has been stopped and you willnot be able to open its event results workspace.The link is to the event results workspace for the situation.
The pop-up menu for the event items has options for working with thesituation and event:
Edit the situation
Start the situationStop the situationQuick acknowledge the eventAcknowledge the eventClose the event (pure events only)
Event results workspace
The event results workspace shows the values of the attributes when thesituation fired and their current values. It shows any expert advice thesituation author might have written and any hypertext links to go to formore information. The take action view enables you to select or define acommand to be invoked at the managed system.The table views showingthe initial situation values and their current values also have pop-upmenus that include the option to launch an application. If you have afavorite diagnostic tool, you can start it from here.
Event acknowledgement
When multiple users are monitoring the network for events, one of themcan acknowledge an event to indicate it has been seen and the problem isbeing worked on. Acknowledging an event changes its event status fromOpen to Acknowledged until the acknowledgement expires or until thesituation is no longer true.You can add notes to an acknowledgement andattach files that are pertinent to the event.
Automated responsesAutomated responses to events can improve the efficiency of systemsmanagement by reducing user workload and errors and allowing quickerresponses to problems. Tivoli Enterprise Portal provides two levels ofautomation: reflex and advanced.v Reflex automation provides simple automated system actions. It allows
you to monitor a condition on a particular system and to specify acommand to execute there. The command can be a single action or ascript of commands. Tivoli Enterprise Portal receives no feedback after itsends the command or notifies the user.Reflex automation is implemented by adding an action command to asituation definition that runs when an event is opened.
50 IBM Tivoli Monitoring: Tivoli Enterprise Portal User's Guide
v Advanced automation allows you to implement more complex workflowstrategies than you can create through simple reflex automation. Policiesare used to perform actions, schedule work, and automate manual tasks.A policy comprises a series of automated steps called activities, which areconnected and can branch to create a workflow. After an activity iscompleted, a return code is received with feedback and the next activityprescribed by the feedback is carried out.With policies you can monitor multiple conditions simultaneously onany number of systems and have selected activities take place whenspecific conditions occur. Many monitoring agents come with predefinedpolicies that you can use as is or modify for your environment.
You can also create your own policies. The Workflows editor is providedfor designing and managing policies.
Opening the situation event results workspaceWhen the conditions of a situation have been met, event indicators appear in theNavigator and in the graphic view. You can investigate the event by opening itsworkspace.
Procedurev Open the event results workspace from the event flyover list:
1. In the Navigator or graphic view, move the mouse over the event indicator (Fatal, Critical, Minor, Warning, Harmless, Informational, orUnknown) to open a flyover listing of the situation that caused the event.
The Navigator shows one event indicator for an item. If more than onesituation is true, the event indicator with the highest severity is displayed.Entries in the event flyover list are grouped by severity. Each event reportsthe situation name, the computer where the event occurred, the two-lettercode of the monitoring agent (such as LX for the Linux OS agent), the eventtimestamp, and the display item if one was specified. As well, if any of thefollowing changes have occurred, a situation status icon displays at the farright:
The event has been acknowledged.The acknowledgement has expired.The acknowledgement was removed before it had expired and the
situation is still true.The situation is not functioning properly and you will not be able to open
its event results workspace.The situation has been stopped and you will not be able to open its event
results workspace.2. In the flyover list, click next to the situation to open its event results
workspace.v Open the event results workspace from the situation event console view:
1. Right-click the row of the event.2. Click Situation Event Results.
Results
A new Navigator item is displayed below the one associated with the event andthe event results workspace opens. The event results workspace contains fourviews to help you investigate the condition and determine what action to takenext:
Chapter 4. Responding to events 51
Initial Situation ValuesThe values are from the data sample that triggered the event. Move themouse pointer over a highlighted value to see the situation formula. Thevalue shows as "Unknown" and the formula does not display if thesituation expression uses a group function: CHANGE, PCTCHANGE, AVG,COUNT, MIN, MAX or SUM.
Current Situation ValuesThe values are from a new data sample that was taken after you selectedthe event results workspace. If the situation is still true, you will see thesame cell highlighting as is shown in the Initial Situation Values view. Ifthis is a pure event, you will see no data. This is because pure events areunsolicited notifications. Situations for pure events have no samplinginterval, thus there is no constant metric that can be monitored for currentvalues.
If the expression that is responsible for a situation event uses a groupfunction, the situation event results workspace shows neither the attributevalue threshold color nor the expression that should display when youhover over an initial situation value.
Command ViewUse the command view to send a take action command to an applicationstarted on the managed system of your choosing.
Expert AdviceIf the situation author wrote any expert advice, it is displayed here. Thisview opens to a web page if the advice is a URL reference.
What to do next
Compare the current situation values with the initial situation values that causedthe event and read the advice for any explanation and possible solutions.
You can right-click the situation workspace Navigator item to open the pop-upmenu. The menu includes functions for responding to the event:
Edit SituationOpens the Situation editor so you can see and edit the situation definition,distribution, expert advice, take action command, or until modifier.
AcknowledgeOpens the Acknowledgement window so you can acknowledge that youare taking care of the event.
Close Situation EventIf this is a pure event, you will see this option to close the event andremove the event indicator. If the condition goes from true to false andback to true again the next time the situation is evaluated, the indicatorwill reappear. If the condition remains true, the indicator is not displayed;you must restart the situation if you want to see the indicator.If you close an event manually, you cannot acknowledge it.
Remove Event ItemRemoves the event item from the Navigator. To see it again, you mustselect the true situation from the event flyover list.
User ID permissions for Events are Acknowledge and Close; and those forSituations include Start or Stop, View, and Modify. If any of these fails to appear inthe pop-up menu, your user ID does not have permission for the function.
52 IBM Tivoli Monitoring: Tivoli Enterprise Portal User's Guide
If you have workspace author mode permission, you can also edit the workspaceto add any views that are helpful for diagnosing an event for this particularsituation. For example, if historical data is collected for an attribute group, youmight want to create a plot chart and add a historical baseline to help to get abroader view of past and current values for trend analysis.
Enterprise Status workspaceAt the highest level of the Navigator Physical view is the Enterprise item. Thedefault workspace for the Enterprise is called Enterprise Status.
The Enterprise Status workspace contains four views:
Situation Event Console
The situation event console inserts a row when the status of a situation changes:Open (including expired and reopened events), Problem, and Acknowledged. TheOwner column shows who acknowledged the event, and you can acknowledge anevent from the pop-up menu. Link indicators in this view and in the MyAcknowledged Events view open the “Event Details workspace” on page 54 oryou can right-click a link indicator and select another of the linked workspaces.
My Acknowledged Events
The My Acknowledged Events table view displays the events assigned to thecurrent user. This view shows both open and closed events. Closed events aredisplayed to enable you to access the notes and actions taken against them.
For each event record listed, you can click the link indicator at the beginning ofthe event row to open the “Event Details workspace” on page 54 with similarevents based on the situation name; or you can right-click the link indicator to seethe other Event Details workspaces. The Event Details workspace shows any notesand attachments for the acknowledged event, along with other related events anda link to the IBM Tivoli Open Process Automation Library where you can findanalytical tools for situations.
If the event is from an incident management agent (such as IBM InformationManagement), you will also see a Reference ID column and, when you open thepop-up menu to select a linked workspace, a link to the Incident Detailsworkspace.
Message Log
The message log view displays a row for every situation in the monitored networkwhose status changes to any of the following: Open, Closed, Stopped, Problem,Acknowledged, Expired, or Reopened.
Open Situations Counts - Last 24 Hours
The Open Situations Counts - Last 24 Hours is a chart view which displays a barfor every situation in the monitored network that has become true in the past 24hours. The bar size indicates the number of times a situation event has beenopened during this time.
Chapter 4. Responding to events 53
More predefined workspaces
More predefined workspaces for the Enterprise Navigator item are accessiblethrough the Workspace Gallery. In addition, your monitoring product mighthave workspaces at the Enterprise level. Consult your product help for moreinformation.
Event Details workspaceThe Enterprise Status workspace (default for the Enterprise Navigator item)includes the Situation Event Console and My Acknowledged Events views, each ofwhich has links to the Event Details workspace. The Event Details workspaceprovides detailed information about the event row and has four views.
Selected Event
The Selected Event view provides reference information about the event. You canclick the link indicator to see the other two Event Details workspaces, thenselect one to open it.
Similar Events by...
This is the view that distinguishes each type of Event Details workspace. Theevents will be similar by situation name, by source, or by resource. This viewenables you to identify event patterns to help diagnose the root cause, whether bycondition, by managed system or by the specific resource being monitored.
Similar Events by Situation NameThis view lists all the events for the same situation. Such events wouldoccur when the situation is true on more than one managed system or thesituation is true on the same managed system more than once (a displayitem was defined in the Advanced Situation options window).
Similar Events by SourceThis view list all the events from the same managed system as the eventyou are viewing.
Similar Events by ResourceThis view displays all the events for situations that were defined with thesame attribute group as the one used for this situation.
Event Notes
The Event Notesdisplays any notes and files that have been applied to the eventacknowledgement. You can access any attached file by clicking the Attachmenthypertext link. The file is launched in your default browser or in the defaultviewer configured for the file's MIME type. You can print the notes for an event byclicking Print. If you want to update the notes for an event, right-click the eventin the Selected Event view and click Event Notes. Click to view the updates.
Event Tools
The Event Tools browser view provides links to additional resources for managingevents. There are downloadable tools, some of which can be used to troubleshootany problems you have with events. For example, this view provides a link to theLog and Trace Analyzer, which you can use as part of an autonomic eventmanagement solution. This view also provides a link to the IBM Tivoli Open
54 IBM Tivoli Monitoring: Tivoli Enterprise Portal User's Guide
Process Automation Library website, from where you can access additionalproblem determination information and tools.
Acknowledging an eventWhen an event is opened for a true situation, you can acknowledge it. This notifiesother users that you have taken ownership of the problem related to the event andare working on it. The acknowledgement window records the time of theacknowledgement and the ID of the user.
Before you begin
Your user ID must have Acknowledge permission for Events to use this function.
About this task
Acknowledgements enable users who are monitoring events to communicate theirworking status. Follow these steps to acknowledge an open event or one whoseacknowledgement has expired or been canceled before the event has been closed.
Procedure1. Do one of the following:
v Move the mouse over an event indicator (such as , , or in the Navigatorto open the flyover list of open events, then right-click the event you want toacknowledge.
v If you have opened the event results workspace, right-click the event itemin the Navigator.
v In the event console view, right-click a row.2. Point to Acknowledge Event and click either Quick Acknowledge, to
acknowledge the event with the default settings, or Acknowledge to openthe Acknowledge window. A quick acknowledgement creates anacknowledgement with no expiration and inserts a time stamp, your user ID,and the statement, “Event quick acknowledged, ownership assigned” in theNotes field.
3. If you selected Acknowledge in the previous step, do any of the following:v Adjust the Expiration settings for the time when the acknowledgement
should expire. If you select Expire at a specific time, click the list box,adjust the year, month, or time, then click the expiration date to close thecalendar. Select Use Server time to use the time zone of the TivoliEnterprise Monitoring Server to which the monitoring agent is connected.
v Write notes about the event in the Add Notes text box. After you click Applyor OK, the text will be moved to the Notes area and preceded with a timestamp, your user ID, and the statement, “Event quick acknowledged,ownership assigned”.
v Attach a file that is applicable to the event by clicking Add an attachmentand selecting the file.
v If your environment includes an incident management agent, such as IBMInformation Management, and the event corresponds to an incident, enter theincident identifier in the Reference ID field, up to 32 characters.
4. When you are finished, save your notes and settings by clicking Apply to keepthe Acknowledgement window open or OK to close the window.
Chapter 4. Responding to events 55
Results
Any notes just written and attachments added are displayed in the Notes area,including the date and time each note was added, the user ID of the author, andhypertext links to the attachments.
What to do next
The acknowledged status of the event is indicated by the Acknowledgementicon in the event flyover list. The message log, situation event console, andcommon event console views also show "Acknowledged" in the Status column.When the event is closed, the acknowledgement is removed. If you want to reviewthe acknowledgement after it has been closed, you can access it through the viewof the Enterprise Status workspace. If the acknowledgement expires before theevent has been closed, the event status changes to Reopened.
Acknowledgement statusAfter you acknowledge an event, its status changes to Acknowledged and isdisplayed in several places.v Navigator item for the event (which is displayed when you open the Situation
Event Results workspace)v Situation flyover list at the end of the rowv Status column of the message log view, situation event console view, and in the
Enterprise Status workspace view named My Acknowledged Events.
The Acknowledged status changes to Closed when the situation is no longer true.
If the situation is still true when the acknowledgement expires, the status willchange to Expired. If the situation is still true and you cancel your ownership(remove acknowledgement) the status will change to Reopened.
Although you can acknowledge a pure event, the acknowledgement does not stopthe arrival of more pure events.
EnterpriseUNIX Systems
BigComputerOracle
Cache TotalsOracle_Library_Reloads_Pct_Crit
More...More...
More...
Reviewing the acknowledgement and adding notesAbout this task
The Acknowledgement feature includes a window for adding notes about theevent and for attaching files. You can review all the notes that have been writtenduring the lifetime of an open event, including notes that were added before theacknowledgement expired and those that are added automatically when anacknowledgement is removed. And you can append notes and attachments at anytime.
56 IBM Tivoli Monitoring: Tivoli Enterprise Portal User's Guide
Procedure1. Do one of the following:
v Move the mouse pointer over an event indicator (such as or ) in theNavigator view to open the flyover list of open events, then right-click theacknowledged event.
v If you have opened the event results workspace, right-click the event itemin the Navigator.
v In the situation event console view, right-click a row where the Status showsas Acknowledged.
v In the Enterprise Status workspace, right-click a row in the MyAcknowledged Events view.
2. Click Event Notes
Results
The Event Notes window opens for you to review and add notes for this event.You can also attach files.
What to do next
You can open the window to review the notes and open attachments for the eventat any time, event after the event has been closed.
Adding notes to an acknowledged eventAbout this task
You can add notes when you acknowledge an event or after an acknowledgementhas been created (but not to events that are in the Open or Closed state) by you oranother user. Notes enable you to communicate what steps you have taken thus farto resolve the event or to provide details on the steps you believe must be taken.
Procedure1. Do one of the following:
v Move the mouse pointer over an event indicator (such as or ) in theNavigator view to open the flyover list of open events, then right-click theacknowledged event.
v If you have opened the event results workspace, right-click the event itemin the Navigator.
v In the situation event console view, right-click a row where the Status showsas Acknowledged.
v In the Enterprise Status workspace, right-click a row in the MyAcknowledged Events view.
2. Click Event Notes. The Event Notes window opens for you to review andadd notes for this event. You can also attach files.
Results
You can continue to open the window to review the notes and open attachmentsfor the event at any time, event after the event has been closed. This is donethrough the pop-up menu of the view.
Chapter 4. Responding to events 57
Removing an acknowledgementAbout this task
If you acknowledged a situation event and must release your ownership before theacknowledgement has expired or the event has closed, you can remove theacknowledgement from the event.
Procedure1. Do one of the following:
v Move the mouse over an event indicator (such as or ) in the Navigatorview to open the flyover list of open events, then right-click theacknowledged event.
v If you have opened the event results workspace, right-click theacknowledged event item in the Navigator.
v In the situation event console view, right-click a row where the status isAcknowledged.
v In the Enterprise Status workspace, right-click a row in the MyAcknowledged Events view.
2. Click Acknowledge Event > Remove Acknowledgement. Removing theacknowledgement changes the event status to Reopened and removes the userID from the Owner column.A time stamp and user information is attached to the event as a note, alongwith an audit note signifying that the acknowledgement was removed.
Closing a situation eventWhen the condition of a situation is met, the situation becomes true and an eventindicator is displayed over the system name and all related items in the Navigator.For pure events, you can turn off the indicator by closing the event. The situationcontinues to run but the indicator disappears until another pure event takes place.
Before you begin
In closing an event, you also have the opportunity to add notes and attachments toexplain what action you took to resolve it. This can be helpful should a similarevent occur in the future. If the event was not previously assigned to an owner, theuser who closes it is assigned as the owner.
To use this function, your user ID must have Close permission for Events.
About this task
Pure events are indicated in the Type column of the message log view andsituation event console view. As well as closing pure events, you can also closeevents of sampled attributes if the situation has been stopped or deleted. Close anevent from any of the following locations:
Procedurev Situation flyover list: From the event flyover list, do the following to close a
pure event or one whose situation has been stopped or deleted:1. In the Navigator, move the mouse pointer over the event indicator to open a
flyover listing of the true situations.
58 IBM Tivoli Monitoring: Tivoli Enterprise Portal User's Guide
2. In the flyover list, right-click the situation whose pure event you want toclose or the situation that has been stopped or deleted and whose event youwant to close.
3. Click Close Event → Close Situation Event or Close Event → CloseSituation Event with Notes.
v Event Navigator item: From the Navigator item for an event, do the followingto close a pure event:1. In the Navigator, move the mouse over the event indicator to open a flyover
listing of the true situations.2. In the flyover list, click a situation name to open its event results workspace.
The Navigator focus moves to the event location and shows the situationname, and its event results workspace opens.
3. In the Navigator, right-click the event item and click Close Event →Close Situation Event or Close Event → Close Situation Event with Notes.
v Situation event console view: From the situation event console view, do thefollowing to close a pure event or one whose situation has been stopped ordeleted:1. In the workspace where the situation event console view displays, right-click
the pure event (or the situation that has been stopped or deleted) you wantto close. Pure events are indicated by Expand in the first cell and Pure inthe Type cell of the event row.
2. Click one of the following options:– Close Event→ Close Situation Event
– Close Event > Close Situation Event with Notes
Results
The indicator disappears until another pure event arrives.
What to do next
Here are some notes about what you can and cannot do after an event has beenclosed:v If you close an event, you cannot acknowledge it.v You can open the notes and any attachments for a closed event through the
pop-up menu of the view.v If you know you need to take an action that will trigger an event, such as
stopping an application, but you do not want notification, you can takepreemptive measures to stop an event from opening: You can stop the situationthen restart it when you want it to begin running again; or, if you can schedulethe time when you don't want the situation to run, you can add a timeexpression to the situation.
Turning off the soundWhen an event is opened for a situation that has a WAV file assigned, the soundplays while the event is open.
Procedurev To turn the sound off, click Turn Sound OFF.v To turn the sound back on, click Turn Sound ON.
Chapter 4. Responding to events 59
What to do next
Use your Windows Sound and Audio Devices or Multimedia utility, accessiblefrom the Control Panel, to adjust the volume of event sounds.
Event reportingFor situations that are associated with Navigator items, alert indicators aredisplayed whenever an event is opened. Several workspace views are alsoavailable for displaying situation and event status.
Event views present alternatives to event indicators in the Navigator. Message logand situation event console views update automatically to show new events asthey arrive and changes in event status as they occur. Graphic views give you apictorial alternative to the Navigator for indicating alerts.Related tasks:“Adding a graphic view” on page 139“Adding a message log view” on page 135“Adding a situation event console view” on page 145“Adding a common event console view” on page 150“Adding a Tivoli Enterprise Console event viewer” on page 156“Adding a Universal Message Console view” on page 138
60 IBM Tivoli Monitoring: Tivoli Enterprise Portal User's Guide
Chapter 5. Customizing workspaces
Your Tivoli Enterprise Portal product comes with a set of predefined workspacesfor every item in the Navigator Physical view. You can use these as a starting pointfor creating and customizing new workspaces to suit your environment.
Custom workspace options and guidelinesThe Tivoli Enterprise Portal has over a dozen types of views that you can populatea workspace with. Over half of the views are query-based and have a number ofembellishments that you can use to observe potential and existing thresholdconditions and other metrics.
Workspace changes
You can make these types of changes to a workspace:v Split a view horizontally or vertically into two separate views.v Change the dimensions of the views by dragging the borders between them.v Rearrange views by clicking a view's title bar and dragging it another view
space. When you release the mouse button, the views switch position.v Maximize the view and, if you like, save the workspace while it is still
full-screen.v Change a view to a different type, such as from a pie chart to a gauge.v Edit the workspace properties, such as to make it the default workspace.v Edit the properties of the individual views to control their styles and, in table
and chart views, what data they display.v Build a link to another workspace so that you can jump to it from this one
quickly.v Save a copy of the current workspace and edit the copy.
Any changes you make to a workspace are available only to you; no one else willsee your changes. The exception is with workspaces that were updated by anadministrator while in workspace administration mode, where the changes to thatworkspace are shared with all users who log on to the same portal server.
Predefined workspaces are protected from editing. You must use File > Save As tocreate your own copy for customization.
Design guidelines
These are the changes you can make to a workspace that are saved with it:v Display a view full screen.v Resize views by dragging the borders.v Swap location with another view by dragging by its title bar to the new
position.v Workspace link definitions.v Arrange the order of workspaces in the workspace gallery. This gets saved with
all workspaces for a Navigator item.
© Copyright IBM Corp. 2005, 2012 61
Here are some guidelines to help you plan workspaces:v Tailor the content of a workspace to the Navigator level: Workspaces at the top
of the hierarchy can show summary information; those at lower levels canprovide more in-depth information.
v Provide summary information at the agent level of the Navigator Physical view.v Use custom queries that pre-filter the data used in a table or chart to ensure
fastest data retrieval and that you see no extraneous data. And use as fewdifferent queries as possible in one workspace.
v Design for a specific monitor resolution. If you are creating in workspaceadministration mode for multiple users, use 1024 x 768, which is the lowestresolution on which the Tivoli Enterprise Portal can run.
v Do not crowd too much information in one workspace. Instead, have multipleworkspaces at one level or links from one workspace to the next.
v For table views with many columns, arrange them so the important ones arevisible. Consider removing some columns by pre-filtering (Properties - Query) orpost-filtering (Properties - Filters).
v Consider combining tables with charts in a workspace for the most effectivestyle layout.
Tipsv If you edit a predefined workspace or one created in administration mode, you
can restore the original through File > Restore Original Workspace. Thecustomized version is overwritten by the original. If you want to keep both thecustomized workspace and the original, save the customized workspace with anew name before restoring the original.
v The managed systems available for reporting are those assigned to the Navigatoritem. If you are not sure which are assigned, select the Navigator item,right-click the item, and click Properties.
v The CLI has several tacmds specific to workspaces:deleteWorkspace to delete a workspace by its objectid from the TivoliEnterprise Portal ServerlistWorkspaces to list all of the workspaces, including objectid, on the portalserverexportWorkspaces to export one or more portal workspace definitions to afileimportWorkspaces to import the workspaces definitions in a file into theportal server
Workspace Author Mode permission
Your user ID requires Workspace Author Mode permission to create and maintainworkspaces, including links. If the main toolbar is disabled (except Refresh, Back,Forward and Stop), as well as the split and remove buttons on the view title bar,you do not have this permission.
Tutorial: Defining a workspaceUse the tutorial to get hands on practice and experience defining a workspace.
In the following exercises you will add new views to an undefined workspace,tailor them with the Properties editor, save the workspace, and, finally, edit theworkspace properties.
62 IBM Tivoli Monitoring: Tivoli Enterprise Portal User's Guide
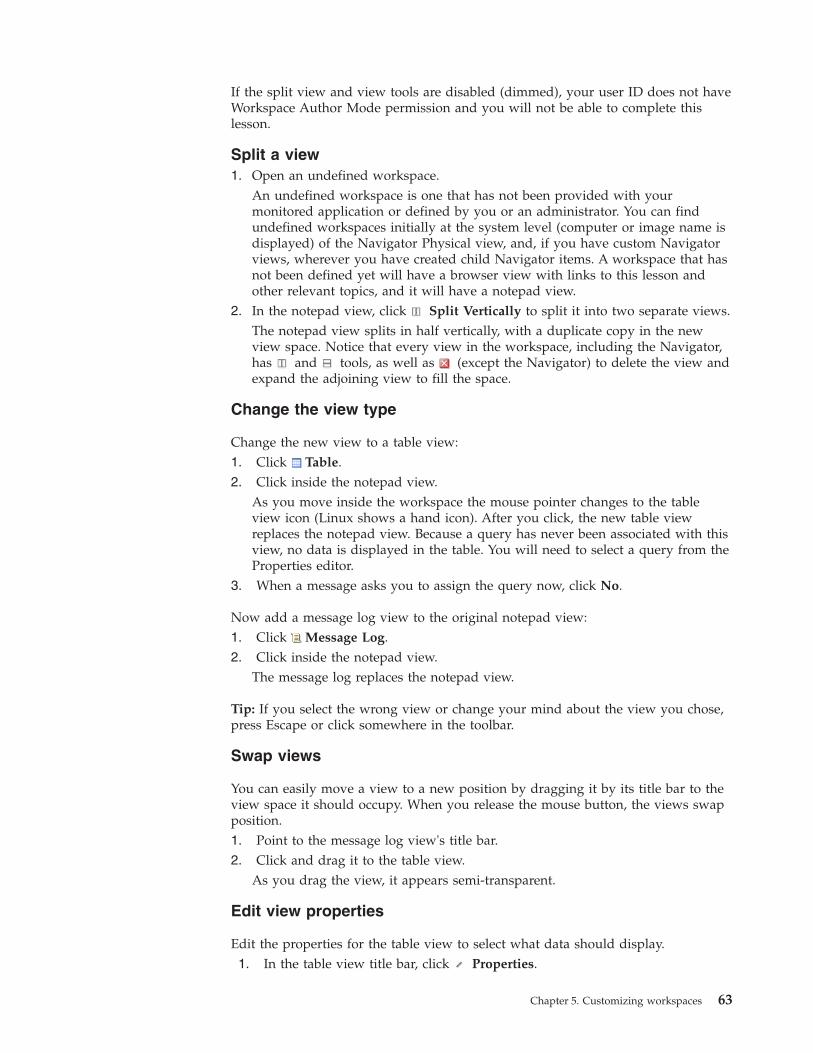
If the split view and view tools are disabled (dimmed), your user ID does not haveWorkspace Author Mode permission and you will not be able to complete thislesson.
Split a view1. Open an undefined workspace.
An undefined workspace is one that has not been provided with yourmonitored application or defined by you or an administrator. You can findundefined workspaces initially at the system level (computer or image name isdisplayed) of the Navigator Physical view, and, if you have custom Navigatorviews, wherever you have created child Navigator items. A workspace that hasnot been defined yet will have a browser view with links to this lesson andother relevant topics, and it will have a notepad view.
2. In the notepad view, click Split Vertically to split it into two separate views.The notepad view splits in half vertically, with a duplicate copy in the newview space. Notice that every view in the workspace, including the Navigator,has and tools, as well as (except the Navigator) to delete the view andexpand the adjoining view to fill the space.
Change the view type
Change the new view to a table view:1. Click Table.2. Click inside the notepad view.
As you move inside the workspace the mouse pointer changes to the tableview icon (Linux shows a hand icon). After you click, the new table viewreplaces the notepad view. Because a query has never been associated with thisview, no data is displayed in the table. You will need to select a query from theProperties editor.
3. When a message asks you to assign the query now, click No.
Now add a message log view to the original notepad view:1. Click Message Log.2. Click inside the notepad view.
The message log replaces the notepad view.
Tip: If you select the wrong view or change your mind about the view you chose,press Escape or click somewhere in the toolbar.
Swap views
You can easily move a view to a new position by dragging it by its title bar to theview space it should occupy. When you release the mouse button, the views swapposition.1. Point to the message log view's title bar.2. Click and drag it to the table view.
As you drag the view, it appears semi-transparent.
Edit view properties
Edit the properties for the table view to select what data should display.1. In the table view title bar, click Properties.
Chapter 5. Customizing workspaces 63
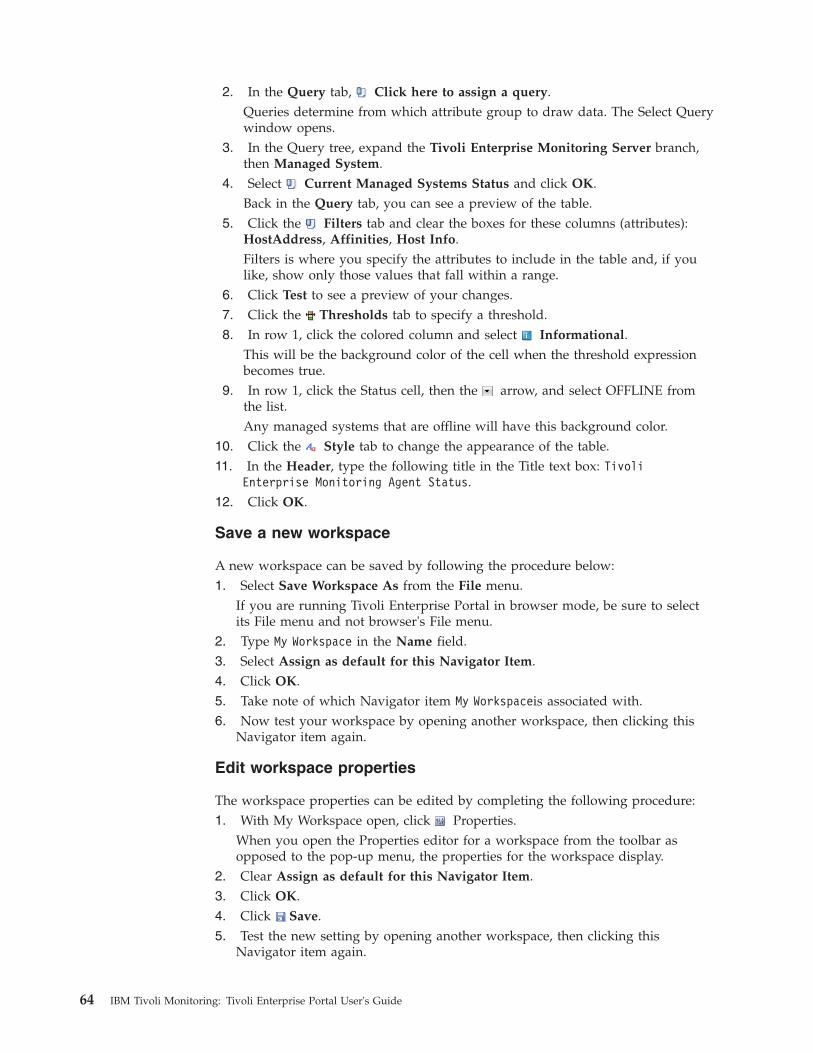
2. In the Query tab, Click here to assign a query.Queries determine from which attribute group to draw data. The Select Querywindow opens.
3. In the Query tree, expand the Tivoli Enterprise Monitoring Server branch,then Managed System.
4. Select Current Managed Systems Status and click OK.Back in the Query tab, you can see a preview of the table.
5. Click the Filters tab and clear the boxes for these columns (attributes):HostAddress, Affinities, Host Info.Filters is where you specify the attributes to include in the table and, if youlike, show only those values that fall within a range.
6. Click Test to see a preview of your changes.7. Click the Thresholds tab to specify a threshold.8. In row 1, click the colored column and select Informational.
This will be the background color of the cell when the threshold expressionbecomes true.
9. In row 1, click the Status cell, then the arrow, and select OFFLINE fromthe list.Any managed systems that are offline will have this background color.
10. Click the Style tab to change the appearance of the table.11. In the Header, type the following title in the Title text box: Tivoli
Enterprise Monitoring Agent Status.12. Click OK.
Save a new workspace
A new workspace can be saved by following the procedure below:1. Select Save Workspace As from the File menu.
If you are running Tivoli Enterprise Portal in browser mode, be sure to selectits File menu and not browser's File menu.
2. Type My Workspace in the Name field.3. Select Assign as default for this Navigator Item.4. Click OK.5. Take note of which Navigator item My Workspaceis associated with.6. Now test your workspace by opening another workspace, then clicking this
Navigator item again.
Edit workspace properties
The workspace properties can be edited by completing the following procedure:1. With My Workspace open, click Properties.
When you open the Properties editor for a workspace from the toolbar asopposed to the pop-up menu, the properties for the workspace display.
2. Clear Assign as default for this Navigator Item.3. Click OK.4. Click Save.5. Test the new setting by opening another workspace, then clicking this
Navigator item again.
64 IBM Tivoli Monitoring: Tivoli Enterprise Portal User's Guide
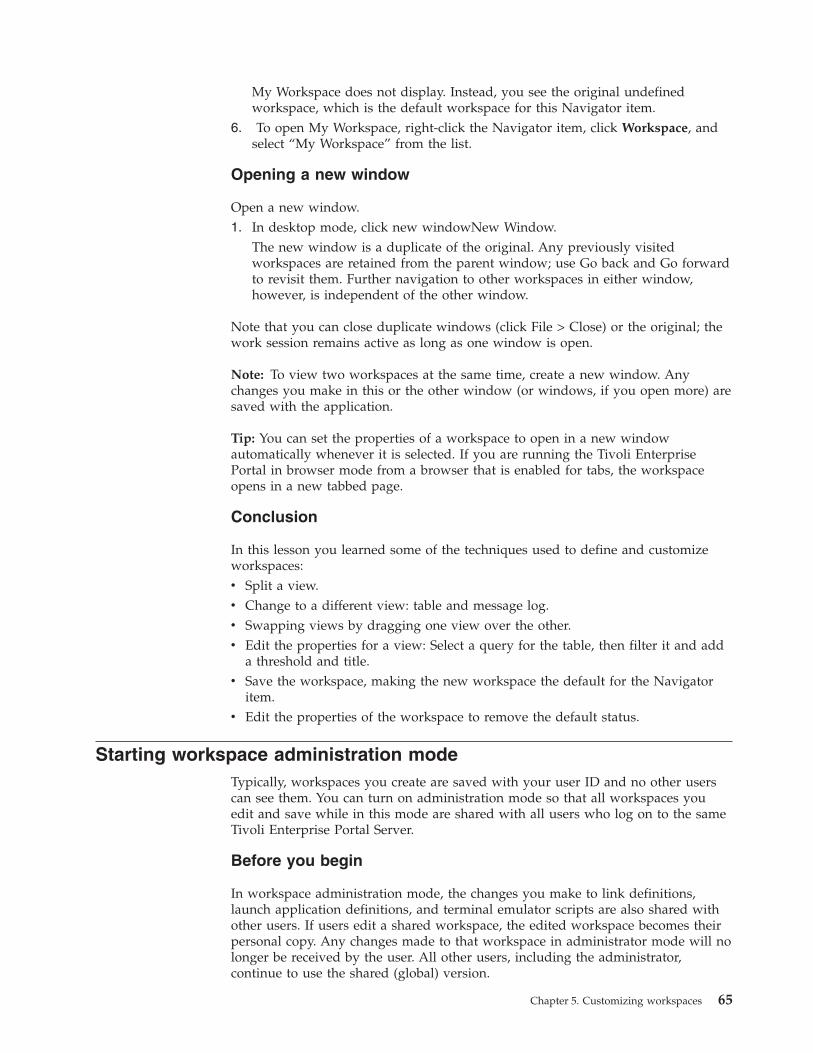
My Workspace does not display. Instead, you see the original undefinedworkspace, which is the default workspace for this Navigator item.
6. To open My Workspace, right-click the Navigator item, click Workspace, andselect “My Workspace” from the list.
Opening a new window
Open a new window.1. In desktop mode, click new windowNew Window.
The new window is a duplicate of the original. Any previously visitedworkspaces are retained from the parent window; use Go back and Go forwardto revisit them. Further navigation to other workspaces in either window,however, is independent of the other window.
Note that you can close duplicate windows (click File > Close) or the original; thework session remains active as long as one window is open.
Note: To view two workspaces at the same time, create a new window. Anychanges you make in this or the other window (or windows, if you open more) aresaved with the application.
Tip: You can set the properties of a workspace to open in a new windowautomatically whenever it is selected. If you are running the Tivoli EnterprisePortal in browser mode from a browser that is enabled for tabs, the workspaceopens in a new tabbed page.
Conclusion
In this lesson you learned some of the techniques used to define and customizeworkspaces:v Split a view.v Change to a different view: table and message log.v Swapping views by dragging one view over the other.v Edit the properties for a view: Select a query for the table, then filter it and add
a threshold and title.v Save the workspace, making the new workspace the default for the Navigator
item.v Edit the properties of the workspace to remove the default status.
Starting workspace administration modeTypically, workspaces you create are saved with your user ID and no other userscan see them. You can turn on administration mode so that all workspaces youedit and save while in this mode are shared with all users who log on to the sameTivoli Enterprise Portal Server.
Before you begin
In workspace administration mode, the changes you make to link definitions,launch application definitions, and terminal emulator scripts are also shared withother users. If users edit a shared workspace, the edited workspace becomes theirpersonal copy. Any changes made to that workspace in administrator mode will nolonger be received by the user. All other users, including the administrator,continue to use the shared (global) version.
Chapter 5. Customizing workspaces 65
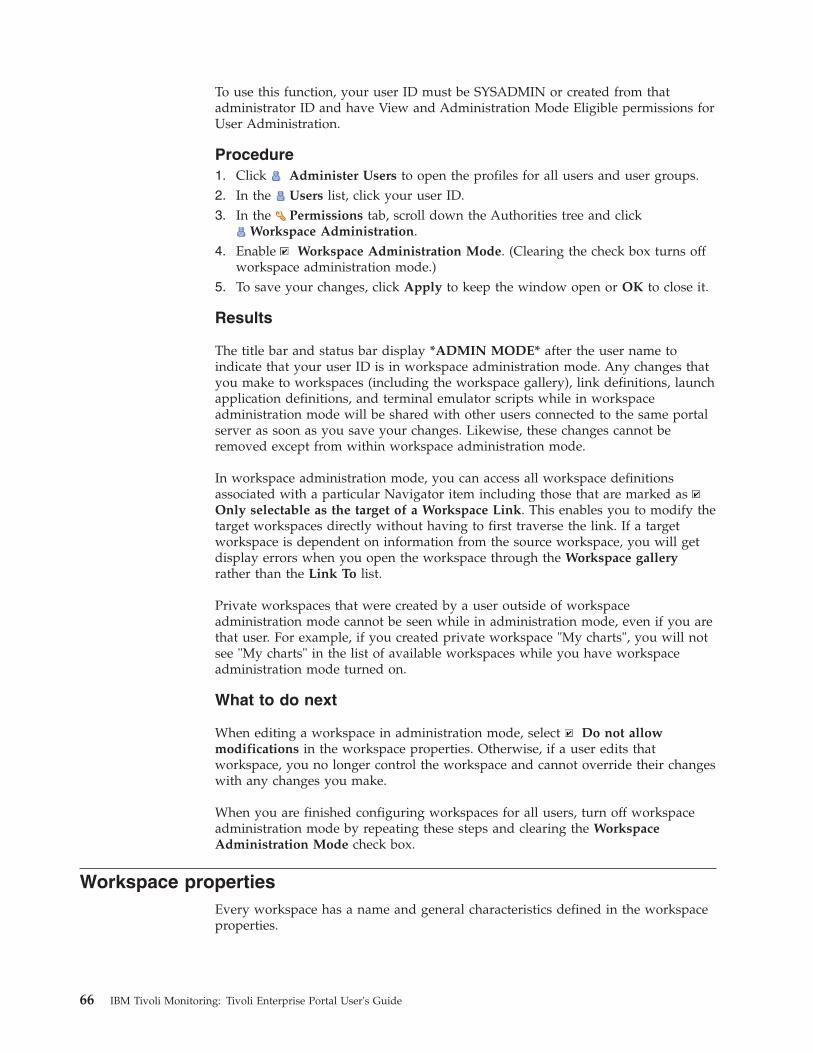
To use this function, your user ID must be SYSADMIN or created from thatadministrator ID and have View and Administration Mode Eligible permissions forUser Administration.
Procedure1. Click Administer Users to open the profiles for all users and user groups.2. In the Users list, click your user ID.3. In the Permissions tab, scroll down the Authorities tree and click
Workspace Administration.4. Enable Workspace Administration Mode. (Clearing the check box turns off
workspace administration mode.)5. To save your changes, click Apply to keep the window open or OK to close it.
Results
The title bar and status bar display *ADMIN MODE* after the user name toindicate that your user ID is in workspace administration mode. Any changes thatyou make to workspaces (including the workspace gallery), link definitions, launchapplication definitions, and terminal emulator scripts while in workspaceadministration mode will be shared with other users connected to the same portalserver as soon as you save your changes. Likewise, these changes cannot beremoved except from within workspace administration mode.
In workspace administration mode, you can access all workspace definitionsassociated with a particular Navigator item including those that are marked asOnly selectable as the target of a Workspace Link. This enables you to modify thetarget workspaces directly without having to first traverse the link. If a targetworkspace is dependent on information from the source workspace, you will getdisplay errors when you open the workspace through the Workspace galleryrather than the Link To list.
Private workspaces that were created by a user outside of workspaceadministration mode cannot be seen while in administration mode, even if you arethat user. For example, if you created private workspace "My charts", you will notsee "My charts" in the list of available workspaces while you have workspaceadministration mode turned on.
What to do next
When editing a workspace in administration mode, select Do not allowmodifications in the workspace properties. Otherwise, if a user edits thatworkspace, you no longer control the workspace and cannot override their changeswith any changes you make.
When you are finished configuring workspaces for all users, turn off workspaceadministration mode by repeating these steps and clearing the WorkspaceAdministration Mode check box.
Workspace propertiesEvery workspace has a name and general characteristics defined in the workspaceproperties.
66 IBM Tivoli Monitoring: Tivoli Enterprise Portal User's Guide
When you save a new workspace with File → Save Workspace As, clickProperties, or, if the Properties editor is already open, click the top item in the treeto see the workspace properties.
Workspace Identity
Name The title of the workspace. The workspace name is displayed in thetitle bar or browser mode banner, in the View → Workspace list, orin the Link To list menu, depending on how you have set theworkspace options (see below). Do not use an & ampersand or #pound sign in the title.
DescriptionOptional. The description can be a full text description of theworkspace.
Workspace Options
Assign as default for this Navigator ItemMakes this workspace the default for the Navigator item (the onethat opens when you click the Navigator item).
Assign as Home WorkspaceSpecifies this as the workspace that opens whenever you startTivoli Enterprise Portal, much like your browser home page.
Do not allow modificationsProtects the workspace from permanent changes and must beselected when you are editing in Workspace administration mode.Users who have access to this workspace can change it temporarily,but if they attempt to save, the Save Workspace As windowopens so that it is saved as a new workspace with a differentname. Also, when this item is enabled you cannot delete theworkspace.
Only selectable as the target of a Workspace LinkMarks the workspace as hidden except when it is a possible LinkTo destination. The workspace does not display in the list ofavailable workspaces for a Navigator item.
Always open workspace in new windowWhen enabled, this option causes the workspace to open in a newwindow, or in a new tab if your browser supports tabbed pages.
Creating a new workspaceYou can create a new workspace from any existing workspace. The new workspaceis associated with the same Navigator item as the original workspace. Youcannot save a new workspace if your user ID does not have Workspace AuthorMode permission.
About this task
To create a new workspace:
Procedure1. Open a workspace at the Navigator level for which you want the new
workspace to be available.2. Click Save Workspace As in the File menu.
Chapter 5. Customizing workspaces 67
3. Type a name for the new workspace. The workspace is saved with the newname and the original left unchanged.
4. Do any of the following to customize the workspace:v Add a new view by splitting an existing view into two separate views.v Change the dimensions of the views by dragging the borders between them.v Change a view to a different type, such as from a notepad view to a browser
view.v Rearrange views by clicking a view's title bar and dragging it another view
space. When you release the mouse button, the views switch position.v Edit the general Properties of the workspace, such as making it the
default workspace.v Edit the Properties of the individual views to control what data to display
and the styling.v Build a link to another workspace so that you can link to the other
workspace from this one at any time.5. When you are finished editing a workspace, click Save. The saved
workspace is associated with your Tivoli Enterprise Portal user ID. Users witha different ID will not see your changes.The workspace is available to all systems with items of the same affinity. Forexample, if you create a new workspace for your Windows agent then allsystems with that monitoring agent will be able to open the new workspace.
Saving a workspaceYou must save a workspace to maintain the changes you make to the workspaceproperties; otherwise, the changes you have made are lost.
Before you begin
Your user ID requires Workspace Author Mode permission to create and maintainworkspaces, including links. If the main toolbar is disabled (except Refresh, Back,Forward and Stop), as well as the split and remove buttons on the view title bar,you do not have this permission.
About this task
Whatever changes you make to the workspace properties, such as adding a viewor defining a link, are only temporary. They will be lost when you open anotherworkspace or exit Tivoli Enterprise Portal unless you save the workspace.
The saved workspace is associated with your Tivoli Enterprise Portal user ID.Users with a different ID will not see your changes unless you were in workspaceadministration mode when you authored them.
Procedurev To save the current workspace, click Save.v To save the current workspace as a new workspace and leave the original
unchanged, click File > Save Workspace As, type a name for the newworkspace, check any of the workspace options that you want to apply, andclick OK. The workspace is saved with the name and options you specify, and isavailable to all systems with items of the same type. For example, if you create anew workspace for your Windows agent then all systems with that monitoringagent will be able to open the new workspace.
68 IBM Tivoli Monitoring: Tivoli Enterprise Portal User's Guide
Editing a workspaceUse the Properties editor to change the general characteristics of a workspace andto edit the style and content of any of its views. You can delete or restore theoriginal version of an edited workspace through the File menu.
Before you begin
To edit a workspace, your user ID must have Workspace Author Mode permission.
About this task
To edit a workspace:
Procedure1. Open the workspace that you want to edit, then click Properties. The
Properties editor opens. The tree on the left shows the workspace nameselected, with the workspace properties on the right.
2. Make any changes to the Workspace Identity and Workspace Options. You canalways return to the general workspace properties by clicking the name of theworkspace at the top of the Properties tree.
3. If you want to edit the properties for a particular view, select the view from theProperties tree.
4. When you are finished editing the workspace or view, do one of the following:v Click Apply to save your changes, then select another view to edit from the
Properties tree.v Click OK to save your changes and close the Properties editor.
5. If you want to keep the changes you made for future work sessions, do one ofthe following:v Click Save to update the workspace properties with the changes you just
made.v Click File > Save Workspace As to save this as a new workspace and leave
the original workspace unchanged.
Results
Changes you make to a workspace are available only to your user ID; no otherusers will see your changes. The exception is when you are in workspaceadministration mode, where any workspace customization you do will be availableto all users.
Renaming a workspaceYou can rename a workspace to better suit your environment.
About this task
Use the following steps to rename a workspace:
Procedure1. Open the workspace whose name you want to change.
Chapter 5. Customizing workspaces 69
2. Click Properties. You can also open the Workspace properties from withinthe Properties editor by selecting the first item in the tree, which is theNavigator item to which the workspace belongs.
3. Edit the title in the Name text box.
Deleting or restoring a workspaceYou can delete a workspace of your creation and restore the original version of apredefined workspace or one created by the administrator.
Before you begin
To delete or restore a workspace, your user ID must have Workspace AuthorMode permission.
About this task
Tivoli Enterprise Portal features enable you to create and edit your ownworkspaces. You can also edit predefined workspaces and those created by thesystem administrator (unless they are protected).
Deleting a workspaceAbout this task
Use the following steps to delete a workspace:
Procedure1. Open the workspace you want to delete. You cannot delete predefined
workspaces. As well, you cannot delete workspaces that were created inworkspace administration mode unless you are currently in workspaceadministration mode.
2. Click File > Delete Workspace. This item is disabled if the workspace ispredefined, was created in administration mode and your user ID is notcurrently in workspace administration mode, or if the workspace propertiesitem Do Not Allow Modifications is selected.
Note: When you delete a workspace, all link definitions that reference it will bedeleted also.
3. When a confirmation message is displayed, click Yes to delete the currentworkspace or No if you change your mind. The default workspace for thatNavigator item displays.
Restoring the original workspaceAbout this task
If you have edited a predefined workspace or one created in administration mode,you can always restore the original version. To restore the original workspace,complete the following procedure:
Procedure1. Open the predefined or administration-mode-created workspace you want to
restore. If you want to retain the original and edited versions as two separateworkspaces, select Save As from the File menu and give the workspace a newname, then repeat this step.
70 IBM Tivoli Monitoring: Tivoli Enterprise Portal User's Guide
2. Click File > Restore Original Workspace. This item is disabled if the originalpredefined or administrator-created workspace is already displaying or if this isa workspace created with your user ID.
3. When a confirmation message is displayed, click Yes to restore the originalworkspace or No if you change your mind. The workspace reverts to itsoriginal state.
Defining links between workspacesThe Tivoli Enterprise Portal enables you to define a link from one workspace toanother. Then you can quickly jump to a related workspace or a sequence ofworkspaces that you like to frequently review.
You can define a link from a Navigator item, or from a table, chart, graphic viewwithin a workspace. A link from a workspace or graphic view provides a shortcutfrom one workspace to another, as does a link from a table row (or chart dataseries). Links from a table row are different in that they can use data from one ormore values in the row to locate and filter the target workspace.
Your user ID requires Workspace Author Mode permission to create and maintainworkspaces, including links. If the view tools are disabled, you do not have thispermission.Related tasks:“Linking to a workspace” on page 40
Creating a new linkUse the link wizard to define a link from a Navigator item, graphic view, orquery-based view that opens the targeted workspace in the same or new windows.
Before you begin
The workspace link feature in the Tivoli Enterprise Portal enables you to createsimple links or advanced links. A simple link can originate from a Navigator itemor from a data series in a chart or table. Context information is passed from thesource workspace to determine which target workspace to open.
About this task
Complete these steps to create a new workspace link.
Procedure1. Create a new link:
a. Open the source workspace.b. Right-click one of the following possible link source locations:
The highlighted Navigator item for this workspaceAn icon in a graphic viewAn object in a Tivoli Management Services Infrastructure viewA row in a table view or situation event console viewA data point in a chart view
c. Click Link To > Link Wizard.d. Select Create a new link and click Next>.e. Type a Name and Description to identify the link, then click Next.
2. Select the link type and target:
Chapter 5. Customizing workspaces 71
a. Select one of the following link types and click Next to open the WorkspaceLink Wizard - Target Workspace window.
DynamicThe dynamic link method offers flexibility in your choice ofworkspace targets. A dynamic link is similar to a relative link and,with some link definitions, behaves in the same way. What isdifferent is that the path to the target workspace uses a systemidentifier passed by the source query-based view. The identifier canbe managed system name, IP address, host name, SystemsManagement Facilities ID, or Product Code.
AbsoluteAn absolute link stores the managed system name of the chosentarget, and goes only there. For example, if you target theDatabases Information workspace on the MS SQL Server branchfor the Paris computer, that is the workspace that will open. TheDatabase Information workspace for the Geneva computer is notconsidered.
Relative
A relative link stores the type of source workspace and targetworkspace. The resulting link is available from any workspace thatis of the same type. If more than one workspace fits the definitionof the target, you are presented with a list of workspaces to choosefrom. For example, a link built from the Paris computer's WindowsOS workspace to its Memory workspace will also be available fromthe Geneva computer's Windows OS workspace and link to itsMemory workspace.If you are linking between Navigator views,relative linking is not recommended. Instead, use the absolute ordynamic method for links to the Navigator Logical view and othercustom Navigator views.
b. If you are targeting a workspace in a different Navigator view, select theview from the Navigator View list.
c. In the Navigator tree, expand the branches and select the Navigator item forthe workspace you want to target. The Navigator view is presented in theleft frame. As you open branches and select Navigator items, the rightframe show their workspaces. With an absolute link, the path you select tothe target is interpreted as an exact match, whereas, with a relative ordynamic link the path is interpreted as the pattern to follow from the linksource to the target workspace.
d. In the Workspace pane, select the workspace to target; or, if this is adynamic link and you want to more generally classify the link, selectThis link does not target a specific workspace.
e. If you would like the workspace to open in a new window instead ofreplacing the current workspace, select Always open target workspace innew window. If you are running the browser client and your browsersupports tabbed pages, the workspace will open in a new tab.
f. Click Next or, if this is an absolute or relative link and you are finisheddefining the link target, click Next twice to see the the summary.
3. If this is an absolute or relative link and you want to refine the link definition,click Next and add the expressions.
4. If this is a dynamic link, the Target Filters window is displayed for you toselect the type of identifier for the target and specify the value to use:
72 IBM Tivoli Monitoring: Tivoli Enterprise Portal User's Guide
a. Click the identifier to use: Managed system name, Hostname (distributedsystems only), IP address (distributed systems only), or SMFID (z/OS-basedsystems only) If you are not sure which one to choose, click ManagedSystem name.
b. Click Modify Expression to open the Expression Editor, then click Symbol.The list is a reverse hierarchy of available symbols starting from thesource context and the current Navigator item and ending at the rootNavigator item.
c. Select a symbol that provides the value for the system identifier. Forexample, Server Name will provide the value needed for Managed systemname when the link is launched. You might need to open different branchesto locate a symbol for the type of target filter chosen.
Selected RowAttributes
% UsageCurrent Size
Server Named. Click OK add the detailed name for the attribute to the Expression Editor.
$kfw.TableRow:ATTRIBUTE.NTLOGINFO.ORIGINNODE$e. Click Evaluate to verify that the variable resolves correctly. The Value
shown must be valid for the identifier type you specified. For example, fora computer named TIVOLIUSER, Primary:TIVOLIUSER:NT is a validWindows OS managed system name and TIVOLIUSER is a valid host name.
f. If no value is displayed or you get a syntax error or a value that does notidentify the system, click Clear and select a different symbol or try anotheridentifier.
g. In addition to Symbol, you can click Operator and Function to find andselect other elements to complete the expression. When you are finishedwith the expression, click OK to insert the expression in the current targetfilter row. Note that expressions can evaluate to patterns using the asterisk(*) and question mark (?) wildcard characters. This allows for patternmatching filters.
h. If the target workspace was updated or is new for the latest version of yourmonitoring product and your environment has a mix of versions, you candisable Allow this link to target any version of the target workspace orleave it enabled:
Enabled is the default setting. The target workspace can be chosen forany version of the monitoring agent. If the query for a view specifiesattributes that are available only in the newer version and the targetworkspace is for an older version of the monitoring agent, no values will bereturned for those attributes. Disable the option if you want the link notto be offered for target workspaces on earlier versions of the monitoringagent.
i. Click Next and refine the link definition; or click Next twice and review thesummary.
5. In the Workspace Link Wizard - Summary page, review the summary, thenclick Finish to save the link definition, Back to return to a previous window tomake additional changes, or Cancel to close the Link Wizard without savingyour changes.
What to do next
If the target workspace is dependent on information that is passed from the sourceworkspace (users will get an error message if they attempt to open the workspace
Chapter 5. Customizing workspaces 73
from the list of available workspace), then edit the workspace properties to hidethe workspace unless it is targeted by a link definition.
Testing the linkYou can test the link you have created to ensure that it works correctly.
About this task
To test a link you have created:
Procedure1. In the source workspace, right-click the location where you created the link.2. Click Link To and select the link from the list. The value of the symbols
specified in the link definition are used to select the target workspace and filterits content. An example is a link from a row in a view that includes the ProcessName, and the value of Process Name is passed to the target workspace. Theview whose symbol was targeted will show information about that particularprocess.
3. If the target workspace does not display what you expected or a Target notfound message is displayed, edit the link.
Tip: If you were prompted to select the target workspace but wanted the linkdefinition to be specific so you would not have to choose from a list, do one oftwo things: If you had chosen Relative as the link type, define a new link andselect a link type of Absolute; or make it Dynamic and supply the expression inthe target filter to target the specific workspace.
Editing a link definitionYou can edit a link definition after it has been created.
Procedure1. Open the workspace where the link originates (source workspace).2. Right-click the link origination point, which can be one of the following:
v The highlighted Navigator item for this workspacev An icon in the graphic viewv A row in the table viewv A row in the situation event console viewv A bar in the bar chart viewv A slice in the pie chart viewv A point in the plot chart view
3. Click Link To > Link Wizard.4. In the Workspace Link Wizard - Welcome page, select Modify an existing
link and click Next>.5. In the Workspace Link Wizard - Link to Modify page, select the name of the
link to edit, then click Next>. Before clicking Next, you can clear the Hidelinks that are not available for the select view check box to see all the linksfor this workspace.
6. Edit the name or description, then click Next> to open the Link editor.7. Edit the link.8. Click Next until you reach the summary page, then click Finish.
74 IBM Tivoli Monitoring: Tivoli Enterprise Portal User's Guide
Deleting a link definitionYou can delete a link definition when it is no longer useful.
About this task
Follow these steps to permanently remove a link definition.
Procedure1. Open the source workspace.2. Right-click the link origination point, which can be one of the following:
v The highlighted Navigator item for this workspacev An icon in a graphic viewv An object in a TMS Infrastructure viewv A row in a table view or situation event console viewv A bar in a bar chart viewv A slice in a pie chart viewv A point in a plot chart view
3. Click Link To > Link Wizard.4. Select Delete one or more existing links and click Next.5. Select the name of the link to delete. You can select additional links with
Ctrl+Click or select all links from the first selection to this one with Shift+Click.6. Click Next until you reach the summary page, then click Finish
Note: When you delete a workspace, all link definitions that originate from itwill be deleted also. This is also true for any absolute links that target thisworkspace.
Adding or editing a link anchorYou can add or edit a link anchor by using the Link Anchor Properties editor tohide the link indicator, disable it for table rows that do not meet the link criteria,and to assign a different default link or no default link.
About this task
When you have a link that originates from a table row or a graphic view icon, alink indicator is displayed: Click to open the default link or to see and selectfrom a list of possible links.
Procedure1. Open the workspace where the link originates (source workspace).2. Right-click a table row or the graphic view icon where you originated the link.3. Click Link Anchor.4. In the Link Anchor Properties editor, select a default link from the list or select
(No Default). When you select the option to show the link indicator (next step),you can click the indicator to go directly to the default linked workspace or, ifno default link was assigned, to see and select from the list of available links.
5. Clear Show Link Indicator if you want no link indicator in the firstcolumn of the table or overlaying the graphic view icon. If you disable theindicator, users can still link to the target workspace by right-clicking a tablerow or the linked graphic view icon.
Chapter 5. Customizing workspaces 75
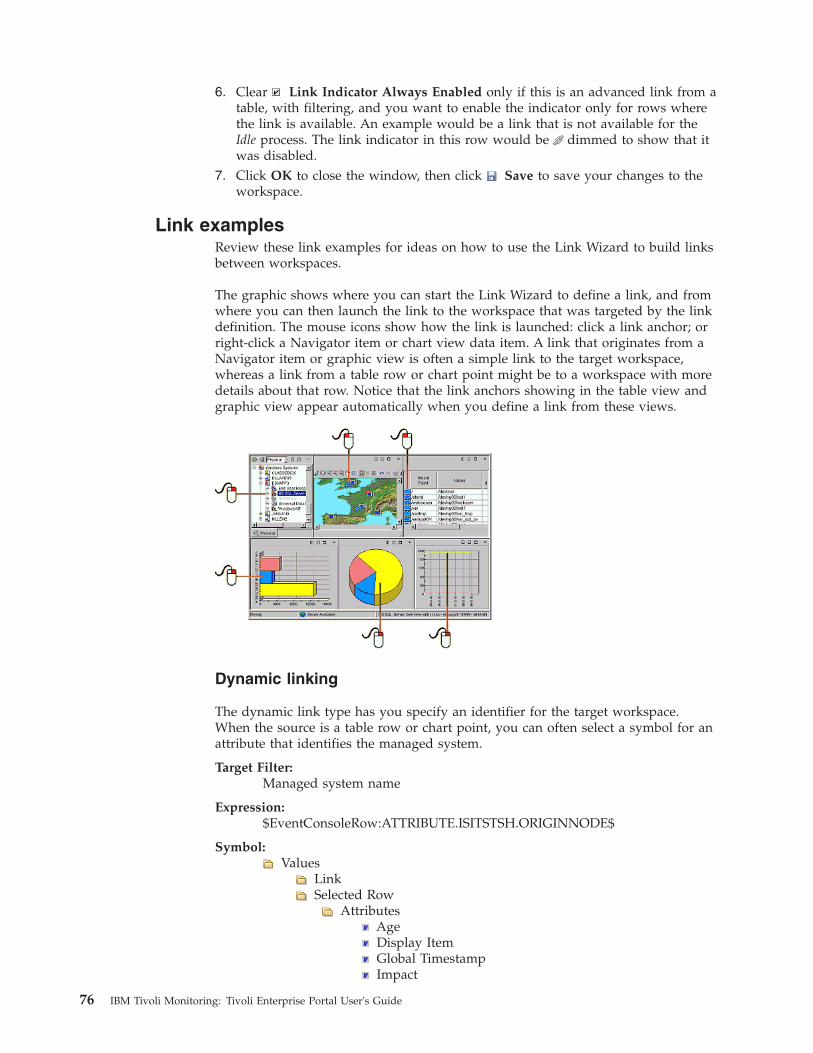
6. Clear Link Indicator Always Enabled only if this is an advanced link from atable, with filtering, and you want to enable the indicator only for rows wherethe link is available. An example would be a link that is not available for theIdle process. The link indicator in this row would be dimmed to show that itwas disabled.
7. Click OK to close the window, then click Save to save your changes to theworkspace.
Link examplesReview these link examples for ideas on how to use the Link Wizard to build linksbetween workspaces.
The graphic shows where you can start the Link Wizard to define a link, and fromwhere you can then launch the link to the workspace that was targeted by the linkdefinition. The mouse icons show how the link is launched: click a link anchor; orright-click a Navigator item or chart view data item. A link that originates from aNavigator item or graphic view is often a simple link to the target workspace,whereas a link from a table row or chart point might be to a workspace with moredetails about that row. Notice that the link anchors showing in the table view andgraphic view appear automatically when you define a link from these views.
Dynamic linking
The dynamic link type has you specify an identifier for the target workspace.When the source is a table row or chart point, you can often select a symbol for anattribute that identifies the managed system.
Target Filter:Managed system name
Expression:$EventConsoleRow:ATTRIBUTE.ISITSTSH.ORIGINNODE$
Symbol:Values
LinkSelected Row
AttributesAgeDisplay ItemGlobal TimestampImpact
76 IBM Tivoli Monitoring: Tivoli Enterprise Portal User's Guide
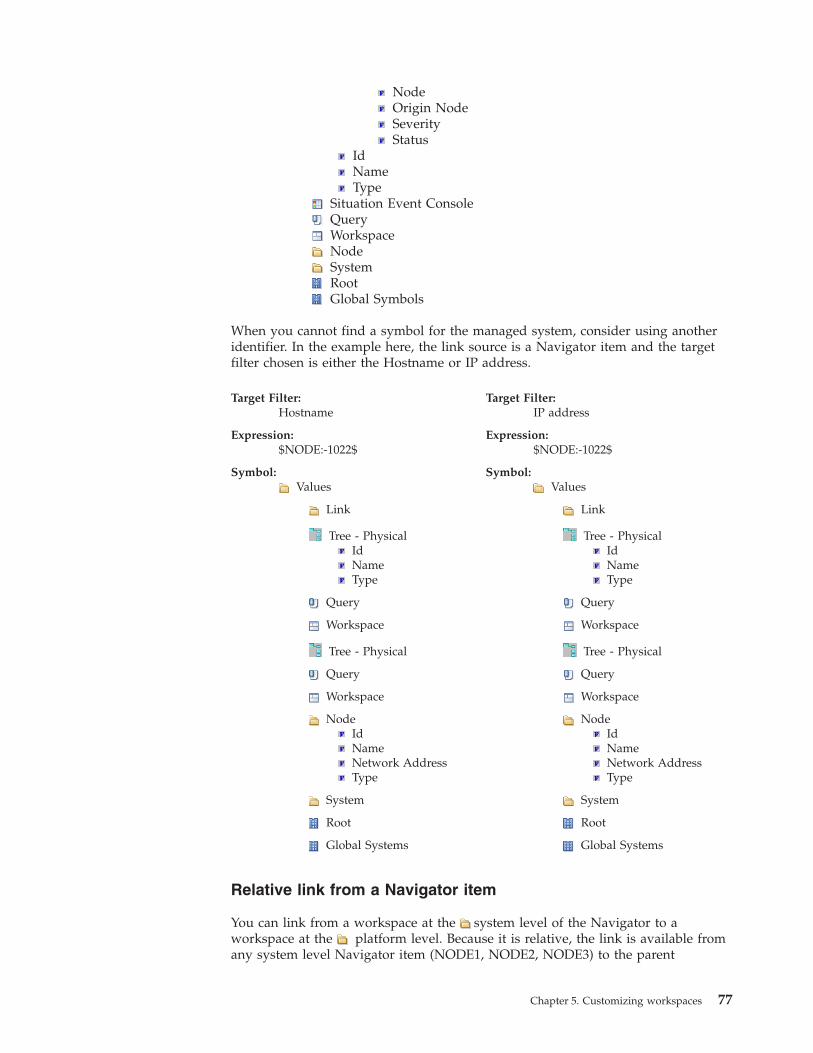
NodeOrigin NodeSeverityStatus
IdNameType
Situation Event ConsoleQueryWorkspaceNodeSystemRootGlobal Symbols
When you cannot find a symbol for the managed system, consider using anotheridentifier. In the example here, the link source is a Navigator item and the targetfilter chosen is either the Hostname or IP address.
Target Filter:Hostname
Expression:$NODE:-1022$
Symbol:Values
Link
Tree - PhysicalIdNameType
Query
Workspace
Tree - Physical
Query
Workspace
NodeIdNameNetwork AddressType
System
Root
Global Systems
Target Filter:IP address
Expression:$NODE:-1022$
Symbol:Values
Link
Tree - PhysicalIdNameType
Query
Workspace
Tree - Physical
Query
Workspace
NodeIdNameNetwork AddressType
System
Root
Global Systems
Relative link from a Navigator item
You can link from a workspace at the system level of the Navigator to aworkspace at the platform level. Because it is relative, the link is available fromany system level Navigator item (NODE1, NODE2, NODE3) to the parent
Chapter 5. Customizing workspaces 77
Windows Systems workspace. In an environment with many Windows systemsbeing monitored, this link enables a quick jump from the expanded branch to theparent workspace.
EnterpriseWindows Systems
NODE1NODE2NODE3
Source point:Any of the NODE Navigator items
Link Type:Relative
Target Workspace:Windows Systems > Windows Systems
Parameters:The expression is built automatically from the source context and theworkspace that was selected as the target.v contextIsAvailable:v $kfw.TreeAdapter:-1021A$ ==
$kfw.LinkSymbolsGroup:PBASED.SOURCE_CONTEXT.0.-1021A$ &&$kfw.Context:-5000$ &&
v $kfw.TreeAdapter:-1021A$ ==$kfw.LinkSymbolsGroup:PBASED.SOURCE_CONTEXT.3.-1021A$ &&$kfw.Context:-5000$
v linkIsEnabled: true
linkIsEnabled usage example
Follow along with these steps to see how a link to the System workspace wascreated using the linkIsEnabled symbol. This example tests the value of theProduct cell in the selected row to determine whether or not to offer the link onthat row.1. Open the Managed System Status workspace in the Navigator Physical view:
Click Enterprise to open the default workspace; right-click Enterpriseand click Workspace > Managed System Status.
2. Right-click a row in the Managed System Status table and click Link To >Link Wizard.
3. Create a new link, name it System Details, select a link type of Relative, andtarget the Windows Systems workspace.
4. Click Next to go to the Workspace Link Wizard - Parameters.5. Click thelinkIsEnabled row. The Expression box reads true.6. Click Modify Expression.7. In the Expression Editor, click Clear, and then click Symbol.8. In the Symbols list, select Product and click OK. The expression is
displayed as $kfw.INODESTS:ATTRIBUTE.INODESTS.PRODUCT$.9. Click Operator, select Equal and click OK to see the == operator.
10. Type "NT" at the end of the expression, which should then read,$kfw.INODESTS:ATTRIBUTE.INODESTS.PRODUCT$ == "NT".
78 IBM Tivoli Monitoring: Tivoli Enterprise Portal User's Guide
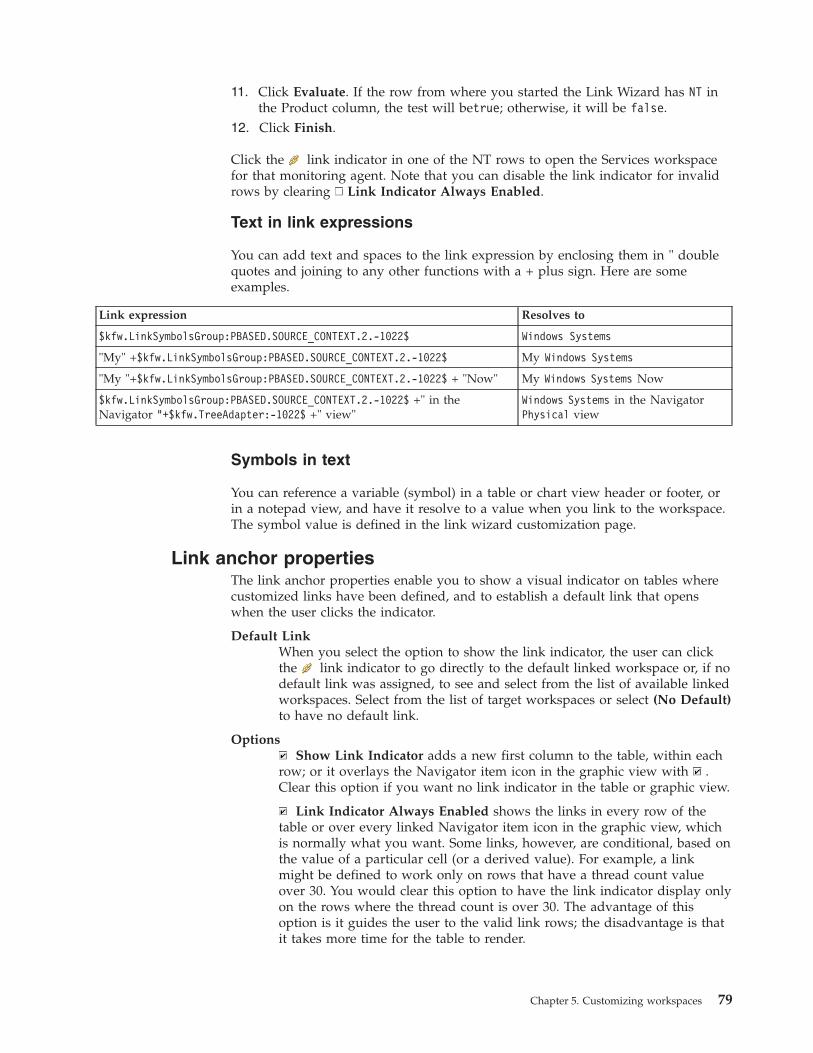
11. Click Evaluate. If the row from where you started the Link Wizard has NT inthe Product column, the test will betrue; otherwise, it will be false.
12. Click Finish.
Click the link indicator in one of the NT rows to open the Services workspacefor that monitoring agent. Note that you can disable the link indicator for invalidrows by clearing Link Indicator Always Enabled.
Text in link expressions
You can add text and spaces to the link expression by enclosing them in " doublequotes and joining to any other functions with a + plus sign. Here are someexamples.
Link expression Resolves to
$kfw.LinkSymbolsGroup:PBASED.SOURCE_CONTEXT.2.-1022$ Windows Systems
"My" +$kfw.LinkSymbolsGroup:PBASED.SOURCE_CONTEXT.2.-1022$ My Windows Systems
"My "+$kfw.LinkSymbolsGroup:PBASED.SOURCE_CONTEXT.2.-1022$ + "Now" My Windows Systems Now
$kfw.LinkSymbolsGroup:PBASED.SOURCE_CONTEXT.2.-1022$ +" in theNavigator "+$kfw.TreeAdapter:-1022$ +" view"
Windows Systems in the NavigatorPhysical view
Symbols in text
You can reference a variable (symbol) in a table or chart view header or footer, orin a notepad view, and have it resolve to a value when you link to the workspace.The symbol value is defined in the link wizard customization page.
Link anchor propertiesThe link anchor properties enable you to show a visual indicator on tables wherecustomized links have been defined, and to establish a default link that openswhen the user clicks the indicator.
Default LinkWhen you select the option to show the link indicator, the user can clickthe link indicator to go directly to the default linked workspace or, if nodefault link was assigned, to see and select from the list of available linkedworkspaces. Select from the list of target workspaces or select (No Default)to have no default link.
OptionsShow Link Indicator adds a new first column to the table, within each
row; or it overlays the Navigator item icon in the graphic view with .Clear this option if you want no link indicator in the table or graphic view.
Link Indicator Always Enabled shows the links in every row of thetable or over every linked Navigator item icon in the graphic view, whichis normally what you want. Some links, however, are conditional, based onthe value of a particular cell (or a derived value). For example, a linkmight be defined to work only on rows that have a thread count valueover 30. You would clear this option to have the link indicator display onlyon the rows where the thread count is over 30. The advantage of thisoption is it guides the user to the valid link rows; the disadvantage is thatit takes more time for the table to render.
Chapter 5. Customizing workspaces 79

80 IBM Tivoli Monitoring: Tivoli Enterprise Portal User's Guide
Chapter 6. Customizing workspace views
Tivoli Enterprise Portal workspaces can be customized to show different views.
The Tivoli Enterprise Portal workspaces can be composed of more than a dozendifferent views. There are query-based views for displaying the attribute valuesgathered by monitoring agents, event views for displaying events and their status,and a number of special purpose views.
Creating a new viewCreate a new view to customize a workspace to show the reports and otherinformation that give you a comprehensive view of your environment or particularaspects of it.
You can add as many views to a workspace as you can easily see within theconfines of the window. Creating a new view is a matter of dividing one view intotwo and editing one of them.
Before you begin
Your user ID must have Workspace Author Mode permission to use this function.
Procedure1. Open the workspace where you want the view.2. If you want the view to occupy a new space, click Split Vertically or
Split Horizontally in an existing view. The pane divides and a duplicate iscreated. If you split the Navigator, the new view is empty.If you want to replace a view with a different type of view, skip this step.
3. Click the tool for the type of view you want:. The mouse pointer changes to the view icon (hand icon on
Linux). If you get the wrong icon or decide not to add the view, press Escapeor click somewhere in the toolbar.
4. Click inside the space to adopt the new view. If this is a table or chart viewand no query has been chosen, or the query is inappropriate for the type ofchart, no data is displayed. You might be prompted to assign a query.
5. Some views require more information:v If the Select Attribute window opens, you replaced a table view with a chart
view, which can show only numeric attributes. Select an attribute (useCtrl+Click or Shift+Click to select more), then click OK.
v If you are adding a terminal view, enter the host name and port number inthe Terminal Emulator Configuration window.
6. Select Edit properties to open the Properties editor to change the content orformat. The tabs displayed depend on the type of view. The Tivoli EnterpriseConsole event viewer and the take action view have no associated properties.
7. As you edit the properties, click Test to see your changes in the Preview area atthe top of the window, Apply to save your changes and keep the window openfor selecting another view to edit, or OK to save your changes and close thewindow.
© Copyright IBM Corp. 2005, 2012 81
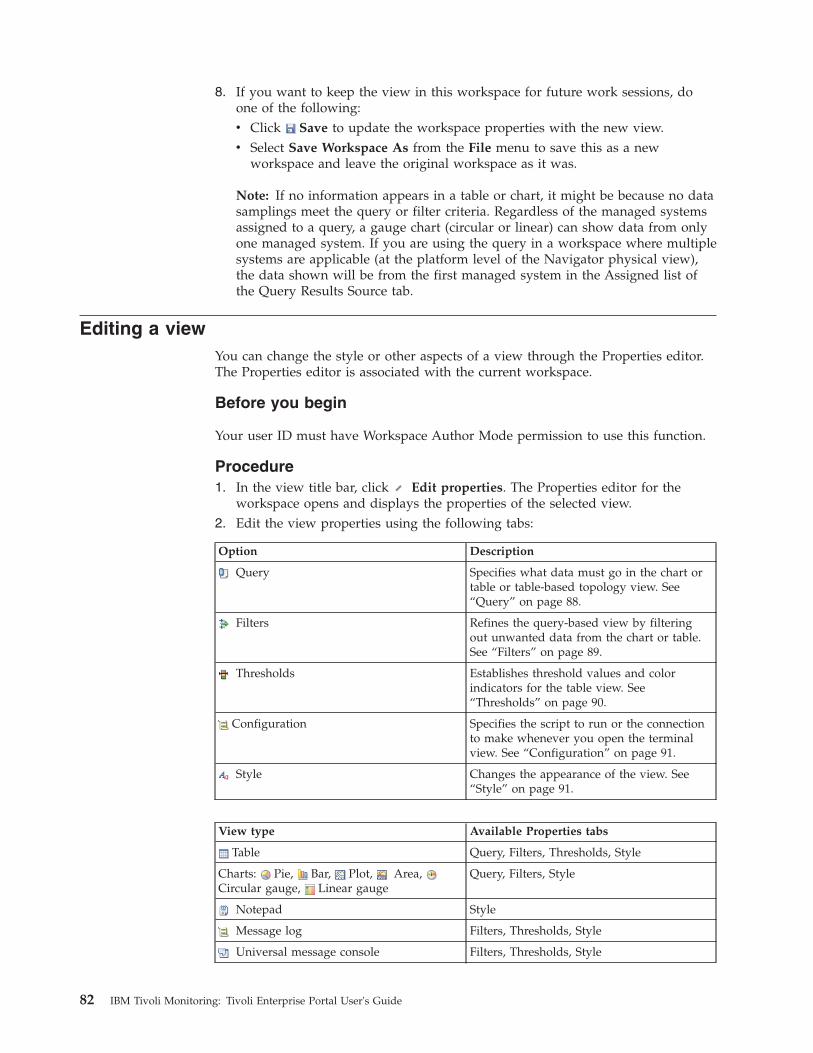
8. If you want to keep the view in this workspace for future work sessions, doone of the following:v Click Save to update the workspace properties with the new view.v Select Save Workspace As from the File menu to save this as a new
workspace and leave the original workspace as it was.
Note: If no information appears in a table or chart, it might be because no datasamplings meet the query or filter criteria. Regardless of the managed systemsassigned to a query, a gauge chart (circular or linear) can show data from onlyone managed system. If you are using the query in a workspace where multiplesystems are applicable (at the platform level of the Navigator physical view),the data shown will be from the first managed system in the Assigned list ofthe Query Results Source tab.
Editing a viewYou can change the style or other aspects of a view through the Properties editor.The Properties editor is associated with the current workspace.
Before you begin
Your user ID must have Workspace Author Mode permission to use this function.
Procedure1. In the view title bar, click Edit properties. The Properties editor for the
workspace opens and displays the properties of the selected view.2. Edit the view properties using the following tabs:
Option Description
Query Specifies what data must go in the chart ortable or table-based topology view. See“Query” on page 88.
Filters Refines the query-based view by filteringout unwanted data from the chart or table.See “Filters” on page 89.
Thresholds Establishes threshold values and colorindicators for the table view. See“Thresholds” on page 90.
Configuration Specifies the script to run or the connectionto make whenever you open the terminalview. See “Configuration” on page 91.
Style Changes the appearance of the view. See“Style” on page 91.
View type Available Properties tabs
Table Query, Filters, Thresholds, Style
Charts: Pie, Bar, Plot, Area,Circular gauge, Linear gauge
Query, Filters, Style
Notepad Style
Message log Filters, Thresholds, Style
Universal message console Filters, Thresholds, Style
82 IBM Tivoli Monitoring: Tivoli Enterprise Portal User's Guide
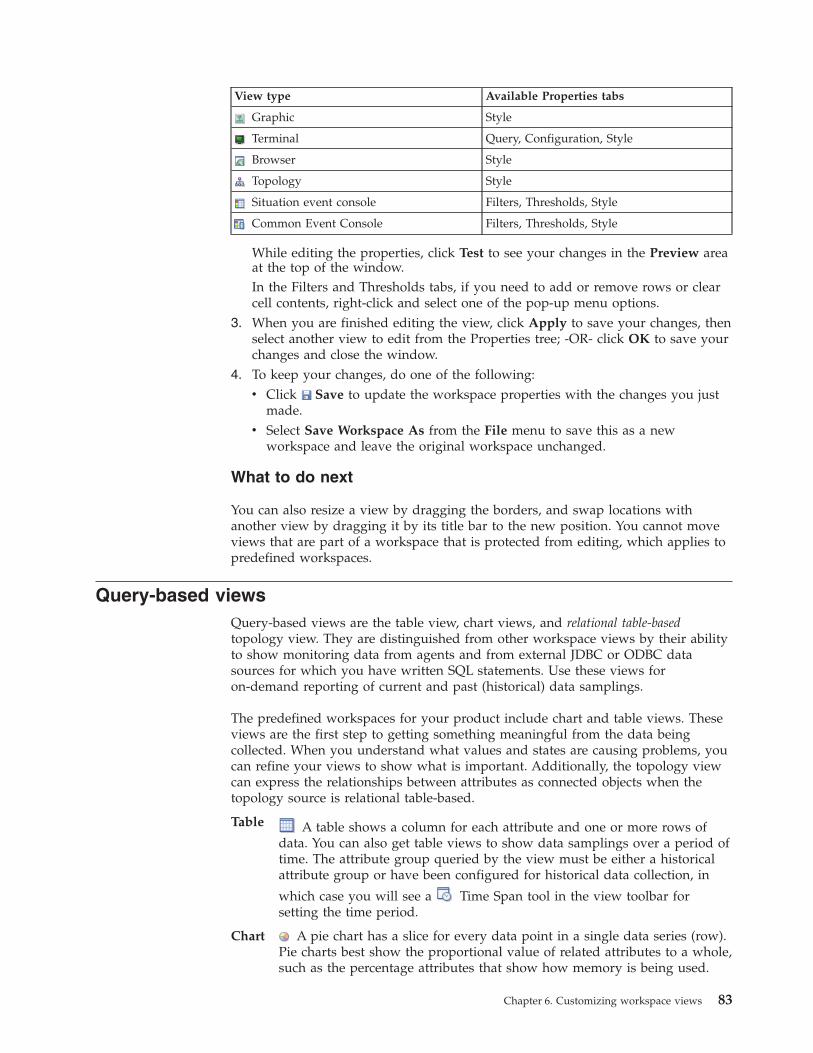
View type Available Properties tabs
Graphic Style
Terminal Query, Configuration, Style
Browser Style
Topology Style
Situation event console Filters, Thresholds, Style
Common Event Console Filters, Thresholds, Style
While editing the properties, click Test to see your changes in the Preview areaat the top of the window.In the Filters and Thresholds tabs, if you need to add or remove rows or clearcell contents, right-click and select one of the pop-up menu options.
3. When you are finished editing the view, click Apply to save your changes, thenselect another view to edit from the Properties tree; -OR- click OK to save yourchanges and close the window.
4. To keep your changes, do one of the following:v Click Save to update the workspace properties with the changes you just
made.v Select Save Workspace As from the File menu to save this as a new
workspace and leave the original workspace unchanged.
What to do next
You can also resize a view by dragging the borders, and swap locations withanother view by dragging it by its title bar to the new position. You cannot moveviews that are part of a workspace that is protected from editing, which applies topredefined workspaces.
Query-based viewsQuery-based views are the table view, chart views, and relational table-basedtopology view. They are distinguished from other workspace views by their abilityto show monitoring data from agents and from external JDBC or ODBC datasources for which you have written SQL statements. Use these views foron-demand reporting of current and past (historical) data samplings.
The predefined workspaces for your product include chart and table views. Theseviews are the first step to getting something meaningful from the data beingcollected. When you understand what values and states are causing problems, youcan refine your views to show what is important. Additionally, the topology viewcan express the relationships between attributes as connected objects when thetopology source is relational table-based.
Table A table shows a column for each attribute and one or more rows ofdata. You can also get table views to show data samplings over a period oftime. The attribute group queried by the view must be either a historicalattribute group or have been configured for historical data collection, in
which case you will see a Time Span tool in the view toolbar forsetting the time period.
Chart A pie chart has a slice for every data point in a single data series (row).Pie charts best show the proportional value of related attributes to a whole,such as the percentage attributes that show how memory is being used.
Chapter 6. Customizing workspace views 83
A bar chart displays a bar for each data point. Bar charts are best suitedfor comparing values among related attributes. The stacking bar chart bestshows multiple values for the same attribute.
A plot chart shows changes over a period of time by drawing acontinuous line from one data point to the next, one data point for eachdata sampling and one line for each attribute selected. The plot chart bestshows trends over time and among related attributes.
An area chart is almost identical to a plot chart except that the areabetween the axis and each plot line is filled with color or a pattern.
A circular gauge chart shows the proportional amount of a data series,one gauge for each attribute chosen. This type of chart is well suited forshowing individual elements that change frequently, such as percentageuser time.
A linear gauge chart shows the collective value of every item in a singledata series, one gauge for each attribute chosen. This type of chart is wellsuited for showing cumulative values.
TopologyA Topology view shows the arrangement of monitored components
associated with its Navigator item. It is considered a query-based viewwhen it has been created as a relational table-based topology view, whichis appropriate for attributes that can show the relationship to otherattributes in their group as connected objects.
Selecting a query for a viewQuery-based views – chart, table or relational table-based topology – must have aquery assigned to specify the data to retrieve.
Before you begin
If you do not see the Queries tool, your user ID does not have View or ModifyQuery permissions. If you can see the tool but it is disabled, your user ID does nothave Workspace Author Mode permission.
About this task
If a newly created chart, table or relational table-based topology view has no queryassigned to it, you must select one. If the view shows data, but you want to showdifferent attributes, change the query.
Procedure1. In the view title bar, click Edit properties. The Properties editor for the
workspace opens and displays the properties of the selected view.2. In the Query tab, click Click here to assign a query to open the Query
editor. The Query editor shows a tree on the left organized by Tivolimonitoring product and then by attribute group.
3. Click to expand the Monitoring agents and attribute group folders tosee the queries.
4. Select a Query title to see its description. The query description, edit date,and specification are displayed in the right frame. The selected options indicatewhich attributes from the group are included in the query. The cells in thenumbered rows show any filter criteria for the query.
84 IBM Tivoli Monitoring: Tivoli Enterprise Portal User's Guide
5. Optional for Tivoli monitoring product queries: To apply the query to specificmanaged systems rather than all managed systems of this type, do thefollowing:a. Click the Query Results Source tab.b. Select Let user assign explicitly.c. Remove from the Assigned list those systems you do not want in the view.
6. Click OK to select the query and return to the Properties editor.
Results
The Description and Formula areas of the Query tab show the name, description,and formula of the query that you selected; the Preview area shows how therendered view will look when the query is applied.
What to do next
Make any other adjustments to the view properties. After you click Apply or OKin the Properties editor, the query is applied to the view and the results shown inthe workspace.
If you chose a custom SQL query and it includes a variable in the statement, youare prompted to enter a value after you click Apply or OK. The value filters thedata that is displayed in the view, but is temporary and cannot be saved with theworkspace.
Regardless of the managed systems assigned to a Navigator item, a gauge chartcan show data from only one managed system. If you are using the query in aworkspace where multiple managed systems are applicable (at the platform levelof the Navigator Physical view), the data shown is from the first managed systemin the Assigned list.
Filtering a query-based viewYou can filter the information displayed on the view to show specific attributesand rows of data.
About this task
Use the Filters tab to control the display to show only those attributes androws of data that are of interest to you. Using this method, you can easily see andcompare the relevant information in a small viewing area.
If you are filtering a view that returns so many rows that response time iscompromised, consider using a query to apply a pre-filter that reduces the amountof data to retrieve.
Procedure1. If the Properties editor is not open, right-click the table view and select
Properties from the pop-up menu.2. Click the Filters tab.3. Select a check box beneath a column heading to include the attribute in the
view; clear a check box to exclude it. If you clear a check box, you can stilladd a filter expression for that attribute (next step).
Chapter 6. Customizing workspace views 85
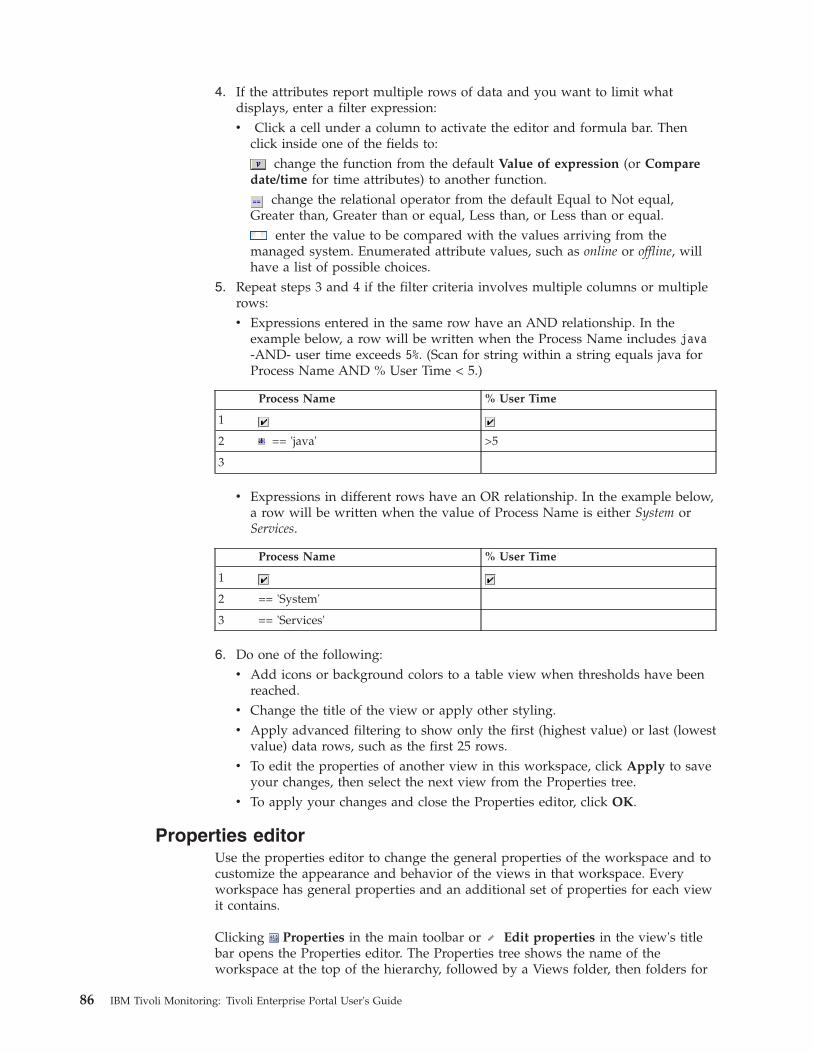
4. If the attributes report multiple rows of data and you want to limit whatdisplays, enter a filter expression:v Click a cell under a column to activate the editor and formula bar. Then
click inside one of the fields to:change the function from the default Value of expression (or Compare
date/time for time attributes) to another function.change the relational operator from the default Equal to Not equal,
Greater than, Greater than or equal, Less than, or Less than or equal.enter the value to be compared with the values arriving from the
managed system. Enumerated attribute values, such as online or offline, willhave a list of possible choices.
5. Repeat steps 3 and 4 if the filter criteria involves multiple columns or multiplerows:v Expressions entered in the same row have an AND relationship. In the
example below, a row will be written when the Process Name includes java-AND- user time exceeds 5%. (Scan for string within a string equals java forProcess Name AND % User Time < 5.)
Process Name % User Time
1
2 == 'java' >5
3
v Expressions in different rows have an OR relationship. In the example below,a row will be written when the value of Process Name is either System orServices.
Process Name % User Time
1
2 == 'System'
3 == 'Services'
6. Do one of the following:v Add icons or background colors to a table view when thresholds have been
reached.v Change the title of the view or apply other styling.v Apply advanced filtering to show only the first (highest value) or last (lowest
value) data rows, such as the first 25 rows.v To edit the properties of another view in this workspace, click Apply to save
your changes, then select the next view from the Properties tree.v To apply your changes and close the Properties editor, click OK.
Properties editorUse the properties editor to change the general properties of the workspace and tocustomize the appearance and behavior of the views in that workspace. Everyworkspace has general properties and an additional set of properties for each viewit contains.
Clicking Properties in the main toolbar or Edit properties in the view's titlebar opens the Properties editor. The Properties tree shows the name of theworkspace at the top of the hierarchy, followed by a Views folder, then folders for
86 IBM Tivoli Monitoring: Tivoli Enterprise Portal User's Guide
every type of view in the workspace. Appearing to the right of the tree are theworkspace properties or view properties, depending on which is selected in thetree.
Workspace propertiesEvery workspace has a name and general characteristics defined in the workspaceproperties.
When you save a new workspace with File → Save Workspace As, clickProperties, or, if the Properties editor is already open, click the top item in the treeto see the workspace properties.
Workspace Identity
Name The title of the workspace. The workspace name is displayed in thetitle bar or browser mode banner, in the View → Workspace list, orin the Link To list menu, depending on how you have set theworkspace options (see below). Do not use an & ampersand or #pound sign in the title.
DescriptionOptional. The description can be a full text description of theworkspace.
Workspace Options
Assign as default for this Navigator ItemMakes this workspace the default for the Navigator item (the onethat opens when you click the Navigator item).
Assign as Home WorkspaceSpecifies this as the workspace that opens whenever you startTivoli Enterprise Portal, much like your browser home page.
Do not allow modificationsProtects the workspace from permanent changes and must beselected when you are editing in Workspace administration mode.Users who have access to this workspace can change it temporarily,but if they attempt to save, the Save Workspace As windowopens so that it is saved as a new workspace with a differentname. Also, when this item is enabled you cannot delete theworkspace.
Only selectable as the target of a Workspace LinkMarks the workspace as hidden except when it is a possible LinkTo destination. The workspace does not display in the list ofavailable workspaces for a Navigator item.
Always open workspace in new windowWhen enabled, this option causes the workspace to open in a newwindow, or in a new tab if your browser supports tabbed pages.
View propertiesEdit the properties of a workspace view to control its appearance and behavior.
The view properties are displayed when you click Edit properties in the view'stitle bar or when you click the view in the Properties tree in the left pane of theProperties editor. The view properties open in the right frame with one or more ofthese tabs, depending on the view type, such as the Thresholds tab for the tableview.
Chapter 6. Customizing workspace views 87
Preview is a mirror of the view before you selected it in the Properties editor. Itgives you a preview of how the view will look when you save (with Apply or OK)your changes. Preview is typically used with query-based views whenever youselect a different query or edit the query, define a filter or threshold, or modify thestyle.
The editor has buttons to Test your changes in the Preview area to see how theywill look, Apply your changes to the view to save them now, and exit with (OK)or without (Cancel) saving your changes. If you plan to edit more than one viewwhile in the Properties editor, click Apply to save your changes to the first viewbefore editing the next.
Query:
A query specifies the attribute values to display in the table view, chart views,relational table-based topology view, and, optionally, the terminal view.
As well as queries of attributes from your managed systems, you can write SQLqueries for an ODBC-compliant database. After the data is retrieved, you can filterout any unwanted data from the view.
Multiple views in the same workspace can use the same data retrieved by thequery, use their style to format the data, and filters to control what is shown.Using the same query for multiple views in a workspace conserves resources at theportal server and the monitoring server. Also, using a query that includes only theattributes you want to see in a view saves resources.
These views have a Query tab where you can select what attribute group and,when there are multiple queries for the same group, which attributes to populatethe view with.
Click here to assign a query.
Opens the Query editor so you can select an existing query or create a newone. The queries available depend on where the workspace is in relation tothe Navigator hierarchy. The exception is Tivoli Enterprise MonitoringServer: these are queries of the common attributes, which are available forall workspaces.
Description
Name of the query.
Description of the query.
Formula
Shows the formula for the query. Note that any column function added tothe query is not displayed here.
View-level Page Size
Controls the page-break size of the table, message log, pie chart or barchart view. For example, a pie chart gives you one pie for each row of datareturned, so 50 rows will give you 50 pies in the view. By limiting the pagesize to three rows, you can have three pies on a page, using to turn tothe next page. The smaller page size speeds up data retrieval to theworkspace because only one page is retrieved at a time rather than theentire row set.
Use default retrieves 100 rows of data per page.
88 IBM Tivoli Monitoring: Tivoli Enterprise Portal User's Guide
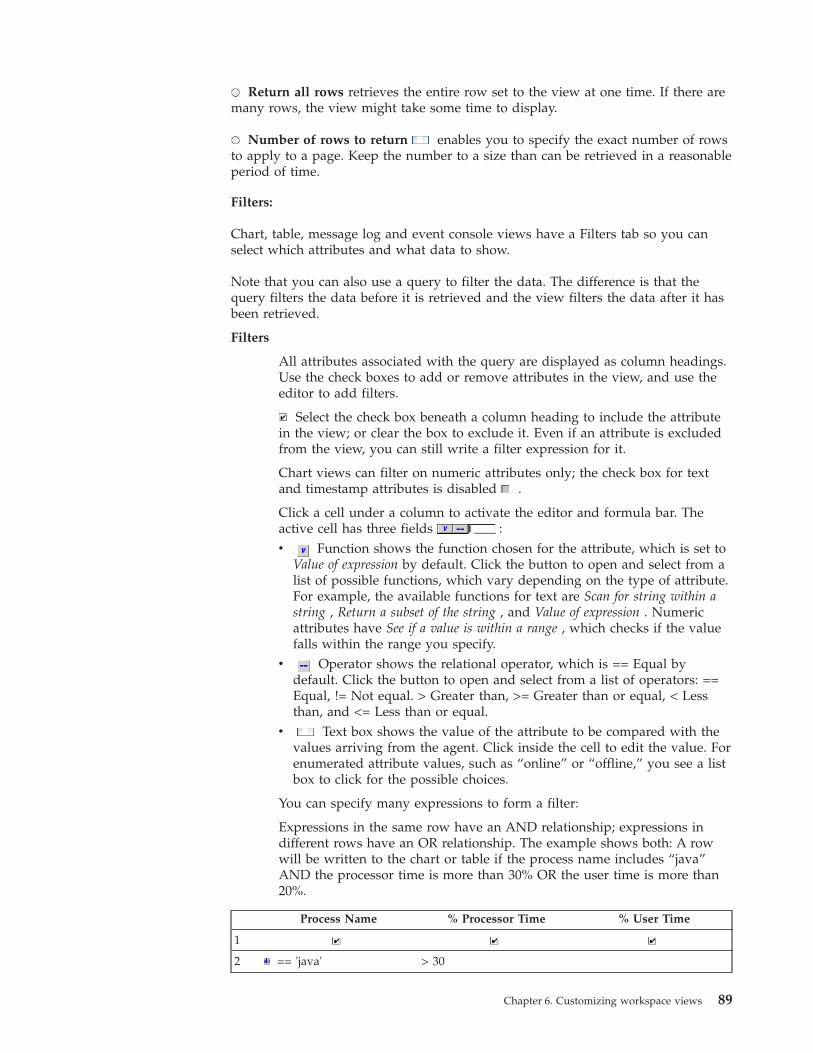
Return all rows retrieves the entire row set to the view at one time. If there aremany rows, the view might take some time to display.
Number of rows to return enables you to specify the exact number of rowsto apply to a page. Keep the number to a size than can be retrieved in a reasonableperiod of time.
Filters:
Chart, table, message log and event console views have a Filters tab so you canselect which attributes and what data to show.
Note that you can also use a query to filter the data. The difference is that thequery filters the data before it is retrieved and the view filters the data after it hasbeen retrieved.
Filters
All attributes associated with the query are displayed as column headings.Use the check boxes to add or remove attributes in the view, and use theeditor to add filters.
Select the check box beneath a column heading to include the attributein the view; or clear the box to exclude it. Even if an attribute is excludedfrom the view, you can still write a filter expression for it.
Chart views can filter on numeric attributes only; the check box for textand timestamp attributes is disabled .
Click a cell under a column to activate the editor and formula bar. Theactive cell has three fields :v Function shows the function chosen for the attribute, which is set to
Value of expression by default. Click the button to open and select from alist of possible functions, which vary depending on the type of attribute.For example, the available functions for text are Scan for string within astring , Return a subset of the string , and Value of expression . Numericattributes have See if a value is within a range , which checks if the valuefalls within the range you specify.
v Operator shows the relational operator, which is == Equal bydefault. Click the button to open and select from a list of operators: ==Equal, != Not equal. > Greater than, >= Greater than or equal, < Lessthan, and <= Less than or equal.
v Text box shows the value of the attribute to be compared with thevalues arriving from the agent. Click inside the cell to edit the value. Forenumerated attribute values, such as “online” or “offline,” you see a listbox to click for the possible choices.
You can specify many expressions to form a filter:
Expressions in the same row have an AND relationship; expressions indifferent rows have an OR relationship. The example shows both: A rowwill be written to the chart or table if the process name includes “java”AND the processor time is more than 30% OR the user time is more than20%.
Process Name % Processor Time % User Time
1
2 == 'java' > 30
Chapter 6. Customizing workspace views 89
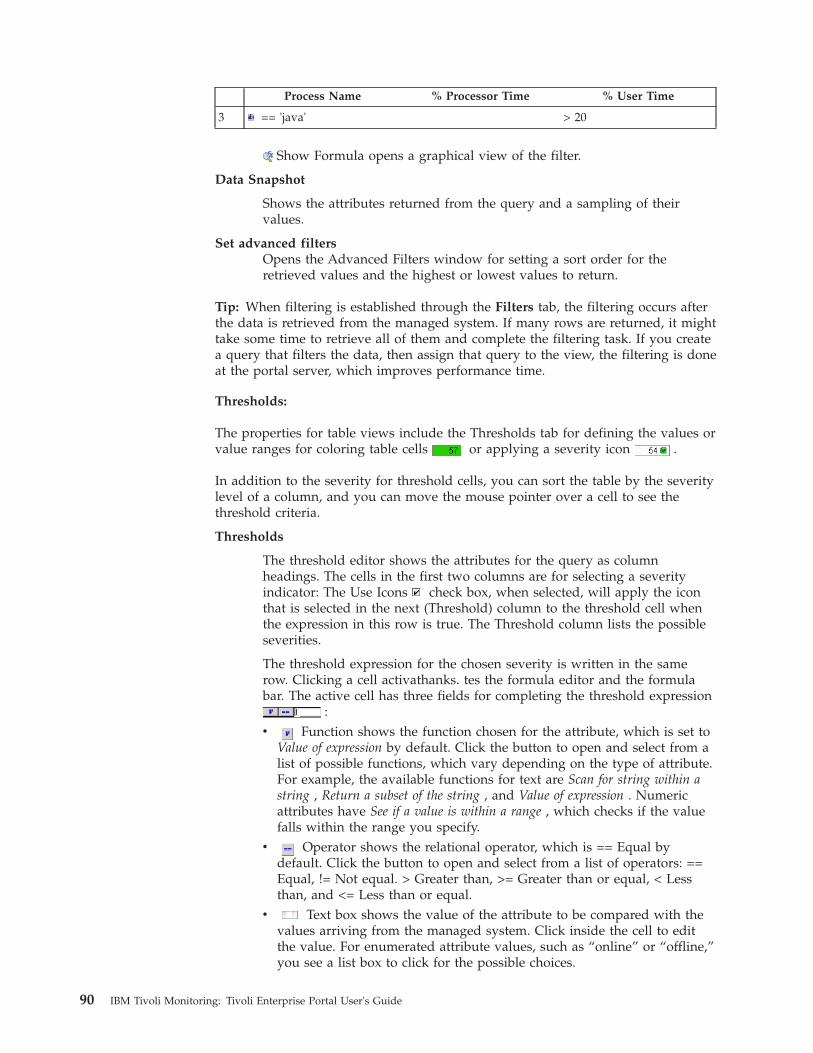
Process Name % Processor Time % User Time
3 == 'java' > 20
Show Formula opens a graphical view of the filter.
Data Snapshot
Shows the attributes returned from the query and a sampling of theirvalues.
Set advanced filtersOpens the Advanced Filters window for setting a sort order for theretrieved values and the highest or lowest values to return.
Tip: When filtering is established through the Filters tab, the filtering occurs afterthe data is retrieved from the managed system. If many rows are returned, it mighttake some time to retrieve all of them and complete the filtering task. If you createa query that filters the data, then assign that query to the view, the filtering is doneat the portal server, which improves performance time.
Thresholds:
The properties for table views include the Thresholds tab for defining the values orvalue ranges for coloring table cells or applying a severity icon .
In addition to the severity for threshold cells, you can sort the table by the severitylevel of a column, and you can move the mouse pointer over a cell to see thethreshold criteria.
Thresholds
The threshold editor shows the attributes for the query as columnheadings. The cells in the first two columns are for selecting a severityindicator: The Use Icons check box, when selected, will apply the iconthat is selected in the next (Threshold) column to the threshold cell whenthe expression in this row is true. The Threshold column lists the possibleseverities.
The threshold expression for the chosen severity is written in the samerow. Clicking a cell activathanks. tes the formula editor and the formulabar. The active cell has three fields for completing the threshold expression
:v Function shows the function chosen for the attribute, which is set to
Value of expression by default. Click the button to open and select from alist of possible functions, which vary depending on the type of attribute.For example, the available functions for text are Scan for string within astring , Return a subset of the string , and Value of expression . Numericattributes have See if a value is within a range , which checks if the valuefalls within the range you specify.
v Operator shows the relational operator, which is == Equal bydefault. Click the button to open and select from a list of operators: ==Equal, != Not equal. > Greater than, >= Greater than or equal, < Lessthan, and <= Less than or equal.
v Text box shows the value of the attribute to be compared with thevalues arriving from the managed system. Click inside the cell to editthe value. For enumerated attribute values, such as “online” or “offline,”you see a list box to click for the possible choices.
90 IBM Tivoli Monitoring: Tivoli Enterprise Portal User's Guide
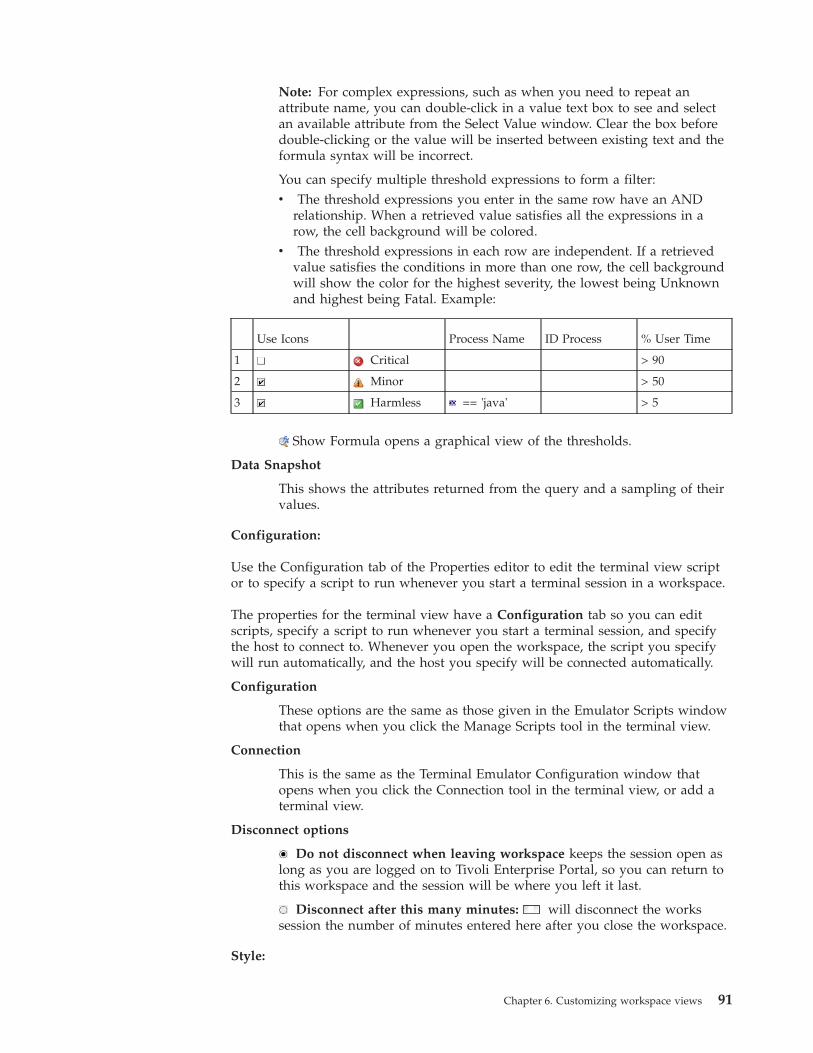
Note: For complex expressions, such as when you need to repeat anattribute name, you can double-click in a value text box to see and selectan available attribute from the Select Value window. Clear the box beforedouble-clicking or the value will be inserted between existing text and theformula syntax will be incorrect.
You can specify multiple threshold expressions to form a filter:v The threshold expressions you enter in the same row have an AND
relationship. When a retrieved value satisfies all the expressions in arow, the cell background will be colored.
v The threshold expressions in each row are independent. If a retrievedvalue satisfies the conditions in more than one row, the cell backgroundwill show the color for the highest severity, the lowest being Unknownand highest being Fatal. Example:
Use Icons Process Name ID Process % User Time
1 Critical > 90
2 Minor > 50
3 Harmless == 'java' > 5
Show Formula opens a graphical view of the thresholds.
Data Snapshot
This shows the attributes returned from the query and a sampling of theirvalues.
Configuration:
Use the Configuration tab of the Properties editor to edit the terminal view scriptor to specify a script to run whenever you start a terminal session in a workspace.
The properties for the terminal view have a Configuration tab so you can editscripts, specify a script to run whenever you start a terminal session, and specifythe host to connect to. Whenever you open the workspace, the script you specifywill run automatically, and the host you specify will be connected automatically.
Configuration
These options are the same as those given in the Emulator Scripts windowthat opens when you click the Manage Scripts tool in the terminal view.
Connection
This is the same as the Terminal Emulator Configuration window thatopens when you click the Connection tool in the terminal view, or add aterminal view.
Disconnect options
Do not disconnect when leaving workspace keeps the session open aslong as you are logged on to Tivoli Enterprise Portal, so you can return tothis workspace and the session will be where you left it last.
Disconnect after this many minutes: will disconnect the workssession the number of minutes entered here after you close the workspace.
Style:
Chapter 6. Customizing workspace views 91
Every view type except Tivoli Enterprise Console and Take Action has styleproperties that you can edit to affect the appearance and behavior of the view.
The Style tab of the Properties editor has a thumbnail graphic with the styleelements as clickable hot spots. When you click a hot spot, such as Plot Area for achart view, the style settings change.
Options
These vary for the type of view.
Title
Text is the title that is displayed at the top of the table, chart, or specifiedelement therein (such as the header). If this is a chart or table, you can alsoadd an attribute symbol to the title that will be replaced by the value ofthat attribute when the view is displayed.
Note: When the workspace is opened, the header and footer are evaluatedfor any expressions. If you happen to have a relational operator (==, !=, >,>=, <, <=) in the text, the operator will be replaced by TRUE or FALSEunless you enclose it in quotes.
Font is the font in which the title will be displayed.
Size is the font size in points.
Style is the format of the font. The choices vary depending on the font, butare usually Bold, Plain and Italic.
Text
Font the title will be displayed in.
Size is font size in points.
Style choices vary depending on the font, but are usually Bold, Normaland Italic.
Use CSS valuesThis is set to use the values of the workspace presentation cascading stylesheet (ws_pres.css) for the label text (header, footer, and chart legend) .This option is useful for text in double-byte character set (DBCS) languagesthat are more legible with a different font styling than the defaults. TheTivoli Enterprise Portal administrator can edit the ws_pres.css style sheetin the Install_dir\cnb (Windows); cw (Linux)\classes\candle\fw\stylesdirectory on the computer where the Tivoli Enterprise Portal Server isinstalled, to establish a specific font style that will be used for all label textand that will not be overwritten whenever your installation is upgraded toa new release.
Clear the check box if you want to use the font styling that is specified inthe Text style area.
Advanced FiltersThe Filters tab of the Properties editor has a Set advanced filters button thatopens this window, where you can specify a sort order for the returned values andthe highest or lowest values to return.
Enable First/Last FilterSelect the check box to filter the view to show the first or last rowsreturned based on the value of the attribute specified in the Sort by area.
92 IBM Tivoli Monitoring: Tivoli Enterprise Portal User's Guide
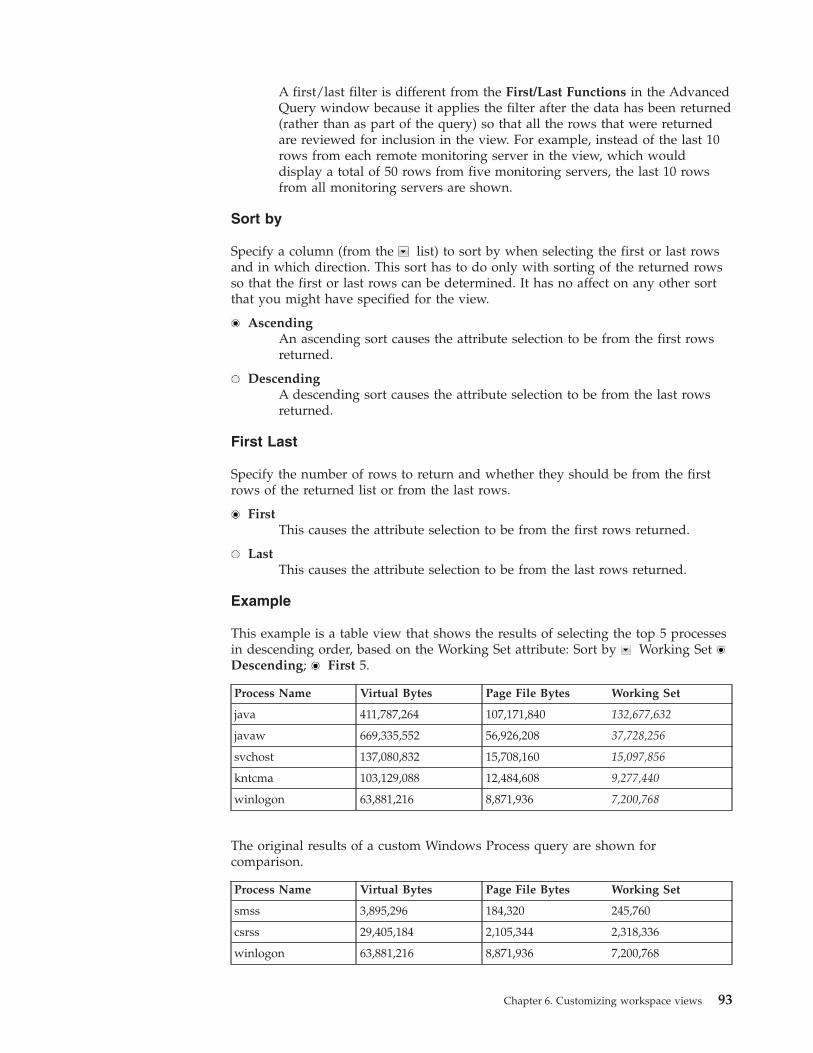
A first/last filter is different from the First/Last Functions in the AdvancedQuery window because it applies the filter after the data has been returned(rather than as part of the query) so that all the rows that were returnedare reviewed for inclusion in the view. For example, instead of the last 10rows from each remote monitoring server in the view, which woulddisplay a total of 50 rows from five monitoring servers, the last 10 rowsfrom all monitoring servers are shown.
Sort by
Specify a column (from the list) to sort by when selecting the first or last rowsand in which direction. This sort has to do only with sorting of the returned rowsso that the first or last rows can be determined. It has no affect on any other sortthat you might have specified for the view.
AscendingAn ascending sort causes the attribute selection to be from the first rowsreturned.
DescendingA descending sort causes the attribute selection to be from the last rowsreturned.
First Last
Specify the number of rows to return and whether they should be from the firstrows of the returned list or from the last rows.
FirstThis causes the attribute selection to be from the first rows returned.
LastThis causes the attribute selection to be from the last rows returned.
Example
This example is a table view that shows the results of selecting the top 5 processesin descending order, based on the Working Set attribute: Sort by Working SetDescending; First 5.
Process Name Virtual Bytes Page File Bytes Working Set
java 411,787,264 107,171,840 132,677,632
javaw 669,335,552 56,926,208 37,728,256
svchost 137,080,832 15,708,160 15,097,856
kntcma 103,129,088 12,484,608 9,277,440
winlogon 63,881,216 8,871,936 7,200,768
The original results of a custom Windows Process query are shown forcomparison.
Process Name Virtual Bytes Page File Bytes Working Set
smss 3,895,296 184,320 245,760
csrss 29,405,184 2,105,344 2,318,336
winlogon 63,881,216 8,871,936 7,200,768
Chapter 6. Customizing workspace views 93
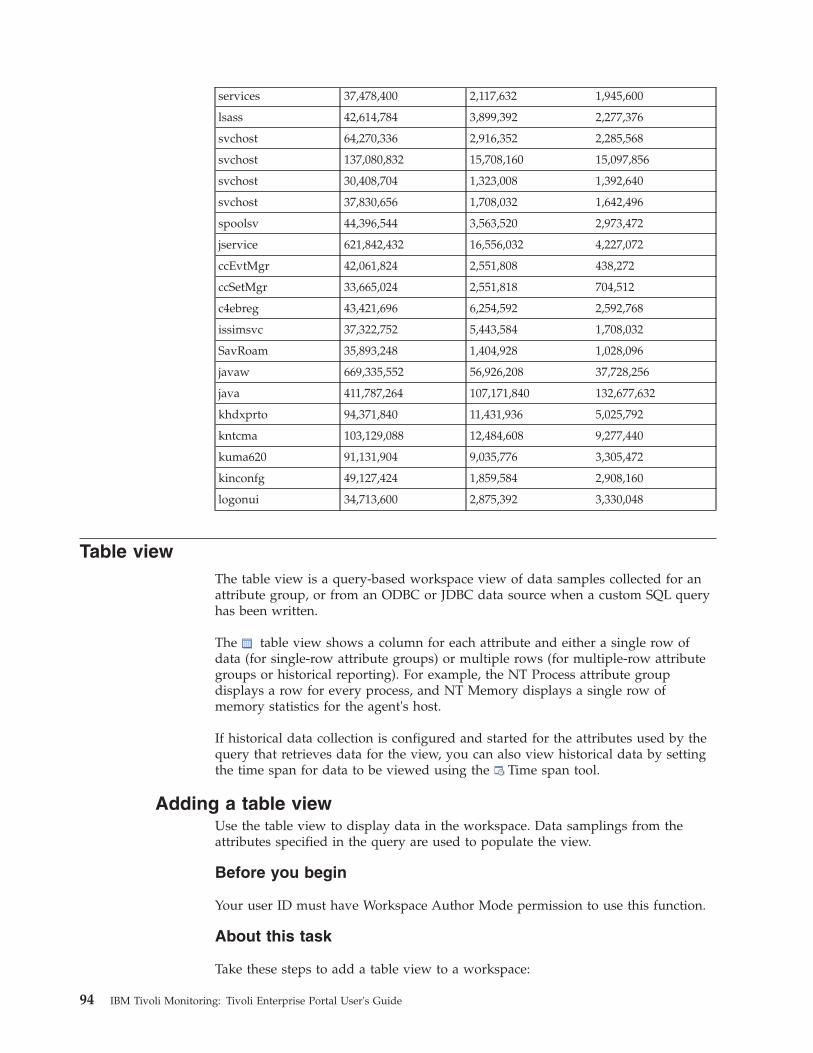
services 37,478,400 2,117,632 1,945,600
lsass 42,614,784 3,899,392 2,277,376
svchost 64,270,336 2,916,352 2,285,568
svchost 137,080,832 15,708,160 15,097,856
svchost 30,408,704 1,323,008 1,392,640
svchost 37,830,656 1,708,032 1,642,496
spoolsv 44,396,544 3,563,520 2,973,472
jservice 621,842,432 16,556,032 4,227,072
ccEvtMgr 42,061,824 2,551,808 438,272
ccSetMgr 33,665,024 2,551,818 704,512
c4ebreg 43,421,696 6,254,592 2,592,768
issimsvc 37,322,752 5,443,584 1,708,032
SavRoam 35,893,248 1,404,928 1,028,096
javaw 669,335,552 56,926,208 37,728,256
java 411,787,264 107,171,840 132,677,632
khdxprto 94,371,840 11,431,936 5,025,792
kntcma 103,129,088 12,484,608 9,277,440
kuma620 91,131,904 9,035,776 3,305,472
kinconfg 49,127,424 1,859,584 2,908,160
logonui 34,713,600 2,875,392 3,330,048
Table viewThe table view is a query-based workspace view of data samples collected for anattribute group, or from an ODBC or JDBC data source when a custom SQL queryhas been written.
The table view shows a column for each attribute and either a single row ofdata (for single-row attribute groups) or multiple rows (for multiple-row attributegroups or historical reporting). For example, the NT Process attribute groupdisplays a row for every process, and NT Memory displays a single row ofmemory statistics for the agent's host.
If historical data collection is configured and started for the attributes used by thequery that retrieves data for the view, you can also view historical data by settingthe time span for data to be viewed using the Time span tool.
Adding a table viewUse the table view to display data in the workspace. Data samplings from theattributes specified in the query are used to populate the view.
Before you begin
Your user ID must have Workspace Author Mode permission to use this function.
About this task
Take these steps to add a table view to a workspace:
94 IBM Tivoli Monitoring: Tivoli Enterprise Portal User's Guide
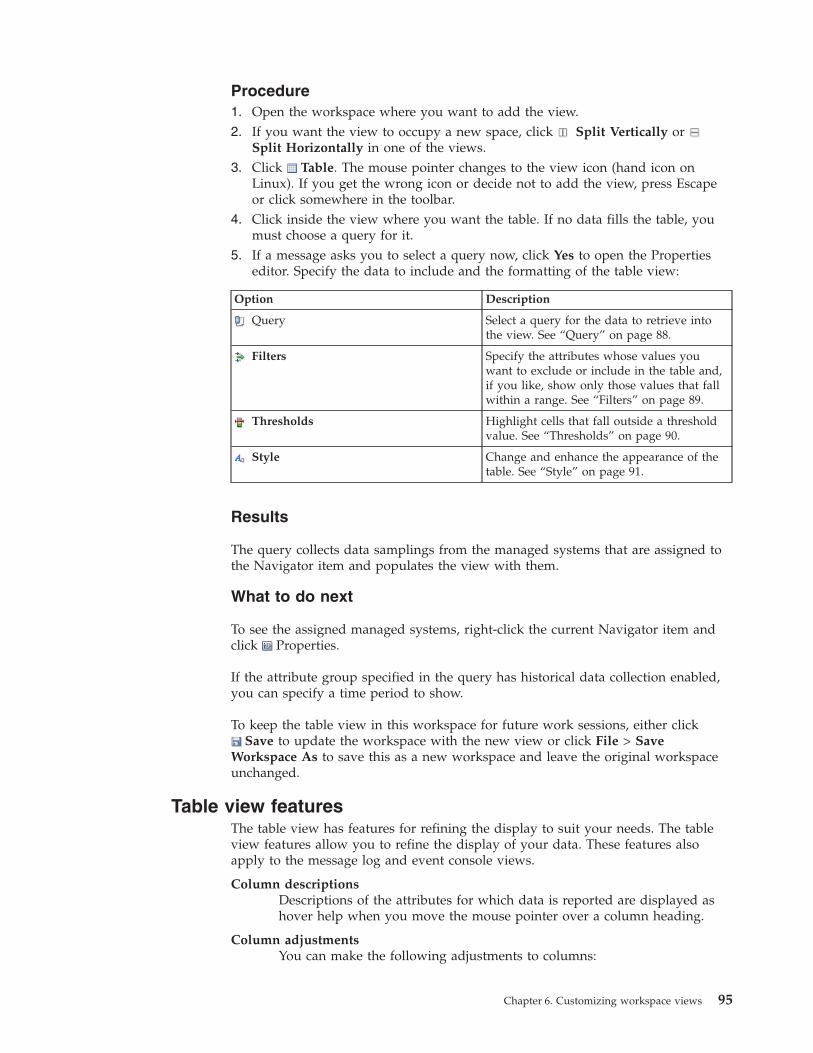
Procedure1. Open the workspace where you want to add the view.2. If you want the view to occupy a new space, click Split Vertically or
Split Horizontally in one of the views.3. Click Table. The mouse pointer changes to the view icon (hand icon on
Linux). If you get the wrong icon or decide not to add the view, press Escapeor click somewhere in the toolbar.
4. Click inside the view where you want the table. If no data fills the table, youmust choose a query for it.
5. If a message asks you to select a query now, click Yes to open the Propertieseditor. Specify the data to include and the formatting of the table view:
Option Description
Query Select a query for the data to retrieve intothe view. See “Query” on page 88.
Filters Specify the attributes whose values youwant to exclude or include in the table and,if you like, show only those values that fallwithin a range. See “Filters” on page 89.
Thresholds Highlight cells that fall outside a thresholdvalue. See “Thresholds” on page 90.
Style Change and enhance the appearance of thetable. See “Style” on page 91.
Results
The query collects data samplings from the managed systems that are assigned tothe Navigator item and populates the view with them.
What to do next
To see the assigned managed systems, right-click the current Navigator item andclick Properties.
If the attribute group specified in the query has historical data collection enabled,you can specify a time period to show.
To keep the table view in this workspace for future work sessions, either clickSave to update the workspace with the new view or click File > Save
Workspace As to save this as a new workspace and leave the original workspaceunchanged.
Table view featuresThe table view has features for refining the display to suit your needs. The tableview features allow you to refine the display of your data. These features alsoapply to the message log and event console views.
Column descriptionsDescriptions of the attributes for which data is reported are displayed ashover help when you move the mouse pointer over a column heading.
Column adjustmentsYou can make the following adjustments to columns:
Chapter 6. Customizing workspace views 95
Adjust column width by dragging a border left or right.
Lock a column by right-clicking in the column heading and selectingLock this Column. The column and any columns to left are fixed in
place as you scroll the table left or right. To unlock, right-click a columnheading and select Unlock Table Columns.
Change column order by dragging a column heading and dropping toinsert it between two columns.
Column sort by clicking a column heading to sort the table by that columnin ascending order, clicking again for descending, and again to go back tothe original arrangement. You can also build a query that specifies a sortorder, which is necessary for multiple-page tables if you want all the rowssorted and not just those in the current page.
FindThe Find function enables you to enter search criteria for the columnsshown in the table.
Threshold indicatorsThreshold cells have either a severity icon or a colored background toindicate values that meet the threshold criteria. A threshold columnheading has an indicator, such as Minor, that you can click to sort thecolumn by the threshold value. If the column has multiple thresholdsassigned, the highest level indicator is displayed. When threshold cells donot show in the viewable area, the scroll button is colored or has a severityicon to show where to click to see them.
Link indicatorsLink indicators appear to the left of a row if the table has a link filtered
by one or more row values. Click the indicator to open the defaultlinked workspace or, if no default link has been assigned, a list of availablelinks. You can also right-click the indicator to get a list of available links orto open the link wizard to define a link.
Multiple pagesMultiple pages, a page being 100 rows, are indicated by and buttonson the scroll bar. A text box is displayed at the top of the table with “Page1 of ”. You can type another number to go to that page. Replace 1 with ahigh number such as 99 and press Enter to go to the last page and adjustthe total number of pages displayed to the correct number.
Click Edit Properties in the view title bar to open the Properties editor,and change the Page size in the Query tab. A smaller page size speeds updata retrieval because only one page is retrieved at one time rather thanthe entire row set.
Historical reportingAs well as seeing real-time data in the table view, you can have TivoliEnterprise Portal log the data into history files so you can examine dataover longer periods of time. The table view has a Time Span tool forsetting a time period to report. The table retains data from previousrefreshes and appends newly arrived data to the view.
Adding column thresholdsYou can decorate a cell in the table view (including event console, message log,and universal message views) with a background color, severity icon, or customicon when the value exceeds a given threshold.
96 IBM Tivoli Monitoring: Tivoli Enterprise Portal User's Guide
About this task
You can decorate a cell with a background color, severity icon, or custom icon bywriting formula expressions that specify the threshold criteria and the indicators touse, such as or .1. If the Properties editor is not open, click Edit Properties in the table view
title bar.2. Click the Thresholds tab.3. If you want to place a severity icon in a threshold cell instead of a background
color, select the Use Icons check box.4. Click inside a cell in the Threshold column (second column) to see and
select from the list of severities.The seven predefined severities, from Fatal to Unknown, display in the list. Ifyou are selecting an icon, also shown are any custom severity icons that wereadded to the portal server. The icons are ordered by their severity, from highestto lowest.
5. In the same row as the selected highlight, click in a column cell and write thethreshold expression for that attribute. This activates the editor and formulabar:Click if you want to change the function from the default Value ofexpression (or Compare date/time for time attributes) to another function.Click if you want to change the relational operator from Equal to Not equalor to any other operator in the list.Click inside the text box to enter the threshold value. Enumerated attributevalues, such as online or offline, have a list of possible choices.
6. Click Test to evaluate the threshold expression and to see in the Preview areahow the results will be displayed.
7. Repeat steps 3 to 5 to add more threshold expressions to this or anothercolumn:The threshold expressions entered in the same row have an AND relationship.When a retrieved value satisfies all the expressions in a row, the cell will behighlighted.The threshold expressions in each row are independent; they have an ORrelationship. If a retrieved value satisfies the conditions in more than one row,the cell will be highlighted with the highest severity.
8. When the threshold formula is complete, save your changes by clicking Applyif you want to leave the Properties editor open or OK to close the editor.
Note:
1. Values in the table that meet the threshold criteria are indicated by the severitybackground color or severity icon. You will notice a severity icon in the columnheading of threshold cells. This is the highest threshold severity established forthe column; click the icon to sort the view by severity.
2. The scroll buttons indicate threshold cells that are outside the visible area. Forexample, guides you to scroll right to see more informational thresholdcells. Move the mouse pointer over a threshold cell to see the threshold criteria.
3. In the event that multiple threshold expressions written for the same columnbecome true at the same time, the severity with the highest value will beapplied. If the same severity was applied (which is possible only if the iconwas selected for one expression and its background color counterpart for theother), then the first row expression will determine the appearance. For
Chapter 6. Customizing workspace views 97
example, if the icon was specified in row 2 of the formula editor and thebackground color in row 3, then the icon will be used.
Guidelines for threshold iconsThere are already seven predefined severity icons that can be assigned to thresholdcells, and you can add your own severity threshold icons to the portal server.
When adding your own severity threshold icons to the portal server, observe theserequirements and guidelines:v Use iconic images sized at 9 pixels by 9 pixels to match the size of the
predefined severity icons. You can use larger images, but they will be clippedwhen applied to a scroll button.
v Save the images in the GIF format. Nonlinear GIFs look best when saved with atransparent background.
v Include the severity value in the filename, immediately preceding the .gifextension (such as icon28.gif, serious_92.gif, or 999.gif). Valid values are greaterthan 0 and less than MAX_INT and must be unique. If a duplicate severity isfound, the icon file will not be included in the list of possible icons that can beused for threshold cells. These are the severity values of the predefined icons:
Fatal = 100Critical = 90Minor = 40Warning = 30Harmless = 27Informational = 25Unknown = 15
v Use only ASCII characters in the filename. Names that use characters outside theASCII code range will not be displayed in the list of available files when theuser browses to select one.
v On the computer where the Tivoli Enterprise Portal Server installed, place theGIF files in the user directory:
or <itm_installdir>/cw/classes/candle/fw/resources/icons/user
<itm_installdir>\cnb\classes\candle\fw\resources\icons\user
v If users are logged on to the portal server, they will need to exit the portal andlog on again before the icons will be available for inclusion in the thresholdcriteria.
Chart viewsAdd one of the seven available chart views to a workspace to present data formanaged systems in real time. When a query is assigned to a chart for an attributegroup that has historical data collected, you can also display historical data.
Each type of chart is best suited to displaying a certain type of data:
98 IBM Tivoli Monitoring: Tivoli Enterprise Portal User's Guide
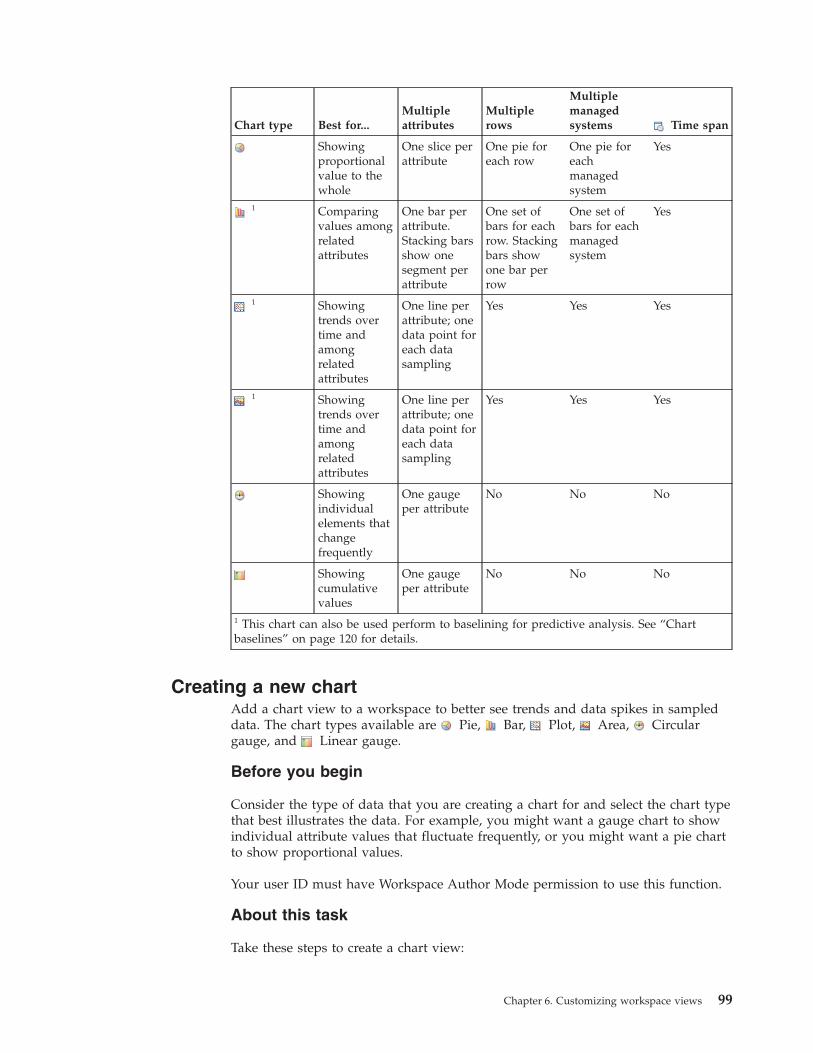
Chart type Best for...Multipleattributes
Multiplerows
Multiplemanagedsystems Time span
Showingproportionalvalue to thewhole
One slice perattribute
One pie foreach row
One pie foreachmanagedsystem
Yes
1 Comparingvalues amongrelatedattributes
One bar perattribute.Stacking barsshow onesegment perattribute
One set ofbars for eachrow. Stackingbars showone bar perrow
One set ofbars for eachmanagedsystem
Yes
1 Showingtrends overtime andamongrelatedattributes
One line perattribute; onedata point foreach datasampling
Yes Yes Yes
1 Showingtrends overtime andamongrelatedattributes
One line perattribute; onedata point foreach datasampling
Yes Yes Yes
Showingindividualelements thatchangefrequently
One gaugeper attribute
No No No
Showingcumulativevalues
One gaugeper attribute
No No No
1 This chart can also be used perform to baselining for predictive analysis. See “Chartbaselines” on page 120 for details.
Creating a new chartAdd a chart view to a workspace to better see trends and data spikes in sampleddata. The chart types available are Pie, Bar, Plot, Area, Circulargauge, and Linear gauge.
Before you begin
Consider the type of data that you are creating a chart for and select the chart typethat best illustrates the data. For example, you might want a gauge chart to showindividual attribute values that fluctuate frequently, or you might want a pie chartto show proportional values.
Your user ID must have Workspace Author Mode permission to use this function.
About this task
Take these steps to create a chart view:
Chapter 6. Customizing workspace views 99
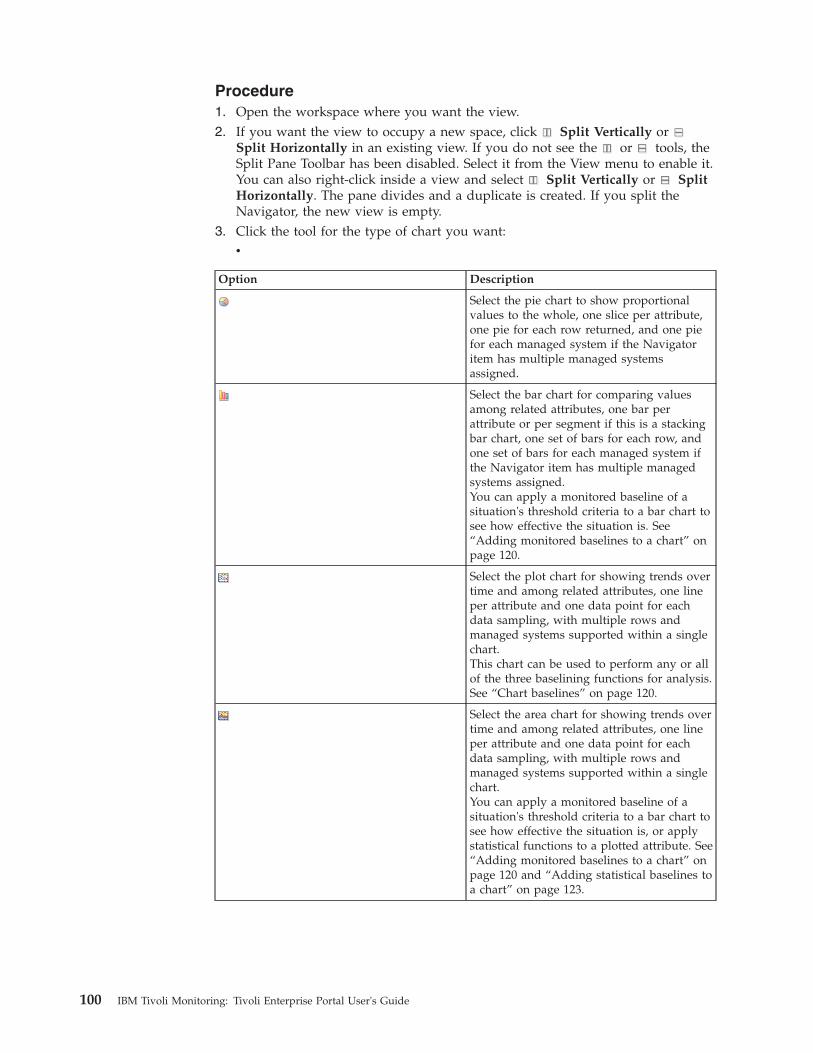
Procedure1. Open the workspace where you want the view.2. If you want the view to occupy a new space, click Split Vertically or
Split Horizontally in an existing view. If you do not see the or tools, theSplit Pane Toolbar has been disabled. Select it from the View menu to enable it.You can also right-click inside a view and select Split Vertically or SplitHorizontally. The pane divides and a duplicate is created. If you split theNavigator, the new view is empty.
3. Click the tool for the type of chart you want:v
Option Description
Select the pie chart to show proportionalvalues to the whole, one slice per attribute,one pie for each row returned, and one piefor each managed system if the Navigatoritem has multiple managed systemsassigned.
Select the bar chart for comparing valuesamong related attributes, one bar perattribute or per segment if this is a stackingbar chart, one set of bars for each row, andone set of bars for each managed system ifthe Navigator item has multiple managedsystems assigned.You can apply a monitored baseline of asituation's threshold criteria to a bar chart tosee how effective the situation is. See“Adding monitored baselines to a chart” onpage 120.
Select the plot chart for showing trends overtime and among related attributes, one lineper attribute and one data point for eachdata sampling, with multiple rows andmanaged systems supported within a singlechart.This chart can be used to perform any or allof the three baselining functions for analysis.See “Chart baselines” on page 120.
Select the area chart for showing trends overtime and among related attributes, one lineper attribute and one data point for eachdata sampling, with multiple rows andmanaged systems supported within a singlechart.You can apply a monitored baseline of asituation's threshold criteria to a bar chart tosee how effective the situation is, or applystatistical functions to a plotted attribute. See“Adding monitored baselines to a chart” onpage 120 and “Adding statistical baselines toa chart” on page 123.
100 IBM Tivoli Monitoring: Tivoli Enterprise Portal User's Guide
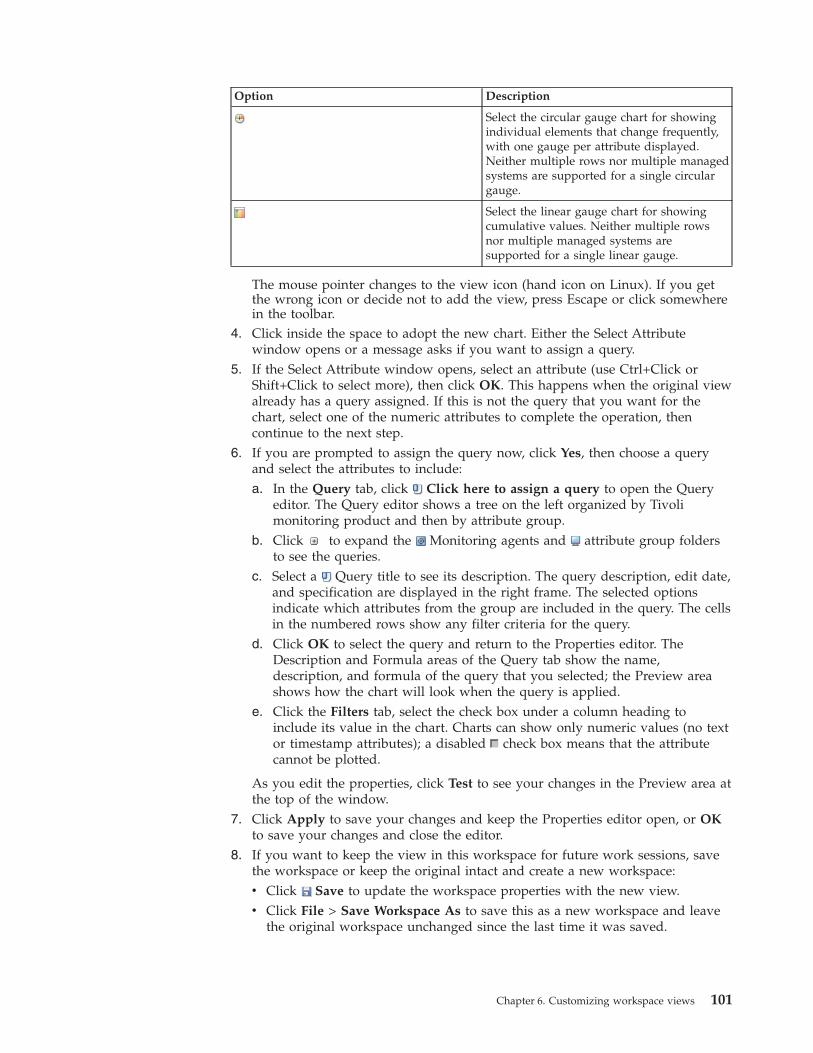
Option Description
Select the circular gauge chart for showingindividual elements that change frequently,with one gauge per attribute displayed.Neither multiple rows nor multiple managedsystems are supported for a single circulargauge.
Select the linear gauge chart for showingcumulative values. Neither multiple rowsnor multiple managed systems aresupported for a single linear gauge.
The mouse pointer changes to the view icon (hand icon on Linux). If you getthe wrong icon or decide not to add the view, press Escape or click somewherein the toolbar.
4. Click inside the space to adopt the new chart. Either the Select Attributewindow opens or a message asks if you want to assign a query.
5. If the Select Attribute window opens, select an attribute (use Ctrl+Click orShift+Click to select more), then click OK. This happens when the original viewalready has a query assigned. If this is not the query that you want for thechart, select one of the numeric attributes to complete the operation, thencontinue to the next step.
6. If you are prompted to assign the query now, click Yes, then choose a queryand select the attributes to include:a. In the Query tab, click Click here to assign a query to open the Query
editor. The Query editor shows a tree on the left organized by Tivolimonitoring product and then by attribute group.
b. Click to expand the Monitoring agents and attribute group foldersto see the queries.
c. Select a Query title to see its description. The query description, edit date,and specification are displayed in the right frame. The selected optionsindicate which attributes from the group are included in the query. The cellsin the numbered rows show any filter criteria for the query.
d. Click OK to select the query and return to the Properties editor. TheDescription and Formula areas of the Query tab show the name,description, and formula of the query that you selected; the Preview areashows how the chart will look when the query is applied.
e. Click the Filters tab, select the check box under a column heading toinclude its value in the chart. Charts can show only numeric values (no textor timestamp attributes); a disabled check box means that the attributecannot be plotted.
As you edit the properties, click Test to see your changes in the Preview area atthe top of the window.
7. Click Apply to save your changes and keep the Properties editor open, or OKto save your changes and close the editor.
8. If you want to keep the view in this workspace for future work sessions, savethe workspace or keep the original intact and create a new workspace:v Click Save to update the workspace properties with the new view.v Click File > Save Workspace As to save this as a new workspace and leave
the original workspace unchanged since the last time it was saved.
Chapter 6. Customizing workspace views 101
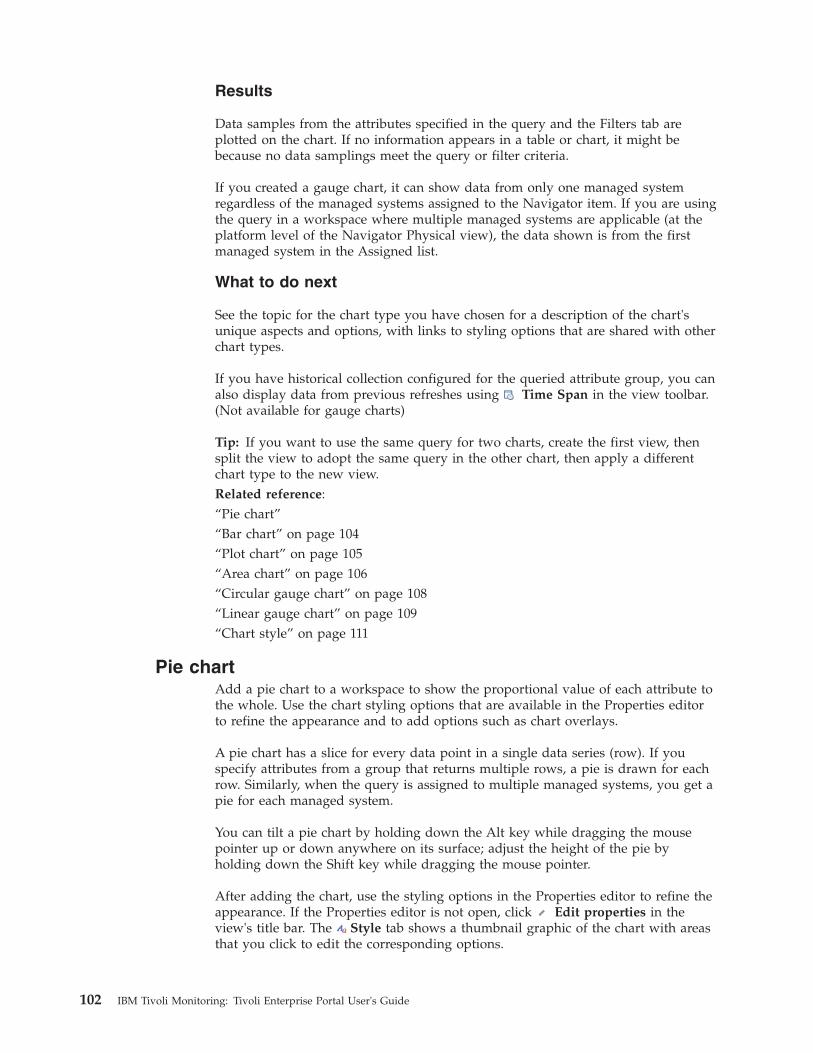
Results
Data samples from the attributes specified in the query and the Filters tab areplotted on the chart. If no information appears in a table or chart, it might bebecause no data samplings meet the query or filter criteria.
If you created a gauge chart, it can show data from only one managed systemregardless of the managed systems assigned to the Navigator item. If you are usingthe query in a workspace where multiple managed systems are applicable (at theplatform level of the Navigator Physical view), the data shown is from the firstmanaged system in the Assigned list.
What to do next
See the topic for the chart type you have chosen for a description of the chart'sunique aspects and options, with links to styling options that are shared with otherchart types.
If you have historical collection configured for the queried attribute group, you canalso display data from previous refreshes using Time Span in the view toolbar.(Not available for gauge charts)
Tip: If you want to use the same query for two charts, create the first view, thensplit the view to adopt the same query in the other chart, then apply a differentchart type to the new view.Related reference:“Pie chart”“Bar chart” on page 104“Plot chart” on page 105“Area chart” on page 106“Circular gauge chart” on page 108“Linear gauge chart” on page 109“Chart style” on page 111
Pie chartAdd a pie chart to a workspace to show the proportional value of each attribute tothe whole. Use the chart styling options that are available in the Properties editorto refine the appearance and to add options such as chart overlays.
A pie chart has a slice for every data point in a single data series (row). If youspecify attributes from a group that returns multiple rows, a pie is drawn for eachrow. Similarly, when the query is assigned to multiple managed systems, you get apie for each managed system.
You can tilt a pie chart by holding down the Alt key while dragging the mousepointer up or down anywhere on its surface; adjust the height of the pie byholding down the Shift key while dragging the mouse pointer.
After adding the chart, use the styling options in the Properties editor to refine theappearance. If the Properties editor is not open, click Edit properties in theview's title bar. The Style tab shows a thumbnail graphic of the chart with areasthat you click to edit the corresponding options.
102 IBM Tivoli Monitoring: Tivoli Enterprise Portal User's Guide
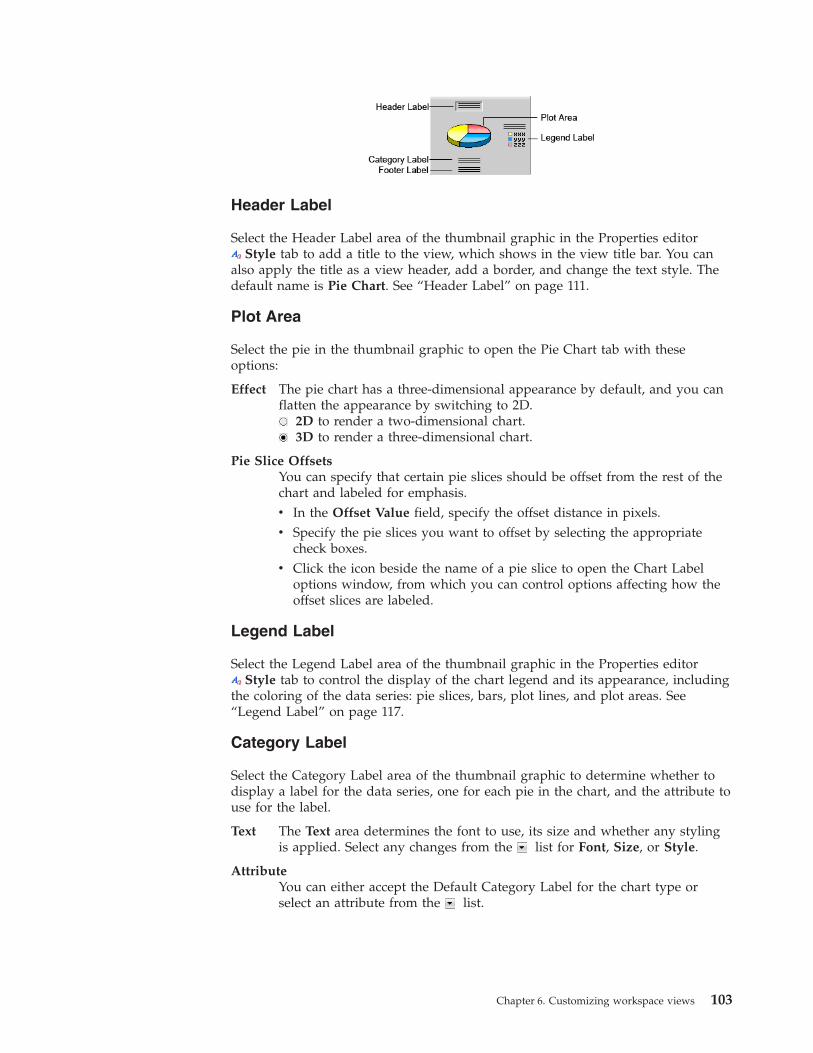
Header Label
Select the Header Label area of the thumbnail graphic in the Properties editorStyle tab to add a title to the view, which shows in the view title bar. You can
also apply the title as a view header, add a border, and change the text style. Thedefault name is Pie Chart. See “Header Label” on page 111.
Plot Area
Select the pie in the thumbnail graphic to open the Pie Chart tab with theseoptions:
Effect The pie chart has a three-dimensional appearance by default, and you canflatten the appearance by switching to 2D.
2D to render a two-dimensional chart.3D to render a three-dimensional chart.
Pie Slice OffsetsYou can specify that certain pie slices should be offset from the rest of thechart and labeled for emphasis.v In the Offset Value field, specify the offset distance in pixels.v Specify the pie slices you want to offset by selecting the appropriate
check boxes.v Click the icon beside the name of a pie slice to open the Chart Label
options window, from which you can control options affecting how theoffset slices are labeled.
Legend Label
Select the Legend Label area of the thumbnail graphic in the Properties editorStyle tab to control the display of the chart legend and its appearance, including
the coloring of the data series: pie slices, bars, plot lines, and plot areas. See“Legend Label” on page 117.
Category Label
Select the Category Label area of the thumbnail graphic to determine whether todisplay a label for the data series, one for each pie in the chart, and the attribute touse for the label.
Text The Text area determines the font to use, its size and whether any stylingis applied. Select any changes from the list for Font, Size, or Style.
AttributeYou can either accept the Default Category Label for the chart type orselect an attribute from the list.
Chapter 6. Customizing workspace views 103
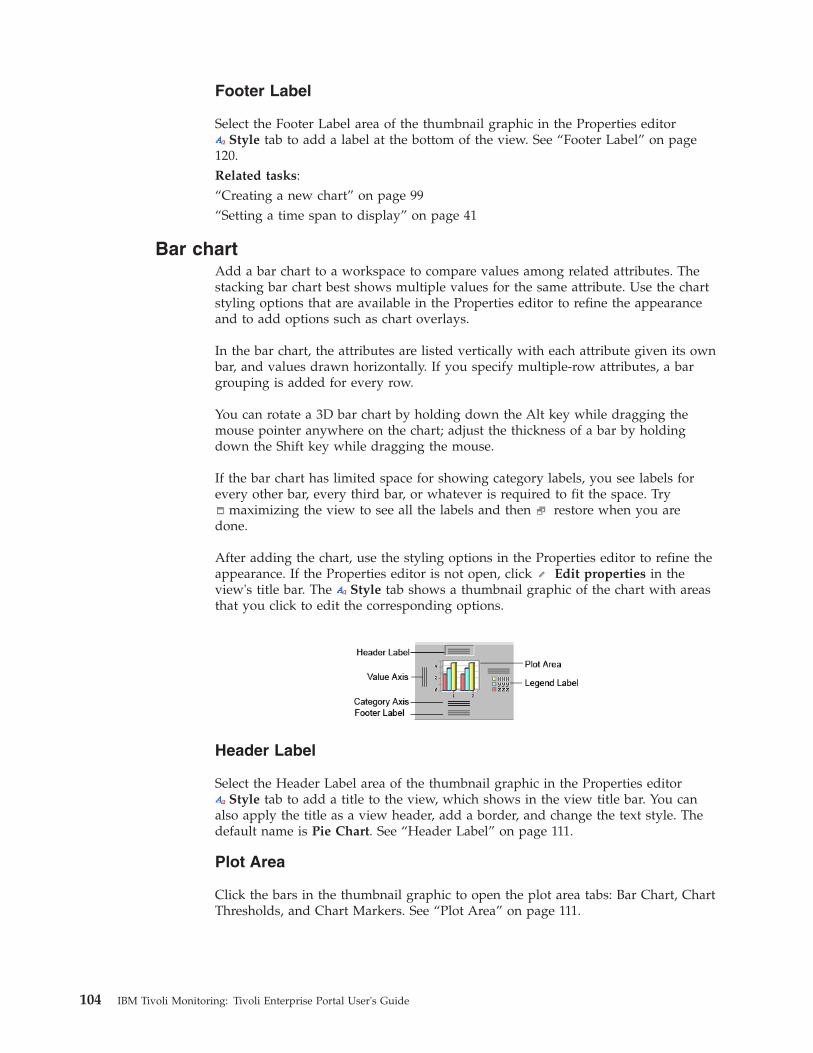
Footer Label
Select the Footer Label area of the thumbnail graphic in the Properties editorStyle tab to add a label at the bottom of the view. See “Footer Label” on page
120.Related tasks:“Creating a new chart” on page 99“Setting a time span to display” on page 41
Bar chartAdd a bar chart to a workspace to compare values among related attributes. Thestacking bar chart best shows multiple values for the same attribute. Use the chartstyling options that are available in the Properties editor to refine the appearanceand to add options such as chart overlays.
In the bar chart, the attributes are listed vertically with each attribute given its ownbar, and values drawn horizontally. If you specify multiple-row attributes, a bargrouping is added for every row.
You can rotate a 3D bar chart by holding down the Alt key while dragging themouse pointer anywhere on the chart; adjust the thickness of a bar by holdingdown the Shift key while dragging the mouse.
If the bar chart has limited space for showing category labels, you see labels forevery other bar, every third bar, or whatever is required to fit the space. Try
maximizing the view to see all the labels and then restore when you aredone.
After adding the chart, use the styling options in the Properties editor to refine theappearance. If the Properties editor is not open, click Edit properties in theview's title bar. The Style tab shows a thumbnail graphic of the chart with areasthat you click to edit the corresponding options.
Header Label
Select the Header Label area of the thumbnail graphic in the Properties editorStyle tab to add a title to the view, which shows in the view title bar. You can
also apply the title as a view header, add a border, and change the text style. Thedefault name is Pie Chart. See “Header Label” on page 111.
Plot Area
Click the bars in the thumbnail graphic to open the plot area tabs: Bar Chart, ChartThresholds, and Chart Markers. See “Plot Area” on page 111.
104 IBM Tivoli Monitoring: Tivoli Enterprise Portal User's Guide
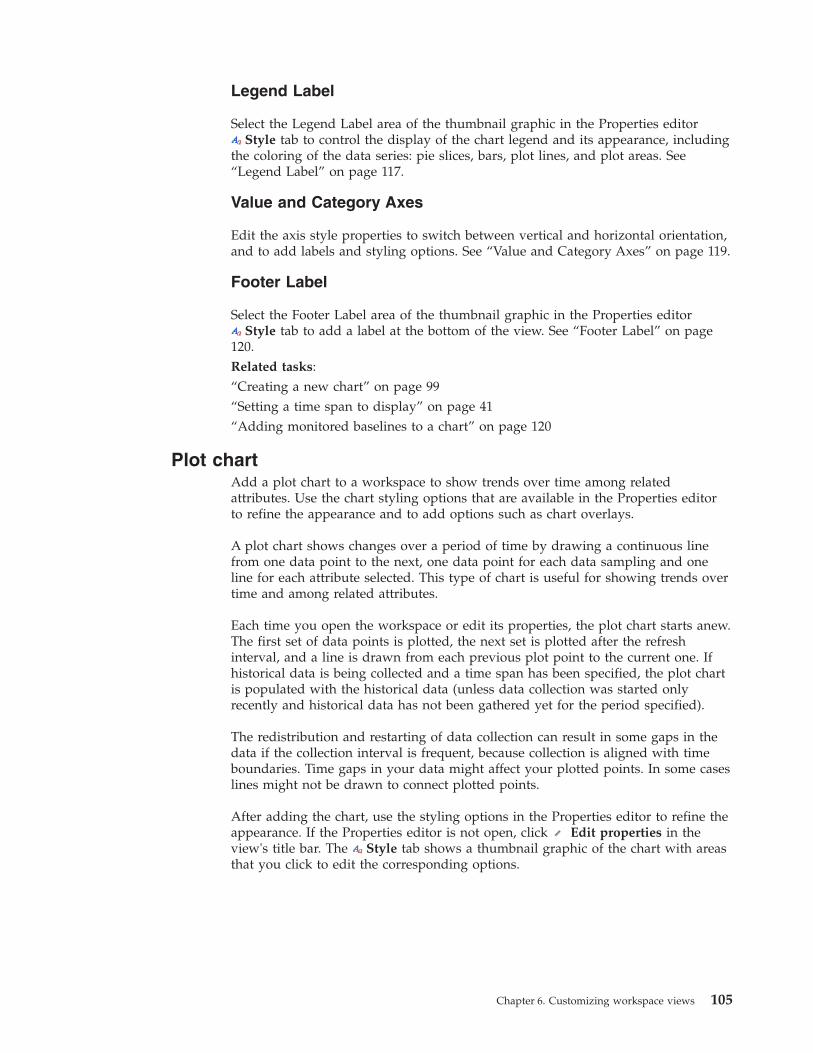
Legend Label
Select the Legend Label area of the thumbnail graphic in the Properties editorStyle tab to control the display of the chart legend and its appearance, including
the coloring of the data series: pie slices, bars, plot lines, and plot areas. See“Legend Label” on page 117.
Value and Category Axes
Edit the axis style properties to switch between vertical and horizontal orientation,and to add labels and styling options. See “Value and Category Axes” on page 119.
Footer Label
Select the Footer Label area of the thumbnail graphic in the Properties editorStyle tab to add a label at the bottom of the view. See “Footer Label” on page
120.Related tasks:“Creating a new chart” on page 99“Setting a time span to display” on page 41“Adding monitored baselines to a chart” on page 120
Plot chartAdd a plot chart to a workspace to show trends over time among relatedattributes. Use the chart styling options that are available in the Properties editorto refine the appearance and to add options such as chart overlays.
A plot chart shows changes over a period of time by drawing a continuous linefrom one data point to the next, one data point for each data sampling and oneline for each attribute selected. This type of chart is useful for showing trends overtime and among related attributes.
Each time you open the workspace or edit its properties, the plot chart starts anew.The first set of data points is plotted, the next set is plotted after the refreshinterval, and a line is drawn from each previous plot point to the current one. Ifhistorical data is being collected and a time span has been specified, the plot chartis populated with the historical data (unless data collection was started onlyrecently and historical data has not been gathered yet for the period specified).
The redistribution and restarting of data collection can result in some gaps in thedata if the collection interval is frequent, because collection is aligned with timeboundaries. Time gaps in your data might affect your plotted points. In some caseslines might not be drawn to connect plotted points.
After adding the chart, use the styling options in the Properties editor to refine theappearance. If the Properties editor is not open, click Edit properties in theview's title bar. The Style tab shows a thumbnail graphic of the chart with areasthat you click to edit the corresponding options.
Chapter 6. Customizing workspace views 105
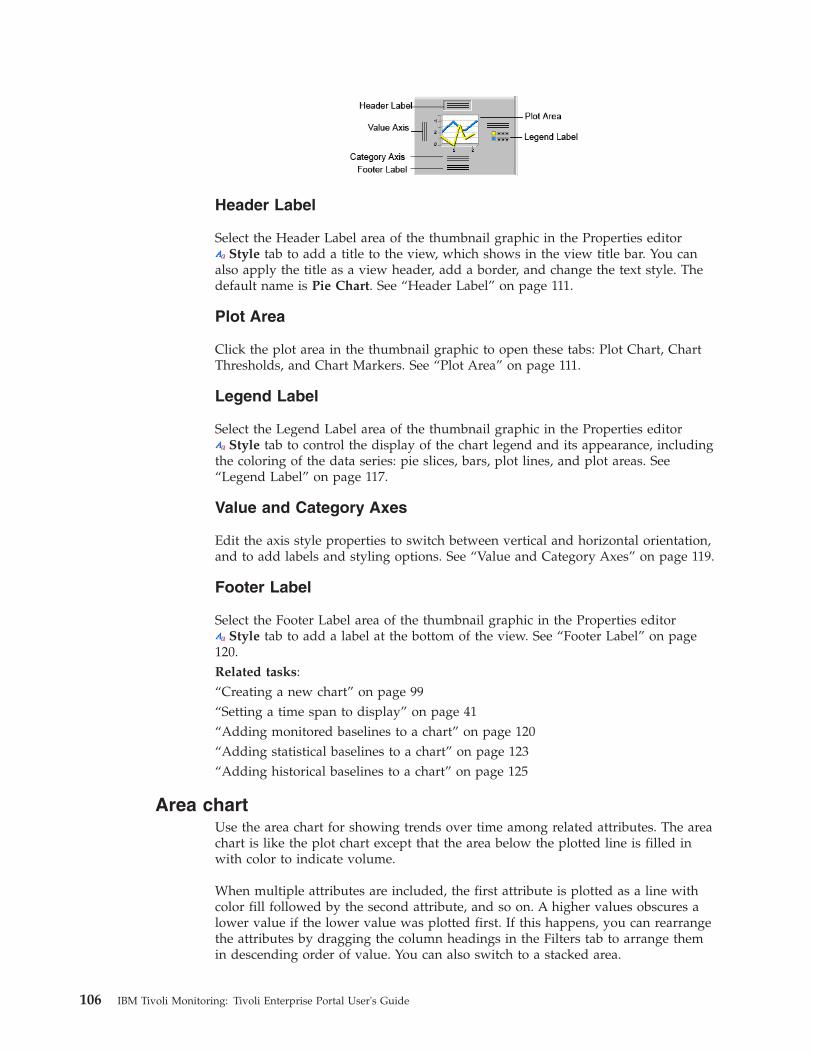
Header Label
Select the Header Label area of the thumbnail graphic in the Properties editorStyle tab to add a title to the view, which shows in the view title bar. You can
also apply the title as a view header, add a border, and change the text style. Thedefault name is Pie Chart. See “Header Label” on page 111.
Plot Area
Click the plot area in the thumbnail graphic to open these tabs: Plot Chart, ChartThresholds, and Chart Markers. See “Plot Area” on page 111.
Legend Label
Select the Legend Label area of the thumbnail graphic in the Properties editorStyle tab to control the display of the chart legend and its appearance, including
the coloring of the data series: pie slices, bars, plot lines, and plot areas. See“Legend Label” on page 117.
Value and Category Axes
Edit the axis style properties to switch between vertical and horizontal orientation,and to add labels and styling options. See “Value and Category Axes” on page 119.
Footer Label
Select the Footer Label area of the thumbnail graphic in the Properties editorStyle tab to add a label at the bottom of the view. See “Footer Label” on page
120.Related tasks:“Creating a new chart” on page 99“Setting a time span to display” on page 41“Adding monitored baselines to a chart” on page 120“Adding statistical baselines to a chart” on page 123“Adding historical baselines to a chart” on page 125
Area chartUse the area chart for showing trends over time among related attributes. The areachart is like the plot chart except that the area below the plotted line is filled inwith color to indicate volume.
When multiple attributes are included, the first attribute is plotted as a line withcolor fill followed by the second attribute, and so on. A higher values obscures alower value if the lower value was plotted first. If this happens, you can rearrangethe attributes by dragging the column headings in the Filters tab to arrange themin descending order of value. You can also switch to a stacked area.
106 IBM Tivoli Monitoring: Tivoli Enterprise Portal User's Guide
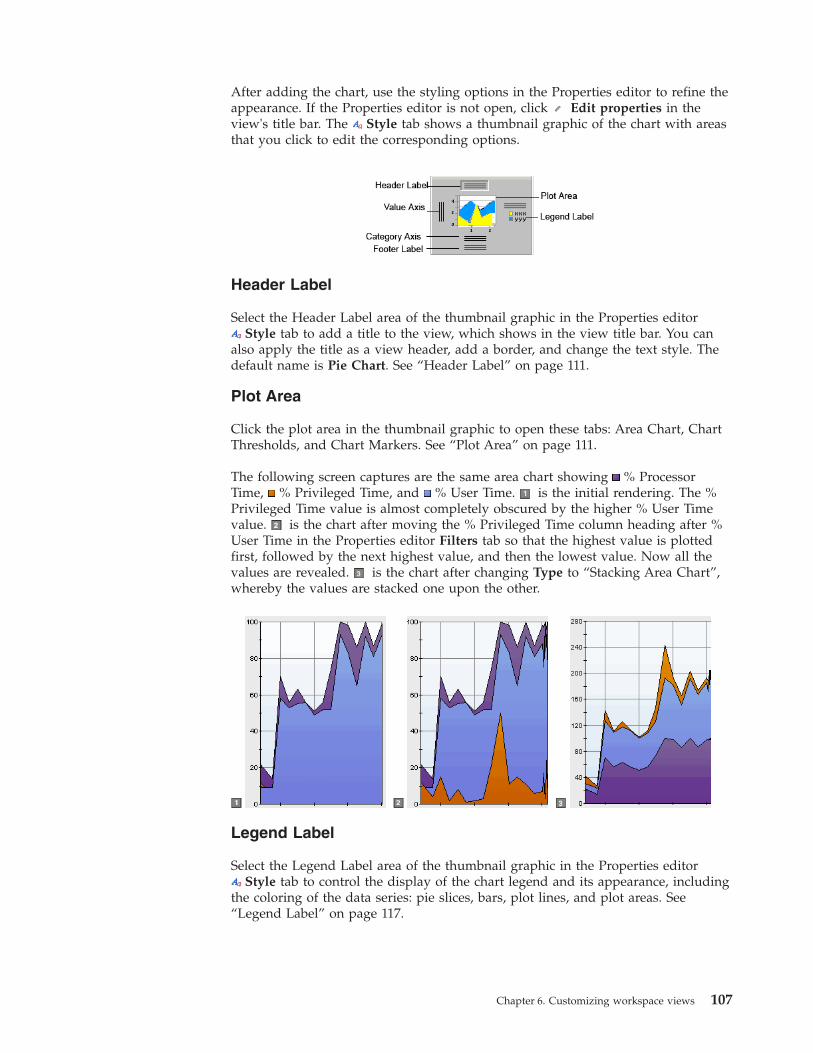
After adding the chart, use the styling options in the Properties editor to refine theappearance. If the Properties editor is not open, click Edit properties in theview's title bar. The Style tab shows a thumbnail graphic of the chart with areasthat you click to edit the corresponding options.
Header Label
Select the Header Label area of the thumbnail graphic in the Properties editorStyle tab to add a title to the view, which shows in the view title bar. You can
also apply the title as a view header, add a border, and change the text style. Thedefault name is Pie Chart. See “Header Label” on page 111.
Plot Area
Click the plot area in the thumbnail graphic to open these tabs: Area Chart, ChartThresholds, and Chart Markers. See “Plot Area” on page 111.
The following screen captures are the same area chart showing % ProcessorTime, % Privileged Time, and % User Time. is the initial rendering. The %Privileged Time value is almost completely obscured by the higher % User Timevalue. is the chart after moving the % Privileged Time column heading after %User Time in the Properties editor Filters tab so that the highest value is plottedfirst, followed by the next highest value, and then the lowest value. Now all thevalues are revealed. is the chart after changing Type to “Stacking Area Chart”,whereby the values are stacked one upon the other.
Legend Label
Select the Legend Label area of the thumbnail graphic in the Properties editorStyle tab to control the display of the chart legend and its appearance, including
the coloring of the data series: pie slices, bars, plot lines, and plot areas. See“Legend Label” on page 117.
Chapter 6. Customizing workspace views 107
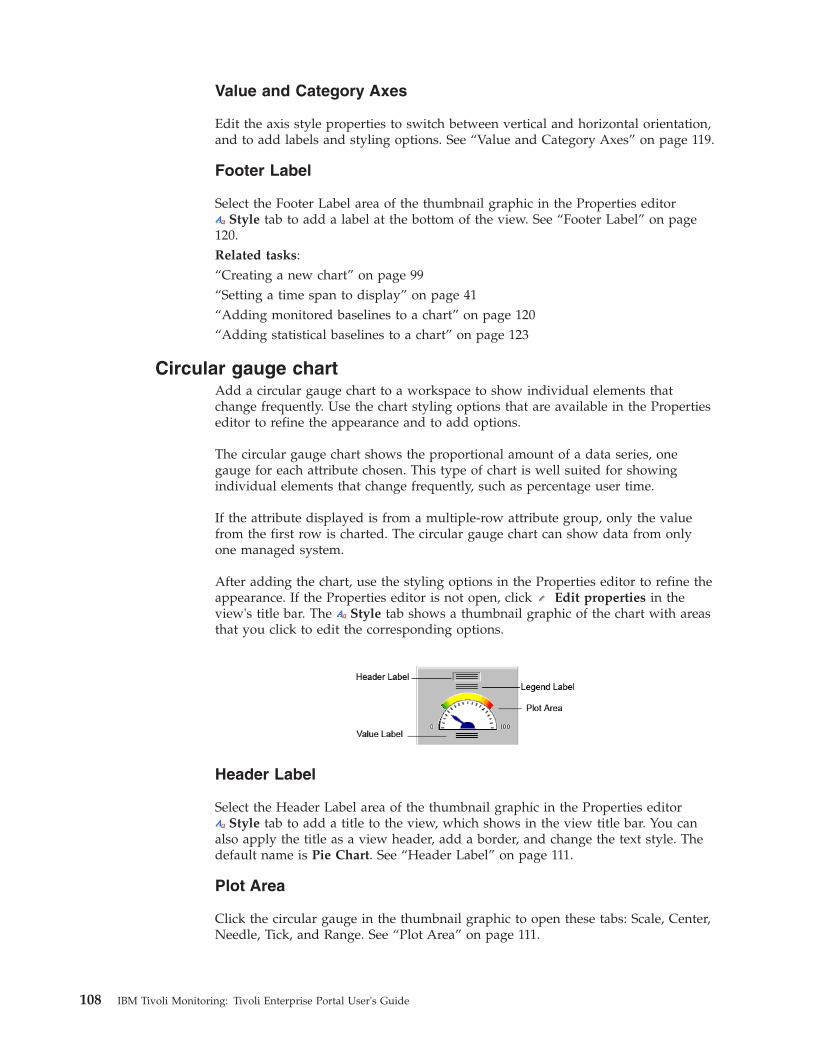
Value and Category Axes
Edit the axis style properties to switch between vertical and horizontal orientation,and to add labels and styling options. See “Value and Category Axes” on page 119.
Footer Label
Select the Footer Label area of the thumbnail graphic in the Properties editorStyle tab to add a label at the bottom of the view. See “Footer Label” on page
120.Related tasks:“Creating a new chart” on page 99“Setting a time span to display” on page 41“Adding monitored baselines to a chart” on page 120“Adding statistical baselines to a chart” on page 123
Circular gauge chartAdd a circular gauge chart to a workspace to show individual elements thatchange frequently. Use the chart styling options that are available in the Propertieseditor to refine the appearance and to add options.
The circular gauge chart shows the proportional amount of a data series, onegauge for each attribute chosen. This type of chart is well suited for showingindividual elements that change frequently, such as percentage user time.
If the attribute displayed is from a multiple-row attribute group, only the valuefrom the first row is charted. The circular gauge chart can show data from onlyone managed system.
After adding the chart, use the styling options in the Properties editor to refine theappearance. If the Properties editor is not open, click Edit properties in theview's title bar. The Style tab shows a thumbnail graphic of the chart with areasthat you click to edit the corresponding options.
Header Label
Select the Header Label area of the thumbnail graphic in the Properties editorStyle tab to add a title to the view, which shows in the view title bar. You can
also apply the title as a view header, add a border, and change the text style. Thedefault name is Pie Chart. See “Header Label” on page 111.
Plot Area
Click the circular gauge in the thumbnail graphic to open these tabs: Scale, Center,Needle, Tick, and Range. See “Plot Area” on page 111.
108 IBM Tivoli Monitoring: Tivoli Enterprise Portal User's Guide
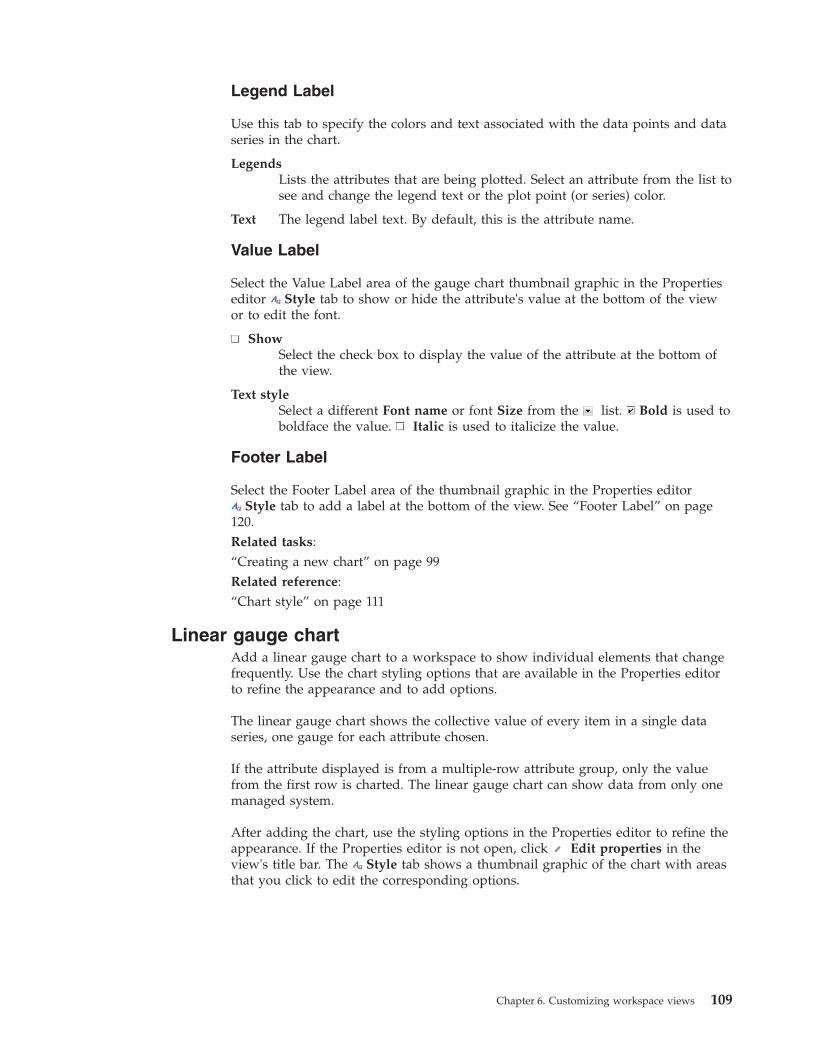
Legend Label
Use this tab to specify the colors and text associated with the data points and dataseries in the chart.
LegendsLists the attributes that are being plotted. Select an attribute from the list tosee and change the legend text or the plot point (or series) color.
Text The legend label text. By default, this is the attribute name.
Value Label
Select the Value Label area of the gauge chart thumbnail graphic in the Propertieseditor Style tab to show or hide the attribute's value at the bottom of the viewor to edit the font.
ShowSelect the check box to display the value of the attribute at the bottom ofthe view.
Text styleSelect a different Font name or font Size from the list. Bold is used toboldface the value. Italic is used to italicize the value.
Footer Label
Select the Footer Label area of the thumbnail graphic in the Properties editorStyle tab to add a label at the bottom of the view. See “Footer Label” on page
120.Related tasks:“Creating a new chart” on page 99Related reference:“Chart style” on page 111
Linear gauge chartAdd a linear gauge chart to a workspace to show individual elements that changefrequently. Use the chart styling options that are available in the Properties editorto refine the appearance and to add options.
The linear gauge chart shows the collective value of every item in a single dataseries, one gauge for each attribute chosen.
If the attribute displayed is from a multiple-row attribute group, only the valuefrom the first row is charted. The linear gauge chart can show data from only onemanaged system.
After adding the chart, use the styling options in the Properties editor to refine theappearance. If the Properties editor is not open, click Edit properties in theview's title bar. The Style tab shows a thumbnail graphic of the chart with areasthat you click to edit the corresponding options.
Chapter 6. Customizing workspace views 109
Header Label
Select the Header Label area of the thumbnail graphic in the Properties editorStyle tab to add a title to the view, which shows in the view title bar. You can
also apply the title as a view header, add a border, and change the text style. Thedefault name is Pie Chart. See “Header Label” on page 111.
Plot Area
Click the linear gauge in the thumbnail graphic to open these tabs: Scale, Needle,Tick, and Range. See “Plot Area” on page 111.
Legend Label
Use this tab to specify the colors and text associated with the data points and dataseries in the chart.
LegendsLists the attributes that are being plotted. Select an attribute from the list tosee and change the legend text or the plot point (or series) color.
Text The legend label text. By default, this is the attribute name.
Value Label
Select the Value Label area of the gauge chart thumbnail graphic in the Propertieseditor Style tab to show or hide the attribute's value at the bottom of the viewor to edit the font.
ShowSelect the check box to display the value of the attribute at the bottom ofthe view.
Text styleSelect a different Font name or font Size from the list. Bold is used toboldface the value. Italic is used to italicize the value.
Footer Label
Select the Footer Label area of the thumbnail graphic in the Properties editorStyle tab to add a label at the bottom of the view. See “Footer Label” on page
120.
110 IBM Tivoli Monitoring: Tivoli Enterprise Portal User's Guide
Related tasks:“Creating a new chart” on page 99Related reference:“Chart style”
Chart styleThe Style tab in the Properties editor to refine the appearance of the chart. Forthe bar, plot, and area charts, this is also where you can specify a line chart overlayand threshold indicators.
Header LabelSelect the Header Label area of the thumbnail graphic in the Properties editor
Style tab to add a title to the view, which shows in the view title bar. You canalso apply the title as a view header, add a border, and change the text style.
ShowSelect the check box to display the title as a header.
Show BorderSelect the check box to display a border around the header label.
Text This text you enter here becomes the view title and is displayed in the titlebar and, if you selected Show, in the header.
Text styleSelect a different Font name or font Size from the list. Bold makesthe header text boldface. Italic makes the header text italicized. WhenUse CSS values is selected, this area is disabled.
Use CSS valuesThis is set to use the values of the workspace presentation cascading stylesheet (ws_pres.css) for the label text (header, footer, and chart legend) .This option is useful for text in double-byte character set (DBCS) languagesthat are more legible with a different font styling than the defaults. TheTivoli Enterprise Portal administrator can edit the ws_pres.css style sheetin the Install_dir\cnb (Windows); cw (Linux)\classes\candle\fw\stylesdirectory on the computer where the Tivoli Enterprise Portal Server isinstalled, to establish a specific font style that will be used for all label textand that will not be overwritten whenever your installation is upgraded toa new release.
Clear the check box if you want to use the font styling that is specified inthe Text style area.
Plot AreaThe chart data is rendered in the plot area. The plot area has such styling optionsas stacking the data series and adding threshold indicators.
The tabs that are displayed depend on the chart type: “<Chart type> Chart” for piecharts, bar charts, plot charts and area charts; “Chart Thresholds” on page 112 and“Chart Markers” on page 113 for bar charts, plot charts, and area charts; and“Scale” on page 114, “Center” on page 115, “Needle” on page 115, “Tick” on page115, and “Range” on page 115 for gauge charts.
<Chart type> Chart
Pie charts, bar charts, plot charts and area charts have this tab for effects that areunique to the chart.
Chapter 6. Customizing workspace views 111
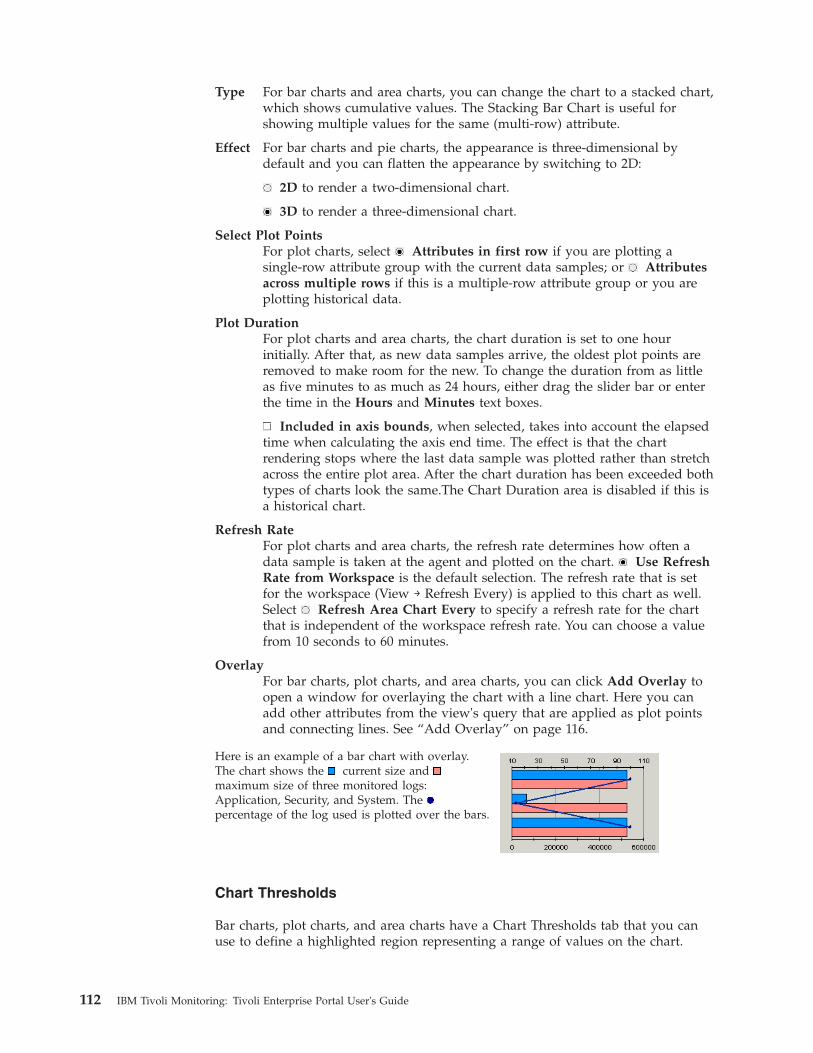
Type For bar charts and area charts, you can change the chart to a stacked chart,which shows cumulative values. The Stacking Bar Chart is useful forshowing multiple values for the same (multi-row) attribute.
Effect For bar charts and pie charts, the appearance is three-dimensional bydefault and you can flatten the appearance by switching to 2D:
2D to render a two-dimensional chart.
3D to render a three-dimensional chart.
Select Plot PointsFor plot charts, select Attributes in first row if you are plotting asingle-row attribute group with the current data samples; or Attributesacross multiple rows if this is a multiple-row attribute group or you areplotting historical data.
Plot DurationFor plot charts and area charts, the chart duration is set to one hourinitially. After that, as new data samples arrive, the oldest plot points areremoved to make room for the new. To change the duration from as littleas five minutes to as much as 24 hours, either drag the slider bar or enterthe time in the Hours and Minutes text boxes.
Included in axis bounds, when selected, takes into account the elapsedtime when calculating the axis end time. The effect is that the chartrendering stops where the last data sample was plotted rather than stretchacross the entire plot area. After the chart duration has been exceeded bothtypes of charts look the same.The Chart Duration area is disabled if this isa historical chart.
Refresh RateFor plot charts and area charts, the refresh rate determines how often adata sample is taken at the agent and plotted on the chart. Use RefreshRate from Workspace is the default selection. The refresh rate that is setfor the workspace (View → Refresh Every) is applied to this chart as well.Select Refresh Area Chart Every to specify a refresh rate for the chartthat is independent of the workspace refresh rate. You can choose a valuefrom 10 seconds to 60 minutes.
OverlayFor bar charts, plot charts, and area charts, you can click Add Overlay toopen a window for overlaying the chart with a line chart. Here you canadd other attributes from the view's query that are applied as plot pointsand connecting lines. See “Add Overlay” on page 116.
Here is an example of a bar chart with overlay.The chart shows the current size andmaximum size of three monitored logs:Application, Security, and System. Thepercentage of the log used is plotted over the bars.
Chart Thresholds
Bar charts, plot charts, and area charts have a Chart Thresholds tab that you canuse to define a highlighted region representing a range of values on the chart.
112 IBM Tivoli Monitoring: Tivoli Enterprise Portal User's Guide
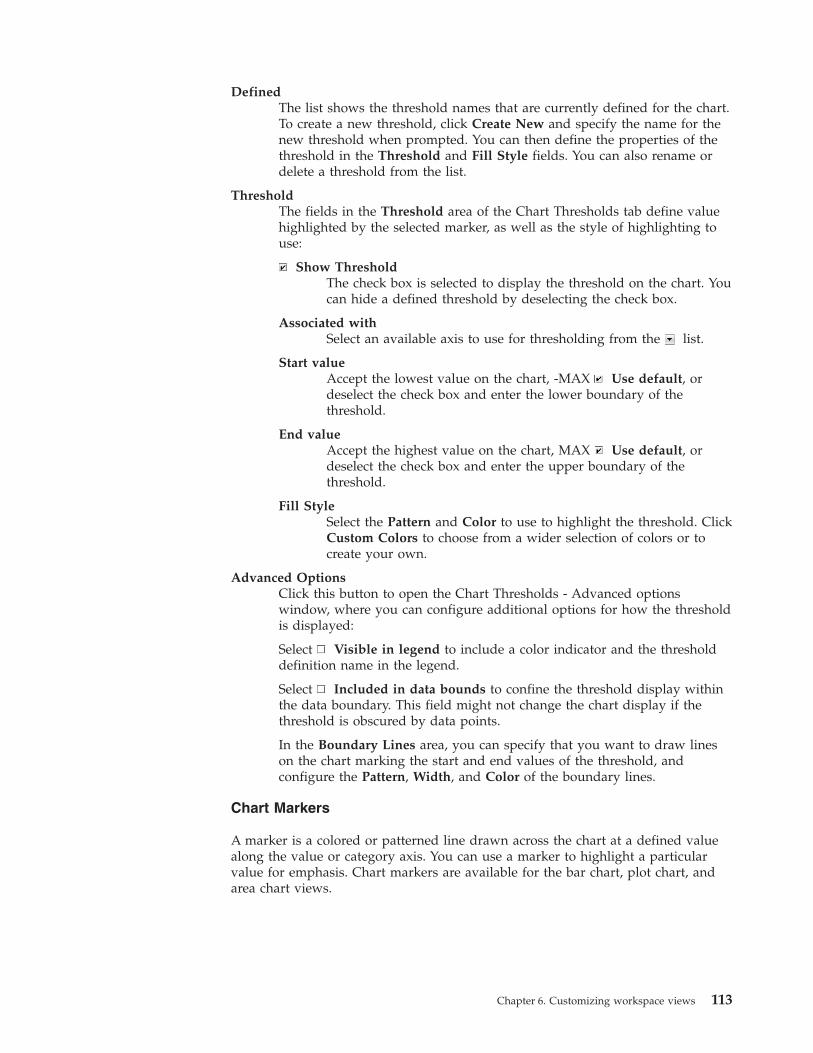
DefinedThe list shows the threshold names that are currently defined for the chart.To create a new threshold, click Create New and specify the name for thenew threshold when prompted. You can then define the properties of thethreshold in the Threshold and Fill Style fields. You can also rename ordelete a threshold from the list.
ThresholdThe fields in the Threshold area of the Chart Thresholds tab define valuehighlighted by the selected marker, as well as the style of highlighting touse:
Show ThresholdThe check box is selected to display the threshold on the chart. Youcan hide a defined threshold by deselecting the check box.
Associated withSelect an available axis to use for thresholding from the list.
Start valueAccept the lowest value on the chart, -MAX Use default, ordeselect the check box and enter the lower boundary of thethreshold.
End valueAccept the highest value on the chart, MAX Use default, ordeselect the check box and enter the upper boundary of thethreshold.
Fill StyleSelect the Pattern and Color to use to highlight the threshold. ClickCustom Colors to choose from a wider selection of colors or tocreate your own.
Advanced OptionsClick this button to open the Chart Thresholds - Advanced optionswindow, where you can configure additional options for how the thresholdis displayed:
Select Visible in legend to include a color indicator and the thresholddefinition name in the legend.
Select Included in data bounds to confine the threshold display withinthe data boundary. This field might not change the chart display if thethreshold is obscured by data points.
In the Boundary Lines area, you can specify that you want to draw lineson the chart marking the start and end values of the threshold, andconfigure the Pattern, Width, and Color of the boundary lines.
Chart Markers
A marker is a colored or patterned line drawn across the chart at a defined valuealong the value or category axis. You can use a marker to highlight a particularvalue for emphasis. Chart markers are available for the bar chart, plot chart, andarea chart views.
Chapter 6. Customizing workspace views 113
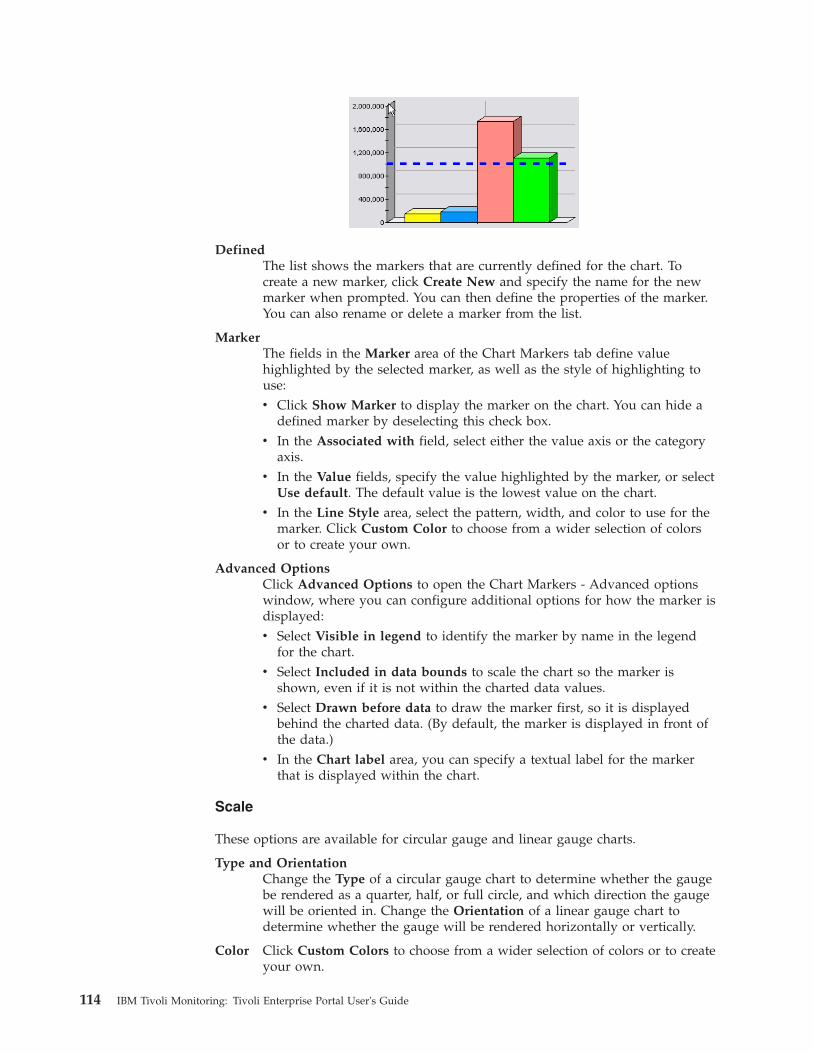
DefinedThe list shows the markers that are currently defined for the chart. Tocreate a new marker, click Create New and specify the name for the newmarker when prompted. You can then define the properties of the marker.You can also rename or delete a marker from the list.
MarkerThe fields in the Marker area of the Chart Markers tab define valuehighlighted by the selected marker, as well as the style of highlighting touse:v Click Show Marker to display the marker on the chart. You can hide a
defined marker by deselecting this check box.v In the Associated with field, select either the value axis or the category
axis.v In the Value fields, specify the value highlighted by the marker, or select
Use default. The default value is the lowest value on the chart.v In the Line Style area, select the pattern, width, and color to use for the
marker. Click Custom Color to choose from a wider selection of colorsor to create your own.
Advanced OptionsClick Advanced Options to open the Chart Markers - Advanced optionswindow, where you can configure additional options for how the marker isdisplayed:v Select Visible in legend to identify the marker by name in the legend
for the chart.v Select Included in data bounds to scale the chart so the marker is
shown, even if it is not within the charted data values.v Select Drawn before data to draw the marker first, so it is displayed
behind the charted data. (By default, the marker is displayed in front ofthe data.)
v In the Chart label area, you can specify a textual label for the markerthat is displayed within the chart.
Scale
These options are available for circular gauge and linear gauge charts.
Type and OrientationChange the Type of a circular gauge chart to determine whether the gaugebe rendered as a quarter, half, or full circle, and which direction the gaugewill be oriented in. Change the Orientation of a linear gauge chart todetermine whether the gauge will be rendered horizontally or vertically.
Color Click Custom Colors to choose from a wider selection of colors or to createyour own.
114 IBM Tivoli Monitoring: Tivoli Enterprise Portal User's Guide
Center
These options are available for circular gauge charts.
Show CenterClick Show Center to display the center of the gauge. You can hide thecenter by deselecting this check box.
Color Select the color to use for the center. Click Custom Color to choose from awider selection of colors or to create your own.
Needle
These options are available for circular gauge and linear gauge charts.
Style Change the Style of the needle to determine the shape of the needle on therendered gauge. The available options are arrow, pointer, rectangle, tailedarrow, tailed pointer, and triangle. The default type is line.
LengthChange the Length of the needle to determine its span across the renderedgauge. This is displayed as a sliding scale.
Width Change the Width of the needle to determine its width on the renderedgauge. This is displayed as a sliding scale.
Color Select the color to use for the needle. Click Custom Color to choose from awider selection of colors or to create your own.
Tick
These options are available for circular gauge and linear gauge charts.
Type Change the Type of the tick marks to determine their shape on therendered gauge. The available options are circle, line, rectangle, reversetriangle, and triangle. The default type is line.
Tick Mark ColorSelect the color to use for the tick marks. Click Custom Colors to choosefrom a wider selection of colors or to create your own.
Label You can click Show Tick Labels to turn off the range number that isdisplayed next to the tick mark. You can also select the color to use for thelabels. Click Custom Color to choose from a wider selection of colors or tocreate your own.
Range
These options are available for circular gauge and linear gauge charts.
AttributeSelect the attribute to which the specified range applies. If you chosemultiple attributes for the view, you can select another attribute from thelist.
Range Values (Minimum Value and Maximum Value)Minimum Value shows the default lowest possible value for the selectedattribute. You can edit the values to reflect a more realistic range, ifneeded. Select Use Default to return to the original values. MaximumValue shows the default highest possible value for the selected attribute.
Chapter 6. Customizing workspace views 115
Specify a more realistic range, to decrease the data points in the gauge.Select Use Default to return to the original values.
Edit SubrangesYou can add subranges for the range specified by clicking EditSubranges... and defining a subrange by following the same procedureused to define the range.
Apply to all views that use this attributeApply to all views that use this attribute lets you apply this range, if
appropriate, to this attribute on all other managed systems. The range isused only for gauge views of this attribute.
Add OverlayAfter clicking the Plot Area of the chart's thumbnail graphic, the Bar Chart, PlotChart, or Area Chart tab is displayed. This tab includes the Add Overlay buttonfor creating a line chart overlay on the current chart.
Use this button to apply a line chart that overlays the plot area of the chart.
Attributes
The Attributes tab has the required fields for assigning the attributes to plot in theoverlaying line chart, one attribute per line.
AttributesSelect an attribute from the Available list and click to move it to theassigned list. You can use Ctrl+click to select multiple attributes orShift+click to select all attributes from the first one selected to this one.
Each attribute will have a different line color and can be styled to changethe line type, line color, and legend symbol. To change the styling of theline chart, click an attribute in the Assigned list. This enables the AttributeStyle fields, described next. After modifying the style for an attribute,repeat for any other assigned attributes.
Text The attribute name will be displayed in the legend label, or you can writesomething else here.
Line StyleThe line style is a solid 3-pixel wide line, or you can select one of thebroken line styles from the Pattern and another thickness from 1 to 10from the Width list. The overlay line width is 3 pixels or you can selectany value from 1 pixel to 10 pixels. Use the Color list to see and select adifferent color for the overlay and its associated legend item, or clickCustom Colors to select or create a new color to represent the attribute.
Symbol StyleThe default shape that will appear in the legend is a disc, or you can selectanother from the Shape list. The size of the shape is 5 pixels or you canselect another size from the Size list. Use the Color list to see andselect a different color for the shape, or click Custom Colors to select orcreate a new color.
Value Axis
Value AxisUse existing Value Axis disables all other fields in this tab and the Axis
Label tab that would otherwise be applied to the new value axis.
116 IBM Tivoli Monitoring: Tivoli Enterprise Portal User's Guide
Use new Value Axis creates a new value axis for the overlay line chart.The Axis Parameters settings are applied to the new value axis, as are thesettings in the Axis Label tab.
To see where the new value axis would be displayed in the chart, positionthe Add Overlay window so that you can see the Preview area of theProperties editor and then select the other radio button.
Axis ParametersShow Grid is used to apply grid lines to the plot area background for
the overlay values.
Font is the font to use for the axis values; Size is the font size in points;and Style is the font style applied to the axis values: Plain, Bold, Italic, orBold & Italic.
Horizontal applies the overlay axis values horizontally.
Vertical rotates the values to display them vertically along the overlayaxis.
Axis Label
Label Show Text is selected to apply a label to the overlay value axis.
Text is the label for the overlay value axis.
Font is the font to use for the label; Size is the font size in points; andStyle is the font style applied to the label: Plain, Bold, Italic, or Bold &Italic.
OrientationHorizontal applies the axis label horizontally.
Vertical rotates the label to display it vertically along the overlay axis.
Legend LabelSelect the Legend Label area of the thumbnail graphic in the Properties editor
Style tab to control the display of the chart legend and its appearance, includingthe coloring of the data series: pie slices, bars, plot lines, and plot areas.
Show Legend - General
Use this tab to specify whether or not to display a legend for the chart, itsplacement, and its appearance. This tab is not available for gauge charts.
Show LegendDisplays the legend with the chart.
Show BorderDraws a border line around the legend box.
PositionThe placement of the chart legend in the view. The default position is theRight side of the view. You can select a different position from the list.
Place Legend in collapsible panelWhen selected, creates a separate bordered pane for the legend inside theview that you can scroll, collapse, or drag to adjust the width.
Trim Legend LabelsWhen selected, trims the legend labels to the boundaries of the legend boxor panel in the manner specified in the Trim Style list.
Chapter 6. Customizing workspace views 117
Text The Text area determines the font to use, its size and whether any stylingis applied. Select any changes from the list for Font, Size, or Style.When Use CSS values is selected, this area is disabled.
Use CSS valuesThis is set to use the values of the workspace presentation cascading stylesheet (ws_pres.css) for the label text (header, footer, and chart legend) .This option is useful for text in double-byte character set (DBCS) languagesthat are more legible with a different font styling than the defaults. TheTivoli Enterprise Portal administrator can edit the ws_pres.css style sheetin the Install_dir\cnb (Windows); cw (Linux)\classes\candle\fw\stylesdirectory on the computer where the Tivoli Enterprise Portal Server isinstalled, to establish a specific font style that will be used for all label textand that will not be overwritten whenever your installation is upgraded toa new release.
Clear the check box if you want to use the font styling that is specified inthe Text style area.
Legend Label
Use this tab to specify the colors and text associated with the data points and dataseries in the chart.
LegendsLists the attributes that are being plotted. Select an attribute from the list tosee and change the legend text or the plot point (or series) color.
Text The legend label text. By default, this is the attribute name.
Fill StyleFor pie charts, bar charts, and area charts, you can select a Fill Pattern orColor from the list for the data point and its associated legend item. If youwant more color choices, click Custom Colors and select from a broaderrange of colors or create a new color.
Line StyleFor plot charts, you can select a line pattern and width for each attribute'sline on the chart. You can also select the color to use for the lines. ClickCustom Colors to choose from a wider selection of colors or to create yourown.
Symbol StyleFor plot charts, you can select a symbol and size for each data point on anattribute's line. You can also select the color to use for the symbols. ClickCustom Colors to choose from a wider selection of colors or to create yourown.
Custom ColorThe Custom Color window enables you to customize the color to exactly what youwant.
SwatchesSelect a color in the Swatches tab or create a new color in the HSB or RGBtab.
HSB HSB displays a color box and vertical slider bar for adjusting the Hue andSaturation or Brightness and RGB values. Click the H, S or B radio button,and drag the small selection ring through the color box:v As you move from left to right, Hue goes from 0 to 360 degrees and
Saturation goes from 100% down to 0%
118 IBM Tivoli Monitoring: Tivoli Enterprise Portal User's Guide
v As you move from top to bottom, Brightness diminishes.
Notice the values of the two unselected elements change as you drag theselection ring, but not that of the one selected. Drag the vertical slider barup and down to change the value of the selected element.
RGB The RGB tab has horizontal sliders to adjust the Red, Green and Bluevalues.
Value and Category AxesEdit the axis style properties to switch between vertical and horizontal orientation,and to add labels and styling options.
The value axis is arranged vertically and the category axis is arranged horizontallywith tick marks and numbers at regular intervals to represent the full range ofattribute values being plotted. Click the Value Axis or Category Axis of the barchart, plot chart, or area chart thumbnail graphic to see the General, Axis Labeland Value Axis tabs:
General
Value Axis - General tab and Category Axis - General tab:
Show GridThe axis already draws a line for the unit measurement, and you can crossthese lines with grid lines to aid the reader in following the axis tick markvalues.
Invert Category Axis and Value AxisSwitches the position of the value axis with the category axis so the valuesare written horizontally along the bottom of the chart and the category(refresh interval times) axis is vertical.
Label
Axis Label tab:
Label Show Text displays a label for the category axis or value axis (such as"Bytes per second""). Type the label in the Text field. Select any formattingchanges from the list for Font, Size, or Style.
OrientationThe label can be written horizontally or vertically. Choose the orientationthat fits best in the space.
Axis
Value Axis tab and Category Axis tab:
Text The Text area determines the font to use, its size and whether any stylingis applied. Select any changes from the list for Font, Size, or Style.
OrientationThe text for the axis tick marks can be written horizontally, diagonally, orvertically. You can select each radio button and see in the chart Previewarea how the labels are displayed with that orientation. You also have theslider bar for adjusting the rotation angle from 0° to 180°.
Chapter 6. Customizing workspace views 119
Footer LabelSelect the Footer Label area of the thumbnail graphic in the Properties editor
Style tab to add a label at the bottom of the view.
ShowSelect the check box to display the contents of the Text field at the bottomof the view.
Text This is the text to display as the footer if you selected Show.
Text styleSelect a different Font name or font Size from the list. Bold makesthe footer text boldface. Italic makes the footer text italicized. If UseCSS values is selected, this area is disabled.
Use CSS valuesThis is set to use the values of the workspace presentation cascading stylesheet (ws_pres.css) for the label text (header, footer, and chart legend) .This option is useful for text in double-byte character set (DBCS) languagesthat are more legible with a different font styling than the defaults. TheTivoli Enterprise Portal administrator can edit the ws_pres.css style sheetin the Install_dir\cnb (Windows); cw (Linux)\classes\candle\fw\stylesdirectory on the computer where the Tivoli Enterprise Portal Server isinstalled, to establish a specific font style that will be used for all label textand that will not be overwritten whenever your installation is upgraded toa new release.
Clear the check box if you want to use the font styling that is specified inthe Text style area.
Chart baselinesUse the values from the current bar chart, plot chart, or area chart to performpredictive and trend analysis of threshold conditions. You can then anticipateproblems or predict future values by comparing current values with past results, oroverlay the chart with situation comparison criteria.Related tasks:“Modeling a situation with view data” on page 278
Adding monitored baselines to a chartApply a monitored baseline of a situation's threshold criteria to a bar chart, plotchart, or area chart to see how effective the situation is in this environment. Youcan visually compare the current values in the chart with the situation and adjustthe thresholds as needed.
Before you begin
Monitored baselining works by comparing the values in the chart with thecomparison criteria of a situation. You must have a situation defined with at leastone of the attributes in the chart and the situation distributed to the managedsystem (or managed systems) assigned to the workspace.
The situation is ineligible for monitored baselines if the formula has embedded orcorrelated situations or uses a group function (such as count or sum), in whichcase the Add Monitored Baseline window does not open when you click AddMonitored Baseline.
120 IBM Tivoli Monitoring: Tivoli Enterprise Portal User's Guide
The monitored baseline tool does not show in the view toolbar if the numericvalues in the chart are the result of a calculation. An example is the Open SituationCounts - Last 24 Hours chart in the Enterprise Status workspace.
About this task
Take these steps to add a monitored baseline to the chart.
Procedure1. Click Add Monitored Baseline in a bar chart, plot chart, or area chart. The
Add Monitored Baseline window opens with a list of eligible situations toselect from.
2. Click the situation that you want to apply baselines from. Use Ctrl + click toselect multiple situations, Ctrl + click a selected situation to deselect it, andShift + click to select all situations between the one previously selected and thisone.
3. If the situation has expression overrides ( icon in the Overrides Existcolumn) and you want to see which threshold (the original or the override) isused at the sampling time, select the Show effective thresholds only checkbox. See “Monitored baselines chart examples” on page 122.
4. To apply the selected baseline or baselines to the chart, click Apply to keep thedialog open or OK to close it.
Results
The comparison criteria of the situation is displayed as a line or a pattern behindthe plotted values. Any situation override thresholds are indicated by broken linesduring the scheduled time when they apply.
What to do next
You can perform any of these activities in the monitored baseline chart:v Move the mouse pointer over a baseline to highlight it and see the situation
formula.v Move the mouse pointer over a plot point to see the value, the name of the
attribute, and when the data sample was taken.v Click and drag to select a smaller time range to zoom in on, and then press Esc
to zoom out.v Right-click a monitored baseline and click Edit Situation to launch the Situation
editor; or click Edit Override to launch the Expression Override editor.v Right-click a plot point and click Model Situation to open the Model Situation
chart and populate the attributes table with the values from the plot point. Afterperforming additional analysis, you can create a new situation with thecalculated values and edit them as needed.
v Remove the monitored baseline from the chart: Click Add Monitored Baselineand Ctrl + click a situation.
v Apply another type of baseline if this is an area chart or plot chart: AddStatistical Baseline and, for plot charts only, Add Historical Baseline.
Chapter 6. Customizing workspace views 121
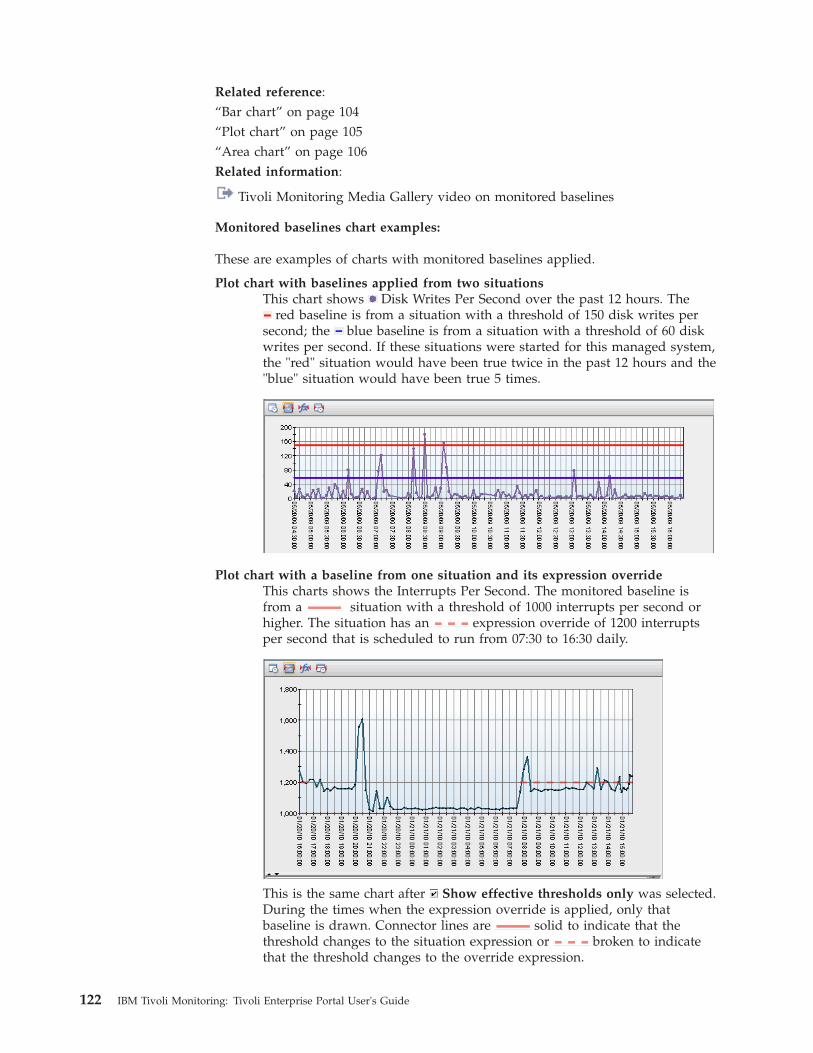
Related reference:“Bar chart” on page 104“Plot chart” on page 105“Area chart” on page 106Related information:
Tivoli Monitoring Media Gallery video on monitored baselines
Monitored baselines chart examples:
These are examples of charts with monitored baselines applied.
Plot chart with baselines applied from two situationsThis chart shows Disk Writes Per Second over the past 12 hours. The
red baseline is from a situation with a threshold of 150 disk writes persecond; the blue baseline is from a situation with a threshold of 60 diskwrites per second. If these situations were started for this managed system,the "red" situation would have been true twice in the past 12 hours and the"blue" situation would have been true 5 times.
Plot chart with a baseline from one situation and its expression overrideThis charts shows the Interrupts Per Second. The monitored baseline isfrom a situation with a threshold of 1000 interrupts per second orhigher. The situation has an expression override of 1200 interruptsper second that is scheduled to run from 07:30 to 16:30 daily.
This is the same chart after Show effective thresholds only was selected.During the times when the expression override is applied, only thatbaseline is drawn. Connector lines are solid to indicate that thethreshold changes to the situation expression or broken to indicatethat the threshold changes to the override expression.
122 IBM Tivoli Monitoring: Tivoli Enterprise Portal User's Guide
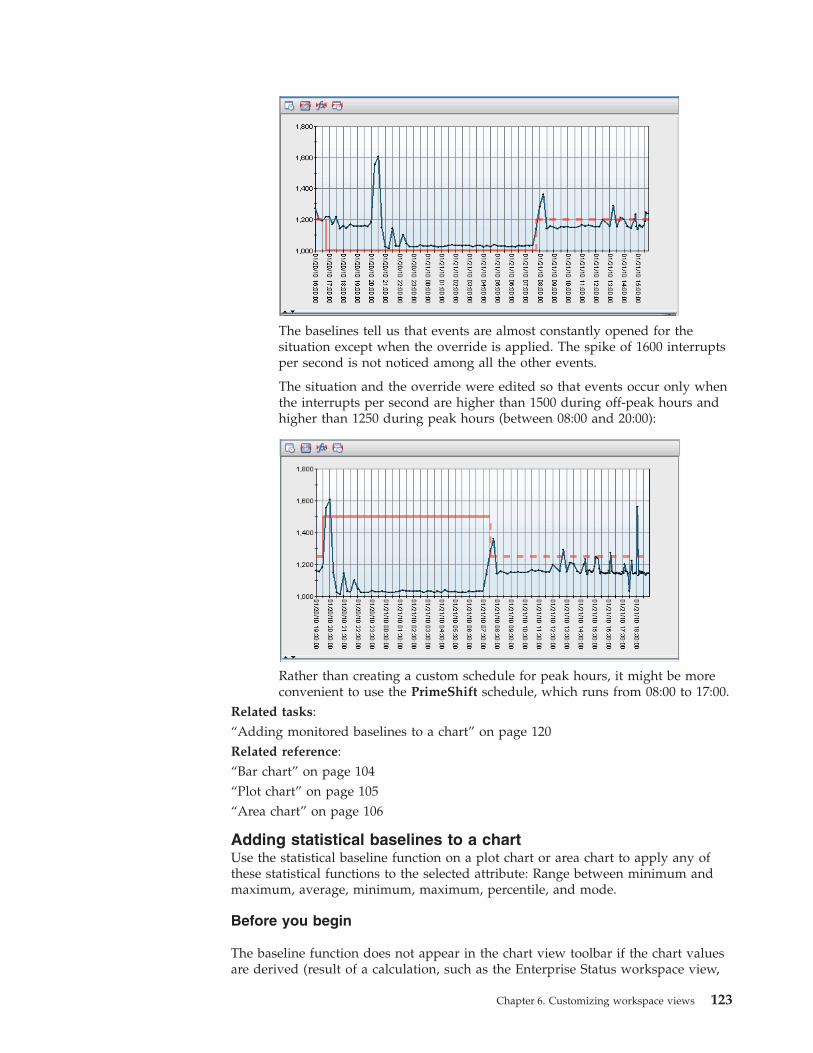
The baselines tell us that events are almost constantly opened for thesituation except when the override is applied. The spike of 1600 interruptsper second is not noticed among all the other events.
The situation and the override were edited so that events occur only whenthe interrupts per second are higher than 1500 during off-peak hours andhigher than 1250 during peak hours (between 08:00 and 20:00):
Rather than creating a custom schedule for peak hours, it might be moreconvenient to use the PrimeShift schedule, which runs from 08:00 to 17:00.
Related tasks:“Adding monitored baselines to a chart” on page 120Related reference:“Bar chart” on page 104“Plot chart” on page 105“Area chart” on page 106
Adding statistical baselines to a chartUse the statistical baseline function on a plot chart or area chart to apply any ofthese statistical functions to the selected attribute: Range between minimum andmaximum, average, minimum, maximum, percentile, and mode.
Before you begin
The baseline function does not appear in the chart view toolbar if the chart valuesare derived (result of a calculation, such as the Enterprise Status workspace view,
Chapter 6. Customizing workspace views 123
Open Situation Counts - Last 24 hours), if this is a plot chart with Attribute(s)across multiple rows selected, or if historical data collection has not configured forthe attribute group and started on the managed system assigned to the Navigatoritem. (You should see Time Span in the chart toolbar.)
For historical data beyond the past 24 hours, you must have a Tivoli DataWarehouse configured and the warehouse proxy agent that transfers data to it.
About this task
Take these steps to add a statistical baseline to the chart.
Procedure1. While displaying a plot chart or area chart, select Add Statistical Baseline in
the view toolbar.2. Select a check box to enable the function.
Function Action
RANGE -MIN/MAX
For the selected attribute, calculate the minimum and maximum valueswithin the time period, and then shade that area on the chart.
AVG
For the selected attribute, calculate the average value from the samplestaken during the time period, and add or subtract the standarddeviation that was entered in the Arguments field (valid values are -6to 6).
MINFor the selected attribute, find the lowest sampled value within the timeperiod, and increase or decrease that value by the percentage that wasentered in the Arguments field (valid values are -100 to 100).
MAXFor the selected attribute, find the highest sampled value within thetime period and increase or decrease that value by the percentage thatwas entered in the Arguments field (valid values are -100 to 100).
PERCENTILEFor the selected attribute, find the value below which NUM percent ofthe data points fall; where NUM is the value from the Arguments field(valid values are 1 to 100).
MODEFor the selected attribute, find the most frequently observed valuewithin the time period. No argument is entered for a MODEcalculation.
3. Enter an Argument, if applicable, and click Apply to see the baseline in theResult cell and in the chart.
4. Try out different calculates by selecting other functions, selecting anotherattribute from the list, or selecting a different time span.
5. Click OK to close the dialog box, and perform any of these actions:v Move the mouse pointer over a baseline to highlight it; move the mouse
pointer over a plot point to see the value, name, and time stamp.v Click and drag a smaller time range to zoom in, then press Esc to zoom out,
once for each time you zoomed.v Right-click a data value that falls outside normal statistical baseline and click
Model Situation to open the Model Situation chart and populate theattributes table with the values from the data point. After performingadditional analysis with the modeling tool, you can create a new situationwith the calculated values and edit them as needed.
124 IBM Tivoli Monitoring: Tivoli Enterprise Portal User's Guide
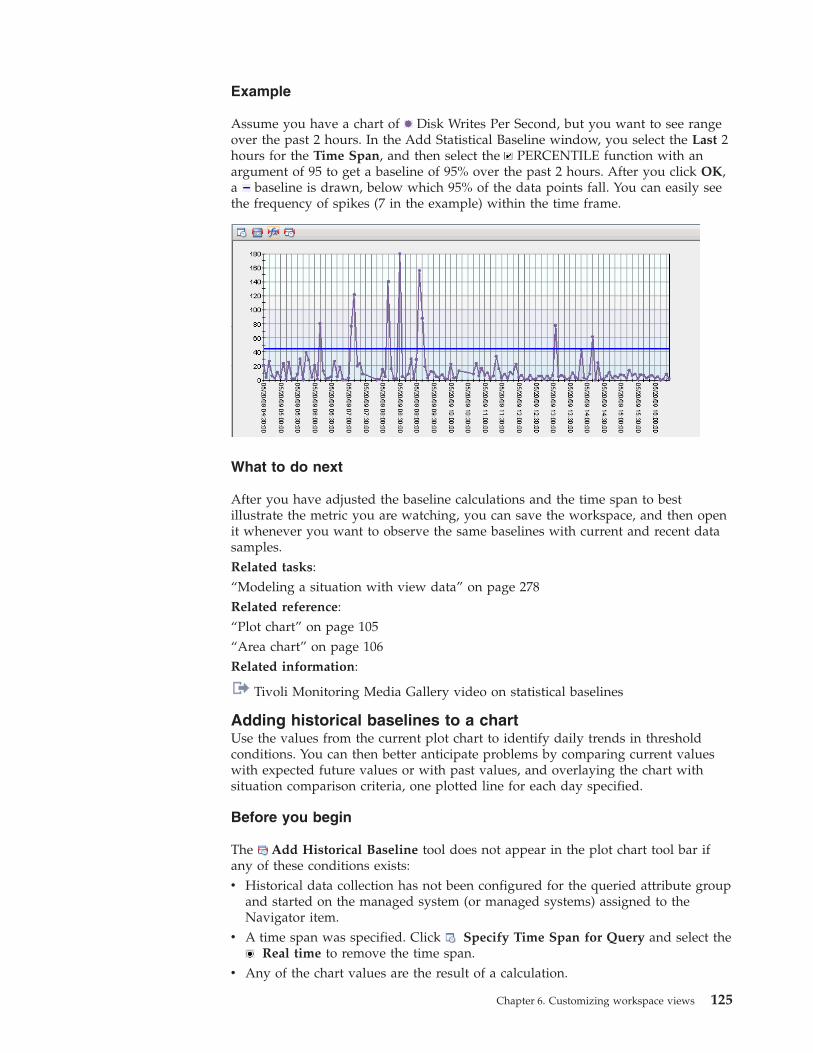
Example
Assume you have a chart of Disk Writes Per Second, but you want to see rangeover the past 2 hours. In the Add Statistical Baseline window, you select the Last 2hours for the Time Span, and then select the PERCENTILE function with anargument of 95 to get a baseline of 95% over the past 2 hours. After you click OK,a baseline is drawn, below which 95% of the data points fall. You can easily seethe frequency of spikes (7 in the example) within the time frame.
What to do next
After you have adjusted the baseline calculations and the time span to bestillustrate the metric you are watching, you can save the workspace, and then openit whenever you want to observe the same baselines with current and recent datasamples.Related tasks:“Modeling a situation with view data” on page 278Related reference:“Plot chart” on page 105“Area chart” on page 106Related information:
Tivoli Monitoring Media Gallery video on statistical baselines
Adding historical baselines to a chartUse the values from the current plot chart to identify daily trends in thresholdconditions. You can then better anticipate problems by comparing current valueswith expected future values or with past values, and overlaying the chart withsituation comparison criteria, one plotted line for each day specified.
Before you begin
The Add Historical Baseline tool does not appear in the plot chart tool bar ifany of these conditions exists:v Historical data collection has not been configured for the queried attribute group
and started on the managed system (or managed systems) assigned to theNavigator item.
v A time span was specified. Click Specify Time Span for Query and select theReal time to remove the time span.
v Any of the chart values are the result of a calculation.
Chapter 6. Customizing workspace views 125
v Attribute(s) across multiple rows is selected. To see if it is, click EditProperties in the view's toolbar, Style tab, then the plot area of the thumbnailgraphic.
For historical data beyond the past 24 hours, you must have a Tivoli DataWarehouse configured and the warehouse proxy agent that transfers data to it.
Procedure1. Click Add Historical Baseline in a plot chart. The tool does not display if
historical data collection has not be configured for the attribute group(indicated by the presence of the Time Span view tool).
2. To plot data samples taken yesterday, the same day last week, or a particularday or past days, select the check box for that time range.
Show yesterday's dataDraws a plot line of data samples from the previous 24 hours. Forexample, if it is May 30 at 8:45 AM, the samplings will be from May 29,starting at 8:45 AM. The legend indicates the line color for each plottedattribute value from Yesterday. As new samples are added, the oldestare removed from the chart.
Show last week's dataDraws a plot line of data samples from the same day last week. Thelegend shows the line color for each plotted attribute value from LastWeek. For example, if this is Wednesday, the samples will be from lastWednesday.
Show this day's dataDraws a plot line of data samples that have been taken on the dayshown. If you would like to see a different day, click the date button toopen a calendar. Select a month and day prior to today. For example,you had selected the check box to show yesterday's data, you couldselect the day before yesterday in the calendar to show the past twodays.
Show data for last __Draws a plot line for each of the last number of weekdays or calendardays you specified. For example, if today is Saturday and you select thelast 7 calendar days, today and all days through last Sunday areplotted. The last 7 weekdays would be Monday through Friday of thispast week plus the Thursday and Friday of the week before.
Time ColumnThe time stamp type displayed will be shown along the X-axis. If theattribute group has other time stamp attributes, you can select one fromthe list. Not all time stamps will be displayed along the axis because ofspace limitations.
3. Click Apply to render the chart with a baseline for each chosen time range. Thetime ranges chosen are listed in the legend along with the color of the plot line,one line for each day.
4. Click OK to close the dialog box, and perform any of these actions:v Move the mouse pointer over a baseline to highlight it; move the mouse
pointer over a plot point to see the value, name, and time stamp.v Click and drag a smaller time range to zoom in, then press Esc to zoom out,
once for each time you zoomed.v Right-click a data value that falls outside normal statistical baseline and click
Model Situation to open the Model Situation chart and populate the
126 IBM Tivoli Monitoring: Tivoli Enterprise Portal User's Guide
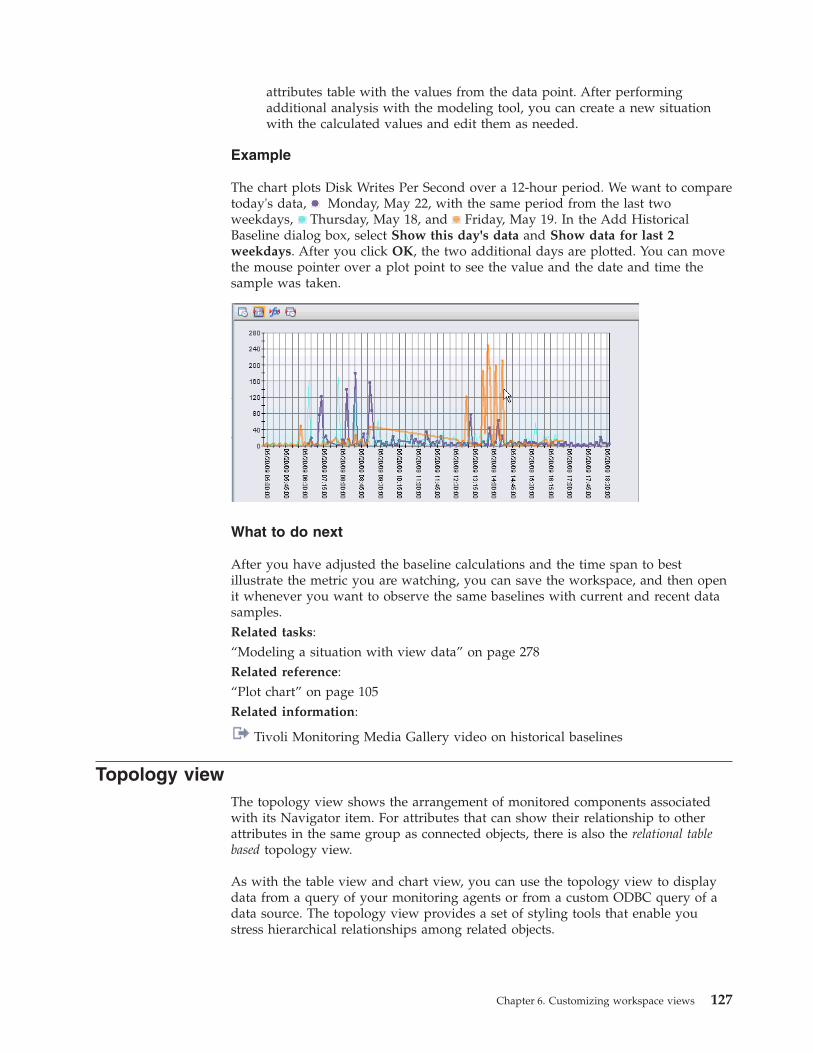
attributes table with the values from the data point. After performingadditional analysis with the modeling tool, you can create a new situationwith the calculated values and edit them as needed.
Example
The chart plots Disk Writes Per Second over a 12-hour period. We want to comparetoday's data, Monday, May 22, with the same period from the last twoweekdays, Thursday, May 18, and Friday, May 19. In the Add HistoricalBaseline dialog box, select Show this day's data and Show data for last 2weekdays. After you click OK, the two additional days are plotted. You can movethe mouse pointer over a plot point to see the value and the date and time thesample was taken.
What to do next
After you have adjusted the baseline calculations and the time span to bestillustrate the metric you are watching, you can save the workspace, and then openit whenever you want to observe the same baselines with current and recent datasamples.Related tasks:“Modeling a situation with view data” on page 278Related reference:“Plot chart” on page 105Related information:
Tivoli Monitoring Media Gallery video on historical baselines
Topology viewThe topology view shows the arrangement of monitored components associatedwith its Navigator item. For attributes that can show their relationship to otherattributes in the same group as connected objects, there is also the relational tablebased topology view.
As with the table view and chart view, you can use the topology view to displaydata from a query of your monitoring agents or from a custom ODBC query of adata source. The topology view provides a set of styling tools that enable youstress hierarchical relationships among related objects.
Chapter 6. Customizing workspace views 127
When you create a topology view that is based on a query (relational table based),each row of data returned becomes an object in the topology view. As with otherquery-based views, you can use the Properties editor to apply filters andthresholds to the view but with some differences:v In the Filters tab, the column check box determines whether the value is
included in the hover help. Any formulas you write for the filters are applied inthe same way as for other query-based views.
v In the Thresholds tab, the chosen severity is applied to the topology as an alertindicator when the threshold is met.
Creating a topology viewAbout this task
A topology view can be added to a workspace to show the arrangement ofmonitored components associated with its Navigator item. Do the following tocreate a topology view.
Procedure1. Select the workspace where you want to create the view. The context of the
Navigator item and the queries available determine the type of informationthat can be displayed. For example, when adding a topology view to anEnterprise Navigator item workspace, you can choose Tivoli ManagementServices Infrastructure as your topology source or Relational Table Based. Atno other level of the Navigator do you get the TMS Infrastructure source.
2. If you want the view to occupy a new space, click Split Vertically orSplit Horizontally in an existing view. The pane divides and a duplicate iscreated. If you split the Navigator, the new view is empty. If you do not seethe or tools, the Split Pane Toolbar has been disabled. Select it from theView menu to enable it. You can also right-click inside a view and selectSplit Vertically or Split Horizontally from the pop-up menu.
3. Click Topology, then click inside the space to adopt the new view.4. Select a source type from the Select Topology Source window that opens.
Relational Table Based is available at every level of the Navigator. Anyproduct-specific topology sources will be unavailable from workspaces thatare not associated with the product.
5. If the Properties editor opens, select Click here to assign a query andfollow these steps:a. Click to expand a monitoring agent and attribute group branch.b. Select a Query name to see its description and the specified attributes.
The selected check boxes indicate which attributes are included in thequery. The cells in the numbered rows show any filter criteria for thequery.
c. Click OK to assign the selected query to the view.
The Preview window at the top of the Properties editor should show nodeicons and names. If not, select a column from the query for the topologyobject in the Column Mapping area of the Style tab.
6. If the Properties editor is not open, click Edit Properties in the view titlebar. A view for which you have selected a query will be empty unless acolumn (attribute) from the query has been mapped to a topology object,which is done in the Style tab.
7. To limit the information in the object hover help, click the Filters tab andclear any column check boxes whose values you do not want displayed. If
128 IBM Tivoli Monitoring: Tivoli Enterprise Portal User's Guide
you want to limit the number of objects in the view, you can also write a filterformula to include only the rows that satisfy the comparison.
8. To have a severity indicator applied to a topology object when a certainthreshold has been exceeded, click the Thresholds tab, select an icon, andwrite a threshold expression for every severity to be represented.
9. To configure and format the view, click the Style tab and adjust the settings.The topology view has many styling options, so start with the essential oneswhen you first create the view:
a. General to add the view title. This is also where you can limit thedepth of the hierarchy if too much data is displayed.
b. Mapping to specify the attribute to use for the nodes (Node ID andName) and the attribute for the related nodes to point to or from (To orFrom Connection). Select the check box to create implied nodes andobserve the change in the Preview pane to see if the view is improved bythe selection.
c. Layout to change the topology layout to the one that best suits thetype of data relationships being presented.
10. When you are done configuring and formatting the view, save your changeswith Apply to keep the Properties editor open or OK to close the editor.
What the topology view shows
A topology view added to a workspace maps the context of the Navigator item toa logical diagrammatic form. The objects shown are elements (attributes) of theproduct that is represented by the Navigator item. The elements of the monitoredproduct are arranged to show their relationships to one another.
Manipulating the topology view
The view has tools for navigating the topology and arranging the objects to revealareas of interest.
Toolbar
In addition to the tools described here, the topology view toolbar for yourproduct might have additional tools, such as an Apply Pending Updatesbutton or Status Filtering button.
Backward returns to the previous display of the topology. Click thelist button to see and select from a history. The view displays the selectedcontent.
Note that the tool does not show in the toolbar if your topology is smallenough to fit within the view space.
If you went back to a previous topology display, click Forward to
return to the most recently navigated version of the view. Click the listbutton to see and select from a history. The view refreshes with the mostrecent status of the management elements.
Chapter 6. Customizing workspace views 129
To zoom the display in and out, move the zoom slider switch right andleft or press Num Pad + and -. As the zoom level decreases, the level ofdetail displayed is reduced. For example, the labels are automaticallyhidden.
Fit to view resizes the objects to fit into the current view space.
Overview opens a small window with the entire topology view inminiature. A blue frame indicates the visible area of the view space. Asyou scroll through the topology, the frame within the overview windowadjust to show your location.
Within the overview window, click to move the viewpoint to that
location, point inside and drag the blue frame to move theviewpoint, and drag a handle of the blue frame to resize the viewarea.
and View as Table switches the topology to table representation, one rowfor each object. Right-click the Node bar under Resource Type to open thepop-up menu.
Note that if you are running the Thai language pack for TivoliMonitoring, the topology table view is not translated but remains inEnglish.
Click View as Topology to return to the topological display.
Enter search text to locate the objects that match. As you type, thematches are automatically selected and zoomed.
When multiple matches are found, the Find Next and Find Previousbuttons are enabled to allow you to navigate between the matches oneobject at a time.
If your search text cannot be found, the background color will change toyellow.
You can use * asterisk or ? question mark wildcard characters, such assys* to find system and sys_01, or system? to find system1 and systemZ.
Mouse and keyboard actions
Click Select the object. Use Ctrl + Click to select multiple objects. Click acorner of the area you want to select, drag to the opposite corner,then release the mouse button to select all the objects within orpartially inside the boundary. Click outside the selection to cancel.
Drag Click an object, then drag to reposition it and the connectors toother objects.
Double-clickPerform the default action for your product on the object.
Right-clickOpen the pop-up menu.
Hover Move the mouse pointer over an object to see its identifiers andstatus.
Alt + Click(Not available on all UNIX platforms or configurations.) Move
130 IBM Tivoli Monitoring: Tivoli Enterprise Portal User's Guide
around the view with a virtual magnifying glass. Once themagnifier is displayed, you can release the Alt key.
Alt + LHide or display link labels.
Alt + NHide or display object labels.
Home Resize the objects to fit into the current view space.
Num Pad + and -.Zoom in and out.
Popup menu options
Right-click a topology element to see the actions that can be applied to theselected object.
Right-click the topology view background to see the actions for the view asa whole.
Topology view style properties
The Style tab of the Properties editor has icons that you click to see and selectthe options for that aspect of the topology view: General, Node, View as Topology,Connection, Mapping, and Layout. The topology view for your product mighthave fewer options than these. For example, the Mapping and Layout options arenot applicable to the TMS Infrastructure view, thus they are not included in theStyle properties for that view.
General
Title
The text entered here is displayed in the view's title bar.
Scalability
The topology view has an alternative table view display that can beselected from the view toolbar. You can also set a threshold number ofobjects that can be displayed in the topology before it switchesautomatically to a table.
Depth
Root Node enables you to identify a node to use as the root of thetopology graph. When this field is empty, any node that does not have aconnection TO it is treated as a root node. When a value is specified, thetopology is displayed with the specified node at the beginning of thegraph. Any objects that connect TO the specified node will not bedisplayed; only connections FROM the root node are visible. The value canbe represented by a variable that is resolved through a workspace link. Avariable is formed by enclosing the intended variable name in % percentsymbols, such as %ROOT%.
Levels enables you to specify all levels of the topology graph or a specificnumber of levels, such as 1 to show only the root level.
Status
Chapter 6. Customizing workspace views 131
Select the check box if you have created thresholds for the view and wouldlike the node label to be highlighted to match the color of the severityindicator.
MappingThis is where you identify the attribute to display as nodes and theattribute the nodes points to (or from).
Mapping
Node ID Column is the attribute that identifies the topology node.
Node Name Column is the attribute to use as the label for the topologyobject, usually the same attribute as the node ID.
To Connection Column, when chosen, becomes the object that the datanodes point to.
From Connection Column, when chosen, becomes the object that points tothe data nodes.
Create implied nodes, when selected, creates an object for an otherwiseundefined connection in the topology. For some types of data, this itemeffectively unifies the topology.
Type
Node Type is used to define the object type for a topology node:Default (kfw.TopoNode) type for all topology nodes, Row type(<table>) for the associated table row (value is is retrieved from the tabledefinition and enclosed in parentheses), or Column to define the objecttype, which allows you to select a different attribute for each topologyobject.
To Connection Type is used to define the object type for the connection toanother topology node: Default (kfw.TopoConnection) for all toconnections, or Column to define the object type, which allows theattribute to be different for each to connection.
From Connection Type is used to define the object type for the connectionfrom another topology node: Default (kfw.TopoConnection) for all fromconnections, or Column to define the object type, which allows theattribute to be different for each from connection.
Connection
Show connection arrow, when enabled, displays an arrowhead at theend of a connector.
Layout
The standard topology layout is Tree, or you can select one of severalpossible style structures.v When the layout is set to Tree, you can adjust the flow direction, the
positioning between objects (Mode), and how the connector lines aredrawn.
v When the layout is Hierarchical, you can change the flow directionstarting from the root object and the link style between objects atdifferent hierarchical levels.
v When the layout is a Grid, use the options to set the maximum numberof objects to display in each topology row or column.
132 IBM Tivoli Monitoring: Tivoli Enterprise Portal User's Guide
v Select Uniform Length Links to have all connector lines the samelength.
v Select Spring Embedder to vary the connector line lengths.
View as Topology
General
Disable direct object manipulations, when selected, keep the objects ina fixed position that cannot be manipulated by the user. Normally you canmove objects around the view, but the new position cannot be saved.
The Change Color button enables you to change the text (foreground) andhighlight (background) color for a selected object.
Background
The Change Color button enables you to change the background color ofthe entire view.
NodeText style fields enable you to adjust the label text style and color: Selectanother Font name from the list to change the font; select another pointSize to increase or decrease the size of the font. Select the Bold checkbox to bold the label text; select the Italic check box to italicize the text.Click Foreground Color to change the color of the object label when it isselected.
Layout fields enable you to control the spacing and alignment of the labeltext line: Wrapping Mode is turned off by default. Select None for a singleline of text; Word to wrap the text within the set line width; Truncate totruncate any text that extends beyond the set line width; or All to wraptext within the set line width and to truncate text that goes beyond the setline height. Alignment is Left, or can be changed to Center or Right.Width and Height define the label boundaries when text wrapping is setto Word or Truncate, as well as the point where Right alignment begins.The default value is 100 pixels.
ConnectionText style fields enable you to adjust the text style and color for theconnection label. Click Foreground Color to change the color of theconnector label when it is selected.
Layout fields enable you to control the spacing and alignment of theconnection label line: Wrapping Mode is turned off by default. Select Nonefor a single line of text; Word to wrap the text within the set line width;Truncate to truncate any text that extends beyond the set line width; or Allto wrap text within the set line width and to truncate text that goesbeyond the set line height. Alignment is Left, or can be changed to Centeror Right. Width and Height define the label boundaries when textwrapping is set to Word or Truncate, as well as the point where Rightalignment begins.
TMS Infrastructure viewThe Enterprise Navigator item has a predefined workspace that includes atopology view of your Tivoli managed network called TMS Infrastructure. Thisview shows the relationships and linking of the Tivoli Management Servicescomponents.
Chapter 6. Customizing workspace views 133
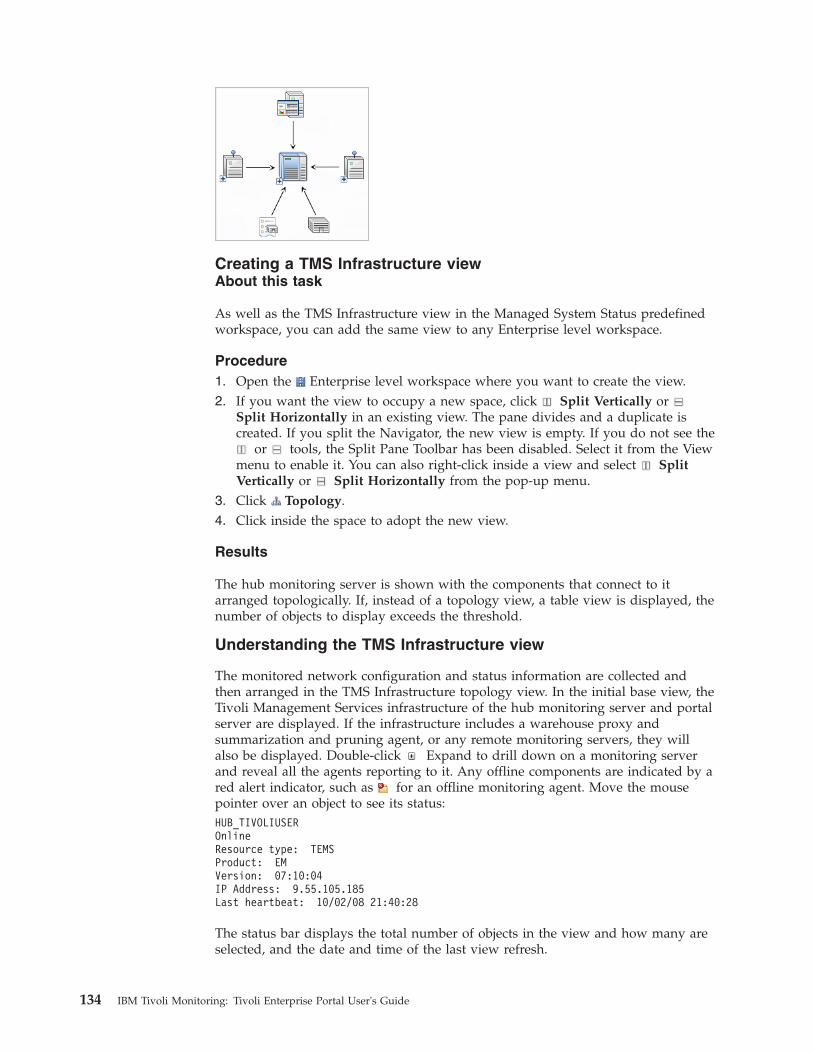
Creating a TMS Infrastructure viewAbout this task
As well as the TMS Infrastructure view in the Managed System Status predefinedworkspace, you can add the same view to any Enterprise level workspace.
Procedure1. Open the Enterprise level workspace where you want to create the view.2. If you want the view to occupy a new space, click Split Vertically or
Split Horizontally in an existing view. The pane divides and a duplicate iscreated. If you split the Navigator, the new view is empty. If you do not see the
or tools, the Split Pane Toolbar has been disabled. Select it from the Viewmenu to enable it. You can also right-click inside a view and select SplitVertically or Split Horizontally from the pop-up menu.
3. Click Topology.4. Click inside the space to adopt the new view.
Results
The hub monitoring server is shown with the components that connect to itarranged topologically. If, instead of a topology view, a table view is displayed, thenumber of objects to display exceeds the threshold.
Understanding the TMS Infrastructure view
The monitored network configuration and status information are collected andthen arranged in the TMS Infrastructure topology view. In the initial base view, theTivoli Management Services infrastructure of the hub monitoring server and portalserver are displayed. If the infrastructure includes a warehouse proxy andsummarization and pruning agent, or any remote monitoring servers, they willalso be displayed. Double-click Expand to drill down on a monitoring serverand reveal all the agents reporting to it. Any offline components are indicated by ared alert indicator, such as for an offline monitoring agent. Move the mousepointer over an object to see its status:HUB_TIVOLIUSEROnlineResource type: TEMSProduct: EMVersion: 07:10:04IP Address: 9.55.105.185Last heartbeat: 10/02/08 21:40:28
The status bar displays the total number of objects in the view and how many areselected, and the date and time of the last view refresh.
134 IBM Tivoli Monitoring: Tivoli Enterprise Portal User's Guide
The topology view can show all the monitoring components at once or show justthe base topology , which collapses the agent display under the local monitoringserver.
Monitoring agents subsumed under the remote monitoring server:
Monitoring agents subsumed under the hub monitoring server:
Event viewsBesides relying on event indicators, you can use any of the event views to getmore granular information for analysis and action.
Event views present alternatives to event indicators in the Navigator. Message logand situation event console views update automatically to show new events asthey arrive and changes in event status as they occur. Graphic views give you apictorial alternative to the Navigator for indicating alerts.
Adding a message log viewThe message log gives you an overview of changes in situation status on yourmonitored network. You can add the view to any workspace.
Before you begin
To create a new view and edit its properties, your user ID requires WorkspaceAuthor Mode permission. For the message log view, your user ID also requiresView permission for Events.
Procedure1. Open the workspace where you want to add the message log view.2. If you want the view to occupy a new pane, click Split Vertically or Split
Horizontally in one of the views. The pane divides and a duplicate is created. Ifyou split the Navigator, the new view is empty.
3. Click Message Log. The mouse pointer changes to the view icon (hand iconin Linux). If you get the wrong icon or decide not to add the view, pressEscape or click somewhere in the main toolbar.
4. Click inside the view where you want the message log.
Results
For each change of situation status in your monitored network, new rows areadded to the top of the view. Beyond the limit of 500 rows (apply quick settings tolower the limit), old rows are deleted as new rows arrive.
What the view showsThe message log view displays a row of data for each situation status change. Thestatus column includes indicators such as Stopped and Deleted.
As new rows arrive, they appear in descending order with the oldest rows at thebottom. After the maximum number of rows has been reached, the oldest areremoved to make room for new rows.
Chapter 6. Customizing workspace views 135
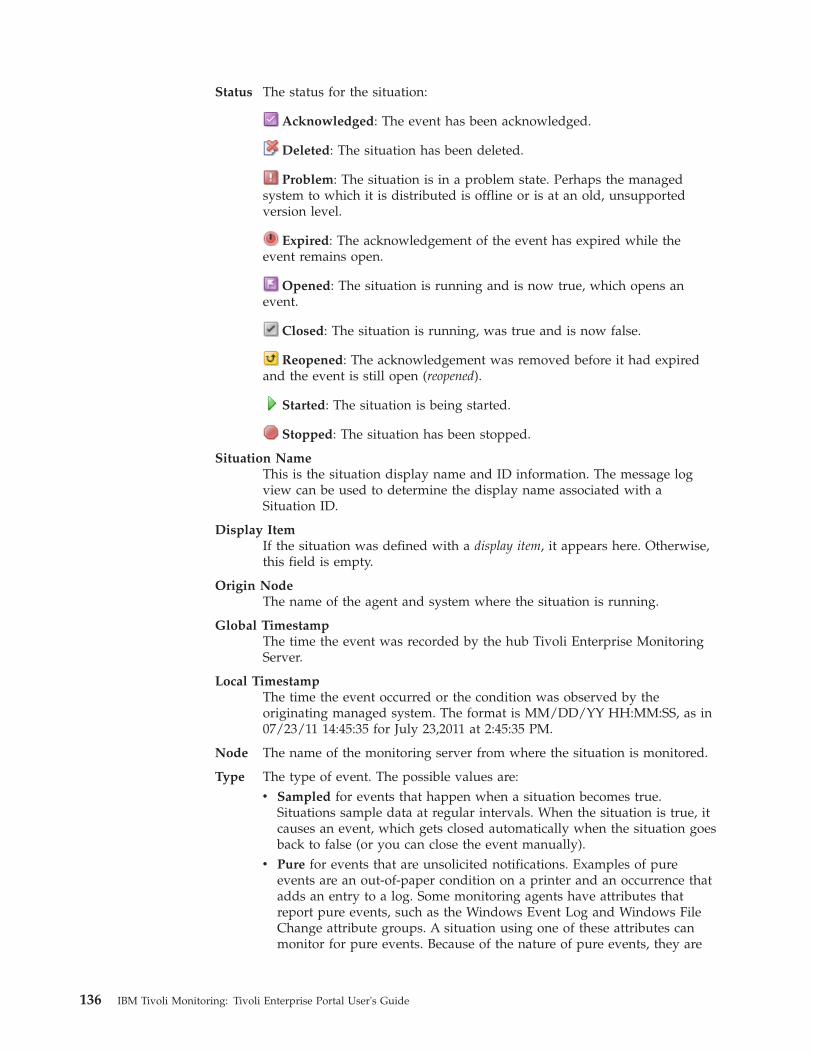
Status The status for the situation:
Acknowledged: The event has been acknowledged.
Deleted: The situation has been deleted.
Problem: The situation is in a problem state. Perhaps the managedsystem to which it is distributed is offline or is at an old, unsupportedversion level.
Expired: The acknowledgement of the event has expired while theevent remains open.
Opened: The situation is running and is now true, which opens anevent.
Closed: The situation is running, was true and is now false.
Reopened: The acknowledgement was removed before it had expiredand the event is still open (reopened).
Started: The situation is being started.
Stopped: The situation has been stopped.
Situation NameThis is the situation display name and ID information. The message logview can be used to determine the display name associated with aSituation ID.
Display ItemIf the situation was defined with a display item, it appears here. Otherwise,this field is empty.
Origin NodeThe name of the agent and system where the situation is running.
Global TimestampThe time the event was recorded by the hub Tivoli Enterprise MonitoringServer.
Local TimestampThe time the event occurred or the condition was observed by theoriginating managed system. The format is MM/DD/YY HH:MM:SS, as in07/23/11 14:45:35 for July 23,2011 at 2:45:35 PM.
Node The name of the monitoring server from where the situation is monitored.
Type The type of event. The possible values are:v Sampled for events that happen when a situation becomes true.
Situations sample data at regular intervals. When the situation is true, itcauses an event, which gets closed automatically when the situation goesback to false (or you can close the event manually).
v Pure for events that are unsolicited notifications. Examples of pureevents are an out-of-paper condition on a printer and an occurrence thatadds an entry to a log. Some monitoring agents have attributes thatreport pure events, such as the Windows Event Log and Windows FileChange attribute groups. A situation using one of these attributes canmonitor for pure events. Because of the nature of pure events, they are
136 IBM Tivoli Monitoring: Tivoli Enterprise Portal User's Guide
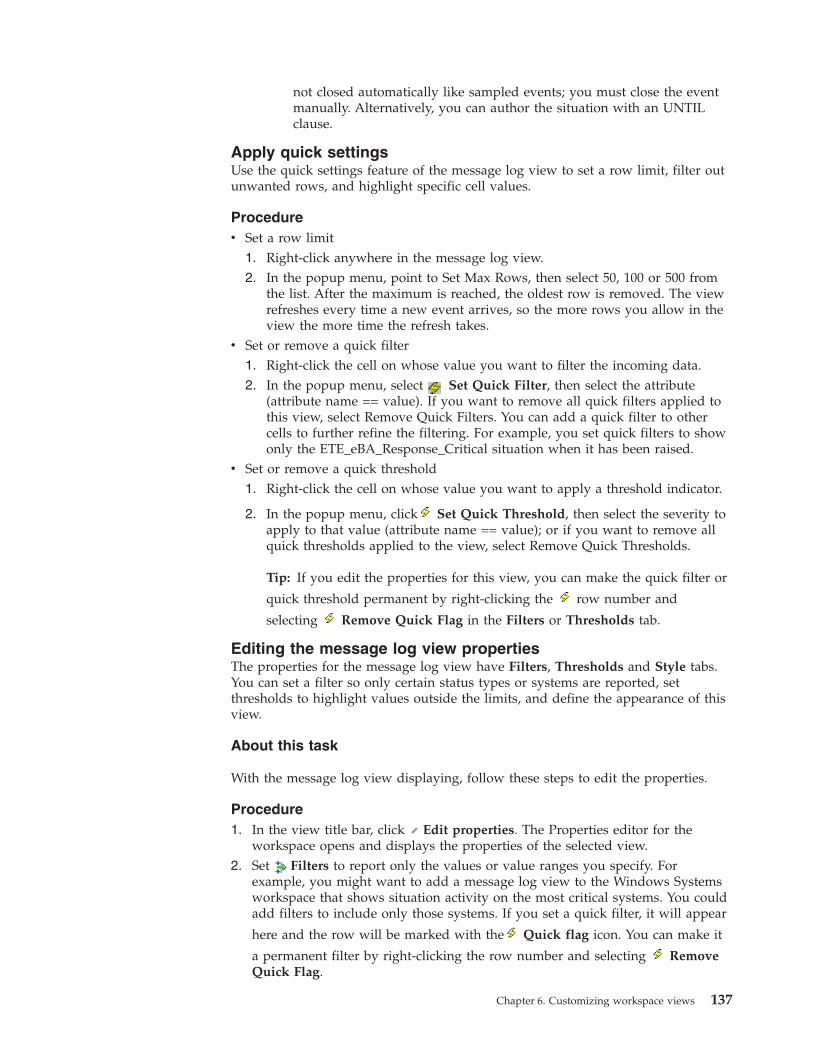
not closed automatically like sampled events; you must close the eventmanually. Alternatively, you can author the situation with an UNTILclause.
Apply quick settingsUse the quick settings feature of the message log view to set a row limit, filter outunwanted rows, and highlight specific cell values.
Procedurev Set a row limit
1. Right-click anywhere in the message log view.2. In the popup menu, point to Set Max Rows, then select 50, 100 or 500 from
the list. After the maximum is reached, the oldest row is removed. The viewrefreshes every time a new event arrives, so the more rows you allow in theview the more time the refresh takes.
v Set or remove a quick filter1. Right-click the cell on whose value you want to filter the incoming data.2. In the popup menu, select Set Quick Filter, then select the attribute
(attribute name == value). If you want to remove all quick filters applied tothis view, select Remove Quick Filters. You can add a quick filter to othercells to further refine the filtering. For example, you set quick filters to showonly the ETE_eBA_Response_Critical situation when it has been raised.
v Set or remove a quick threshold1. Right-click the cell on whose value you want to apply a threshold indicator.
2. In the popup menu, click Set Quick Threshold, then select the severity toapply to that value (attribute name == value); or if you want to remove allquick thresholds applied to the view, select Remove Quick Thresholds.
Tip: If you edit the properties for this view, you can make the quick filter or
quick threshold permanent by right-clicking the row number and
selecting Remove Quick Flag in the Filters or Thresholds tab.
Editing the message log view propertiesThe properties for the message log view have Filters, Thresholds and Style tabs.You can set a filter so only certain status types or systems are reported, setthresholds to highlight values outside the limits, and define the appearance of thisview.
About this task
With the message log view displaying, follow these steps to edit the properties.
Procedure1. In the view title bar, click Edit properties. The Properties editor for the
workspace opens and displays the properties of the selected view.2. Set Filters to report only the values or value ranges you specify. For
example, you might want to add a message log view to the Windows Systemsworkspace that shows situation activity on the most critical systems. You couldadd filters to include only those systems. If you set a quick filter, it will appear
here and the row will be marked with the Quick flag icon. You can make it
a permanent filter by right-clicking the row number and selecting RemoveQuick Flag.
Chapter 6. Customizing workspace views 137
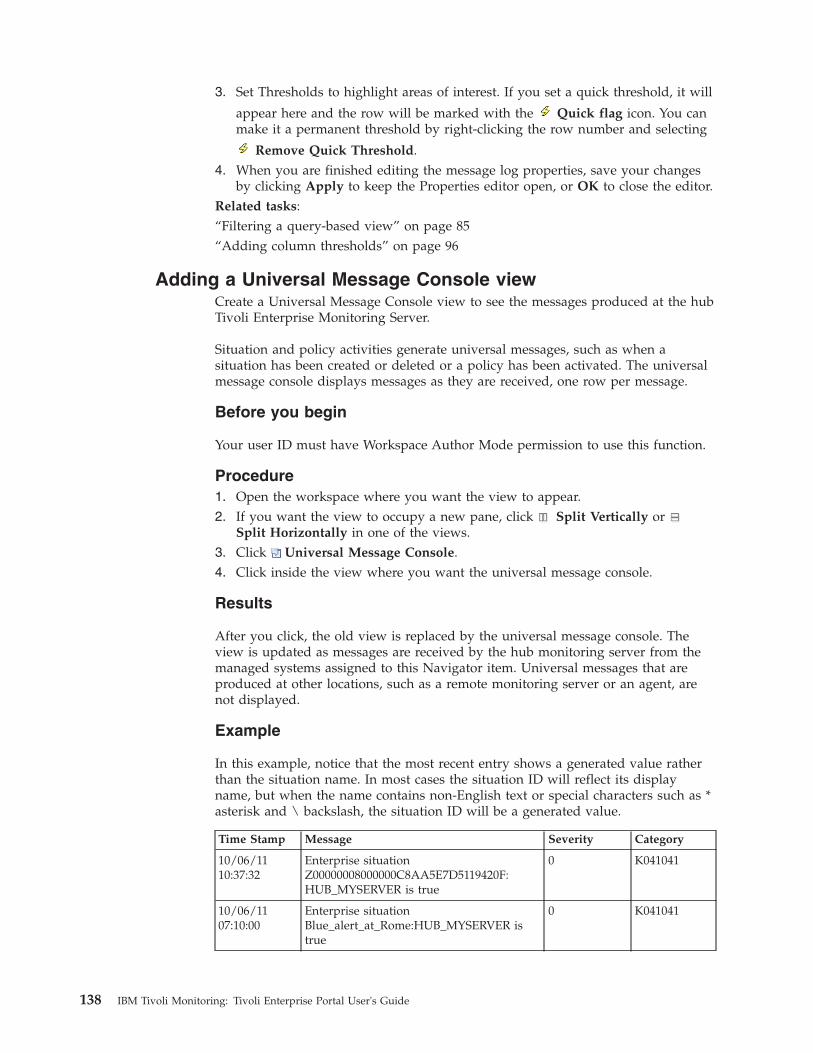
3. Set Thresholds to highlight areas of interest. If you set a quick threshold, it will
appear here and the row will be marked with the Quick flag icon. You canmake it a permanent threshold by right-clicking the row number and selecting
Remove Quick Threshold.4. When you are finished editing the message log properties, save your changes
by clicking Apply to keep the Properties editor open, or OK to close the editor.Related tasks:“Filtering a query-based view” on page 85“Adding column thresholds” on page 96
Adding a Universal Message Console viewCreate a Universal Message Console view to see the messages produced at the hubTivoli Enterprise Monitoring Server.
Situation and policy activities generate universal messages, such as when asituation has been created or deleted or a policy has been activated. The universalmessage console displays messages as they are received, one row per message.
Before you begin
Your user ID must have Workspace Author Mode permission to use this function.
Procedure1. Open the workspace where you want the view to appear.2. If you want the view to occupy a new pane, click Split Vertically or
Split Horizontally in one of the views.3. Click Universal Message Console.4. Click inside the view where you want the universal message console.
Results
After you click, the old view is replaced by the universal message console. Theview is updated as messages are received by the hub monitoring server from themanaged systems assigned to this Navigator item. Universal messages that areproduced at other locations, such as a remote monitoring server or an agent, arenot displayed.
Example
In this example, notice that the most recent entry shows a generated value ratherthan the situation name. In most cases the situation ID will reflect its displayname, but when the name contains non-English text or special characters such as *asterisk and \ backslash, the situation ID will be a generated value.
Time Stamp Message Severity Category
10/06/1110:37:32
Enterprise situationZ00000008000000C8AA5E7D5119420F:HUB_MYSERVER is true
0 K041041
10/06/1107:10:00
Enterprise situationBlue_alert_at_Rome:HUB_MYSERVER istrue
0 K041041
138 IBM Tivoli Monitoring: Tivoli Enterprise Portal User's Guide
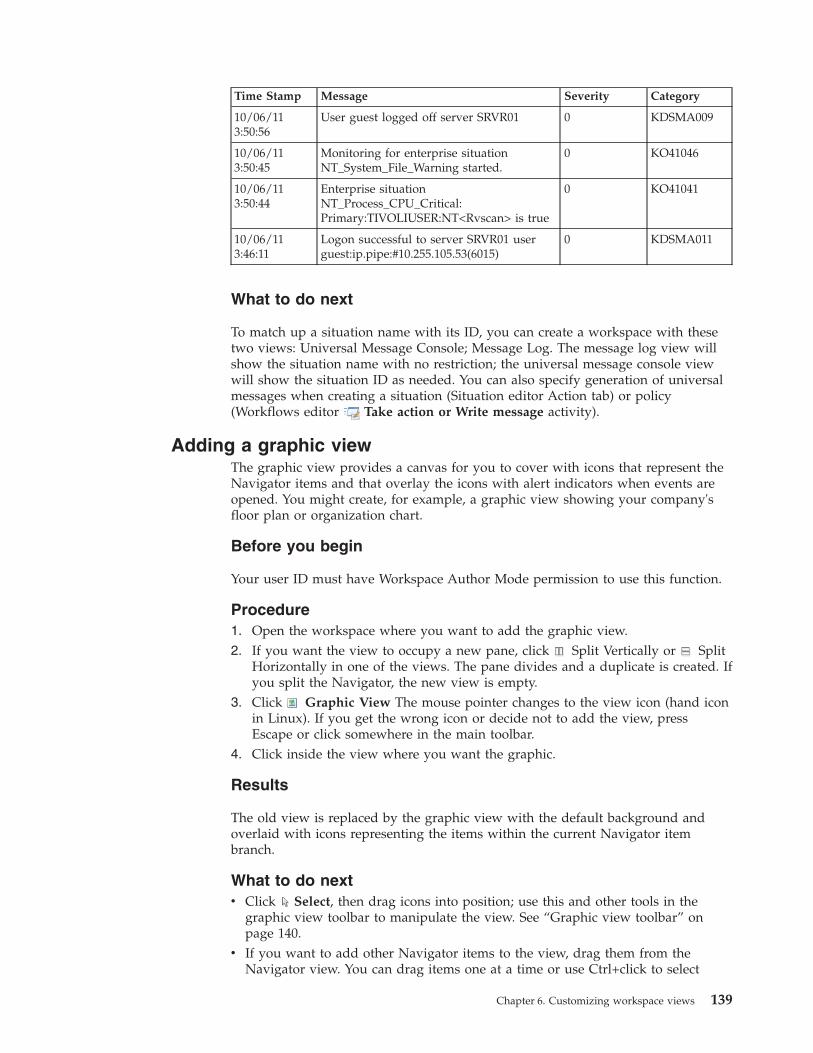
Time Stamp Message Severity Category
10/06/113:50:56
User guest logged off server SRVR01 0 KDSMA009
10/06/113:50:45
Monitoring for enterprise situationNT_System_File_Warning started.
0 KO41046
10/06/113:50:44
Enterprise situationNT_Process_CPU_Critical:Primary:TIVOLIUSER:NT<Rvscan> is true
0 KO41041
10/06/113:46:11
Logon successful to server SRVR01 userguest:ip.pipe:#10.255.105.53(6015)
0 KDSMA011
What to do next
To match up a situation name with its ID, you can create a workspace with thesetwo views: Universal Message Console; Message Log. The message log view willshow the situation name with no restriction; the universal message console viewwill show the situation ID as needed. You can also specify generation of universalmessages when creating a situation (Situation editor Action tab) or policy(Workflows editor Take action or Write message activity).
Adding a graphic viewThe graphic view provides a canvas for you to cover with icons that represent theNavigator items and that overlay the icons with alert indicators when events areopened. You might create, for example, a graphic view showing your company'sfloor plan or organization chart.
Before you begin
Your user ID must have Workspace Author Mode permission to use this function.
Procedure1. Open the workspace where you want to add the graphic view.2. If you want the view to occupy a new pane, click Split Vertically or Split
Horizontally in one of the views. The pane divides and a duplicate is created. Ifyou split the Navigator, the new view is empty.
3. Click Graphic View The mouse pointer changes to the view icon (hand iconin Linux). If you get the wrong icon or decide not to add the view, pressEscape or click somewhere in the main toolbar.
4. Click inside the view where you want the graphic.
Results
The old view is replaced by the graphic view with the default background andoverlaid with icons representing the items within the current Navigator itembranch.
What to do nextv Click Select, then drag icons into position; use this and other tools in the
graphic view toolbar to manipulate the view. See “Graphic view toolbar” onpage 140.
v If you want to add other Navigator items to the view, drag them from theNavigator view. You can drag items one at a time or use Ctrl+click to select
Chapter 6. Customizing workspace views 139
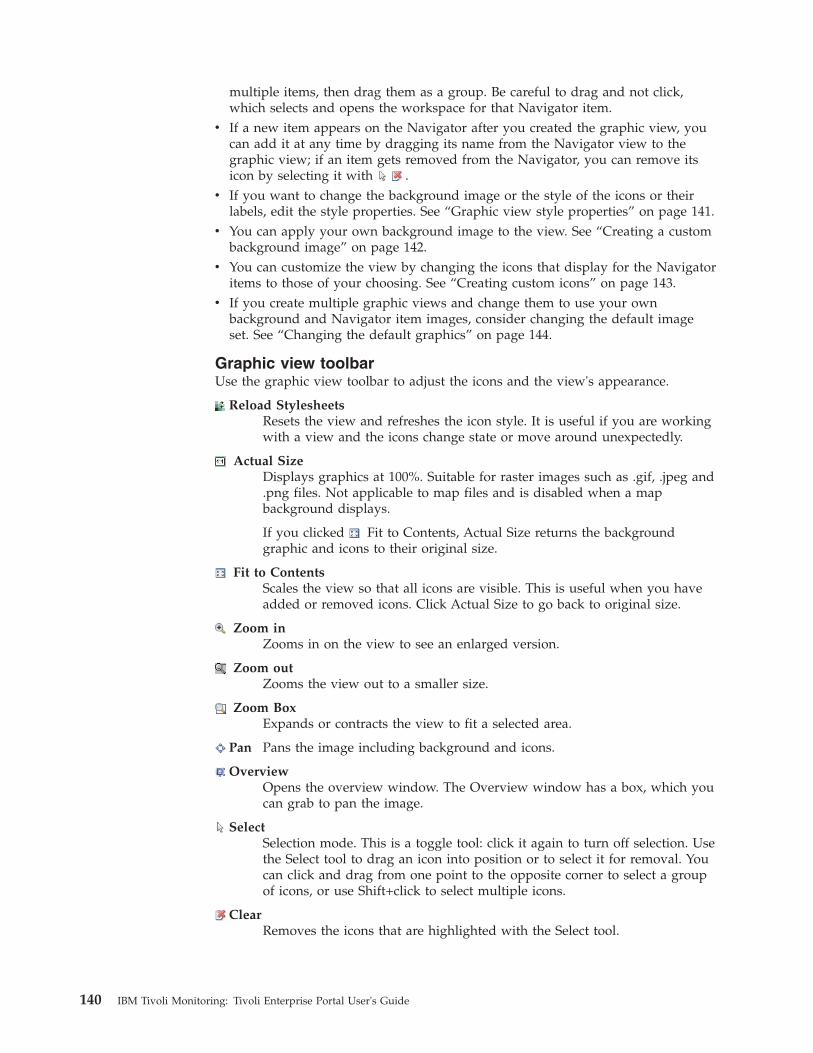
multiple items, then drag them as a group. Be careful to drag and not click,which selects and opens the workspace for that Navigator item.
v If a new item appears on the Navigator after you created the graphic view, youcan add it at any time by dragging its name from the Navigator view to thegraphic view; if an item gets removed from the Navigator, you can remove itsicon by selecting it with .
v If you want to change the background image or the style of the icons or theirlabels, edit the style properties. See “Graphic view style properties” on page 141.
v You can apply your own background image to the view. See “Creating a custombackground image” on page 142.
v You can customize the view by changing the icons that display for the Navigatoritems to those of your choosing. See “Creating custom icons” on page 143.
v If you create multiple graphic views and change them to use your ownbackground and Navigator item images, consider changing the default imageset. See “Changing the default graphics” on page 144.
Graphic view toolbarUse the graphic view toolbar to adjust the icons and the view's appearance.
Reload StylesheetsResets the view and refreshes the icon style. It is useful if you are workingwith a view and the icons change state or move around unexpectedly.
Actual SizeDisplays graphics at 100%. Suitable for raster images such as .gif, .jpeg and.png files. Not applicable to map files and is disabled when a mapbackground displays.
If you clicked Fit to Contents, Actual Size returns the backgroundgraphic and icons to their original size.
Fit to ContentsScales the view so that all icons are visible. This is useful when you haveadded or removed icons. Click Actual Size to go back to original size.
Zoom inZooms in on the view to see an enlarged version.
Zoom outZooms the view out to a smaller size.
Zoom BoxExpands or contracts the view to fit a selected area.
Pan Pans the image including background and icons.
OverviewOpens the overview window. The Overview window has a box, which youcan grab to pan the image.
SelectSelection mode. This is a toggle tool: click it again to turn off selection. Usethe Select tool to drag an icon into position or to select it for removal. Youcan click and drag from one point to the opposite corner to select a groupof icons, or use Shift+click to select multiple icons.
ClearRemoves the icons that are highlighted with the Select tool.
140 IBM Tivoli Monitoring: Tivoli Enterprise Portal User's Guide
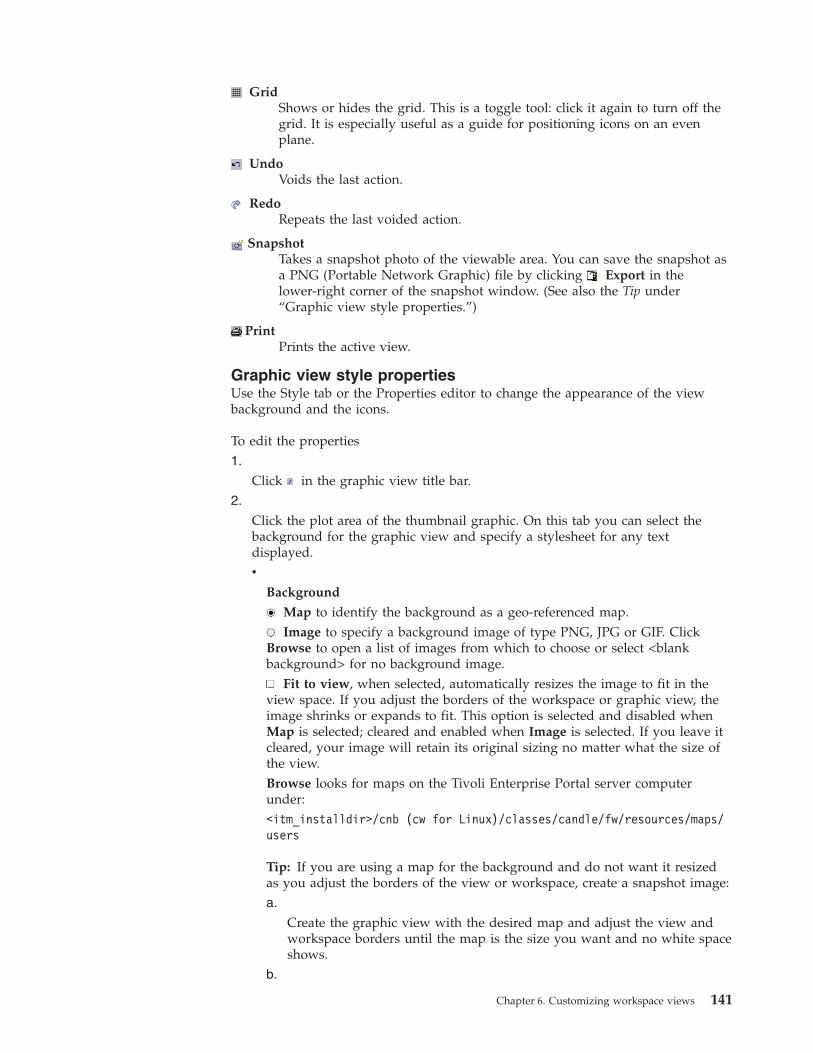
GridShows or hides the grid. This is a toggle tool: click it again to turn off thegrid. It is especially useful as a guide for positioning icons on an evenplane.
UndoVoids the last action.
RedoRepeats the last voided action.
SnapshotTakes a snapshot photo of the viewable area. You can save the snapshot asa PNG (Portable Network Graphic) file by clicking Export in thelower-right corner of the snapshot window. (See also the Tip under“Graphic view style properties.”)
PrintPrints the active view.
Graphic view style propertiesUse the Style tab or the Properties editor to change the appearance of the viewbackground and the icons.
To edit the properties1.
Click in the graphic view title bar.2.
Click the plot area of the thumbnail graphic. On this tab you can select thebackground for the graphic view and specify a stylesheet for any textdisplayed.v
Background
Map to identify the background as a geo-referenced map.Image to specify a background image of type PNG, JPG or GIF. Click
Browse to open a list of images from which to choose or select <blankbackground> for no background image.
Fit to view, when selected, automatically resizes the image to fit in theview space. If you adjust the borders of the workspace or graphic view, theimage shrinks or expands to fit. This option is selected and disabled whenMap is selected; cleared and enabled when Image is selected. If you leave itcleared, your image will retain its original sizing no matter what the size ofthe view.Browse looks for maps on the Tivoli Enterprise Portal server computerunder:<itm_installdir>/cnb (cw for Linux)/classes/candle/fw/resources/maps/users
Tip: If you are using a map for the background and do not want it resizedas you adjust the borders of the view or workspace, create a snapshot image:a.
Create the graphic view with the desired map and adjust the view andworkspace borders until the map is the size you want and no white spaceshows.
b.
Chapter 6. Customizing workspace views 141
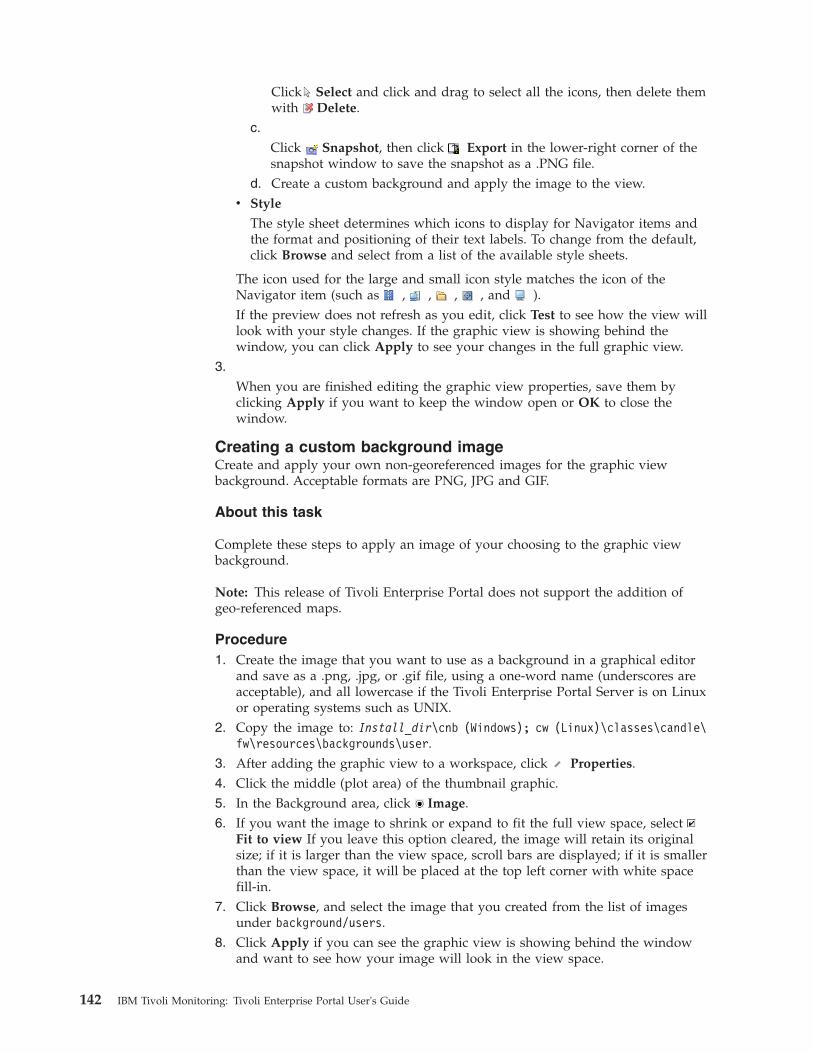
Click Select and click and drag to select all the icons, then delete themwith Delete.
c.
Click Snapshot, then click Export in the lower-right corner of thesnapshot window to save the snapshot as a .PNG file.
d. Create a custom background and apply the image to the view.v Style
The style sheet determines which icons to display for Navigator items andthe format and positioning of their text labels. To change from the default,click Browse and select from a list of the available style sheets.
The icon used for the large and small icon style matches the icon of theNavigator item (such as , , , , and ).If the preview does not refresh as you edit, click Test to see how the view willlook with your style changes. If the graphic view is showing behind thewindow, you can click Apply to see your changes in the full graphic view.
3.
When you are finished editing the graphic view properties, save them byclicking Apply if you want to keep the window open or OK to close thewindow.
Creating a custom background imageCreate and apply your own non-georeferenced images for the graphic viewbackground. Acceptable formats are PNG, JPG and GIF.
About this task
Complete these steps to apply an image of your choosing to the graphic viewbackground.
Note: This release of Tivoli Enterprise Portal does not support the addition ofgeo-referenced maps.
Procedure1. Create the image that you want to use as a background in a graphical editor
and save as a .png, .jpg, or .gif file, using a one-word name (underscores areacceptable), and all lowercase if the Tivoli Enterprise Portal Server is on Linuxor operating systems such as UNIX.
2. Copy the image to: Install_dir\cnb (Windows); cw (Linux)\classes\candle\fw\resources\backgrounds\user.
3. After adding the graphic view to a workspace, click Properties.4. Click the middle (plot area) of the thumbnail graphic.5. In the Background area, click Image.6. If you want the image to shrink or expand to fit the full view space, select
Fit to view If you leave this option cleared, the image will retain its originalsize; if it is larger than the view space, scroll bars are displayed; if it is smallerthan the view space, it will be placed at the top left corner with white spacefill-in.
7. Click Browse, and select the image that you created from the list of imagesunder background/users.
8. Click Apply if you can see the graphic view is showing behind the windowand want to see how your image will look in the view space.
142 IBM Tivoli Monitoring: Tivoli Enterprise Portal User's Guide
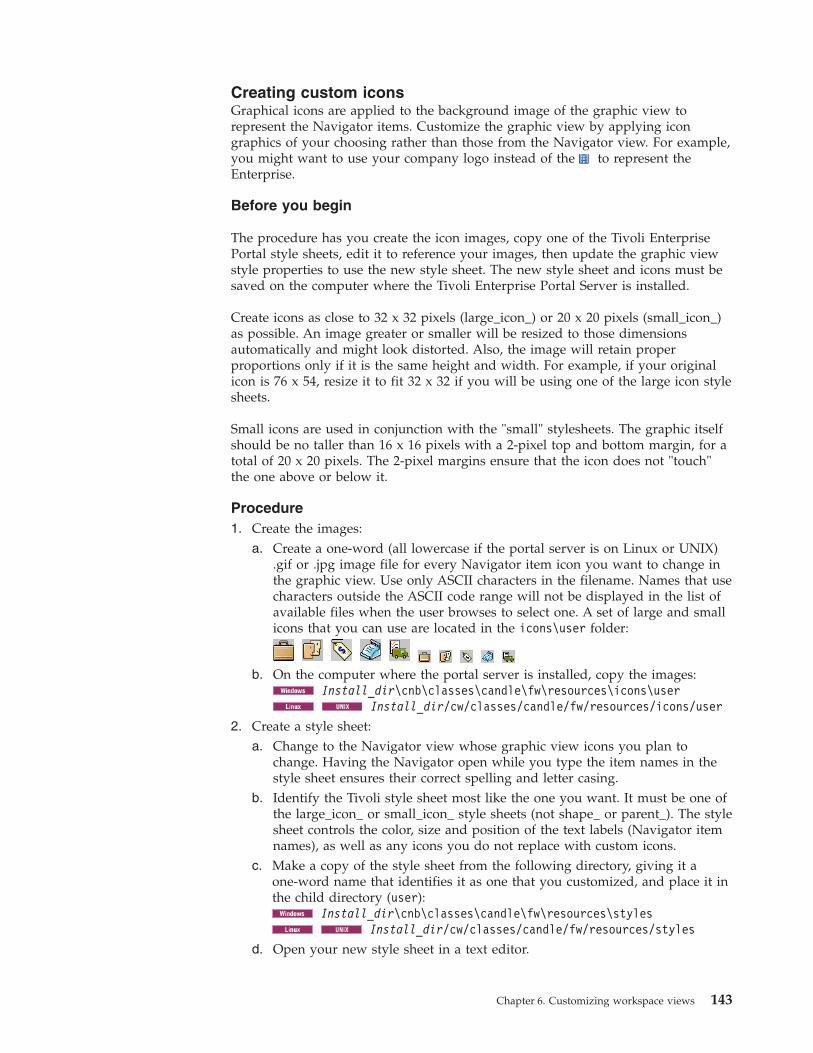
Creating custom iconsGraphical icons are applied to the background image of the graphic view torepresent the Navigator items. Customize the graphic view by applying icongraphics of your choosing rather than those from the Navigator view. For example,you might want to use your company logo instead of the to represent theEnterprise.
Before you begin
The procedure has you create the icon images, copy one of the Tivoli EnterprisePortal style sheets, edit it to reference your images, then update the graphic viewstyle properties to use the new style sheet. The new style sheet and icons must besaved on the computer where the Tivoli Enterprise Portal Server is installed.
Create icons as close to 32 x 32 pixels (large_icon_) or 20 x 20 pixels (small_icon_)as possible. An image greater or smaller will be resized to those dimensionsautomatically and might look distorted. Also, the image will retain properproportions only if it is the same height and width. For example, if your originalicon is 76 x 54, resize it to fit 32 x 32 if you will be using one of the large icon stylesheets.
Small icons are used in conjunction with the "small" stylesheets. The graphic itselfshould be no taller than 16 x 16 pixels with a 2-pixel top and bottom margin, for atotal of 20 x 20 pixels. The 2-pixel margins ensure that the icon does not "touch"the one above or below it.
Procedure1. Create the images:
a. Create a one-word (all lowercase if the portal server is on Linux or UNIX).gif or .jpg image file for every Navigator item icon you want to change inthe graphic view. Use only ASCII characters in the filename. Names that usecharacters outside the ASCII code range will not be displayed in the list ofavailable files when the user browses to select one. A set of large and smallicons that you can use are located in the icons\user folder:
b. On the computer where the portal server is installed, copy the images:Install_dir\cnb\classes\candle\fw\resources\icons\user
Install_dir/cw/classes/candle/fw/resources/icons/user
2. Create a style sheet:a. Change to the Navigator view whose graphic view icons you plan to
change. Having the Navigator open while you type the item names in thestyle sheet ensures their correct spelling and letter casing.
b. Identify the Tivoli style sheet most like the one you want. It must be one ofthe large_icon_ or small_icon_ style sheets (not shape_ or parent_). The stylesheet controls the color, size and position of the text labels (Navigator itemnames), as well as any icons you do not replace with custom icons.
c. Make a copy of the style sheet from the following directory, giving it aone-word name that identifies it as one that you customized, and place it inthe child directory (user):
Install_dir\cnb\classes\candle\fw\resources\stylesInstall_dir/cw/classes/candle/fw/resources/styles
d. Open your new style sheet in a text editor.
Chapter 6. Customizing workspace views 143
e. Edit the @import lines at the top of the file to insert ../ in front of the $.Example:@import “../$base.css”; @import “../$baseLargeIcon.ss”;@import “../$baseNodeLabelBottom.css”;
f. Copy and paste the following entry at the end of the file, one line for eachNavigator item whose graphic view icon you want to change.node[name = “My Item Name”]{iconImage: url(../../icons/user/iconname.gif);}
g. Replace Your Item Name Here with the exact name of the Navigator item;and replace iconname.gif with the exact name of the icon graphic file. Becareful to follow the syntax exactly. Any errors, such as missing or extraparentheses, quotes, or misspellings will give unpredictable results. Thesymptom might be that your style sheet change did not affect the graphicview or the view contents disappear.
h. Save the text file.3. Apply the new style sheet:
a. Open the workspace that contains the graphic view or add a graphic viewto the current workspace.
b. In the graphic view title bar, click Properties.c. In the Style tab, click the plot area of the thumbnail graphic.d. Adjust the Background settings as needed.e. In the Style area, click Browse, select the custom style sheet from the Select
Name list, and click OK. Your style sheets are displayed as user/style at theend of the list. If you do not see your style sheet in the list, check that yousaved it in the right directory and that you did not start the name with $. Ifyou are in browser mode, make sure you added a style entry to$_index.txt and that you spelled it correctly. You can drag the borderbetween Preview and Style to make the preview image larger.
f. When you are finished editing the graphic view properties, save yourchanges with Apply to keep the window open, or OK to close the Propertieseditor.
What to do next1. When you erase the background image name (no image selected) or use a
non-map background, you usually need to save the workspace, switch toanother workspace, then return to it to see the correct icon sizes. This isrequired whenever the image sizes do not scale as you expect.
2. After you have created a user style sheet and associated it with a graphic view,you can make further changes with a text editor and see the effect withoutreopening the Properties editor. To do so, save the changed file, click ReloadStylesheet to refresh the style sheet and see the new icons.
3. If you want your new style sheet to be applied automatically to all new graphicviews you create, you can make it the default.
Changing the default graphicsWhen you drop a new graphic view onto the workspace, the background thatdisplays is the default image, as are the icons overlaying the graphic. You canchange the graphic and the styling through the Properties editor Style tab. If youprefer another background graphic or icons for the default images, you can useyour own.
144 IBM Tivoli Monitoring: Tivoli Enterprise Portal User's Guide
About this task
Take these steps on the computer where the Tivoli Enterprise Portal Server isinstalled.
Procedurev To change the default background:
1. Rename the original default.jpg to default_backup.jpg in the backgroundsdirectory:
or Install_dir/cw/classes/candle/fw/resources/backgrounds
Install_dir\cnb\classes\candle\fw\resources\backgrounds
2. Copy the new default graphic to the same directory and name itdefault.jpg.
v To change the default icons and styles:1. Make a backup copy of $base.css, $baseIcon.css, $baseLargeIcon.css, and
$baseNodeState.css in the styles directory:or Install_dir/cw/classes/candle/fw/resources/stylesInstall_dir\cnb\classes\candle\fw\resources\styles
2. Edit the original style sheets to reference the images that you want as thedefaults. All users connecting to this portal server will get this default iconimages whenever they create a new graphic view.
Adding a situation event console viewYou can add a situation event console view to list each alert for situationsassociated with the current Navigator item and those it subsumes.
Before you begin
This feature requires your user ID to have Workspace Author Mode permission.
About this task
The situation event console view adds a row for every event status change forsituations associated with this branch of the Navigator, up to 100 rows. Theconsole has a toolbar for filtering the view to show only the events that you wantto see and a pop-up menu with items for managing events. Take these steps to adda situation event console view to a workspace:
Procedure1. Open the workspace where you want to add the situation event console view.2. If you want the view to occupy a new pane, click Split Vertically or Split
Horizontally in one of the views. The pane divides and a duplicate is created. Ifyou split the Navigator, the new view is empty.
3. Click Situation Event Console. The mouse pointer changes to the view icon(hand icon in Linux). If you get the wrong icon or decide not to add the view,press Escape or click somewhere in the main toolbar.
4. Click inside the view where you want the event console. After you click, theold view is replaced by the event console.
5. Use any of the filtering tools to limit or expand the rows to show the eventsyou are most interested in.
Chapter 6. Customizing workspace views 145
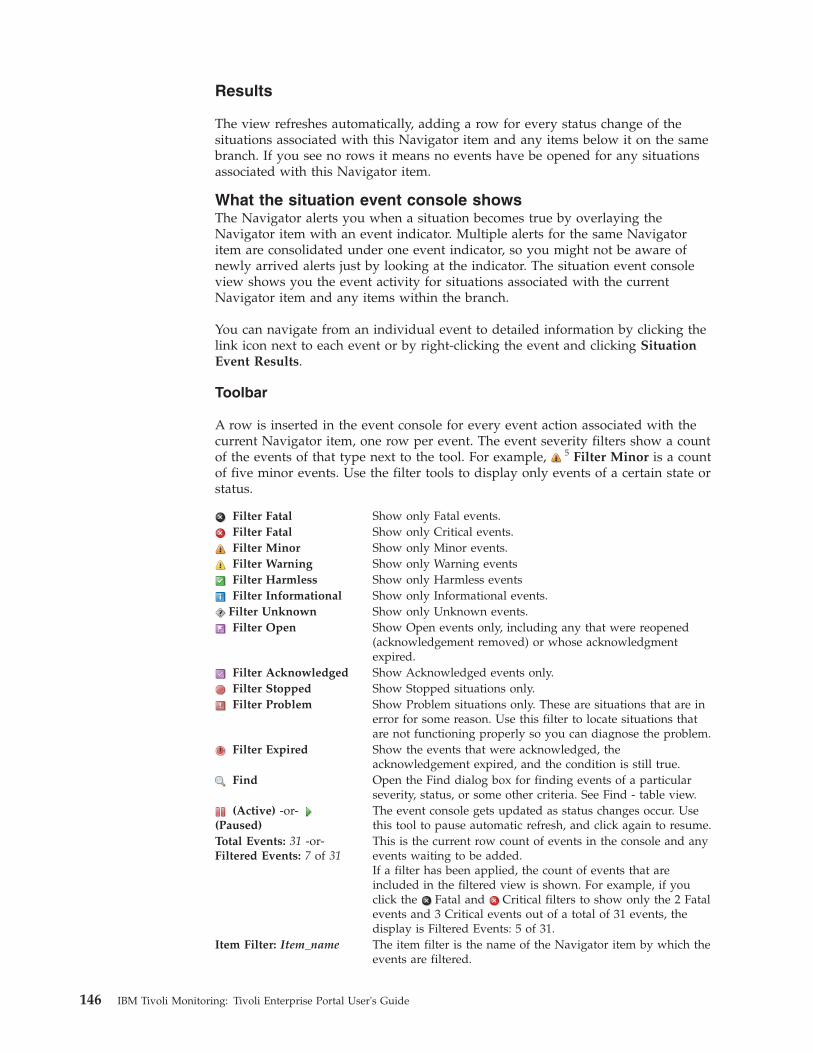
Results
The view refreshes automatically, adding a row for every status change of thesituations associated with this Navigator item and any items below it on the samebranch. If you see no rows it means no events have be opened for any situationsassociated with this Navigator item.
What the situation event console showsThe Navigator alerts you when a situation becomes true by overlaying theNavigator item with an event indicator. Multiple alerts for the same Navigatoritem are consolidated under one event indicator, so you might not be aware ofnewly arrived alerts just by looking at the indicator. The situation event consoleview shows you the event activity for situations associated with the currentNavigator item and any items within the branch.
You can navigate from an individual event to detailed information by clicking thelink icon next to each event or by right-clicking the event and clicking SituationEvent Results.
Toolbar
A row is inserted in the event console for every event action associated with thecurrent Navigator item, one row per event. The event severity filters show a countof the events of that type next to the tool. For example, 5 Filter Minor is a countof five minor events. Use the filter tools to display only events of a certain state orstatus.
Filter Fatal Show only Fatal events.Filter Fatal Show only Critical events.Filter Minor Show only Minor events.Filter Warning Show only Warning eventsFilter Harmless Show only Harmless eventsFilter Informational Show only Informational events.
Filter Unknown Show only Unknown events.Filter Open Show Open events only, including any that were reopened
(acknowledgement removed) or whose acknowledgmentexpired.
Filter Acknowledged Show Acknowledged events only.Filter Stopped Show Stopped situations only.Filter Problem Show Problem situations only. These are situations that are in
error for some reason. Use this filter to locate situations thatare not functioning properly so you can diagnose the problem.
Filter Expired Show the events that were acknowledged, theacknowledgement expired, and the condition is still true.
Find Open the Find dialog box for finding events of a particularseverity, status, or some other criteria. See Find - table view.
(Active) -or-(Paused)
The event console gets updated as status changes occur. Usethis tool to pause automatic refresh, and click again to resume.
Total Events: 31 -or-Filtered Events: 7 of 31
This is the current row count of events in the console and anyevents waiting to be added.If a filter has been applied, the count of events that areincluded in the filtered view is shown. For example, if youclick the Fatal and Critical filters to show only the 2 Fatalevents and 3 Critical events out of a total of 31 events, thedisplay is Filtered Events: 5 of 31.
Item Filter: Item_name The item filter is the name of the Navigator item by which theevents are filtered.
146 IBM Tivoli Monitoring: Tivoli Enterprise Portal User's Guide
Event list
The event console displays event information in the view.
If you begin to scroll the view or expand pure events,automatic refresh turns off and this indicator is displayed atthe top left corner of the list. Click Console Resume when youwant to resume automatic refresh.
Pure Event in the first column indicates the event is a pureevent. Consecutive pure events are consolidated: Expandthe list to show a row for each pure event; Link to eventdetails about the pure event; Collapse the list back to onerow. If the list does not expand, it means there is only one pureevent.Tip: You can remove old pure events from the list by closingthe pure event.The link button enables you to navigate to the Event Detailsworkspace for an individual event.
SeverityThe severity of the event: Critical, Warning, Informational, andso on.
Status
The status of the event:
Open The situation is true and the event indicator turnedon. The icon and threshold color indicate the severityof the alert.
overlays the state icon if the acknowledgement forthe event has Expired while the event is still open.
overlays the state icon if the acknowledgement hasbeen removed while the event is still open (Reopened).
AcknowledgedThe event has been acknowledged.
StoppedA user stopped the situation. It will not begin runningagain until someone starts it or edits it in the Situationeditor.
DeletedThe situation was deleted through the Situation editor.
ProblemThe situation is not functioning properly. One reasonmight be that the agent to which it is distributed isoffline or is at an old, unsupported version level.
Owner The user who acknowledged or took ownership of the event.Situation Name The name of the situation or policy.
Display ItemIf the situation was defined with a display item, it is displayedhere. Otherwise, this field is empty.
SourceThe name of the agent and system identifying where the eventoccurred.
ImpactThe name of the Navigator item where the event indicatororiginated; when you click , the entire branch opens.
OpenedThis is the local time at the agent location when the event waslast opened.
Age
This is the time interval that has passed since the event wasopened. If you apply a Filter or Threshold to this column, enterthe number of minutes. After you click outside the cell, youwill see the value converted to days, hours and minutes. Forexample, an entry of 1450 becomes 1 Day, 10 Minutes.
Chapter 6. Customizing workspace views 147
Local TimestampThe time at the Tivoli Enterprise Monitoring Server (the one towhich the agent connects) when the situation status changed.
Type
Additional information about the event, usually the event type.
SampledSampled events happen when a situation becomestrue. Situations sample data at regular intervals. Whenthe situation is true, it causes an event, which getsclosed automatically when the situation goes back tofalse (or you can close it manually).
Pure Pure events are unsolicited notifications. Examples ofpure events are an out-of-paper condition on a printerand an occurrence that adds an entry to the WindowsSystem Log. Some Tivoli monitoring agents haveattributes that report pure events, such as the NTEvent Log and NT File Change attribute groups. Asituation using one of these attributes can monitor forpure events. Because of the nature of pure events,they are not closed automatically like sampled events;you must close the event manually. Alternatively, youcan author the situation with an UNTIL clause.
Situation ID The situation identifier.
Table view features
The features available to the table view, such as column locking, can also be usedin the situation event console view.
Pop-up menu
You can open the Situation Event Results workspace and perform other eventrelated tasks from the pop-up menu: Edit Situation, Start Situation, Stop Situation,Acknowledge Event, and Event Notes. You can also launch an application on yoursystem, link to another workspace, or send a command to the managed systemwhere the event occurred.
Applying filters and thresholdsYou can apply filters and thresholds to adjust the event list and the number ofrows that are displayed from the console.
About this task
You can adjust the event list to show only those of a certain severity or status,owner, attribute or attribute value, or associated with another Navigator item. Youcan also limit or expand the maximum number of rows that can show on theconsole, and you can apply thresholds to cells. Tools are provided for the mostcommon filters, state and status, so you can quickly toggle a filter on or off.
SeverityAll severities are shown in the event list. You can filter the list to show oneor two states instead of all:v Click , , , , , or to filter the view to show only events
with that severity.v Click a tool again to remove that particular filter.
Status All status types are shown in the event list. You can filter the list to showonly a certain status:
148 IBM Tivoli Monitoring: Tivoli Enterprise Portal User's Guide
v Click Open, Acknowledged, Stopped, or Problem to filteron one or more of these statuses.
v Click a tool again to remove that particular filter.
ColumnThe toolbar enables you to filter the list by Severity, Status, or Owner.Through the popup menu, you can filter on any column and even multiplecolumns.1. Right-click the cell on whose value you want to filter the incoming
data.2. Click Set Quick Filter, then select the attribute (attribute name ==
value).
If you want to remove the quick filter, right-click a cell in the samecolumn, point to Set Quick Filter, and click either Remove Quick Filterto remove the last filter applied or Remove Quick Filter Predicate andselect the filter to remove.
Navigator itemInitially, the event console shows events for the situations associated withthe current Navigator item. You can change the view to show the event listfor a different Navigator item:1. Select the Navigator item whose events you want to see.2. Hold down the Ctrl key while dragging the Navigator item into the
view.3. When the mouse is over one of the rows, release the mouse button.
Number of rowsTivoli Enterprise Portal enters a row in the table at the time a change tothe event status takes place. As new rows arrive, they appear indescending order with the oldest rows at the bottom. After the maximum(100 is the default) is reached, the oldest row is removed as each new rowarrives. The view refreshes every time a new event arrives, so the morerows you have in the view, the more time the refresh takes. To change themaximum:1. Right-click anywhere in the event console view.2. Click Set Max Rows, then select 50, 100 or 500 from the list.
Quick thresholdUse the quick settings to highlight cell values that fall outside thethreshold:1. Right-click the cell on whose value you want to apply a threshold
indicator.2. Click Set Quick Threshold, then select the severity to apply to that
attribute value (attribute name == value).
If you want to remove the quick thresholds applied to the view, right-clicka cell in the same column, point to Set Quick Threshold, and clickeither Remove Quick Thresholds to remove the last threshold applied, orRemove Quick Thresholds Predicate and select the threshold to remove.
If you edit the properties for this view, you can make the quick filter orquick threshold permanent by right-clicking the row number and clickingRemove Quick Flag in the Filters or Thresholds tab.
Chapter 6. Customizing workspace views 149
Editing the situation event console view propertiesThe properties for the situation event console view have Filters, Thresholdsand Style tabs. You can set a filter so only certain status types or systems arereported, set thresholds to highlight values outside the limits in red or yellow, anddefine the appearance of this view.
About this task
With the situation event console view displaying, follow these steps to edit theproperties:
Procedure1. In the view title bar, click Edit properties. The Properties editor for the
workspace opens and displays the properties of the selected view.2. Set Filters, as described in “Filtering a query-based view” on page 85, to
report only the values or value ranges you specify. If you set a quick filter, it
will appear here and the row will be marked with the Quick flag icon. Youcan make it a permanent filter by right-clicking the row number and selecting
Remove Quick Flag.3. Set Thresholds, as described in “Adding column thresholds” on page 96, to
highlight areas of interest. If you set a quick threshold, it will appear here and
the row will be marked with the Quick flag icon. You can make it apermanent threshold by right-clicking the row number and selecting
Remove Quick Threshold.4. When you are finished editing the situation event console properties, save your
changes by clicking Apply to keep the Properties editor open, or OK to closethe editor.
Adding a common event console viewAdd the common event console view to a workspace to get a single, integrateddisplay of events from multiple event repositories, including Tivoli Monitoring,Tivoli Enterprise Console, and Tivoli Netcool/OMNIbus.
About this task
To add a common event console view:
Procedure1. Open the workspace where you want the common event console view. A
common event console view is not associated with any particular Navigatoritem. Therefore, it always shows all available events from the configuredconnectors, subject to any filtering options you select for the view.
2. If you want the view to occupy a new pane, click Split Vertically or SplitHorizontally in one of the views. The pane divides and a duplicate is created. Ifyou split the Navigator, the new view is empty.
3. Click Common Event Console. The mouse pointer changes to the view icon(or the hand icon on Linux systems). If you accidentally click the wrong icon ordecide not to add the view, press Esc or click somewhere in the toolbar.
4. Click inside the view where you want the common event console. After youclick, the old view is replaced by the common event console. If any of theconfigured common event connectors are experiencing problems retrieving
150 IBM Tivoli Monitoring: Tivoli Enterprise Portal User's Guide
event data, a window might appear to notify you of the problem. You can usethe Common Event Connector Status window to see the status of all configuredconnectors.
5. Use any of the filtering tools to show the events that you are most interestedin.
What to do next
You can adjust the event console to show only events of a certain severity, status,owner, or other attribute value. You can also apply thresholds to cells.
What the common event console view showsA row is inserted in the common event console for each event retrieved from aconnected event repository: Tivoli Enterprise Monitoring Server, Tivoli EnterpriseConsole event server, and Netcool/OMNIbus ObjectServer. Use the tools to displayonly events of a certain severity or status, to find specific events, and to controlhow the display is updated.
Toolbar
When severity or status filters are applied, the event console shows the events thatmatch any of the selected filters. If you filter on both severity and status, theconsole shows only the events that match both sets of filters. The exceptions are asfollows:v If you click all of the status filter icons, all status filters are removed; events of
all status values appear in the console.v If you click all of the severity filter icons, all severity filters are applied; events
of all severity values appear in the console.
Filter Fatal Show only Fatal events.Filter Critical Show only Critical events.Filter Minor Show only Minor events.Filter Warning Show only Warning eventsFilter Harmless Show only Harmless eventsFilter Informational Show only Informational events.Filter Unknown Show only Unknown events.Filter Open Show Open events only, including any that were reopened
(acknowledgement removed) or whose acknowledgmentexpired.
Filter Acknowledged Show Acknowledged events only.Filter Stopped Show Stopped situations only.Filter Problem Show Problem situations only. These are situations that are in
error for some reason. Use this filter to locate situations thatare not functioning properly so you can diagnose the problem.
Filter Expired Show the events that were acknowledged, theacknowledgement expired, and the condition is still true.
Find Open the Find dialog box for finding events of a particularseverity, status, or some other criteria. See Find - table view.
(Active) -or-(Paused)
The event console gets updated as status changes occur. Usethis tool to pause automatic refresh, and click again to resume.
Chapter 6. Customizing workspace views 151
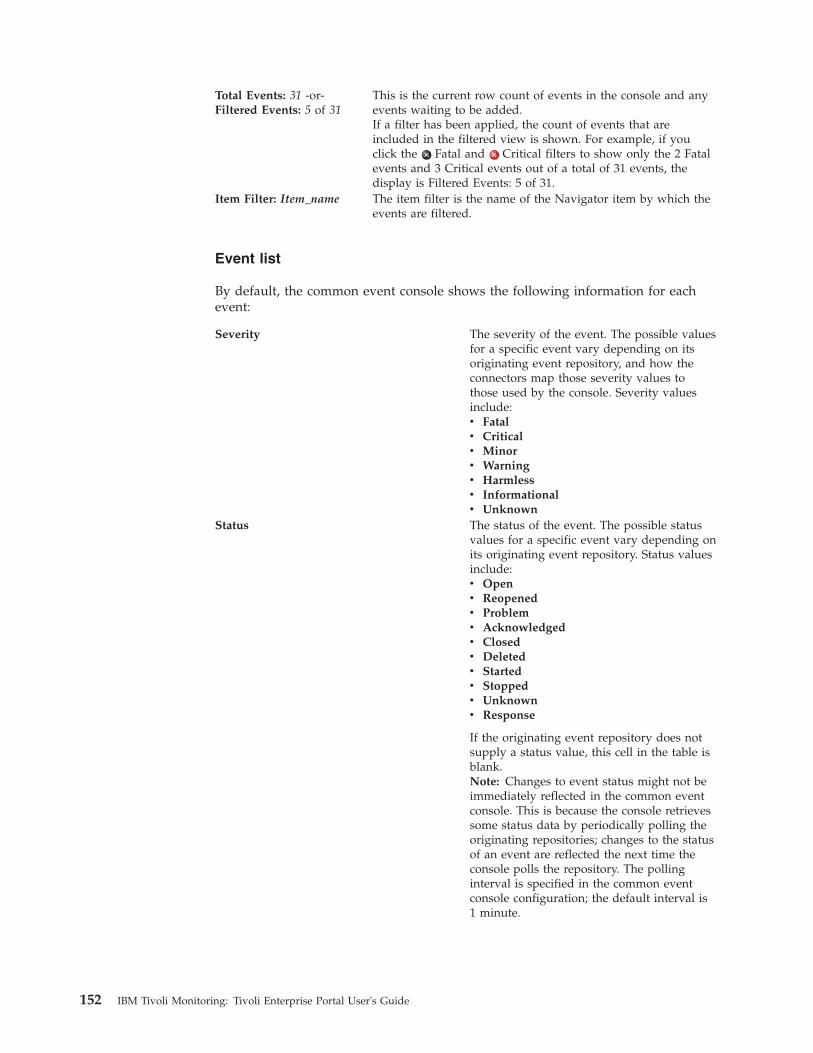
Total Events: 31 -or-Filtered Events: 5 of 31
This is the current row count of events in the console and anyevents waiting to be added.If a filter has been applied, the count of events that areincluded in the filtered view is shown. For example, if youclick the Fatal and Critical filters to show only the 2 Fatalevents and 3 Critical events out of a total of 31 events, thedisplay is Filtered Events: 5 of 31.
Item Filter: Item_name The item filter is the name of the Navigator item by which theevents are filtered.
Event list
By default, the common event console shows the following information for eachevent:
Severity The severity of the event. The possible valuesfor a specific event vary depending on itsoriginating event repository, and how theconnectors map those severity values tothose used by the console. Severity valuesinclude:v Fatalv Criticalv Minorv Warningv Harmlessv Informationalv Unknown
Status The status of the event. The possible statusvalues for a specific event vary depending onits originating event repository. Status valuesinclude:v Openv Reopenedv Problemv Acknowledgedv Closedv Deletedv Startedv Stoppedv Unknownv Response
If the originating event repository does notsupply a status value, this cell in the table isblank.Note: Changes to event status might not beimmediately reflected in the common eventconsole. This is because the console retrievessome status data by periodically polling theoriginating repositories; changes to the statusof an event are reflected the next time theconsole polls the repository. The pollinginterval is specified in the common eventconsole configuration; the default interval is1 minute.
152 IBM Tivoli Monitoring: Tivoli Enterprise Portal User's Guide
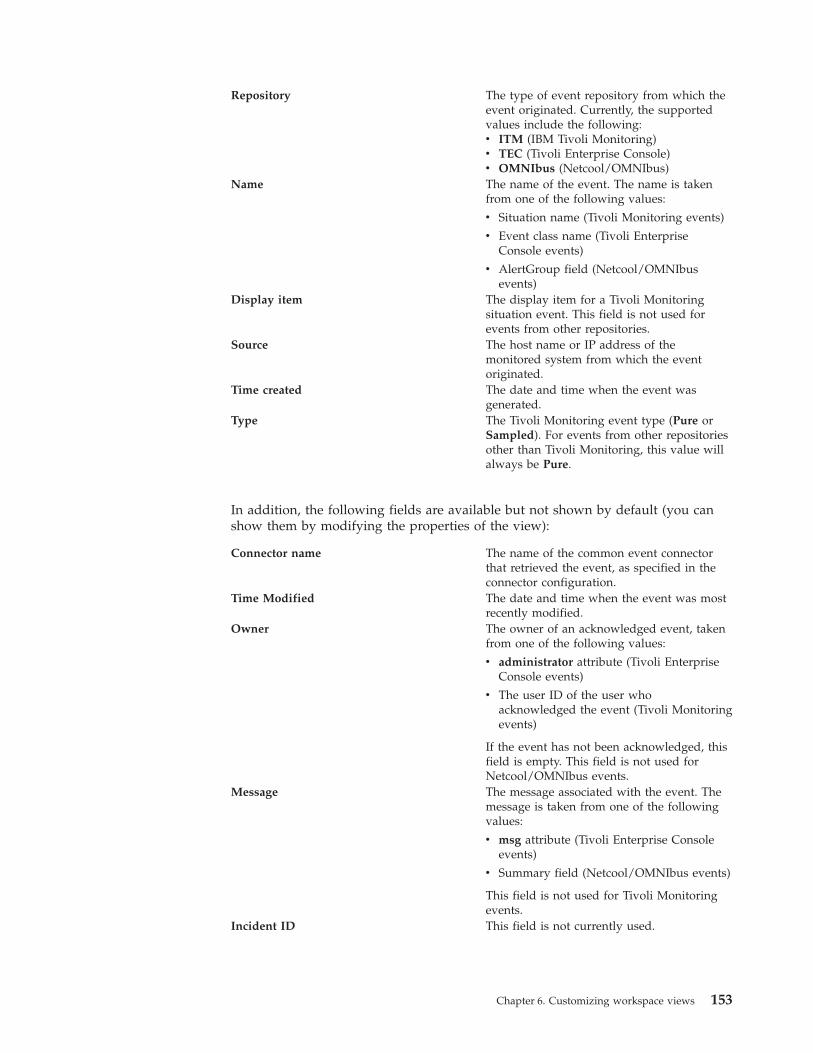
Repository The type of event repository from which theevent originated. Currently, the supportedvalues include the following:v ITM (IBM Tivoli Monitoring)v TEC (Tivoli Enterprise Console)v OMNIbus (Netcool/OMNIbus)
Name The name of the event. The name is takenfrom one of the following values:
v Situation name (Tivoli Monitoring events)
v Event class name (Tivoli EnterpriseConsole events)
v AlertGroup field (Netcool/OMNIbusevents)
Display item The display item for a Tivoli Monitoringsituation event. This field is not used forevents from other repositories.
Source The host name or IP address of themonitored system from which the eventoriginated.
Time created The date and time when the event wasgenerated.
Type The Tivoli Monitoring event type (Pure orSampled). For events from other repositoriesother than Tivoli Monitoring, this value willalways be Pure.
In addition, the following fields are available but not shown by default (you canshow them by modifying the properties of the view):
Connector name The name of the common event connectorthat retrieved the event, as specified in theconnector configuration.
Time Modified The date and time when the event was mostrecently modified.
Owner The owner of an acknowledged event, takenfrom one of the following values:
v administrator attribute (Tivoli EnterpriseConsole events)
v The user ID of the user whoacknowledged the event (Tivoli Monitoringevents)
If the event has not been acknowledged, thisfield is empty. This field is not used forNetcool/OMNIbus events.
Message The message associated with the event. Themessage is taken from one of the followingvalues:
v msg attribute (Tivoli Enterprise Consoleevents)
v Summary field (Netcool/OMNIbus events)
This field is not used for Tivoli Monitoringevents.
Incident ID This field is not currently used.
Chapter 6. Customizing workspace views 153
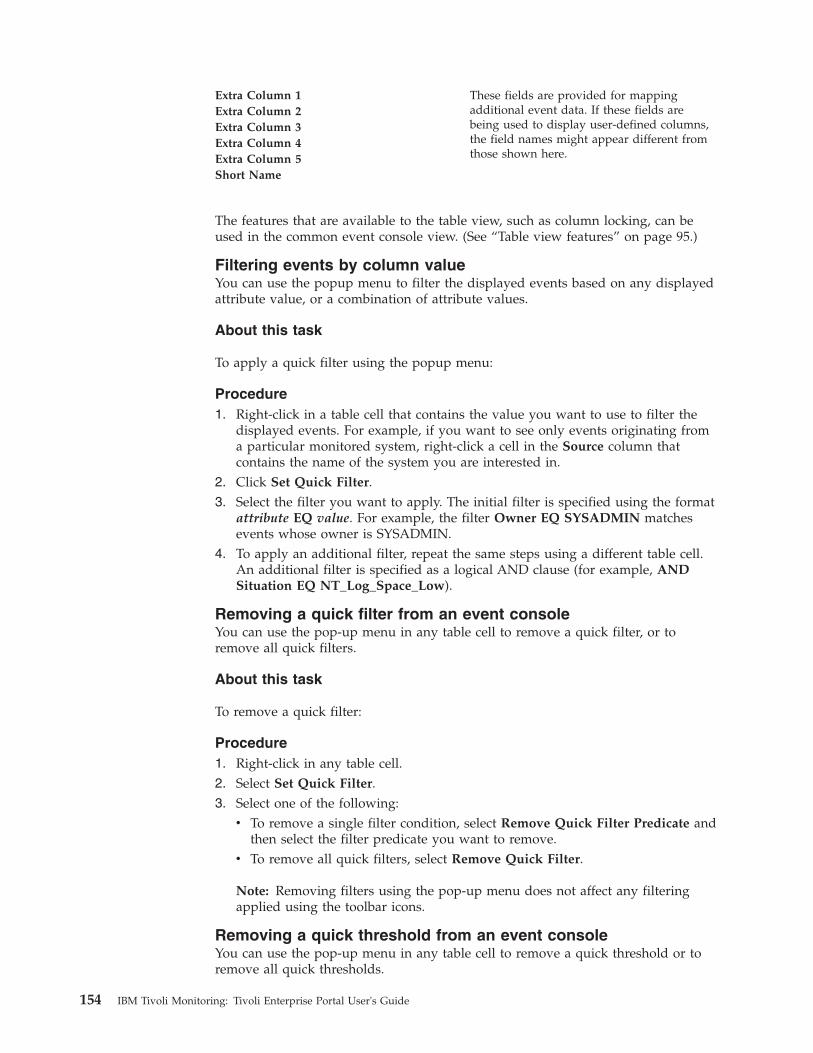
Extra Column 1 These fields are provided for mappingadditional event data. If these fields arebeing used to display user-defined columns,the field names might appear different fromthose shown here.
Extra Column 2Extra Column 3Extra Column 4Extra Column 5Short Name
The features that are available to the table view, such as column locking, can beused in the common event console view. (See “Table view features” on page 95.)
Filtering events by column valueYou can use the popup menu to filter the displayed events based on any displayedattribute value, or a combination of attribute values.
About this task
To apply a quick filter using the popup menu:
Procedure1. Right-click in a table cell that contains the value you want to use to filter the
displayed events. For example, if you want to see only events originating froma particular monitored system, right-click a cell in the Source column thatcontains the name of the system you are interested in.
2. Click Set Quick Filter.3. Select the filter you want to apply. The initial filter is specified using the format
attribute EQ value. For example, the filter Owner EQ SYSADMIN matchesevents whose owner is SYSADMIN.
4. To apply an additional filter, repeat the same steps using a different table cell.An additional filter is specified as a logical AND clause (for example, ANDSituation EQ NT_Log_Space_Low).
Removing a quick filter from an event consoleYou can use the pop-up menu in any table cell to remove a quick filter, or toremove all quick filters.
About this task
To remove a quick filter:
Procedure1. Right-click in any table cell.2. Select Set Quick Filter.3. Select one of the following:
v To remove a single filter condition, select Remove Quick Filter Predicate andthen select the filter predicate you want to remove.
v To remove all quick filters, select Remove Quick Filter.
Note: Removing filters using the pop-up menu does not affect any filteringapplied using the toolbar icons.
Removing a quick threshold from an event consoleYou can use the pop-up menu in any table cell to remove a quick threshold or toremove all quick thresholds.
154 IBM Tivoli Monitoring: Tivoli Enterprise Portal User's Guide
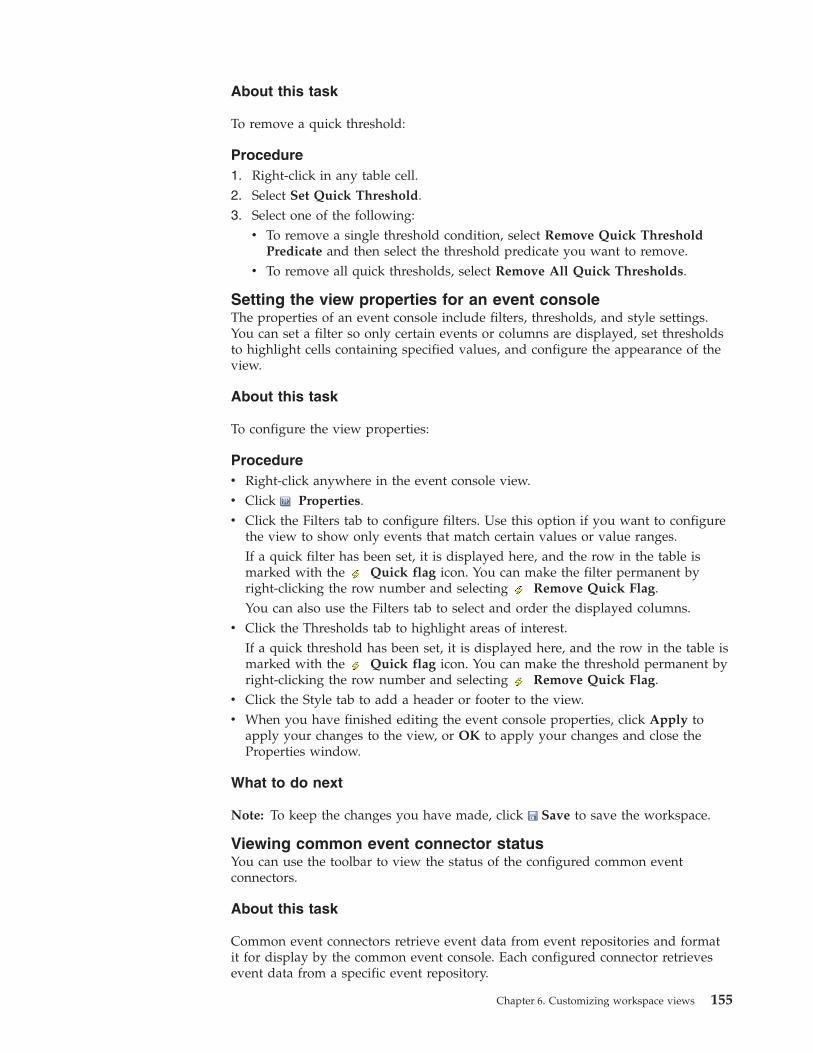
About this task
To remove a quick threshold:
Procedure1. Right-click in any table cell.2. Select Set Quick Threshold.3. Select one of the following:
v To remove a single threshold condition, select Remove Quick ThresholdPredicate and then select the threshold predicate you want to remove.
v To remove all quick thresholds, select Remove All Quick Thresholds.
Setting the view properties for an event consoleThe properties of an event console include filters, thresholds, and style settings.You can set a filter so only certain events or columns are displayed, set thresholdsto highlight cells containing specified values, and configure the appearance of theview.
About this task
To configure the view properties:
Procedurev Right-click anywhere in the event console view.v Click Properties.v Click the Filters tab to configure filters. Use this option if you want to configure
the view to show only events that match certain values or value ranges.If a quick filter has been set, it is displayed here, and the row in the table ismarked with the Quick flag icon. You can make the filter permanent byright-clicking the row number and selecting Remove Quick Flag.You can also use the Filters tab to select and order the displayed columns.
v Click the Thresholds tab to highlight areas of interest.If a quick threshold has been set, it is displayed here, and the row in the table ismarked with the Quick flag icon. You can make the threshold permanent byright-clicking the row number and selecting Remove Quick Flag.
v Click the Style tab to add a header or footer to the view.v When you have finished editing the event console properties, click Apply to
apply your changes to the view, or OK to apply your changes and close theProperties window.
What to do next
Note: To keep the changes you have made, click Save to save the workspace.
Viewing common event connector statusYou can use the toolbar to view the status of the configured common eventconnectors.
About this task
Common event connectors retrieve event data from event repositories and formatit for display by the common event console. Each configured connector retrievesevent data from a specific event repository.
Chapter 6. Customizing workspace views 155
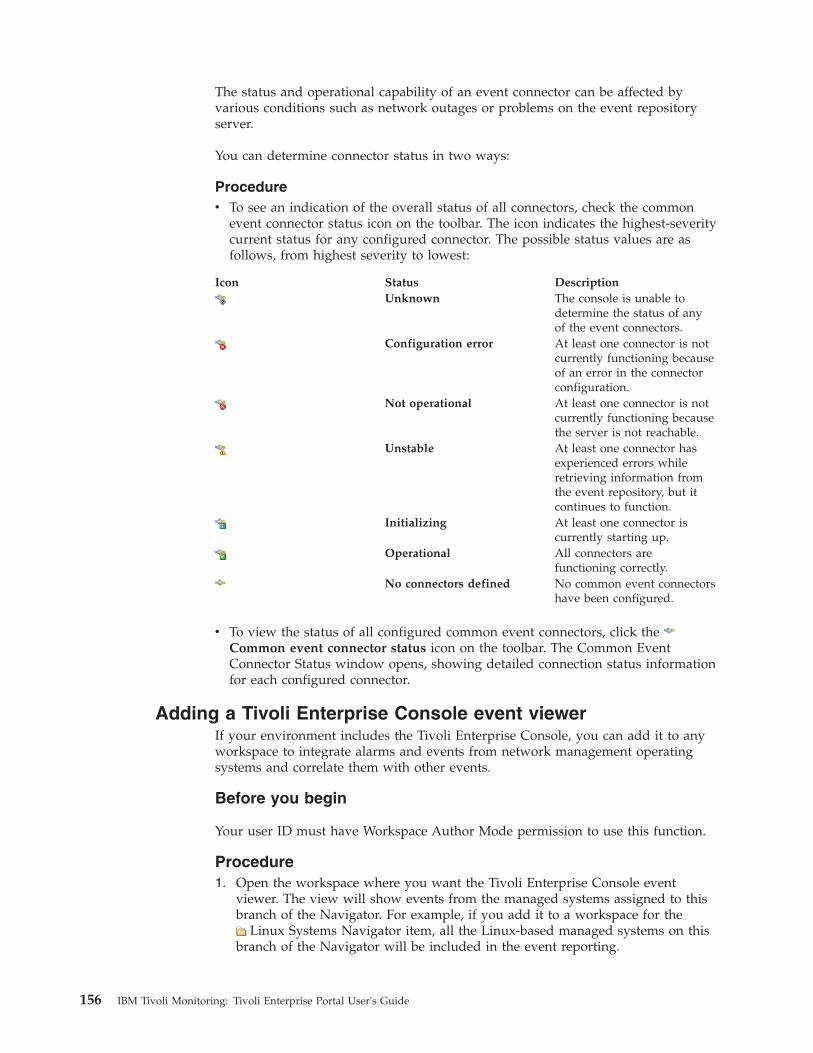
The status and operational capability of an event connector can be affected byvarious conditions such as network outages or problems on the event repositoryserver.
You can determine connector status in two ways:
Procedurev To see an indication of the overall status of all connectors, check the common
event connector status icon on the toolbar. The icon indicates the highest-severitycurrent status for any configured connector. The possible status values are asfollows, from highest severity to lowest:
Icon Status DescriptionUnknown The console is unable to
determine the status of anyof the event connectors.
Configuration error At least one connector is notcurrently functioning becauseof an error in the connectorconfiguration.
Not operational At least one connector is notcurrently functioning becausethe server is not reachable.
Unstable At least one connector hasexperienced errors whileretrieving information fromthe event repository, but itcontinues to function.
Initializing At least one connector iscurrently starting up.
Operational All connectors arefunctioning correctly.
No connectors defined No common event connectorshave been configured.
v To view the status of all configured common event connectors, click theCommon event connector status icon on the toolbar. The Common EventConnector Status window opens, showing detailed connection status informationfor each configured connector.
Adding a Tivoli Enterprise Console event viewerIf your environment includes the Tivoli Enterprise Console, you can add it to anyworkspace to integrate alarms and events from network management operatingsystems and correlate them with other events.
Before you begin
Your user ID must have Workspace Author Mode permission to use this function.
Procedure1. Open the workspace where you want the Tivoli Enterprise Console event
viewer. The view will show events from the managed systems assigned to thisbranch of the Navigator. For example, if you add it to a workspace for the
Linux Systems Navigator item, all the Linux-based managed systems on thisbranch of the Navigator will be included in the event reporting.
156 IBM Tivoli Monitoring: Tivoli Enterprise Portal User's Guide
2. If you want the view to occupy a new space, click Split Vertically orSplit Horizontally in one of the views.
3. Click Tivoli Enterprise Console. The mouse pointer changes to the viewicon (hand icon on Linux). If you get the wrong icon or decide not to add theview, press Escape or click somewhere in the toolbar.
4. Click inside the view where you want the Tivoli Enterprise Console eventviewer. After you click, the old view is replaced by the Tivoli EnterpriseConsole event viewer and a login or configuration window might display.
5. If the Tivoli Enterprise Console Login window opens, complete the fields tospecify the Tivoli Enterprise Console managed host and your user ID.
Results
After you click OK, a dynamic or event group query is issued and events areretrieved from the event server as they occur. The managed systems that arereporting events to this view are those assigned to the current Navigator item.
What to do next
Additional windows for viewing event details and running IBM Tivoli Monitoringtasks can be launched off this view.
When you return to this view during future work sessions, you can log onautomatically. If you are logged onto the portal server from your browser, be sureto exit and then restart the browser before attempting to log in again. Otherwise,any Tivoli Enterprise Console event viewers you add to workspaces will notreceive events.
Tivoli Enterprise Console event viewer and console toolbarsThe Tivoli Enterprise Console event viewer has tools for working with events andfiltering them. It also has a pop-up menu for actions to take on the selected row.When a dialog box is displayed you can click Help to access the Tivoli EnterpriseConsole help system.
PreferencesThis tool opens the Preferences window. The changes you make are foryour user ID and affect this and all new Tivoli Enterprise Console eventviewers. General preferences set the refresh rate for displaying new events,the age of closed events to display, and the number of events to display.The Working Queue/All Events preferences determine the column sortorder in the Working Queue and All Events queue. Severity Colorspreferences determine whether or not hover and column highlighting areactivated, and what colors to use for event severity.
New Task with Selected EventThis tool opens a window for configuring automated tasks, which runwhen a particular event is received by the event console. For example, youcan configure an automated task to send an e-mail message to anadministrator when an event matching the criteria you defined ahead oftime is received by the event console.
When an automated task completes, it issues information about its successor failure and any results created by the task. An icon is displayed in theTask Completion column of the Event Viewer when an automated taskcompletes. You can double-click this icon to view the task results. This iconalso is displayed for rule-based tasks that have completed.
Chapter 6. Customizing workspace views 157
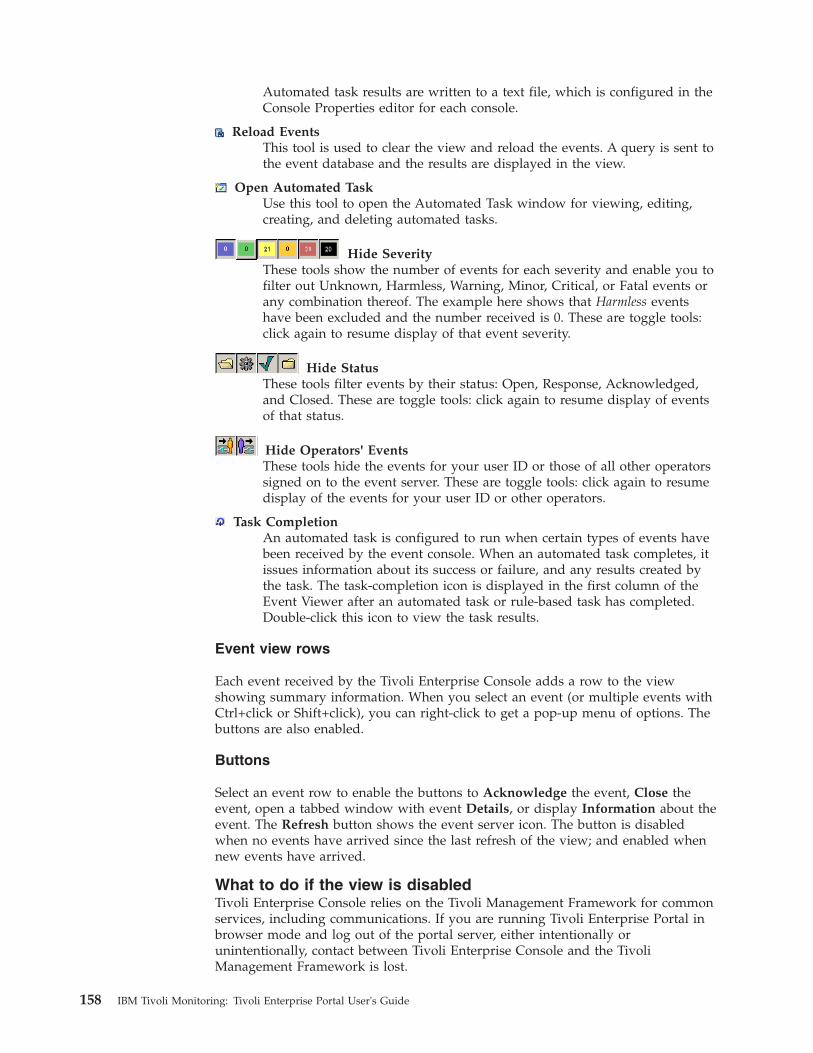
Automated task results are written to a text file, which is configured in theConsole Properties editor for each console.
Reload EventsThis tool is used to clear the view and reload the events. A query is sent tothe event database and the results are displayed in the view.
Open Automated TaskUse this tool to open the Automated Task window for viewing, editing,creating, and deleting automated tasks.
Hide SeverityThese tools show the number of events for each severity and enable you tofilter out Unknown, Harmless, Warning, Minor, Critical, or Fatal events orany combination thereof. The example here shows that Harmless eventshave been excluded and the number received is 0. These are toggle tools:click again to resume display of that event severity.
Hide StatusThese tools filter events by their status: Open, Response, Acknowledged,and Closed. These are toggle tools: click again to resume display of eventsof that status.
Hide Operators' EventsThese tools hide the events for your user ID or those of all other operatorssigned on to the event server. These are toggle tools: click again to resumedisplay of the events for your user ID or other operators.
Task CompletionAn automated task is configured to run when certain types of events havebeen received by the event console. When an automated task completes, itissues information about its success or failure, and any results created bythe task. The task-completion icon is displayed in the first column of theEvent Viewer after an automated task or rule-based task has completed.Double-click this icon to view the task results.
Event view rows
Each event received by the Tivoli Enterprise Console adds a row to the viewshowing summary information. When you select an event (or multiple events withCtrl+click or Shift+click), you can right-click to get a pop-up menu of options. Thebuttons are also enabled.
Buttons
Select an event row to enable the buttons to Acknowledge the event, Close theevent, open a tabbed window with event Details, or display Information about theevent. The Refresh button shows the event server icon. The button is disabledwhen no events have arrived since the last refresh of the view; and enabled whennew events have arrived.
What to do if the view is disabledTivoli Enterprise Console relies on the Tivoli Management Framework for commonservices, including communications. If you are running Tivoli Enterprise Portal inbrowser mode and log out of the portal server, either intentionally orunintentionally, contact between Tivoli Enterprise Console and the TivoliManagement Framework is lost.
158 IBM Tivoli Monitoring: Tivoli Enterprise Portal User's Guide
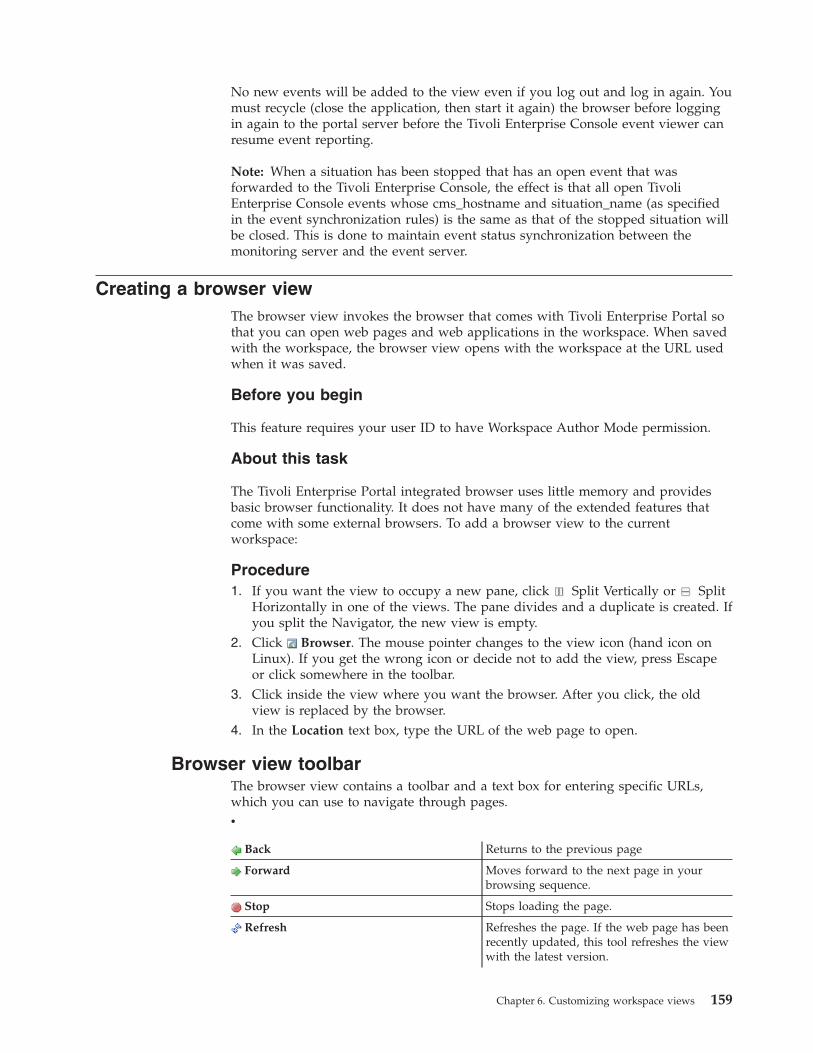
No new events will be added to the view even if you log out and log in again. Youmust recycle (close the application, then start it again) the browser before loggingin again to the portal server before the Tivoli Enterprise Console event viewer canresume event reporting.
Note: When a situation has been stopped that has an open event that wasforwarded to the Tivoli Enterprise Console, the effect is that all open TivoliEnterprise Console events whose cms_hostname and situation_name (as specifiedin the event synchronization rules) is the same as that of the stopped situation willbe closed. This is done to maintain event status synchronization between themonitoring server and the event server.
Creating a browser viewThe browser view invokes the browser that comes with Tivoli Enterprise Portal sothat you can open web pages and web applications in the workspace. When savedwith the workspace, the browser view opens with the workspace at the URL usedwhen it was saved.
Before you begin
This feature requires your user ID to have Workspace Author Mode permission.
About this task
The Tivoli Enterprise Portal integrated browser uses little memory and providesbasic browser functionality. It does not have many of the extended features thatcome with some external browsers. To add a browser view to the currentworkspace:
Procedure1. If you want the view to occupy a new pane, click Split Vertically or Split
Horizontally in one of the views. The pane divides and a duplicate is created. Ifyou split the Navigator, the new view is empty.
2. Click Browser. The mouse pointer changes to the view icon (hand icon onLinux). If you get the wrong icon or decide not to add the view, press Escapeor click somewhere in the toolbar.
3. Click inside the view where you want the browser. After you click, the oldview is replaced by the browser.
4. In the Location text box, type the URL of the web page to open.
Browser view toolbarThe browser view contains a toolbar and a text box for entering specific URLs,which you can use to navigate through pages.v
Back Returns to the previous page
Forward Moves forward to the next page in yourbrowsing sequence.
Stop Stops loading the page.
Refresh Refreshes the page. If the web page has beenrecently updated, this tool refreshes the viewwith the latest version.
Chapter 6. Customizing workspace views 159
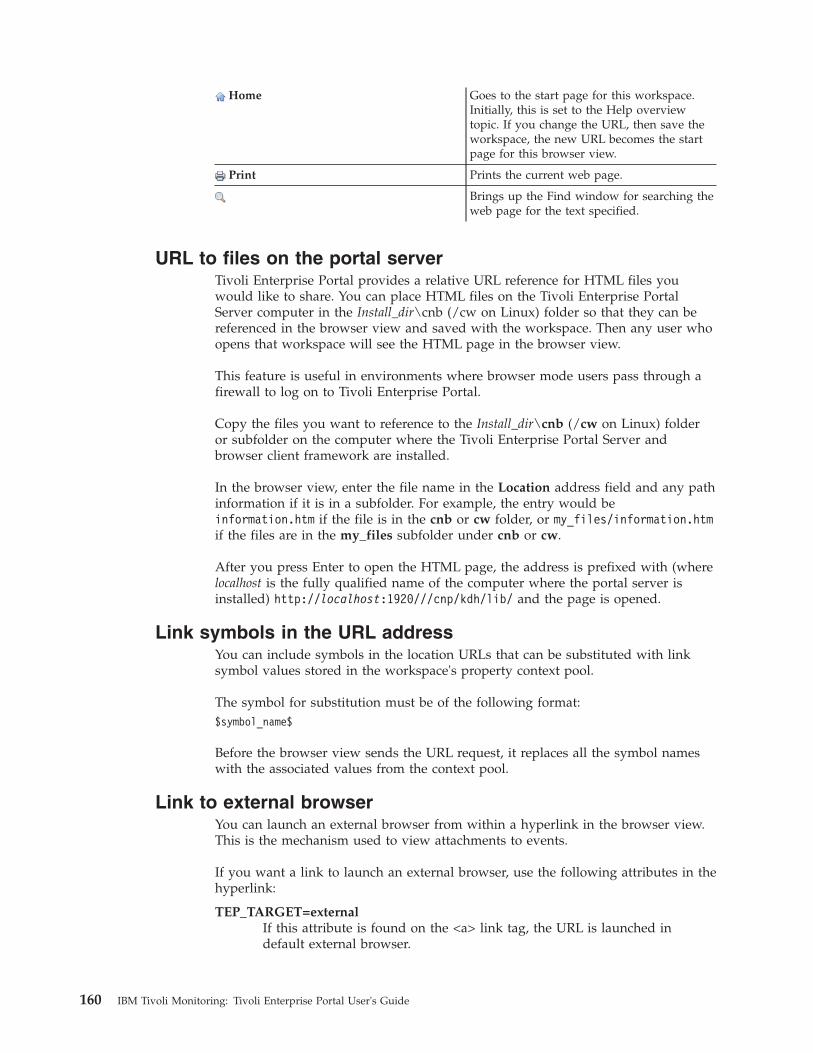
Home Goes to the start page for this workspace.Initially, this is set to the Help overviewtopic. If you change the URL, then save theworkspace, the new URL becomes the startpage for this browser view.
Print Prints the current web page.
Brings up the Find window for searching theweb page for the text specified.
URL to files on the portal serverTivoli Enterprise Portal provides a relative URL reference for HTML files youwould like to share. You can place HTML files on the Tivoli Enterprise PortalServer computer in the Install_dir\cnb (/cw on Linux) folder so that they can bereferenced in the browser view and saved with the workspace. Then any user whoopens that workspace will see the HTML page in the browser view.
This feature is useful in environments where browser mode users pass through afirewall to log on to Tivoli Enterprise Portal.
Copy the files you want to reference to the Install_dir\cnb (/cw on Linux) folderor subfolder on the computer where the Tivoli Enterprise Portal Server andbrowser client framework are installed.
In the browser view, enter the file name in the Location address field and any pathinformation if it is in a subfolder. For example, the entry would beinformation.htm if the file is in the cnb or cw folder, or my_files/information.htmif the files are in the my_files subfolder under cnb or cw.
After you press Enter to open the HTML page, the address is prefixed with (wherelocalhost is the fully qualified name of the computer where the portal server isinstalled) http://localhost:1920///cnp/kdh/lib/ and the page is opened.
Link symbols in the URL addressYou can include symbols in the location URLs that can be substituted with linksymbol values stored in the workspace's property context pool.
The symbol for substitution must be of the following format:$symbol_name$
Before the browser view sends the URL request, it replaces all the symbol nameswith the associated values from the context pool.
Link to external browserYou can launch an external browser from within a hyperlink in the browser view.This is the mechanism used to view attachments to events.
If you want a link to launch an external browser, use the following attributes in thehyperlink:
TEP_TARGET=externalIf this attribute is found on the <a> link tag, the URL is launched indefault external browser.
160 IBM Tivoli Monitoring: Tivoli Enterprise Portal User's Guide
TEP_LOCATION=relativeIf this attribute is found on the <a> link tag, the "href=" value is treated asa relative URL and the path is appended to the web server's basedresources.
Adding a notepad viewThe notepad view gives you a text editor for writing about the workspace.
Before you begin
Your user ID must have Workspace Author Mode permission to use this function.
Procedure1. Open the workspace where you want the view.2. If you want the view to occupy a new pane, click Split Vertically or Split
Horizontally in one of the views. The pane divides and a duplicate is created. Ifyou split the Navigator, the new view is empty.
3. Click Notepad. The mouse pointer changes to the view icon (hand icon onLinux). If you get the wrong icon or decide not to add the view, press Escapeor click somewhere in the toolbar.
4. Click inside the view where you want the notepad. After you click, the oldview is replaced by the notepad and a cursor is displayed.
What to do next
Type any text in the view. The standard text editing and cursor movement keys onyour keyboard can be used with the notepad view.
BackspaceDelete the character to the left of the cursor.
Delete Delete the character to the right of the cursor.
ArrowsMove the cursor left or right one space, or up or down one line.
Home Move the cursor to the beginning of the line.
End Move the cursor to the end of the line.
When you are finished, save (or File > Save As) the workspace if you want to keepthe notepad view and the text you entered.
Creating a take action viewTivoli Enterprise Portal enables you to interact directly with your applications andoperating system through its take action feature. You can use the take action viewto enter a system command or to stop or start a process at the system.
Before you begin
Your user ID must have Workspace Author Mode permission to use this function.
Procedure1. Open the workspace where you want the view
Chapter 6. Customizing workspace views 161
2. If you want the view to occupy a new pane, click Split Vertically or SplitHorizontally in one of the views. The pane divides and a duplicate is created. Ifyou split the Navigator, the new view is empty.
3. Click Take Action. The mouse pointer changes to the view icon (hand iconon Linux). If you get the wrong icon or decide not to add the view, pressEscape or click somewhere in the toolbar.
4. Click inside the view where you want the take action view. After you click, theold view is replaced by the take action view.
What to do next
If you want to keep the take action view in this workspace for future worksessions, either click Save to update the workspace properties with the newview, or click File > Save Workspace As to save this as a new workspace andleave the original unchanged.
Terminal viewUse the terminal view to connect to a TN3270, TN5250, or VT100 host system withTCP/IP. For a 3270 or 5250 terminal view, you also have scripting capability withrecord, playback, and authoring of entire scripts.
By associating a terminal view with a connection script and a query that returnsappropriate values, you can configure a view that opens to a specific panel of a3270 application. This feature, called dynamic terminal integration support, is usefulfor creating contextual workspace links for investigating issues.
Your user ID must have Workspace Author Mode permission to use this function.
Adding a terminal view to the workspaceYou can add a terminal view to your workspace, connect to a TN3270, TN5250, orVT100 host system with TCP/IP, and save the connection settings with theworkspace.
Procedure1. Open the workspace where you want the view.2. If you want the view to occupy a new pane, click Split Vertically or Split
Horizontally in one of the views. The pane divides and a duplicate is created. Ifyou split the Navigator, the new view is empty.
3. Click Terminal. The mouse pointer changes to the view icon (hand icon onLinux). If you get the wrong icon or decide not to add the view, press Escapeor click somewhere in the toolbar.
4. Click inside the view where you want the terminal emulator. When you clickinside a view, the Terminal Emulator Configuration window opens.
5. Specify the connection information for the view, or specify that you want toretrieve the connection information from a query.v If you want to specify the connection information in the configuration, select
Use the values from this dialog, and fill out the appropriate fields:
Host Type the host name or IP address of the system to which you wantto connect.
Port Type the IP port number to which you want to connect. The defaultof 23 is valid for most installations.
162 IBM Tivoli Monitoring: Tivoli Enterprise Portal User's Guide
Terminal typeSelect a terminal type from the Terminal Type list or accept thedefault.
v If you want to retrieve connection information from a query, select Fetchvalues from a query. You will then need to specify the appropriate query inthe view properties.
Note: To support obtaining connection information from a query, themonitoring agent for the target application must provide a suitable query touse. For more information, refer to the agent documentation.
6. Click OK to accept the configuration and add the view.7. If you specified Fetch values from a query, open the view properties and
specify the query that will provide the connection information. To determinewhich query to use, refer to the agent documentation.
8. If you want to keep the terminal view in this workspace for future worksessions, do one of the following:v Click Save to update the workspace properties with the new view.v Click Save Workspace As in the File menu to save this as a new workspace
and leave the original workspace as it was.
Results
This configuration information will be used each time the workspace is openedand will establish a connection to the specified host. By default the terminalconnection remains active until you disconnect manually or until you end thisTivoli Enterprise Portal work session. This means you can open other workspacesand return to this one without breaking the connection.
What to do next
If you want to use dynamic terminal integration support to link to a specificapplication panel, you must also configure a connection script. Without aconnection script, users will need to manually navigate to the appropriateapplication panel.
What the terminal view showsThe terminal view displays a toolbar, main terminal window, keyboard mapping,and status bar.
About this task
The terminal view has four parts:v A toolbar to control the display and operation of the session:
KeyPad toggles the display of the key mappings at the bottom of theview.
Connection connects to a session or disconnects from an active session.Disconnecting from a session while a script is active will terminate thescript; disconnecting while the script is recording will stop the recording.
Manage Scripts opens a window so you can create, edit, delete, start,and stop scripts for 3270 or 5250 sessions. Scripts are not available forTelnet sessions.
Record New Script prompts for a new script name and starts recording.
Chapter 6. Customizing workspace views 163
The text box shows Recording: name, where name is the title of the scriptcurrently being recorded. Scripts are not available for Telnet sessions.
Stop Script stops whichever is in use: script recording or scriptplayback.
v A main terminal window that represents the emulator session with the host. Youmanipulate this window in the same manner as a normal terminal.
v A keyboard mapping that emulates the aid keys of the real terminal. You canclick directly on these keys to send the equivalent aid key.
v A status bar that displays information about the current status of the session:Host name displays the name of the host to which you are connected.Connection status indicates whether the current session is connected ordisconnected.Keyboard status indicates whether the keyboard is locked or unlocked.Overwrite/Insert indicates whether the characters will overwrite or insert whentyped into an unprotected field.Field Status indicates whether a field on the terminal screen is protected orunprotected.Cursor Location displays the screen row, column of the cursor.
Terminal view propertiesThe terminal view has Configuration, Style, and Query properties that can beedited to suit your environment.
Click Edit properties in the terminal view title bar or right-click the view andclick Properties to see these tabs:
Configuration
The Configuration tab has sub-tabs for customizing the terminal view and itsdisplay: Connection and Scripts and Zoom. Whenever you open the workspace,the script you specify will run automatically and the host you specify will beconnected automatically.
Connection
ConnectionThis is the same Terminal Emulator Configuration window you get whenadding a terminal view to the workspace. The values are those yousupplied when you added the terminal view. You can change them here:
Fetch values from a query indicates that you want to retrieve connectioninformation from a query. You must specify the appropriate query on theQuery tab.
Use the values from this dialog indicates that you want to use theconnection information specified in these fields: Host is the host name orIP address of the system to which you want to connect; and Port is the IPport number used by the host software. The default of 23 is valid for mostinstallations.
Terminal Type is the name and dimensions of the terminal to emulate.Accept the default or select one from the list.
164 IBM Tivoli Monitoring: Tivoli Enterprise Portal User's Guide
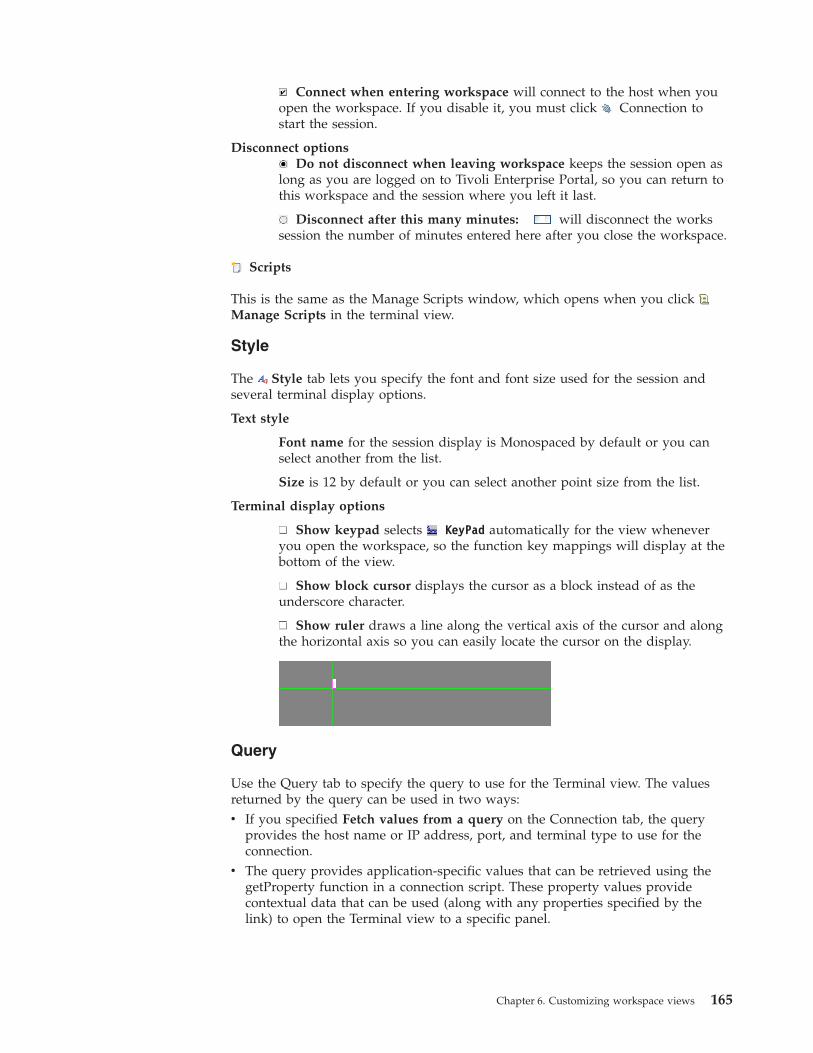
Connect when entering workspace will connect to the host when youopen the workspace. If you disable it, you must click Connection tostart the session.
Disconnect optionsDo not disconnect when leaving workspace keeps the session open as
long as you are logged on to Tivoli Enterprise Portal, so you can return tothis workspace and the session where you left it last.
Disconnect after this many minutes: will disconnect the workssession the number of minutes entered here after you close the workspace.
Scripts
This is the same as the Manage Scripts window, which opens when you clickManage Scripts in the terminal view.
Style
The Style tab lets you specify the font and font size used for the session andseveral terminal display options.
Text style
Font name for the session display is Monospaced by default or you canselect another from the list.
Size is 12 by default or you can select another point size from the list.
Terminal display options
Show keypad selects KeyPad automatically for the view wheneveryou open the workspace, so the function key mappings will display at thebottom of the view.
Show block cursor displays the cursor as a block instead of as theunderscore character.
Show ruler draws a line along the vertical axis of the cursor and alongthe horizontal axis so you can easily locate the cursor on the display.
Query
Use the Query tab to specify the query to use for the Terminal view. The valuesreturned by the query can be used in two ways:v If you specified Fetch values from a query on the Connection tab, the query
provides the host name or IP address, port, and terminal type to use for theconnection.
v The query provides application-specific values that can be retrieved using thegetProperty function in a connection script. These property values providecontextual data that can be used (along with any properties specified by thelink) to open the Terminal view to a specific panel.
Chapter 6. Customizing workspace views 165
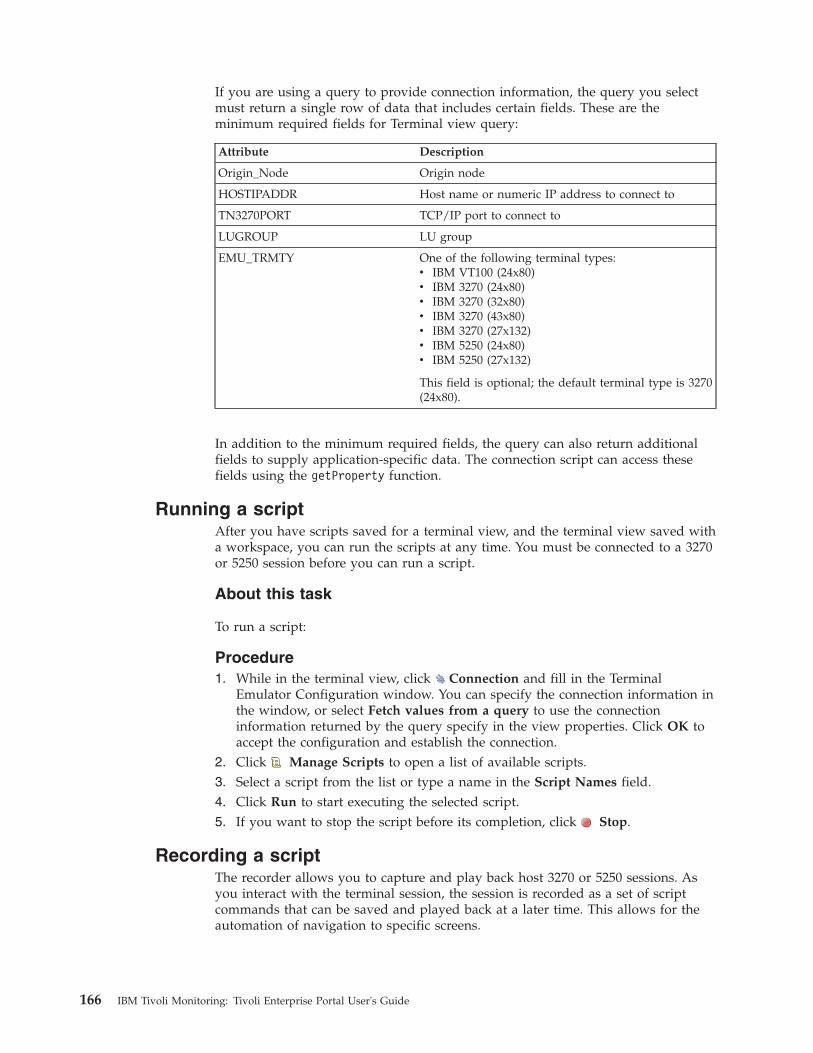
If you are using a query to provide connection information, the query you selectmust return a single row of data that includes certain fields. These are theminimum required fields for Terminal view query:
Attribute Description
Origin_Node Origin node
HOSTIPADDR Host name or numeric IP address to connect to
TN3270PORT TCP/IP port to connect to
LUGROUP LU group
EMU_TRMTY One of the following terminal types:v IBM VT100 (24x80)v IBM 3270 (24x80)v IBM 3270 (32x80)v IBM 3270 (43x80)v IBM 3270 (27x132)v IBM 5250 (24x80)v IBM 5250 (27x132)
This field is optional; the default terminal type is 3270(24x80).
In addition to the minimum required fields, the query can also return additionalfields to supply application-specific data. The connection script can access thesefields using the getProperty function.
Running a scriptAfter you have scripts saved for a terminal view, and the terminal view saved witha workspace, you can run the scripts at any time. You must be connected to a 3270or 5250 session before you can run a script.
About this task
To run a script:
Procedure1. While in the terminal view, click Connection and fill in the Terminal
Emulator Configuration window. You can specify the connection information inthe window, or select Fetch values from a query to use the connectioninformation returned by the query specify in the view properties. Click OK toaccept the configuration and establish the connection.
2. Click Manage Scripts to open a list of available scripts.3. Select a script from the list or type a name in the Script Names field.4. Click Run to start executing the selected script.5. If you want to stop the script before its completion, click Stop.
Recording a scriptThe recorder allows you to capture and play back host 3270 or 5250 sessions. Asyou interact with the terminal session, the session is recorded as a set of scriptcommands that can be saved and played back at a later time. This allows for theautomation of navigation to specific screens.
166 IBM Tivoli Monitoring: Tivoli Enterprise Portal User's Guide
About this task
To record a script:
Procedure1. While in the terminal view, click Record New Script.2. Type a new name in the Script Name field and click OK. From this point on, all
terminal activity will be captured in the script.3. Perform all the actions to be recorded in the script.4. When you are finished, click Stop. The script is now available in the
workspace for editing or execution through Manage Scripts.5. If you want the script to start automatically upon connection, click Manage
Scripts and select the script from the Startup Script list.6. Click Save to permanently save the script. Session scripts are saved with
your user ID, so no other users will be able to see and run the same scriptsunless you have Workspace administration mode turned on when you createthem. The saved script is available from any workspace to which you add aterminal view.
Managing scriptsUse the Manage Scripts function to edit existing scripts and to specify a script torun whenever you start a 3270 or 5250 terminal session.
About this task
To manage scripts:
Procedure1. While in the terminal view, click Manage Scripts to see the list of available
scripts. There are two types of scripts:v Global scripts are stored as part of the Tivoli Enterprise Portal configuration
and are available in any workspace. In the Manage Scripts window, globalscripts appear in normal text.
v Local scripts are stored as part of the workspace configuration and areassociated with a particular agent. In the Manage Scripts window, localscripts are indented and appear in italic text.
2. Select a script from the list, or type a name in the Script Names field, then clickone of the following:v Run to start executing the selected script. Note that you must be connected
to a session before you can run a script.v Stop to discontinue running the script. This is useful if you want to stop a
script before it has completed or if an unrecoverable error has occurred.v Record to start recording a new script. The Record New Script window
appears, prompting you for details about the new script.
Note: Select the Local script check box to specify that the new script shouldbe saved as local rather than global. Saving scripts as local is recommendedbecause local scripts can be exported and restored as part of the workspaceconfiguration. (For more information, refer to the IBM Tivoli Monitoring:Administrator's Guide.)
v Stop Recording to stop the recorder.
Chapter 6. Customizing workspace views 167
v Open to edit the selected script. The Script editor opens with basic editingfunctions such as Copy and Paste. It has menu items to create a New script,Save the script, Save As another script, and Exit the Script editor.
v Delete to remove the selected script from the list of available scripts.
Note: Some scripts are read-only and cannot be deleted or modified. If youedit a read-only script, you can save the modified version as a new script byclicking the Save As menu choice.
3. If you want to designate a script to start automatically upon connection, selectif from the Startup Script list. Connection to a host system is establishedwhenever you open a workspace that contains a terminal view, and when youreconnect to a session with Connection or by running a script. Instead ofusing hard-coded values, the connection script can use the getPropery functionto retrieve values specified by a workspace link or by the query specified in theview properties. These values can include connection information as well asapplication-specific data used to navigate to a specific application panel forinvestigating issues.
4. Click Save if you designated a startup script.
Terminal Emulator Scripting LanguageAutomate terminal view session navigation with scripts written with ourproprietary Terminal Emulator Scripting Language and saved for use in yourmonitored environment.
The scripting engine is an interpreter/execution engine based on a C-like language.It has a defined format and syntax, and a set of built-in functions. It also allowsyou to create your own functions. Because it is intended to address a specificenvironment—that of manipulating terminal session navigation—it does notprovide a full range of programming functionality.
Script syntaxCreate new 3270 or 5250 session scripts using the Manage Scripts feature that isavailable from the terminal view.
A script is a program made up of function definitions, variable definitions, andexecutable program statements. The terminal emulator scripting language is similarto Java or C. The scripting language has these general conventions:v Keywords, variables and function names are case-insensitivev All statements are terminated with a semi-colonv Multiple statements can appear on a single linev Function definitions must appear ahead of the data declarations and program
statementsv Declarations can appear anywhere before they are referenced
The general layout is:
Return-type FUNCTION function-name (optional parameters) {optional localvariables; statements...}
Reserved wordsReserved words are character strings that have special meanings. Theycannot be used except for their intended meaning. The reserved words areof three types:
168 IBM Tivoli Monitoring: Tivoli Enterprise Portal User's Guide
Language keywordsLanguage keywords are used as commands within a script. They areinterpreted to provide some action or considered as part of a statement.You can use these keywords only for their predefined purpose:
AND ; (semicolon) IfOR Break IntEQ Continue RealNE Else ReturnGE Exit StringGT For WhileLE Function LT
Declarations and function namesEach script program begins with global data declarations, stating the globalvariables and user-defined functions you will be using. Declarations buildan association between a function and its attributes or values. You do notneed to declare any of the built-in functions, because the interpreteralready recognizes these function names.
IdentifiersIdentifiers are the names that you create to denote constants, variables, andfunctions. Identifiers have the following characteristics:v an identifier can be any lengthv the first character must be alphabetic (a-z, A-Z), numeric (0-9), or an
underscore (_)v the remaining characters can be alphabetic (a-z, A-Z), numeric (0-9), or
underscores (_)v each identifier must be unique. Identifiers cannot be one of the reserved
words.
PunctuationThe following punctuation rules apply to a sectionv Statements end with a semi-colon – ;v Parameter lists are enclosed in parenthesis – ()v Parameters are separated by commas – ,v Statement blocks are enclosed in braces – {}
Embedded quoted stringsString literals are enclosed in double quotes or single quotes. You caninsert double quotes as part of a string literal by preceding the quote withthe escape character /". Alternatively, you can begin and end the stringliteral with the single quote character '. To imbed a single quote use the /'escape sequence or enclose the string literal within double quotes.Example:// Both statements yield embedded quotes quotedStr1 ="The job /"TSOA/" is running"; quotedStr2 = ’The job "TSOA" is running’;
White spaceThe script language ignores white space (spaces, tabs, new-lines) exceptwithin a quoted string.
CommentsComments are supported as a way to add explanatory text to your scriptprogram or to exclude certain parts of the code.v comments can be single line or multi-line comment blocks
Chapter 6. Customizing workspace views 169
v the script interpreter ignores commentsv comment blocks are enclosed within the /* */ pairs. Comment blocks
can span multiple lines.v comments can also start with the // character string. The interpreter
ignores everything to the right of the double slash up to the end of theline (new-line character).
v comments can start anywhere in the script
Example:// This is a single line comment a = 3;// this is a comment /* This section defines multiple linecomment block */ a = 3; /* imbedded comment block */ b=4;
Constants and variablesA constant is a named data item with a predefined value, while a variable is anamed data item whose value can change during the course of program execution.Variables can be either global or local.
All data is represented as one of three basic data types:
Int Integer data type ( + - followed by 1 or more digits 0–9).
Real Floating point (+- followed by zero or more digits 0–9). Decimal pointfollowed by 1 or more digits 0–9. Note that all numbers are storedinternally as Float.
String Any valid Unicode string enclosed within quotes.
ConstantsA constant is a named data item with a predefined value. You cannotchange the value assigned to a predefined constant. The predefinedconstants are:
NULL An empty reference. Similar to an empty pointer. Note that this isnot the same as a null string "".
TRUEEquivalent to the number 1.
FALSEEquivalent to the number 0.
Variable definitionsA variable is a named data item whose value can change during the courseof program execution. A variable name must follow the naming conventionof an Identifier (alphabetic character, numeric character, and theunderscore.) When more than one variable is defined on a singledeclaration, the name must be separated by commas. Each variabledeclaration must be terminated with a semi-colon. Variable names cannotbe the same as a reserved word.
Note: Identifiers and Names in the script language are case-insensitive.Thus, abc is the same as ABC.
Global and local variablesVariables can be either global or local. A variable is global unless it isdeclared within a function definition. Global variables are visible andavailable to all statements in a script. Local variables are only visible andavailable within the function where they were defined. Although variablenames and identifiers must be unique, it is valid to declare a local variable
170 IBM Tivoli Monitoring: Tivoli Enterprise Portal User's Guide
that has the same name as global, or the same name as a local variabledefined in another function. Parameter names in a function definition areconsidered to be local variables. Data passed to a function is by value. Aglobal variable passed to a function will not be changed by the function.
Operators and expressionsExpressions perform specific actions, based on an operator, with one or twooperands. An operand can be a constant, a variable or a function result. Operatorsare arithmetic, logical, and relational. As with C, some operators vary infunctionality according to the data type of the operands specified in the expression.
Arithmetic operators ( +, -, *, /, **, % )Arithmetic operators perform mathematical operations such as additionand subtraction with operands. There are two types of mathematicaloperators: unary and binary. Unary operators perform an action with asingle operand. Binary operators perform actions with two operands. In acomplex expression, (two or more operands) the order of evaluationdepends on precedence rules.
Unary arithmetic operatorsUnary operators are arithmetic operators that perform an action on a singleoperand. The script language recognizes the unary operator negative (-).
The negative unary operator reverses the sign of an expression frompositive to negative or vice-versa. The net effect is that of multiplying thenumber by -1. Example:a = -10;
The Prefix operators increment or decrement the variable prior todereferencing the object, while the Postfix operators increment ordecrement the variable after referencing it. Example:A=1;B = a++; // b will equal 1, a will equal 2;A = 1;B = ++a; // b will equal 2, a will equal 2;A= 1;B = a--; // b will equal 1, a will equal 0;
Binary arithmetic operatorsInsert a space before and after an arithmetic operator. The binaryarithmetic operators that are supported are listed below.
Table 1. Binary Arithmetic Operators
Symbol Operation Example Description
+ Addition a + b Add the two operands
- Subtraction a - b Subtract the second operandfrom the first operand
* Multiplication a * b Multiply the two operands
/ Division a / b Divide the first operand by thesecond operand
** Power a ** b Raise the first operand by thepower of the second operand
%Modulo a % b
Divide the first operand by thesecond operand and yield theremainder portion
Chapter 6. Customizing workspace views 171
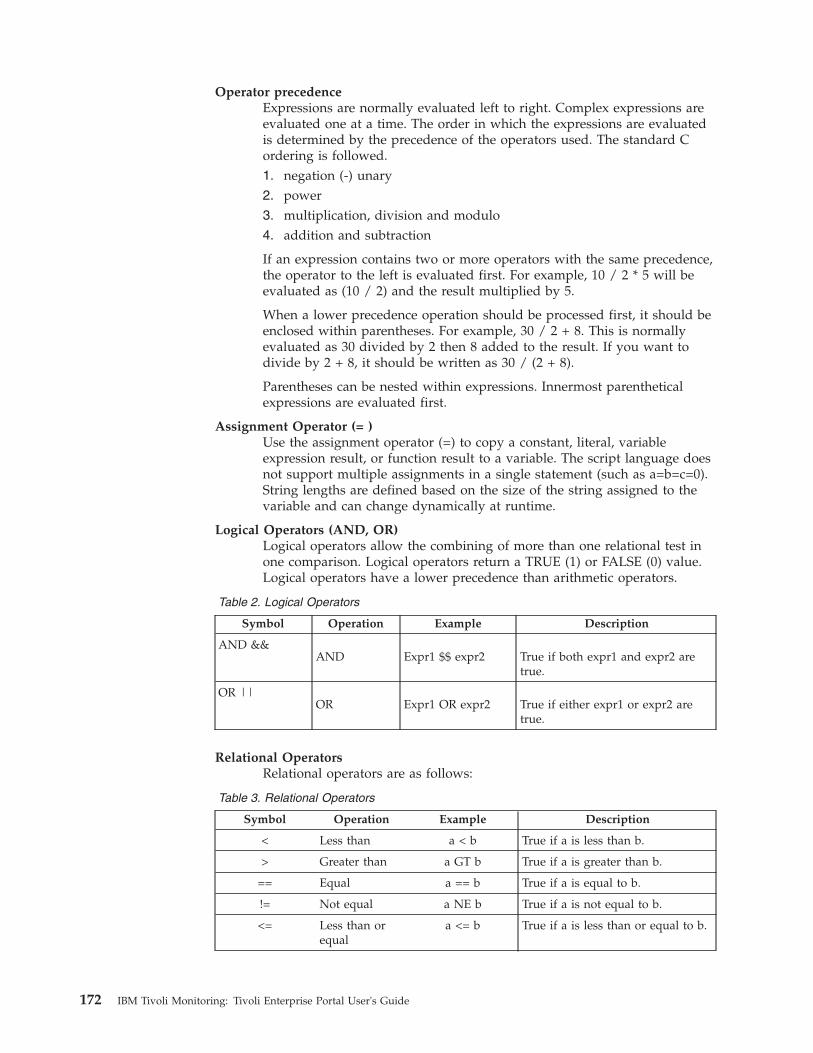
Operator precedenceExpressions are normally evaluated left to right. Complex expressions areevaluated one at a time. The order in which the expressions are evaluatedis determined by the precedence of the operators used. The standard Cordering is followed.1. negation (-) unary2. power3. multiplication, division and modulo4. addition and subtraction
If an expression contains two or more operators with the same precedence,the operator to the left is evaluated first. For example, 10 / 2 * 5 will beevaluated as (10 / 2) and the result multiplied by 5.
When a lower precedence operation should be processed first, it should beenclosed within parentheses. For example, 30 / 2 + 8. This is normallyevaluated as 30 divided by 2 then 8 added to the result. If you want todivide by 2 + 8, it should be written as 30 / (2 + 8).
Parentheses can be nested within expressions. Innermost parentheticalexpressions are evaluated first.
Assignment Operator (= )Use the assignment operator (=) to copy a constant, literal, variableexpression result, or function result to a variable. The script language doesnot support multiple assignments in a single statement (such as a=b=c=0).String lengths are defined based on the size of the string assigned to thevariable and can change dynamically at runtime.
Logical Operators (AND, OR)Logical operators allow the combining of more than one relational test inone comparison. Logical operators return a TRUE (1) or FALSE (0) value.Logical operators have a lower precedence than arithmetic operators.
Table 2. Logical Operators
Symbol Operation Example Description
AND &&AND Expr1 $$ expr2 True if both expr1 and expr2 are
true.
OR ||OR Expr1 OR expr2 True if either expr1 or expr2 are
true.
Relational OperatorsRelational operators are as follows:
Table 3. Relational Operators
Symbol Operation Example Description
< Less than a < b True if a is less than b.
> Greater than a GT b True if a is greater than b.
== Equal a == b True if a is equal to b.
!= Not equal a NE b True if a is not equal to b.
<= Less than orequal
a <= b True if a is less than or equal to b.
172 IBM Tivoli Monitoring: Tivoli Enterprise Portal User's Guide
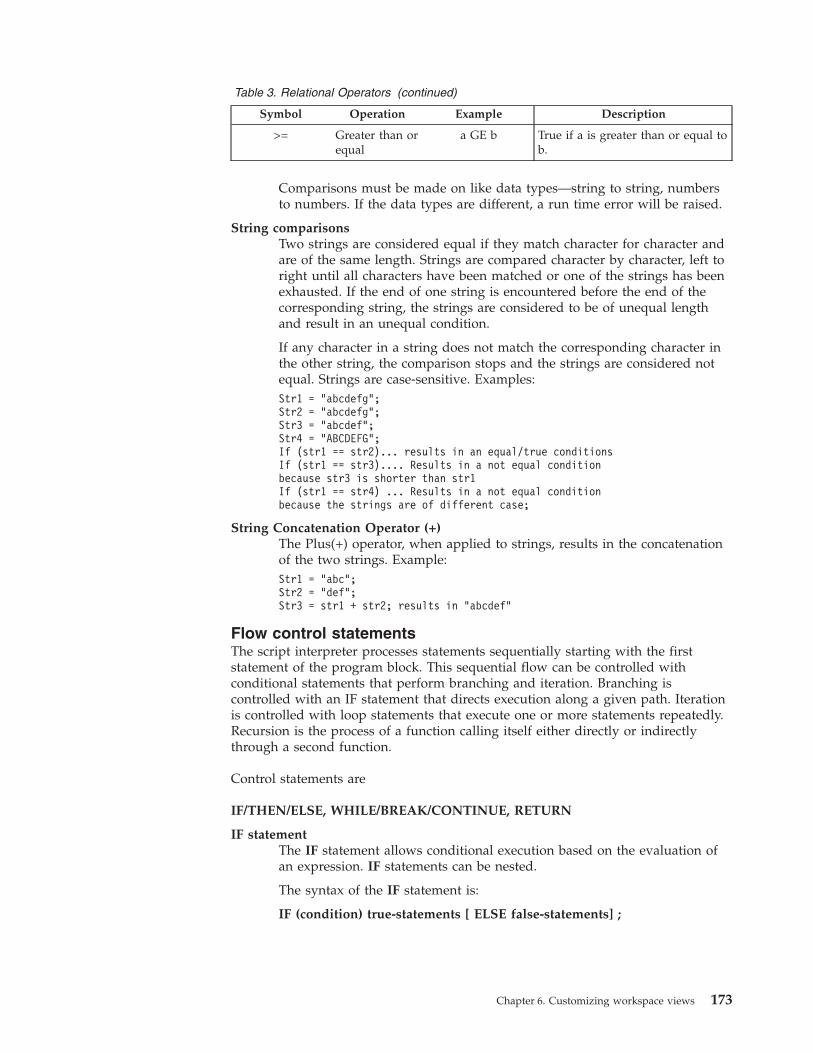
Table 3. Relational Operators (continued)
Symbol Operation Example Description
>= Greater than orequal
a GE b True if a is greater than or equal tob.
Comparisons must be made on like data types—string to string, numbersto numbers. If the data types are different, a run time error will be raised.
String comparisonsTwo strings are considered equal if they match character for character andare of the same length. Strings are compared character by character, left toright until all characters have been matched or one of the strings has beenexhausted. If the end of one string is encountered before the end of thecorresponding string, the strings are considered to be of unequal lengthand result in an unequal condition.
If any character in a string does not match the corresponding character inthe other string, the comparison stops and the strings are considered notequal. Strings are case-sensitive. Examples:Str1 = "abcdefg";Str2 = "abcdefg";Str3 = "abcdef";Str4 = "ABCDEFG";If (str1 == str2)... results in an equal/true conditionsIf (str1 == str3).... Results in a not equal conditionbecause str3 is shorter than str1If (str1 == str4) ... Results in a not equal conditionbecause the strings are of different case;
String Concatenation Operator (+)The Plus(+) operator, when applied to strings, results in the concatenationof the two strings. Example:Str1 = "abc";Str2 = "def";Str3 = str1 + str2; results in "abcdef"
Flow control statementsThe script interpreter processes statements sequentially starting with the firststatement of the program block. This sequential flow can be controlled withconditional statements that perform branching and iteration. Branching iscontrolled with an IF statement that directs execution along a given path. Iterationis controlled with loop statements that execute one or more statements repeatedly.Recursion is the process of a function calling itself either directly or indirectlythrough a second function.
Control statements are
IF/THEN/ELSE, WHILE/BREAK/CONTINUE, RETURN
IF statementThe IF statement allows conditional execution based on the evaluation ofan expression. IF statements can be nested.
The syntax of the IF statement is:
IF (condition) true-statements [ ELSE false-statements] ;
Chapter 6. Customizing workspace views 173
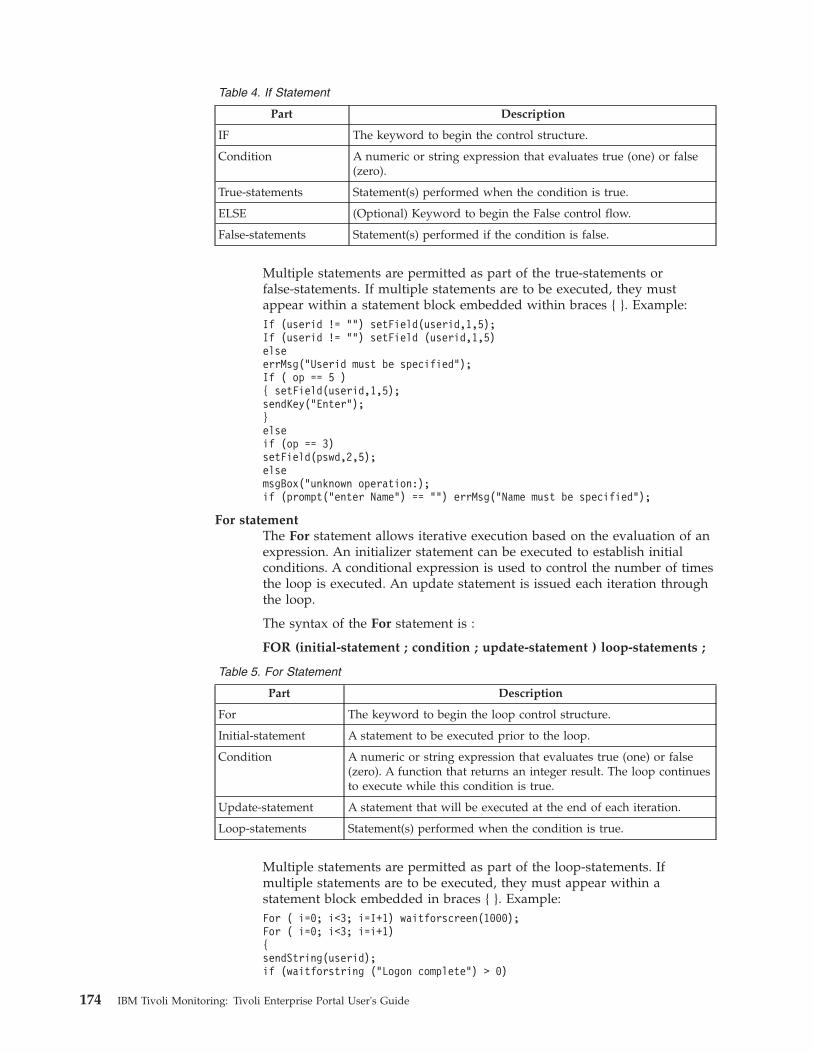
Table 4. If Statement
Part Description
IF The keyword to begin the control structure.
Condition A numeric or string expression that evaluates true (one) or false(zero).
True-statements Statement(s) performed when the condition is true.
ELSE (Optional) Keyword to begin the False control flow.
False-statements Statement(s) performed if the condition is false.
Multiple statements are permitted as part of the true-statements orfalse-statements. If multiple statements are to be executed, they mustappear within a statement block embedded within braces { }. Example:If (userid != "") setField(userid,1,5);If (userid != "") setField (userid,1,5)elseerrMsg("Userid must be specified");If ( op == 5 ){ setField(userid,1,5);sendKey("Enter");}elseif (op == 3)setField(pswd,2,5);elsemsgBox("unknown operation:);if (prompt("enter Name") == "") errMsg("Name must be specified");
For statementThe For statement allows iterative execution based on the evaluation of anexpression. An initializer statement can be executed to establish initialconditions. A conditional expression is used to control the number of timesthe loop is executed. An update statement is issued each iteration throughthe loop.
The syntax of the For statement is :
FOR (initial-statement ; condition ; update-statement ) loop-statements ;
Table 5. For Statement
Part Description
For The keyword to begin the loop control structure.
Initial-statement A statement to be executed prior to the loop.
Condition A numeric or string expression that evaluates true (one) or false(zero). A function that returns an integer result. The loop continuesto execute while this condition is true.
Update-statement A statement that will be executed at the end of each iteration.
Loop-statements Statement(s) performed when the condition is true.
Multiple statements are permitted as part of the loop-statements. Ifmultiple statements are to be executed, they must appear within astatement block embedded in braces { }. Example:For ( i=0; i<3; i=I+1) waitforscreen(1000);For ( i=0; i<3; i=i+1){sendString(userid);if (waitforstring ("Logon complete") > 0)
174 IBM Tivoli Monitoring: Tivoli Enterprise Portal User's Guide
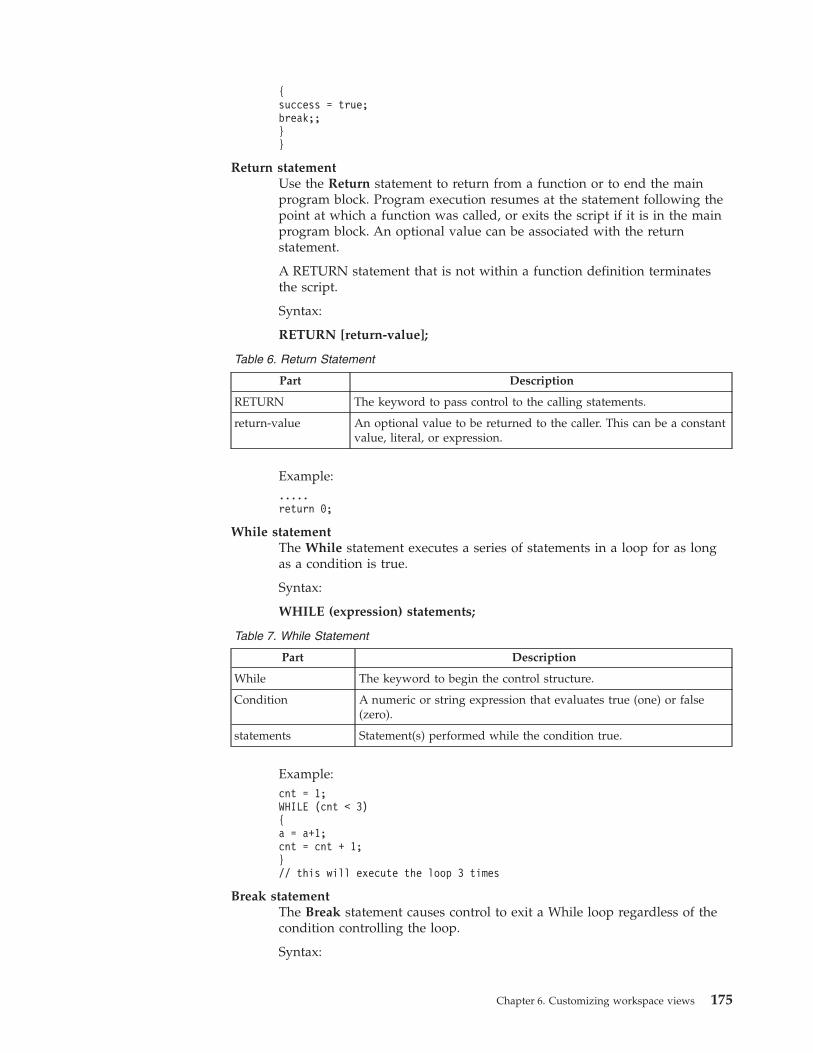
{success = true;break;;}}
Return statementUse the Return statement to return from a function or to end the mainprogram block. Program execution resumes at the statement following thepoint at which a function was called, or exits the script if it is in the mainprogram block. An optional value can be associated with the returnstatement.
A RETURN statement that is not within a function definition terminatesthe script.
Syntax:
RETURN [return-value];
Table 6. Return Statement
Part Description
RETURN The keyword to pass control to the calling statements.
return-value An optional value to be returned to the caller. This can be a constantvalue, literal, or expression.
Example:.....return 0;
While statementThe While statement executes a series of statements in a loop for as longas a condition is true.
Syntax:
WHILE (expression) statements;
Table 7. While Statement
Part Description
While The keyword to begin the control structure.
Condition A numeric or string expression that evaluates true (one) or false(zero).
statements Statement(s) performed while the condition true.
Example:cnt = 1;WHILE (cnt < 3){a = a+1;cnt = cnt + 1;}// this will execute the loop 3 times
Break statementThe Break statement causes control to exit a While loop regardless of thecondition controlling the loop.
Syntax:
Chapter 6. Customizing workspace views 175
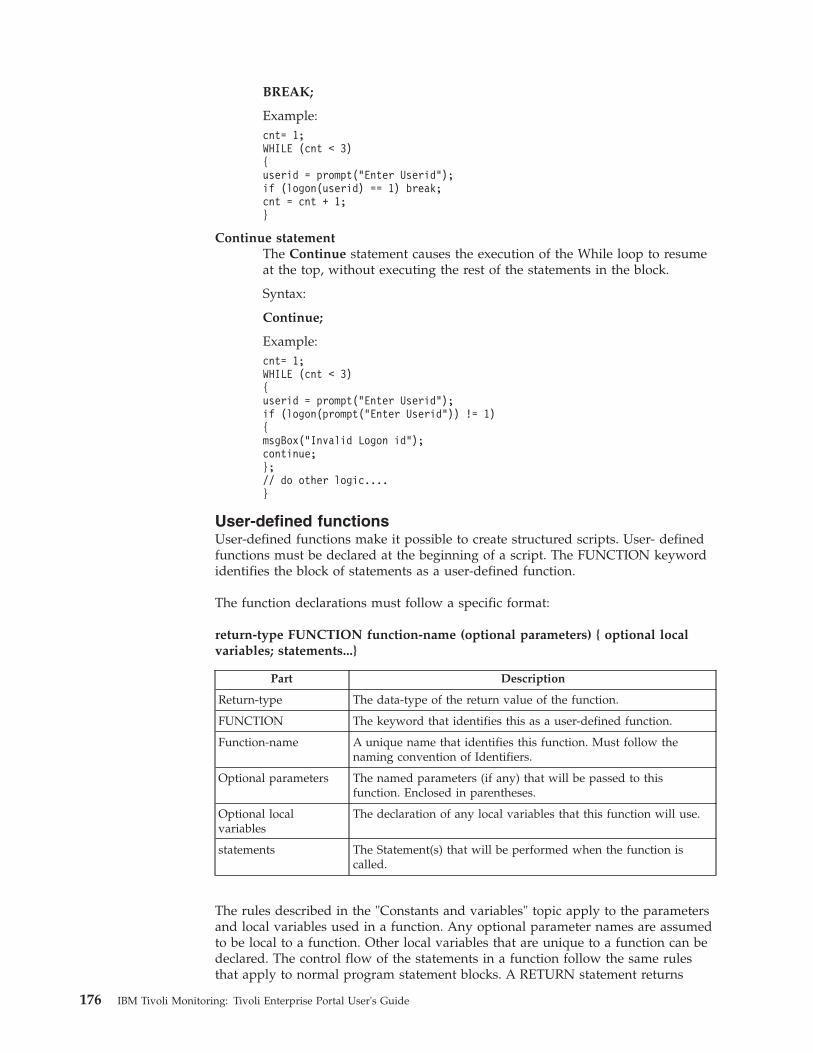
BREAK;
Example:cnt= 1;WHILE (cnt < 3){userid = prompt("Enter Userid");if (logon(userid) == 1) break;cnt = cnt + 1;}
Continue statementThe Continue statement causes the execution of the While loop to resumeat the top, without executing the rest of the statements in the block.
Syntax:
Continue;
Example:cnt= 1;WHILE (cnt < 3){userid = prompt("Enter Userid");if (logon(prompt("Enter Userid")) != 1){msgBox("Invalid Logon id");continue;};// do other logic....}
User-defined functionsUser-defined functions make it possible to create structured scripts. User- definedfunctions must be declared at the beginning of a script. The FUNCTION keywordidentifies the block of statements as a user-defined function.
The function declarations must follow a specific format:
return-type FUNCTION function-name (optional parameters) { optional localvariables; statements...}
Part Description
Return-type The data-type of the return value of the function.
FUNCTION The keyword that identifies this as a user-defined function.
Function-name A unique name that identifies this function. Must follow thenaming convention of Identifiers.
Optional parameters The named parameters (if any) that will be passed to thisfunction. Enclosed in parentheses.
Optional localvariables
The declaration of any local variables that this function will use.
statements The Statement(s) that will be performed when the function iscalled.
The rules described in the "Constants and variables" topic apply to the parametersand local variables used in a function. Any optional parameter names are assumedto be local to a function. Other local variables that are unique to a function can bedeclared. The control flow of the statements in a function follow the same rulesthat apply to normal program statement blocks. A RETURN statement returns
176 IBM Tivoli Monitoring: Tivoli Enterprise Portal User's Guide
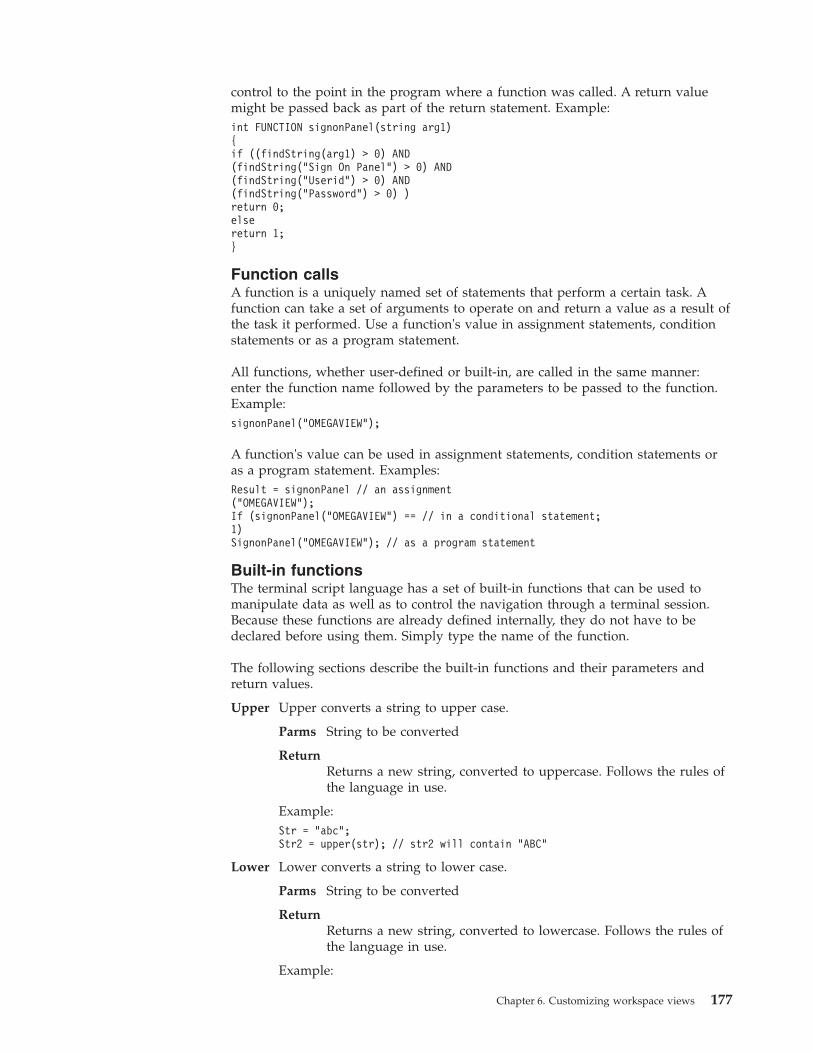
control to the point in the program where a function was called. A return valuemight be passed back as part of the return statement. Example:int FUNCTION signonPanel(string arg1){if ((findString(arg1) > 0) AND(findString("Sign On Panel") > 0) AND(findString("Userid") > 0) AND(findString("Password") > 0) )return 0;elsereturn 1;}
Function callsA function is a uniquely named set of statements that perform a certain task. Afunction can take a set of arguments to operate on and return a value as a result ofthe task it performed. Use a function's value in assignment statements, conditionstatements or as a program statement.
All functions, whether user-defined or built-in, are called in the same manner:enter the function name followed by the parameters to be passed to the function.Example:signonPanel("OMEGAVIEW");
A function's value can be used in assignment statements, condition statements oras a program statement. Examples:Result = signonPanel // an assignment("OMEGAVIEW");If (signonPanel("OMEGAVIEW") == // in a conditional statement;1)SignonPanel("OMEGAVIEW"); // as a program statement
Built-in functionsThe terminal script language has a set of built-in functions that can be used tomanipulate data as well as to control the navigation through a terminal session.Because these functions are already defined internally, they do not have to bedeclared before using them. Simply type the name of the function.
The following sections describe the built-in functions and their parameters andreturn values.
Upper Upper converts a string to upper case.
Parms String to be converted
ReturnReturns a new string, converted to uppercase. Follows the rules ofthe language in use.
Example:Str = "abc";Str2 = upper(str); // str2 will contain "ABC"
Lower Lower converts a string to lower case.
Parms String to be converted
ReturnReturns a new string, converted to lowercase. Follows the rules ofthe language in use.
Example:
Chapter 6. Customizing workspace views 177
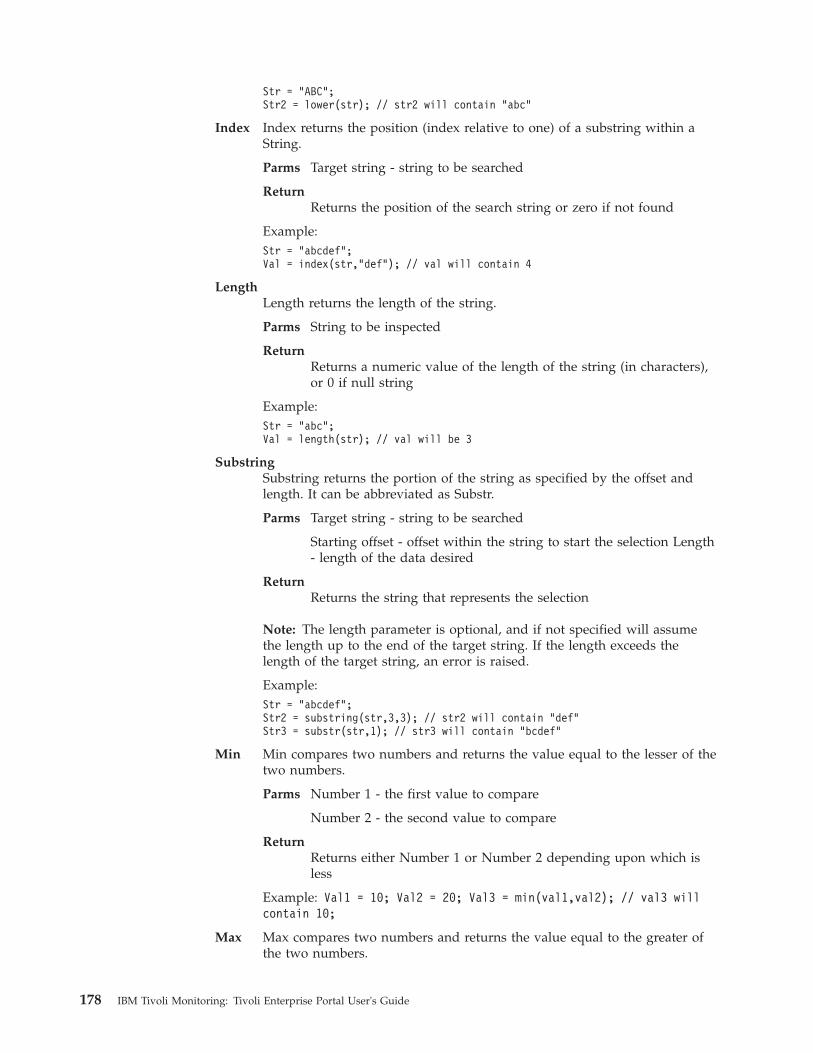
Str = "ABC";Str2 = lower(str); // str2 will contain "abc"
Index Index returns the position (index relative to one) of a substring within aString.
Parms Target string - string to be searched
ReturnReturns the position of the search string or zero if not found
Example:Str = "abcdef";Val = index(str,"def"); // val will contain 4
LengthLength returns the length of the string.
Parms String to be inspected
ReturnReturns a numeric value of the length of the string (in characters),or 0 if null string
Example:Str = "abc";Val = length(str); // val will be 3
SubstringSubstring returns the portion of the string as specified by the offset andlength. It can be abbreviated as Substr.
Parms Target string - string to be searched
Starting offset - offset within the string to start the selection Length- length of the data desired
ReturnReturns the string that represents the selection
Note: The length parameter is optional, and if not specified will assumethe length up to the end of the target string. If the length exceeds thelength of the target string, an error is raised.
Example:Str = "abcdef";Str2 = substring(str,3,3); // str2 will contain "def"Str3 = substr(str,1); // str3 will contain "bcdef"
Min Min compares two numbers and returns the value equal to the lesser of thetwo numbers.
Parms Number 1 - the first value to compare
Number 2 - the second value to compare
ReturnReturns either Number 1 or Number 2 depending upon which isless
Example: Val1 = 10; Val2 = 20; Val3 = min(val1,val2); // val3 willcontain 10;
Max Max compares two numbers and returns the value equal to the greater ofthe two numbers.
178 IBM Tivoli Monitoring: Tivoli Enterprise Portal User's Guide
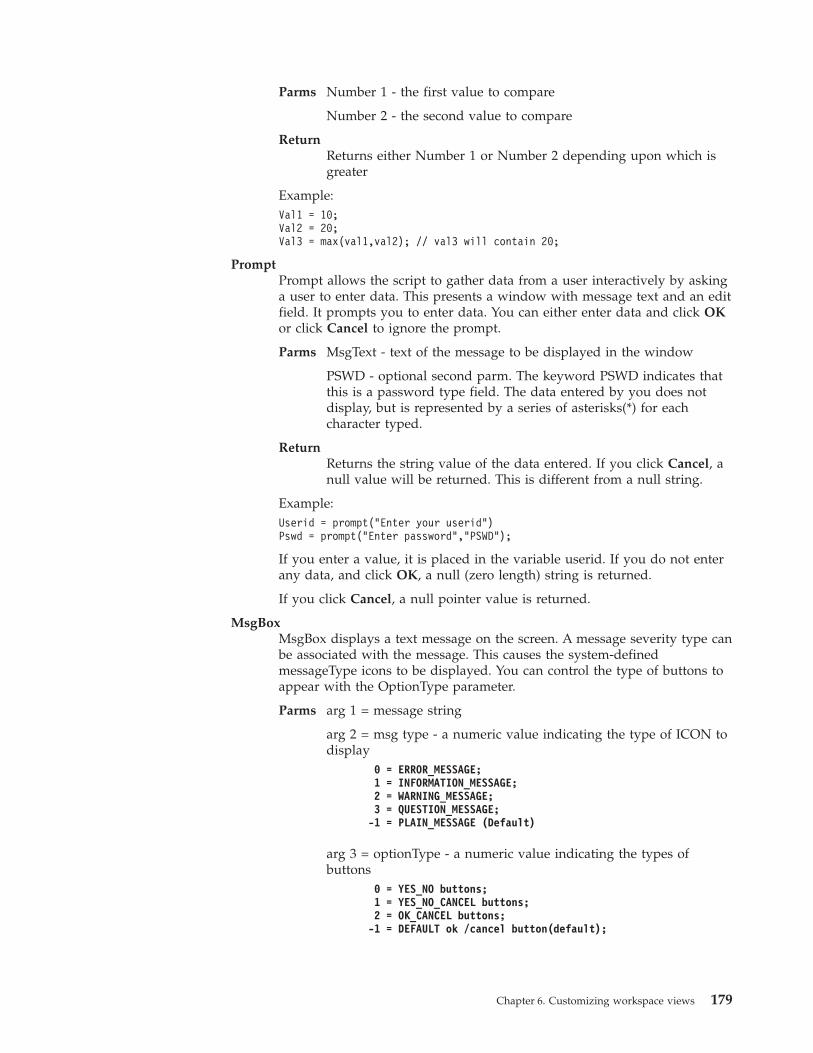
Parms Number 1 - the first value to compare
Number 2 - the second value to compare
ReturnReturns either Number 1 or Number 2 depending upon which isgreater
Example:Val1 = 10;Val2 = 20;Val3 = max(val1,val2); // val3 will contain 20;
PromptPrompt allows the script to gather data from a user interactively by askinga user to enter data. This presents a window with message text and an editfield. It prompts you to enter data. You can either enter data and click OKor click Cancel to ignore the prompt.
Parms MsgText - text of the message to be displayed in the window
PSWD - optional second parm. The keyword PSWD indicates thatthis is a password type field. The data entered by you does notdisplay, but is represented by a series of asterisks(*) for eachcharacter typed.
ReturnReturns the string value of the data entered. If you click Cancel, anull value will be returned. This is different from a null string.
Example:Userid = prompt("Enter your userid")Pswd = prompt("Enter password","PSWD");
If you enter a value, it is placed in the variable userid. If you do not enterany data, and click OK, a null (zero length) string is returned.
If you click Cancel, a null pointer value is returned.
MsgBoxMsgBox displays a text message on the screen. A message severity type canbe associated with the message. This causes the system-definedmessageType icons to be displayed. You can control the type of buttons toappear with the OptionType parameter.
Parms arg 1 = message string
arg 2 = msg type - a numeric value indicating the type of ICON todisplay
0 = ERROR_MESSAGE;1 = INFORMATION_MESSAGE;2 = WARNING_MESSAGE;3 = QUESTION_MESSAGE;
-1 = PLAIN_MESSAGE (Default)
arg 3 = optionType - a numeric value indicating the types ofbuttons
0 = YES_NO buttons;1 = YES_NO_CANCEL buttons;2 = OK_CANCEL buttons;
-1 = DEFAULT ok /cancel button(default);
Chapter 6. Customizing workspace views 179
@return = a numeric value representing the button that waspressed to dismiss the window
0 = YES button or OK button;1 = NO button;2 = CANCEL button;
-1 = CLOSED. The dialog was dismissed by closingthe dialog window - no button was pressed.
-2 = The message box was not responded to and thetimeout value was exceeded
Example:msgBox("The system is running"); // this will display a plain message,with OK cancel buttonVal = msgBox("Invalid signon. Retry?",0,1); // this will present anError type message, with the YES,NO,CANCEL buttons;
Note: Because the msgBox is waiting for user input, it could take a longtime before the user responds. If it is running unattended, the user willnever respond, and the script will stall. For this reason, there is a timeoutvalue associated with this function. If the user does not respond within 10minutes, the dialog is automatically dismissed and a value of -2 returned.
Sleep Sleep suspends the execution for the time interval specified
Parms Time interval1 - the number of milliseconds to wait
ReturnReturns zero if successful; minus one if an error
Example:Sleep(1000); // sleep for 1 second;Sleep(1000*60); // sleep for 1 minute
Note: The maximum amount of time permitted is 15 minutes (1000 * 60 *15). If it is necessary to wait longer, multiple sleep() functions can beissued.
Note: The sleep is an Active wait. The actual internal value is a 1 secondwait. The implementation uses a loop counter to issue the 1 second sleep.This prevents a stall condition and allows the script to be stopped oraborted.
Emulator functionsThe emulator built-in functions perform actions related to the navigation anddisplay of data in the terminal session. The session must be connected to a host inorder for these functions to execute. If the session is not connected, the functionwill return with a default value of zero for numeric return values or a null stringfor string values. If the function fails, a negative one (-1) will be returned.
Locations on the screen are referenced by Row/Column or by buffer offset (relative0). Thus, the top left position would be Row 1, Column 1 or Location 0. Functionsthat take a screen position accept either form. Screen locations (buffer offsets) yielddifferent Row/Column values depending on the screen size. For example, if theterminal has 24 rows and 80 bytes, location 80 will be row 2, col 1. However, if it isa model 5, location 80 will be row 1, col 81.
DisconnectDisconnects the current session from the host. The script terminates whenthe session disconnects.
Parms None
180 IBM Tivoli Monitoring: Tivoli Enterprise Portal User's Guide
ReturnReturns 0 if success; -1 if an error
Example:disconnect a ( ); // disconnects the current session
FindStringUse FindSring to find the string specified anywhere on the screen.
Parms Arg1 - string to search for
ReturnReturns the location of the string, or -1 if the string was not foundor the session gets disconnected
Example:user = findString("Userid"); // find the string "Userid" and return itslocation if ((findString("OMEGAVIEW") > 0) // is this the correct screen?
GetCursorGetCursor returns the current location of the cursor. This is the bufferoffset.
Parms None
ReturnReturns the relative location of the cursor, or -1 if an error occursor the terminal gets disconnected
Example:Pos = getCursor(); // returns the cursor position
GetCursorColGetCursorCol returns the current column number of the cursor.
Parms None
ReturnReturns the integer value of the cursor column number, or -1 if anerror occurs or the terminal is disconnected
Example:Col = getCursorCol(); // get cursor column number
GetCursorRowGetCursorRow returns the current row number of the cursor.
Parms None
ReturnReturns the integer value of the cursor row number, or -1 if anerror occurs or the terminal is disconnected
Example:Row = getCursorRow(); // get cursor row number
GetDefaultTimeoutGetDefaultTimeout returns the value of the WaitForScreen default Timeout.
Parms None
ReturnReturns the value of the WaitForScreen default Timeout inmilliseconds
Example:
Chapter 6. Customizing workspace views 181
TimeoutValue = getDefaultTimeout();// returns the cursor wait for screen timeout value
GetFieldGetField retrieves the string from the field pointed to by location. Thenumber of characters is determined by the length of the field.
Parms Position - the position of the field on the screen. This can be aROW,COL or the relative location on the screen.
ReturnReturns the string of characters from the field, or a null string if itis an invalid field position
Example:Applid = getField(5,1); // get the data in the field at Row 5, column 1Applid = getField(80); // get the data from the field atlocation 80 - offset 80 (row 2 col 1 on a model 2)
Note: The location can be any valid location on the screen. The fieldcontaining that address is referenced. Protected or unprotected data can beretrieved. If the location is invalid, an error is generated and a null stringis returned.
GetFontSizeGetFontSize gets the current Emulator screen font size.
Parms None
ReturnReturns an integer value of the Font point size
Example:FontSize = getFontSize();// return the current Font size (in points)
GetPropertyGetProperty retrieves the value of a System Property.
Parms PropertyName - the name of the system property to retrieve,enclosed in quotes
ReturnReturns the value of the property, or null if not found
Example:Applid = getProperty("APPLID") // get the data from the APPLID variable
GetStringGetString retrieves the string from the location on the screen. The numberof characters is determined by the length parm.
Parms Position - the position on the screen. This can be a ROW,COL orthe relative location on the screen.
Length - number of characters to retrieve
ReturnReturns the string of characters from the location
Example:Applid = getString(5,1,16); // get 16 characters from screenlocation Row 5, column 1 Applid = getString(80,15);// get 15 characters from location 80 - offset 80 (row 2 col 1 on a model 2)
182 IBM Tivoli Monitoring: Tivoli Enterprise Portal User's Guide
Note: The location can be any valid location on the screen, protected orunprotected. If the location is invalid, an error is generated and a nullstring is returned.
Hide Hides the terminal screen. This sets the terminal frame to not visible. It isused when it is not desirable to show the actual screens that are beingnavigated. When the script ends, or the session is disconnected, the screenwill be shown.
Parms None
ReturnReturns 0 if successful, or -1 if there is an error or the terminal getsdisconnected
Example:Hide(); // set the terminal window to not visible
ScreencolsScreencols returns the number of columns on the screen. For a 3270 model2 this would be 80.
Parms None
ReturnReturns the number of columns on the screen, or -1 if there is anerror or the terminal gets disconnected
Example:Cols = screenCols(); // returns the number of columns
ScreenrowsScreenrows returns the number of rows on the screen. For a 3270 model 2this would be 24.
Parms None
ReturnReturns the number of rows on the screen, or -1 if there is an erroror the terminal gets disconnected
Example:Rows = ScreenRows(); // returns the number of rows
SendKeySendKey simulates pressing the corresponding AID key.
Parms String representation of the key to send
ReturnReturns 0 if successful, or -1 if there is an error or the terminal getsdisconnected
Example:SendKey ("Enter"); // sends the Enter key. Any modifieddata on the screen will be sent as part of the data stream.
The following values can be specified:
ENTEREnter key. Sends the modified data, cursor location and the AIDkey.
Chapter 6. Customizing workspace views 183
RESETResets and unlocks the keyboard. No data is sent to the host.
CLEARSends the CLEAR Aid key. Only the Aid key is sent.
SYS_REQSends the System Request Aid.
ERASE_EOFClears the Unprotected fields from the current cursor location tothe end of screen. No data is transmitted to the host.The fields areset to nulls.
ERASE_INPUTClears the current field to nulls.
FIELD_MARKTransmits the FieldMark aid key.
HOMEPuts the cursor at the first unprotected field on the screen.
TAB Places the cursor at the next unprotected field.
PA1, PA2, PA3
F1 through F24
The following special keys position the cursor:
HOMEPuts the cursor at the first unprotected field on the screen.
TAB Places the cursor at the next unprotected field.
Note: The behavior and data that gets transmitted to the host aredependent on the actual key being sent. The Enter and the Function keyssend any modified data fields, as well as the cursor location and the AIDkey. The other AID keys send only the AID key.
SendstringSendstring sets the string at the current cursor location and sends the datawith the Enter key.
Parms String to be sent
ReturnReturns 0 if successful, or -1 if there is an error or the terminal getsdisconnected
Example:Sendstring ("ctsoa"); // enters the string ctsoa at thecurrent cursor location and sends the data with the Enter key
SetcursorSetcursor positions the cursor on the terminal.
Parms Screen position can be either of the following:
ROW,COL - the Row and Column to position the cursor Location -the relative location on the screen
ReturnReturns the relative location of the cursor, or -1 if there is an erroror the terminal gets disconnected
184 IBM Tivoli Monitoring: Tivoli Enterprise Portal User's Guide
Example:SetCursor(1,1); // sets the cursor to the top left position of the screenSetCursor(80); // sets the cursor to offset 80 (This would be row 2,col 1 on a 24x80 terminal)
SetDefaultTimeoutSetDefaultTimeout sets the default timeout.
Parms New wait time, in milliseconds. For example, 1000 is a one secondwait.
ReturnReturns the previous value of the WaitForScreen Timeout valued
Example:oldTimeoutValue = setDefaultTimeout(10000);// override the timeout to 10 seconds
SetFieldSetField places a string in the field containing the designated location Thenumber of characters is determined by the length of the string.
Parms String value - the string to be placed in the field
Position - a position on the screen that is part of a field.Theposition must be in an Unprotected field.This can be a ROW,COLor relative location on the screen.
ReturnReturns 0 if successful, or -1 if there is an error.
Example:SetField(applid,5,1); // put the string pointed to by applidat the field containing row 5,col 1SetField("ctsoa",80); // put the string ctsoa at the fieldcontaining offset 80 (row 2 col 1 on a model 2)
Note: If the location on the screen is not an Unprotected field, or if thelength exceeds the size of the field, an error will be generated; no data willbe placed.
SetFontSizeSets a new font size.
Parms The new font size, in points
ReturnReturns the previous value of the font size
Example:oldFontSize = setFontSize(16); // set the new Font size to 16 pt
SetstringSetstring places a string at the designated location on the screen. Thenumber of characters is determined by the length of the string.
Parms String value - the string to be placed on the screen:
Position - the position on the screen. This can be a ROW,COL orrelative location on the screen.
ReturnReturns 0 if successful, or -1 if there is an error
Example:
Chapter 6. Customizing workspace views 185
SetString(applid,5,1); // put the string pointed toby the variable applid at row 5,col 1SetString("ctsoa",80); // put the string ctsoa atoffset 80 (row 2 col 1 on a model 2)
Note: If the location on the screen is not an Unprotected field, or if thelength exceeds the size of the field, an error will be generated and no datawill be placed.
Show Shows the terminal screen. This sets the terminal frame to visible.
Parms None
ReturnReturns the relative location of the cursor, or -1 if there is an erroror the terminal gets disconnected
Example:Show(); // set the terminal window to visible
WaitforScreenWaitForScreen waits for a screen of data to be received from the host.
Parms arg 1 = Timeout value. This is the length of time to wait, inmilliseconds.
If no data is received by this time, processing continues If no valueis specified, a default of 15 minutes is assume
ReturnReturns a numeric value specifying the result of the function:
0 = data was received
-1 = timeout. No data was received within the time specified
Example:waitforscreen(); // wait until a screen is received(or 15 minutes has elapsed)waitforscreen(15*1000) // wait for up to 15 seconds
Note: Because the WaitforScreen is waiting for input, it could take a longtime before a screen is received. If a stall has occurred and the system isnot responding, the script will stall. For this reason, there is a timeoutvalue associated with this function. If no data is received for 10 minutes,the wait is cancelled automatically and a value of -1 is returned.
WaitForString
WaitForString waits for a screen containing the specified data at thespecified location to be received.
Parms arg 1 = The string to wait for
arg2 = The row,column position of the data
arg3 = Timeout value. This is the length of time to wait, inmilliseconds.
If no data is received by this time, processing will continue.
If no value is specified, a default of 15 minutes is assumed
ReturnReturns a numeric value specifying the result of the function:
0 = data was received
186 IBM Tivoli Monitoring: Tivoli Enterprise Portal User's Guide
-1 = timeout. No data was received within the time specified
Example:Waitforstring("Userid",5,1); // wait until a screen is receivedthat has the string "Userid" at row 5 col 1Waitforstring ("Userid",5,1 1000*15) // wait for up to 15 seconds
Note: Because the waitforstring is waiting for input, it could take a longtime before a screen is received. If a stall has occurred and the system isnot responding, the script will stall. For this reason, there is a timeoutvalue associated with this function. If no data is received within 10minutes, the wait will be cancelled automatically and a value of -1 will bereturned.
Sample script
The following example shows a sample script for an Omegaview Zoom. Itdemonstrates the constructs of the scripting language through user-definedfunctions, local variables, flow control and built-in emulator functions./*Omegaview Zoom Emulator ScriptCopyright(c) !IBM Corporation 2002, 2005
*/// ---------------------------------------// Check for Signon Panel// 0 = not found// 1 = found// ---------------------------------------int FUNCTION signonPanel(){
if ((findString("OMEGAVIEW") > 0) AND(findString("Sign On Panel") > 0) AND(findString("Userid") > 0) AND(findString("Password") > 0) )return TRUE;elsereturn FALSE;
}
// ---------------------------------------// Check for Signon Error// return 0 if no error// 1 if the SignonError pop-up found// ---------------------------------------int FUNCTION signonErrorpop-up(){
if ((findString("OMEGAVIEW") > 0) AND(findString("User access denied") > 0) )
return TRUE;
return FALSE;}
// ---------------------------------------// Goto Command Panel// 0 = not found// 1 = found// ---------------------------------------int FUNCTION gotoCommandPanel(){
rc = TRUE; // be optimistic
if (findString(CMD_PANEL_ID) < 0){
Chapter 6. Customizing workspace views 187
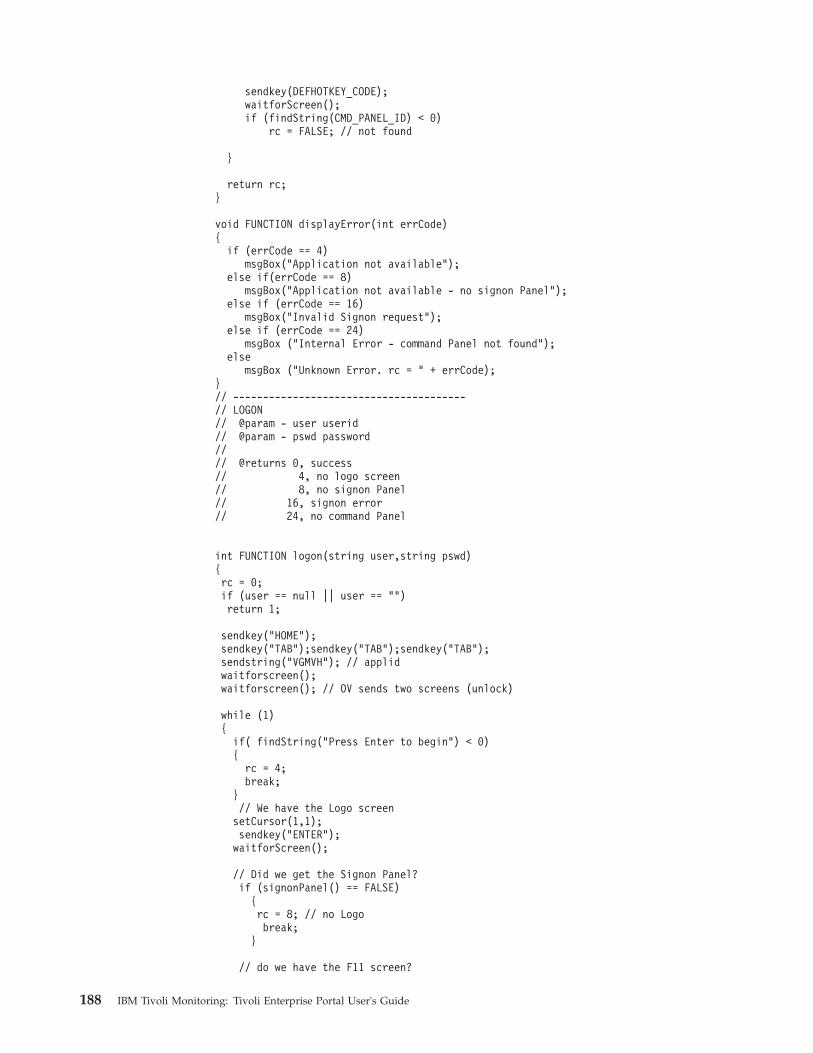
sendkey(DEFHOTKEY_CODE);waitforScreen();if (findString(CMD_PANEL_ID) < 0)
rc = FALSE; // not found
}
return rc;}
void FUNCTION displayError(int errCode){
if (errCode == 4)msgBox("Application not available");
else if(errCode == 8)msgBox("Application not available - no signon Panel");
else if (errCode == 16)msgBox("Invalid Signon request");
else if (errCode == 24)msgBox ("Internal Error - command Panel not found");
elsemsgBox ("Unknown Error. rc = " + errCode);
}// ---------------------------------------// LOGON// @param - user userid// @param - pswd password//// @returns 0, success// 4, no logo screen// 8, no signon Panel// 16, signon error// 24, no command Panel
int FUNCTION logon(string user,string pswd){rc = 0;if (user == null || user == "")return 1;
sendkey("HOME");sendkey("TAB");sendkey("TAB");sendkey("TAB");sendstring("VGMVH"); // applidwaitforscreen();waitforscreen(); // OV sends two screens (unlock)
while (1){
if( findString("Press Enter to begin") < 0){
rc = 4;break;
}// We have the Logo screensetCursor(1,1);sendkey("ENTER");waitforScreen();
// Did we get the Signon Panel?if (signonPanel() == FALSE)
{rc = 8; // no Logobreak;
}
// do we have the F11 screen?
188 IBM Tivoli Monitoring: Tivoli Enterprise Portal User's Guide
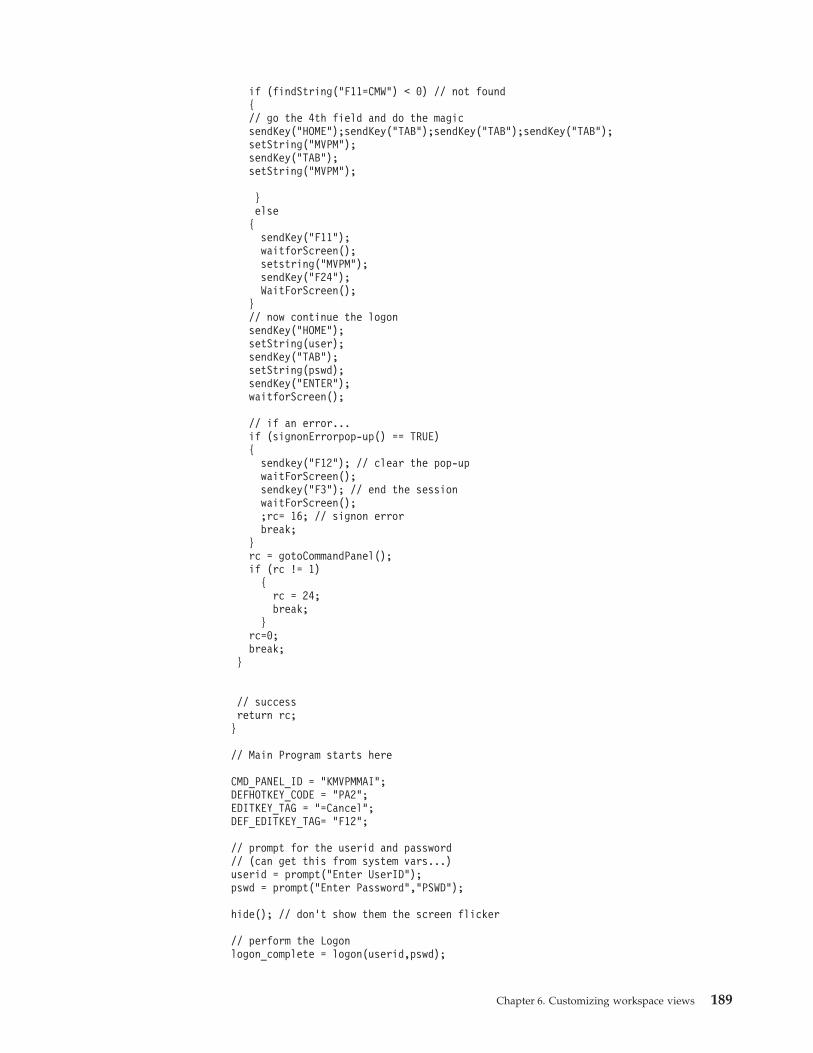
if (findString("F11=CMW") < 0) // not found{// go the 4th field and do the magicsendKey("HOME");sendKey("TAB");sendKey("TAB");sendKey("TAB");setString("MVPM");sendKey("TAB");setString("MVPM");
}else{
sendKey("F11");waitforScreen();setstring("MVPM");sendKey("F24");WaitForScreen();
}// now continue the logonsendKey("HOME");setString(user);sendKey("TAB");setString(pswd);sendKey("ENTER");waitforScreen();
// if an error...if (signonErrorpop-up() == TRUE){
sendkey("F12"); // clear the pop-upwaitForScreen();sendkey("F3"); // end the sessionwaitForScreen();;rc= 16; // signon errorbreak;
}rc = gotoCommandPanel();if (rc != 1)
{rc = 24;break;
}rc=0;break;
}
// successreturn rc;}
// Main Program starts here
CMD_PANEL_ID = "KMVPMMAI";DEFHOTKEY_CODE = "PA2";EDITKEY_TAG = "=Cancel";DEF_EDITKEY_TAG= "F12";
// prompt for the userid and password// (can get this from system vars...)userid = prompt("Enter UserID");pswd = prompt("Enter Password","PSWD");
hide(); // don’t show them the screen flicker
// perform the Logonlogon_complete = logon(userid,pswd);
Chapter 6. Customizing workspace views 189
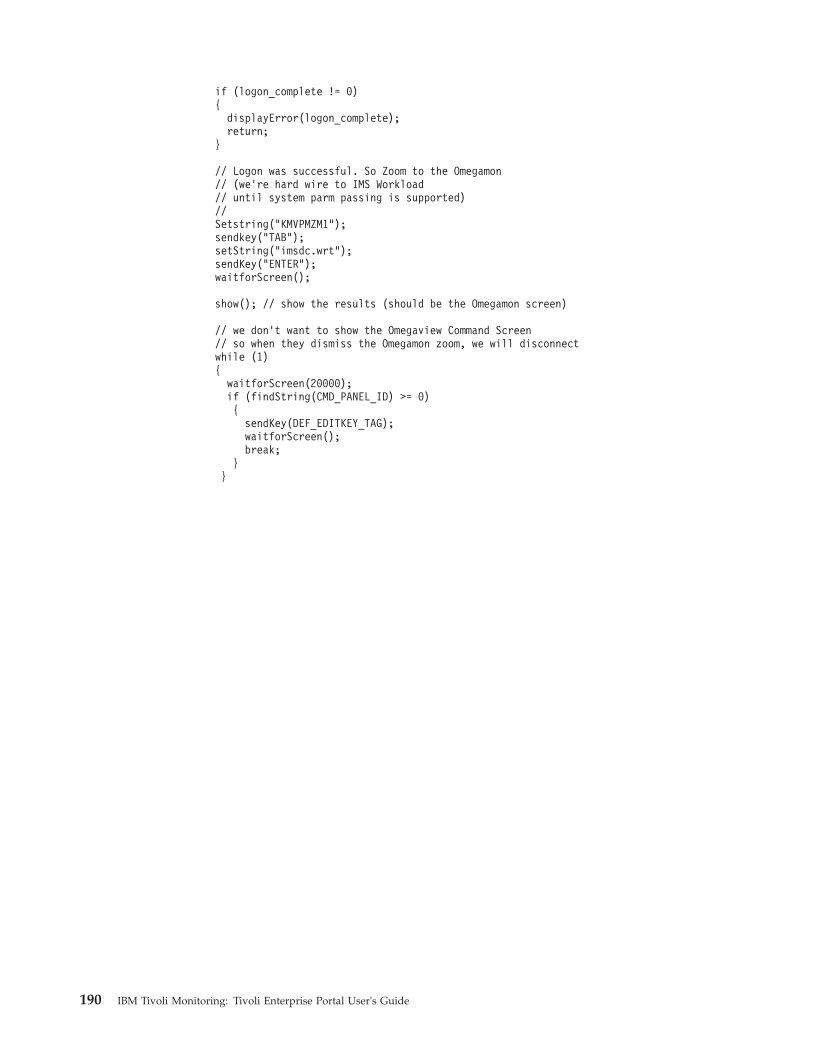
if (logon_complete != 0){
displayError(logon_complete);return;
}
// Logon was successful. So Zoom to the Omegamon// (we’re hard wire to IMS Workload// until system parm passing is supported)//Setstring("KMVPMZM1");sendkey("TAB");setString("imsdc.wrt");sendKey("ENTER");waitforScreen();
show(); // show the results (should be the Omegamon screen)
// we don’t want to show the Omegaview Command Screen// so when they dismiss the Omegamon zoom, we will disconnectwhile (1){
waitforScreen(20000);if (findString(CMD_PANEL_ID) >= 0){
sendKey(DEF_EDITKEY_TAG);waitforScreen();break;
}}
190 IBM Tivoli Monitoring: Tivoli Enterprise Portal User's Guide
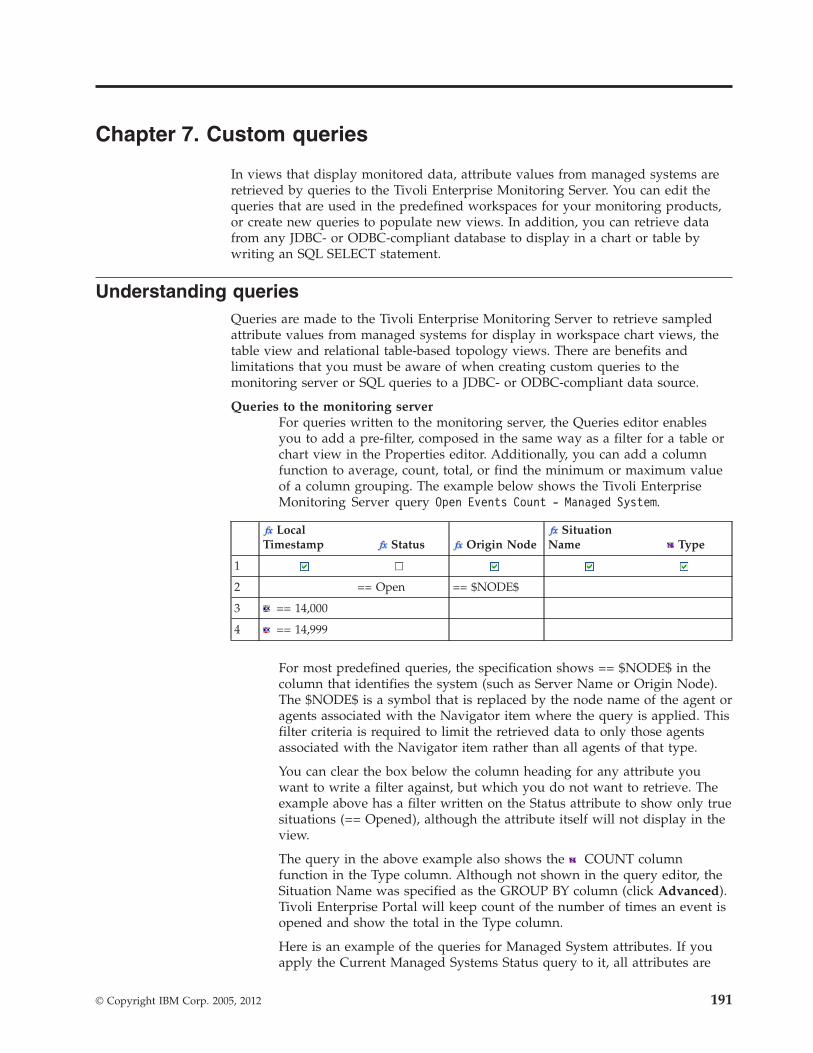
Chapter 7. Custom queries
In views that display monitored data, attribute values from managed systems areretrieved by queries to the Tivoli Enterprise Monitoring Server. You can edit thequeries that are used in the predefined workspaces for your monitoring products,or create new queries to populate new views. In addition, you can retrieve datafrom any JDBC- or ODBC-compliant database to display in a chart or table bywriting an SQL SELECT statement.
Understanding queriesQueries are made to the Tivoli Enterprise Monitoring Server to retrieve sampledattribute values from managed systems for display in workspace chart views, thetable view and relational table-based topology views. There are benefits andlimitations that you must be aware of when creating custom queries to themonitoring server or SQL queries to a JDBC- or ODBC-compliant data source.
Queries to the monitoring serverFor queries written to the monitoring server, the Queries editor enablesyou to add a pre-filter, composed in the same way as a filter for a table orchart view in the Properties editor. Additionally, you can add a columnfunction to average, count, total, or find the minimum or maximum valueof a column grouping. The example below shows the Tivoli EnterpriseMonitoring Server query Open Events Count - Managed System.
LocalTimestamp Status Origin Node
SituationName Type
1
2 == Open == $NODE$
3 == 14,000
4 == 14,999
For most predefined queries, the specification shows == $NODE$ in thecolumn that identifies the system (such as Server Name or Origin Node).The $NODE$ is a symbol that is replaced by the node name of the agent oragents associated with the Navigator item where the query is applied. Thisfilter criteria is required to limit the retrieved data to only those agentsassociated with the Navigator item rather than all agents of that type.
You can clear the box below the column heading for any attribute youwant to write a filter against, but which you do not want to retrieve. Theexample above has a filter written on the Status attribute to show only truesituations (== Opened), although the attribute itself will not display in theview.
The query in the above example also shows the COUNT columnfunction in the Type column. Although not shown in the query editor, theSituation Name was specified as the GROUP BY column (click Advanced).Tivoli Enterprise Portal will keep count of the number of times an event isopened and show the total in the Type column.
Here is an example of the queries for Managed System attributes. If youapply the Current Managed Systems Status query to it, all attributes are
© Copyright IBM Corp. 2005, 2012 191
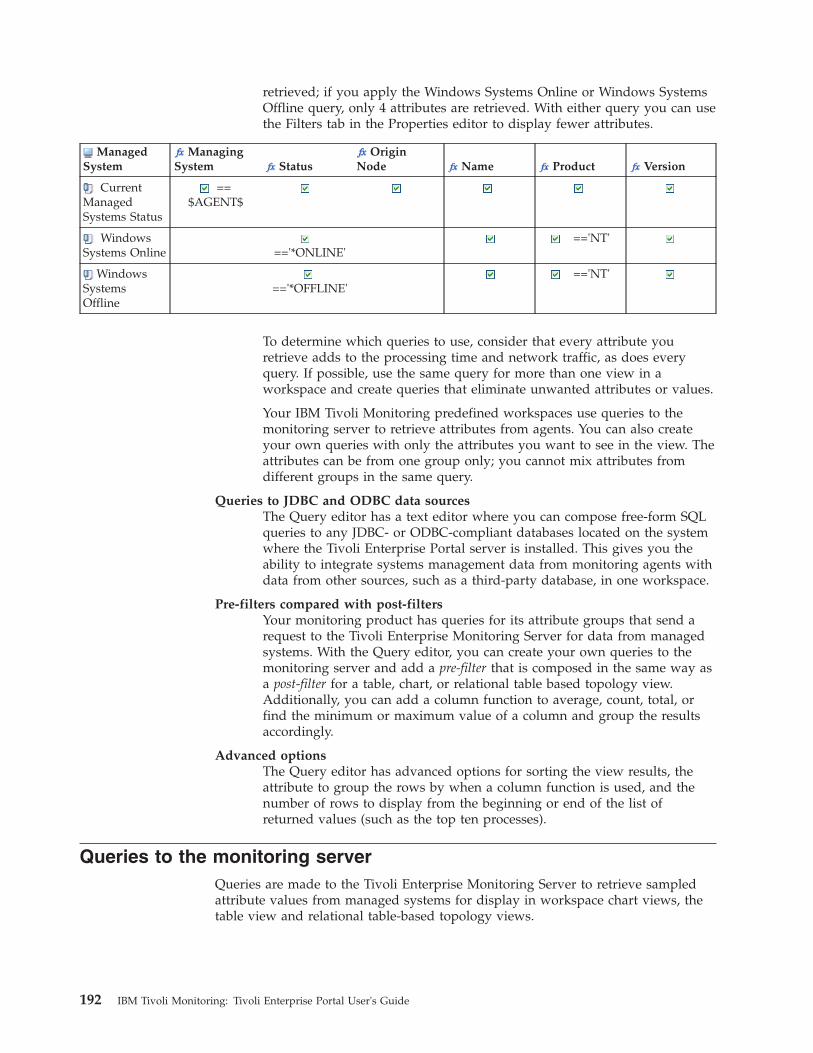
retrieved; if you apply the Windows Systems Online or Windows SystemsOffline query, only 4 attributes are retrieved. With either query you can usethe Filters tab in the Properties editor to display fewer attributes.
ManagedSystem
ManagingSystem Status
OriginNode Name Product Version
CurrentManagedSystems Status
==$AGENT$
WindowsSystems Online =='*ONLINE'
=='NT'
WindowsSystemsOffline
=='*OFFLINE'=='NT'
To determine which queries to use, consider that every attribute youretrieve adds to the processing time and network traffic, as does everyquery. If possible, use the same query for more than one view in aworkspace and create queries that eliminate unwanted attributes or values.
Your IBM Tivoli Monitoring predefined workspaces use queries to themonitoring server to retrieve attributes from agents. You can also createyour own queries with only the attributes you want to see in the view. Theattributes can be from one group only; you cannot mix attributes fromdifferent groups in the same query.
Queries to JDBC and ODBC data sourcesThe Query editor has a text editor where you can compose free-form SQLqueries to any JDBC- or ODBC-compliant databases located on the systemwhere the Tivoli Enterprise Portal server is installed. This gives you theability to integrate systems management data from monitoring agents withdata from other sources, such as a third-party database, in one workspace.
Pre-filters compared with post-filtersYour monitoring product has queries for its attribute groups that send arequest to the Tivoli Enterprise Monitoring Server for data from managedsystems. With the Query editor, you can create your own queries to themonitoring server and add a pre-filter that is composed in the same way asa post-filter for a table, chart, or relational table based topology view.Additionally, you can add a column function to average, count, total, orfind the minimum or maximum value of a column and group the resultsaccordingly.
Advanced optionsThe Query editor has advanced options for sorting the view results, theattribute to group the rows by when a column function is used, and thenumber of rows to display from the beginning or end of the list ofreturned values (such as the top ten processes).
Queries to the monitoring serverQueries are made to the Tivoli Enterprise Monitoring Server to retrieve sampledattribute values from managed systems for display in workspace chart views, thetable view and relational table-based topology views.
192 IBM Tivoli Monitoring: Tivoli Enterprise Portal User's Guide
Creating a query to the monitoring serverYou can create a new query to the monitoring server. Use this method to create aquery only if you know what symbols the are required by the query.
Before you begin
Although you can follow this method to add a new query to the monitoring server,use Create Another Query to ensure the query has the required symbolexpression to reference the managed systems to include. Otherwise, no data isretrieved. Exception: When your product is upgraded to a new release with newattributes or attribute groups, the new attributes are not shown in the queries forthat attribute group. And no new queries are shown for new attribute groups. Ifthis exception applies, use this procedure to create a new query.
Your user ID must have permission for Modify Query and for Workspace AuthorMode. If you do not see the Queries tool, your user ID does not have View orModify Query permissions. If you can see the tool but it is disabled, your user IDdoes not have Workspace Author Mode permission. If you can open the Queryeditor but the tools are disabled, your user ID does not have Modify Querypermission.
Procedure1. Complete one of the following steps to open the Query editor:
v Click Queries.v In the title bar of the table or chart view where you would like to apply a
new query, click Properties > Click here to assign a query.2. Click Create New Query.3. In the Name field, type a name of up to 32 letters, numbers, underscores ( _ ),
and spaces; in the Description field, type a description to help users identifywhat the query does or what it is for, up to 256 characters and spaces. TheSelect attribute window opens.
4. Select the Tivoli product name from the Category list, and click OK.5. Select the attribute group from the Group list, select the attributes to include
from the Item list, and click OK. After selecting one attribute, you can useCtrl+click to select multiple attributes or Shift+click to select all attributes fromthe first selection to this one, or click Select All.
6. Add the same symbol expressions to the specification as those used in thepredefined query for this attribute group. Usually, this symbol is the $NODE$symbol in the column that identifies the computer: System Name, Server Name,Originnode or something similar. If you are not sure what the expressions are,click Apply, open a predefined query for the attribute group that includes asymbol expression. Make note of the column name and any symbol expressionsused in the specification, return to your new query, and add the symbolexpression to the appropriate column.
7. Edit the specification for any changes you want to make:v Add an attribute to the query by clicking Add Attributes and selecting the
attributes you want to include. The attributes available are from the groupused in the original query.
v Remove an attribute by right-clicking the column heading and clickingDelete. (You can also right-click a row and delete it.)
v Include an attribute in the filter, but do not retrieve it by clearing thatcolumn.
Chapter 7. Custom queries 193
v Clear the filter criteria by right-clicking the cell, column, or row, and clickingClear Contents.
v Insert a row by right-clicking the row and clicking Insert.v Cut, copy, or paste by right-clicking the cell or row and clicking Cut,
Copy, or Paste. When you paste, the contents of the clipboardoverwrites the cell or row.
v Add filter criteria by clicking in a cell and writing the expression.v Add a column function by clicking in the column heading and selecting a
function from the list; then click Advanced and select the column to GroupBy.
v Specify a sort order by clicking Advanced, and selecting the column to SortBy. Note that if you selected a Group By column, you cannot also specify asort order.
v Adjust column order by dragging a column heading and dropping at theinsertion point.
v Restrict the rows (data series) that show in the table view or bar chart to aspecific number. Restrict the first rows retrieved from the monitoring agentor the most recent (last rows) by clicking Advanced, selecting First or
Last, and specifying the the number or rows to retrieve.8. Optional. If you opened the Query editor from the view properties, you can
change the list of managed systems the query will extract data from.a. Click the Query Results Source tab.b. Select Let user assign explicitly, then remove managed systems from
the Assigned list and add them from the Available list.
Regardless of the managed systems assigned to a query, a gauge chart canshow data from only one managed system. If you are using the query in aworkspace where multiple systems are applicable, such as at the Enterprise-or Platform level of the Navigator Physical view, the data shown is from thefirst managed system in the Assigned list.
9. When you are finished, click Apply to save the query and keep the windowopen or click OK to save the query and close the window. If you opened theQuery editor from the Properties window, clicking OK also selects the queryfor the current view.
What to do next
Be aware of these limitations:1. The attributes in a query can be from one group only; you cannot mix
attributes from different groups in the same query.2. Even if data collection has been started, you cannot use the time span feature
if the query for the chart or table includes any column functions. If this is thecase, you can select or create another query to enable Time Span.
3. The Sort by advanced query function is incompatible with the historicalreporting feature. The view will not be sorted even if you have specified a sortorder in the query. Nonetheless, while a table view that specifies a time span isdisplayed in a workspace, you can still sort it by clicking a column heading.Similarly, the Sort by and Group by advanced query functions are unavailablefor views that specify a time span within the last 24 hours, that is, views thatdraw from short-term history. (The first 24-hour retrieval from short-termhistory can be reduced or eliminated by adjusting theKFW_REPORT_TERM_BREAK_POINT value in the Tivoli Enterprise PortalServer environment file.)
194 IBM Tivoli Monitoring: Tivoli Enterprise Portal User's Guide
Creating another query to the monitoring serverUse this method to create Tivoli Enterprise Monitoring Server queries and to createqueries similar to existing ones.
Before you begin
Your user ID must have permission for Modify Query and for Workspace AuthorMode. If you do not see the Queries tool, your user ID does not have View orModify Query permissions. If you can see the tool but it is disabled, your user IDdoes not have Workspace Author Mode permission. If you can open the Queryeditor but the tools are disabled, your user ID does not have Modify Querypermission.
If your product has been upgraded to a new release, with new attributes orattribute groups added, and you see no new attributes in the query or queries forthat attribute group or you see no query for a new attribute group, do not usethese steps. Instead, use the procedure for creating a new query.
Procedure1. Complete one of the following steps to open the Query editor:
v Click Queries.v In the title bar of the table or chart view where you would like to apply the
new query, click Properties > Click here to assign a query.2. Click to expand the Monitoring agents and attribute group folders to
see the queries.3. Find a query similar to the one you want, select the query and click Create
Another Query.4. In the Name field, type a name of up to 32 letters, numbers, underscores (_)
and spaces, then click OK. A duplicate of the original query is displayed withthe name you entered.
5. In the Description field, type a new description.6. Edit the specification for any changes you want to make:
v Add an attribute to the query by clicking Add Attributes and selecting theattributes you want to include. The attributes available are from the groupused in the original query.
v Remove an attribute by right-clicking the column heading and clickingDelete. (You can also right-click a row and delete it.)
v Include an attribute in the filter, but do not retrieve it by clearing thatcolumn.
v Clear the filter criteria by right-clicking the cell, column, or row, and clickingClear Contents.
v Insert a row by right-clicking the row and clicking Insert.v Cut, copy, or paste by right-clicking the cell or row and clicking Cut,
Copy, or Paste. When you paste, the contents of the clipboardoverwrites the cell or row.
v Add filter criteria by clicking in a cell and writing the expression.v Add a column function by clicking in the column heading and selecting a
function from the list; then click Advanced and select the column to GroupBy.
Chapter 7. Custom queries 195
v Specify a sort order by clicking Advanced, and selecting the column to SortBy. Note that if you selected a Group By column, you cannot also specify asort order.
v Adjust column order by dragging a column heading and dropping at theinsertion point.
v Restrict the rows (data series) that show in the table view or bar chart to aspecific number. Restrict the first rows retrieved from the monitoring agentor the most recent (last rows) by clicking Advanced, selecting First or
Last, and specifying the the number or rows to retrieve.7. Optional. If you opened the Query editor from the view properties, you can
change the list of managed systems the query will extract data from.a. Click the Query Results Source tab.b. Select Let user assign explicitly, then remove managed systems from
the Assigned list and add them from the Available list.
Regardless of the managed systems assigned to a query, a gauge chart canshow data from only one managed system. If you are using the query in aworkspace where multiple systems are applicable, such as at the Enterprise-or Platform level of the Navigator Physical view, the data shown is from thefirst managed system in the Assigned list.
8. When you are finished, click Apply to save the query and keep the windowopen or click OK to save the query and close the window. If you opened theQuery editor from the Properties window, clicking OK also selects the queryfor the current view.
Related concepts:Appendix A, “Formula functions,” on page 401Related reference:
http://publib.boulder.ibm.com/infocenter/tivihelp/v15r1/topic/com.ibm.itm.doc_6.2.2fp2/teps_kfwenv_list.htm
Adding symbols in queries to the monitoring serverMost predefined queries include a == $NODE$ (or similar) variable expression thatidentifies the managed systems. The $NODE$ symbol resolves to the node name ofeach agent associated with the Navigator item and serves to limit the retrieveddata to those agents rather than all agents of that type in your enterprise.
About this task
You can also add your own symbols (variables) to a query to provide morecustomization options in the Link Wizard. To check for or to add a symbol to aquery, complete the following steps:
Procedure1. Open the workspace to which you plan to link (the target, or link to,
workspace).2. Right-click the table or chart. This view has a key field you want to reference in
the link definition. Typically, it is the view that will show details for anattribute from the row where you launched the link.
3. Click Properties > Click here to assign a query.4. In the Query editor, review the query specification to see that it has a symbol
defined for the attribute on which you want to build the custom link. Symbolsare surrounded by dollar signs ($) .
196 IBM Tivoli Monitoring: Tivoli Enterprise Portal User's Guide
5. If the attribute has no symbol, create your own by typing $mysymbol$ in thefirst cell in that column, where mysymbol is a one-word name. If the queryalready has a symbol (or symbols) defined, such as $WTPROCESS.IDPROCESS$, besure to add your symbol to the same row of the specification to create an ANDexpression.You can create a symbol for any column whose value can be used to restrict thenumber of rows returned. If the symbol resolves to a non-null value, arestricting where clause is added; if not, it is skipped.
6. Click OK to save your changes to the query and close the window.7. Repeat these steps for any other views whose query you want to check.
Results
When you are finished, you can open the source workspace for the link and startthe Link Wizard from the chart or table row. The symbol you added is displayedin the list of symbols available for the query.v Use a one-word name surrounded by dollar signs, as in $mysymbol$, where
mysymbol is the symbol name.v Do not use the same name as one of your monitoring agent attributes. For
example, $MYNODE$ is acceptable, but not $NODE$.v When the link is launched, a symbol is resolved to a value enclosed in single
quote marks if it is anything other than an integer. An integer resolves withoutthe quotes.
Queries to a databaseThe Query editor has a text editor where you can compose free-form SQL queriesto any JDBC- or ODBC-compliant databases located on the system where the TivoliEnterprise Portal server is installed.
Creating a query to a JDBC or ODBC databaseThe Query editor has a text editor for composing free-form SQL statements to anyJDBC- or ODBC-compliant database located on the computer where the TivoliEnterprise Portal server is installed.
Before you begin
Your user ID must have Modify Query permission for this function. If you do notsee the Queries tool, your user ID does not have View or Modify Querypermissions; if you can open the Query editor but the tools are disabled, your userID does not have Modify Query permission.
About this task
Use this task to create a new query of JDBC or ODBC attributes, thus enabling youto integrate systems management data from monitoring agents with data fromother sources in one workspace.
Procedure1. Do either of the following actions to open the Query editor:
v Click Query editor in the main toolbar.v In the title bar of the view where you want to apply the new query, click
Properties > Click here to assign a query.
Chapter 7. Custom queries 197
2. Click Create New Query.3. In the Name field, type a name of up to 32 letters, numbers, underscores (_)
and spaces and, optionally, in the Description field, type a description of up to256 characters and spaces.
4. From the Category list, select the folder where you want the new query toappear in the Queries tree.
5. Select a JDBC or ODBC database in the Data Sources list. Custom SQL isselected for you. If you do not see the database for which you want to createthe query, it must be added through Manage Tivoli Monitoring Services.
6. Click OK. The new query is displayed in the Queries tree under Folder(where Folder is the Category you selected) in the Custom_SQL folder. TheSpecification tab opens with a Custom SQL text box for you to enter SQLcommands.
7. Write an SQL SELECT statement in the text box using the correct syntax. Youmust be familiar with SQL commands and syntax to write a valid SQL query.
8. When you are finished writing the SQL statement, click Apply to save thequery and keep the window open; or click OK to save the query and close thewindow.
What to do next
If the view remains empty after you assign the query, the query has not beenentered correctly. Review the notes for JDBC or ODBC database queries and returnto the Query editor to edit the SELECT statement as needed.
Notes on queries to a JDBC or ODBC databaseConsult these notes about SQL statements written to a JDBC or ODBC database toensure data is returned successfully.
Date and time format varies among databasesYou must know the format and write the appropriate SQL code against itwhen selecting by date. Otherwise, the statement might be not be valid forthe database to which the request is directed.
Database user IDsAnyone with permission to create custom queries has access to all theJDBC and ODBC DSNs (Data Source Names) that were created on thesame computer as the Tivoli Enterprise Portal Server. Add database userIDs (to be used in the DSN) to your database software to restrict useraccess to only those tables, columns, and so on, allowed by yourorganization's security policies.
Symbolic variablesIf you included a symbol in the statement, you are prompted to enter avalue for the symbol when you apply the query to a table or chart view.The value you enter filters the data that is displayed in the view, but istemporary and cannot be saved with the workspace.
Column functions in a statement that has a JOINWhen a custom SQL statement contains a JOIN command, the TivoliEnterprise Portal does not set the table name property in the request sentto the Tivoli Enterprise Portal Server. Normally, the portal serverdetermines the table name from the result set returned from the database.However, when a column function (such as COUNT, MAX, or MIN) isused on one of the columns in the request, the result set meta data does
198 IBM Tivoli Monitoring: Tivoli Enterprise Portal User's Guide
not provide a table name for that column. With no table name, the portalclient treats the column as a text attribute, which means that it cannot berendered in a chart view.
To ensure that the column data type is set correctly, provide an alias forany column in the SELECT statement that uses a column function. Thealias must be in the form table.column. The table and column values canbe arbitrary strings, and do not need to match the actual table or columnname in the database. The value supplied for column is the columnheading. In the attribute selection dialog, the value for table is theattribute group, and the value for column is the attribute item.
In the Before sample, the data returned from the statement rendersproperly in a table view but cannot be selected in the Properties editor
Filters tab for any chart views because the returned values are read astext attributes. The After sample shows how the statement was edited tocreate an alias to explicitly state the table name for TYPE and COUNT.
BeforeSELECT COUNT(column1) item_countFROM table1LEFT OUTER JOIN table2 ON table1.column1 = table2.column1
AfterSELECT COUNT(column1) "my_group.item_count"FROM table1LEFT OUTER JOIN table2 ON table1.column1 = table2.column1
Creating another query to a JDBC or ODBC databaseIf you want to create a query that is similar to an existing one, you can copy theoriginal and edit the new query.
About this task
To create another query to an ODBC database:
Procedure1. Do one of the following to open Query editor:
v Click Queries.v In the title bar of the table or chart view where you would like to apply the
new query, click Properties > Click here to assign a query.2. Click to expand the Tivoli Enterprise Monitoring Agents and attribute
group folders to see the queries.3. Find a query similar to the one you want, select the query and click Create
Another Query.4. In the Name field, type a name of up to 32 letters, numbers, underscores (_)
and spaces, then click OK. A duplicate of the original query is displayed withthe name you entered.
5. In the Description field, type a new description.6. Edit the specification for any changes you want to make to the SELECT
statement.7. When you are done, click Apply to save the query and keep the window open;
-OR- click OK to save the query and close the window.
Chapter 7. Custom queries 199
Symbols in creating queries to JDBC or ODBC data sourcesYou can use symbols (variables) in custom SQL queries to JDBC- orODBC-compliant data sources. The reason you would add a symbol to a customSQL query is to build a filtered link (using the Link Wizard) to the workspace witha table or chart that uses this query. For example, if you are building a link basedon the data source attribute for system name, the symbol might be $myhostname$.
When you apply the query to a table or chart, you will be prompted to enter avalue for the variable as soon as you click Apply or OK. The value filters the datathat will show in the view, but is temporary and cannot be saved with theworkspace.v Use a one-word name surrounded by dollar signs, as in $mysymbol$, where
mysymbol is the symbol name.v When the link is launched, a symbol is resolved to a value enclosed in single
quotation marks if it is anything other than an integer. An integer resolveswithout the quotation marks. If you are referencing the symbol in a custom SQLstatement and you do not want the quote marks included in the resolved value,add a pound sign after the first dollar sign, as in $#noquotes$, where noquotes isthe symbol name. This notation is required for numeric data types.Example:SELECT * FROM MYTABLE WHERE MYCOLUMN = $#myNumber$
The value of the $#myNumber$ symbol is a number (such as 5 or 345).
Adding a database to the Data Source listThe Data Source area of the Create Query window lists the databases available fora query. The databases that are shown are read from the database server on thesystem where the Tivoli Enterprise Portal Server was installed. If you do not seethe database for which you want to write a query in the list, you must add itthrough Manage Tivoli Monitoring Services.
About this task
You can also use the tacmd configurePortalServer to complete this task. See theIBM Tivoli Monitoring Command Reference for more information.
Restriction: The ODBC interface is not supported on Linux and UNIX. Because ofthis limitation, the CONNECTION_TYPE=DB2 is used.
To add a database to the Data Source list on Windows:
Procedure1. On the computer where the Tivoli Enterprise Portal Server is installed, click
Start > Programs > IBM Tivoli Monitoring > Manage Tivoli MonitoringServices.
2. Right-click the Tivoli Enterprise Portal Server name and click Advanced > EditENV File.
3. Find the section entitled KFW_ODBC_*.4. Delete the # remark symbol at the beginning of the DSUSER1 entry.5. Edit the DSUSER1 entry for your data set name, username and password:
DSUSER1=“DSN=myODBC;UID=mUsername;PWD=myPassword”
where
200 IBM Tivoli Monitoring: Tivoli Enterprise Portal User's Guide
v DSN is the ODBC data source name as it is displayed in the database server.v UID is the user ID for accessing the database.v PWD, if used, is the password for the user ID.
Each property is a key=value pair and is separated by a semi-colon (;).Other key=value pairs can be added such as: CONNECTION_TYPE,CONNECTION_LIMIT, KFWJDBCDRIVER, and KFWDSURL.The information provided for the entry creates your datasource connectionstring.
6. Continue to add new lines for other data sources, from DSUSER2 up toDSUSER9.
7. Close the text editor and answer Yes to the prompt to recycle the portal server.
Note: The database you want to reference must be in the ODBC Data Sourceregistry on the Tivoli Enterprise Portal Server. If it is not, consult yourWindows system administrator.
8. Recycle the portal server.
Editing a queryYou can edit any of the queries you have created for the monitoring server or foran ODBC-compliant database. You might want to modify a query to add a filterthat keeps unnecessary data from cluttering the view and slowing the return ofdata, for example.
Before you begin
Your user ID must have permission for Modify Query and for Workspace AuthorMode. If you do not see the Queries tool, your user ID does not have View orModify Query permissions. If you can see the tool but it is disabled, your user IDdoes not have Workspace Author Mode permission. If you can open the Queryeditor but the tools are disabled, your user ID does not have Modify Querypermission.
Procedure1. Complete one of the following steps to open the Query editor:
v Click Query Editor.v In the view whose query you want to edit, click Edit Properties.v Click Properties and select the view from the Properties tree.
2. Expand the Tivoli Enterprise Monitoring Agents and attribute groupfolders to see the queries.
3. Select the Query that you want to edit. The query specification is displayedin the right frame.
4. Edit the specification for any changes you want to make.v For monitoring server queries:
Add an attribute to the queryClick Add Attributes and select the attributes to include. Theattributes available are from the group used in the original query.
Remove an attributeRight-click the column heading and click Delete. You can alsoright-click a row and delete it.
Chapter 7. Custom queries 201
Include an attribute in the filter but not retrieve the valueClear the check box for that column.
Delete the filter criteriaRight-click the cell, column, or row and click Clear Contents.
Insert a rowRight-click a row and click Insert.
Cut, copy, or pasteRight-click the cell or row and click Cut, Copy, or Paste.When you paste, the contents of the clipboard overwrites the cell orrow.
Add filter criteriaClick in a cell and write the expression.
Reorder the columnsDrag a column heading and drop it at the insertion point. Views thatuse this query are displayed with this column order. Users can dragcolumns in the workspace view to rearrange them and, if theworkspace is saved the new order becomes permanent until anotherquery is applied to the view or the columns reordered and theworkspace is saved again.
Specify a sort orderClick Advanced and select the Sort By column from the list. Notethat if you selected a Group By column, you cannot also specify asort order.
If your environment has multiple monitoring servers, the sorting isdone independently at each monitoring server and then returned tothe portal without resorting the merged values. You can sort therows returned after they are displayed in the view.
Specify the first or last n rows to returnClick Advanced, select First or Last, then use the spincontrol to adjust the number of rows to retrieve or type the numberdirectly into the text box.
This is the number of rows to retrieve from each Tivoli EnterpriseMonitoring Server in your monitored environment. For example, ifyour environment has a hub monitoring server with one remotemonitoring server and you select the last 5 rows, the view shows 10rows of data: 5 from the hub and 5 from the remote. The data issorted for each server individually. In table views, you can click acolumn heading to sort the results from all servers.
Apply a group functionClick Formula in the column heading and select from the list ofavailable group functions. The icon in the column heading changesto the icon for the chosen function:
Minimum in group
Maximum in group
Count of group members
Sum of group
Average of group
Click Advanced and select the Group By column from the list.
202 IBM Tivoli Monitoring: Tivoli Enterprise Portal User's Guide
v For ODBC queries, edit the SELECT statement.5. Optional. If you opened the Query editor from the view properties, you can
change the list of managed systems the query will extract data from.a. Click the Query Results Source tab.b. Select Let user assign explicitly, then remove managed systems from
the Assigned list and add them from the Available list.
Regardless of the managed systems assigned to a query, a gauge chart canshow data from only one managed system. If you are using the query in aworkspace where multiple systems are applicable, such as at the Enterprise-or Platform level of the Navigator Physical view, the data shown is from thefirst managed system in the Assigned list.
6. When you are finished, click Apply to save the query and keep the windowopen or click OK to save the query and close the window. If you opened theQuery editor from the Properties window, clicking OK also selects the queryfor the current view.
Related concepts:Appendix A, “Formula functions,” on page 401Related reference:
http://publib.boulder.ibm.com/infocenter/tivihelp/v15r1/topic/com.ibm.itm.doc_6.2.2fp2/teps_kfwenv_list.htm
Deleting a queryWhen you no longer need a query for any purpose, you can clean up the Queryeditor tree by deleting it.
About this task
If you do not see the Queries tool, your user ID does not have View or ModifyQuery permissions. If you can open the Query editor but the tools are disabled,your user ID does not have Modify Query permission.
Procedure1. Do one of the following to open the Query editor:
v Click Query Editor.v In the view whose query you want to delete, click Properties.v Click Properties and select the view from the Properties tree.
2. Select the Query name in the tree. The query specification is displayed inthe right frame.
3. Click Delete Query. If the Delete Query tool is disabled, your user ID doesnot have Modify Query permission.If a Navigator item is associated with a query, you will not be able to delete thequery.
Note: If you delete a query that is being used by a view, the view is no longerassociated with a query and contains no data when you next open itsworkspace.
4. Click OK to confirm.
Chapter 7. Custom queries 203
Tivoli Enterprise Monitoring Server predefined queriesEvery IBM Tivoli Monitoring product is shipped with a set of predefined queriesthat you can apply to a table or chart view. This topic describes the queriesdelivered as part of the Tivoli Management Services infrastructure. The TivoliEnterprise Monitoring Server queries are available for every item in the Navigator.
Expand the Tivoli Enterprise Monitoring Server branch of the Queries tree tosee these query groups:
Agent Operations LogThis log and the EIB Change Log are good diagnostic tools to use whenproblems arise such as a true situation that is not raising an alert asexpected. They also provide information that can help in planningoptimization strategies.
Agent Operations Log provides information about situation andconnectivity messages that occur on the managed system associated withthe Navigator physical view item or the link source. It is useful fordiagnostic research with IBM Support.
Catalog CheckThe Catalog Check queries compare the application catalogs of the hubTivoli Enterprise Monitoring Server with those of the remote monitoringservers and report any discrepancies. These queries are used in the ManageTivoli Enterprise Monitoring Servers workspaces:
Compare Enterprise Catalogs
Compare TEMS Catalogs
Custom SQLThe custom SQL (Structured Query Language) queries provide informationthat the portal server (TEPS) database gathers from the hub TivoliEnterprise Monitoring Server. These queries are for the Situation EventResults workspace and the Self-Monitoring Topology workspace.
EIB Change LogThe Enterprise Information Base log, like the Agent Operations log, isstored on the hub monitoring server.
EIB Change Log provides information about changes to EnterpriseInformation Base objects such as situations. It is useful mainly fordiagnostic research with IBM Support. This is an ODBC query of the EIBChange Log attributes.
ITM Audit LogThe ITM Audit Log query is stored on the hub monitoring server.
ITM Audit Log provides information on critical state-changing events inthe monitoring environment.
Managed SystemThe Managed Systems queries are used to check vital heartbeatinformation from the monitoring server and monitoring agents.
Current Managed Systems Status, when applied to a table view, displaysall the Managed Systems attributes. It displays such information as theagent product code and the host name and IP address of the managedsystem. The Enterprise Navigator item has a Managed System Statusworkspace that uses this query. A threshold was applied to the Statuscolumn that highlights any offline managed systems.
204 IBM Tivoli Monitoring: Tivoli Enterprise Portal User's Guide
ITV Managed System Count is a count of the managed systems reportingto each monitoring server.
Tivoli Enterprise Monitoring Servers
Windows Systems Online lists the Windows OS managed systems that areonline. Other OS agents have similar queries.
Windows Systems Offline lists the Windows OS managed systems that areunavailable. Other OS agents have similar queries.
Situation Definition
Situation Definition uses the Situation Definition attributes to retrieveinformation that describe every aspect of the situations defined to this hubmonitoring server.
Situation State EventsThe Situation State Events queries collect status information on situationevents.
Events by Owner Using ID
Selected Event Using ID
Similar Events by Situation Name lists all the events for the same situation.Such events would occur when the situation is true on more than onemanaged system or the situation is true on the same managed systemmore than once (a display item was defined in the Advanced Situationoptions window). You can see table views that use this query: From theEnterprise Status workspace, right-click the link anchor for anacknowledgement in the My Acknowledged Events view, and click EventDetails - Similar by Situation Name.
Similar Events by Source lists all the events from the same managedsystem as the event you are viewing. You can see table views that use thisquery: From the Enterprise Status workspace, right-click the link anchorfor an acknowledgement in the My Acknowledged Events view, and clickEvent Details - Similar by Source.
Similar Events by Resource lists all the events for situations that weredefined with the same attribute group as the one used for this situation.You can see table views that use this query: From the Enterprise Statusworkspace, right-click the link anchor for an acknowledgement in theMy Acknowledged Events view, and click Event Details - Similar byResource.
Events by Owner Using Name returns all the events by owner.
Selected Event Using Name returns all events by their short name.
Similar Events by Situation Display Name return all events by their fullname.
Similar Events by Source using Situation Display Name
Similar Events by Resource using Situation Display Name
Situation Status
Situation Status Detail
Situation Status Summary
Chapter 7. Custom queries 205
Situation Status CurrentThese queries use the Active Situation Status attributes to display statusinformation on situations and policies that are running.
Alternate Current Situation Status is an alternate query for message loginitialization.
Current Active Situation Status Using ID
Pure Event Occurrences Using ID displays the situations with pure eventsopened when applied to a table view.
Current Active Situation Status Using Name
Pure Event Occurrences Using Name displays the situations with pureevents opened when applied to a table view.
Situation Status LogThese queries use the Situation Status attributes to display statusinformation on started situations and policies.
Open Events Count Using ID - Enterprise shows the every open event onthe Enterprise and the number of intervals the situation has been true sinceit was started.
Open Events Count Using ID - Managed System shows the every openevent on the managed system and the number of intervals the situationhas been true since it was started.
Situation Status Log shows the status of the situations on this managedsystem. It is similar to the message log view.
Open Events Count Using Name - Enterprise shows the every open eventon the Enterprise and the number of intervals the situation has been truesince it was started.
Open Events Count Using Name - Managed System shows the every openevent on the managed system and the number of intervals the situationhas been true since it was started.
206 IBM Tivoli Monitoring: Tivoli Enterprise Portal User's Guide
Chapter 8. Historical reporting
Tivoli Enterprise Portal provides historical data collection and reportingcapabilities. If historical data collection has been configured and started for anattribute group on the managed systems specified, you can set a time span forretrieving historical data into a query-based view.
Overview of historical data collection and reportingUse historical data collection and reporting to gather useful metrics about yourmanaged network. You can also use historical data with the chart baselining toolsfor predictive analysis and in situation modeling for key performance indicators.
How historical data collection and reporting worksAfter historical data collection has been configured and started, datasamples are collected and saved in history files at either the monitoringagent or the monitoring server for the short term. The data is stored intables, one for each attribute group for which data is being collected. If theTivoli data warehousing facility has been set up, you can move the data toa relational database for longer term storage.
The History Collection Configuration window enables you to configurehistorical data collection for individual attribute groups and specify fromwhich managed systems to collect, how frequently to collect the data,where to store it for the short-term, and whether to save data long-term toa data warehouse. You can create multiple historical collections for anattribute group, each with different collection settings and managed systemdistributions, and you can write filtering formulas to collect only the datasamples that meet the filter criteria.
The Object Group editor enables you to combine historical data collectionsinto groups and assign managed systems. With historical collection groupsyou can easily turn on and turn off historical data collection at specificmanaged systems or groups of managed systems by changing thedistribution.
Viewing historical dataAfter data collection has been configured and started for an attributegroup, historical data for that group can be retrieved and displayed inquery-based views (chart views, table view, and the topology view).
You know that historical data collection has been enabled for the attributesin a view when you can see Time Span in the view's toolbar. The viewshows current data samplings unless you use this tool to specify a broadertime period. The first 24 hours of collected data is retrieved from theshort-term history files; beyond 24 hours, the data is pulled from the datawarehouse.
Historical data is valuable for use in chart baselining and situationmodeling. Applying historical data to chart baselines and situationmodeling enables you to perform predictive analysis and fine tunesituations.
Requests that return large amounts of data can negatively affect theperformance of monitoring servers, monitoring agents, and your network.
© Copyright IBM Corp. 2005, 2012 207
For attributes or views that return considerable amounts of data, try tolimit the time span to as short a period as will provide the requiredinformation.
Be aware that if this is a newly configured historical data collection, youwill see the historical data samples that have been collected and no more.For example, if you created a historical collection and assigned it to ahistorical collection group an hour ago, you will see only the last 1 hour inthe chart or table view even if you selected, say, the last 8 hours.
Historical navigation modeThe Set historical navigation mode tool at the end of the main toolbar isfor a different purpose: It enables you to set a time span that issynchronized so that you can see the same time range in workspaces asyou move among them, and compare those values.
Related tasks:“Setting a time span to display” on page 41
Setting a time span to displayYou can have the Tivoli Enterprise Portal log data samplings into history files or adatabase for display in a table or chart. These historical data enabled views have atool for setting a range of previous data samples to be reported.
Before you begin
Historical data collection must be configured and distributed to the managedsystems that you are querying data from. Otherwise, Time Span is not displayedin the toolbar of the query-based view.
Some attributes groups, such as Situation Status and the Windows Event Log, arehistorical in nature and show all their entries without you having to specify a timespan. For these types of attribute groups, you do not need to configure historycollection unless you want to roll off to a data warehouse for long-term storage orlimit the amount of data displayed. Thus, the time span feature, rather thanshowing more data, limits the data reported to the time period indicated.
Even if data collection has been started, you cannot use the time span feature if thequery for the chart or table includes any column functions. If this is the case, youcan select or create another query to enable Time Span.
About this task
Take these steps to broaden the time range of data beyond the current datasamplings.
Procedure1. Open the workspace containing the chart, table, or relational table-based
topology view where you want to see historical data.2. Click Time Span in the view's toolbar.3. Select a time frame: Real time plus Last _ Hours (enabled for bar, plot, and
area charts only), Last _ Hours (or Days, Weeks, or Months, if the data iswarehoused), or Custom.
4. If you selected Last or Custom, specify the range of data:v Detailed data is all the data collected for the agent.
208 IBM Tivoli Monitoring: Tivoli Enterprise Portal User's Guide
v Summarized data is data that is aggregated across the specified time frame.Set the time frame interval, work shift, and the days. This option is disabledif no data warehouse and summarization schedule were configured for thisattribute group.
v To set a custom time frame, click inside the Start Time and End Time fieldsto open the date editor. Use the spin boxes to adjust the time, year, ormonth; and click the calendar day. HH:MM:SS AM/PM is initially set to thecurrent time.
v To apply the time span to all views that use the same query as this view,select Apply to all views associated with this view's query. When thisoption is enabled, the query is modified to include the time span set here, soany other views using this query report the same time range.
v The Timestamp column that is added to the historical view can show eitherthe global timestamp (the default) or local. Select Use Hub time to reflectthe time at the Hub Tivoli Enterprise Monitoring Server rather than at theTivoli Enterprise Portal Server or portal client.
Results
After you click OK, the view shows data from the time span you specified. If theview is a table, a timestamp is displayed as the first column and is accurate to thenearest minute; seconds are displayed as 00.
If you see null as the value of a table cell or chart point, it means that no valuewas stored in the Tivoli Data Warehouse. This happens when values that wereidentified as invalid are reported from a monitoring agent for a givensummarization period.
What to do next
The sort function is incompatible with the historical reporting feature. If you areusing Time Span to retrieve historical data, the chart or table is not sorted evenif you have specified a sort order in the query. You can still sort a table by clickinga column heading.
After support for an updated product has been applied to the portal server, it ispossible to get a request error message about a missing or unknown column namein the view's status bar after you set a time span with Use summarized dataselected. Wait until after the next scheduled summarization and pruning procedurehas taken place before viewing the summarized data. If need be, you canreschedule summarization and pruning to run sooner.Related concepts:“Overview of historical data collection and reporting” on page 207Related tasks:“Discontinuing historical reporting”
Discontinuing historical reportingFor views that have a time span set to show data samplings over a range of time,you can remove the time span and display real-time data only.
About this task
To change the view to show current data samplings, perform the following steps:
Chapter 8. Historical reporting 209
Procedure1. Open the workspace with the view from which you want to remove historical
reporting.2. Click Time Span in the view's toolbar.3. Select Real time.4. Click OK.
Results
If this is a table view, the leftmost time stamp column is no longer displayed. Theview now shows data from the current sampling only. The exception is views ofattribute groups that are normally historical, such as the Situation Status and theEvent Log: When Real time is selected, attribute groups show all data they havecollected, up to 2000 of the most recent entries.Related tasks:“Setting a time span to display” on page 41
Turning on historical navigation modeUse historical navigation mode to synchronize workspaces and retain the sametime period as you switch from one workspace to another.
About this task
Whenever you open a workspace, the latest values are retrieved to the query-basedviews. Open or link to another workspace and the data is retrieved at a differenttime. For performance analysis, you can specify a time span to use for theworkspaces that get opened. Historical navigation mode is easily started andstopped, and you can adjust the time span. Follow these steps to start historicalnavigation mode.
Procedure1. Do either of the following:
v Click Set historical navigation mode at the end of the main toolbar.v Click Select time span in the view toolbar. The time span tool shows for
views of attribute groups that historical data collection has been configuredfor and started or that are historical in nature.
2. Set the time span.3. Select Lock time span for Historical Navigation.4. If you want to base the time span on the Hub monitoring server's clock and
time zone, select Use Hub time.5. Click OK. From now on, workspaces that are opened will display data
according to the time span settings, as indicated by the appearance of the Resethistorical navigation mode tool. The status bar also shows an indicator of thetime span.
6. When you are ready to deactivate historical navigation mode, click Resethistorical navigation mode, then clear Lock time span for HistoricalNavigation.
210 IBM Tivoli Monitoring: Tivoli Enterprise Portal User's Guide
What to do next
Not all workspace views are able to display a time span or the range that you havespecified. In this case, no values are displayed and a message in the view's statusbar says that the query assigned to the view does not support a historical timerange. It is likely that historical data collection has not been configured for theattribute group shown in the view or there is no historical data to report. Exithistorical navigation mode to remove this message. To see historical data in thisview, you must first configure historical data collection for the attribute groupreferenced by the query, then start collection and wait a sufficient period of timefor historical data to be gathered before displaying the view again.
Historical collection configurationTo make historical data available for reporting in workspace views, you mustconfigure and start historical data collection for the appropriate products andattribute groups. This is done through the History Collection Configurationwindow.
Understanding historical configurationIt is necessary to configure historical data collection for attribute groups anddistribute to managed systems before users can see historical data in the TivoliEnterprise Portal. Read this topic to understand the configuration settings and theirimplications.
Configure historical data collection firstCustomization of the Tivoli Enterprise Portal is best begun withconfiguring historical data collection. Until then, no historical data isavailable for the predefined historical workspaces that your product mightoffer, for situation modeling, or for chart baselining, all of which enableyou to perform in-depth analysis and health assessments of your managedenvironment.
Distribute to Managed System (Agent) or Managing System (TEMS)In a historical collection, the first decision made regarding distribution isthe method:
Managed System (Agent) is the default method and requires that anymanaged system in the distribution connect to a Tivoli EnterpriseMonitoring Server Version 6.2.2 or later. The distribution goes to a subsetof managed systems: the managed systems of that agent type that areassigned individually or as part of a managed system group. Alternatively,you can choose to assign managed systems for distribution to a historicalconfiguration group that the collection belongs to.
Historical configuration groups provide a way to group historicalcollections that have the same distribution requirements. The managedsystem distribution list can be assigned for the group rather than to eachcollection individually.
Managing System (TEMS) is the method that was used for distribution inIBM Tivoli Monitoring Version 6.2.1 and earlier; it is the required methodfor distribution if the managed system connects to a V6.2.1 or earliermonitoring server. The distribution is to managed systems of that agenttype that are connected to the Tivoli Enterprise Monitoring Server. If theManaging System (TEMS) method has been chosen for a collectiondefinition, that collection becomes ineligible for membership in a historicalconfiguration group.
Chapter 8. Historical reporting 211
Upgraded historical configuration from an earlier versionIf you have upgraded to Tivoli Management Services Version 6.2.2 (orlater) from a release prior to Version 6.2.2, you get a historical collectiondefinition for each attribute group that was configured and the distributionmethod is unchanged: Managing System (TEMS). If you would like to usethe distribution techniques that are available when distribution is bymanaged system, change the distribution method for each collectiondefinition to Managed System (Agent). (See the link to “Changing thedistribution method” at the end of this topic.)
Managed System distribution through the historical collection or through thehistorical configuration group
You can assign a managed system (or managed system group or both) tothe individual historical collection definition, a historical configurationgroup or to a managed system group that is assigned to the collection orhistorical group.
As a best practice, develop a way to organize managed system distributionfor historical data collection. It is possible for a managed system to bereferenced more than once for the same historical collection definition. Forexample, the managed system might be have been assigned in theDistribution tab for the collection definition and the collection is a memberof a historical configuration group that also has that managed systemassigned. You need not be concerned with data being collected multipletimes on that managed system for this collection definition, but be awarethat if you intend to stop data collection on that managed system byremoving it (or a managed system group it belongs to) from thedistribution, data collection will continue to occur. This will go on until themanaged system is removed from all group distributions that the collectionis a member of.
Distributing a historical collection to a new managed systemAfter a new managed system is added to your managed environment, datacollection begins immediately if the new managed system is assigned to amanaged system group that a collection definition is distributed to or if thedata collection method is to Managing System (TEMS) and the newmanaged system connects to the Tivoli Enterprise Monitoring Server thatwas specified.
For example, a new Linux managed system is automatically assigned tothe *LZ_SYSTEM predefined managed system group. If the historicalcollection is distributed to *LZ_SYSTEM, then historical data collectionbegins on the new managed system. Otherwise, you must add the newmanaged system to the historical collection distribution directly, to amanaged system group that the collection is distributed to, or to thedistribution of a historical configuration group that the historical collectionis a member of.
Effect of editing a managed system group on the historical collectionWhen a managed system group gets updated, which is typically when aconstituent managed system is removed or a managed system is added,any historical collection that includes that group is redistributed to allmanaged systems in the group and collection is restarted.
The redistribution and restarting of data collection can result in some gapsin the data if the collection interval is frequent, because collection isaligned with time boundaries. For example, if the collection interval is 15minutes and collection was started at 3:16, the first sampling is at 3:30; or
212 IBM Tivoli Monitoring: Tivoli Enterprise Portal User's Guide
if the last collection was at 4:15 and an update to the managed systemgroup causes the 4:30 collection to be missed, the next data collection takesplace at 4:45.
Multiple collection definitions for the same attribute group
You can create another copy of a collection definition for an attributegroup, then configure the copy for different values for any of these criteria:collection interval, warehouse interval, managed system distribution, orattribute filtering. What remains the same for every historical collectionthat is defined for an attribute group, however, is the Collection Location(TEMA or TEMS) and the settings for Summarization and Pruning.
To illustrate some of the possibilities, here is an example of three collectiondefinitions for the Process attribute group:v Process transaction servers has a 1-minute collection interval, a 1-hour
warehousing interval, and is distributed to a few critical servers.v Process database servers has a 15-minute collection interval, data
warehousing every 12 hours, and is distributed to database servers.v Process staff systems has a 1-hour collection interval, data warehousing
every 24 hours, and is distributed to a general use group of managedsystems.
The original and the two copied collection definitions have their short-termhistory files saved at the same place (TEMA or TEMS) and follow the samesummarization and pruning schedule.
As stated earlier, it is important for you to develop a way to organize howmanaged systems are assigned to historical distributions. When youCreate another collection, the managed system distribution from theoriginal collection definition is not copied from the original collection. Thisis to help ensure that you do not assign the same managed systems toother collection definitions for the attribute group. If you do, historical datasamples will be taken for each collection definition, a symptom of which isthe occurrence of duplicate rows in a table view. Group functions, such asaverages, will have skewed results also. If this happens, use the CLI tacmdhistListCollections (see IBM Tivoli Monitoring Command Reference(http://publib.boulder.ibm.com/infocenter/tivihelp/v15r1/topic/com.ibm.itm.doc_6.2.3fp1/itm623fp1_cmdref.htm)) to list the historicalcollection distributions, then remove the managed system reference fromall but one of the collections for the attribute group.
Historical attribute groupsSome attributes groups, such as Situation Status and Windows Event Log,are historical in nature and show all their entries without your having tospecify a time span. You do not need to configure history collection forthese attribute groups unless you want to roll off to a data warehouse orlimit the data reported.
Configurable elements of collections for an attribute group and theirdependencies
Summarization and pruning is configured by attribute group; not by thecollection definitions, and can be configured independently of collectiondefinitions.
Collection interval, the frequency that data samples are taken at themanaged system and saved to the short-term history file, can be differentfor each collection definition.
Chapter 8. Historical reporting 213
Collection location for the short-term history file can be at the managedsystem or the monitoring server it connects to. There is one short-termhistory file for an attribute group per managed system; whatever was setfor the first collection is used by all collection definitions for that attributegroup.
Warehouse interval, for controlling how often historical data is copiedfrom the short-term history file to the data warehouse, can be setdifferently for each collection definition.
Distribute to Managed System (Agent) or Managing System (TEMS)can be set differently for each collection definition.
When this is set to Managing System, distribution is to all managed systemsconnected to the monitoring server; the ability to selectively distribute thecollection on managed systems is disabled.
When this is set to Managed System, you have the option of assigningmanaged systems to the individual collection definition in the Distributiontab or to a historical configuration group that the collection is a member ofor both. And managed systems can be assigned individually or as amanaged system group.
Filter criteria for preventing the collection of unwanted data isconfigurable for each collection definition. Applying filters to historicaldata collection can help reduce network traffic and wasted disk space andcan improve summarization and pruning performance.
Be aware that filtered data collection can affect the results of trendingcalculations that are performed with chart baselining and situationmodeling and of query-based views that include historical data. Forexample, a filter to collect only rows where the process uses 80% or moreCPU means that a calculation of average values will be only of values 80%and higher, rather than of all values.
Creating a historical collectionA historical data collection specifies the attribute group to collect data from, whereto store the historical data, and other information such as the collection frequencyand distribution. Create a historical collection definition for every attribute groupthat you want to collect historical data for. You can then retrieve the historical datainto query-based views.
Before you begin
Your user ID must have Configure History permission to open the HistoryCollection Configuration window. If you do not have this permission, you will notsee the menu item or tool for historical configuration.
The CCC Logs apply to all managed systems: Agent Operations Log, ITM Audit,and Universal Messages. The Policy_Status and System_Status attributes do notrecord historical data. Typical environments do not use the EIB Change Log andSituation Status Log attribute groups.
About this task
Complete these steps for each attribute group that you want to collect historicaldata from on specified managed systems or managed system groups or on all themanaged systems that connect to a Tivoli Enterprise Monitoring Server:
214 IBM Tivoli Monitoring: Tivoli Enterprise Portal User's Guide
Procedure1. Click History Configuration to open the History Collection Configuration
window.2. Click Create a new collection. If you first click a Monitored Application
(or right-click and click ), Monitored Application will be selected for you.3. Enter a Name of up to 256 bytes. A short name is also given to the collection
and is shown in the middle section of the status bar.4. Optional: Enter a Description for the collection, up to 64 bytes.5. Select a Monitored Application from the list.6. Select an Attribute Group from the list. Not all the product attribute groups
necessarily display: only those that are appropriate for historical collection andreporting.
7. Click OK to open the configuration tabs for the collection. The branch of themonitored applications expands to show the new collection. At this point, ithas not been distributed to the managed systems.
8. Complete the fields in the Basic tab:a. Collection Interval is the frequency of data transmission to the short-term
history file on the computer where the data is saved (Tivoli EnterpriseMonitoring Agent or Tivoli Enterprise Monitoring Server). The options areevery 1, 5, 15, or 30 minutes, every hour, or once per day. The defaultinterval is 15 minutes.The shorter the interval, the faster and larger the history file grows. Thiscan overload the database, warehouse proxy, and summarization andpruning agent. For example, if you set a 1-minute collection interval forProcess data, expect the summarization and pruning for that attributegroup to take a long time. Such a short interval should be enabled for anattribute group only if it is critical in your work.
b. Collection Location is where the short-term historical data file resides: atthe TEMA (Tivoli Enterprise Monitoring Agent) or the TEMS (TivoliEnterprise Monitoring Server). The default location is TEMA, whichminimizes the performance impact on the monitoring server fromhistorical data management.If you are filtering the historical collection (step 9), collection at the TEMAalso gives you more space for composing the filter. The formula exampleat the end of this topic takes up 63% of the formula storage whencollection is set to TEMS; and 31% when collection is set to TEMA..Note, however, that TEMS might be a better choice for certainenvironments. Also, the OMEGAMON XE on z/OS product requires thatthe data be stored at the monitoring server.
c. Warehouse Interval determines whether the collected data is warehousedand how often. The options are 15 minutes, 30 minutes, 1 hour, 12 hours, 1day, or Off.A more frequent warehousing interval enables quicker availability ofwarehoused data for retrieval. Shorter intervals cause some additionalprocessing to check for and transmit newly collected data; and there aremore frequent elevated levels of transmission activity, but for shorterdurations. Regardless of the warehouse interval, the most recent 24 hoursare always available in the short-term history files. If you use TivoliCommon Reporting, note that queries are to the data warehouse only.
9. If you want to restrict the collection of samples to only those that meet certainconditions, click the Filter tab and compose the formula:a. Click Add Attributes.
Chapter 8. Historical reporting 215
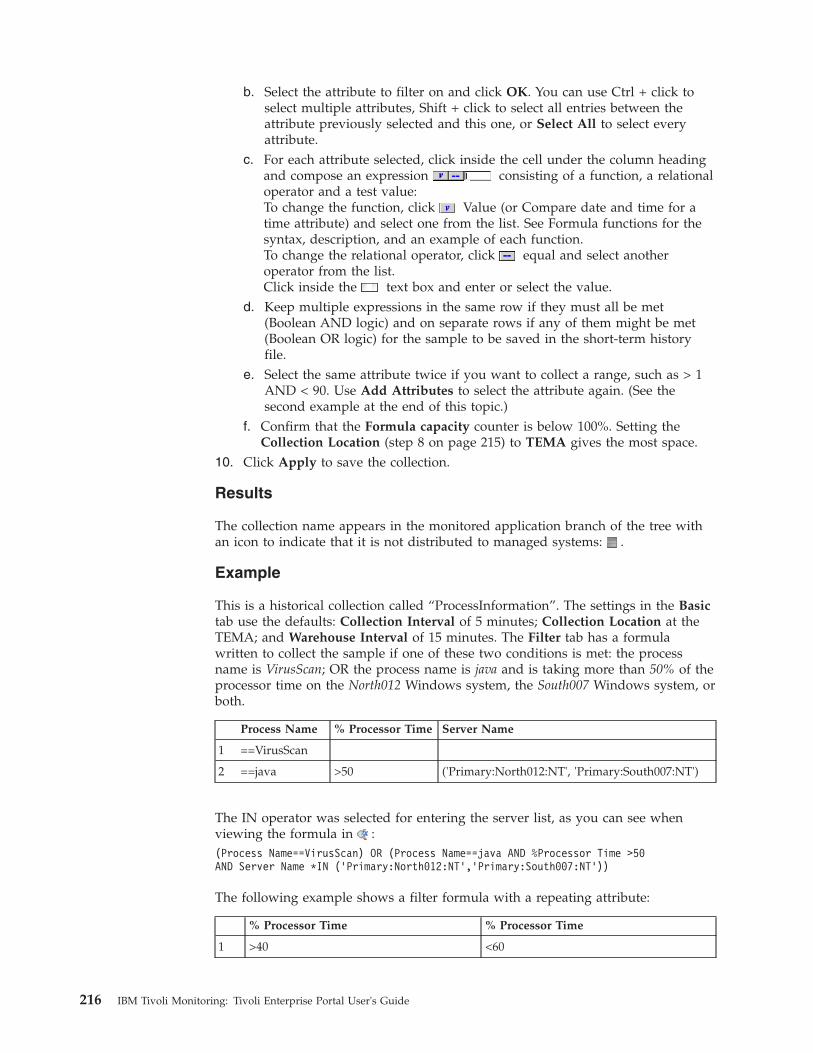
b. Select the attribute to filter on and click OK. You can use Ctrl + click toselect multiple attributes, Shift + click to select all entries between theattribute previously selected and this one, or Select All to select everyattribute.
c. For each attribute selected, click inside the cell under the column headingand compose an expression consisting of a function, a relationaloperator and a test value:To change the function, click Value (or Compare date and time for atime attribute) and select one from the list. See Formula functions for thesyntax, description, and an example of each function.To change the relational operator, click equal and select anotheroperator from the list.Click inside the text box and enter or select the value.
d. Keep multiple expressions in the same row if they must all be met(Boolean AND logic) and on separate rows if any of them might be met(Boolean OR logic) for the sample to be saved in the short-term historyfile.
e. Select the same attribute twice if you want to collect a range, such as > 1AND < 90. Use Add Attributes to select the attribute again. (See thesecond example at the end of this topic.)
f. Confirm that the Formula capacity counter is below 100%. Setting theCollection Location (step 8 on page 215) to TEMA gives the most space.
10. Click Apply to save the collection.
Results
The collection name appears in the monitored application branch of the tree withan icon to indicate that it is not distributed to managed systems: .
Example
This is a historical collection called “ProcessInformation”. The settings in the Basictab use the defaults: Collection Interval of 5 minutes; Collection Location at theTEMA; and Warehouse Interval of 15 minutes. The Filter tab has a formulawritten to collect the sample if one of these two conditions is met: the processname is VirusScan; OR the process name is java and is taking more than 50% of theprocessor time on the North012 Windows system, the South007 Windows system, orboth.
Process Name % Processor Time Server Name
1 ==VirusScan
2 ==java >50 ('Primary:North012:NT', 'Primary:South007:NT')
The IN operator was selected for entering the server list, as you can see whenviewing the formula in :(Process Name==VirusScan) OR (Process Name==java AND %Processor Time >50AND Server Name *IN (’Primary:North012:NT’,’Primary:South007:NT’))
The following example shows a filter formula with a repeating attribute:
% Processor Time % Processor Time
1 >40 <60
216 IBM Tivoli Monitoring: Tivoli Enterprise Portal User's Guide
What to do next
After creating a new collection definition, you must distribute it to the managedsystems where you want to take data samples. You can assign the managedsystems to distribute the collection to in the Distribution tab or assign thecollection to a historical configuration group that has a distribution. If you are notready to distribute the collection, you can do so at a later time.
If you added a filter to restrict the collection data samples to samples that meet thecriteria, test the formula to make sure that the intended data is being collected. It ispossible to enter an incorrect value, which might result in no data being collected.To test the filter formula, wait until enough historical data has been collected toshow in a historical table view of the attributes. Then set a time span for the tableview. If no rows are retrieved to the table view, review the filter formula fortypographical or value errors.Related concepts:Managed system groups
Distributing a historical collectionDistribute a historical collection definition to the managed systems that you wantto save data samples from. Data collection begins as soon as you save thedistribution. Edit the distribution list whenever you want to start or stop historicalsampling on certain managed systems or managed system groups.
Before you begin
After you create a new historical collection definition or create another, the nextstep is to select the distribution method (Managed System or Managing System)and assign managed systems to the distribution list.
About this task
Take these steps to create or edit the managed system distribution for a historicalcollection definition:
Procedure1. If the History Collection Configuration window is not open, click History
Configuration, click the Monitored Application, then click the historicalcollection definition that you want to distribute.
2. Click the Distribution tab and select the distribution method:v Managed System (Agent) to select managed systems and managed
system groups individually. You can also add the collection definition to ahistorical configuration group to adopt the group's distribution.
v Managing System (TEMS) to select all the agents that connect to thismonitoring server. This method makes the collection ineligible for inclusionin a historical configuration group.
In the following example, if you chose distribution by managed system (agent),you could select any of the agents to distribute the collection to; if you chosedistribution by managing system (TEMS), selecting the East Tivoli EnterpriseMonitoring Server distributes the collection to the 1, 2, and 4 agents and youcannot remove any of them or add agents from the West monitoring server.
Chapter 8. Historical reporting 217
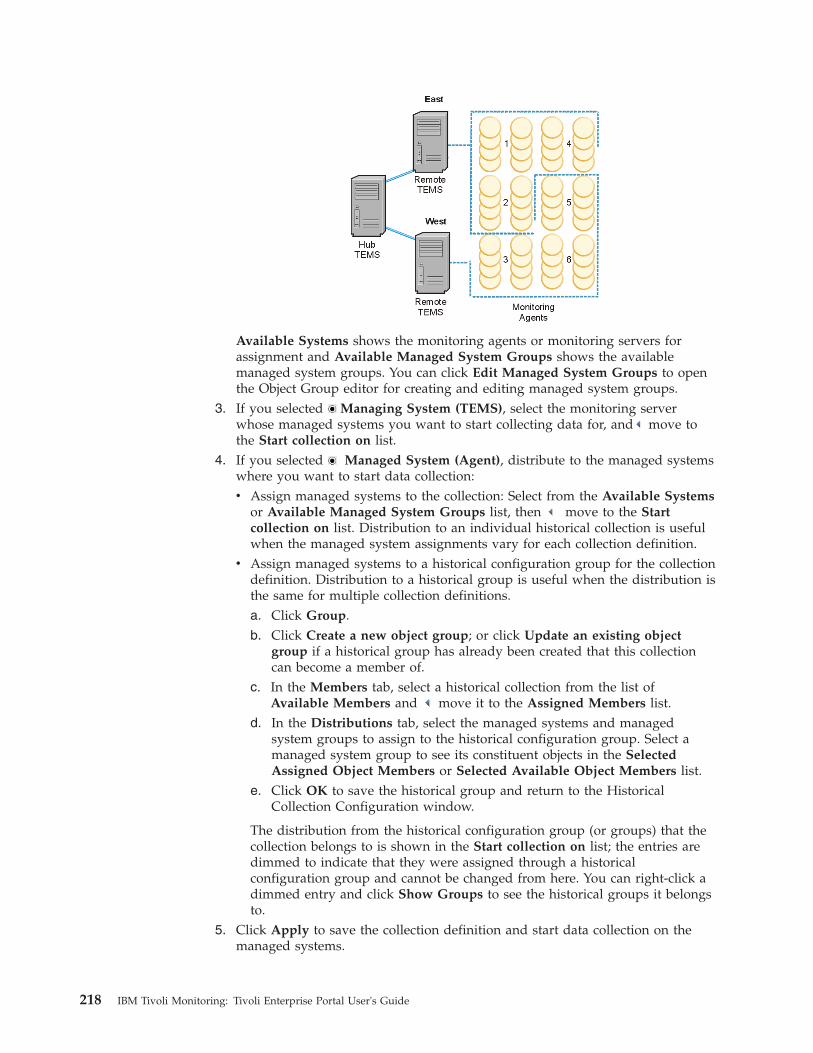
Available Systems shows the monitoring agents or monitoring servers forassignment and Available Managed System Groups shows the availablemanaged system groups. You can click Edit Managed System Groups to openthe Object Group editor for creating and editing managed system groups.
3. If you selected Managing System (TEMS), select the monitoring serverwhose managed systems you want to start collecting data for, and move tothe Start collection on list.
4. If you selected Managed System (Agent), distribute to the managed systemswhere you want to start data collection:v Assign managed systems to the collection: Select from the Available Systems
or Available Managed System Groups list, then move to the Startcollection on list. Distribution to an individual historical collection is usefulwhen the managed system assignments vary for each collection definition.
v Assign managed systems to a historical configuration group for the collectiondefinition. Distribution to a historical group is useful when the distribution isthe same for multiple collection definitions.a. Click Group.b. Click Create a new object group; or click Update an existing object
group if a historical group has already been created that this collectioncan become a member of.
c. In the Members tab, select a historical collection from the list ofAvailable Members and move it to the Assigned Members list.
d. In the Distributions tab, select the managed systems and managedsystem groups to assign to the historical configuration group. Select amanaged system group to see its constituent objects in the SelectedAssigned Object Members or Selected Available Object Members list.
e. Click OK to save the historical group and return to the HistoricalCollection Configuration window.
The distribution from the historical configuration group (or groups) that thecollection belongs to is shown in the Start collection on list; the entries aredimmed to indicate that they were assigned through a historicalconfiguration group and cannot be changed from here. You can right-click adimmed entry and click Show Groups to see the historical groups it belongsto.
5. Click Apply to save the collection definition and start data collection on themanaged systems.
218 IBM Tivoli Monitoring: Tivoli Enterprise Portal User's Guide
Results
The collection shows in the tree as distributed to indicate that data collection istaking place on the assigned managed systems.
What to do next
Click the monitored application name in the tree and, in the right frame, findthe attribute group for the collection that you just configured. The attribute groupis prefixed with a Data collection started icon.
If the collection definition has a warehouse interval, you need to configuresummarization and pruning for the attribute group if you have not already doneso.
After historical data samples have been saved to the short-term history files, youcan create query-based views and select a time span of historical data to display.
After data collection has begun, the Distribution method radio buttons aredisabled. If you want to enable them to change the distribution method, you mustfirst remove the current distributions as described in the topic, “Changing theDistribution Method”.Related tasks:Creating a managed system group
Configuring summarization and pruning for attribute groupsConfigure summarization and pruning for the Tivoli Data Warehouse to aggregatedata and keep the database size at a manageable level.
Before you begin
The summarization and pruning agent must be installed, configured, and startedas described in the IBM Tivoli Monitoring Installation and Setup Guide.
Your user ID must have Configure History permission to open the HistoryCollection Configuration window. If you do not have this permission, you will notsee the menu item or tool for historical configuration.
About this task
Although summarization and pruning is not mandatory for warehoused data, itkeeps the database from growing to an unwieldy size and minimizes the amountof data that gets retrieved to the Tivoli Enterprise Portal. Even if data collection foran attribute group has not been configured, you can set up summarization andpruning. If no collections have been created and distributed for an attribute group,no data goes to the warehouse, and summarization and pruning does not takeplace.
Procedure1. If the History Collection Configuration window is not open, click History
Configuration.2. Select a Monitored Application from the tree.
Chapter 8. Historical reporting 219
3. Review the attribute groups in the table. If summarization and pruning hasalready been configured for an attribute group, the values will be shown in thesummarization and pruning cells. Collapse the tree, drag the borders, or scrollthe table right to see all the cells.
4. Select one or more attribute groups to configure. You can select multiple groupswith Ctrl+click, or Shift+click to select all groups from the first one selected tothis point. The settings of the first group selected continue to display, regardlessof the settings in any of the other selected groups. This enables you to adjustthe configuration controls once and apply the same settings to all selectedattribute groups. Use the Clear all button if you want to clear all the fields andstart over.
5. In the Summarization area, select the check box for every time period to beaggregated: Yearly, Quarterly, Monthly, Weekly, Daily, and Hourly.
6. In the Pruning area, select the check box for every time period to be pruned:Yearly, Quarterly, Monthly, Weekly, Daily, and Hourly. If you also want to keepthe original data samples, select the Detailed data check box. In thecorresponding fields, specify the number of days, months, or years to keep thedata.
7. Click Apply to save the configuration for the attribute groups that wereselected. The summarization and pruning cells for the attribute group areupdated to reflect the new settings.
What to do next
The next time summarization and pruning takes place, the summarization andpruning agent applies the configuration to the long-term data stored in the datawarehouse. Wait for the next scheduled time period to elapse before expecting tosee any summarized data.
Creating another historical collectionAfter historical collection definitions have been created, use the History CollectionConfiguration window to create duplicates that you can customize for differentcollection intervals, warehousing intervals, and distribution.
Before you begin
Your user ID must have Configure History permission to open the HistoryCollection Configuration window. If you do not have this permission, you will notsee the menu item or tool for historical configuration.
About this task
Take these steps to copy a historical data collection:
Procedure1. Click History Configuration to open the History Collection Configuration
window.2. Click the managed application, then the collection that you want to copy.3. Click Create another collection.4. Enter a new name for the collection and, optionally, a description. The
Monitored Application and Attribute Group fields are disabled.5. Click OK to open the configuration tabs for the collection, make any changes to
the intervals, and assign the managed systems to distribute the collection to.
220 IBM Tivoli Monitoring: Tivoli Enterprise Portal User's Guide
What to do next
Other than the Collection Location, which uses what was specified for the originalcollection definition, configure the data collection just as you would a newcollection. You can change the collection and warehouse intervals, and you mustspecify the distribution.
Creating a historical configuration groupOrganize the historical collections that you have defined into named groups thatcan be managed collectively.
Before you begin
Historical configuration groups are made up of historical data collections that weredefined in the History Collection Configuration window. Create the historicalcollections that you intend to include in the historical group before opening theObject Group editor.
This feature is available when the Tivoli Enterprise Portal Server and TivoliEnterprise Monitoring Server are at Version 6.2.2 or later and the historical datacollection that you want to add to the group is configured for Managed System(Agent) as the distribution method.
About this task
Take these steps to create a historical configuration group:
Procedure1. Open the Object group editor from either of these locations:
v Click Object group editor, then click Historical configurations.v If the History Collection Configuration window, is not open, click History
Configuration. Click a monitored application, click an undistributed ordistributed historical collection definition, then click Group.
2. Click Create a new object group.3. Type a name for the historical group and, optionally, a description, then click
OK. The new historical configuration group is displayed in the Historicalconfigurations branch.
4. In the Members tab, select a historical collection from the list of AvailableMembers and move it to the Assigned Members list. You can selectmultiple collection definitions for an attribute group by holding down Ctrlwhile clicking; or use Shift+click to select all entries between this and the firstselection. Historical collections that are configured for “Managing System(TEMS)” distribution are not displayed in the list.
5. If you have historical configuration groups available and want to assign agroup to this one, click the Member of tab, then select a group and move itto the Assigned Members Of list.
6. In the Distributions tab, select the managed systems and managed systemgroups to assign to the historical configuration group. Select a managed systemgroup to see its constituent objects in the Selected Assigned Object Membersor Selected Available Object Members list.
7. Save your changes and either keep the editor open with Apply or exit withOK.
Chapter 8. Historical reporting 221
Results
The historical configuration group is now available to all users who log onto thesame portal server. Historical data samples are collected to the short-term historyfiles for the managed systems in the distribution.
When you next view the historical data collection in the History CollectionConfiguration window, the Distribution tab shows the historical configurationgroup in the Start collection on list. The group name is disabled (dimmed); youcannot remove it from the distribution. To do that, you would return to the Objectgroup editor and remove the historical collection from the historical group.Related tasks:Creating a managed system group
Stopping data collectionStop data collection on one or more managed systems for a historical collectiondefinition when you are no longer interested in gathering data on the managedsystem or would like to temporarily disable data collection.
Before you begin
Your user ID must have Configure History permission to open the HistoryCollection Configuration window. If you do not have this permission, you will notsee the tool for historical configuration.
About this task
The historical collections for an attribute group can be edited to stop datacollection on some or all of the managed systems in the distribution list. Themanaged systems that remain in the distribution continue to collect historical data.Take these steps to stop data collection on a managed system or managed systemgroup:
Procedure1. Click History Configuration to open the History Collection Configuration
window.2. Click the monitored application (agent type).3. Click the collection that the managed system is assigned to.4. For managed systems that are assigned to the historical collection:
a. Click the Distribution tab to see the managed systems, managed systemgroups, and historical object groups that collection is occurring on.
b. In the Start collection on list, click the managed systems or managedsystems groups (or both) that you want to stop collection on and movethem back to the Available list. You can also use Ctrl+click to selectmultiple items and Shift+click to select all items between the item lastselected and this one.
c. If this is a historical object group, the name is disabled as are any managedsystems and managed system groups that are assigned to the distributionthrough the historical group. Right-click a name and click Show Groupsto see the historical configuration group it was distributed to, then completethe next step.
5. For managed systems that are assigned to a historical configuration group:a. Click Group.
222 IBM Tivoli Monitoring: Tivoli Enterprise Portal User's Guide
b. Click the historical group in the Historical configurations branch.c. Click the Distributions tab.d. In the Assigned managed systems list, click the systems or groups (or both)
that you want to stop collection on and move them back to the Availablelist.
6. To save your changes, click Apply to keep the window open or OK to close it.
Results
Historical data collection no longer occurs on the managed systems that youmoved out of the Start collection on list for the historical collection definition orthat you moved out of the Assigned managed systems list for the historicalconfiguration group.
If data collection was stopped on all managed systems that were assigned to thehistorical collection, its icon changes to indicate that it is not distributed.Likewise, if data collection was stopped on all managed systems for an attributegroup, the icon that indicates data collection is started in the summarizationand pruning table no longer displays.
What to do next
If you want to verify that you removed a managed system or managed systemgroup from all historical collection definitions, you can use the tacmdhistlistcollections command to list all the collections that are started for amanaged system or managed system group.
For example, histListCollections -m Primary:BRAZIL:NT shows all historicalcollections that are started on the managed system called Primary:BRAZIL:NT. Seethe IBM Tivoli Monitoring Command Reference for more information.
If your intention is to stop data collection on all managed systems for thiscollection permanently, delete the historical collection definition; if your intention isto stop data collection for the entire attribute group, delete all the collectiondefinitions that were created for it.
Starting data collectionYou can start collection of historical data for attribute groups on selected managedsystems and whenever you have managed systems that you want to add.
Before you begin
Your user ID must have Configure History permission to open the HistoryCollection Configuration window. If you do not have this permission, you will notsee the menu item or tool for historical configuration.
About this task
After you distribute the collection definitions to managed systems, data collectionbegins automatically. If data collection has been stopped for any of the managedsystems in the distribution, complete these steps to resume collection. Completethese steps also if you want add new managed systems to the distribution.
Chapter 8. Historical reporting 223
Procedure1. Click History Configuration to open the History Collection Configuration
window.2. Click the monitored application (agent type).3. In the expanded branch, click the undistributed or distributed historical
collection that you want to start on managed systems.4. Assign managed systems to the collection or add the collection to a historical
configuration group to use its distribution. See “Distributing a historicalcollection” on page 217 for details.
5. To save the revised distribution and begin data collection on the managedsystems that you added, click Apply to keep the window open or OK to closeit.
Changing the distribution methodChange the distribution method from Managing System (TEMS) to ManagedSystem (Agent) to enable the historical collection definition to be added to ahistorical object group.
About this task
If you have upgraded to Tivoli Management Services Version 6.2.2 from a previousversion, you will see a historical collection for each attribute group that wasconfigured, and the distribution method will be as it was before: ManagingSystem (TEMS). Complete these steps if you want to change the distributionmethod for each historical collection to Managed System (Agent).
If, instead, you want to change the distribution method from Managed System toManaging System, the procedure is the same except that it can be more involved ifan entry in the Start collection on list is disabled. A disabled entry means that itwas added to the distribution as part of a historical configuration object group. Ifany of the collection belongs to one or more historical groups, you must remove itfrom any historical group that it belongs to that has a distribution before you canremove it from the Start collection on list. The topic on “Stopping data collection”has instructions for removing managed systems from the distribution of a historicalobject group.
Procedure1. If the History Collection Configuration window is not open, click History
Configuration, click the Monitored Application, then click the historicalcollection name to open the definition.
2. Click the Distribution tab.3. Select all entries in the Start collection on list, and move them to the
Available list. After clicking the first entry, you can Shift+click the last entry toselect all of them.
4. Click Apply.
What to do next
You can now assign managed systems to the distribution here or add the historicaldefinition to a historical object group to use the distribution of the group.
224 IBM Tivoli Monitoring: Tivoli Enterprise Portal User's Guide
Removing a historical data collectionUse the History Collection Configuration window to remove any unnecessaryhistorical data collection definitions.
Before you begin
Your user ID must have Configure History permission to open the HistoryCollection Configuration window. If you do not have this permission, you will notsee the menu item or tool for historical configuration.
About this task
Take these steps to remove a historical collection definition and thereby no longercollect data for the attribute group on the assigned managed systems. Be awarethat if there are multiple collection definitions for the same attribute group, youmust delete all of them before data collection will be discontinued for the attributegroup.
Procedure1. Click History Configuration to open the History Collection Configuration
window.2. Click the monitored application (agent type).3. In the expanded branch, select the historical collection that you want to
unconfigure. You can use Ctrl + click to select multiple collections or Shift +click to select all between the one previously selected and this one.
4. Click Delete collection.5. Confirm the deletion of the historical collection definition to permanently
remove it.
Results
Data collection stops for the historical collection definition on all managed systemsit was distributed to. The historical data collected up to this point continues toremain in the short-term history files and data warehouse.
Chapter 8. Historical reporting 225

226 IBM Tivoli Monitoring: Tivoli Enterprise Portal User's Guide
Chapter 9. Navigator views for logical organization
Create custom Navigator views to organize your monitored environment intological hierarchical groupings. You can also create Navigator views and buildworkspaces that are targeted for specific points of view, such as executive,operator, or subject matter expert for an application domain.
The Navigator editor enables you to create new Navigator views and build ahierarchical structure by creating new child items as branches in the tree andsharing items from a source Navigator view with the new (target) view. You canassign managed system groups to dynamically update Navigator items wheneverthe group is edited.
Custom Navigator view characteristicsCustom Navigator views and the Navigator Physical view have characteristics thatdistinguish them from one another. Understanding these distinctions and thecustomization options can help you design the most effective Navigator views.
Navigator Physical viewThe Navigator Physical view is the default Navigator view. It shows yourmonitored enterprise as a physical mapping of managed systems by theirnode names and operating systems. The Navigator Physical view is adiscovered view: as managed systems are added to the monitoredenvironment, the Tivoli Enterprise Portal Server discovers them anddisplays them in the Navigator view.
As well as showing the physical hierarchy of your environment, theNavigator gives you visual indication of situation events that occur onmanaged systems associated with a Navigator item and organizes yourworkspaces.
You can create situations and associate them with the Navigator itemswhere you want to see alert indicators and you can create workspaces andreport data from the managed systems assigned to that branch of the tree.But you cannot edit the Navigator Physical view itself.
Custom Navigator viewsYou can create Navigator views for logical hierarchies, such as by locationor business application. With custom Navigator views, you can createNavigator items and determine their managed system assignments. Youcan add Navigator items either by dragging and dropping them from asource Navigator view to the target view or by creating them manually.
The drag and drop method shares the item in the source and targetNavigator views. When you share an item, all managed systemassignments, workspaces, and situations associated with the source itemare applied. Future changes to one item are applied to the other. Ashared icon is displayed over the source and target Navigator item icons. Itprovides a visual reminder of the relationship so that you do notunintentionally change or delete an item from one Navigator view thatmight affect another view. You cannot change the managed systemassignments of Navigator items that were shared using the drag and dropmethod.
© Copyright IBM Corp. 2005, 2012 227
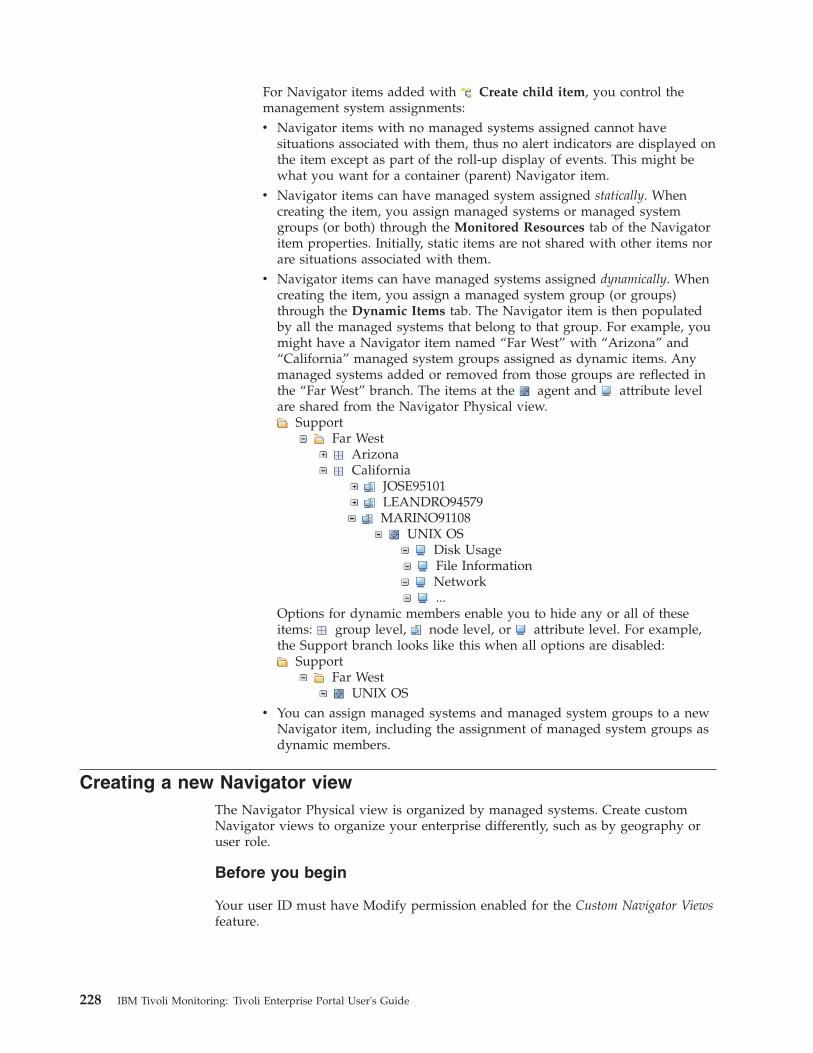
For Navigator items added with Create child item, you control themanagement system assignments:v Navigator items with no managed systems assigned cannot have
situations associated with them, thus no alert indicators are displayed onthe item except as part of the roll-up display of events. This might bewhat you want for a container (parent) Navigator item.
v Navigator items can have managed system assigned statically. Whencreating the item, you assign managed systems or managed systemgroups (or both) through the Monitored Resources tab of the Navigatoritem properties. Initially, static items are not shared with other items norare situations associated with them.
v Navigator items can have managed systems assigned dynamically. Whencreating the item, you assign a managed system group (or groups)through the Dynamic Items tab. The Navigator item is then populatedby all the managed systems that belong to that group. For example, youmight have a Navigator item named “Far West” with “Arizona” and“California” managed system groups assigned as dynamic items. Anymanaged systems added or removed from those groups are reflected inthe “Far West” branch. The items at the agent and attribute levelare shared from the Navigator Physical view.
SupportFar West
ArizonaCalifornia
JOSE95101LEANDRO94579MARINO91108
UNIX OSDisk UsageFile InformationNetwork...
Options for dynamic members enable you to hide any or all of theseitems: group level, node level, or attribute level. For example,the Support branch looks like this when all options are disabled:
SupportFar West
UNIX OSv You can assign managed systems and managed system groups to a new
Navigator item, including the assignment of managed system groups asdynamic members.
Creating a new Navigator viewThe Navigator Physical view is organized by managed systems. Create customNavigator views to organize your enterprise differently, such as by geography oruser role.
Before you begin
Your user ID must have Modify permission enabled for the Custom Navigator Viewsfeature.
228 IBM Tivoli Monitoring: Tivoli Enterprise Portal User's Guide
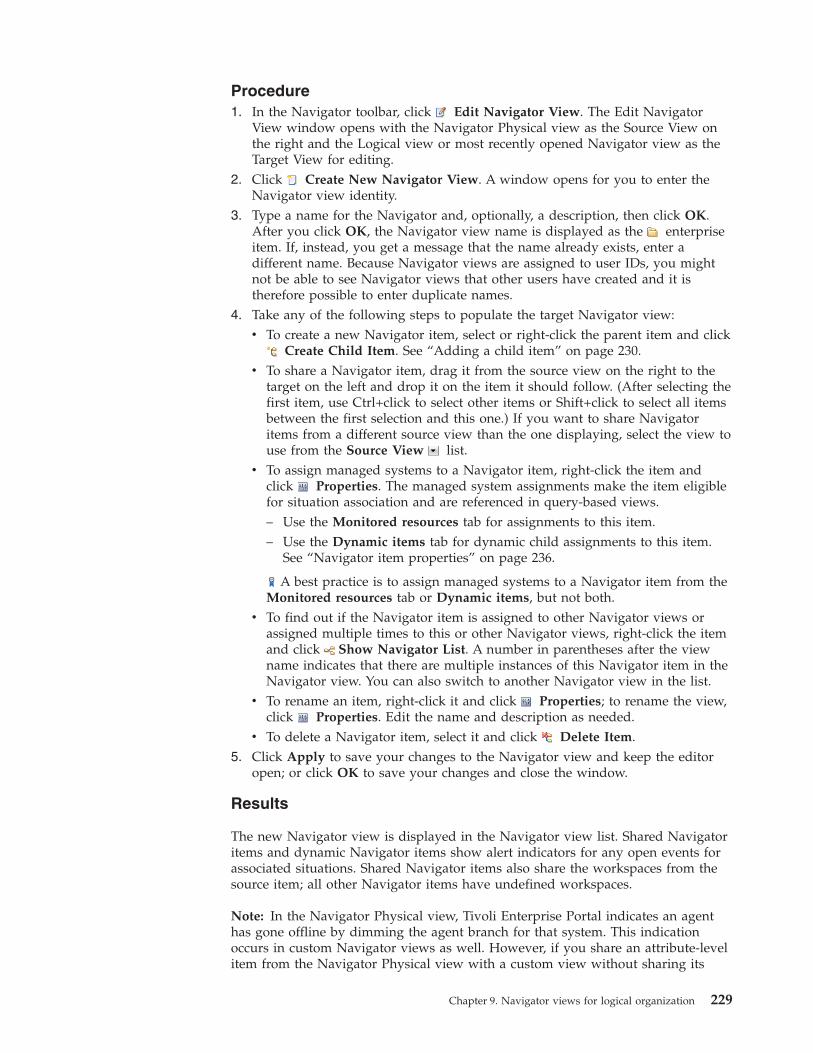
Procedure1. In the Navigator toolbar, click Edit Navigator View. The Edit Navigator
View window opens with the Navigator Physical view as the Source View onthe right and the Logical view or most recently opened Navigator view as theTarget View for editing.
2. Click Create New Navigator View. A window opens for you to enter theNavigator view identity.
3. Type a name for the Navigator and, optionally, a description, then click OK.After you click OK, the Navigator view name is displayed as the enterpriseitem. If, instead, you get a message that the name already exists, enter adifferent name. Because Navigator views are assigned to user IDs, you mightnot be able to see Navigator views that other users have created and it istherefore possible to enter duplicate names.
4. Take any of the following steps to populate the target Navigator view:v To create a new Navigator item, select or right-click the parent item and click
Create Child Item. See “Adding a child item” on page 230.v To share a Navigator item, drag it from the source view on the right to the
target on the left and drop it on the item it should follow. (After selecting thefirst item, use Ctrl+click to select other items or Shift+click to select all itemsbetween the first selection and this one.) If you want to share Navigatoritems from a different source view than the one displaying, select the view touse from the Source View list.
v To assign managed systems to a Navigator item, right-click the item andclick Properties. The managed system assignments make the item eligiblefor situation association and are referenced in query-based views.– Use the Monitored resources tab for assignments to this item.– Use the Dynamic items tab for dynamic child assignments to this item.
See “Navigator item properties” on page 236.
A best practice is to assign managed systems to a Navigator item from theMonitored resources tab or Dynamic items, but not both.
v To find out if the Navigator item is assigned to other Navigator views orassigned multiple times to this or other Navigator views, right-click the itemand click Show Navigator List. A number in parentheses after the viewname indicates that there are multiple instances of this Navigator item in theNavigator view. You can also switch to another Navigator view in the list.
v To rename an item, right-click it and click Properties; to rename the view,click Properties. Edit the name and description as needed.
v To delete a Navigator item, select it and click Delete Item.5. Click Apply to save your changes to the Navigator view and keep the editor
open; or click OK to save your changes and close the window.
Results
The new Navigator view is displayed in the Navigator view list. Shared Navigatoritems and dynamic Navigator items show alert indicators for any open events forassociated situations. Shared Navigator items also share the workspaces from thesource item; all other Navigator items have undefined workspaces.
Note: In the Navigator Physical view, Tivoli Enterprise Portal indicates an agenthas gone offline by dimming the agent branch for that system. This indicationoccurs in custom Navigator views as well. However, if you share an attribute-levelitem from the Navigator Physical view with a custom view without sharing its
Chapter 9. Navigator views for logical organization 229
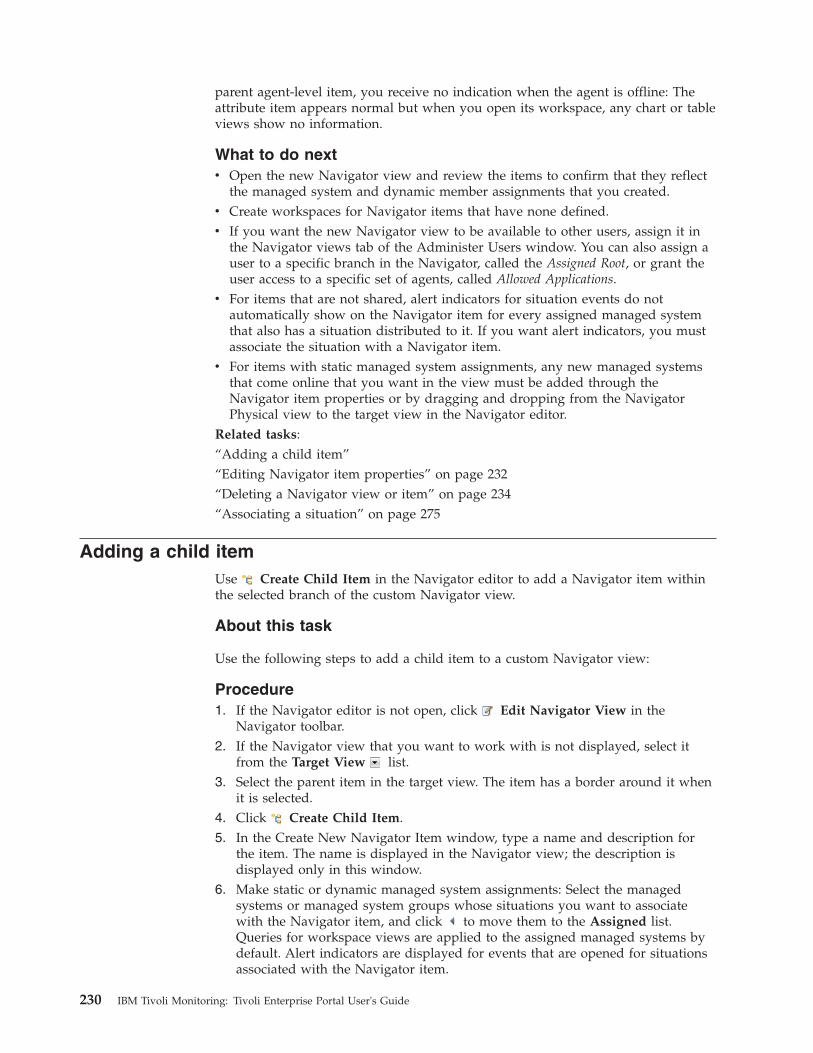
parent agent-level item, you receive no indication when the agent is offline: Theattribute item appears normal but when you open its workspace, any chart or tableviews show no information.
What to do nextv Open the new Navigator view and review the items to confirm that they reflect
the managed system and dynamic member assignments that you created.v Create workspaces for Navigator items that have none defined.v If you want the new Navigator view to be available to other users, assign it in
the Navigator views tab of the Administer Users window. You can also assign auser to a specific branch in the Navigator, called the Assigned Root, or grant theuser access to a specific set of agents, called Allowed Applications.
v For items that are not shared, alert indicators for situation events do notautomatically show on the Navigator item for every assigned managed systemthat also has a situation distributed to it. If you want alert indicators, you mustassociate the situation with a Navigator item.
v For items with static managed system assignments, any new managed systemsthat come online that you want in the view must be added through theNavigator item properties or by dragging and dropping from the NavigatorPhysical view to the target view in the Navigator editor.
Related tasks:“Adding a child item”“Editing Navigator item properties” on page 232“Deleting a Navigator view or item” on page 234“Associating a situation” on page 275
Adding a child itemUse Create Child Item in the Navigator editor to add a Navigator item withinthe selected branch of the custom Navigator view.
About this task
Use the following steps to add a child item to a custom Navigator view:
Procedure1. If the Navigator editor is not open, click Edit Navigator View in the
Navigator toolbar.2. If the Navigator view that you want to work with is not displayed, select it
from the Target View list.3. Select the parent item in the target view. The item has a border around it when
it is selected.4. Click Create Child Item.5. In the Create New Navigator Item window, type a name and description for
the item. The name is displayed in the Navigator view; the description isdisplayed only in this window.
6. Make static or dynamic managed system assignments: Select the managedsystems or managed system groups whose situations you want to associatewith the Navigator item, and click to move them to the Assigned list.Queries for workspace views are applied to the assigned managed systems bydefault. Alert indicators are displayed for events that are opened for situationsassociated with the Navigator item.
230 IBM Tivoli Monitoring: Tivoli Enterprise Portal User's Guide
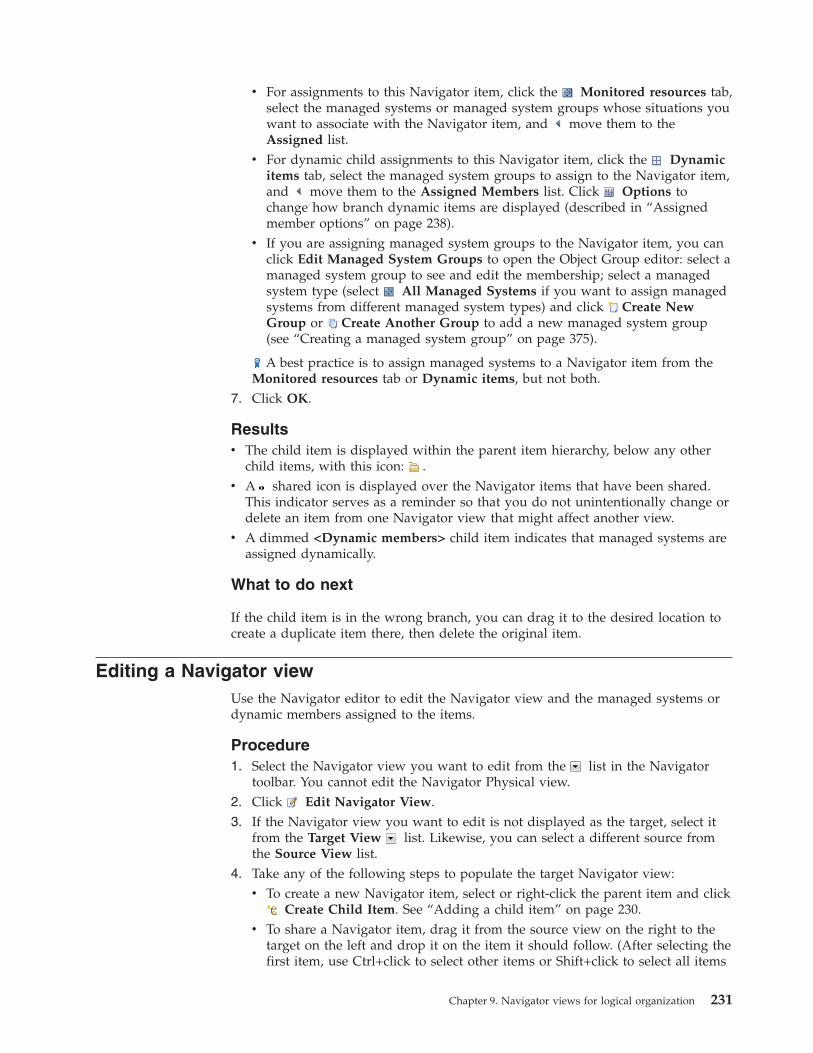
v For assignments to this Navigator item, click the Monitored resources tab,select the managed systems or managed system groups whose situations youwant to associate with the Navigator item, and move them to theAssigned list.
v For dynamic child assignments to this Navigator item, click the Dynamicitems tab, select the managed system groups to assign to the Navigator item,and move them to the Assigned Members list. Click Options tochange how branch dynamic items are displayed (described in “Assignedmember options” on page 238).
v If you are assigning managed system groups to the Navigator item, you canclick Edit Managed System Groups to open the Object Group editor: select amanaged system group to see and edit the membership; select a managedsystem type (select All Managed Systems if you want to assign managedsystems from different managed system types) and click Create NewGroup or Create Another Group to add a new managed system group(see “Creating a managed system group” on page 375).
A best practice is to assign managed systems to a Navigator item from theMonitored resources tab or Dynamic items, but not both.
7. Click OK.
Resultsv The child item is displayed within the parent item hierarchy, below any other
child items, with this icon: .v A shared icon is displayed over the Navigator items that have been shared.
This indicator serves as a reminder so that you do not unintentionally change ordelete an item from one Navigator view that might affect another view.
v A dimmed <Dynamic members> child item indicates that managed systems areassigned dynamically.
What to do next
If the child item is in the wrong branch, you can drag it to the desired location tocreate a duplicate item there, then delete the original item.
Editing a Navigator viewUse the Navigator editor to edit the Navigator view and the managed systems ordynamic members assigned to the items.
Procedure1. Select the Navigator view you want to edit from the list in the Navigator
toolbar. You cannot edit the Navigator Physical view.2. Click Edit Navigator View.3. If the Navigator view you want to edit is not displayed as the target, select it
from the Target View list. Likewise, you can select a different source fromthe Source View list.
4. Take any of the following steps to populate the target Navigator view:v To create a new Navigator item, select or right-click the parent item and click
Create Child Item. See “Adding a child item” on page 230.v To share a Navigator item, drag it from the source view on the right to the
target on the left and drop it on the item it should follow. (After selecting thefirst item, use Ctrl+click to select other items or Shift+click to select all items
Chapter 9. Navigator views for logical organization 231
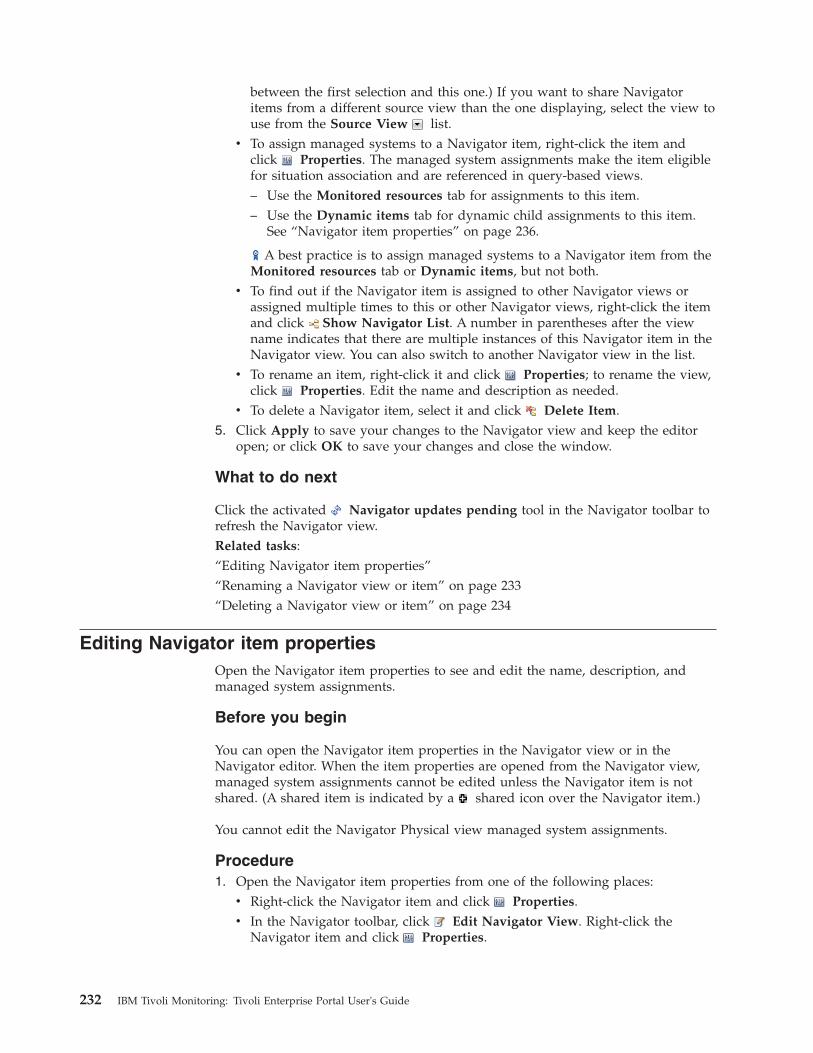
between the first selection and this one.) If you want to share Navigatoritems from a different source view than the one displaying, select the view touse from the Source View list.
v To assign managed systems to a Navigator item, right-click the item andclick Properties. The managed system assignments make the item eligiblefor situation association and are referenced in query-based views.– Use the Monitored resources tab for assignments to this item.– Use the Dynamic items tab for dynamic child assignments to this item.
See “Navigator item properties” on page 236.
A best practice is to assign managed systems to a Navigator item from theMonitored resources tab or Dynamic items, but not both.
v To find out if the Navigator item is assigned to other Navigator views orassigned multiple times to this or other Navigator views, right-click the itemand click Show Navigator List. A number in parentheses after the viewname indicates that there are multiple instances of this Navigator item in theNavigator view. You can also switch to another Navigator view in the list.
v To rename an item, right-click it and click Properties; to rename the view,click Properties. Edit the name and description as needed.
v To delete a Navigator item, select it and click Delete Item.5. Click Apply to save your changes to the Navigator view and keep the editor
open; or click OK to save your changes and close the window.
What to do next
Click the activated Navigator updates pending tool in the Navigator toolbar torefresh the Navigator view.Related tasks:“Editing Navigator item properties”“Renaming a Navigator view or item” on page 233“Deleting a Navigator view or item” on page 234
Editing Navigator item propertiesOpen the Navigator item properties to see and edit the name, description, andmanaged system assignments.
Before you begin
You can open the Navigator item properties in the Navigator view or in theNavigator editor. When the item properties are opened from the Navigator view,managed system assignments cannot be edited unless the Navigator item is notshared. (A shared item is indicated by a shared icon over the Navigator item.)
You cannot edit the Navigator Physical view managed system assignments.
Procedure1. Open the Navigator item properties from one of the following places:
v Right-click the Navigator item and click Properties.v In the Navigator toolbar, click Edit Navigator View. Right-click the
Navigator item and click Properties.
232 IBM Tivoli Monitoring: Tivoli Enterprise Portal User's Guide
2. Edit the name and description as needed. The name is shown in the Navigatorview and the description displays when you move the mouse pointer over thename in the tabbed list at the bottom of the view.
3. Edit the managed system assignments as needed. The Assigned list has noeffect on the availability of queries for the workspace, only the event indicatorsfor situations. If you have no managed systems assigned to this Navigator item,no events are displayed for it unless they are part of a roll-up display of events,and the Situation editor will not be available from the pop-up menu.v Monitored resources shows the managed systems that were assigned
through this tab or by shared Navigator items. If the Assigned list ispopulated but unavailable (dimmed), the assignments were created bysharing items from the Source Navigator view with the Target view.
v Dynamic items shows the managed system groups that were assignedthrough this tab. Use the tab to assign managed system groups to theNavigator item as dynamic members (child items) so that the Navigator itemand the items it contains are updated automatically when managed systemsare added to or removed from the managed system groups. Select a memberand click Options to change the dynamic Navigator item levels that aredisplayed in the branch.
What to do next
Click the activated Navigator updates pending tool in the Navigator toolbar torefresh the Navigator view.Related tasks:“Editing a Navigator view” on page 231
Renaming a Navigator view or itemUse the Navigator editor to rename a Navigator view or any of its Navigator itemsor to edit the description.
Procedure1. In the Navigator toolbar, click Edit Navigator View.2. If the Navigator view whose item you want to rename is not displaying, select
it from the Target View list.3. To rename the Navigator view, click Properties in the Target View toolbar.
Type the new name in the Name field, add or change the description in theDescription field, and click OK.
4. To rename a Navigator item, right-click the item and click Properties. Typethe new name in the Name field, add or change the description in theDescription field, and click OK.
Results
The Navigator view description is displayed in a flyover message box when youmove the mouse pointer over its tab; the Navigator item description isdisplayed only in this Properties window.
Chapter 9. Navigator views for logical organization 233
Related tasks:“Editing a Navigator view” on page 231
Deleting a Navigator view or itemUse the Navigator editor to delete a Navigator view or any of its Navigator items.
Before you begin
Be careful when deleting Navigator items. A shared icon is displayed over thesource and target Navigator item icons to indicate a relationship with another item.This indicator serves as a reminder of the dependency so that you do notunintentionally change or delete an item from one Navigator view that mightaffect another view. To see the Navigator views this item is assigned to, right-clickthe item and click Show Navigator List.
About this task
Complete the following steps to delete a Navigator view or item:
Procedure1. In the Navigator toolbar, click Edit Navigator View.2. If the Navigator view you want to delete or whose item you want to delete is
not displayed, select it from the Target View list.3. Take one of the following actions:
v To delete the Navigator view, click Delete Navigator View. When amessage asks if you are sure, click Yes or click No to cancel.
v To delete an item, select it and click Delete Item. When a message asks ifyou are sure, click Yes or click No to cancel.
What to do nextv If you delete the current Navigator view (the one showing when you opened
the Navigator editor), Navigator updates pending is displayed in theNavigator view toolbar. Click this tool to remove the deleted Navigator viewand open the next Navigator view.
v Deleted Navigator items are not removed from any graphic views that youhave created in workspaces for the Navigator view. You need to delete the itemsmanually from the view itself.
v When an agent is removed from the managed network, Navigator updatespending is displayed in the Navigator Physical view toolbar for you to refreshthe view. This also happens for custom Navigator views with dynamicNavigator item members. For Navigator items with no dynamic members (childitems), you must delete the agent's Navigator item to remove it from the display.
Related tasks:“Editing a Navigator view” on page 231
Navigator editor and propertiesThe Navigator editor is used to create and edit custom Navigator views and hasother dialogs to support customization. Two of these dialogs, Navigator itemproperties and Navigator List are available from two places: the current Navigatorview and the Navigator editor.
234 IBM Tivoli Monitoring: Tivoli Enterprise Portal User's Guide
Edit Navigator viewClick Edit Navigator View in the Navigator toolbar to open the Navigator editorfor creating and maintaining custom Navigator views.
The window has two frames:
Target ViewThe Target View shows the name of the Navigator view you are editing inthe left frame. When multiple Navigator views are available, you can selecta different target from the list.
Refresh nowThis refreshes the display of the target Navigator levels.
PropertiesThis opens the Properties window of the target Navigator view foryou to see and edit the Navigator name and description.
You can also right-click a Navigator item and click Properties tosee and edit the monitored resources or the dynamic items.
Create New Navigator ViewThis opens the Create New Navigator View window for adding anew Navigator view. After you have created the view, you cancreate new child items and assign managed systems (statically ordynamically) or drag items that you want to include in the viewfrom the source Navigator view and rename them as needed.
Delete Navigator ViewThis deletes the current target Navigator view.
Create Child ItemCreates a new Navigator item below the one selected in the targetview.
Delete ItemDeletes the selected Navigator item. Before deleting an item,right-click and click Show Navigator List to see if the item isrepeated in this Navigator or is in other Navigator views.
ExpandExpand a Navigator item to see the child items. A dimmed<Dynamic members> child item indicates that managed systemsare assigned dynamically.
A shared icon is displayed over the Navigator items that havebeen shared. This indicator serves as a reminder so that you do notunintentionally change or delete an item from one Navigator viewthat might affect another view.
Right frameSource View shows the name of the original Navigator view in the rightframe. Use this view to copy Navigator items to the target view. If you areediting the target view and not copying any items from this view, you canignore what is in the right frame. When multiple Navigator views areavailable, you can select a different source from the list.
Refresh nowRefreshes the display of the source Navigator levels.
PropertiesOpens the Properties window of the originating Navigator view
Chapter 9. Navigator views for logical organization 235
for you to see and edit the name and description. You cannotchange the properties of the Navigator Physical view.
Navigator item propertiesWhen you create a child item in the Navigator editor, this window opens for youto enter the identity and assign managed systems. You can also open the NavigatorItem properties in the Navigator editor or Navigator view by right-clicking aNavigator item and clicking Properties.
The item Name is displayed in the Navigator view. Enter a Description if youwant to provide more detailed information about the item and its usage. See andchange the managed system assignments in the Monitored resources andDynamic items tabs:
Monitored resourcesMonitored resources tab shows the managed systems and managed systemgroups that were assigned to the Navigator item and any that are availablefor assignment. When the items are not selectable (dimmed), it means thatthe managed system assignments were shared with the Navigator Physicalview.
AssignedShows the managed systems and managed system groups that areassigned to this Navigator item. To unassign a managed system ormanaged system group from the Navigator item, select it and
move it to the Available Managed Systems or AvailableManaged System Groups list.
Available Managed SystemsShows the managed systems that can be assigned to the Navigatoritem. To add a managed system to the Navigator item, click thename and move it to the Available Managed Systems list. Afterselecting a managed system, you can select multiples by holdingdown the Ctrl key while selecting others individually or byholding down the Shift key to select everything between.
Available Managed System GroupsNamed groups of managed systems. To assign a managed systemgroup to the Navigator item, click the name and move it to theAvailable Managed Systems list.
Click Edit Managed System Group if you want to open the Objectgroup editor for creating and modifying managed system groups.
ExampleAfter assigning managed systems to the “Eastern Region” item inthe Monitored resources tab, this is how the tree looks in theNavigator editor and in the Tivoli Enterprise Portal window afterclosing the editor:
ShippingEastern Region
Dynamic itemsThe Dynamic items tab is available for custom Navigator view items; itdoes not show for Navigator Physical view items. Use this tab to assignmanaged system groups to the Navigator item as Dynamic members (childitems) and to control how the branch is displayed.
236 IBM Tivoli Monitoring: Tivoli Enterprise Portal User's Guide
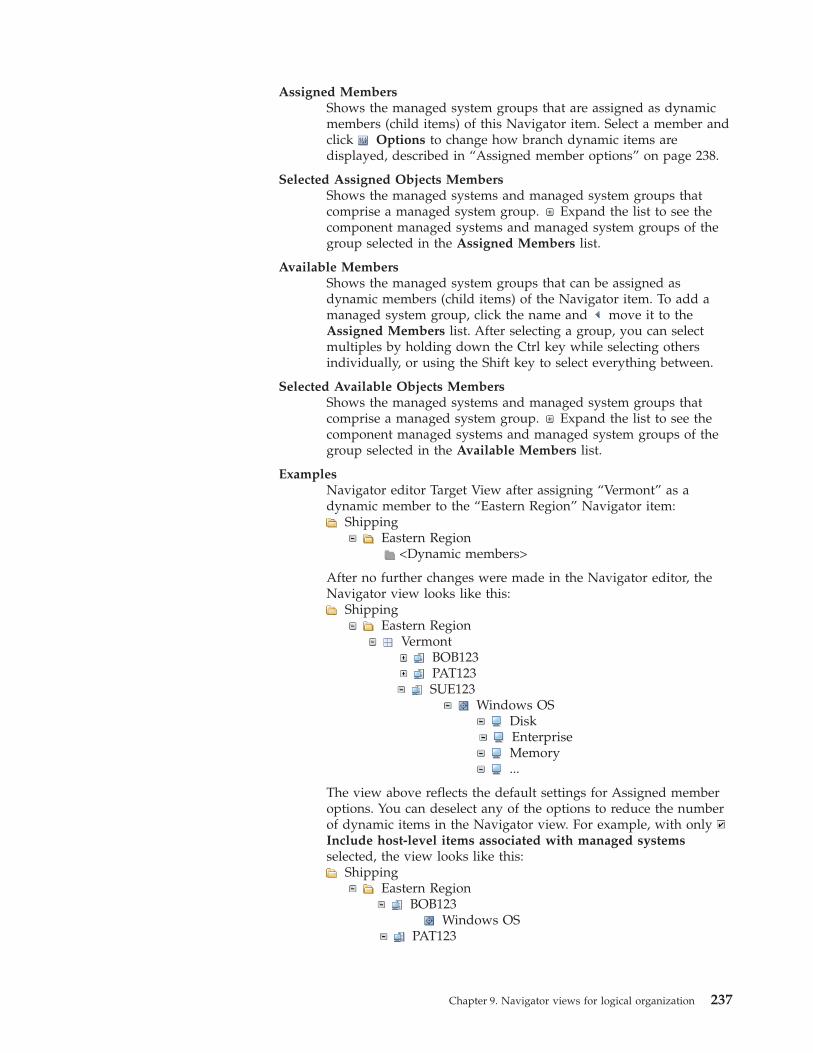
Assigned MembersShows the managed system groups that are assigned as dynamicmembers (child items) of this Navigator item. Select a member andclick Options to change how branch dynamic items aredisplayed, described in “Assigned member options” on page 238.
Selected Assigned Objects MembersShows the managed systems and managed system groups thatcomprise a managed system group. Expand the list to see thecomponent managed systems and managed system groups of thegroup selected in the Assigned Members list.
Available MembersShows the managed system groups that can be assigned asdynamic members (child items) of the Navigator item. To add amanaged system group, click the name and move it to theAssigned Members list. After selecting a group, you can selectmultiples by holding down the Ctrl key while selecting othersindividually, or using the Shift key to select everything between.
Selected Available Objects MembersShows the managed systems and managed system groups thatcomprise a managed system group. Expand the list to see thecomponent managed systems and managed system groups of thegroup selected in the Available Members list.
ExamplesNavigator editor Target View after assigning “Vermont” as adynamic member to the “Eastern Region” Navigator item:
ShippingEastern Region
<Dynamic members>
After no further changes were made in the Navigator editor, theNavigator view looks like this:
ShippingEastern Region
VermontBOB123PAT123SUE123
Windows OSDiskEnterpriseMemory...
The view above reflects the default settings for Assigned memberoptions. You can deselect any of the options to reduce the numberof dynamic items in the Navigator view. For example, with onlyInclude host-level items associated with managed systemsselected, the view looks like this:
ShippingEastern Region
BOB123Windows OS
PAT123
Chapter 9. Navigator views for logical organization 237
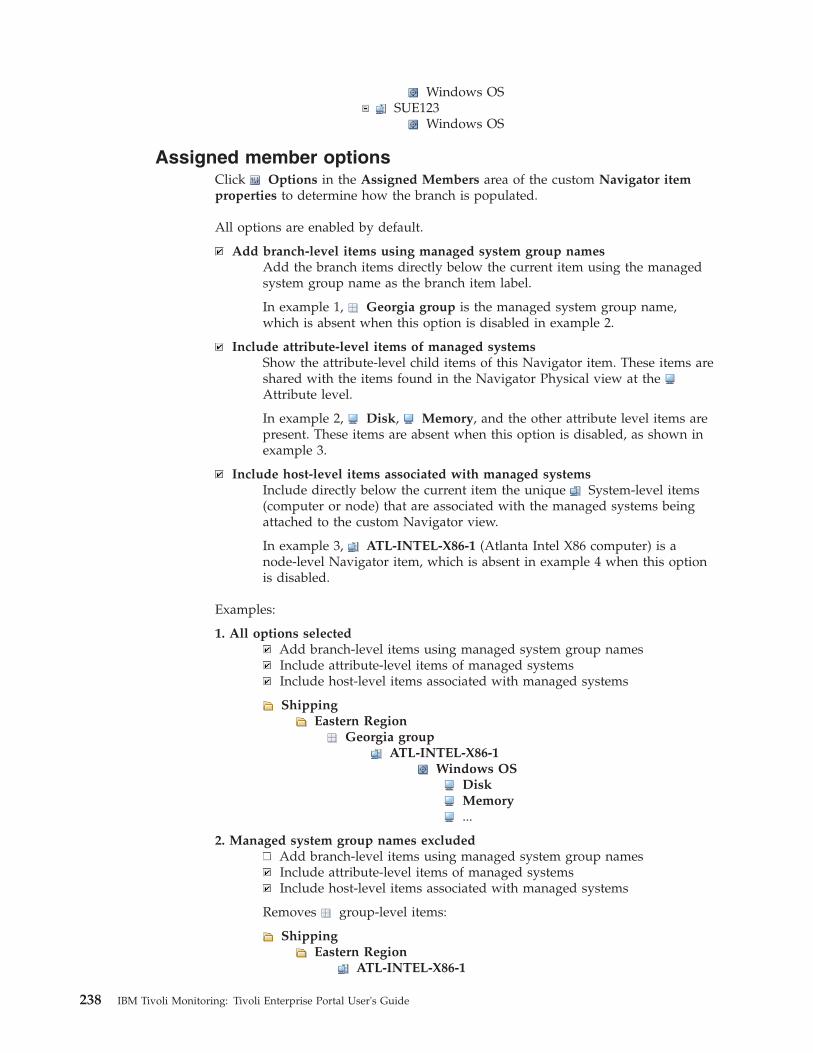
Windows OSSUE123
Windows OS
Assigned member optionsClick Options in the Assigned Members area of the custom Navigator itemproperties to determine how the branch is populated.
All options are enabled by default.
Add branch-level items using managed system group namesAdd the branch items directly below the current item using the managedsystem group name as the branch item label.
In example 1, Georgia group is the managed system group name,which is absent when this option is disabled in example 2.
Include attribute-level items of managed systemsShow the attribute-level child items of this Navigator item. These items areshared with the items found in the Navigator Physical view at theAttribute level.
In example 2, Disk, Memory, and the other attribute level items arepresent. These items are absent when this option is disabled, as shown inexample 3.
Include host-level items associated with managed systemsInclude directly below the current item the unique System-level items(computer or node) that are associated with the managed systems beingattached to the custom Navigator view.
In example 3, ATL-INTEL-X86-1 (Atlanta Intel X86 computer) is anode-level Navigator item, which is absent in example 4 when this optionis disabled.
Examples:
1. All options selectedAdd branch-level items using managed system group namesInclude attribute-level items of managed systemsInclude host-level items associated with managed systems
ShippingEastern Region
Georgia groupATL-INTEL-X86-1
Windows OSDiskMemory...
2. Managed system group names excludedAdd branch-level items using managed system group namesInclude attribute-level items of managed systemsInclude host-level items associated with managed systems
Removes group-level items:
ShippingEastern Region
ATL-INTEL-X86-1
238 IBM Tivoli Monitoring: Tivoli Enterprise Portal User's Guide
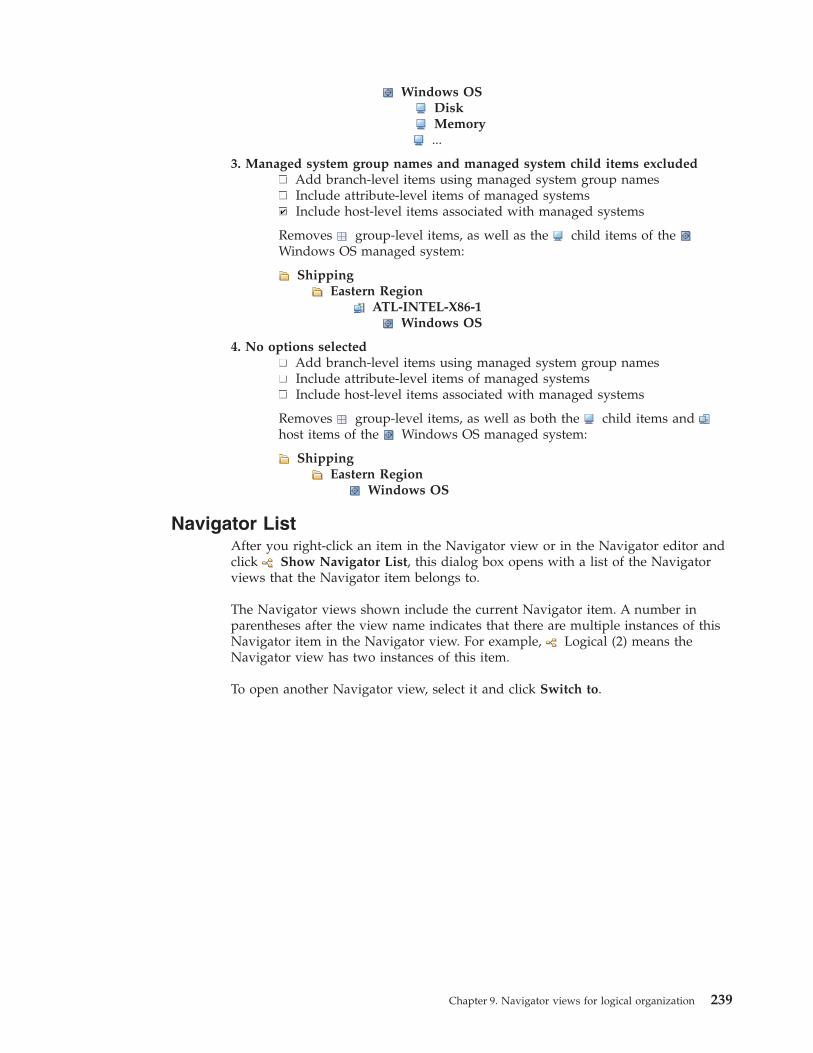
Windows OSDiskMemory...
3. Managed system group names and managed system child items excludedAdd branch-level items using managed system group namesInclude attribute-level items of managed systemsInclude host-level items associated with managed systems
Removes group-level items, as well as the child items of theWindows OS managed system:
ShippingEastern Region
ATL-INTEL-X86-1Windows OS
4. No options selectedAdd branch-level items using managed system group namesInclude attribute-level items of managed systemsInclude host-level items associated with managed systems
Removes group-level items, as well as both the child items andhost items of the Windows OS managed system:
ShippingEastern Region
Windows OS
Navigator ListAfter you right-click an item in the Navigator view or in the Navigator editor andclick Show Navigator List, this dialog box opens with a list of the Navigatorviews that the Navigator item belongs to.
The Navigator views shown include the current Navigator item. A number inparentheses after the view name indicates that there are multiple instances of thisNavigator item in the Navigator view. For example, Logical (2) means theNavigator view has two instances of this item.
To open another Navigator view, select it and click Switch to.
Chapter 9. Navigator views for logical organization 239

240 IBM Tivoli Monitoring: Tivoli Enterprise Portal User's Guide
Chapter 10. Situations for event monitoring
Situations are definitions of conditions to test, such as slow transaction rates orinvalid logon attempts. Use situations to raise alerts of certain conditions and totrigger single action commands or automated workflows.
Your user ID must have Modify Situation permission to open the Situation editorfor creating and maintaining situations.
OverviewYou can create monitoring specifications called situations to detect when specificconditions or events in your environment occur, thus raising an alert. Eachsituation is assigned to one or more managed systems that is to be monitored forspecific conditions.
Predefined situationsEvery monitoring agent comes with a set of predefined situations so thatyou can begin monitoring as soon as you begin using the Tivoli EnterprisePortal. Most of the predefined situations require you to enable them beforethey can monitor for events. This involves setting them to Run at startup ifyou want them turned on automatically with the agentYou can edit thethresholds of these situations to match your environment, as well as createyour own situations.
Situations for pure events or sampled eventsThe event that opens for a situation can be pure or sampled. When thedetermination of the event is based on observations made at specificintervals, it is known as a sampled event. When the event is based on aspontaneous occurrence, it is known as a pure event. Therefore, situationsfor sampled events have an interval associated with them, while those forpure events have no interval. Another characteristic of sampled events isthat the condition that caused the event can change, thus causing it to beno longer true. This is not the case with pure events: Pure events cannotchange. Therefore, alerts raised for sampled events can transition from trueto not true, while a pure event stays true when it occurs.
An example of a sampled situation is disk free space < 10%. The samplesituation becomes true when the available disk space falls below 10% andlater becomes false again after unneeded files are deleted and the diskspace goes to 11% or higher. A situation that monitors for an invalid userlogon attempt is a pure event: the event occurs when an invalid logonattempt is detected, and does not become a False event.
Situation editorOpen the Situation editor to see the definition of situations, edit them, orto create new situations. The Situation editor has tabs for:
Composing the condition that will trigger the situation to fire, alongwith the interval between tests and the severity of the alert indicator(such as critical or harmless). When you open or create a situation, thecolumn names that show in the formula editor are the names of theattributes being tested by the situation.
Selecting the systems to test with the situationWriting expert advice to appear in the event results workspace
© Copyright IBM Corp. 2005, 2012 241
Entering a take action command to be run on the system when thesituation fires
Specifying the severity and destination of events that are forwardedto an Event Integration Facility receiver. (Available only when the hubTivoli Enterprise Monitoring Server has been configured to forwardevents to an event server. Refer to the event integration information inthe IBM Tivoli Monitoring Installation and Setup Guide(http://publib.boulder.ibm.com/infocenter/tivihelp/v15r1/topic/com.ibm.itm.doc_6.2.3fp1/itm623FP1_install.htm).)
Adding an Until modifier to control when an open event closes: aftera period of time or when another situation is true
Situation editor opened from the toolbar (Ctrl+E) or from a Navigator itemYou can open the Situation editor from the toolbar or from the Navigatoritem pop-up menu and there is a difference. The Situation editor is exactlythe same for every aspect of the situation definition except for the fieldsfor alert indicators in the Formula tab: Sound and State This behavior isintentional. The Situation editor opened with Ctrl+E shows all thesituations in your environment, not filtered by application, and there is nocontext. Some administrators want to create many situations at one timeand associate them with Navigators later, if at all. For example, you mightwant a situation running in the background that produces no visible alerton the Navigator but that might be embedded in another situation, mightbe used to activate a policy workflow, or to perform reflex automation. Foran alert indicator to show in the Navigator, the Situation editor must beopened from the item where you want the alert.
Single-row and multiple-row attribute groupsYou can build a situation with attributes from different groups belongingto the same monitoring agent so long as the attributes are from single-rowattribute groups; one multi-row attribute group can be included.
Who can see situationsSituation definitions, both predefined and custom, are stored on the TivoliEnterprise Monitoring Server. This means that any changes to situationsmade by any user are shared with all users on the same managed networkif their user permissions include the ability to view situations and to accessthe managed application that is referenced in the situation.
Start situations manually or automaticallyBy default, situations are set to start monitoring as soon as the situation issaved and, subsequently, to start automatically when a monitoring agentthat the situation is distributed to starts again after going offline. If youdisable the Run at startup capability, you must start the situationmanually.
Even if a situation is set to Run at startup, you can stop and start the
situation manually with Start Situation and Stop Situation if youruser permissions include the ability to start and stop situations.
Even if a situation has been started manually, it can still be startedautomatically on other managed systems that connect to the samemonitoring server. For example, if the managed system is added to thedistribution after the situation was started manually, the situation startsrunning on the newly added managed system. This addition to thedistribution might be caused by any of the following conditions:v The monitoring agent came online after the situation was started.
242 IBM Tivoli Monitoring: Tivoli Enterprise Portal User's Guide
v The managed system was added to a managed system group in thesituation distribution.
v The managed system was added to a situation object group that thesituation is a member of.
Command-line InterfaceIf you are using the Tivoli Monitoring command line tacmd createSitfunction (described in the IBM Tivoli Monitoring Command Reference(http://publib.boulder.ibm.com/infocenter/tivihelp/v15r1/topic/com.ibm.itm.doc_6.2.3fp1/itm623fp1_cmdref.htm)) for situation creation,you also can use the Situation editor to validate the specified attributes.
Private situationsEnterprise monitoring agents and system monitor agents can use locallydefined situations to operate fully autonomously. These locally definedprivate situations are created in a private situation definition XML file.Private situations events come directly from the monitoring agent. Youmust place a private situation configuration file in the agent installationand restart the agent to enable this function. If you want to send an SNMPalert or EIF event when a private situation event is opened, then the SNMPtrap configuration file or EIF event configuration file must also be in theagent installation.
Private situations on an enterprise monitoring agent have no interactionwith or reporting of any kind to the monitoring server. Private situationsand enterprise situations can run concurrently.
See Private situations in the IBM Tivoli Monitoring Administrator's Guide(http://publib.boulder.ibm.com/infocenter/tivihelp/v15r1/topic/com.ibm.itm.doc_6.2.3fp1/adminuse/itm_admin.htm) for details.
Situation limitationsSee the ITM Situation Limits technote.
Opening the Situation editorThere are several places from which you can open the Situation editor, withdifferent capabilities related to the context. When the Situation editor is openedfrom the toolbar, for example, you can create situations for any agent type but youcannot associate them with Navigator items or set the event state or sound.
About this task
Open the Situation editor from one of these locations:
Procedurev Right-click a Navigator item and select Situations.
The Situations tree shows the situations associated with the Navigator item. Ifyou do not see the situation, click Situation Filter to identify a broader range.The state and sound for the situation is also associated with the Navigator item.You can give the same situation a different state and sound for differentNavigator item associations.You will not see this option at the Navigator Physical view's platform level(such as UNIX Systems).
v Click Situation Editor in the toolbar.When opened through the toolbar, the Situation editor has no connection to theNavigator. You can see all the situations available in your monitored network,
Chapter 10. Situations for event monitoring 243
you can edit or delete any of them, create new situations, and distribute them tomanaged systems. What you cannot do is associate situations with Navigatoritems or change their state or sound. This is also true when you open theSituation editor through the Manage Situations window.
v Right-click a situation in the event flyover list and select Edit Situation.The situation opens in the Situation editor so you can read the definition andedit it. You cannot associate (or disassociate) the situation with a Navigator item,nor can you change its state or sound here.
v Right-click an open event in the situation event console view and select EditSituation.The situation opens in the Situation editor so you can read the definition andedit it. You cannot associate (or disassociate) the situation with a Navigator item,nor can you change its state or sound.
v In the Manage Situations at Managed System window (opened through thepop-up menu of either the Enterprise or agent Navigator item), select asituation row and click Edit Situation.
v While editing a policy workflow in the Grapher view, right-click a situationactivity and click Edit Situation.
Filtering the situations treeWhen you open the Situation editor from anywhere except the toolbar, only thesituations associated with the current Navigator item are displayed in the Situationtree. You can filter the tree to show situations that are not associated or to see allthe situations that have been defined for the monitored application.
Before you begin
You must open the Situation editor from a Navigator item for the Set Situationfilter criteria tool to be available.
About this task
The tree lists the situations that are associated with the Navigator item (or allsituations in your monitoring environment if you opened the Situation editor fromthe toolbar). For example, if you opened the Situation editor from the EnterpriseNavigator item, you would see all the situations that are distributed and associatedwith the Tivoli Enterprise Monitoring Server; if you right-clicked a system item,you would see all situations that were distributed to that managed system. If youopen the Situation editor from a custom Navigator view, the situations are thoseassociated with the managed systems that were assigned to the Navigator item.
Take these steps to control which situations appear in the tree:
Procedure1. Click Situation Filter.2. Select any combination of these options:
244 IBM Tivoli Monitoring: Tivoli Enterprise Portal User's Guide
Option Description
Associated with Monitored Application Show all situations that were written for thistype of agent, regardless of where they aredistributed or if they are distributed. Selectthis box if you want to see situations thathave not been distributed to managedsystems.
Eligible for Association Show all situations that have beendistributed to the managed system (orsystems) assigned to this Navigator item andthat have not been associated with it. If youare planning to associate situations with thisNavigator item, select this box to see thosesituations that have not yet been associated.
Associated with this object Show all situations associated with thisNavigator item. If you are planning toassociate situations with this Navigator item,clear this check box and select Eligiblefor Association to see only those situationsthat have not yet been associated.
Results
After you click OK, the tree shows the situations specified by the filter. If theresults are not what you expected or need, return to the Show Situations windowand try another setting.
Situation editorSituations notify you when an event occurs on a managed system. Your monitoringproduct provides a set of predefined situations for your immediate use. You canview and edit these situations and create others.
The left frame of the Situation editor is a tree of the situations associated with thecurrent Navigator item or the situations of all installed monitoring products if youopened the editor from the toolbar; the right frame shows this user assistance untilyou create or select a situation.
In the situation tree, click:or Situation name to open the definition for viewing and editing. (
indicates the situation is not distributed.)Set Situation filter criteria to identify a broader range of situations to
show in the tree.Create new Situation to create a new standard situation or correlated
situation.Create another Situation to copy the selected situation, with a new
name and description.Delete Situation to permanently remove the selected situation.
After selecting or creating a situation, click:“Formula” on page 247 to see, add attributes to, and edit the formula.“Distribution” on page 249 to see and assign the managed systems
where the situation is running.“Expert Advice” on page 250 to create links to URLs or to write
instructions to be read in the event results workspace.“Action” on page 251 to send a command or a universal message as an
Chapter 10. Situations for event monitoring 245
automatic, reflexive response when the situation becomes true.“EIF” on page 253 to forward situation events to an Event Integration
Facility receiver. (Available when the Tivoli Enterprise Monitoring Serverhas been configured to forward events.)
“Until” on page 254 to specify that the event be closed after a certainperiod of time or when another situation is true.
In the situation tree pop-up menu, click:Create New situation to create a new standard situation or correlated
situation.Create Another situation to copy the selected situation, with a new
name and description.Start or Stop the situation. Be careful when stopping a situation,
because it stops on all managed systems where it is running.Delete the situation. The situation stops running on all managed
systems where it was distributed, and then is deleted.Associate the situation with the current Navigator item to enable an
alert indicator of the selected state to be applied to the Navigator itemwhen the situation is true; or Dissociate the situation from the currentNavigator item.
Enable or Disable the situation overrides that have been created forthis situation, or Remove All Overrides.
Show the situation groups that this situation is a member of.
The Situation editor buttons enable you to Apply your changes by saving andstarting the situation, and exit with (OK) or without (Cancel) saving your changes.If you plan to edit multiple situations while in the Situation editor, click Apply tosave your changes before selecting the next situation to edit or creating a new one.
Note: Open the editor from a Navigator item if you want to edit or assign a stateor sound to a situation, or if you want to associate a situation with a Navigatoritem.
Tip: If you are using the command line tacmd createSit function for situationcreation, you can use the Situation editor to validate the specified attributes.
Situation treeThe Situation editor tree shows the situations that are associated with the currentNavigator item; or it shows all situations in your monitoring environment if youopened the editor from the toolbar.
If you right-click the Enterprise item, for example, you see all the situations thatare distributed to the monitoring server; if you right-clicked a system item, you seeall situations that were distributed to that managed system. If you access the editorfrom a custom Navigator view, the products and situations shown are thoseassociated with the managed systems you have assigned to the Navigator itemthrough the Navigator properties window.
You can also show all the situations running on the operating platform (such asWindows or Linux) or specify a subset. To change what situations show in the tree,do the following:1. Click Situation Filter.2. Select any combination of the following three options. Select all three to see
every situation in your installation.
246 IBM Tivoli Monitoring: Tivoli Enterprise Portal User's Guide
Associated with Monitored Application to see all situations that werewritten for this type of agent, regardless of where they are distributed. Clearthis box if you want to see situations that have not been distributed . Whenyou return to the Situation tree, any undistributed situations have a graydisabled icon.
Eligible for Association to show all situations that have been distributedto the managed system or systems assigned to this Navigator item and thathave not been associated with it. If you are planning to associate situationswith this Navigator item, select this box to see those situations that have notyet been associated.
Associated with this object to show all situations associated with thisNavigator item. If you are planning to associate situations with thisNavigator item, clear this check box to see only those situations that havenot yet been associated.
3. Click OK to see the result of the filtering you set. If the results are not whatyou expected or need, return to the Show Situations window and try anothersetting.
FormulaThe Formula tab defines the condition that will be compared to the attributevalues sampled by the agent. If the comparison is true, an event is opened. If youopened the editor from the Navigator, you can also assign a state and a sound tothe situation.
Name The situation name can contain any UTF-8 characters and can be up to 256bytes long. The number of characters allowed varies depending on thecharacters used, because some UTF-8 characters require more than onebyte.
If you enter a character other than letters, numbers, underscores, or spacesin the situation name, a unique short name is created and shown in theSituation editor status bar and in the results of the CLI tacmd viewSit. Forexample, a situation named My #1 situation might show asZ___________310A58ACAE95465A. This does no harm and cannot be changed.The only way to change the short name is to create another situation fromthis one, give it a name with no special characters other than theunderscore, and delete the original situation.
DescriptionThe description is displayed in the Manage Situations at Managed Systemwindow and when you select the situation for embedding in anothersituation. The description contain any UTF-8 characters and can be up to64 bytes long. The number of characters allowed varies depending on thecharacters used, because some UTF-8 characters require more than onebyte.
Formula
This area shows the thresholds to be tested by the situation. Click a cellunder a column to activate the editor and enable the formula bar.
Show Formula opens a graphical view of the formula.
The active cell (and the formula bar) has three fields for building anexpression :
Chapter 10. Situations for event monitoring 247
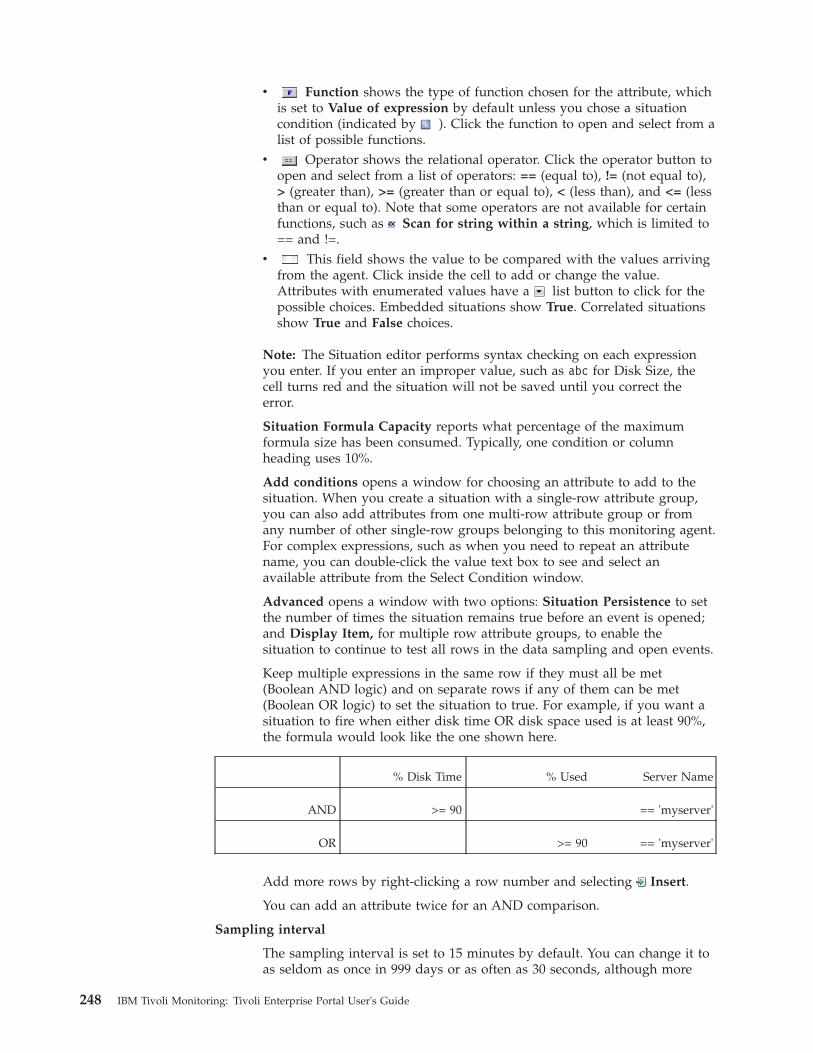
v Function shows the type of function chosen for the attribute, whichis set to Value of expression by default unless you chose a situationcondition (indicated by ). Click the function to open and select from alist of possible functions.
v Operator shows the relational operator. Click the operator button toopen and select from a list of operators: == (equal to), != (not equal to),> (greater than), >= (greater than or equal to), < (less than), and <= (lessthan or equal to). Note that some operators are not available for certainfunctions, such as Scan for string within a string, which is limited to== and !=.
v This field shows the value to be compared with the values arrivingfrom the agent. Click inside the cell to add or change the value.Attributes with enumerated values have a list button to click for thepossible choices. Embedded situations show True. Correlated situationsshow True and False choices.
Note: The Situation editor performs syntax checking on each expressionyou enter. If you enter an improper value, such as abc for Disk Size, thecell turns red and the situation will not be saved until you correct theerror.
Situation Formula Capacity reports what percentage of the maximumformula size has been consumed. Typically, one condition or columnheading uses 10%.
Add conditions opens a window for choosing an attribute to add to thesituation. When you create a situation with a single-row attribute group,you can also add attributes from one multi-row attribute group or fromany number of other single-row groups belonging to this monitoring agent.For complex expressions, such as when you need to repeat an attributename, you can double-click the value text box to see and select anavailable attribute from the Select Condition window.
Advanced opens a window with two options: Situation Persistence to setthe number of times the situation remains true before an event is opened;and Display Item, for multiple row attribute groups, to enable thesituation to continue to test all rows in the data sampling and open events.
Keep multiple expressions in the same row if they must all be met(Boolean AND logic) and on separate rows if any of them can be met(Boolean OR logic) to set the situation to true. For example, if you want asituation to fire when either disk time OR disk space used is at least 90%,the formula would look like the one shown here.
% Disk Time % Used Server Name
AND >= 90 == 'myserver'
OR >= 90 == 'myserver'
Add more rows by right-clicking a row number and selecting Insert.
You can add an attribute twice for an AND comparison.
Sampling interval
The sampling interval is set to 15 minutes by default. You can change it toas seldom as once in 999 days or as often as 30 seconds, although more
248 IBM Tivoli Monitoring: Tivoli Enterprise Portal User's Guide
frequent samplings consume more resources. Click inside the day, hour,minute or second cell and type the number or click the up and downarrows.
Note that if the situation monitors for pure events, this field is disabled;rather than sampling at specific intervals, the situation waits for a pureevent.
Sound
(Not available when you open the Situation editor through the toolbar.)
Enable, when selected, causes the sound file to play when an event isopened or reopened for this situation. Click Play to hear the sound. ClickEdit to open the sound properties for editing.
State
(Not available when you open the Situation editor through the toolbar.)
This is the state indicated when the conditions have been met and thesituation becomes true. An event indicator for the state, such as Criticalor Informational overlays the Navigator item icon. To specify a state,click the list button and select one.
Run at startup
Starts monitoring as soon as the situation is saved with Apply or OK. If amonitoring agent to which the situation is distributed goes offline, thesituation will start automatically when the agent starts again. Clear the boxif you want to start the situation manually
DistributionThe Distribution tab is where you assign the managed systems where the situationshould run. When you open the Situation editor from the Navigator item menu,the default distribution for a new situation is to the managed systems assigned tothat item.
If the managed system has multiple agents of this type, then distribution will be toall of the agents. For example, a message queue situation written for a system withthree message queues would be distributed to the three agents of this type on thesystem.
Assigned list
Shows the agents to which the situation is assigned.
Available Managed Systems
Shows the agents of the same type to which the situation can bedistributed, such as all UNIX agents for a UNIX situation. To add amanaged system to the distribution, click the name, then move it to theAssigned list.
Available Managed System Groups
Your product comes with one managed system group named for theproduct, such as *MS_SQL_SERVER for IBM Tivoli Monitoring for MS SQLServer managed systems, and you can have custom lists created throughthe Object group editor. To add a managed system list to the distribution,click the name, then move it to the Assigned list.
Chapter 10. Situations for event monitoring 249
Note: The situation tree shows a disabled icon for a situation that has not beendistributed.
Expert AdviceWhen a situation becomes true, an event indicator lights up on its associatedNavigator item. Move the mouse pointer over the indicator, and click one of theevent links to see the event results workspace, which includes Expert Advice forthe event.
For the expert advice view, you can add comments or instructions for users, usingthe built-in HTML editor, or insert a link to an existing HTML page.
Adding expert advice in HTML textThe text you enter in the expert advice view of the event results workspaceis converted to an HTML document. You can format the text, such as tobold or italicize a word, using the proper HTML code. For example, <b>bold </b> and <i> italic </i> . And you can add links, using HTMLtagging, as in <a href “http://www.ibm.com”>IBM</a> . Use Preview tocheck that your coding is correct. The limit is 512 characters. If you mustgo beyond that, consider linking to another HTML page.
Opening a web pageIf, instead of entering HTML text, you want to have a particular web pageopened automatically in the expert advice view, simply enter the URLwithout any other text. For example, if you have only http://www.ibm.comfor the expert advice text, the view will open to that website. Use Previewto test the URL.
Using conditional expressionsThe conditional expressions you can build in the Link Wizardcustomization page can also be included in expert advice using textscripting language. The syntax is very specific, so it is best to gather theattribute reference or compose the expression in the Link Wizard and copyit to the expert advice.
The conditional expressions you can build in the Link Wizardcustomization page can also be included in expert advice using textscripting language. The syntax is very specific, so it is best to gather theattribute reference or compose the expression in the Link Wizard and copyit to the expert advice. Preview to check your coding is correct and doeswhat you had intended. Example:search = INPUT(“What do you want to look for?”, “enter”);
“<BODY BGCOLOR=’#e6e6fa’>Searching database for <b>”+search+“</b>...<META HTTP-EQUIV=’refresh’ CONTENT=’1;URL=http://searchenginesite.com/search?q=”+search+“’>”
The code creates the variable search from the user's response to, What doyou want to look for? , then puts it in the URL for the search engine. TheMETA refresh tag is used to switch to the website automatically after onesecond. The INPUT function is available in the Link Wizard. Example:name = $EVENT:ATTRIBUTE.ISITSTSH.SITNAME$;node = $NODE$;
"<BODY BGCOLOR=’##FEDCEF’><div align=center><h3><i>This is expert advice for </i></h3><h2>"+name+"</h2> on "+node+ "<p>Please notify your systemadministrator that we have a <b>"+name+"</b> alert. <p>To learn more,click here: <a href=http://www.searchsite.com/search?q="+name+">IBM Tivoli Advice </a></div>"
250 IBM Tivoli Monitoring: Tivoli Enterprise Portal User's Guide
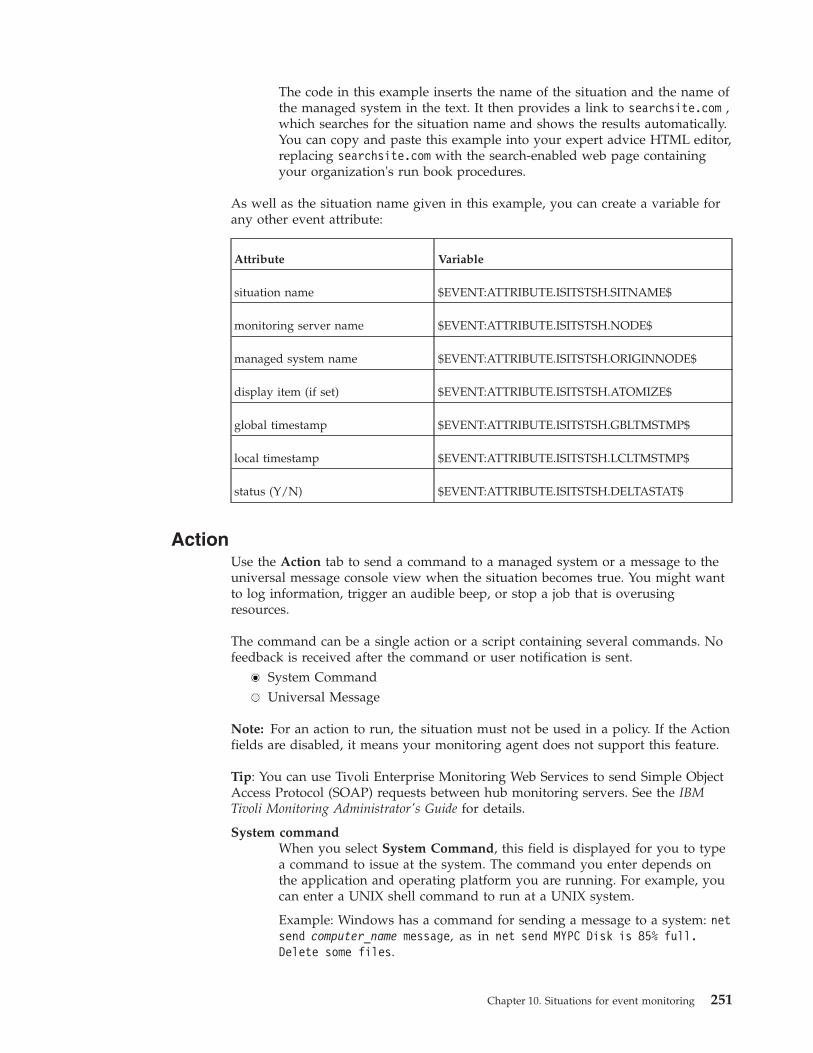
The code in this example inserts the name of the situation and the name ofthe managed system in the text. It then provides a link to searchsite.com ,which searches for the situation name and shows the results automatically.You can copy and paste this example into your expert advice HTML editor,replacing searchsite.com with the search-enabled web page containingyour organization's run book procedures.
As well as the situation name given in this example, you can create a variable forany other event attribute:
Attribute Variable
situation name $EVENT:ATTRIBUTE.ISITSTSH.SITNAME$
monitoring server name $EVENT:ATTRIBUTE.ISITSTSH.NODE$
managed system name $EVENT:ATTRIBUTE.ISITSTSH.ORIGINNODE$
display item (if set) $EVENT:ATTRIBUTE.ISITSTSH.ATOMIZE$
global timestamp $EVENT:ATTRIBUTE.ISITSTSH.GBLTMSTMP$
local timestamp $EVENT:ATTRIBUTE.ISITSTSH.LCLTMSTMP$
status (Y/N) $EVENT:ATTRIBUTE.ISITSTSH.DELTASTAT$
ActionUse the Action tab to send a command to a managed system or a message to theuniversal message console view when the situation becomes true. You might wantto log information, trigger an audible beep, or stop a job that is overusingresources.
The command can be a single action or a script containing several commands. Nofeedback is received after the command or user notification is sent.
System CommandUniversal Message
Note: For an action to run, the situation must not be used in a policy. If the Actionfields are disabled, it means your monitoring agent does not support this feature.
Tip: You can use Tivoli Enterprise Monitoring Web Services to send Simple ObjectAccess Protocol (SOAP) requests between hub monitoring servers. See the IBMTivoli Monitoring Administrator's Guide for details.
System commandWhen you select System Command, this field is displayed for you to typea command to issue at the system. The command you enter depends onthe application and operating platform you are running. For example, youcan enter a UNIX shell command to run at a UNIX system.
Example: Windows has a command for sending a message to a system: netsend computer_name message, as in net send MYPC Disk is 85% full.Delete some files.
Chapter 10. Situations for event monitoring 251
Example: UNIX has the mail command for directing messages: mail nodeuserID text.
Note: To use the ":" colon character in the command, precede it with a "\"backslash. Otherwise, the command will truncate at the ":" colon. Forexample, to specify c:\something , you would enter c\:\something .
The Attribute Substitution button brings up a window for you to choosean attribute. The attribute name you select is replaced by the actual valueduring execution of the action command. Note that attribute substitution isnot possible for correlated situations. Example:echo System: &NT_Logical_Disk.Server_Name, Disk: &NT_Logical_Disk.Disk_Name,
Space Available: &NT_Logical_Disk.%_Free%|mail userID .
This command sends an email that reads, "System: MyServer, Disk: D:,Space Available: 15
Universal messageYou can generate a universal message that can be seen in a universalmessage console view.
Category is the category the message must fall under, such as"Non-essential" or "SiteCritical". Type a one-word term of up to 16characters to categorize the message.
Severity is the importance of the message, such as "High" or "1”. Type aone-word term of up to 8 characters that conveys the severity of themessage.
Message is the text to display when the situation occurs. Type a messageof up to 245 characters. You can include an attribute value in the messageby selecting Attribute Substitution.
Attribute Substitution opens a window for choosing an attribute. Theattribute name is replaced by the actual value during execution of theaction command.
If the condition is true for more than one monitored item:v If the sampling from the monitoring server returns multiple rows of data and
more than one row satisfies the condition, you can choose to issue the commandon only the first row that meets the condition or once for each row that meetsthe condition. For example, if the situation fires when any process uses over 80%of the CPU, you can issue a command to terminate just the first process thatmeets this criteria or all processes.
Only take action on first item
Take action on each item
Note: If the situation has a Display Item set and the "Only take action on firstitem" option is selected, the action is taken once for each unique display item inthe rows of data. For example, if there were 100 total rows that qualified andthere were 6 unique display items, the situation would fire 6 times. See“Formula” on page 247 for more information on display items.
Where should the Action be run (performed):v Determines where to perform the action: on the system where the agent resides
or at the Tivoli Enterprise Monitoring Server to which it is connected.v Execute the Action at the Managed System (Agent)
252 IBM Tivoli Monitoring: Tivoli Enterprise Portal User's Guide
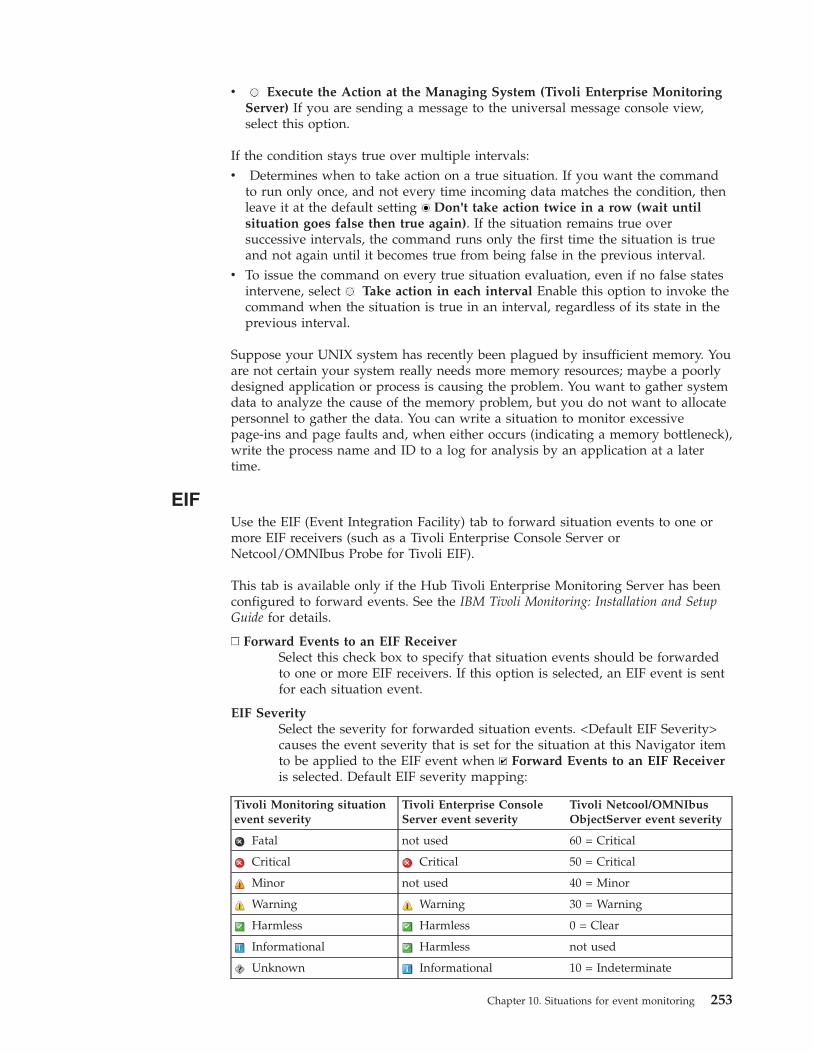
v Execute the Action at the Managing System (Tivoli Enterprise MonitoringServer) If you are sending a message to the universal message console view,select this option.
If the condition stays true over multiple intervals:v Determines when to take action on a true situation. If you want the command
to run only once, and not every time incoming data matches the condition, thenleave it at the default setting Don't take action twice in a row (wait untilsituation goes false then true again). If the situation remains true oversuccessive intervals, the command runs only the first time the situation is trueand not again until it becomes true from being false in the previous interval.
v To issue the command on every true situation evaluation, even if no false statesintervene, select Take action in each interval Enable this option to invoke thecommand when the situation is true in an interval, regardless of its state in theprevious interval.
Suppose your UNIX system has recently been plagued by insufficient memory. Youare not certain your system really needs more memory resources; maybe a poorlydesigned application or process is causing the problem. You want to gather systemdata to analyze the cause of the memory problem, but you do not want to allocatepersonnel to gather the data. You can write a situation to monitor excessivepage-ins and page faults and, when either occurs (indicating a memory bottleneck),write the process name and ID to a log for analysis by an application at a latertime.
EIFUse the EIF (Event Integration Facility) tab to forward situation events to one ormore EIF receivers (such as a Tivoli Enterprise Console Server orNetcool/OMNIbus Probe for Tivoli EIF).
This tab is available only if the Hub Tivoli Enterprise Monitoring Server has beenconfigured to forward events. See the IBM Tivoli Monitoring: Installation and SetupGuide for details.
Forward Events to an EIF ReceiverSelect this check box to specify that situation events should be forwardedto one or more EIF receivers. If this option is selected, an EIF event is sentfor each situation event.
EIF SeveritySelect the severity for forwarded situation events. <Default EIF Severity>causes the event severity that is set for the situation at this Navigator itemto be applied to the EIF event when Forward Events to an EIF Receiveris selected. Default EIF severity mapping:
Tivoli Monitoring situationevent severity
Tivoli Enterprise ConsoleServer event severity
Tivoli Netcool/OMNIbusObjectServer event severity
Fatal not used 60 = Critical
Critical Critical 50 = Critical
Minor not used 40 = Minor
Warning Warning 30 = Warning
Harmless Harmless 0 = Clear
Informational Harmless not used
Unknown Informational 10 = Indeterminate
Chapter 10. Situations for event monitoring 253
EIF ReceiversSpecify the EIF destinations for the forwarded events.
The Assigned EIF Receivers list shows the destinations to whichforwarded events will be sent, and the Available EIF Receivers list showsall of the defined EIF destinations. (EIF destinations are defined in theManage Tivoli Monitoring Services application, described in the IBM TivoliMonitoring Installation and Setup Guide, or with the tacmd createEventDestcommand, described in the IBM Tivoli Monitoring: Command Reference.)
Each destination represents one or more EIF receivers. If you move themouse pointer over an entry in the list, the hover help shows the serverand port information specified for the destination.
To add a destination, select it from the Available EIF Receivers list andthen move it to the Assigned list. (After selecting the first destination,you can use Ctrl+click to select other destinations or Shift+click to select alldestinations between the first selection and this one.)
To remove destinations from the list, select them from the Assigned EIFReceivers list and move to the Available list.
If you want to customize how situation events are mapped to EIF events,click EIF Slot Customization
Note: If you are forwarding events, when an active situation is deleted, the Stopand Delete events that are sent to the event server use the situation short nameand not the long name. This is also true for any messages that are sent to themessage log view.
UntilThe Until clause provides a way to automatically close an event by turning a truesituation to false when another situation is true or when the close interval expires.This is particularly useful for pure events that might occur frequently.
Close this Event when either occursInterval Expires When this option is cleared, the event does not close
until the situation becomes false. Select this option to close the eventautomatically after the specified interval, 15 minutes by default. To changethe interval, click inside the days, hours, minutes or seconds cell, thenadjust up or down, or type the number.
This option must be used only for Pure Events in cases where processing isoccurring outside the portal client, such as situation action commands orby an event processor like NetCool/OMNIbus. It should never be used forsampled situations. The underlying condition will continue to exist eventhough there is no indication. The event will open again only after thecondition become false and then goes back to true. For sampled situations,there are three ways to close an event:v Resolve the issuev Stop the situationv Change the situation distribution
Another Situation is TRUE, when selected, closes the event for thissituation when the selected situation is also true. The situations availableare for the same monitored application that this situation is written for orthat use the common attributes. The two events must have the same
254 IBM Tivoli Monitoring: Tivoli Enterprise Portal User's Guide
managed system names and Display Item if present in either situation.For sampled situations, after an event is closed based on the Until setting,no further events are opened even if the situation continues to evaluate totrue. The situation must evaluate to false, then true again before anotherevent is opened. However, if the situation also has persistence set (clickAdvanced in the Formula tab), and continues to be true after the event hasbeen closed, another event is opened when the persistence count haspassed.This option is designed for sampled events. It can work for pure events ifthey arrive slowly. Events arriving in sudden bursts can be reordered bythe monitoring server. In some agents a burst of activity can lead to loss ofevents. Either of those two cases will result in processing failures. As aresult any such usage must be tested extremely carefully.
Predefined situationsTivoli Monitoring products have situations that are ready to use as soon as youstart the portal client. Also provided are situations that can be applied to anymanaged system and situations for the monitoring server.
Some predefined situations are already distributed and set to start automaticallywhen the monitoring server is started. And some of those situations might not beassociated with a Navigator item, which means an event is opened when thesituation becomes true and an entry is written in the message log, but no eventindicator appears in the Navigator. Other predefined situations might not bedistributed or might not be set to run at startup.
When setting up event monitoring, review the predefined situations and determinewhich ones you would like to have run automatically and whether any thresholdvalues need to be changed. If the situation is not associated with a Navigator itemand you want an event indicator to display there when an event is opened, set thealert state and, optionally, the sound to play.
All Managed Systems situationsNo matter where you open the Situation editor from, the All Managed Systemssituations are available. Except for the MS_Offline situation, which uses theManaged Systems attributes, these predefined situations use the Local Timeattributes.
The default setting for these situations is to not Run at startup.
MS_OfflineThe managed system offline situation opens an event if one of themanaged systems gets disconnected or goes offline for some reason. It runsat one-minute intervals. When this situation is associated with theEnterprise item, any managed system in the network that goes offline willcause an event to open. The situation as it appears in Show Formula:( Status == *OFFLINE AND Reason != ’FA’)
If an event is opened for this situation, it means the agent is not connectedto its monitoring server, has stopped running, or is in error. If all theagents connected to the same monitoring server are offline, it is likely thatthe server is offline and not the agent.
NonPrimeShiftNonPrimeShift checks for times after 5 PM and before 8 AM from
Chapter 10. Situations for event monitoring 255
Mondays to Fridays. This situation is useful for embedding in a situationor policy that you want an event opened for only outside the prime shifthours. The situation as it appears in Show Formula:(Day Of Week >= Monday AND Day Of Week <= Friday AND Hours < 08) OR(Day Of Week >= Monday AND Day Of Week <= Friday AND Hours >= 17)
PrimeShiftThis situation is useful for embedding in a situation or policy that youwant an event opened for only outside the prime shift hours. The situationas it appears in Show Formula:( Status == *OFFLINE AND Reason != ’FA’)
QOMEGAMON_ONLINEThe situation as it appears in Show Formula:( Status == *OFFLINE AND Reason != ’FA’)
WeekdayThis situation is useful for embedding in a situation or policy that youwant an event opened for only outside the prime shift hours. The situationas it appears in Show Formula:( Status == *OFFLINE AND Reason != ’FA’)
WeekendThis situation is useful for embedding in a situation or policy that youwant an event opened for only outside the prime shift hours. The situationas it appears in Show Formula:( Status == *OFFLINE AND Reason != ’FA’)
Tivoli Enterprise Monitoring Server situationsThe Enterprise Navigator item has a set of predefined situations. They appearwithin the Tivoli Enterprise Monitoring Server entry of the Situation editor.
Deploy_FailedThis situation becomes true and an event is opened when one or moreagent deployments has failed. Default: Do not Run at startup. ShowFormula:( Status == Failed)
Deploy_RetryingThis situation becomes true and an event is opened when one or moreagent deployments is in the FailedRetry state, which means it has failed anattempt to deploy and is making another attempt. Default: Do not Runat startup. Show Formula:( Status == ’Failed Retrying’)
Hub_Catalog_CriticalThis situation becomes true and an event is opened when an applicationcatalog that is installed at a remote monitoring server is not installed at thehub monitoring server. This can happen when application support has notbeen selected for the hub during installation. Default: Do not Run atstartup. Show Formula:( Status == Missing At Hub) AND (Catalog != ’PDSSTATS’)
Hub_Catalog_WarningThis situation becomes true and an event is opened when an applicationcatalog that is installed at a remote monitoring server is newer than whatis installed at the hub monitoring server. This is a warning that the
256 IBM Tivoli Monitoring: Tivoli Enterprise Portal User's Guide
application support for the component is out of date. This might not be aproblem if the hub has not been upgraded yet. Default: Do not Run atstartup. Show Formula:( Status == RTEMS Newer)
Remote_Catalog_WarningThis situation becomes true and an event is opened when an applicationcatalog that is installed at the hub monitoring server is not also installed ata remote monitoring server; or an application catalog that is installed at thehub is newer than what is installed at a remote monitoring server.
This might not be a problem if the remote monitoring server has not beenupgraded yet. Also, the remote system might be intentionally notsupporting the subject application, or might only be supporting an olderversion of the application. Default: Do not Run at startup. ShowFormula:((Status == Missing At Hub) AND (Catalog != ’PDSSTATS’)) OR(Status == Hub_Newer)
TEMS_BusyThis situation becomes true and an event is opened when the TivoliEnterprise Monitoring Server is continually busy. Default: Do not Run atstartup. Show Formula:( Product == ’EM’ AND Reason == ’H’)
Creating a situationYou can create a situation to alert you of certain conditions and to trigger singleaction commands or complex automated workflows.
About this task
Take these steps to create a situation:
Procedure1. If the Situation editor is not open, open it using one of the methods described
in “Opening the Situation editor” on page 243.2. In the Situation editor, click Create new Situation.3. Type a name for the situation in the Name field and, optionally, a description
in the Description field. The name and description can contain any UTF-8characters: up to 256 bytes for the name and up to 64 bytes for the description.The maximum varies depending on the characters used because some UTF-8characters require more than one byte. If you use any special characters such aspound sign (#) or ampersand (&) in the name, a unique short name isgenerated and displayed in the Situation editor status bar and in the results ofthe CLI tacmd viewSit.
4. If this will be a standard situation, select the type of monitoring agent from theMonitored Application list and click OK.
5. If this will be a correlated situation, select Correlated Situation from the Typelist, click OK, and continue to step 5 of “Correlating situations” on page 301.
Defining the conditionDefine the condition to test for in the Situation editor Formula tab.
Chapter 10. Situations for event monitoring 257
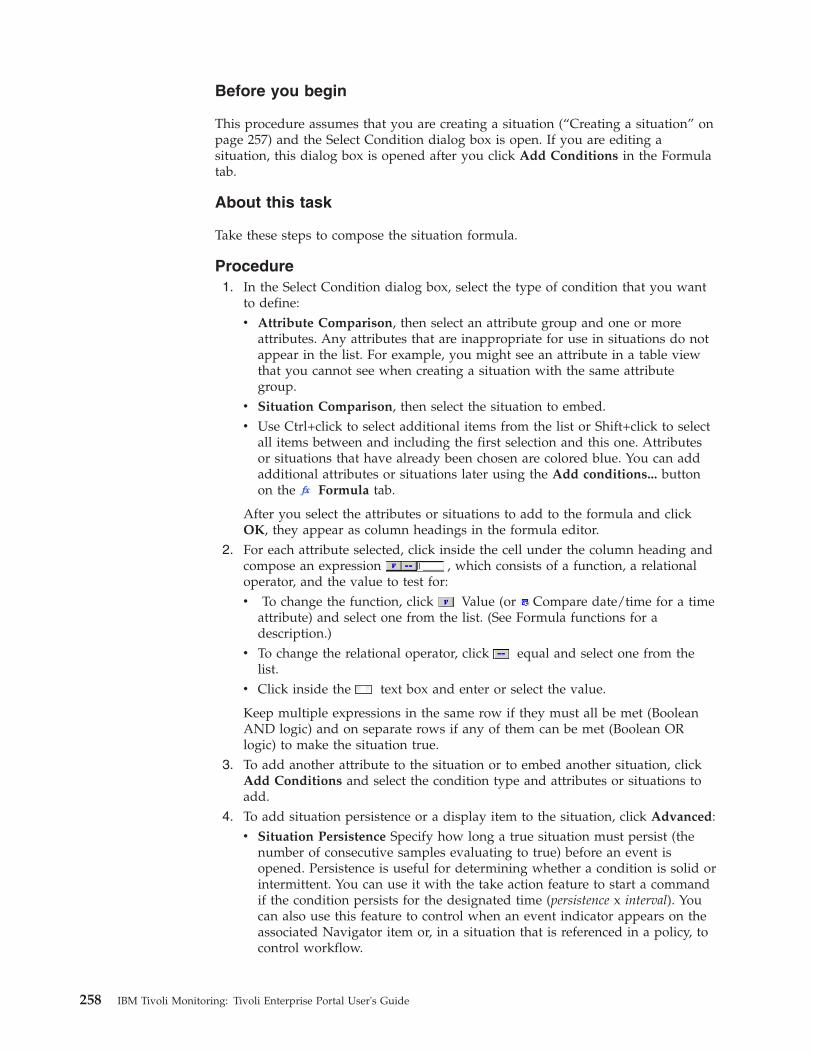
Before you begin
This procedure assumes that you are creating a situation (“Creating a situation” onpage 257) and the Select Condition dialog box is open. If you are editing asituation, this dialog box is opened after you click Add Conditions in the Formulatab.
About this task
Take these steps to compose the situation formula.
Procedure1. In the Select Condition dialog box, select the type of condition that you want
to define:v Attribute Comparison, then select an attribute group and one or more
attributes. Any attributes that are inappropriate for use in situations do notappear in the list. For example, you might see an attribute in a table viewthat you cannot see when creating a situation with the same attributegroup.
v Situation Comparison, then select the situation to embed.v Use Ctrl+click to select additional items from the list or Shift+click to select
all items between and including the first selection and this one. Attributesor situations that have already been chosen are colored blue. You can addadditional attributes or situations later using the Add conditions... buttonon the Formula tab.
After you select the attributes or situations to add to the formula and clickOK, they appear as column headings in the formula editor.
2. For each attribute selected, click inside the cell under the column heading andcompose an expression , which consists of a function, a relationaloperator, and the value to test for:v To change the function, click Value (or Compare date/time for a time
attribute) and select one from the list. (See Formula functions for adescription.)
v To change the relational operator, click equal and select one from thelist.
v Click inside the text box and enter or select the value.
Keep multiple expressions in the same row if they must all be met (BooleanAND logic) and on separate rows if any of them can be met (Boolean ORlogic) to make the situation true.
3. To add another attribute to the situation or to embed another situation, clickAdd Conditions and select the condition type and attributes or situations toadd.
4. To add situation persistence or a display item to the situation, click Advanced:v Situation Persistence Specify how long a true situation must persist (the
number of consecutive samples evaluating to true) before an event isopened. Persistence is useful for determining whether a condition is solid orintermittent. You can use it with the take action feature to start a commandif the condition persists for the designated time (persistence x interval). Youcan also use this feature to control when an event indicator appears on theassociated Navigator item or, in a situation that is referenced in a policy, tocontrol workflow.
258 IBM Tivoli Monitoring: Tivoli Enterprise Portal User's Guide
v Display Item Normally, when a situation encounters a value in a row thatmeets the condition, an event is opened and remains open across samplingintervals until the situation is no longer true. No more events for thesituation on this managed system can be opened until the event has beenclosed. However, if you set a display item for a multiple-row attributegroup, the situation continues to look at the other rows in the sampling andopens more events if other rows qualify. This optional addition to asituation also enables you to quickly distinguish events in the message logand event console views. Only certain attributes can be designated asdisplay items. Any valid display items are displayed in the list.
5. To specify how often the condition should be tested, accept the default of 15minutes in the Sampling interval field or adjust the value. This field isdisabled if the situation monitors for pure events. (Pure event occursautomatically, such as when a paper out condition occurs on the printer orwhen a new log entry is written. Situations written to notify you of pureevents wait until an event occurs rather than sampling at specific intervalsand remain true until they are manually closed or automatically closed by anUNTIL clause.)v Click inside the day, hour, minute, or second cell and type the number or
click the up and down arrows.v You can change it to as seldom as once in 999 days or as often as 30
seconds, although more frequent samplings consume more resources.6. To start the situation manually rather than automatically, clear the Run at
startup check box. By default, situations are set to start monitoring as soon asthe situation is saved and, subsequently, to start automatically when amonitoring agent that the situation is distributed to starts again after goingoffline. See Start situations manually or automatically for more information.
7. If you opened the Situation editor from a Navigator item, you can also assigna severity indicator or a sound to play when an event opens:v Assign a different severity by selecting an alert indicator from the State list.v Select a sound to play by checking Enable filename in the Sound area.
Click Edit to change the sound file or its properties. Click Play to listen tothe sound.
8. Select other tabs in the Situation editor as needed to complete the situationdefinition:v Distribute the situation to the managed systems on which you want it to
run. See “Distributing the situation” on page 261.v Add expert advice to the situation. See “Writing expert advice” on page
262.v Specify an action to take or a message to send to the Universal Message
Console when the situation is true. See “Specifying an action” on page 264v Forward events that open for this situation to an Event Integration Facility
receiver such as the Netcool/OMNIbus Probe for Tivoli EIF. See“Forwarding the event to an EIF receiver” on page 267.
v Specify how long a situation shall remain true. See “Adding an Untilmodifier” on page 266.
9. When you are finished composing the situation, save your changes and startthe situation by clicking Apply to keep the editor open; or by clicking OK toclose the Situation editor.
Chapter 10. Situations for event monitoring 259
The Situation editor performs syntax checking on each expression youenter. If you entered an improper value for an attribute, such as “abc” forDisk Size, the cell turns red and the situation will not be saved until youcorrect the error.If you opened the Situation editor from the toolbar, the situation you justcreated is not associated with any Navigator items and no event indicatoris displayed when the situation becomes true. You must associate asituation with a Navigator item or change its state and click Apply.Situations are stored at the hub Tivoli Enterprise Monitoring Server. In theunlikely event that two users attempt to save a situation with the samename simultaneously, an error occurs to ensure that one situation does notoverwrite another.
10. If the Distribution Change window is displayed, click OK to add themanaged systems shown in the Required Managed Systems list to thedistribution for this situation.
Playing sounds when an event is openedEvery situation has a state assigned to its associated Navigator item. You can alsoassign a sound file that plays whenever the situation becomes true for thisNavigator item, and you can use different sounds for different Navigator itemsassociated with the same situation.
About this task
Take the following steps to assign a sound to a situation.
Procedure1. Right-click the Navigator item to which the situation is associated and select
Situations. The Situation editor opens with the list of situations that have beenassociated with this Navigator item.
2. Select the situation to which you want to assign a sound. If you do not see thesituation in the list, click Situation Filter, then select Eligible forAssociation, and click OK.The right frame displays the Formula tab for the selected situation. In theSound area, the name of the default sound file for the state assigned to theNavigator item.
3. To use the default sound, select Enable The default sound for the stateassigned to the Navigator item will play when this situation becomes true andopens or reopens an event.
4. Click Play to hear the currently selected sound; click Edit... to select anothersound file or to edit the sound properties. Clicking Edit... opens the Soundwindow. The text field in the File area shows the name of the currently selectedfile (the default file for the state assigned to the Navigator item if no other hasbeen selected).v Click Browse to select an alternative file. Default sounds are stored in the
sound or user subdirectory on the system on which the Tivoli EnterprisePortal is installed.
v Apply any of the following options to the selected file:
Protect from Global Default overridesIf selected, this option keeps the sound file you have assigned to thissituation, even if you have selected a global option. If this option isnot selected, any applicable global sound option you have setoverrides the sound file shown here.
260 IBM Tivoli Monitoring: Tivoli Enterprise Portal User's Guide
Enable SoundIf selected, this option use the sound shown in the File field. If thisoption is not selected, no sound plays when the situation becomestrue. (You can also enable the selected file in the Sound area of theFormula tab.)
Global OptionsThis button opens the Sound - Global Options window where youcan specify options for applying the sound to all situations of thesame state or type as this one.
v Click OK to save the selections and return to the Formula tab.5. Click Apply to save your changes without closing the Situation editor, or click
OK to save the changes and close the editor.
Customizing sounds with your audio filesYou can add your own WAVeform audio format files to your Tivoli EnterprisePortal installation to customize the sound for a situation or situation type.Waveform audio is a format for storing sound in files, developed jointly byMicrosoft and IBM.
About this task
On the computer where the Tivoli Enterprise Portal Server is installed, copy yourcustom WAV files to the user subdirectory of the sound directory:
<itm_installdir>
CNB (cw on Linux or UNIX)
classes
candle
fw
resources
sounds
user
Use the Edit... button in the Sound area and then the Browse button on thesituation_name - Sound window. to select your own WAV file.
Distributing the situationThe distribution of a situation determines where it will run.
About this task
The situation tree displays when a situation is distributed, and when asituation is not distributed.
Note: If you are running multiple versions of a monitoring agent, you will be ableto distribute a situation only to the managed systems that the version supports.
Take the following steps to distribute a situation:1. In the Situation editor, select the Distribution tab.
If it is not already, open the Situation editor and select the situation whosedistribution you want to specify.
2. To add to the Assigned list, select from the Available Managed Systems orAvailable Managed System Groups, or both, and click .
Chapter 10. Situations for event monitoring 261
Available Managed Systems shows the monitoring agents to which thesituation can be distributed.Available Managed System Groups Each monitoring agent product comeswith one managed system group named for the product, such as*MS_SQL_SERVER for IBM Tivoli Monitoring for MS SQL Server managedsystems, and you can have custom lists that were created in the Objectgroup editor.
3. If you want to override the situation formula for any of the assigned managedsystems, select one or more managed systems or managed system lists from theAssigned list, and then click Override Formula.
Note: Not all situations can be overridden. If you are editing a situation thatcannot be overridden, the Override Formula button is not available.
4.
Select other tabs in the Situation editor to:v Add expert advice to the situation. See “Writing expert advice.”v Specify an action to take or a message to send to the Universal Message
Console when the situation is true. See “Specifying an action” on page 264v Forward events that open for this situation to an Event Integration Facility
receiver such as the Netcool/OMNIbus Probe for Tivoli EIF. See “Forwardingthe event to an EIF receiver” on page 267.
v Specify how long a situation shall remain true. See “Adding an Untilmodifier” on page 266.
5. When you are finished composing the situation, save your changes and startthe situation by clicking Apply to keep the editor open; or by clicking OK toclose the Situation editor.The Situation editor performs syntax checking on each expression you enter. Ifyou entered an improper value for an attribute, such as “abc” for Disk Size, thecell turns red and the situation will not be saved until you correct the error.If you opened the Situation editor from the toolbar, the situation you justcreated will not be associated with any Navigator items and no event indicatoris displayed when the situation becomes true. You must associate a situationwith a Navigator item or change its state and click Apply.Situations are stored at the hub monitoring server. In the unlikely event thattwo users attempt to save a situation with the same name simultaneously, anerror will occur, ensuring that one situation does not overwrite another.
6. If the Distribution Change window is displayed, click OK to add the managedsystems shown in the Required Managed Systems list to the distribution forthis situation.
Writing expert adviceUse the Expert Advice tab to add comments or instructions, up to 500 characters,for the user to see in the event results workspace. Or create a link to an existingpage on the web which contains relevant information.
About this task1. In the Situation editor, select the Expert Advice tab.
If it is not already open, open the Situation editor and select the situation towrite expert advice for.
2. In the HTML editor, do one of the following :v Enter comments or instructions.
262 IBM Tivoli Monitoring: Tivoli Enterprise Portal User's Guide
The text is converted to an HTML document to be viewed from the eventresults workspace. You can format the text, such as to bold or italicize aword, using the correct HTML code. For example,<b>bold</b> and <i>italics</i>
You can also add links, using HTML tagging, as in<a href "http://www.ibm.com">IBM</a>
Click Preview to check that your coding is correct.You can also include conditional expressions in the Expert Advice. Thesyntax is very specific, so it is best to gather the attribute reference or tocompose the expression in the Link Wizard and copy it to the expert advice.An expression can be a combination of literal values, references to valuesavailable from the source context, operators, and functions applied to values.Click Preview to check that your coding does what is intended.
v Open a web page.If you would like to automatically open a web page in the Expert Adviceview, enter just the URL without any other text in the HTML editor. Forexample, if the only entry in the editor ishttp://www.ibm.com, the view opensto that website. Click Preview to test the URL.
3. Select other tabs in the Situation editor to:v Distribute the situation to the managed systems on which you want it to run.
See “Distributing the situation” on page 261.v Specify an action to take or a message to send to the Universal Message
Console when the situation is true. See “Specifying an action” on page 264v Forward events that open for this situation to an Event Integration Facility
receiver such as the Netcool/OMNIbus Probe for Tivoli EIF. See “Forwardingthe event to an EIF receiver” on page 267.
v Specify how long a situation shall remain true. See “Adding an Untilmodifier” on page 266.
4. When you are finished composing the situation, save your changes and startthe situation by clicking Apply to keep the editor open; or by clicking OK toclose the Situation editor.The Situation editor performs syntax checking on each expression you enter. Ifyou entered an improper value for an attribute, such as “abc” for Disk Size, thecell turns red and the situation will not be saved until you correct the error.If you opened the Situation editor from the toolbar, the situation you justcreated will not be associated with any Navigator items and no event indicatoris displayed when the situation becomes true. You must associate a situationwith a Navigator item or change its state and click Apply.Situations are stored at the hub monitoring server. In the unlikely event thattwo users attempt to save a situation with the same name simultaneously, anerror will occur, ensuring that one situation does not overwrite another.
5. If the Distribution Change window is displayed, click OK to add the managedsystems shown in the Required Managed Systems list to the distribution forthis situation.
Example
An expression can be a combination of literal values, references to values availablefrom the source context, operators, and functions applied to values. Click Previewto check that your coding does what is intended.
Chapter 10. Situations for event monitoring 263
Search variableThe code creates the variable “search” from what the user enters whenprompted, “What do you want to look for?”, and enters that value as partof the URL for the searchenginesite.com search engine. The META 'refresh'tag is used to switch to the website automatically after one second. TheINPUT function is available in the Link Wizard.search = INPUT(“What do you want to look for?”, “enter”);”
<BODY BGCOLOR=’#e6e6fa’>Searching database for <b>”+search+"</b>...<META HTTP-EQUIV=’refresh’ CONTENT=’1; URL=http://searchenginesite.com/search?q=”+search+”’>”
Search variable with situation information includedThe code in this example inserts the name of the situation and the name ofthe managed system in the text. It then provides a link tosearchenginesite.com, which searches for the situation name and displays theresults automatically.name = $EVENT:ATTRIBUTE.ISITSTSH.SITNAME$;
node = $NODE$;"<BODY BGCOLOR=’#FFFF80’><div align=center><h3><i>This is expert advice for </i> </h3><h2>"+name+"</h2> on "+node+ "<p>Please notify your systemadministrator that <b>"+name+"</b> fired. <p>To learn more, click here:<a href=http://www.searchenginesite.com/search?q="+name+">Tivoli Advice </a>"
As well as the situation name given in the previous example above, youcan reference any other event attribute in the code:
situation name$EVENT:ATTRIBUTE.ISITSTSH.SITNAME$
monitoring server name$EVENT:ATTRIBUTE.ISITSTSH.NODE$
managed system name$EVENT:ATTRIBUTE.ISITSTSH.ORIGINNODE$
display item$EVENT:ATTRIBUTE.ISITSTSH.ATOMIZE$
global timestamp$EVENT:ATTRIBUTE.ISITSTSH.GBLTMSTMP$
local timestamp$EVENT:ATTRIBUTE.ISITSTSH.LCLTMSTMP$
status $EVENT:ATTRIBUTE.ISITSTSH.DELTASTAT$
Specifying an actionUse the Situation editor Action tab to send a command to a system or a messageto the universal message console when the situation becomes true.
You might want to log information, trigger an audible beep, or stop a job that isoverusing resources.
About this task
A take action command can be a single action or a script of many commands. TheTivoli Enterprise Portal Server receives no feedback after it sends the command ornotifies the user. To issue a command, the user ID must be authorized on therelevant system for the requested command. For example, to issue a TSO
264 IBM Tivoli Monitoring: Tivoli Enterprise Portal User's Guide
command, your user ID must be a valid TSO ID. The user ID must also be definedas a valid logon ID for the Tivoli Enterprise Portal Server. If an application prefix isused (such as MQ:), then the portal server logon ID will be used. However, forsystem level commands, the authorization of the monitoring agent will be used.
Note: The action will not be invoked if the situation is used in a policy.
Procedure1. In the Situation editor, click the Action tab. If it is not already, open the
situation editor and select the situation to which you want to specify reflexautomation.
2. Select the type of action you want to take: System Command or UniversalMessage.
3. Specify the command or message.v For a system command, write the command exactly as you would enter it
manually for the application and operating platform on which it is running.v For a universal message, write the category, severity and the text to display
in the Universal message console view.– Category of messages to see (for example, critical, warning, information),
up to 16 characters.– Severity of the message, one word of up to 8 characters, such as 1 or high.– Message text when the situation occurs, up to 256 characters.
Attribute Substitution opens a window for choosing an attribute. The attributename is replaced by the actual value during execution of the action command.Example:echo System: &NT_Logical_Disk.Server_Name, Disk: &NT_Logical_Disk.Disk_Name,
Space Available: &NT_Logical_Disk.%_Free%|mail userID.
which sends an email to the user ID indicated that reads, "System: MyServer,Disk: D:, Space Available: 15%."
4. If the condition is true for more than one monitored item, indicate when theaction should be taken:v Select Only take action on first item to issue the command on only the first
row that meets the condition.v Select Take action on each item to issue the command once for each row of
data returned that meets the condition.For example, if the situation fires when any process uses over 80% of the CPU,you can issue a command to terminate just the first process that meets thiscriteria, or you can issue a command to terminate all processes that meet thecriteria.
Note: If the situation has a Display Item set and the "Only take action on firstitem" option is selected, the action is taken once for each unique display item inthe rows of data. For example, if there were 100 total rows that qualified andthere were 6 unique display items, the situation would fire 6 times. See“Formula” on page 247 for more information on display items.
5. Specify where the action should be executed (performed):v Select Execute the Action at the Managed System to perform the action on
the system where the monitoring agent resides.v Select Execute the Action at the Managing System (TEMS) to perform the
action on the monitoring server to which the agent is connected
Chapter 10. Situations for event monitoring 265
If you are sending a Universal Message, the action takes place at themonitoring server.
6. Specify what to do if the condition stays true over multiple intervals:v Select Don't take action twice in a row to execute the command or universal
message once, and not every time incoming data matches the condition.v Select Take action in each interval to invoke the command or issue the
universal message when the situation is true in an interval, regardless of itsstate in the previous interval.
7. Select other tabs in the Situation editor to:v Distribute the situation to the managed systems on which you want it to run.
See “Distributing the situation” on page 261.v Add expert advice to the situation. See “Writing expert advice” on page 262.v Forward events that open for this situation to an Event Integration Facility
receiver such as the Netcool/OMNIbus Probe for Tivoli EIF. See “Forwardingthe event to an EIF receiver” on page 267.
v Specify how long a situation shall remain true. See “Adding an Untilmodifier.”
8. When you are finished composing the situation, save your changes and startthe situation by clicking Apply to keep the editor open; or by clicking OK toclose the Situation editor. The Situation editor performs syntax checking oneach expression you enter. If you entered an improper value for an attribute,such as “abc” for Disk Size, the cell turns red and the situation will not besaved until you correct the error.If you opened the Situation editor from the toolbar, the situation you justcreated will not be associated with any Navigator items and no event indicatoris displayed when the situation becomes true. You must associate a situationwith a Navigator item or change its state and click Apply.Situations are stored at the hub monitoring server. In the unlikely event thattwo users attempt to save a situation with the same name simultaneously, anerror will occur, ensuring that one situation does not overwrite another.
9. If the Distribution Change window is displayed, click OK to add the managedsystems shown in the Required Managed Systems list to the distribution forthis situation.
Adding an Until modifierAdd an Until modifier to control when a true situation closes: after a period oftime or when another situation is true or, if you select both, whichever occurs first.
Before you begin
When the Until modifier is for a sampled situation, the event is closed and will notreopen until the monitored condition turns false and turns true again. However,using a persistent count of 2 or more causes the event to close. But if the conditionremains true for the number of intervals equal to the persistent count, the eventwill reopen for the same condition for which it originally fired. (See step 4 on page258 in the procedure for defining the condition to read about persistence and howto set it.)
266 IBM Tivoli Monitoring: Tivoli Enterprise Portal User's Guide
About this task
This procedure assumes that you are creating or editing a situation in the Situationeditor (see “Opening the Situation editor” on page 243. Take these steps to add anUntil modifier to the situation.
Procedure1. Click the Until tab.
If it is not open already, open the Situation editor and select the situation towhich you want to specify the Until modifier.
2. Specify when you want the situation to close:v Check Another Situation is TRUE to close the event when the situation is
true and select a situation from the list.The situations available are for the same type of monitoring agent that thissituation uses or that use the IBM Tivoli Monitoring common attributes.
v Check Reset Interval Expires to close the event after the specified interval,15 minutes by default.To change the interval, click inside dd (day), hh (hour), mm (minute) or ss(second) and click the arrows to adjust up or down, or type the number.
See “Until” on page 254 for more information on choosing an option.3. Select other tabs in the Situation editor to:
v Distribute the situation to the managed systems on which you want it to run.See “Distributing the situation” on page 261.
v Add expert advice to the situation. See “Writing expert advice” on page 262.v Specify an action to take or a message to send to the Universal Message
Console when the situation is true. See “Specifying an action” on page 264v Forward events that open for this situation to an Event Integration Facility
receiver such as the Netcool/OMNIbus Probe for Tivoli EIF. See “Forwardingthe event to an EIF receiver.”
4. When you are finished composing the situation, save your changes and startthe situation by clicking Apply to keep the editor open; or by clicking OK toclose the Situation editor.The Situation editor performs syntax checking on each expression you enter. Ifyou entered an improper value for an attribute, such as “abc” for Disk Size, thecell turns red and the situation will not be saved until you correct the error.If you opened the Situation editor from the toolbar, the situation you justcreated will not be associated with any Navigator items and no event indicatoris displayed when the situation becomes true. You must associate a situationwith a Navigator item or change its state and click Apply.Situations are stored at the hub monitoring server. In the unlikely event thattwo users attempt to save a situation with the same name simultaneously, anerror will occur, ensuring that one situation does not overwrite another.
5. If the Distribution Change window is displayed, click OK to add the managedsystems shown in the Required Managed Systems list to the distribution forthis situation.
Forwarding the event to an EIF receiverWhen situation event forwarding has been configured in your monitoringenvironment, a default Event Integration Facility receiver is assigned and theseverity of forwarded events matches the state specified for the situation. The EIF
Chapter 10. Situations for event monitoring 267
tab of the Situation editor enables you to specify the severity and the EIF receiveror receivers the event shall be forwarded to, or to disable event forwarding for asituation.
About this task
Note: The EIF tab shows in the Situation editor only if the hub monitoring serverhas been configured to forward events. See IBM Tivoli Monitoring Installation andSetup Guide (http://publib.boulder.ibm.com/infocenter/tivihelp/v15r1/topic/com.ibm.itm.doc_6.2.3fp1/itm623FP1_install.htm) for details.
You can avoid duplicate situation events (one from the monitoring server and onefrom the event server or ObjectServer) by configuring connectors as described in“Best practices for using event synchronization” in the IBM Tivoli MonitoringAdministrator's Guide (http://publib.boulder.ibm.com/infocenter/tivihelp/v15r1/topic/com.ibm.itm.doc_6.2.3fp1/adminuse/itm_admin.htm).
Complete these steps to customize how events are forwarded to the EIF receiver:
Procedure1. In the Situation editor, click the EIF tab.2. Select Forward Events to an EIF Receiver to send an EIF event for every
event that opens for this situation or clear the check box if you prefer not toforward events that open for this situation.
3. Select the EIF Severity of forwarded events. <Default EIF Severity> causes theevent severity that is set for the situation at this Navigator item to be appliedto the EIF event when Forward Events to an EIF Receiver is selected.If the situation event being forwarded has the Informational severity, it willbe seen as Harmless at the Tivoli Enterprise Console.
4. Specify the EIF destinations for forwarded events:v To add a destination, select it from the Available EIF Receivers list and then
click the left-arrow.v To remove a destination from the list, select it in the Assigned EIF Receivers
list and click the right-arrow.
EIF destinations are defined in the Manage Tivoli Monitoring Servicesapplication, described in IBM Tivoli Monitoring Installation and Setup Guide(http://publib.boulder.ibm.com/infocenter/tivihelp/v15r1/topic/com.ibm.itm.doc_6.2.3fp1/itm623FP1_install.htm); or with the tacmdcreateEventDest command.
5. If you want to customize how situation events are mapped to EIF events, clickEIF Slot Customization.
6. Select other tabs in the Situation editor to:v Distribute the situation to the managed systems on which you want it to run.
See “Distributing the situation” on page 261.v Add expert advice to the situation. See “Writing expert advice” on page 262.v Specify an action to take or a message to send to the Universal Message
Console when the situation is true. See “Specifying an action” on page 264v Specify how long a situation shall remain true. See “Adding an Until
modifier” on page 266.7. When you are finished composing the situation, save your changes and start
the situation by clicking Apply to keep the editor open; or by clicking OK toclose the Situation editor. The Situation editor performs syntax checking on
268 IBM Tivoli Monitoring: Tivoli Enterprise Portal User's Guide
each expression you enter. If you entered an improper value for an attribute,such as “abc” for Disk Size, the cell turns red and the situation will not besaved until you correct the error.If you opened the Situation editor from the toolbar, the situation you justcreated will not be associated with any Navigator items and no event indicatoris displayed when the situation becomes true. You must associate a situationwith a Navigator item or change its state and click Apply.Situations are stored at the hub monitoring server. In the unlikely event thattwo users attempt to save a situation with the same name simultaneously, anerror will occur, ensuring that one situation does not overwrite another.
8. If the Distribution Change window is displayed, click OK to add the managedsystems shown in the Required Managed Systems list to the distribution forthis situation.
EIF Slot CustomizationUse the EIF Slot Customization editor to customize how situation events aremapped to forwarded EIF events.
The EIF Slot Customization editor opens when you click EIF Slot Customizationin the EIF tab of the Situation editor. Here you can create a custom event mappingthat overrides the default mapping between situation events and events forwardedto an EIF receiver such as the Tivoli Enterprise Console event server. Specify amapping between each EIF event slot and a corresponding Tivoli Monitoringattribute, and any options that determine how attribute data is to be converted inthe forwarded event.
The event mapping specified here completely replaces the default mapping.Therefore, if you do not specify a mapping for a particular attribute in thiswindow, that attribute is not included in the forwarded event. (You can use theMap all attributes option to apply the default mapping to any attribute notspecifically listed.)
Event class name
Specify the EIF event class you want to use for the events forwarded to the EIFreceiver. You can either type the class name directly in the field, or click Selectevent class to select from a list of all the defined classes.
When you select an event class from the list or type the name of a defined class,the Extended slots table is populated with the extended slots defined for theselected class. If you type the name of a class that is not defined in the TivoliMonitoring configuration, the extended slots are not available and must be enteredmanually.
Base slots
Use the Base slots table to specify how each base slot of the forwarded EIF eventis populated with data:v You can specify a Tivoli Monitoring attribute to be mapped to each slot, along
with options that affect how the value of the attribute is mapped to acorresponding value in the EIF event slot.
v You can specify a literal value that is used for the event slot for each forwardedevent.
Chapter 10. Situations for event monitoring 269
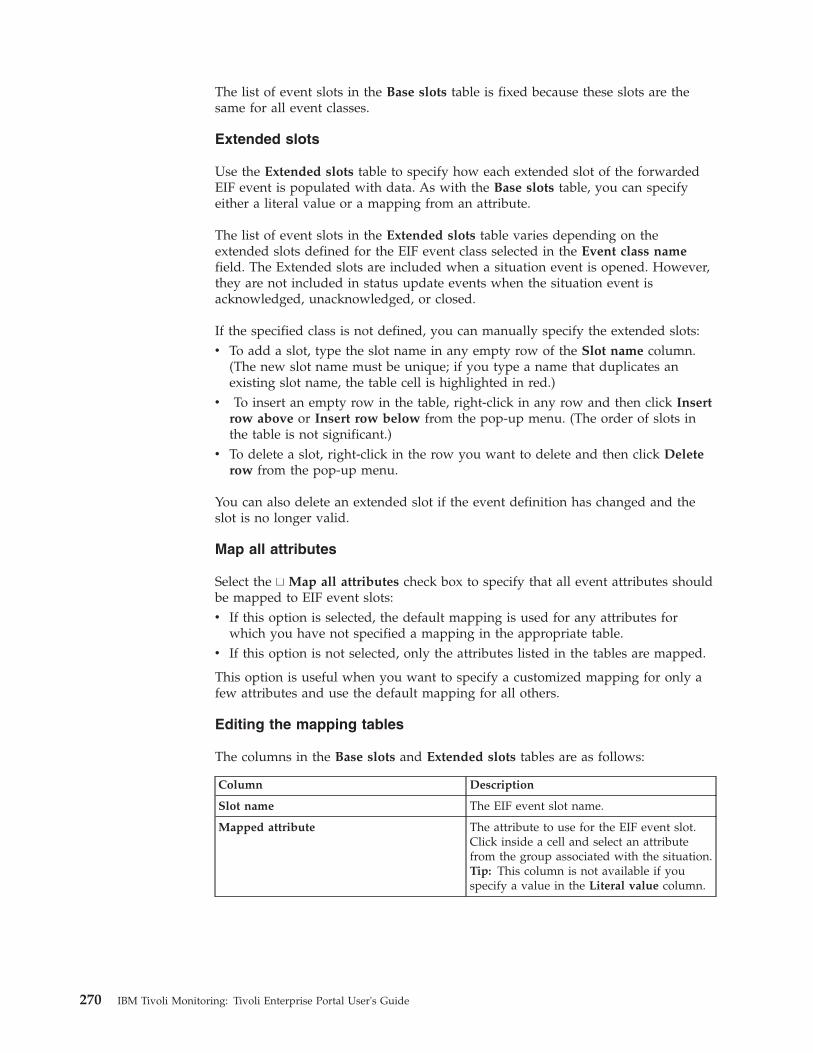
The list of event slots in the Base slots table is fixed because these slots are thesame for all event classes.
Extended slots
Use the Extended slots table to specify how each extended slot of the forwardedEIF event is populated with data. As with the Base slots table, you can specifyeither a literal value or a mapping from an attribute.
The list of event slots in the Extended slots table varies depending on theextended slots defined for the EIF event class selected in the Event class namefield. The Extended slots are included when a situation event is opened. However,they are not included in status update events when the situation event isacknowledged, unacknowledged, or closed.
If the specified class is not defined, you can manually specify the extended slots:v To add a slot, type the slot name in any empty row of the Slot name column.
(The new slot name must be unique; if you type a name that duplicates anexisting slot name, the table cell is highlighted in red.)
v To insert an empty row in the table, right-click in any row and then click Insertrow above or Insert row below from the pop-up menu. (The order of slots inthe table is not significant.)
v To delete a slot, right-click in the row you want to delete and then click Deleterow from the pop-up menu.
You can also delete an extended slot if the event definition has changed and theslot is no longer valid.
Map all attributes
Select the Map all attributes check box to specify that all event attributes shouldbe mapped to EIF event slots:v If this option is selected, the default mapping is used for any attributes for
which you have not specified a mapping in the appropriate table.v If this option is not selected, only the attributes listed in the tables are mapped.
This option is useful when you want to specify a customized mapping for only afew attributes and use the default mapping for all others.
Editing the mapping tables
The columns in the Base slots and Extended slots tables are as follows:
Column Description
Slot name The EIF event slot name.
Mapped attribute The attribute to use for the EIF event slot.Click inside a cell and select an attributefrom the group associated with the situation.Tip: This column is not available if youspecify a value in the Literal value column.
270 IBM Tivoli Monitoring: Tivoli Enterprise Portal User's Guide
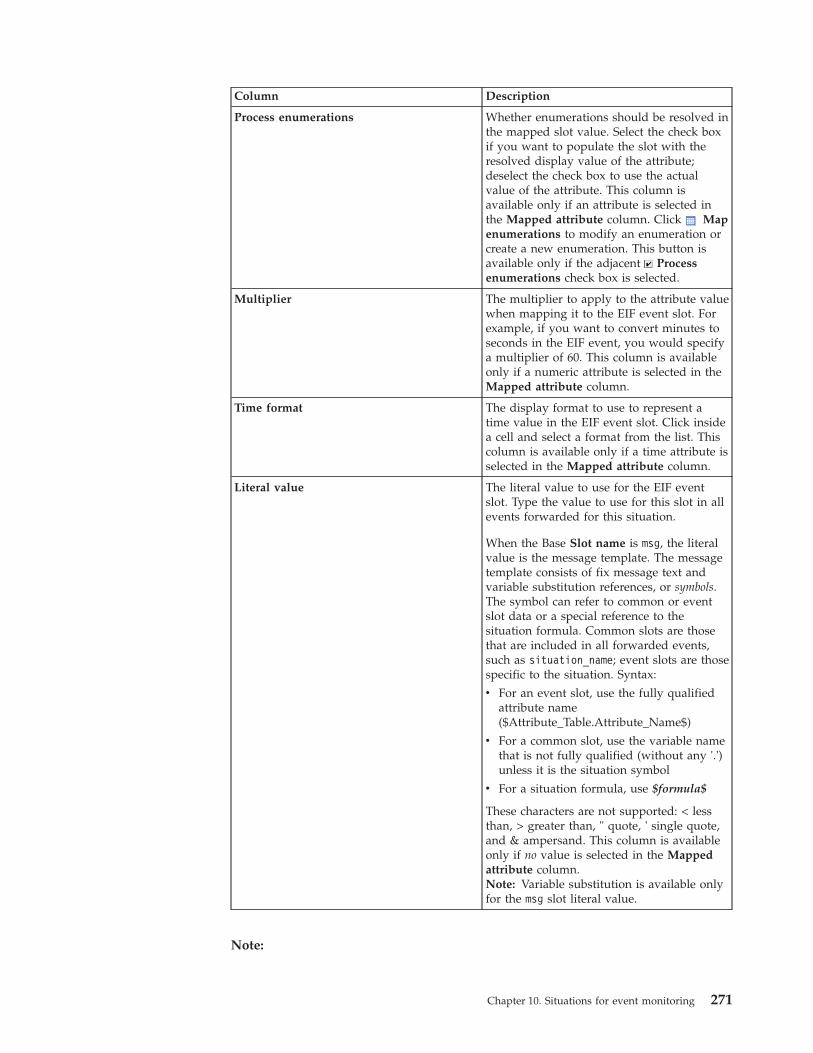
Column Description
Process enumerations Whether enumerations should be resolved inthe mapped slot value. Select the check boxif you want to populate the slot with theresolved display value of the attribute;deselect the check box to use the actualvalue of the attribute. This column isavailable only if an attribute is selected inthe Mapped attribute column. Click Mapenumerations to modify an enumeration orcreate a new enumeration. This button isavailable only if the adjacent Processenumerations check box is selected.
Multiplier The multiplier to apply to the attribute valuewhen mapping it to the EIF event slot. Forexample, if you want to convert minutes toseconds in the EIF event, you would specifya multiplier of 60. This column is availableonly if a numeric attribute is selected in theMapped attribute column.
Time format The display format to use to represent atime value in the EIF event slot. Click insidea cell and select a format from the list. Thiscolumn is available only if a time attribute isselected in the Mapped attribute column.
Literal value The literal value to use for the EIF eventslot. Type the value to use for this slot in allevents forwarded for this situation.
When the Base Slot name is msg, the literalvalue is the message template. The messagetemplate consists of fix message text andvariable substitution references, or symbols.The symbol can refer to common or eventslot data or a special reference to thesituation formula. Common slots are thosethat are included in all forwarded events,such as situation_name; event slots are thosespecific to the situation. Syntax:
v For an event slot, use the fully qualifiedattribute name($Attribute_Table.Attribute_Name$)
v For a common slot, use the variable namethat is not fully qualified (without any '.')unless it is the situation symbol
v For a situation formula, use $formula$
These characters are not supported: < lessthan, > greater than, " quote, ' single quote,and & ampersand. This column is availableonly if no value is selected in the Mappedattribute column.Note: Variable substitution is available onlyfor the msg slot literal value.
Note:
Chapter 10. Situations for event monitoring 271
v For the msg slot, typical users specify a Literal value, not a Mapped attributevalue. If a value is specified in the Mapped attribute column for the msg slot,the following results occur:– If Map all attributes is not selected, then the Mapped attribute for the msg
will not be present in the event, and will be ignored.– If Map all attributes is selected, then the Tivoli Enterprise Console event
includes only the default message template and not the Mapped attributespecified in the msg slot.
v For the base slot, if you select a Mapped Attribute, the mapping is used when asituation event is opened. However, the mapping does not occur in situationstatus update events that are sent to the EIF receiver when an event isacknowledged, unacknowledged, or closed.
Map enumerations:
Use the Map enumerations window to modify or create enumerations used tomap a Tivoli Monitoring attribute value to an EIF event slot.
The Map enumerations window is opened from the EIF Slot Customizationwindow after you click (which does not show in that window until you select
Process enumerations for an event slot).
If an enumeration already exists for the attribute, it populates the table and youcan modify the entries. These enumerated values are used to convert attributevalues to display values for the slots of the forwarded event. For example, if thesituation event uses the numerals 0 through 6 to represent days of the week, youcan map those values to their names, Sunday through Saturday.
To modify the enumeration, click in the table cells and edit the text:v Type or edit the attribute Value and the corresponding Display as value, one
row for each enumeration. Any new values you add must be unique: If you typea value that duplicates an existing entry in the Value column, the table cell ishighlighted in red.
v To insert an empty row in the table, right-click in any row and then click Insertrow above or Insert row below from the pop-up menu. The order of values inthe table is not significant.
v To delete a slot, right-click in the row and click Delete row.
Select event class:
Use the Select Event Class window to select the Tivoli Enterprise Console eventclasses you want to trigger a correlation rule for the Tivoli Enterprise Consolegateway.
This window is opened from the EIF Slot Customization window when you clickSelect Event Class. The Available Event Classes list shows all of the event
classes available for correlation rules. The available event classes are determined bythe event definition XML files specified by the KFW_MCS_XML_FILES parameter in theportal server environment file. For more information, refer to the IBM TivoliMonitoring Administrator's Guide.
Click to see the event classes for that class type. Click the event class to use,then OK to close the window. The Extended slots list of the EIF SlotCustomization window is populated with the attributes from the chosen eventclass.
272 IBM Tivoli Monitoring: Tivoli Enterprise Portal User's Guide
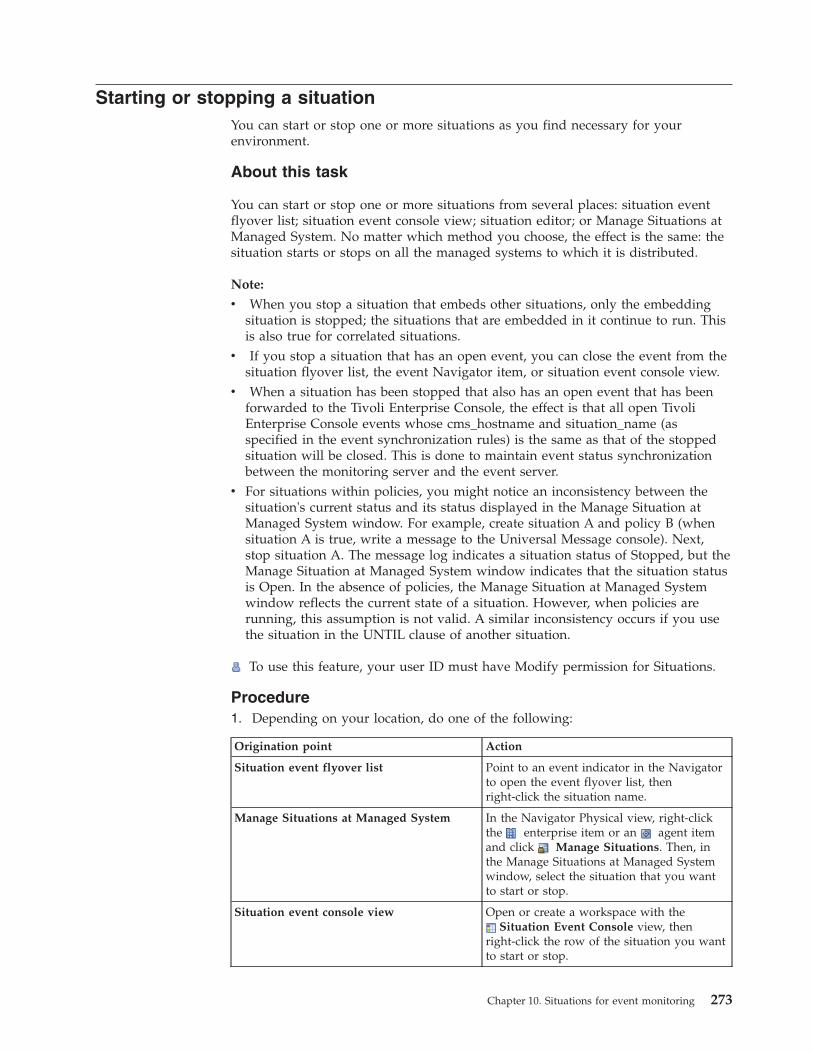
Starting or stopping a situationYou can start or stop one or more situations as you find necessary for yourenvironment.
About this task
You can start or stop one or more situations from several places: situation eventflyover list; situation event console view; situation editor; or Manage Situations atManaged System. No matter which method you choose, the effect is the same: thesituation starts or stops on all the managed systems to which it is distributed.
Note:
v When you stop a situation that embeds other situations, only the embeddingsituation is stopped; the situations that are embedded in it continue to run. Thisis also true for correlated situations.
v If you stop a situation that has an open event, you can close the event from thesituation flyover list, the event Navigator item, or situation event console view.
v When a situation has been stopped that also has an open event that has beenforwarded to the Tivoli Enterprise Console, the effect is that all open TivoliEnterprise Console events whose cms_hostname and situation_name (asspecified in the event synchronization rules) is the same as that of the stoppedsituation will be closed. This is done to maintain event status synchronizationbetween the monitoring server and the event server.
v For situations within policies, you might notice an inconsistency between thesituation's current status and its status displayed in the Manage Situation atManaged System window. For example, create situation A and policy B (whensituation A is true, write a message to the Universal Message console). Next,stop situation A. The message log indicates a situation status of Stopped, but theManage Situation at Managed System window indicates that the situation statusis Open. In the absence of policies, the Manage Situation at Managed Systemwindow reflects the current state of a situation. However, when policies arerunning, this assumption is not valid. A similar inconsistency occurs if you usethe situation in the UNTIL clause of another situation.
To use this feature, your user ID must have Modify permission for Situations.
Procedure1. Depending on your location, do one of the following:
Origination point Action
Situation event flyover list Point to an event indicator in the Navigatorto open the event flyover list, thenright-click the situation name.
Manage Situations at Managed System In the Navigator Physical view, right-clickthe enterprise item or an agent itemand click Manage Situations. Then, inthe Manage Situations at Managed Systemwindow, select the situation that you wantto start or stop.
Situation event console view Open or create a workspace with theSituation Event Console view, then
right-click the row of the situation you wantto start or stop.
Chapter 10. Situations for event monitoring 273
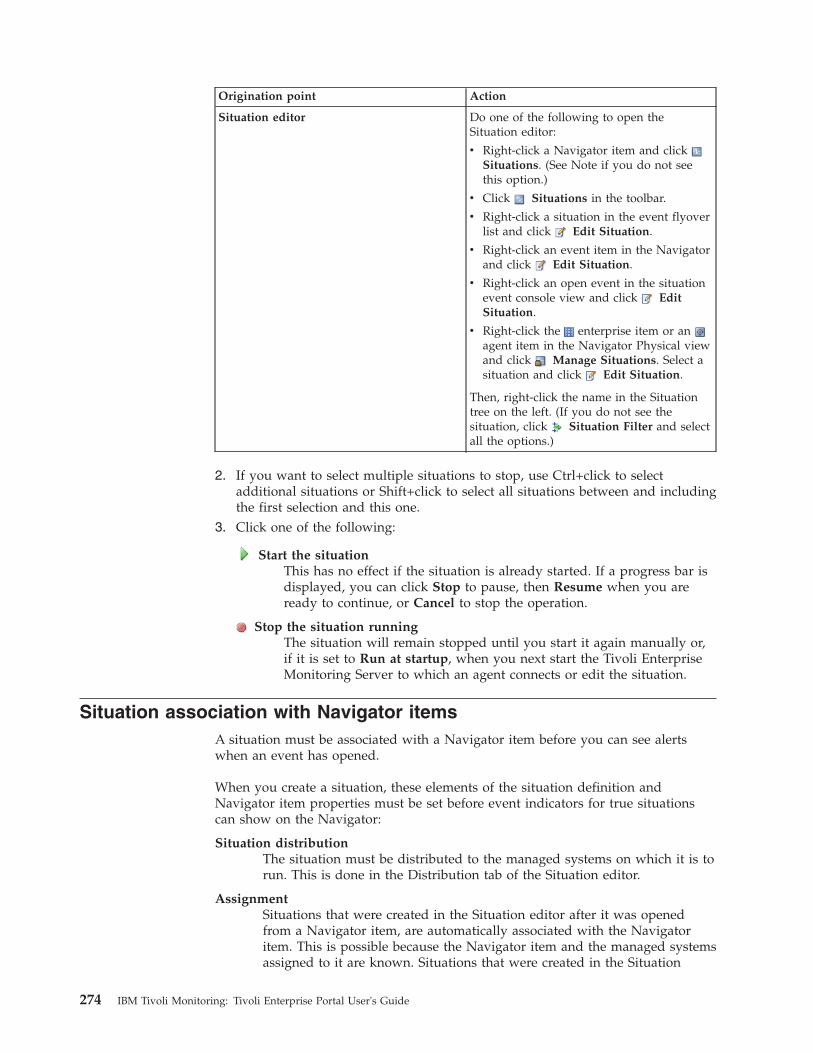
Origination point Action
Situation editor Do one of the following to open theSituation editor:
v Right-click a Navigator item and clickSituations. (See Note if you do not seethis option.)
v Click Situations in the toolbar.
v Right-click a situation in the event flyoverlist and click Edit Situation.
v Right-click an event item in the Navigatorand click Edit Situation.
v Right-click an open event in the situationevent console view and click EditSituation.
v Right-click the enterprise item or anagent item in the Navigator Physical viewand click Manage Situations. Select asituation and click Edit Situation.
Then, right-click the name in the Situationtree on the left. (If you do not see thesituation, click Situation Filter and selectall the options.)
2. If you want to select multiple situations to stop, use Ctrl+click to selectadditional situations or Shift+click to select all situations between and includingthe first selection and this one.
3. Click one of the following:
Start the situationThis has no effect if the situation is already started. If a progress bar isdisplayed, you can click Stop to pause, then Resume when you areready to continue, or Cancel to stop the operation.
Stop the situation runningThe situation will remain stopped until you start it again manually or,if it is set to Run at startup, when you next start the Tivoli EnterpriseMonitoring Server to which an agent connects or edit the situation.
Situation association with Navigator itemsA situation must be associated with a Navigator item before you can see alertswhen an event has opened.
When you create a situation, these elements of the situation definition andNavigator item properties must be set before event indicators for true situationscan show on the Navigator:
Situation distributionThe situation must be distributed to the managed systems on which it is torun. This is done in the Distribution tab of the Situation editor.
AssignmentSituations that were created in the Situation editor after it was openedfrom a Navigator item, are automatically associated with the Navigatoritem. This is possible because the Navigator item and the managed systemsassigned to it are known. Situations that were created in the Situation
274 IBM Tivoli Monitoring: Tivoli Enterprise Portal User's Guide
editor after it was opened from the main toolbar are not associated with aNavigator item initially: the situation might be distributed to one or moremanaged systems, but the Navigator item is not known at this point.
For custom Navigator views, you must relate, or assign, managed systemsto the Navigator items where you want to see alerts.
AssociationYou must associate a situation with the Navigator items where you want tosee event indicators for the situation. Association with a Navigator item isdone automatically when you open the Situation editor from theNavigator, then create or edit a situation and click Apply or OK.Association with a Navigator item is done manually for situations createdin the Situation editor when it was opened from the toolbar.
Tip: When you associate a situation with a Navigator item, the situation state andsound are also associated with the item. The same situation can be associated witha different Navigator item if you want to apply a different state or sound. This isespecially useful for custom Navigator views where one situation might be
critical in an operator's Navigator view, but considered informational in aview designed for an executive.
Associating a situationIf you access the Situation editor through the toolbar to create situations, no alertwill be visible in the Navigator when the situation becomes true until youassociate the situations with a Navigator item.
About this task
For each Navigator item you want to associate a situation with, do the following:
Procedure1. Right-click the Navigator item to which you want to associate a situation. If
this is a correlated situation, right-click the Enterprise Navigator item.2. Click Situations. Situations is displayed in the pop-up menu for all
Navigator items in the Physical view except for those at the operating platformlevel (such as Linux Systems). The Enterprise item is limited to TivoliEnterprise Monitoring Server situations distributed to *HUB_ or *ALL_CMSmanaged systems. A Navigator item in a custom Navigator view must have atleast one managed system assigned to it, or you will not see Situations inthe pop-up menu.The Situation editor opens with the list of situations that have been associatedwith this Navigator item.
3. Click Situation Filter to open the Show Situations window.4. Select Eligible for Association and clear Associated with this Object. If
you are associating a situation with the Enterprise item in the NavigatorPhysical view, also select Associated with Monitored Application.
5. If you want to apply a different event state to the situation than the defaultcritical state (or the one it was created with) or you want to apply an eventsound, select the situation from the tree, then do one or both of the following.v In the State area, select a different state.v In the "Sound" area, select Enable. If you want to change the sound, click
Edit.
Chapter 10. Situations for event monitoring 275
This ability to change the event state and sound enables you to qualify theseverity of a situation for different Navigator items.
6. Right-click the situation to associate with the Navigator item and clickAssociate.
7. When you are finished, check your work by clicking Situation Filter, clearingEligible for Association, and selecting Associated with this Object. The
situations you associated with this Navigator item are displayed in the list.8. To save your changes, click Apply to keep the Situation editor open; -OR- click
OK to close it.
Results
Tip: If you have multiple situations to associate, you can use Ctrl+click to selectadditional situations to associate or Shift+click to select all situations between andincluding the first selection and this one. Be aware that the Critical state and nosound will be applied to this Navigator item.
Dissociating a situationIf you no longer want to have event indicators originate for this situation from theNavigator item, dissociate it. For example, you might have a situation that is onlyembedded in other situations and never runs on its own.
About this task
To dissociate a situation:
Procedure1. Right-click the Navigator item from which you want to dissociate a situation.2. Click Situations. The Situations option is available from all Navigator items
except those at the operating platform level (such as Linux Systems). TheEnterprise item is limited to Tivoli Enterprise Monitoring Server situationsdistributed to *HUB_ or *ALL_CMS managed systems. A Navigator item in acustom Navigator view must have at least one managed system assigned to it;otherwise, you will not see Situations in the pop-up menu.The Situation editor opens with the list of situations that have been associatedwith this Navigator item.
3. Right-click the situation you want to dissociate from the Navigator item andclick Dissociate. If you want to remove all associations, click DissociateAll. If you have multiple situations to dissociate, you can use Ctrl+click toselect more situations or Shift+click to select all situations between andincluding the first selection and this one. Then right-click one of the situationsand select Dissociate.
4. To save your changes, click Apply if you want to keep the Situation editoropen; -OR- click OK if you want to close it.
Modeling conditions for situationsUse situation modeling to perform threshold analysis on selected data samples or asituation and use the results to create or edit a situation.
276 IBM Tivoli Monitoring: Tivoli Enterprise Portal User's Guide
Related information:
Tivoli Media Gallery video on situation modeling
Understanding situation modelingSituation modeling can be done with selected attributes from the currentquery-based view or with the conditions of the current situation.
Modeling from a query-based viewQuery-based views and historical data are valuable for exploring yourmonitored environment and researching conditions to build situationsagainst. The situation modeling feature enables you to capture data from aquery-based view and use it to model possible threshold scenarios or totest the effectiveness of a situation. The Model Situation window hasoptions for calculating different values, comparing attributes, andtransferring the results to the Situation editor to create a new situation orto fine tune the conditions in an existing situation.
If the attribute group data has been collected historically, then you can runstatistical algorithms against it and provide values on the same chart. Themodel situation chart shows the difference between the original andcalculated values. For example, you might be viewing data samples over amonth-long period and see that a metric peaks during Monday morningsfrom 8:00 to 10:00. You can use the modeling tools to help you makedecisions about whether that maximum value is repeatable or an anomaly,and whether it correlates with other conditions.
You can open the Model Situation window from the selected data row orpoint in a chart view or table view.
Modeling from the Manage Situations at Managed Systems windowThe Manage Situations at Managed System window displays all thesituations that are associated with the Navigator item for the agent. Youcan use situation modeling to refine the thresholds of an existing situationso that events are opened appropriately: not too often, but not so seldomthat important issues are missed.
Open the Model Situation window for a selected situation to see theformula with the current attribute values plotted in the model situationchart. Use the expression editor and statistical functions to model otherpossible thresholds. Then copy the results into the Situation editor forediting the situation values or to create another situation.The tool is disabled if a situation is ineligible for modeling. Situationdefinitions that have any these characteristics cannot be used for modeling:v Embedded situations, which also includes correlated situationsv Situations with more than ten attributes in the formulav Situations with no numeric attributes in the formulav Situations with an attribute repeated in the formula (such as
MyAttribute > 0 AND MyAttribute < 50)v Situations with Boolean OR logicv Situations with group functions: count, sum, average, minimum,
maximum
Chapter 10. Situations for event monitoring 277
Modeling a situation with view dataUse the values from the current chart or table to model threshold conditions andthen use the results in a new situation. Historical views are particularly valuablefor researching thresholds.
Before you begin
Your user ID must have View permissions for Situations for this feature to beenabled. To create or edit Situations, your user ID must have Modify permission.
About this task
The attribute values that are used for modeling are especially valuable forcomparing with historical data samples. Take these steps to work with thesituation modeling feature and, if you choose to, create a situation. Text attributescannot be modeled. Only display item, which has a checked box
Procedure1. Right-click a table row or chart point containing numeric attributes to monitor
and click Model Situation. The Select attribute window is opened with theattribute group preselected. If you opened the pop-up menu from a chart,attributes are preselected.
2. In the Select attribute window, select the attributes to model:v Click an attribute to select it. You can also use Ctrl+click to select multiple
items and Shift+click to select all items between the item last selected andthis one. You can select up to 10 attributes.
v Select numeric attributes of interest.
After you click OK, the Model Situation window is opened with a chartdisplaying the selected numeric attributes and their values (from the selectedrow).v If historical data samples are available, the last 24 hours are displayed in a
plot chart. If no historical data has been collected, the current data samplesare displayed in a bar chart.
v Any non-numeric attribute values are shown but are non-selectable. Theexception is a display item, which is a key attribute in some multiple rowattribute groups and shows in the Model Situation window. In situationmodeling, it can be used to select different data rows. In a situationdefinition, a display item can be selected as an Advanced option that enablesthe situation to open multiple events: once for each row that meets thecondition.
v A message informs you if no modeling chart is displayed. This happens ifthe situation override is for a multiple-row attribute group that has nodisplay item.
3. Use the modeling tools to apply different threshold scenarios; click Recalculateto render the chart with the modified argument set.
4. To create a situation populated with values from the Condition column, clickCreate Situation. Enter the situation name and optional description.
278 IBM Tivoli Monitoring: Tivoli Enterprise Portal User's Guide
Related reference:“Model Situation”
Modeling with an existing situationUse situation modeling to calculate new threshold values for an existing situationor to create another situation with the modeling results, replacing the originalsituation thresholds. This enables you to fine tune the situation so that it does notopen events unnecessarily or, conversely, miss important issues.
Before you begin
To get the most benefit from situation modeling, use historical data samples forcomparison. If no historical data is being collected for the attribute in the situation,you can still model thresholds but without the benefit of historical data andstatistical functions.
Some situation constructs make them ineligible for modeling: embedded situations,and that includes correlated situations; more than ten attributes in the formula; nonumeric attributes in the formula; attributes repeated in the formula; and BooleanOR logic.
Your user ID must have Modify permissions for Situations for this feature to beenabled.
About this task
Take these steps to model threshold conditions for a situation, then apply theresults to the situation or to a new situation.
Procedure1. Right-click a Navigator item that has situations associated with it: either
Enterprise or Agent.2. Click Manage Situations.3. Click the row of the situation that you want to model and click Model
Situation. The Model situation window opens with the formula in theAttributes expression editor and the current values plotted in a chart. Ifhistorical data samples are available, the last 24 hours are plotted. Anynon-numeric attribute values are shown but are non-selectable.
4. Use the modeling tools to try out different threshold scenarios; clickRecalculate to render the chart with the modified argument set.
5. To create a situation populated with values from the Condition column, clickCreate Situation; or to edit a situation, click Edit Situation.
Related reference:“Model Situation”
Model SituationYou can select Model Situation from a query-based view or Manage Situationsat Managed System window to display selected attribute values in a chart, try outdifferent thresholding scenarios, and use the results to create or edit a situation.
If the attribute group used by the query-based view or situation has historical datacollection enabled, the Model Situation window shows a plot chart in the top halfof the window (up to the last 24 hours) and Attributes, Time Span, and Functions
Chapter 10. Situations for event monitoring 279
areas in the lower half. You can switch the display to a bar chart or area chart. Ifhistorical collection has not been configured, the Model Situation window shows abar chart in the top half of the window and an Attributes area in the bottom half.
Model situation chart
If you started from a query-based view, your selections from the Select Attributewindow are displayed in a chart with values from the current row or data point. Ifyou started from a situation, the formula is displayed in the Attributes expressioneditor and the current attribute values are plotted in a chart. As you modifyattribute conditions (such as to change the value), the chart is adjusted and thedifference indicated.
For attributes with historical data samples, the last 24 hours of data samples areplotted by default unless you have a time span set, in which case that time span isplotted. Although all the data points are plotted, the window has only limitedspace for time stamp labels. Use any of these methods to see values and adjust thedisplay:v Move the mouse pointer over a point to see the value and time stamp.v Drag the window border to expand the chart width.v Drag the border bar between the chart and the Attributes area up or down.v Click Zoom in (Ctrl + Click) and drag the mouse over the time period to
highlight; the selection expands to fill the chart area. Click Zoom out (Esc) toreturn to the full data view.
v Select options in the Time Span area to reduce the time span and thus thenumber of samples displayed.
v Click , , or to redraw the data as a bar chart, plot chart (the default), orarea chart.
Attributes
This area has a row for each selected attribute or situation attribute. Click inside acell to see only that attribute plotted on the chart.
Name This is the name of the attribute chosen from the Select attribute dialog.
If you see a check box in the first column, it means the attribute is adisplay item, a key attribute in a multiple-row attribute group. You canenter another valid value in the Condition cell to plot the values for thatdisplay item attribute.
ConditionThis is the value of the attribute from the chart view data series or tableview row, or from the situation if you are modeling with an existingsituation.
Click inside a cell to change the function or operator,or to edit the value. A solid marker line is drawn across the chart torepresent the current comparison value. A shaded region appears above orbelow this marker line if the relational operator represents a range oftrigger values (>, >=, <, <=). The difference between the original andcalculated value is the threshold area and is highlighted.
Value modifierThis is initially set to < none selected >. Click inside the cell to calculate athreshold by raising or lowering the original value by a specifiedpercentage.
280 IBM Tivoli Monitoring: Tivoli Enterprise Portal User's Guide
In the + PERCENT or - PERCENT window that opens, enter thepercentage to raise or lower the value by, click Draw to apply thethreshold to the chart. After you click OK, the difference between theoriginal and percentage raised or lowered is used to set a new thresholdvalue.
Chart optionsModify the appearance of the threshold: Visible in legend to addThreshold to the legend, Show chart label to add a threshold label, andFill Style to change the threshold pattern or color. Click Custom Colors tochoose from a wider selection of colors or to create your own.
Functions
This area is displayed when the attribute group used in the view or situation hashistorically collected values. Click a row in the Attributes area. In the Functionsarea, select the check box for the statistical function you want to use. After settingan Argument, click Recalculate to see the adjusted threshold in the Result cell andplot it on the chart as a colored line.
AVGFor the selected attribute, calculate the average value from the samplestaken during the time period, and add or subtract the standard deviationthat was entered in the Argument field. Valid values are -6 to 6.
MINFor the selected attribute, find the lowest sampled value within the timeperiod, and increase or decrease that value by the percentage that wasentered in the Argument field. Valid values are -100 to 100.
MAXFor the selected attribute, find the highest sampled value within the timeperiod and increase or decrease that value by the percentage that wasentered in the Argument field. Valid values are -100 to 100.
PERCENTILEFor the selected attribute, find the value below which NUM percent of thedata points fall; where NUM is the value from the Argument field. Validvalues are 1 to 100.
MODEFor the selected attribute, find the most frequently observed value withinthe time period. No argument is entered for a MODE calculation.
CopyAdd the value from the Result cell to the selected cell in the Attributesarea.
Chart optionsModify the appearance of the threshold: Visible in legend to addThreshold to the legend, Show chart label to add a threshold label, andFill Style to change the threshold pattern or color. Click Custom Colors tochoose from a wider selection of colors or to create your own.
Time Span
This area is displayed when the attribute group used in the view or situation hashistorically collected values. The Last 24 Hours is shown by default.
Chapter 10. Situations for event monitoring 281
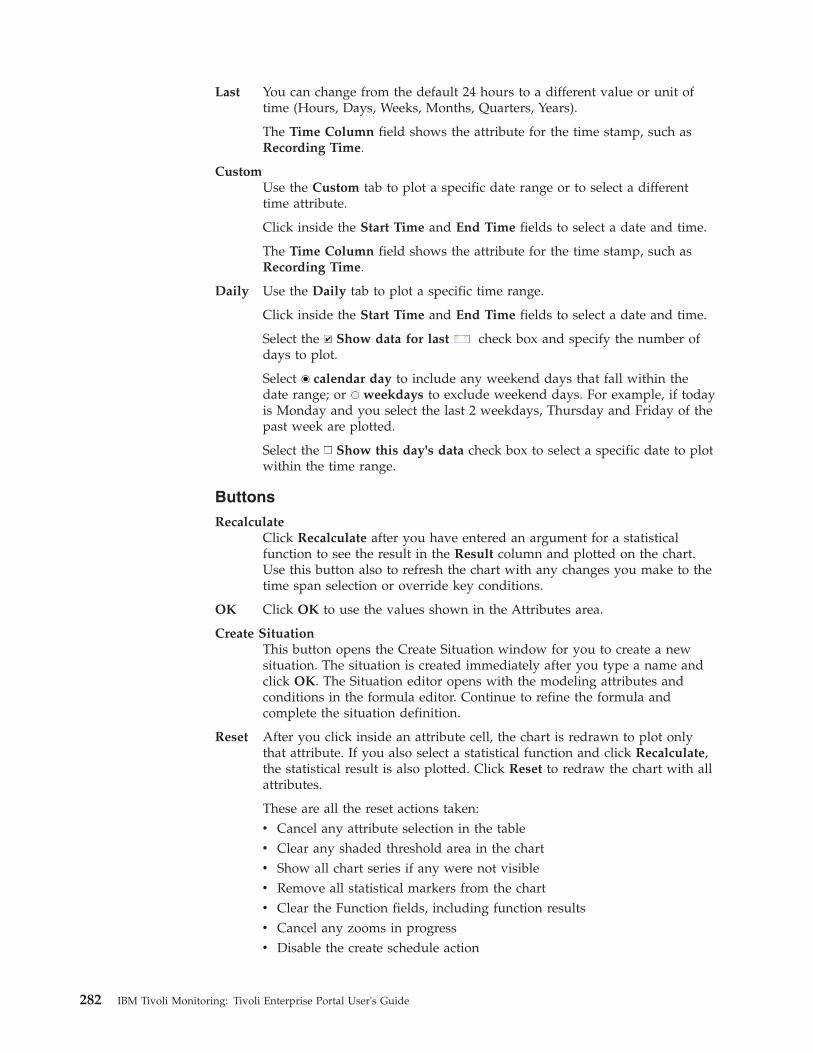
Last You can change from the default 24 hours to a different value or unit oftime (Hours, Days, Weeks, Months, Quarters, Years).
The Time Column field shows the attribute for the time stamp, such asRecording Time.
CustomUse the Custom tab to plot a specific date range or to select a differenttime attribute.
Click inside the Start Time and End Time fields to select a date and time.
The Time Column field shows the attribute for the time stamp, such asRecording Time.
Daily Use the Daily tab to plot a specific time range.
Click inside the Start Time and End Time fields to select a date and time.
Select the Show data for last check box and specify the number ofdays to plot.
Select calendar day to include any weekend days that fall within thedate range; or weekdays to exclude weekend days. For example, if todayis Monday and you select the last 2 weekdays, Thursday and Friday of thepast week are plotted.
Select the Show this day's data check box to select a specific date to plotwithin the time range.
Buttons
RecalculateClick Recalculate after you have entered an argument for a statisticalfunction to see the result in the Result column and plotted on the chart.Use this button also to refresh the chart with any changes you make to thetime span selection or override key conditions.
OK Click OK to use the values shown in the Attributes area.
Create SituationThis button opens the Create Situation window for you to create a newsituation. The situation is created immediately after you type a name andclick OK. The Situation editor opens with the modeling attributes andconditions in the formula editor. Continue to refine the formula andcomplete the situation definition.
Reset After you click inside an attribute cell, the chart is redrawn to plot onlythat attribute. If you also select a statistical function and click Recalculate,the statistical result is also plotted. Click Reset to redraw the chart with allattributes.
These are all the reset actions taken:v Cancel any attribute selection in the tablev Clear any shaded threshold area in the chartv Show all chart series if any were not visiblev Remove all statistical markers from the chartv Clear the Function fields, including function resultsv Cancel any zooms in progressv Disable the create schedule action
282 IBM Tivoli Monitoring: Tivoli Enterprise Portal User's Guide
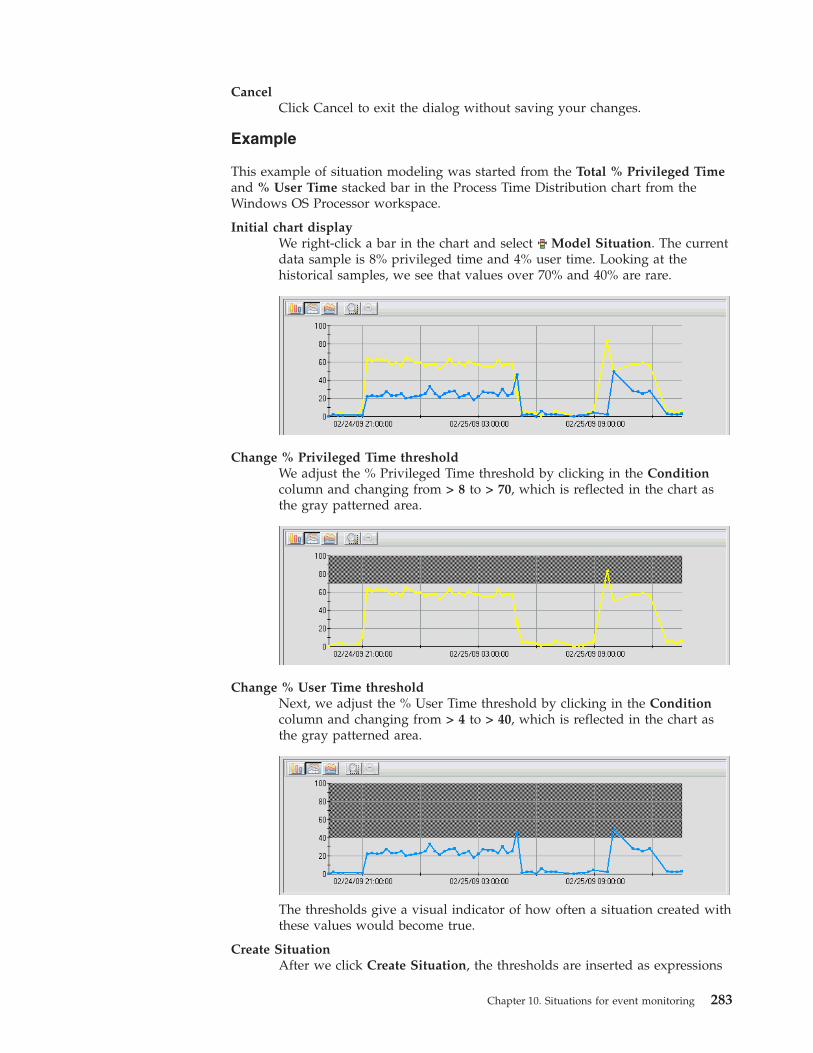
CancelClick Cancel to exit the dialog without saving your changes.
Example
This example of situation modeling was started from the Total % Privileged Timeand % User Time stacked bar in the Process Time Distribution chart from theWindows OS Processor workspace.
Initial chart displayWe right-click a bar in the chart and select Model Situation. The currentdata sample is 8% privileged time and 4% user time. Looking at thehistorical samples, we see that values over 70% and 40% are rare.
Change % Privileged Time thresholdWe adjust the % Privileged Time threshold by clicking in the Conditioncolumn and changing from > 8 to > 70, which is reflected in the chart asthe gray patterned area.
Change % User Time thresholdNext, we adjust the % User Time threshold by clicking in the Conditioncolumn and changing from > 4 to > 40, which is reflected in the chart asthe gray patterned area.
The thresholds give a visual indicator of how often a situation created withthese values would become true.
Create SituationAfter we click Create Situation, the thresholds are inserted as expressions
Chapter 10. Situations for event monitoring 283
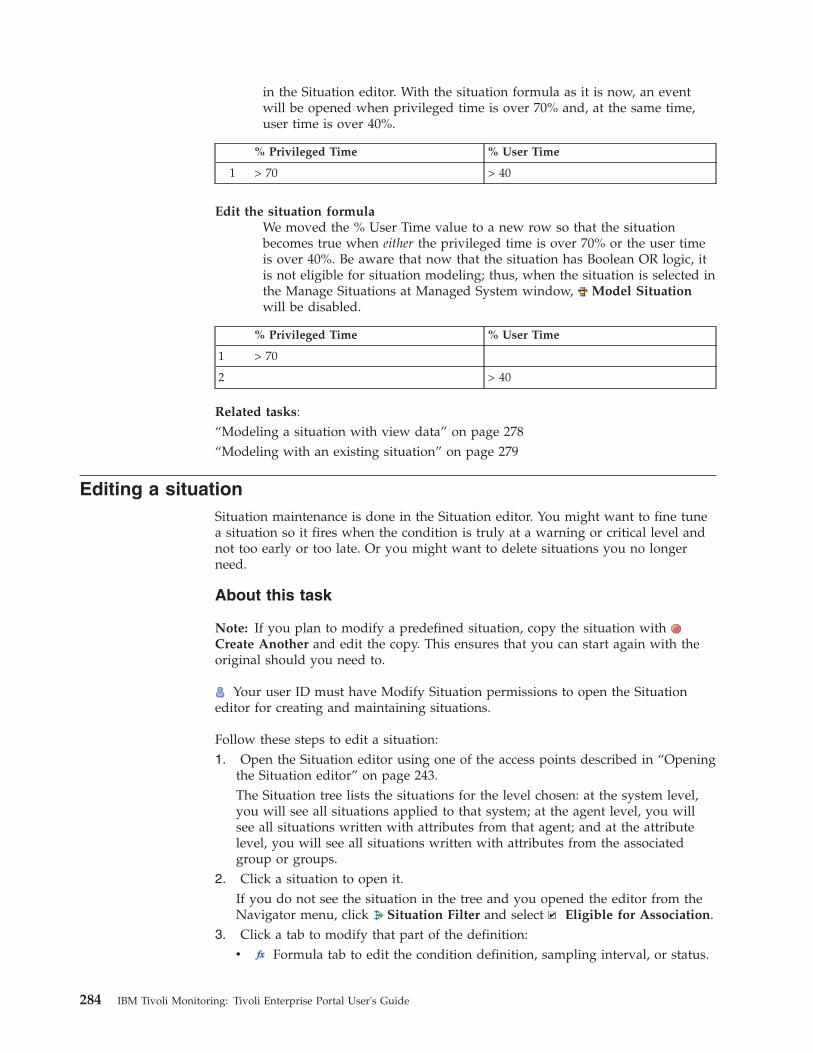
in the Situation editor. With the situation formula as it is now, an eventwill be opened when privileged time is over 70% and, at the same time,user time is over 40%.
% Privileged Time % User Time
1 > 70 > 40
Edit the situation formulaWe moved the % User Time value to a new row so that the situationbecomes true when either the privileged time is over 70% or the user timeis over 40%. Be aware that now that the situation has Boolean OR logic, itis not eligible for situation modeling; thus, when the situation is selected inthe Manage Situations at Managed System window, Model Situationwill be disabled.
% Privileged Time % User Time
1 > 70
2 > 40
Related tasks:“Modeling a situation with view data” on page 278“Modeling with an existing situation” on page 279
Editing a situationSituation maintenance is done in the Situation editor. You might want to fine tunea situation so it fires when the condition is truly at a warning or critical level andnot too early or too late. Or you might want to delete situations you no longerneed.
About this task
Note: If you plan to modify a predefined situation, copy the situation withCreate Another and edit the copy. This ensures that you can start again with theoriginal should you need to.
Your user ID must have Modify Situation permissions to open the Situationeditor for creating and maintaining situations.
Follow these steps to edit a situation:1. Open the Situation editor using one of the access points described in “Opening
the Situation editor” on page 243.The Situation tree lists the situations for the level chosen: at the system level,you will see all situations applied to that system; at the agent level, you willsee all situations written with attributes from that agent; and at the attributelevel, you will see all situations written with attributes from the associatedgroup or groups.
2. Click a situation to open it.If you do not see the situation in the tree and you opened the editor from theNavigator menu, click Situation Filter and select Eligible for Association.
3. Click a tab to modify that part of the definition:v Formula tab to edit the condition definition, sampling interval, or status.
284 IBM Tivoli Monitoring: Tivoli Enterprise Portal User's Guide
Tip: If you need to add or remove rows or clear cell contents, right-click andselect one of the pop-up menu options.
v Distribution tab to see and assign the systems to monitorv Expert Advice tab to enter text viewable from the event results workspacev Action tab to enter a command to be invoked when the situation firesv Until tab to have the event close after a period of time or when another
situation is true4. When you are finished editing the situation, click Apply to save your changes
and start the situation; -OR- OK to save your changes, start the situation, andexit the Situation editor.The Situation editor performs syntax checking on each expression you enter. Ifyou enter an improper value for an attribute, such as “30000” for % User Time,the cell turns red and the situation will not be saved until you correct the error.When the formula or other aspects of a situation definition are changed, thesituation is first stopped and then re-started. An event indicator for thesituation will appear in the Navigator for a brief period and the event flyoverwill show the situation stop indicator.
Deleting a situationUse the Situation editor to delete situations. Keep in mind that deleting a situationremoves it from every managed system to which it was distributed.
About this task
To delete a situation:
Procedure
Do one of the following to open the Situation editor:v Right-click a Navigator item and click Situations. (See Note if you do not see
this option.)v Click in the toolbar.v Right-click a situation in the event flyover list and click Edit Situation.v Right-click an event item in the Navigator and click Edit Situation.v Right-click an open event in the situation event console view and click Edit
Situation.v Right-click the enterprise item or an agent item in the Navigator Physical
view and click Manage Situations. Select a situation and click EditSituation.
Results1. Right-click the situation name in the tree on the left.
If you do not see the situation, click Situation Filter and select all of theoptions.You can use Ctrl+click to select additional situations or Shift+click to select allsituations between and including the first selection and this one.
2. Click Delete to permanently remove the situation selection.If a progress bar is displayed, you can click Stop to pause, then Resume whenyou are ready to continue, or Cancel to stop the operation.
Chapter 10. Situations for event monitoring 285
3. If this situation is referenced (embedded) in another situation or in a policy, aReferential Integrity window opens with a list of the affected objects and youmust do the following before you can delete the situation:a. Click Copy if you want to save the list to the Windows clipboard.b. Click Cancel.
You can now paste the list into a text editor or a notepad view in aworkspace.
c. Edit each situation or policy in the list to delete the reference to thissituation. (With the situation open in the Formula editor, right-click thecolumn heading for the embedded situation, and click Delete. With thepolicy open in the Workflow editor, select the activity references thissituation, and click Clear.)
Note: Situations is only in the pop-up menu of Navigator items that havemanaged systems assigned. In the Navigator Physical view, managed systems arepreassigned to every item except those at the operating platform level (such asLinux Systems) and cannot be changed. In the Navigator Logical and customviews, you can assign managed systems when creating a Navigator item or editingits properties.
Note: If you are forwarding events to an event integration facility such as theTivoli Enterprise Console Server, when an active situation is deleted, the Stop andDelete events that are sent to the event server use the situation short name and notthe long name. This is also true for any associated messages that are sent to themessage log view.
Situation overrides for dynamic thresholdingUse situation overrides for dynamic thresholding at selected managed systems,under specific conditions, and at scheduled times.
Overriding a situation formula is useful if you need to adjust the comparisonvalues based on local conditions or a specific time. The values used in a situationoverride can be either fixed or calculated from runtime data. Examples include thefollowing:v Overriding the formula for a particular managed system because of its unique
configuration. For example, you might want to use a different threshold todetect a "disk full" condition for a system that has a large hard disk drive.
v Focusing on the performance of a specific process or component. For example,you might override a comparison value only when the Process Name attributematches a specified value, in order to specify a lower CPU time threshold forthat process.
v Applying different expression values during specified periods of time toaccommodate varying service level objectives. For example, you might applydifferent override expressions during weekends and holidays.
v Deriving comparison values from historical data for a managed system. Forexample, you might specify that the threshold for a "high CPU usage" situationshould be based on deviation from the average CPU usage for that system.
Creating a situation overrideUse the situation expression override function to change the formula thresholds forone or more of the managed systems that the situation is distributed to. Theoverride can remain in effect indefinitely, at a set schedule, or until you remove it.
286 IBM Tivoli Monitoring: Tivoli Enterprise Portal User's Guide
Before you begin
When you define an override, apply it immediately or at a scheduled time. Theschedule for an override can run on specific days (calendar schedule) or every day ata certain time (hourly schedule). Calendar schedules can be saved and selected atany time. An hourly schedule can be assigned to the schedule, but is deleted afteryou close the Override editor if you turn off the assignment. If you plan toschedule the override, decide whether you want a calendar schedule or hourly.
Make sure the situation is eligible for overriding, and that it is currentlydistributed to one or more managed systems either directly or as part of managedsystem groups. If a situation is not eligible, Override Formula remains disabledeven after you select a managed system or managed system group.
About this task
The Expression Override editor is available through the Distribution tab of theSituation editor.
Procedure1. Identify the managed system or managed systems where the override should
take place and click Override Formula from either of these windows:v On the Situation editor Distribution tab, select one or more managed
systems or managed system groups from the Assigned list. The OverrideFormula button is disabled until you select an entry from the Assigned list.
v In the Manage Situations at Managed System window, select the situationthat you want to override and click Override Formula.
The Add Expression Overrides window opens.2. If the Expressions tab has no expressions, click Add Expression to add the
reference formula.3. Edit the expression value (or more if there are multiple expressions in the
formula) for the overrides to apply. These values will be used instead of thosein the reference formula when the override definition is applied.v Click inside a cell and enter a new value. After you press Enter or click
outside the cell, the new value appears with a blue background to indicatethat the original reference value has changed.
v Click Model Expression if you want to use expression modeling to establishthreshold values based on historical data and statistical analysis. See “ModelExpression” on page 296.
v The use of wildcards (* or ?) cannot be used in the key value.
Examples of eligible repeated attribute expressions (situations involving thesepatterns are eligible for override because the operators are unique):%_Processor_Time >= 30 and %_Processor_Time <= 50 p_name == "Websphere"
4. To view or change the override details, click the Details tab. The details includethe description, distribution, and override priority (1 is the highest priority; 200is the lowest).
5. If you want to apply the override immediately and without defining a schedule(unless you defined one in the Model Expression editor), click OK and skip tostep 7 on page 288. Otherwise, continue to the next step.
6. Specify a schedule for the override:a. Select Click here to assign an override schedule.
Chapter 10. Situations for event monitoring 287
b. In the Select Override Expression Schedule dialog, either select one of thedefined schedules entries and continue to step 7 or click Create NewSchedule. Any schedules created from the command line with tacmdaddCalendarEntry are displayed in the list.
c. Select Create a new calendar schedule to create a schedule for particulardays or sequence of days, or Create a new hourly schedule to create adaily schedule that runs at specified times.
d. In the Schedule editor that opens, define the schedule: “Calendar” on page294 or “Hourly” on page 296
After you click OK, the undefined schedule icon changes to indicate that acalendar schedule or an hourly schedule has been applied.
7. Click Apply to validate the override definition and save your changes. Thesituation override is validated when you save it. If any problems are found, amessage describes the error. Select the check box next to the Calendarerror and click Remove Expression.
8. If you want to add another override, click Add Expression and repeat thesesteps starting at step 3 on page 287 A copy of the reference formula is added tothe formula overrides. You can have one formula that has no schedule; anyothers must have a schedule applied.
Results
If the situation override entry has no schedule, it begins running after you clickApply or OK. Any overrides with a schedule are activated at the designated time.
What to do next
You can use the monitored baselines feature to see the override expressionscharted. See Adding monitored baselines to a chart.
Outside of the portal, you can use the CLI tacmd setOverride, tacmdaddCalendarEntry, tacmd suggestBaseline, and tacmd acceptBaseline commandsto create override expressions based on calculated baseline values rather than fixedvalues. (described in the IBM Tivoli Monitoring Command Reference) or using a localthresholds.xml configuration file (described in the IBM Tivoli MonitoringAdministrator's Guide Situation override XML specification).
If the Calendars list shows only <No schedule> or only the calendar entries thatyou have defined and no predefined calendars, it indicates that the hub monitoringserver was upgraded from an earlier version but application support was notadded. Application support is added by running the CLI itmcmd supportcommand. See the IBM Tivoli Monitoring Installation and Setup Guide forinstructions.
Adaptive monitoring considerationsReview these considerations when you are planning to implement adaptivemonitoring, such as which situations are eligible for expression overrides.
To create a situation override, you must be editing a situation that does not haveany of these characteristics
v Situations that embed other situationsv Correlated situations. These are run at the hub Tivoli Enterprise
Monitoring Serverv Situations that are distributed only to the monitoring server
288 IBM Tivoli Monitoring: Tivoli Enterprise Portal User's Guide
v Situations containing multiple attribute groupsv Situations containing expressions that involve aggregate column
functions: MIN, MAX, AVG, SUM, COUNT, CHANGE, PCTCHANGEv Situations containing expressions involving these row functions: STR,
SCAN, MISSING, TIME, DATEv Situations containing multiple expressions using the same attribute and
the same relational operator (for example, p_state != "running" andp_state != "waiting")
Override Formula is not available in the Situation editor's Distribution tabor in the Manage Situations at Managed System window if the situation isnot eligible for expression overrides.
The following restrictions apply to override expressions
v An override expression cannot add attribute comparisons that do notappear in the reference formula or change the comparison operatorsused.
v If the override contains multiple expressions, each must have a uniqueoverride condition.
v An override expression must be different from the reference formula (atleast one comparison value must be changed).
v If you no longer need an expression override definition, you can removeit (in the Add Expression Overrides window, select the check box next tothe definition and click Remove Expression). After clicking OK to closethe Add Expression Overrides window, you will be unable to edit thesituation until it has been refreshed: You can adjust the value in anexpression, but you cannot change the formula function or relationaloperator.
The following restrictions apply to override expression modeling
v The modeling graph is unavailable if the situation override is for amanaged system group.
v The modeling graph is unavailable if the situation override is for amultiple-row attribute group that has no display item (used as a keycondition).
Avoid conflicting or overlapping override expressionsFor a situation that has multiple expression overrides defined for the samemanaged system or managed system group, avoid defining conflicting oroverlapping override expressions. A typical conflict scenario is where twoor more override expressions have schedules assigned and an overlapexists in their time ranges. In these cases the order in which the individualoverride expressions are evaluated by the target agent or agents isundefined.
Keep the situation override expressions under 4000 bytesThe total number of characters used in all the expression overrides definedfor a situation should not exceed 4000 bytes. The actual size requirementfor a single override varies depending on the names and values of the keycolumns and the override expression. In one case the limit might be 25 or,in a simpler case, it might be higher.
The symptom of exceeding the 4000-byte limit is that the overrides do notwork and the monitoring server trace log shows an “exceeds limit 4000”override error. See the ITM Situation Limits > Situation Formula Overridestechnote for details.
Chapter 10. Situations for event monitoring 289
Situation overrides defined at the command lineYou can also use the Command Line Interface tacmd setOverride to definea situation override and tacmd addCalendarEntry to create a calendarschedule for the override.
A more granular schedule can be defined with tacmd addCalendarEntry,which uses the cron format, than with the Tivoli Enterprise Portal Scheduleeditor. For example, in the Schedule editor you can specify a calendarschedule for the override that runs once every hour, once every 2 hours,and so on, in 1-hour increments (such as every 3 hours at 00:00, 03:00,06:00, and so on). In the CLI you can specify interval times to the minute,such as -c 10 * * * * for every 10 minutes. If you create a schedule fromthe CLI that is too complex for the Schedule editor, an error message isdisplayed and you must use the CLI to modify the schedule.
See the IBM Tivoli Monitoring Command Reference (http://publib.boulder.ibm.com/infocenter/tivihelp/v15r1/topic/com.ibm.itm.doc_6.2.3fp1/itm623fp1_cmdref.htm) for details about thetacmds.
Disabling and enabling situation overridesA situation override starts as soon as you define it or when you have it scheduled.You can also manually enable and disable situation overrides. This procedureapplies to any override definition for a situation, scheduled or not.
Before you begin
This procedure enables or disables all the overrides for the situation. If you haveany overrides that you no longer need to keep, you can selectively remove thembeforehand.
Procedure1. Click Situation Editor or right-click the Navigator item that the situation is
associated with and click Situations.2. In the Situations tree, right-click the situation. Situations with override
definitions show an override indicator at the right end of the status bar.3. Click one of the following options:
v Enable Situation Overrides to activate the override (or overrides) for thesituation. Any unscheduled and scheduled overrides for this situation arenow enabled. Unscheduled overrides begin running immediately; scheduledoverrides are activated at their designated time.
v Disable Situation Overrides to deactivate the override (or overrides) forthe situation. Any expression overrides for this situation that are running arestopped and disabled; the original situation definition is now in effect. Anyscheduled overrides do not resume until you have enabled them againmanually or edit the schedule.
Removing override definitionsWhen you no longer want to keep a situation override, remove the definition. Youcan remove a specific override definition or all the override definitions that havebeen written for a situation.
290 IBM Tivoli Monitoring: Tivoli Enterprise Portal User's Guide
Before you begin
This procedure permanently deletes the selected override definition (ordefinitions). If you think you might want to use the override definition again at alater time, you can disable it rather than remove it.
About this task
Take one of these steps to remove the selected override definition or to remove allthe override definition for a situation.
Procedurev Remove an override definition for a situation:
1. Open the Add Expression Overrides editor:– In the Situation editor, open the situation that has an override definition
assigned (indicated by at the right end of the status bar). In theDistribution tab, select the managed system (or managed systems) fromthe Assigned list and click Override Formula.
– In the Manage Situations at Managed System window, select the situationthat has an override definition assigned (indicated by in the OverridesExist column) and click Override Formula.
2. Select the check box for each override definition that you want to removeand click Remove.
3. Save your changes by clicking Apply to keep the window open or OK toclose the window.
v Remove all the override definitions for a situation:1. Click Situation Editor or right-click the Navigator item that the situation is
associated with and click Situations.2. In the Situations tree, right-click the situation. (Use Ctrl + click to select
multiple entries or Shift + click to select all entries between the onepreviously selected and this one.) Situations with override definitions showan override indicator at the right end of the status bar.
3. Click Remove All Overrides.
What to do next
If you are in the Situation editor and want to edit the definition, you first mustrefresh the situation. To do this, click another situation in the tree, then click thissituation again. After the situation has been refreshed, you no longer see in thestatus bar.
Expression override and scheduling windowsUse the Expression override editor to create overrides for dynamic thresholdingand use the override schedule dialogs to determine when they should run.
Add Expression OverridesYou can use the Add Expression Overrides window to define a situation overrideto be distributed to one or more managed systems.
A situation override is a set of expressions that can conditionally substitutecomparison values that are different from those in the situation formula, andapplied to one or more of the managed systems that the situation is distributed to.
Chapter 10. Situations for event monitoring 291
The Add Expression Overrides window supports creating expression overridesusing specified comparison values. You can also use expression modeling to createthe override expression from a calculated baseline value.
Navigation treeThe navigation tree on the left side of the window shows the situation youare currently editing and the assigned managed systems and managedsystem groups for the situation, with the currently selected entrieshighlighted. You can click items in this list to change which systems areincluded in the override.
Reference formulaThe Reference formula area shows the original situation formula. This isthe formula you are overriding. You can view the reference formula as atable or graphic by clicking the respective Table View or GraphicView tab.
Formula overridesThe Expressions tab is divided into two panes: on the left are attributesthat can be applied to the override, but which cannot be used forexpression modeling; on the right are attributes whose override values canbe modified with expression modeling. Specify the override values toapply to the selected managed systems.v To model override values, click Model Expression (see “Model
Expression” on page 296). This feature is most effective for attributesthat have historical data collected)
v To edit an expression, click in a table cell and edit the values.– To define a schedule when the override should run, select Click
here to assign an override schedule. Select a defined schedule fromthe list or create a new schedule (see “Select Override ExpressionSchedule” on page 293).
– The columns in the right-hand section define the comparison valuesfor the expression. These are the values that will be substituted forthose in the reference formula if the override condition is met, or if nooverride condition is set. Click in the appropriate table cells to editthe comparison values used for the override expression.
v To add an expression, click Add Expression.v To remove an expression, select the check box next to the expression that
you want to remove and click Remove Expression.
The Details tab shows information for the situation override:
Assigned toThe managed systems or managed system groups to which thissituation override is currently distributed.
Priority
This field is a display-only field showing the relative priority ofthis situation override. If multiple overrides are distributed to thesame managed system, the priority determines which overridetakes precedence. This can happen if an override is distributed toan individual managed system, and another override is distributedto a managed system group that includes the same system.
Situation overrides that are distributed to managed systems have ahigher priority than overrides distributed to managed systemsgroups: 1 is the highest priority; 200 is the lowest.
292 IBM Tivoli Monitoring: Tivoli Enterprise Portal User's Guide
DescriptionEnter an optional description of the situation override.
Add ExpressionClick this button to add a new formula row.
Remove ExpressionSelect the check box next to the expression you want to delete and clickRemove Expression.
Model ExpressionClick this button to open the Model Expression dialog.
Restriction:
v An override expression cannot add attribute comparisons that do not appear inthe reference formula or change the comparison operators used.
v If the override contains multiple expressions, each must have a unique overridecondition.
v An override expression must be different from the reference formula (at leastone comparison value must be changed).
v If you no longer need an expression override definition, you can remove it (inthe Add Expression Overrides window, select the check box next to thedefinition and click Remove Expression). After clicking OK to close the AddExpression Overrides window, you will be unable to edit the situation until ithas been refreshed: You can adjust the value in an expression, but you cannotchange the formula function or relational operator.
Select Override Expression ScheduleUse the Select Override Expression Schedule dialog to select a calendar entry thatspecifies when the expression override should be applied. You can define a newschedule in this dialog and edit or delete existing schedules.
From the Add Expression Overrides dialog, click Calendar to establish aschedule, Calendar to edit a calendar schedule, or Calendar to edit an hourlyschedule.
Schedules is a list of schedules that are available for this situation. Click aschedule to see its description in the Description field. The predefined schedulesare NonPrimeShift, PrimeShift, Weekday, and Weekend. Use the following tools tocreate, edit, or delete a schedule:
Create New ScheduleDefine a new schedule including name, description, and timing.
Create Another ScheduleCopy the selected schedule and give it a new name. This is a good choiceif you want to base the new schedule on, or in contrast to, what wasdefined for the source schedule.
Modify ScheduleEdit a schedule to change the time or frequency that it runs.
Delete ScheduleDelete a schedule that you no longer need for this situation.
If you want to keep a schedule definition but disable it, click Remove. Theschedule is deselected and <No schedule> is enabled.
Chapter 10. Situations for event monitoring 293
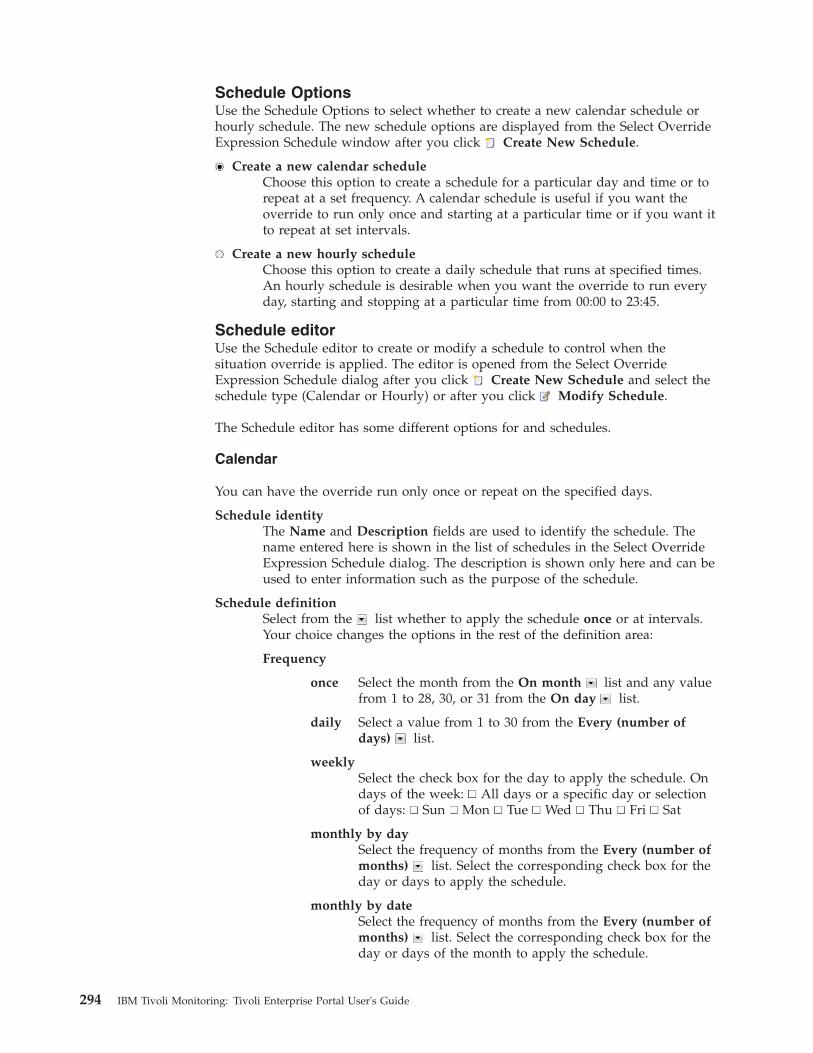
Schedule OptionsUse the Schedule Options to select whether to create a new calendar schedule orhourly schedule. The new schedule options are displayed from the Select OverrideExpression Schedule window after you click Create New Schedule.
Create a new calendar scheduleChoose this option to create a schedule for a particular day and time or torepeat at a set frequency. A calendar schedule is useful if you want theoverride to run only once and starting at a particular time or if you want itto repeat at set intervals.
Create a new hourly scheduleChoose this option to create a daily schedule that runs at specified times.An hourly schedule is desirable when you want the override to run everyday, starting and stopping at a particular time from 00:00 to 23:45.
Schedule editorUse the Schedule editor to create or modify a schedule to control when thesituation override is applied. The editor is opened from the Select OverrideExpression Schedule dialog after you click Create New Schedule and select theschedule type (Calendar or Hourly) or after you click Modify Schedule.
The Schedule editor has some different options for and schedules.
Calendar
You can have the override run only once or repeat on the specified days.
Schedule identityThe Name and Description fields are used to identify the schedule. Thename entered here is shown in the list of schedules in the Select OverrideExpression Schedule dialog. The description is shown only here and can beused to enter information such as the purpose of the schedule.
Schedule definitionSelect from the list whether to apply the schedule once or at intervals.Your choice changes the options in the rest of the definition area:
Frequency
once Select the month from the On month list and any valuefrom 1 to 28, 30, or 31 from the On day list.
daily Select a value from 1 to 30 from the Every (number ofdays) list.
weeklySelect the check box for the day to apply the schedule. Ondays of the week: All days or a specific day or selectionof days: Sun Mon Tue Wed Thu Fri Sat
monthly by daySelect the frequency of months from the Every (number ofmonths) list. Select the corresponding check box for theday or days to apply the schedule.
monthly by dateSelect the frequency of months from the Every (number ofmonths) list. Select the corresponding check box for theday or days of the month to apply the schedule.
294 IBM Tivoli Monitoring: Tivoli Enterprise Portal User's Guide
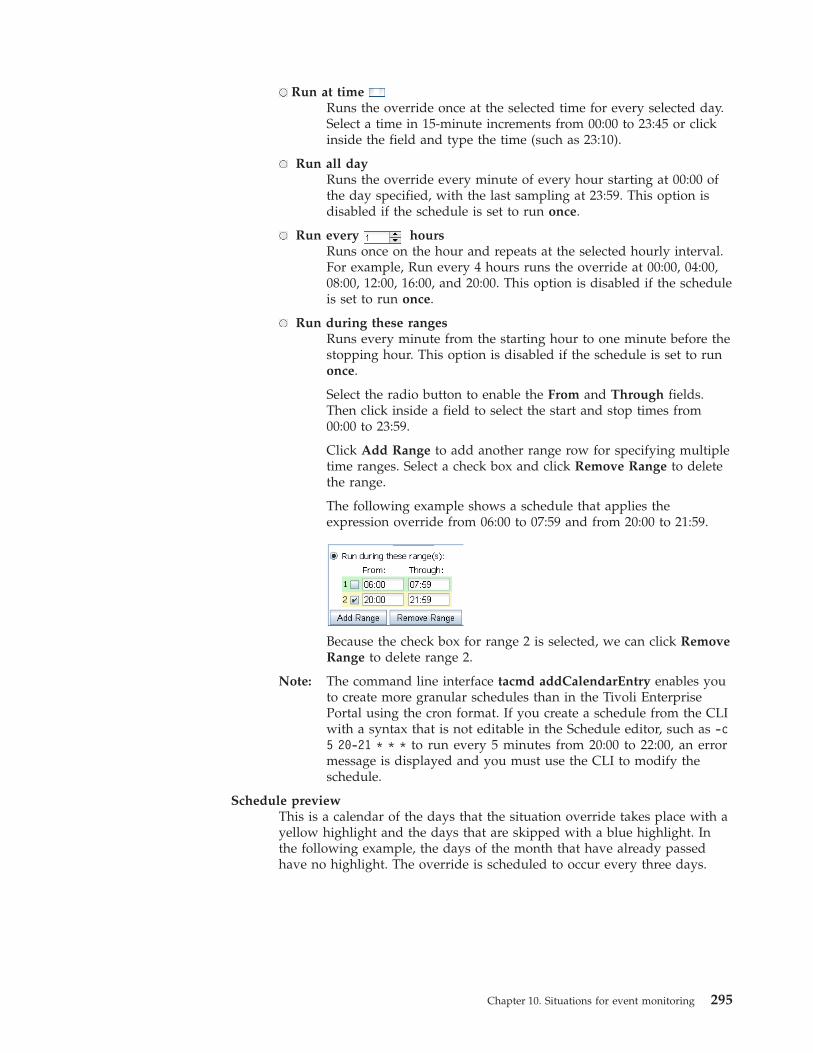
Run at timeRuns the override once at the selected time for every selected day.Select a time in 15-minute increments from 00:00 to 23:45 or clickinside the field and type the time (such as 23:10).
Run all dayRuns the override every minute of every hour starting at 00:00 ofthe day specified, with the last sampling at 23:59. This option isdisabled if the schedule is set to run once.
Run every hoursRuns once on the hour and repeats at the selected hourly interval.For example, Run every 4 hours runs the override at 00:00, 04:00,08:00, 12:00, 16:00, and 20:00. This option is disabled if the scheduleis set to run once.
Run during these rangesRuns every minute from the starting hour to one minute before thestopping hour. This option is disabled if the schedule is set to runonce.
Select the radio button to enable the From and Through fields.Then click inside a field to select the start and stop times from00:00 to 23:59.
Click Add Range to add another range row for specifying multipletime ranges. Select a check box and click Remove Range to deletethe range.
The following example shows a schedule that applies theexpression override from 06:00 to 07:59 and from 20:00 to 21:59.
Because the check box for range 2 is selected, we can click RemoveRange to delete range 2.
Note: The command line interface tacmd addCalendarEntry enables youto create more granular schedules than in the Tivoli EnterprisePortal using the cron format. If you create a schedule from the CLIwith a syntax that is not editable in the Schedule editor, such as -c5 20-21 * * * to run every 5 minutes from 20:00 to 22:00, an errormessage is displayed and you must use the CLI to modify theschedule.
Schedule previewThis is a calendar of the days that the situation override takes place with ayellow highlight and the days that are skipped with a blue highlight. Inthe following example, the days of the month that have already passedhave no highlight. The override is scheduled to occur every three days.
Chapter 10. Situations for event monitoring 295
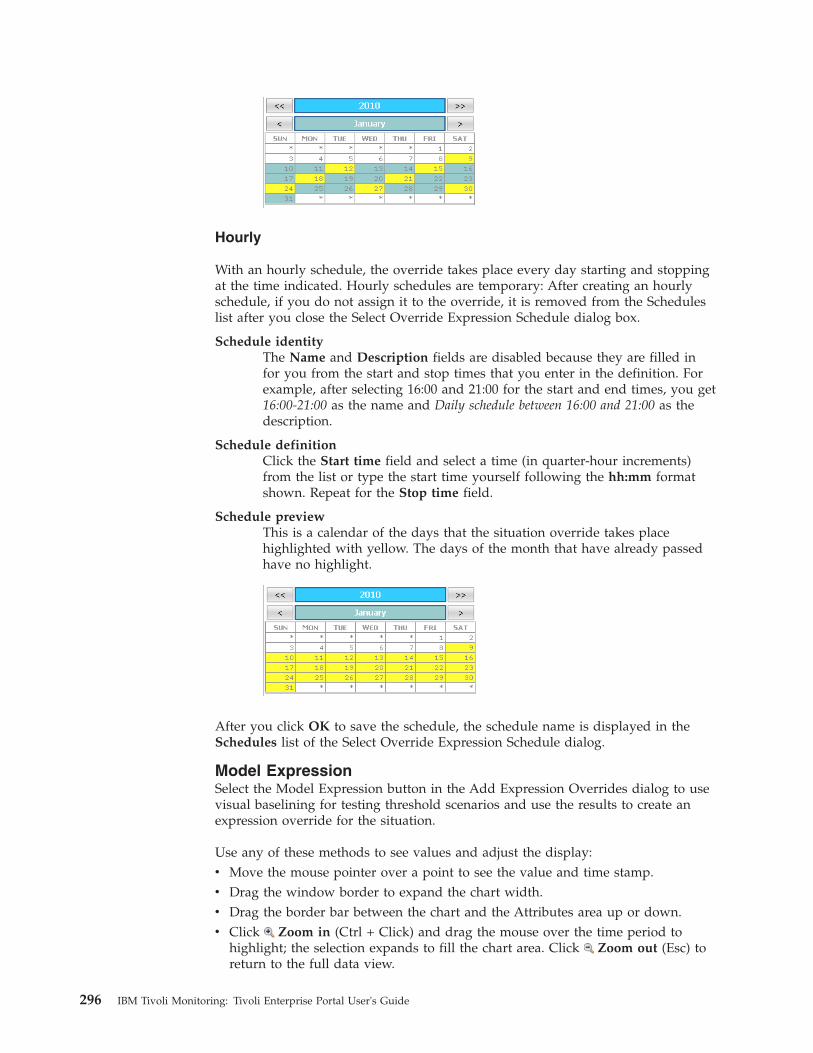
Hourly
With an hourly schedule, the override takes place every day starting and stoppingat the time indicated. Hourly schedules are temporary: After creating an hourlyschedule, if you do not assign it to the override, it is removed from the Scheduleslist after you close the Select Override Expression Schedule dialog box.
Schedule identityThe Name and Description fields are disabled because they are filled infor you from the start and stop times that you enter in the definition. Forexample, after selecting 16:00 and 21:00 for the start and end times, you get16:00-21:00 as the name and Daily schedule between 16:00 and 21:00 as thedescription.
Schedule definitionClick the Start time field and select a time (in quarter-hour increments)from the list or type the start time yourself following the hh:mm formatshown. Repeat for the Stop time field.
Schedule previewThis is a calendar of the days that the situation override takes placehighlighted with yellow. The days of the month that have already passedhave no highlight.
After you click OK to save the schedule, the schedule name is displayed in theSchedules list of the Select Override Expression Schedule dialog.
Model ExpressionSelect the Model Expression button in the Add Expression Overrides dialog to usevisual baselining for testing threshold scenarios and use the results to create anexpression override for the situation.
Use any of these methods to see values and adjust the display:v Move the mouse pointer over a point to see the value and time stamp.v Drag the window border to expand the chart width.v Drag the border bar between the chart and the Attributes area up or down.v Click Zoom in (Ctrl + Click) and drag the mouse over the time period to
highlight; the selection expands to fill the chart area. Click Zoom out (Esc) toreturn to the full data view.
296 IBM Tivoli Monitoring: Tivoli Enterprise Portal User's Guide
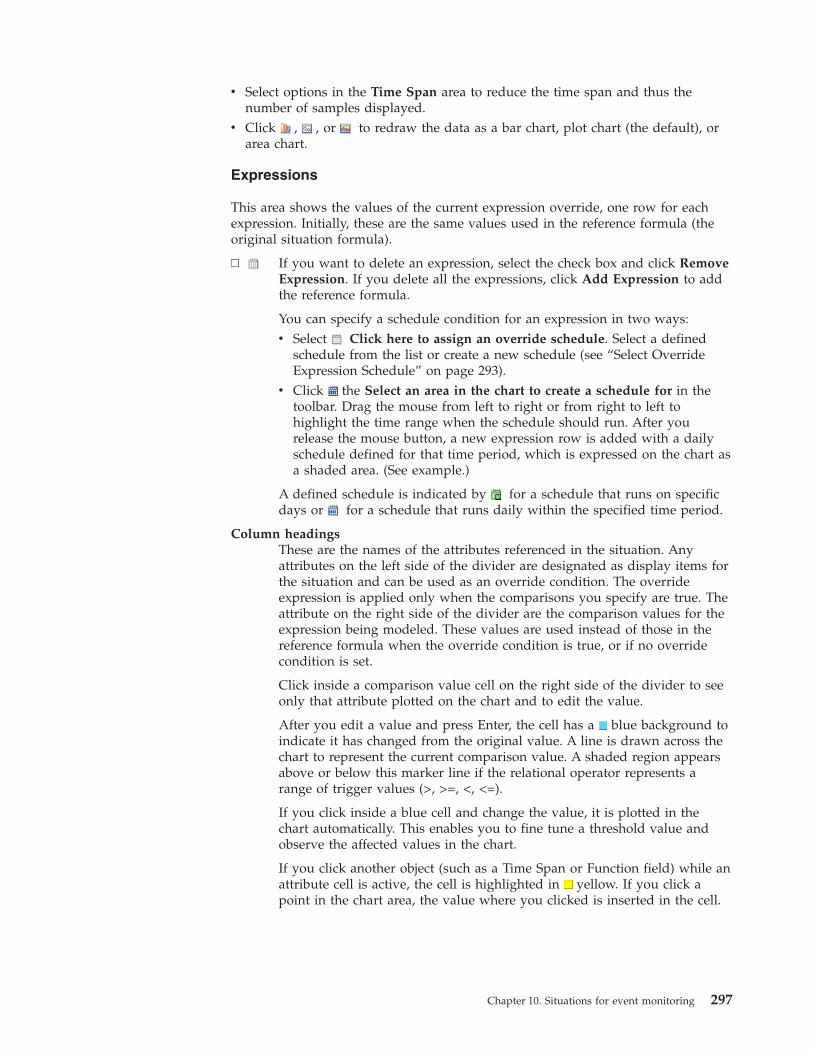
v Select options in the Time Span area to reduce the time span and thus thenumber of samples displayed.
v Click , , or to redraw the data as a bar chart, plot chart (the default), orarea chart.
Expressions
This area shows the values of the current expression override, one row for eachexpression. Initially, these are the same values used in the reference formula (theoriginal situation formula).
If you want to delete an expression, select the check box and click RemoveExpression. If you delete all the expressions, click Add Expression to addthe reference formula.
You can specify a schedule condition for an expression in two ways:v Select Click here to assign an override schedule. Select a defined
schedule from the list or create a new schedule (see “Select OverrideExpression Schedule” on page 293).
v Click the Select an area in the chart to create a schedule for in thetoolbar. Drag the mouse from left to right or from right to left tohighlight the time range when the schedule should run. After yourelease the mouse button, a new expression row is added with a dailyschedule defined for that time period, which is expressed on the chart asa shaded area. (See example.)
A defined schedule is indicated by for a schedule that runs on specificdays or for a schedule that runs daily within the specified time period.
Column headingsThese are the names of the attributes referenced in the situation. Anyattributes on the left side of the divider are designated as display items forthe situation and can be used as an override condition. The overrideexpression is applied only when the comparisons you specify are true. Theattribute on the right side of the divider are the comparison values for theexpression being modeled. These values are used instead of those in thereference formula when the override condition is true, or if no overridecondition is set.
Click inside a comparison value cell on the right side of the divider to seeonly that attribute plotted on the chart and to edit the value.
After you edit a value and press Enter, the cell has a blue background toindicate it has changed from the original value. A line is drawn across thechart to represent the current comparison value. A shaded region appearsabove or below this marker line if the relational operator represents arange of trigger values (>, >=, <, <=).
If you click inside a blue cell and change the value, it is plotted in thechart automatically. This enables you to fine tune a threshold value andobserve the affected values in the chart.
If you click another object (such as a Time Span or Function field) while anattribute cell is active, the cell is highlighted in yellow. If you click apoint in the chart area, the value where you clicked is inserted in the cell.
Chapter 10. Situations for event monitoring 297
Functions
This area is displayed when the attribute group used in the situation hashistorically collected values. Click a cell in the Expressions area to enable theFunctions area, and select the check box for the statistical function to use.Optionally enter a value in the Argument field and click Recalculate to see theadjusted threshold in the Result field and plot it on the chart as a colored line.
AVGFor the selected attribute, calculate the average value from the samplestaken during the time period, and add or subtract the standard deviationthat was entered in the Argument field. Valid values are -6 to 6.
MINFor the selected attribute, find the lowest sampled value within the timeperiod, and increase or decrease that value by the percentage that wasentered in the Argument field. Valid values are -100 to 100.
MAXFor the selected attribute, find the highest sampled value within the timeperiod and increase or decrease that value by the percentage that wasentered in the Argument field. Valid values are -100 to 100.
PERCENTILEFor the selected attribute, find the value below which NUM percent of thedata points fall; where NUM is the value from the Argument field. Validvalues are 1 to 100.
MODEFor the selected attribute, find the most frequently observed value withinthe time period. No argument is entered for a MODE calculation.
CopyAdd the value from the Result cell to the selected cell in the Attributesarea.
Chart optionsModify the appearance of the threshold: Visible in legend to addThreshold to the legend, Show chart label to add a threshold label, andFill Style to change the threshold pattern or color. Click Custom Colors tochoose from a wider selection of colors or to create your own.
Time Span
This area is displayed when the attribute group used in the situation hashistorically collected values. The Last 24 Hours is shown by default.
Last You can change from the default 24 hours to a different value or unit oftime (Hours, Days, Weeks, Months, Quarters, Years).
The Time Column field shows the attribute for the time stamp, such asRecording Time.
CustomUse the Custom tab to plot a specific date range or to select a differenttime attribute.
Click inside the Start Time and End Time fields to select a date and time.
The Time Column field shows the attribute for the time stamp, such asRecording Time.
298 IBM Tivoli Monitoring: Tivoli Enterprise Portal User's Guide
Daily Use the Daily tab to plot a specific time range.
Click inside the Start Time and End Time fields to select a date and time.
Select the Show data for last check box and specify the number ofdays to plot.
Select calendar day to include any weekend days that fall within thedate range; or weekdays to exclude weekend days. For example, if todayis Monday and you select the last 2 weekdays, Thursday and Friday of thepast week are plotted.
Select the Show this day's data check box to select a specific date to plotwithin the time range.
Buttons
RecalculateClick Recalculate after you have entered an argument for a statisticalfunction to see the result in the Result column and plotted on the chart.Use this button also to refresh the chart with any changes you make to thetime span selection or override key conditions.
OK Click OK to close the dialog and use the values from the Expressions areafor the expression override.
Reset After you click inside an attribute cell, the chart is redrawn to plot onlythat attribute. If you also select a statistical function and click Recalculate,the statistical result is also plotted. Click Reset to redraw the chart with allattributes.
These are all the reset actions taken:v Cancel any attribute selection in the tablev Clear any shaded threshold area in the chartv Show all chart series if any were not visiblev Remove all statistical markers from the chartv Clear the Function fields, including function resultsv Cancel any zooms in progressv Disable the create schedule action
CancelClick Cancel to exit the dialog without saving your changes.
Example
This example shows a daily schedule over three days that applies the override >=75 from 01:00 to 06:00.
Chapter 10. Situations for event monitoring 299
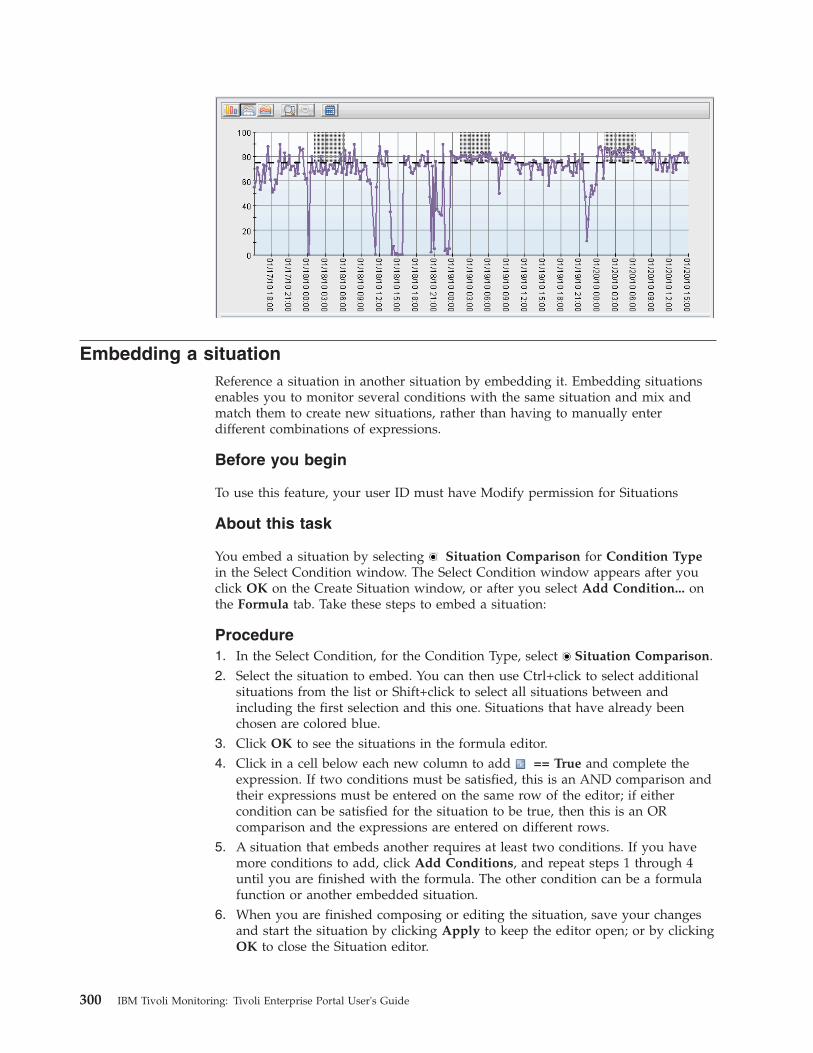
Embedding a situationReference a situation in another situation by embedding it. Embedding situationsenables you to monitor several conditions with the same situation and mix andmatch them to create new situations, rather than having to manually enterdifferent combinations of expressions.
Before you begin
To use this feature, your user ID must have Modify permission for Situations
About this task
You embed a situation by selecting Situation Comparison for Condition Typein the Select Condition window. The Select Condition window appears after youclick OK on the Create Situation window, or after you select Add Condition... onthe Formula tab. Take these steps to embed a situation:
Procedure1. In the Select Condition, for the Condition Type, select Situation Comparison.2. Select the situation to embed. You can then use Ctrl+click to select additional
situations from the list or Shift+click to select all situations between andincluding the first selection and this one. Situations that have already beenchosen are colored blue.
3. Click OK to see the situations in the formula editor.4. Click in a cell below each new column to add == True and complete the
expression. If two conditions must be satisfied, this is an AND comparison andtheir expressions must be entered on the same row of the editor; if eithercondition can be satisfied for the situation to be true, then this is an ORcomparison and the expressions are entered on different rows.
5. A situation that embeds another requires at least two conditions. If you havemore conditions to add, click Add Conditions, and repeat steps 1 through 4until you are finished with the formula. The other condition can be a formulafunction or another embedded situation.
6. When you are finished composing or editing the situation, save your changesand start the situation by clicking Apply to keep the editor open; or by clickingOK to close the Situation editor.
300 IBM Tivoli Monitoring: Tivoli Enterprise Portal User's Guide
Results
The Situation editor performs syntax checking on each expression you enter. If youentered an improper value for an attribute, such as “abc” for Disk Size, the cellturns red and the situation will not be saved until you correct the error.
The properties of the embedding situation, such as the monitoring interval,override the properties of the embedded situation.
In the unlikely event that two users attempt to save a situation with the samename simultaneously, an error will occur ensuring that one situation does notoverwrite another.
What to do next
If you opened the Situation editor from the toolbar, the situation you just createdwill not be associated with any Navigator items and no event indicator isdisplayed when the situation becomes true. You must associate a situation with aNavigator item or change its state and click Apply.
You must distribute each embedded situation to the same managed systems as theembedding situation. Otherwise, the embedding situation does not run.
If you change an embedded situation, you must restart each situation that embedsit.
When you stop a situation that embeds other situations, only the embeddingsituation is stopped; the embedded situations continue to run.
A situation cannot be embedded in the situation if it has a display item assigned.You can create another situation and remove the display item assignment from thenew situation to enable it for embedding.
Situations are stored at the hub monitoring server. It is possible that while youwere building the situation that any of the embedded situations could have bedeleted. Should this happen, a message will tell you that the embedded situation ismissing when you attempt to save your changes. You will need to remove theembedded situation from this one before you can save it. You can always create anew situation to be embedded or find another one that is the equivalent andembed that one.
Correlating situationsCreate a correlated situation, which is made up entirely of other situations, totarget a set of conditions on a subset of the original distribution. For example, youmight have two situations that signify a critical breakdown when they bothbecome true on a particular managed system. You can create a correlated situationof these two situations and distribute it to the managed system in question.
Before you begin
To use this feature, your user ID must have Modify permission for Situations andhave the Enterprise Monitoring Server as an Allowed Application.
Chapter 10. Situations for event monitoring 301
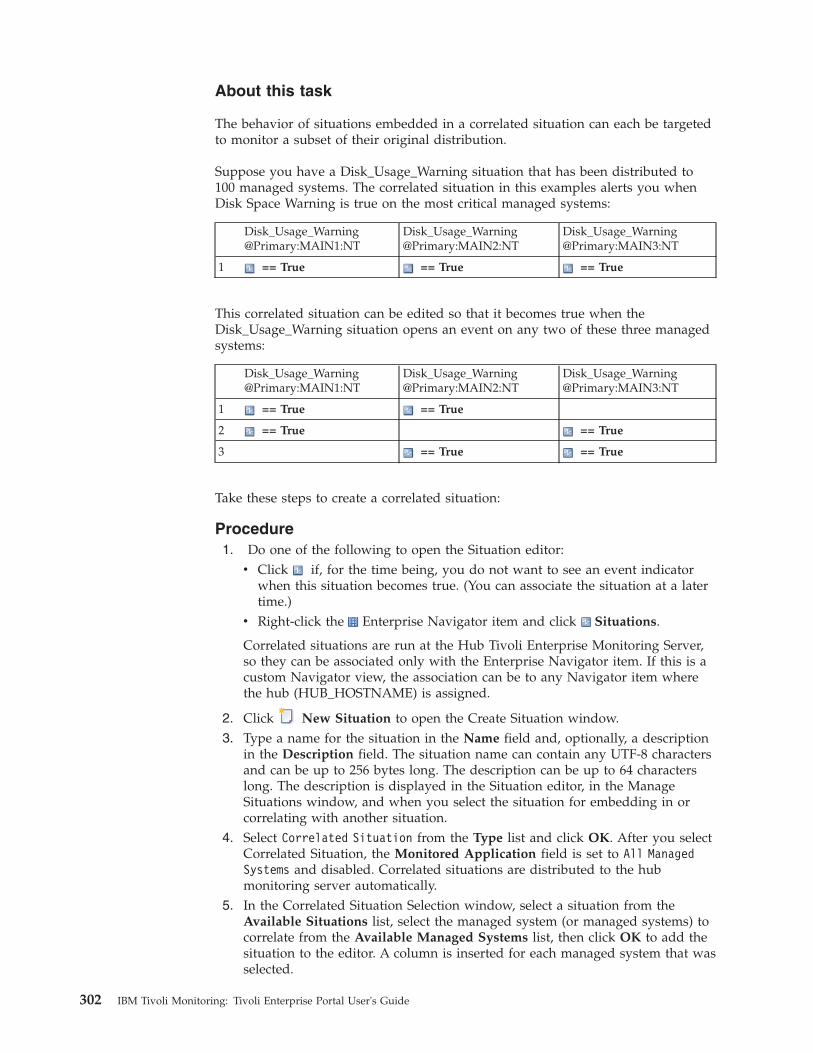
About this task
The behavior of situations embedded in a correlated situation can each be targetedto monitor a subset of their original distribution.
Suppose you have a Disk_Usage_Warning situation that has been distributed to100 managed systems. The correlated situation in this examples alerts you whenDisk Space Warning is true on the most critical managed systems:
Disk_Usage_Warning@Primary:MAIN1:NT
Disk_Usage_Warning@Primary:MAIN2:NT
Disk_Usage_Warning@Primary:MAIN3:NT
1 == True == True == True
This correlated situation can be edited so that it becomes true when theDisk_Usage_Warning situation opens an event on any two of these three managedsystems:
Disk_Usage_Warning@Primary:MAIN1:NT
Disk_Usage_Warning@Primary:MAIN2:NT
Disk_Usage_Warning@Primary:MAIN3:NT
1 == True == True
2 == True == True
3 == True == True
Take these steps to create a correlated situation:
Procedure1. Do one of the following to open the Situation editor:
v Click if, for the time being, you do not want to see an event indicatorwhen this situation becomes true. (You can associate the situation at a latertime.)
v Right-click the Enterprise Navigator item and click Situations.
Correlated situations are run at the Hub Tivoli Enterprise Monitoring Server,so they can be associated only with the Enterprise Navigator item. If this is acustom Navigator view, the association can be to any Navigator item wherethe hub (HUB_HOSTNAME) is assigned.
2. Click New Situation to open the Create Situation window.3. Type a name for the situation in the Name field and, optionally, a description
in the Description field. The situation name can contain any UTF-8 charactersand can be up to 256 bytes long. The description can be up to 64 characterslong. The description is displayed in the Situation editor, in the ManageSituations window, and when you select the situation for embedding in orcorrelating with another situation.
4. Select Correlated Situation from the Type list and click OK. After you selectCorrelated Situation, the Monitored Application field is set to All ManagedSystems and disabled. Correlated situations are distributed to the hubmonitoring server automatically.
5. In the Correlated Situation Selection window, select a situation from theAvailable Situations list, select the managed system (or managed systems) tocorrelate from the Available Managed Systems list, then click OK to add thesituation to the editor. A column is inserted for each managed system that wasselected.
302 IBM Tivoli Monitoring: Tivoli Enterprise Portal User's Guide
6. Click in a cell below each new column to add == True and complete theexpression. If the comparison must be satisfied on both managed systems, thisis an AND comparison and their expressions must be entered on the samerow; if the comparison can be satisfied on either managed system, this is anOR comparison and the expressions must be entered on different rows.
7. A correlated situation is not complete until it has at least two conditions. Ifyou have more situations to add, click Add Conditions, select the nextsituation and managed system (or managed systems), click OK, and selectinside a cell of each column added. If a managed system name is colored blueinstead of black, it means the situation for this managed system was alreadyadded to the correlation formula.
8. Adjust any other settings in the Formula tab to complete the formula:v To add event persistence, click Advanced.v To change the sampling interval, click inside the dd (day), hh (hour), mm
(minute) or ss (second) field and click the up and down arrows.v To start the situation manually rather than automatically, clear .v To choose a different State, select one from the list. (Not available if you
opened the Situation editor from the main toolbar.)v To play a sound when an event opens, select in the Sound area. Click
Edit to change the sound file or its properties. (Not available if you openedthe Situation editor from the main toolbar.)
9. Specify options on the other tabs as needed.10. When you are finished composing or editing the situation, save your changes
and start the situation by clicking Apply to keep the editor open; or byclicking OK to close the Situation editor.
Results
The properties of the embedding situation, such as the monitoring interval,override the properties of the embedded situation.
If you enter a system command in the Action tab, the Attribute Substitutionbutton is disabled because a correlated situation references one or more situationsand not attribute groups.
When you stop a situation that embeds other situations, only the embeddingsituation is stopped; the embedded situations continue to run.
What to do next
If you change an embedded situation, you must restart each situation that embedsit.
If you opened the Situation editor from the toolbar or from any Navigator itemother than the one to which the hub monitoring server is assigned, the situationyou just created will not be associated with any Navigator items and no eventindicator is displayed when the situation becomes true. If this is the case,right-click the Enterprise Navigator item and click Situations. In the Situationeditor, click Situation Filter and select Eligible for Association. In theSituation tree, right-click the correlated situation and click Associate,thenApply or OK.
A situation cannot be referenced in the correlated situation if it has a display itemassigned. You can create another situation and remove the display item assignment
Chapter 10. Situations for event monitoring 303
from the new situation to enable it for inclusion in a correlated situation.
Tutorial: Correlating situations across managed resourcesYou can gets hands on experience in correlating situations across managedresources by completing the tasks in this tutorial.
Tasks to accomplish the goal
The following tasks will accomplish the goal:1. Create a situation that monitors for the missing process and opens an
Informational situation event.2. Create a correlated situation to reference this situation and to become
true for any two of the three computers. When the situation becomestrue it will open a Warning situation event.
3. Create a second correlated situation much like the other, but have itbecome true only when the process is missing on all three computers.When the situation becomes true it will open a Critical situation event.
To use this feature, your user ID must have Modify permission forSituations.
Note: The following scenario assumes that you have the Windows OSmonitoring agent installed.
The situations developed for your monitoring environment can be designed toconvey the true urgency of the situation event while ensuring that operators arenot overwhelmed by unnecessary alerts.
In this scenario, a company has software used by the support staff that must berunning on any of three computers at all times. The goal is to find out when thesoftware is not running, and to prioritize the alerts so that when the process isstopped on two systems, a warning alert is issued; and if it is stopped on all threesystems, a critical alert is issued.
First task
Create a situation that monitors for the missing process and opens anInformational situation event:1. Right-click the Process (Enterprise > Windows Systems > Windows
OS > Process) Navigator item and click Situations.2. In the Situation editor, click New Situation to open the Create
Situation window.3. Type Missing Process in the Name field (where Process is the name
of the executable software), select Windows OS as the MonitoredApplication, and click OK.
4. In the Select Condition window, select the NT_Process attribute groupand the Process Name attribute, then click OK.
5. Click inside the row 1 Process Name cell, click the Function fieldand select Check for Missing Items.
6. Type the name of the software process in the Missing Item List andclick OK.For the hands-on practice, type notepad.
7. Select Informational from the State field.8. Click the Distribution tab, move the other two managed systems to
the Assigned list.
304 IBM Tivoli Monitoring: Tivoli Enterprise Portal User's Guide
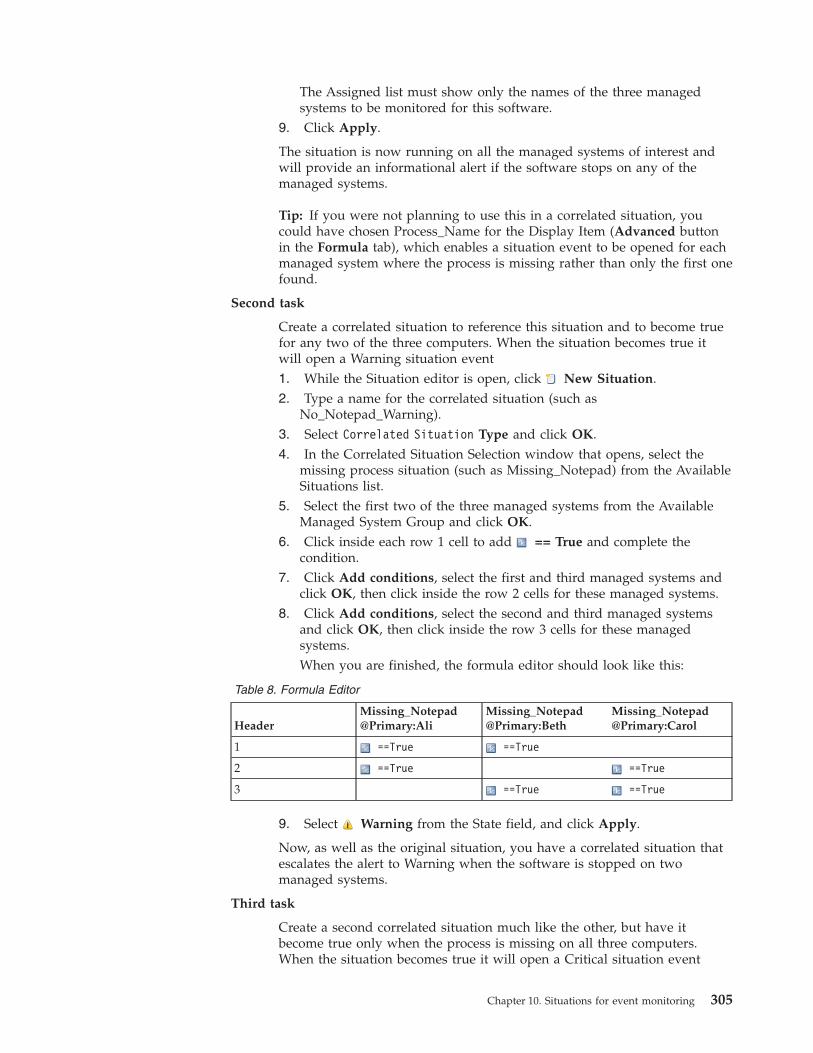
The Assigned list must show only the names of the three managedsystems to be monitored for this software.
9. Click Apply.
The situation is now running on all the managed systems of interest andwill provide an informational alert if the software stops on any of themanaged systems.
Tip: If you were not planning to use this in a correlated situation, youcould have chosen Process_Name for the Display Item (Advanced buttonin the Formula tab), which enables a situation event to be opened for eachmanaged system where the process is missing rather than only the first onefound.
Second task
Create a correlated situation to reference this situation and to become truefor any two of the three computers. When the situation becomes true itwill open a Warning situation event1. While the Situation editor is open, click New Situation.2. Type a name for the correlated situation (such as
No_Notepad_Warning).3. Select Correlated Situation Type and click OK.4. In the Correlated Situation Selection window that opens, select the
missing process situation (such as Missing_Notepad) from the AvailableSituations list.
5. Select the first two of the three managed systems from the AvailableManaged System Group and click OK.
6. Click inside each row 1 cell to add == True and complete thecondition.
7. Click Add conditions, select the first and third managed systems andclick OK, then click inside the row 2 cells for these managed systems.
8. Click Add conditions, select the second and third managed systemsand click OK, then click inside the row 3 cells for these managedsystems.When you are finished, the formula editor should look like this:
Table 8. Formula Editor
HeaderMissing_Notepad@Primary:Ali
Missing_Notepad@Primary:Beth
Missing_Notepad@Primary:Carol
1 ==True ==True
2 ==True ==True
3 ==True ==True
9. Select Warning from the State field, and click Apply.
Now, as well as the original situation, you have a correlated situation thatescalates the alert to Warning when the software is stopped on twomanaged systems.
Third task
Create a second correlated situation much like the other, but have itbecome true only when the process is missing on all three computers.When the situation becomes true it will open a Critical situation event
Chapter 10. Situations for event monitoring 305
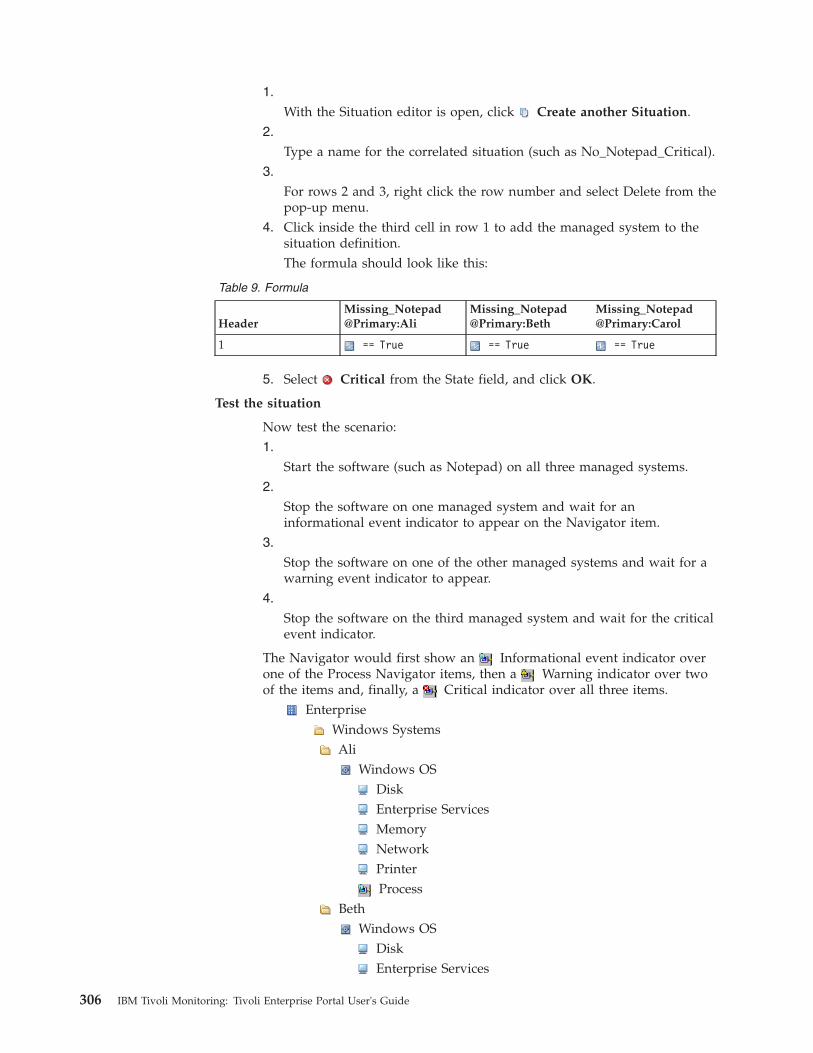
1.
With the Situation editor is open, click Create another Situation.2.
Type a name for the correlated situation (such as No_Notepad_Critical).3.
For rows 2 and 3, right click the row number and select Delete from thepop-up menu.
4. Click inside the third cell in row 1 to add the managed system to thesituation definition.The formula should look like this:
Table 9. Formula
HeaderMissing_Notepad@Primary:Ali
Missing_Notepad@Primary:Beth
Missing_Notepad@Primary:Carol
1 == True == True == True
5. Select Critical from the State field, and click OK.
Test the situation
Now test the scenario:1.
Start the software (such as Notepad) on all three managed systems.2.
Stop the software on one managed system and wait for aninformational event indicator to appear on the Navigator item.
3.
Stop the software on one of the other managed systems and wait for awarning event indicator to appear.
4.
Stop the software on the third managed system and wait for the criticalevent indicator.
The Navigator would first show an Informational event indicator overone of the Process Navigator items, then a Warning indicator over twoof the items and, finally, a Critical indicator over all three items.
EnterpriseWindows SystemsAli
Windows OSDiskEnterprise ServicesMemoryNetworkPrinterProcess
BethWindows OS
DiskEnterprise Services
306 IBM Tivoli Monitoring: Tivoli Enterprise Portal User's Guide
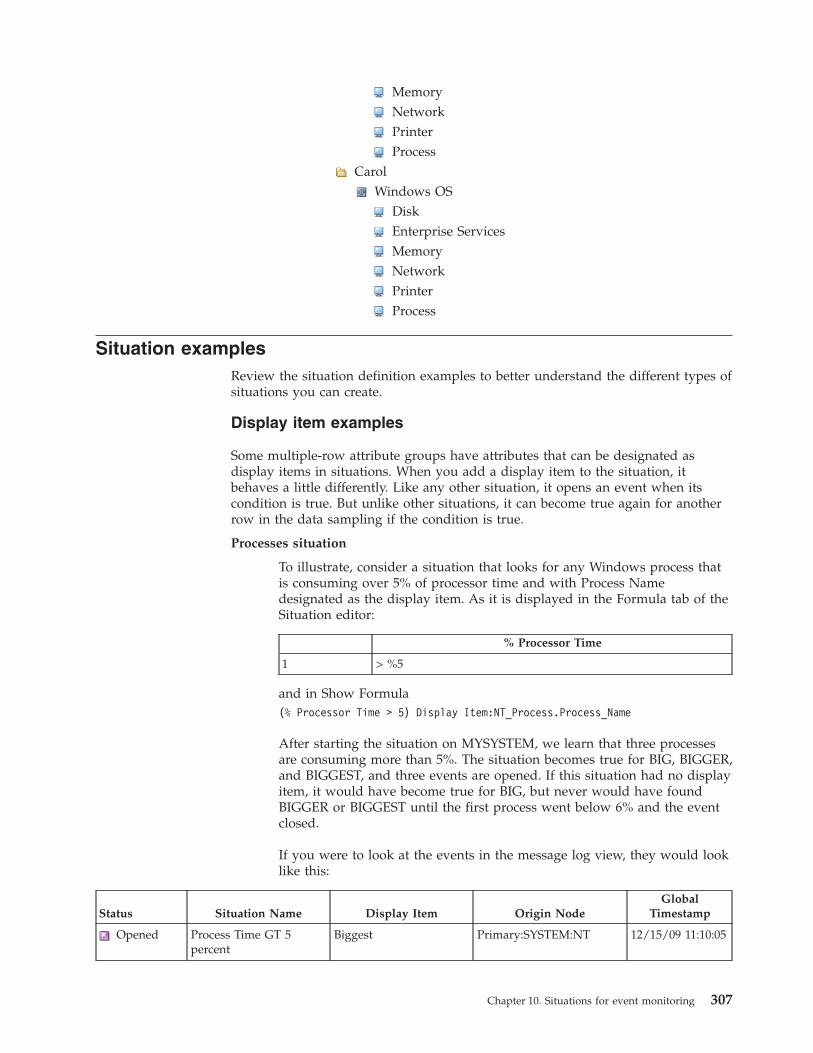
MemoryNetworkPrinterProcess
CarolWindows OS
DiskEnterprise ServicesMemoryNetworkPrinterProcess
Situation examplesReview the situation definition examples to better understand the different types ofsituations you can create.
Display item examples
Some multiple-row attribute groups have attributes that can be designated asdisplay items in situations. When you add a display item to the situation, itbehaves a little differently. Like any other situation, it opens an event when itscondition is true. But unlike other situations, it can become true again for anotherrow in the data sampling if the condition is true.
Processes situation
To illustrate, consider a situation that looks for any Windows process thatis consuming over 5% of processor time and with Process Namedesignated as the display item. As it is displayed in the Formula tab of theSituation editor:
% Processor Time
1 > %5
and in Show Formula(% Processor Time > 5) Display Item:NT_Process.Process_Name
After starting the situation on MYSYSTEM, we learn that three processesare consuming more than 5%. The situation becomes true for BIG, BIGGER,and BIGGEST, and three events are opened. If this situation had no displayitem, it would have become true for BIG, but never would have foundBIGGER or BIGGEST until the first process went below 6% and the eventclosed.
If you were to look at the events in the message log view, they would looklike this:
Status Situation Name Display Item Origin NodeGlobal
Timestamp
Opened Process Time GT 5percent
Biggest Primary:SYSTEM:NT 12/15/09 11:10:05
Chapter 10. Situations for event monitoring 307
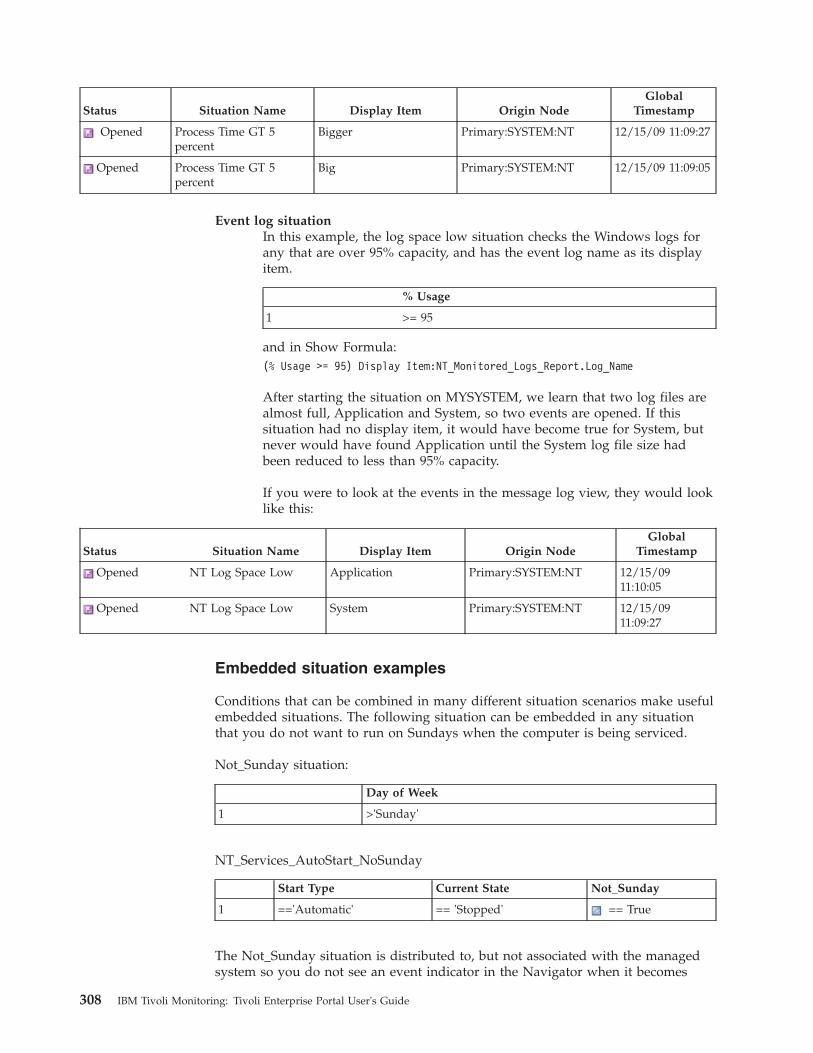
Status Situation Name Display Item Origin NodeGlobal
Timestamp
Opened Process Time GT 5percent
Bigger Primary:SYSTEM:NT 12/15/09 11:09:27
Opened Process Time GT 5percent
Big Primary:SYSTEM:NT 12/15/09 11:09:05
Event log situationIn this example, the log space low situation checks the Windows logs forany that are over 95% capacity, and has the event log name as its displayitem.
% Usage
1 >= 95
and in Show Formula:(% Usage >= 95) Display Item:NT_Monitored_Logs_Report.Log_Name
After starting the situation on MYSYSTEM, we learn that two log files arealmost full, Application and System, so two events are opened. If thissituation had no display item, it would have become true for System, butnever would have found Application until the System log file size hadbeen reduced to less than 95% capacity.
If you were to look at the events in the message log view, they would looklike this:
Status Situation Name Display Item Origin NodeGlobal
Timestamp
Opened NT Log Space Low Application Primary:SYSTEM:NT 12/15/0911:10:05
Opened NT Log Space Low System Primary:SYSTEM:NT 12/15/0911:09:27
Embedded situation examples
Conditions that can be combined in many different situation scenarios make usefulembedded situations. The following situation can be embedded in any situationthat you do not want to run on Sundays when the computer is being serviced.
Not_Sunday situation:
Day of Week
1 >'Sunday'
NT_Services_AutoStart_NoSunday
Start Type Current State Not_Sunday
1 =='Automatic' == 'Stopped' == True
The Not_Sunday situation is distributed to, but not associated with the managedsystem so you do not see an event indicator in the Navigator when it becomes
308 IBM Tivoli Monitoring: Tivoli Enterprise Portal User's Guide
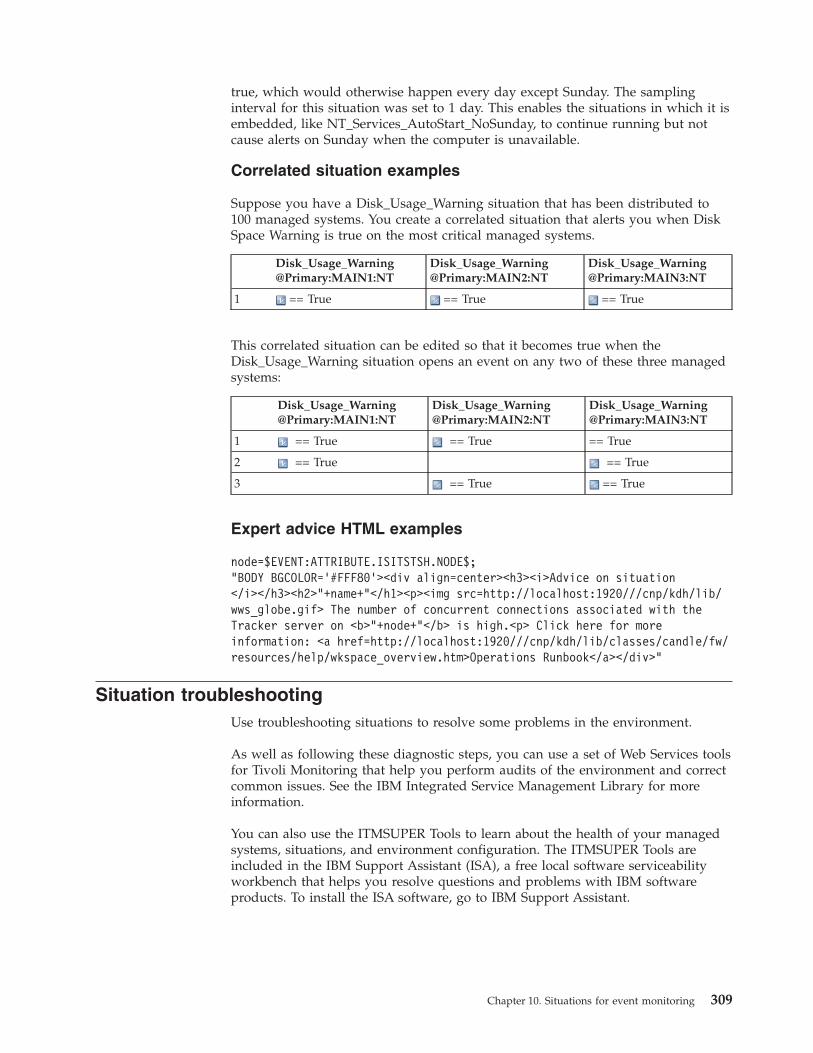
true, which would otherwise happen every day except Sunday. The samplinginterval for this situation was set to 1 day. This enables the situations in which it isembedded, like NT_Services_AutoStart_NoSunday, to continue running but notcause alerts on Sunday when the computer is unavailable.
Correlated situation examples
Suppose you have a Disk_Usage_Warning situation that has been distributed to100 managed systems. You create a correlated situation that alerts you when DiskSpace Warning is true on the most critical managed systems.
Disk_Usage_Warning@Primary:MAIN1:NT
Disk_Usage_Warning@Primary:MAIN2:NT
Disk_Usage_Warning@Primary:MAIN3:NT
1 == True == True == True
This correlated situation can be edited so that it becomes true when theDisk_Usage_Warning situation opens an event on any two of these three managedsystems:
Disk_Usage_Warning@Primary:MAIN1:NT
Disk_Usage_Warning@Primary:MAIN2:NT
Disk_Usage_Warning@Primary:MAIN3:NT
1 == True == True == True
2 == True == True
3 == True == True
Expert advice HTML examples
node=$EVENT:ATTRIBUTE.ISITSTSH.NODE$;"BODY BGCOLOR=’#FFF80’><div align=center><h3><i>Advice on situation</i></h3><h2>"+name+"</h1><p><img src=http://localhost:1920///cnp/kdh/lib/wws_globe.gif> The number of concurrent connections associated with theTracker server on <b>"+node+"</b> is high.<p> Click here for moreinformation: <a href=http://localhost:1920///cnp/kdh/lib/classes/candle/fw/resources/help/wkspace_overview.htm>Operations Runbook</a></div>"
Situation troubleshootingUse troubleshooting situations to resolve some problems in the environment.
As well as following these diagnostic steps, you can use a set of Web Services toolsfor Tivoli Monitoring that help you perform audits of the environment and correctcommon issues. See the IBM Integrated Service Management Library for moreinformation.
You can also use the ITMSUPER Tools to learn about the health of your managedsystems, situations, and environment configuration. The ITMSUPER Tools areincluded in the IBM Support Assistant (ISA), a free local software serviceabilityworkbench that helps you resolve questions and problems with IBM softwareproducts. To install the ISA software, go to IBM Support Assistant.
Chapter 10. Situations for event monitoring 309
Agent not connected to the monitoring serverAfter a situation has been distributed to an agent and started, it continues to rununtil it is stopped manually. Most situations at the agent also stop when the agentto which the situations are distributed loses contact with its Tivoli EnterpriseMonitoring Server.
The situations that continue to run at the agent are considered to be autonomoussituations.
There are two categories of autonomous agent situations:v Historical data collection (or UADVISOR) situations where historical data is
configured to be stored at the agent. UADVISOR situations are used to gatherdata samples at intervals and then insert the samples in historical data fileslocated at either the monitoring server (TEMS) or agent (TEMA). When historicaldata collection is stored at the agent, the UADVISOR situations continue to runwhen the agent loses communication with its monitoring server.
v A situation that specifies an action command (reflex automation) that is to beexecuted at the agent. A situation containing an action command creates twoseparate requests that are sent to the agent. One request returns the event databack to the monitoring server. The second request executes the command. Onlythe request executing the command at the agent will remain active when themonitoring server connection is lost.
Troubleshooting events not openingA Critical, Warning, or Informational status light goes on in the Navigator when asituation associated with an item becomes true.
About this task
If a light is not displayed when you think it should be, check each item below insequence until the issue is resolved:
Procedure1. Is the managed system online ? Situations cannot run on an offline managed
system.v If the agent is offline, restart it. The installation guide for your IBM Tivoli
Monitoring product has instructions for configuring and starting an agent. Ifyou cannot restart the agent, contact IBM Support.
v If you see a status discrepancy between the Navigator and the ManagedSystems Status table (one view shows the agent is offline and the othershows it online), try recycling the Tivoli Enterprise Portal Server. If thecondition does not clear, contact IBM Support.
2. Is the situation distributed to the managed system and associated with a Navigatoritem? To find out, right-click the Navigator item where the event light shouldbe displayed, then select Situations from the pop-up menu. The left frame ofthe Situation editor shows all situations distributed to and associated with theNavigator item. If the situation is listed, it has been properly distributed andassociated.v If you do not see the situation, click Situation Filter, adjust the settings as
shown below and click OK:Associated with Monitored Application
Eligible for Association
310 IBM Tivoli Monitoring: Tivoli Enterprise Portal User's Guide
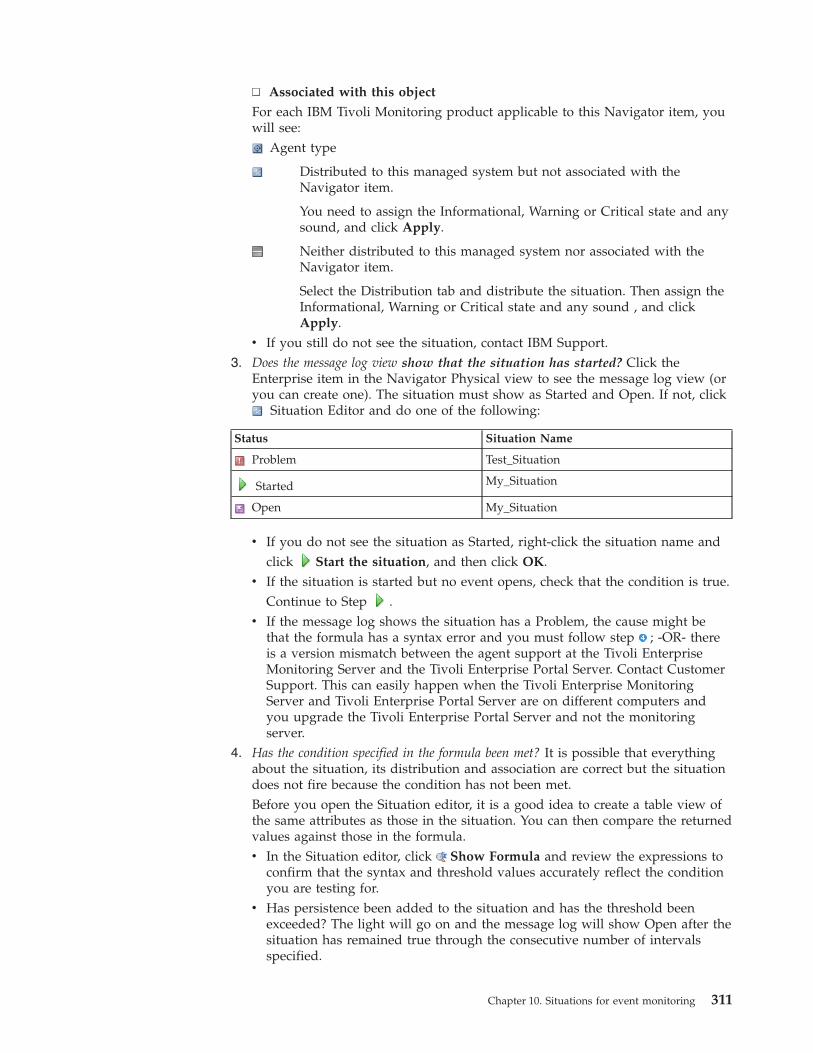
Associated with this object
For each IBM Tivoli Monitoring product applicable to this Navigator item, youwill see:
Agent type
Distributed to this managed system but not associated with theNavigator item.
You need to assign the Informational, Warning or Critical state and anysound, and click Apply.
Neither distributed to this managed system nor associated with theNavigator item.
Select the Distribution tab and distribute the situation. Then assign theInformational, Warning or Critical state and any sound , and clickApply.
v If you still do not see the situation, contact IBM Support.3. Does the message log view show that the situation has started? Click the
Enterprise item in the Navigator Physical view to see the message log view (oryou can create one). The situation must show as Started and Open. If not, click
Situation Editor and do one of the following:
Status Situation Name
Problem Test_Situation
Started My_Situation
Open My_Situation
v If you do not see the situation as Started, right-click the situation name andclick Start the situation, and then click OK.
v If the situation is started but no event opens, check that the condition is true.Continue to Step .
v If the message log shows the situation has a Problem, the cause might bethat the formula has a syntax error and you must follow step ; -OR- thereis a version mismatch between the agent support at the Tivoli EnterpriseMonitoring Server and the Tivoli Enterprise Portal Server. Contact CustomerSupport. This can easily happen when the Tivoli Enterprise MonitoringServer and Tivoli Enterprise Portal Server are on different computers andyou upgrade the Tivoli Enterprise Portal Server and not the monitoringserver.
4. Has the condition specified in the formula been met? It is possible that everythingabout the situation, its distribution and association are correct but the situationdoes not fire because the condition has not been met.Before you open the Situation editor, it is a good idea to create a table view ofthe same attributes as those in the situation. You can then compare the returnedvalues against those in the formula.v In the Situation editor, click Show Formula and review the expressions to
confirm that the syntax and threshold values accurately reflect the conditionyou are testing for.
v Has persistence been added to the situation and has the threshold beenexceeded? The light will go on and the message log will show Open after thesituation has remained true through the consecutive number of intervalsspecified.
Chapter 10. Situations for event monitoring 311
v Does the situation have an UNTIL clause and is the other situation true?When the other situation is true, the event for this situation is closed even ifthe condition still exists. An event will not be opened until the next intervaland only if the condition is true.
v If you still can't determine the cause of the situation not firing, try adding anOR expression for one of the attributes that is sure to be true. Then clickApply to restart the situation with the true condition. It should become true.Remove the OR expression when you are done.
5. Contact customer support If you went through all these steps and still think itshould be firing, then turn on RAS traces on the monitoring server to whichthe managed system is connected as instructed by Customer Support.
Troubleshooting events not closingIf you have a situation that seems always to be true and have open events, you canadjust the formula or the interval or add persistence to the definition.
About this task
Procedure1. Are the condition thresholds too stringent? The threshold values in the formula
might be appropriate to signal an alert on one managed system but notanother. Try adjusting the formula to raise the threshold. Or, if the thresholdshould vary for the different types of managed systems you are monitoring,create another situation, edit the values, and distribute to only the managedsystems to which it applies. You will also need to remove these managedsystems from the distribute list of the original situation.
2. Is the interval too short? If the situation is always true, the interval might be soshort as to not allow the condition to resolve itself before the next datasampling. Try increasing the interval between data samplings to a time thatenables the condition to return to normal status; -OR- consider addingpersistence or an UNTIL clause, described next.
3. Has persistence or an UNTIL clause been added? When the other situation istrue, the event for this situation is closed even if the condition still exists. Anevent will not be opened until the next interval and only if the condition istrue.
4. Contact customer support If you went through these steps and the situation isstill true too does not work as you expect, contact Customer Support.
Note: If you only want to stop events opening for a certain period of timewhile you take down a system or application for maintenance, you candisassociate situations from Navigator items. The situations will continue to runbut will not send event notifications to the Navigator until you associate themagain. See Associate Situations. Alternatively, you can add an UNTIL clausethat closes the event when another situation is true. The other situationspecifies a time span, such as Sunday after 10:00 PM or Monday before 4:00AM. See Create a Situation; Situation Editor - Until.
High CPU usage on the monitoring serverA poorly written situation can have a surprisingly large impact on CPU usage on amonitoring server.
312 IBM Tivoli Monitoring: Tivoli Enterprise Portal User's Guide
About this task
Using wildcard characters (*) in situations is one of the most common mistakesmade in writing situations. Using fields longer than required can also causeadditional work to evaluate the situation. Making the changes below have, in someinstances, reduced CPU usage on a monitoring server from close to full utilizationto nearly completely idle. The CPU usage manifests itself in the kdsmain process.
You might notice that kdsmain uses large amounts of CPU, agents appear offline,agent deployments fail, and other symptoms occur. Follow the guidelines forsituations below.
Procedure1. Avoid using wildcard characters in situations whenever possible.2. Use the simplest field possible that will provide the required value. Look at the
attributes under consideration in the Tivoli Enterprise Portal prior to writingthe situation. There might be a field that gives the required value withoutperforming a search operation on that field.
3. If a situation requires searching for a phrase within a field, use Scan for stringwithin a string.
4. When performing a Count of group members operation, use a short field forthe count. The field selected does not change the result, but does cause lessdata to be handled to derive it.
5. Avoid using Unicode fields unless they are required. They require moreprocessing then their non-Unicode counterparts.
Example
Scenario 1: Situation to ensure syslogd is running.Original situation: MISSING(Process Command (Unicode)) == ( ’*syslogd*’ )
Revised situation: MISSING(Base Command) == ( ’syslogd’ )
The revised situation is better for several reasons. First, it removes the wildcardcharacters from the situation. Second, it uses a non-Unicode field. Third, it doesnot require any searching operation as the Base Command field returns exactly therequired phrase.
Scenario 2: Situation checks for free space on multiple mount points starting with/opt/IBM.
Original situation: Mount Point == ’/opt/IBM*’ AND Space Available Percent< 5
Revised situation: SCAN(Mount Point) == ’/opt/IBM’ AND Space AvailablePercent < 5
The revised situation removed the wildcard character and used the more efficientSCAN function.
Scenario 3: Situation checks for more than 3 tecad_logfile processes.Original Situation: Process Command (Unicode) == *tecad_logfile* ANDCOUNT(Process Command (Unicode)) > ’3’
Revised Situation: Base Command == ’tecad_logfile’ AND COUNT(Base Command)> ’3’
The revised situation uses Base Command instead of a search or wildcardcharacters to find the required value. It also uses a shorter field to perform the
Chapter 10. Situations for event monitoring 313

count operation and avoids Unicode fields.
314 IBM Tivoli Monitoring: Tivoli Enterprise Portal User's Guide
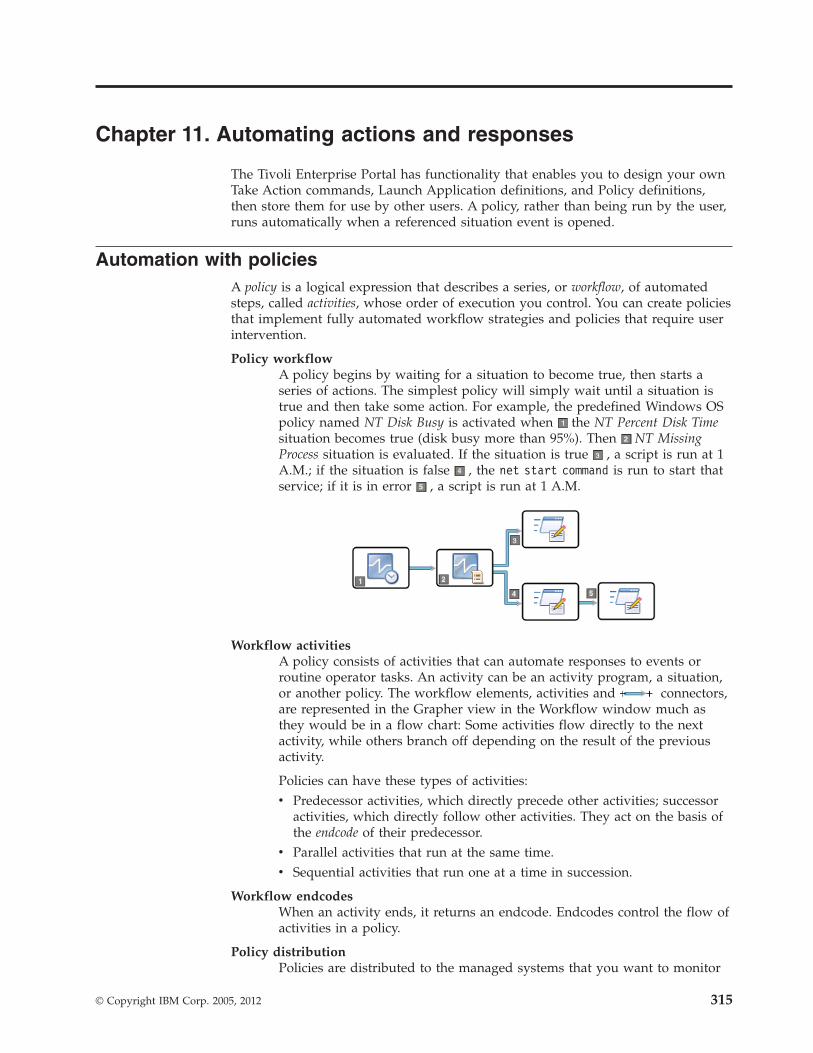
Chapter 11. Automating actions and responses
The Tivoli Enterprise Portal has functionality that enables you to design your ownTake Action commands, Launch Application definitions, and Policy definitions,then store them for use by other users. A policy, rather than being run by the user,runs automatically when a referenced situation event is opened.
Automation with policiesA policy is a logical expression that describes a series, or workflow, of automatedsteps, called activities, whose order of execution you control. You can create policiesthat implement fully automated workflow strategies and policies that require userintervention.
Policy workflowA policy begins by waiting for a situation to become true, then starts aseries of actions. The simplest policy will simply wait until a situation istrue and then take some action. For example, the predefined Windows OSpolicy named NT Disk Busy is activated when the NT Percent Disk Timesituation becomes true (disk busy more than 95%). Then NT MissingProcess situation is evaluated. If the situation is true , a script is run at 1A.M.; if the situation is false , the net start command is run to start thatservice; if it is in error , a script is run at 1 A.M.
Workflow activitiesA policy consists of activities that can automate responses to events orroutine operator tasks. An activity can be an activity program, a situation,or another policy. The workflow elements, activities and connectors,are represented in the Grapher view in the Workflow window much asthey would be in a flow chart: Some activities flow directly to the nextactivity, while others branch off depending on the result of the previousactivity.
Policies can have these types of activities:v Predecessor activities, which directly precede other activities; successor
activities, which directly follow other activities. They act on the basis ofthe endcode of their predecessor.
v Parallel activities that run at the same time.v Sequential activities that run one at a time in succession.
Workflow endcodesWhen an activity ends, it returns an endcode. Endcodes control the flow ofactivities in a policy.
Policy distributionPolicies are distributed to the managed systems that you want to monitor
© Copyright IBM Corp. 2005, 2012 315
and send commands to and controlled by the Tivoli Enterprise MonitoringServer that the monitoring agents connect to.
A policy starts after you save it if Auto start is enabled (the defaultsetting). A policy also starts after you select it and click Start Policy inthe Workflows editor or Manage Policies at Managed Systems window.
If the policy distribution is changed manually or dynamically, the policy isrestarted. Dynamic updates happen after a new agent comes online or afteran agent connection switches from one monitoring server to another.
Predefined policiesSome monitoring agents provide predefined policies that you can use as isor modify for your environment. See the user's guide for your product fora description of any predefined policies.
Viewing policy detailsThe Policy Details area of the Workflows window is a listing of all the policies onyour managed network and their settings.
Before you begin
If the Workflows tool is disabled, your user ID does not have View Policypermission or Workspace Author Mode permission or both.
About this task
Take one of these actions to see a list of the policies that are available on yourmanaged network or on a particular managed system.
Procedurev Click Workflow Editor. With this method, you can see and select all policies,
distributed or not distributed. The Workflows window opens with the policydetails at the top. If any of the column headings are obscured, you can move themouse pointer over them to see their titles or drag the column border left orright to adjust their width.
v In the Navigator Physical view, right-click the Enterprise Navigator item or anAgent Navigator item and click Manage Policies from the popup menu.
With this method, you can see and select from all the policies that aredistributed to the selected managed system.
Creating a policyUse policies to perform actions, schedule work, and automate manual tasks on oneor more managed systems in your enterprise.
Before you begin
Your user ID must have Modify Policy permission. Otherwise, the Workflows toolis disabled.
About this task
The first step to building a policy for automation is to create a new policy and fillin important details such as where it is distributed to and whether it is autostarted. Take these steps to begin building a new policy.
316 IBM Tivoli Monitoring: Tivoli Enterprise Portal User's Guide
Procedure1. Click Workflow Editor.2. Click New Policy (or Alt+ to keep the full Policies Details area open).
New_Policy is added to the Policy Details list and a blank Grapher viewopens in the Workflow editor for you to add and connect activities. To enlargethe grapher view, click Collapse, which collapses the Policy Details areaand expands the Workflow Editor area to full window; click Expand torestore the Policies Details area. You can also drag the border up or down.
3. In the newly added row of the Policy Details area, edit the name anddescription, distribute the policy, and adjust the settings as needed. (See“Policy list” on page 323.)
4. In the Workflow editor, add a Wait until a situation is True activity:Waituntil a situation is True in the General activities tab of the Workflowcomponents frame. The policy must begin with this activity type unless it isuncorrelated, in which case you can start with any activity.a. Click the Wait until a situation is True activity.b. Click inside the Grapher view to place the activity icon. The Select a
Situation window opens for you to select a situation that, when true or inerror, triggers the next activity in the workflow.
c. Select the situation and click OK. (If you do not see the situation in thelist, click Cancel, and create the situation you need, then repeat thesesteps.) The activity icon displays with the name of the situation.
5. Add other activities to the policy (see Workflow Components). Double-click anactivity tool to keep it on. You can add activities to start or to stop otherpolicies or situations, to suspend execution for a given period of time, toevaluate a situation, and to invoke specific actions You can have severalactivity programs running either sequentially or in parallel.
6. Draw connecting lines to direct the workflow:a. Click Connector, then click inside one activity and again inside the
one that follows. The Select a link condition window opens with a list ofpossible conditions that will run the next activity. When you join activitieswith the Connect tool, you assign an endcode to each connection. Anendcode indicates the result of activity processing and control the flow ofactivities in a policy.
b. Select the result that will trigger the next activity, then click OK. Thecompletion of one activity starts the execution of the next activity based onthe link condition chosen here. If, for example, you connect a Wait until asituation is True activity to a Take action or Write message activity, andchoose Situation is true as the condition, the Take action or Writemessage activity begins executing when the situation becomes true. Everyactivity type except Suspend execution gives you multiple conditions fromwhich to choose. You can create an activity for each one of theseconditions and connect to each of them from the source activity.
c. Connect the remaining activities.v You can double-click Connect to keep it on until you select
another activity or click Select. After drawing a connector line, a thinblack line is displayed between the two activities. The line disappearswhen you draw the next connector line or turn off the tool.
v While Connect is active, every mouse movement in the Grapherview draws the connector line. Right-click if you want to stop drawingtemporarily. As soon as you click an activity in the Grapher view again,
Chapter 11. Automating actions and responses 317
the tool will be reactivated and you can continue to draw. Also, you canclick Undo to cancel the last change you made (or changes, if youcontinue to click).
7. When you have finished adding activities and connecting them, clickValidate to check the logic flow. If you get an error message, you must fix
the problem before you can save the policy.8. If you have not yet distributed the policy to the managed systems where it
will run, select Distributed, select the managed systems or managed systemgroups to which you want to distribute the policy.
9. When you are finished creating the policy, click Apply. Policies are stored atand controlled by the monitoring server to which the managed system isconnected, either a remote or the hub Tivoli Enterprise Monitoring Server. Thepolicy is saved and started automatically on the managed systems to which itis distributed unless you cleared the Auto start check box.
10. If the policy is not set to Auto start, start the policy manually by clickingStart Policy.
11. If you are prompted to specify the TEMS to start the policy on, select themonitoring server (or servers) and click Start.
Results
The policy is stored at and controlled by the Tivoli Enterprise Monitoring Server towhich the agent is connected, either a remote or the hub monitoring server. If thepolicy distribution is changed manually or dynamically, the policy is restarted.Dynamic updates happen after a new agent comes online or after an agentconnection switches from one monitoring server to another.
The first activity in the policy is Wait until a situation is True, which mightgive the impression that the policy is not running because it is an activity thatwaits and does nothing until the situation is true. But after that happens, theworkflow progresses and continues until all activities have been completed or untilthe policy is manually stopped with Stop Policy. If you enabled Restart andthe situation is still true, the policy begins again.
If there are invalid activities in the logical workflow, visual feedback is providedshowing you which activities are valid and which are not valid. The label of allvalid activities changes to blue following validation. If an activity is not valid, theappearance changes in the following ways:v Border changes from magenta to blackv Label changes from black to redv Shape changes from rounded rectangle to rectanglev Tool tip changes to the last error that applies to the activityRelated reference:“Policy Details” on page 322“Workflow Editor” on page 325
Editing a policyUse the Policy Details area of the Workflows window for changing policy settingsand the Workflow editor area for editing policy workflows.
318 IBM Tivoli Monitoring: Tivoli Enterprise Portal User's Guide
Before you begin
Your user ID must have Modify Policy permission to use this function.
About this task
To edit a policy:
Procedure1. If the Workflows window is not open, click Workflow Editor.2. In Policy Details, click the row whose policy you want to change, then edit the
cells as needed. As soon as you make a change, Undo is enabled. Click it ifyou want to undo the changes made so far to the policy settings.After a policy has been saved, you cannot change its name. Instead, copy thepolicy and edit the name of the copy.
3. Click Edit Workflow to open the policy in the Workflow editor, then editthe activities as needed:v To edit an activity, double-click it.v To delete an activity or connector, select it and click Delete. You can also
use Shift+click to select multiple activities or use click and drag to select arectangular area.
v To copy an activity, select it, click Copy. Click where you want it to go inthis or another policy open in the work area, and click Paste. You can alsouse Shift+click to select multiple activities or use click and drag to select arectangular area.
v To move an activity, select it, click Cut, then click to where you want tomove it in this or another policy open in the work area, and click Paste.You can also use Shift+click to select multiple activities or use click and dragto select a rectangular area.
v To add an activity, click its icon in the Workflow components frame, thenclick inside the Grapher view.
v To connect an activity, click Connect, then drag from the sourceactivity to the target and click.
v To restore the Policy Details area, click Expand; to collapse it, clickCollapse.
4. When you have finished editing, if Validate is enabled, click it to check thelogic flow. If there are errors, fix them as indicated in the message, and click
Validate again.5. Click Apply to save your changes and continue working with policies; -OR-
click OK to save your changes and close the window. If the policy is set toAuto start, it will start running automatically; if not, you will need to click
Start Policy.
Copying a policyCopy a policy when you want to use part or all of an existing workflow in a newpolicy that you can edit for different activities or settings. Also, use this methodwhen you want to rename a policy.
Before you begin
Your user ID must have Modify Policy permission to use this function.
Chapter 11. Automating actions and responses 319
About this task
To copy a policy:
Procedure1. If the Workflows window is not open, click Workflow Editor.2. In Policy Details, click the row of the policy you want to copy.3. Click Copy. A new row is added to the list and the policy titled,
Copy_of_name, where nameis the name of the original policy. The details of theoriginal policy, such as the distribution, are replicated to the new policy.
4. Click inside the Policy name field and change the name. After the policy issaved, you will not be able to rename it.
5. Change any other settings for the new policy in the Policy Details area.6. In the Workflow editor, modify the activities as needed:
v To open an activity for editing, double-click it.v To delete an activity or connector, select it and click Delete. You can also
use Shift+click to select multiple activities or use click and drag to select arectangular area.
v To copy an activity, select it, click Copy, then click where you want tocopy it in this or another policy open in the work area, and click Paste.You can also use Shift+click to select multiple activities or use click and dragto select a rectangular area.
v To move an activity, select it, click Cut, then click where you want to moveit in this or another policy open in the work area, and click Paste. You canalso use Shift+click to select multiple activities or use click and drag to selecta rectangular area.
v To add an activity, click its icon in the Workflow components frame, thenclick inside the Grapher view.
v To connect an activity, click Connector, then drag from the sourceactivity to the target and click.
7. To save your changes, click Apply to keep the window open or OK to close it.
What to do next
If you used these steps to rename a policy, Deletethe original policy.
Deleting a policyYou can delete a policy that is no longer needed.
Before you begin
Your user ID must have Modify Policy permission to use this function.
About this task
Complete these steps to delete a policy.
Procedure1. If the Workflows editor is not open, click Workflow Editor.2. Select the row that lists the policy you want to delete. You can also select
multiple policies with Ctrl+click, or Shift+click to select all applicationsbetween the first selection and this one.
320 IBM Tivoli Monitoring: Tivoli Enterprise Portal User's Guide
3. Click Delete Policy.
Results
After you click OK in response to the confirmation message, the policy is deletedfrom the list. If it was running at the time, it stops; if it was in the middle ofexecuting an activity, that activity will complete.
Starting and stopping policiesYou can start or stop a policy as you find necessary. When you create or edit apolicy that is set to start automatically, it starts running as soon as you click Applyor OK in the Workflow editor. If it is not set to Auto start, you can manually startit. You can also stop the policy and restart it manually.
Before you begin
For you to stop or start a policy, your user ID must have Start/Stop Policypermission.
About this task
A workflow can involve many activities and can be in various states for differentmonitoring agents. Stopping or restarting a policy causes those states to be lost.
You can choose to start or stop a policy on all monitoring agents to which it isdistributed or, if your configuration includes remote Tivoli Enterprise MonitoringServers, on all agents that report to a particular monitoring server. With this addedcontrol, you can configure your enterprise in such a way that automation can bestopped for agents that, say, are monitoring subsystems that are undergoingmaintenance.
Procedure1. Open the policy list:
v In the Navigator Physical view, right-click the Enterprise Navigator item oran Agent Navigator item and click Manage Policies from the popupmenu. With this method, you can see and select from all the policies that aredistributed to the selected managed system.
v Click Workflow Editor. With this method, you can see and select allpolicies, distributed or not distributed.
2. Select the policy that you want to start or stop. You can use Ctrl+click to selectadditional policies or Shift+click to select all policies between and including thefirst selection and this one. In the Manage Policies at Managed System window,you can also click Select All for all the policies in the list.
3. Click Start Policy or Stop Policy.4. When a message asks you to specify the TEMS list on which to start or stop the
policy, select the monitoring server (or servers) and click Start or Stop.5. If you are in the Manage Policies at Managed System window, click Refresh
to refresh the view and see your changes.
Chapter 11. Automating actions and responses 321
Results
When you start a policy, it starts on the managed systems to which it is distributedon the selected monitoring server (or servers). All the situations within the policyare also started or restarted.
When you stop a policy, if it was in the middle of executing an activity, thatactivity will complete. Policies are stored at and controlled by the monitoringserver to which the managed system connects. The policy will remain stoppeduntil you start it again manually or, if it is set to Auto Start, until you next edit thepolicy or restart the monitoring server.
If the policy distribution is changed manually or dynamically, the policy isrestarted. Dynamic updates happen after a new agent comes online or after anagent connection switches from one monitoring server to another.
Policy distributionWhen you create a new policy, it is not initially distributed to any managedsystems. This window opens after you select Distribution for a policy in thePolicy Details list, so you can select the managed systems where you want thepolicy to run.
If the system is selected and has multiple agents of this type, then distribution willbe to all of them. For example, a WebSphere MQ message queue policy written fora system with three WebSphere MQ message queues would be distributed to thethree agents of this type on the system.
AssignedShows the agents to which the policy is assigned.
Available Managed SystemsShows the agents of the same type to which the policy can be distributed,such as all UNIX agents for a UNIX situation. To add a managed system tothe distribution, click the name, then to move it to the Assigned list.
Available Managed System GroupsYour product comes with one managed system group named for theproduct, such as *MS_SQL_SERVER for all MS SQL Server managed systems.To add a managed system group to the distribution, click the name, then
to move it to the Assigned list.
Note: If Correlate by is set to Business Application, no individual managedsystems are shown; only managed system groups.
WorkflowsThe Workflows window opens when you click Workflow Editor. Use thiswindow to see all the policies in your managed environment and to create and editpolicy workflows.
The Workflows window has two parts: Policy Details and Workflow Editor.
Policy DetailsReview the Policy Details area of the Workflows window to see the entire list ofpolicies in your monitored environment and information about each policy, such aswhether it is distributed or auto started.
322 IBM Tivoli Monitoring: Tivoli Enterprise Portal User's Guide
Toolbar
The Policy Details lists the policies that are stored on the Hub Tivoli EnterpriseMonitoring Server and any remote monitoring servers. It has tools for creating andmaintaining policies and an area that shows the current version of each Workflowsoftware component.If none of the tools is available, your user ID does not haveModify Policy permission; if, after you select a policy, the Start and Stop tools bothremain dimmed, your user ID does not have Start/Stop Policy permission.
Start PolicyStarts the selected policy (or policies) on the managed systems to which itis distributed.
Stop PolicyStops running the selected policy (or policies). If the workflow activitiesare currently executing, processing stops after the current activity iscompleted.
New PolicyAdds a new row to the Policy list, partially collapses the Policy Detailsarea to show only the new policy, and expands the Workflow Editor areaso you can build the workflow. You can restore the policy list withand collapse it with , or drag the border up or down. Initially, thepolicy is named and described as New_Policy. Click inside the field tochange the name. Use the Delete or Backspace key to erase to the right orleft of the cursor.
If you prefer to keep the Policies Details area open when you create a newpolicy, use Alt+ .
Copy PolicyCopies the selected policy. A new row is added to the list, the PolicyDetails area collapses, and the Workflow Editor area expands to the fullwindow so you can build the workflow. You can manually restore thepolicy list with and collapse it with . Initially, the policy is giventhe same name as the original, but prefixed with “Copy_of_”. In the PolicyDetails area, click inside the Name field to change the name; use Delete orBackspace to erase to the right or left of the cursor.
To keep the Policies Details area open when you copy the policy, use Alt+.
Delete PolicyDeletes the selected policy.
Refresh ListIf any policies have been added, edited, or deleted by other users in yourTivoli® managed network, you can refresh the Policies list to show thechanges.
Policy list
The policy list is a table containing the names and properties of policies on the hubmonitoring server and any remote monitoring servers. The first two columns of thetable allow you to edit a policy workflow or to undo any changes you have madeto the policy during the current session. The other columns contain the names ofthe policies and properties that you can specify or edit. These columns include thefollowing:
Chapter 11. Automating actions and responses 323
UndoVoids your changes to the policy in this row.
Edit WorkflowOpens the policy in the Workflow editor for viewing and editing theworkflow components. When you do, the Policies Details area partiallycollapses to show only the policy you selected and the Workflow Editorarea expands. If you prefer to keep the Policies Details area open, use Alt+
when you open the Workflow editor.
Note that you can manually restore the policy list with Expand andcollapse it with Collapse, or by dragging the border up or down.
Policy nameThe name of the policy, up to 32 letters and numbers, with no spaces orspecial characters other than the underscore character (_). Click inside thisfield and edit the text as needed, using the Backspace and Delete keys toerase text to the left or right.
You cannot rename the policy after it has been saved with Apply or OK.Instead, copy the policy and change the name and any other settings forthe new policy in the Policy Details area.
DistributedSpecifies where the policy is to be distributed and run. When you selectthis option, the Change Policy Distribution window opens with a list of theavailable managed systems to which you can assign the policy.
If Correlate by is set to Logical Application Group, no individual managedsystems are shown; only managed system groups. You must select onefrom the Available managed system groups list and click .
Auto startWhen selected, starts the policy automatically when it is saved and whenthe monitoring server is started. Clear this option if you want to start thepolicy manually.
Save ResultsWhen selected, saves the results data internally. You can save results dataonly to policies that contain a user choice activity.
Correlate by
Host Namethe default mode, maintains separate paths of execution for eachhost where one or more different managed systems are running. Ifthe host name for two different managed systems is the same, bothmanaged systems take the same path through the policy. For eachdistinct path, the policy waits for data from, or runs programs on,the same host that started that path of execution.
Host Addressworks identically to Host Name except it identifies the managedsystems by their host address instead of host name. It is typicallyused only if the policy cannot run when it references the hostname.
Logical Application Groupidentifies the managed systems for processing by their managedsystem list name. This mode is used to combine disparate agenttypes. The policy maintains separate paths of execution for eachmanaged system list to which the policy is distributed.
324 IBM Tivoli Monitoring: Tivoli Enterprise Portal User's Guide
Uncorrelatedwhich is not normally used, takes one path through the policy forall managed systems to which the policy is distributed. No attemptis made to correlate data from different managed systems as oneactivity terminates and subsequent activities are started.
Limit restartsLeft cleared, specifies no limitation on the number of times the policy canbegin running again. When selected, stops the policy after it has run fivetimes in a 24-hour period.
RestartStarts the policy again after the last activity finishes executing. Whencleared, stops the policy after the last activity finishes executing until it isstarted again manually or, if you have Auto start enabled, the next timethe policy is saved or when the monitoring server on which it is running isrecycled.
DescriptionShows the description for the policy. Click inside this field and edit the textas needed, using the Backspace and Delete keys to erase text to the left orright.
VersionThe version of the hub monitoring server.
Modified byShows the user ID of the person who most recently edited the policy.
Modified dateShows the time and date the policy was last edited.
Compatibility levels
This area of the window shows , which you can click to list the minimumversion of the Workflow Editor software components that are compatible:v Workflow Editorv Tivoli Enterprise Portal Automation Serverv Tivoli Enterprise Monitoring Server Automation ServerRelated tasks:“Creating a policy” on page 316
Workflow EditorUse the Workflow editor portion of the Workflows window to create and editpolicy workflows by selecting, configuring, arranging, and connecting activities,and to test their validity.
When you select a policy from the Policy Details list and click Edit Workflow,a Grapher view pane opens in the Workflow editor so you can see and edit thepolicy activities. You can open multiple policies in the Workflow editor, each in itsown pane. This area of the Workflows window has the following components:v A Toolbarv A Workflow Components area, with tabs for General activities, Emitter activities,
and Extensions on the leftv A Work area and grapher view area where you add and connect activities to
create a workflow on the right
Chapter 11. Automating actions and responses 325
Click (between the Workflow Editor and Policy Details) to expand theWorkflow Editor area to the top of the window or to restore the policy list andreturn the editor to its former size.
Click Expand (between the Workflow components and the work Grapher view)
to expand the work area to the width of the window or Restore to restore theWorkflow components and return the work area to its previous width.
By right-clicking a situation activity in the Grapher view, you can choose to editthe situation specified in the activity. The situation opens in the Situation editor.
Toolbar
ValidateTest the workflow to ensure it is composed logically. The text turnsblue for activities that validate successfully.
Any errors are reported in a Workflow Definition Error message.The message supplies the activity ID in brackets, which isdisplayed in a flyover description when you move the mousepointer over an activity; followed by the name and the errormessage. You cannot save the policy until you fix any problemsand the workflow passes validation.
CutRemoves the selected activity or activities and place on theclipboard.
CopyCopies the selected activity.
PastePastes the contents of the clipboard into the editor
ClearRemoves the selected activities from the workflow.
UndoVoids the last action (or actions if you continue to click).
RedoRepeats the last action.
SelectSelection mode. This is a toggle tool. Click it again to turn offselection. Use the Select tool to drag an activity into position or toselect it for removal. You can click and drag from one point to theopposite corner to select a group of activities, or use Shift+click toselect multiple activities individually.
Perform node layoutRearranges, as needed, the activities and their connectors to best fitin the view.
Actual sizeReturns the view to normal size. Used after zooming.
Fit to ContentsScales the view so all activities are visible. This is useful when youhave added or removed activities.
326 IBM Tivoli Monitoring: Tivoli Enterprise Portal User's Guide
Zoom inZooms in on the view to see an enlarged version.
Zoom outZooms the view out to reduce the size and see more in the workarea.
Zoom BoxExpands or contracts the view to fit a selected area.
PanPans the view, which selects the entire policy and enables you tomove it around the Grapher view.
Related tasks:“Creating a policy” on page 316
Grapher ViewThe grapher view is displayed when you create a workflow or have chosen aworkflow to edit. Use it to add, edit, and connect activities.
After a workflow activity has been added to the grapher view, you can move themouse pointer over the activity to see its identifier. If the Workflow was created inthe Workflow Editor, the ID will be the activity name followed by a sequencenumber, such as "WaitOnSituation1" or "SystemCommand3". Otherwise, the ID willlook something like "NT285". The activity identifier is referenced in two places:v In the Take action or Write message activity, the More options button
expands the Action Settings dialog. If multiple data items are returned, you canchoose to take action on every item generated by the situation in an activity. Youcan also choose to take action on the agent that returned data for the situation inan activity The activity ID is selected from a list.
v When the workflow has been tested with Validate, if errors are found, theIDs of the affected activities are referenced in the Workflow Definition Errormessage.
General activitiesThe General activities tab in the Workflow Editor displays the default activitiesand product-provided predefined activities.
Wait until a situation is TrueOpens a list of the situations distributed on your managed network. Whenyou select the situation and click OK, the icon with the name of thesituation is displayed in the grapher view. When the policy encounters thisobject in the workflow, it suspends execution until the situation is true. Youthen must add an activity to perform when the situation fires.
All policies except those that are uncorrelated must begin with this activity.
End code choices for starting the next activity: Situation is true; Error.
Evaluate a situation nowExamine the status of an existing situation. Select a situation from thescroll box that is displayed after you drop the activity into the Graphicview. Click OK to confirm your selection. Note that the evaluation intervalis based on the monitoring interval of the selected situation. There aresome special considerations related to the evaluate situation activitydescribed in Using IBM® Tivoli® Monitoring.
End code choices for starting the next activity: Situation is true; Situation isfalse; Error.
Chapter 11. Automating actions and responses 327
Take action or Write messageEnables you to issue a system command from a policy or generate auniversal message that can be seen in the Universal Message console view.
When issuing a system command, keep in mind that there is a timeoutperiod of 50 seconds. If the command does not complete within that time,an error is issued. As well, the command must be valid on the operatingplatform on which it will execute.
You can send Simple Object Access Protocol (SOAP) requests. See the IBMTivoli Monitoring Administrator's Guide for details. If the action command isa SOAP request, the policy must be distributed to the hub_ hostnamemanaged system (or *HUB managed system group).
End code choices for starting the next activity: Error; Action succeeded.
Make a choiceNot editable
This option is displayed when any of the policies in the list was created inthe Candle® Management Workstation (predecessor user interface to theTivoli Enterprise™ Portal) and includes a Make a choice activity. However,it is not available for adding to policies.
Suspend executionSpecifies a unit of time, expressed in seconds, that you want a policy towait prior to running. This is a useful feature if, for example, you issued acommand, and you want to give the system administrator time to resolvethe problem prior to continuing to run the policy.
Start/Stop a policyUse this activity in a policy to stop another policy from running while thecurrent policy is executing. You can also use to start another policy whilethe current policy is executing.
End code choices for starting the next activity: Policy started; Error.
Start/Stop a situationStops a situation from running while the current policy is executing. Youcan also use this option to start another situation while the current policyis executing.
End code choices for starting the next activity: Situation started; Error.
ConnectorAdds connecting lines from one activity to the next to control theworkflow of the policy.
You can have a single connector from an activity, and you can havemultiple connectors from an activity so long as each connector links to aseparate activity. Multiple connectors from an activity are processed usingAND logic.
When you join activities using the Connector tool, you assign an end codeto each connection. As you click and drag from one activity to the next onein succession, a window opens from which you select a link condition. Thepossible conditions (end codes) resulting from the source activity that willinvoke the target activity are listed in the window. For example, if you areconnecting a Wait until a situation is True activity and choose Situation istrue as the link condition, the target activity will begin executing when thesituation becomes true.
Available end codes include the following:
328 IBM Tivoli Monitoring: Tivoli Enterprise Portal User's Guide
Action succeededThe action completed without errors.
Error The activity failed to complete successfully. The reason might bethat a referenced object does not exist or a command returned anerror status from the operating system.
ResumeThe Suspend execution activity waits a specified period of time,then resumes executing the policy.
Situation is falseThe Evaluate situation now and Wait until a situation is Falseactivities return this end code if the situation is not currently true.
Situation is trueThe Wait until a situation is True and Evaluate situation nowactivities return this end code if the situation is currently true.
ChoiceThe Make a choice activity uses this end code to indicate that thelinked activity is a potential choice offered to the user when awork item is opened.
TimeoutThe Make a choice activity uses this end code to indicate the nextactivity is to run if the user choice times out before a user selectsan option.
Action SucceededThe Take action or Write message activity uses this endcode toindicate the action completed without errors.
Action Settings:
In the Workflow editor, clicking Take action or Write message opens the ActionSettings window. Use this function to send a command or universal message to thesystem. For example, you might want to log information, trigger an audible beep,or stop a job that is using too many resources.
Action SelectionUniversal Message, when selected, opens this area:Category of the message you are defining. Type one of the following:critical, warning, or informational.Severity that you want assigned to the message. Type a severitynumber (1, 2, and so forth).Message that is displayed. Type the message text you want to bedisplayed at the system specified (see Where should the action be run,below).
Universal messages are shown in the Universal Message Console view.
System Command, when selected, opens a text box for entering thecommand to issue at the system. The command language is that of theapplication and operating platform you are running (such as a UNIX shellcommand to run at a UNIX system).
Example: Windows has a command for sending a message to a system:net send computer_name message, as in net send MYPC Disk is 85%full. Delete some files.
Chapter 11. Automating actions and responses 329
Example: UNIX has the mail command for directing messages: mailnode userID text.
AttributeA window is opened for choosing an attribute to include in the universalmessage or system command. In the Select Attribute window, specify anattribute group and item, then click OK.
The attribute you selected is displayed in the Message field or the SystemCommand field. The attribute name is replaced by the actual value duringexecution of the action. The attributes available for you to select are basedon the situations you have added to the policy preceding the action. Ifthere are no situations in the policy, the Attribute button is disabled.
In the example that follows, the command sends an email that reads,"System: MyServer, Disk: D:, Space Available: 15%":echo System: &NT_Logical_Disk.Server_Name;, Disk:&NT_Logical_Disk.Disk_Name;, Space Available:&NT_Logical_Disk.;%_Free%|mail userID.
More Options
If multiple data items are returnedThese options determine what action to take if more than onemonitored item of data is returned by the situation evaluation:
Only take action on first item issues the universal message orthe system command on only the first item of data that meets thesituation criteria.
Take action on each item from activity issues the universalmessage or system command on all items of data generated by thesituation specified in the activity selected from the list. The IDfor an activity is shown in the Grapher View when you move themouse pointer over the activity graphic.
The results data returned from each of these individualsituation-based activities might originate from the same attributegroup on an agent or from attribute groups on different agents. Forexample, the workflow might be triggered by an OMEGAMON XEfor CICS on z/OS situation that monitors for delayed transactionson an CICS monitoring agent, (activity ID WaitOnSituation1) andmight then evaluate the state of a situation that monitors threadson an OMEGAMON XE for DB2 monitoring agent, (activity IDEvaluateSituation2).
Some situations can return a single row and others can returnmultiple rows for each sample. You can control the number ofuniversal messages or system commands to issue when there aremultiple situation rows: a message or a command can be sent forthe first row only or for every row. As mentioned earlier, though,there can be multiple sets of situation data originating fromdifferent activities. Select this radio button to control which set ofresults data to use.
Referring to the earlier example, send one command for every rowreturned by the CICS situation by selecting WaitOnSituation1; orsend one command for every row returned by the DB2 situation byselecting EvaluateSituation2.
Continue processing rows on failure, when selected, keepstrack of both the rows for which the command failed and those for
330 IBM Tivoli Monitoring: Tivoli Enterprise Portal User's Guide
which it succeeded. A policy can be constructed so that one path istaken for the rows that succeeded and another for the rows thatfailed.
This is a useful feature when, for example, you want to run ascript to filter results. In this case, a failed condition does not meanthat the activity itself encountered a problem but that a particularrow did not satisfy some criteria. When this option is cleared, asystem command that returns a non-zero result while processing aseries of situation result rows stops further processing of anyremaining rows and the activity is terminated with Error, eventhough some of the commands might have succeeded.
Note: If the situation has a Display Item set and the "Only takeaction on first item" option is selected, the action is taken once foreach unique display item in the rows of data. For example, if therewere 100 total rows that qualified and there were 6 unique displayitems, the situation would fire 6 times. See “Formula” on page 247for more information on display items.
Where should the action be executedDetermines where to perform the action: on the system where theagent resides, the monitoring server to which it is connected, or thesystem selected from the list.
Execute the action at the agent that returned data for activityissues the universal message or system command on the agent thatreturned data for the situation in the specified activity (selectedfrom the list). The ID for an activity is shown in the GrapherView when you move the mouse pointer over the activity graphic.Referring to the Take action on each item from activity example, ifthe action must be executed at the DB2 agent, you would specifyEvaluateSituation2 because this is the ID of the activity thatevaluates the state of the DB2 situation on the DB2 agent.
Execute the action at the Tivoli Enterprise Monitoring Serverissues the universal message or system command at the monitoringserver that the agent connects to.
Execute the action at is used to select a specific managedsystem from the list.
Related tasks:“Adding a Universal Message Console view” on page 138
Attribute selection:
The Attribute Selection window lists the available attributes for the group, withthose selected listed on the left. This window opens automatically when you selectAttributes from one of the other panes in the Workflow editor.
Selected AttributesDisplays the attributes selected for this activity. To remove an attributefrom this list, select the attribute you want to remove and click Remove.After selecting the first attribute, you can use Ctrl+click to select others orShift+click to select all attributes between the first selection and this one.
Remove All selects and moves all the attributes back to the AvailableAttributes list.
Chapter 11. Automating actions and responses 331
Available AttributesShows the selected attribute group, followed by the attributes available forthat group. Click to see and select from the available attribute groups.The common attributes for Local Time are always available. The otherattribute groups are those associated with the emitter type.
Select the attribute you want from the list and click Add. After selectingthe first attribute, you can use Ctrl+click to select others or Shift+click toselect all attributes between the first selection and this one.
Add All selects all the attributes in the list and moves them to theSelected Attributes list.
DescriptionDisplays a short description of a selected attribute.
Emitter activitiesThe Emitter activities in the Workflow Editor displays activities associated withalert emitters.
When your managed network includes an IBM Tivoli Alert Adapter or IBM TivoliAlert Manager, this tab shows the emitter activities available for your products.Emitter activities are used to forward situation events to Tivoli managementproducts and to third-party party management products.
For more information on the parameters for the emitter activity, click Help in theEmitter Settings window and refer to the documentation of the target managementproduct. The SNMP Event activity is available to all users; many of the otheractivities are available only if your environment has policies that were created withone of the other alert manager products.
NetView® Event
IBM Tivoli Alert Adapter for TME 10 Netview.
SNMP Event
This activity is available with the Universal Agent. It enables you to sendan SNMP trap with information about any situation event to an SNMPmanager.
ConnectorUse the Connector tool to add connecting lines between the activity iconsto control the workflow of the policy.
You can have a single connector from an activity, and you can havemultiple connectors from an activity so long as each connector links to aseparate activity. Multiple connectors from an activity are processed usingAND logic.
When joining activities with the Connector tool, you assign an end code toeach connection. Emitter activities can generate the following end codes:v Error means that the emitter activity failed to complete successfully. The
reason might be that a referenced object does not exist or a commandreturned an error status from the operating system.
v Data emitted means that the data generated by the activity was emittedsuccessfully to the application.
Emitter settings:
332 IBM Tivoli Monitoring: Tivoli Enterprise Portal User's Guide
The Emitter activities tab of the Workflow editor contains the available emitteractivities for your installed products. After you drop an emitter activity into thegrapher view, this window is displayed for you to configure the activity.
Emitter TypeShows the name of the emitter activity.
ParametersLists the parameters required for this emitter. Select a parameter to see itscurrent value on the right.
Emitter target identifies the emitter that transfers the request (such as acommand or log entry) to the third-party software. The host name isfollowed by the emitter name, separated by a colon (:), such asmyhost:TME_Emit.
Attributes opens the Attribute Selection window, which shows theattributes currently selected to be included in the communication. Afterviewing and adjusting the list as needed, click OK to close the windowand see the selected attributes in this area.
Any other required parameters for your IBM Tivoli Monitoring productwill display here. See your product documentation for details.
Current valueShows and enables you to change the value or values of the selectedparameter.
Operation ModeDetermines how the communication is transferred to the emitter.
Invoke emitter once for each data row, the default, repeats the emitteractivity for every row in the data sample that renders the situation true.
Bundle data rows and invoke emitter once assembles the emittercommunication for every row returned in the true situation and sendsthem as one emitter activity.
For example, consider a situation that fires when the disk space is below20%. Of the four rows in the data sampling, one for each disk, three meetthe condition. The emitter activity sends a message to the third-party eventconsole, depending on the operation mode, once for each of the three disksbelow 20% or once for all three disks.
ExtensionsThe Extensions tab displays the Wait until a situation is False activity, On DemandReport activity, Send an e-mail activity, and activities associated with TivoliApplication Dependency Discovery Manager (TADDM) integration.
Wait until a situation is FalseWaits for the state of a specified situation to change from true back to false,which causes the open event to close. The event closes automatically whenthe agent is next sampled (determined by the situation sampling interval)and the condition is no longer true.
Wait until a situation is False is useful for policies you want to repeat butonly when the state returns to false. An example would be a repeatingpolicy that uses an emitter activity to generate a trouble ticket when CPUactivity is high. If this condition continues beyond the 30-minute samplinginterval, a new trouble ticket would be generated every 30 minutes. Toprevent this from happening the user adds a Wait until a situation is False
Chapter 11. Automating actions and responses 333
activity to the end of the workflow, so the policy will not restart until thesituation has gone to false, then true again.
End code choices for starting the next activity: Situation is false; Error.
Note: This activity does not apply to manual event closures.
Configure Tivoli Application Dependency Discovery Manager IntegrationThis activity is the first step in establishing communication with a TADDMserver. There must be one Configuration Tivoli Application DependencyManager Integration activity for each TADDM server you want to update.
End code choices: Success; Error.
See “Configure Tivoli Application Dependency Discovery ManagerIntegration” on page 335.
Send a Tivoli Application Dependency Discovery Manager UpdateSends information in response to a triggered situation to a TADDM server(previously specified in a Configure Tivoli Application DependencyDiscovery Manager Integration activity). Use this activity to notifyTADDM of resource changes in your monitoring environment. Therequests sent can include returned situation data or information from OnDemand Report activities.
End code choices: Success; Error.
See “Send a Tivoli Application Dependency Discovery Manager Update”on page 336.
On Demand reportSends an on-demand request to retrieve attribute data for a specifiedmonitoring agent report. You can specify filters to be used in the request,limiting data to the situation that triggered the workflow.
End code choices: Success; Error.
See “On Demand Report” on page 337.
Send an e-mailSends an e-mail to a single recipient in response to a triggered situationevent or activity in your workflow.
End code choices: Success; Error.
See “Send an e-mail” on page 340.
ConnectorAdds connecting lines from one activity to the next to control theworkflow of the policy.
You can have a single connector from an activity, and you can havemultiple connectors from an activity so long as each connector links to aseparate activity. Multiple connectors to an activity are processed usingAND logic.
When you join activities using the Connector tool, you assign an end codeto each connection. As you click and drag from one activity to the next onein succession, a window opens from which you select a link condition. Thepossible conditions (end codes) resulting from the source activity that willinvoke the target activity are listed in the window. For example, if you are
334 IBM Tivoli Monitoring: Tivoli Enterprise Portal User's Guide
connecting a Wait until a situation is True activity and choose Situation istrue as the link condition, the target activity will begin executing when thesituation becomes true.
Related concepts:“Tivoli Application Dependency Discovery Manager policies” on page 340
Configure Tivoli Application Dependency Discovery Manager Integration:
Selecting the Configure Tivoli Application Dependency Discovery ManagerIntegration activity opens a dialog box for entering the information required tosend updates to the TADDM server.
Define how Tivoli Monitoring communicates with TADDM and prepares TADDMto accept subsequent update requests from your Tivoli Monitoring environment.
If you have multiple TADDM servers, you must provide information for eachserver using separate Configure Tivoli Application Dependency DiscoveryManager Integration activities. Include this configuration activity in the workflowof a policy that is defined with Auto start selected, Correlated by set toUncorrelated, and Restart not selected.
If you change any fields at a later date, the new values become effectiveimmediately (assuming the containing policy has been defined to Auto start); thenext update sent by any policy to this TADDM server uses the new values.
Tivoli Application Dependency Discovery Manager Server AliasThe server alias represents a TADDM server. The server alias specified heremust be used by all activities that intend to send updates to this TADDMserver.
For example, the server alias specified for the associated Send TivoliApplication Dependency Discovery Manager Update activities mustmatch the server alias specified here.
The server alias can be an arbitrary name such as, Prod1, Test2, or Austin3.
Tivoli Application Dependency Discovery Manager Server TypeSelect the corresponding server type of the TADDM server you are sendingupdates to. The server type depends on how the TADDM server isconfigured. Select one of the following options: Enterprise or Domain. SeeThree ways of deploying TADDM in the TADDM Information Center formore information. Note: The selection of Enterprise corresponds to theTADDM synchronization server. The selection of Domain corresponds tothe TADDM domain/storage server.
Management Software System HostnameThis hostname must match the hostname provided by the DiscoveryLibrary Adapter (DLA) discovery process. This value is used to constructthe MSSName that is used in subsequent TADDM update activities. TheMSSName is used by the TADDM server to correlate update notificationswith information provided through the discovery process.
Typically, the value should specify the hostname of the portal server foundin the DLA XML output file. For example, if the DLA XML output fileincludes <cdm:Hostname>aix1.lab.raleigh.ibm.com</cdm:Hostname>, thenaix1.lab.raleigh.ibm.com would be the hostname you specify.
For more information on the DLA process see Using the TivoliManagement Services Discovery Library Adapter.
Chapter 11. Automating actions and responses 335
Tivoli Application Dependency Discovery Manager Server URLEnter the information for the TADDM server. The protocol options are http(default port 9430) or https (default port 9431). You can also specify yourown valid port number.
Tivoli Application Dependency Discovery Manager User CredentialsRequired user name and password for the TADDM server.
Tivoli Enterprise Portal Server URLEnter the information for the Tivoli Enterprise Portal Server. This URL isstored in the TADDM server and used to perform any launch-in-contextactivity. The protocol options are http (default port 1920) or https (defaultport 3660). You can also specify your own valid port number. Specify thesame hostname and port number that your portal server is configured touse.
Request ParametersThe Request Parameters section is used to define the format of theJavaScript Object Notation (JSON) update request that IBM TivoliMonitoring sends to the TADDM server. These three fields are included:Key, Value Type, and Value.
This section is predefined and typically does not require modification.
If needed, make a copy of the TADDM_Initialization policy and use therequest parameters included in the Configure Tivoli ApplicationDependency Discovery Manager Integration activity.
Insert Variable DataBecause the Request Parameters section is typically predefined, you do notneed to use substitution options.
Request timeoutSelect the amount of time in seconds you want to allow before a timeoutoccurs. A timeout occurs when IBM Tivoli Monitoring doesn't receive aresponse from the TADDM server. Options (in seconds): 5, 10, 15, 30(default), 45, 60, 90, 120.
Send a Tivoli Application Dependency Discovery Manager Update:
Selecting the Send a Tivoli Application Dependency Discovery Manager Updateactivity opens a dialog box for entering information required to forward changes inyour monitoring environment, discovered through situation events, to a TADDMserver.
Tivoli Application Dependency Discovery Manager AliasThe server alias represents a TADDM server. Use the same server alias thatyou specified in the associated Configure Tivoli Application DependencyDiscovery Manager Integration activity. The server alias can be anarbitrary name such as Prod1, Test2, or Austin3.
Operation TypeThe operation type determines what type of update is sent to the TADDMserver. Select one of the following types appropriate to the situation thattriggered the workflow: Create, Update, Move, or Delete.
Request ParametersThe Request Parameters section is used to define a JavaScript ObjectNotation (JSON) update request that IBM Tivoli Monitoring sends to theTADDM server. These three fields are included: Key, Value Type, and
336 IBM Tivoli Monitoring: Tivoli Enterprise Portal User's Guide
Value. Monitoring agents that exploit this activity provide policies thatinclude predefined request parameters.
The Key contains a list of common predefined keys. Other valid key valuescan be entered, but they must be part of the Tivoli Common Data Model(defined in the IBM Multilingual Terminology database).
The Value Type is a fixed list of selectable values.
The Value can be a predefined selected value or a user-defined value. Themost common options are displayed.
See “Request Parameters” on page 342 for more information.
Insert Variable DataSpecify Situation Attribute or Other value to substitute data from apreceding situation or On Demand activity.
The Situation Attribute button becomes active if the policy contains a"Wait until a situation is true" activity and you select a row cell underValue.
The Other value button becomes active if the user selects a row cell underValue. Selecting this button opens a dialog box that facilitates thesubstitution of data returned by a preceding On Demand activity, as wellas diagnostic information regarding TADDM activities and On Demandactivities.
Request timeoutSelect the amount of time in seconds you want to allow before a timeoutoccurs. A timeout occurs when IBM Tivoli Monitoring doesn't receive aresponse from the TADDM server. Options (in seconds): 5, 10, 15 (default),30, 45, 60, 90, 120.
If multiple data items are returnedYour selection here controls how this activity behaves if the triggeringsituation returns multiple rows of data. The selection should be predefinedbased on the supported monitoring agent.
If an update request should be sent only for the first situation row, selectExecute request once. Otherwise, select Execute request for each row fromactivity and select either the situation that triggered the workflow or theOn Demand activity. Ensure the Continue processing rows on failureoption is selected.
On Demand Report:
Use the On Demand Report activity to request real-time data from any monitoringagent. This activity is generally used to retrieve additional information related tothe situation that triggered a workflow.
ITM SOAP Server URLThe default value is Localhost. Protocol options are http (default) or https.Select Localhost or Other. When selecting Other, enter the specific hubmonitoring server where the targeted SOAP server is running and to whichthe On Demand Report will be sent. You must also specify the valid portnumber used by the SOAP server.
ApplicationSelect the application. For example, Windows OS.
Chapter 11. Automating actions and responses 337
Attribute GroupSelect the attribute group. Your options depend on the application youpreviously selected.
Data sourceFor Automatic, the On Demand Report request is sent to the monitoringagent that triggered the workflow. For Other, you can specify a validmanaged system name to which the On Demand Report request will besent.
ITM SOAP Server User CredentialsEnter the user name and password to access the ITM SOAP server.Credentials are required if authentication is enabled at the hub monitoringserver where the targeted SOAP server is running.
AttributesSelect the attributes you want to be returned in the report. You must selectas least one attribute.
Filter Add optional filters to the report. The report returns only rows that meetthe filter criteria.
The Attribute element is a list of attributes based on the selected AttributeGroup.
The supported operator values are Equal to, Not equal to, Less than, Lessthan or equal to, Greater than or equal to, Greater than, and Like. For theLike operator, the '*' character matches one or more characters. Onlysupported for text attributes.
The Value element can be a hard-coded literal or the substitution of anattribute or value returned by a preceding Wait On Situation or OnDemand activity.
Multiple filters are supported as conjuncts, for example, using AND to jointogether.
Insert Variable DataSpecify Situation Attribute or Other value to substitute data from apreceding situation or On Demand activity.
The Situation Attribute button becomes active if the policy contains a"Wait until a situation is true" activity and you select a row cell underValue.
The Other value button becomes active if the user selects a row cell underValue. Selecting this button opens a dialog box that facilitates thesubstitution of data returned by a preceding On Demand activity, as wellas diagnostic information regarding TADDM activities and On Demandactivities.
Request timeoutSelect the amount of time in seconds you want to allow before a timeoutoccurs. A timeout occurs when IBM Tivoli Monitoring doesn't receive aresponse from the SOAP server. Options (in seconds): 5, 10, 15 (default), 30,45, 60, 90, 120.
If multiple data items are returnedYour selection here controls how this activity behaves if the triggeringsituation returns multiple rows of data. The selection should be predefinedbased on the supported monitoring agent.
338 IBM Tivoli Monitoring: Tivoli Enterprise Portal User's Guide
If an update request should be sent only for the first situation row, selectExecute request once. Otherwise, select Execute request for each row fromactivity and select either the situation that triggered the workflow or theOn Demand activity. Ensure the Continue processing rows on failureoption is selected.
Value Substitution:
When you are using Other value data substitution, the following options areavailable.
The default substitution values are for an On Demand activity.
Substitution typeYour selection here dynamically changes the window options.
Value: Use this type to substitute data returned by an On Demand activity.
Diagnosis: Use this type to substitute diagnosis data.
Other: Use this type to substitute other values from the active policy.
Web Services ActivityDisplays when Value and Diagnosis are selected as the substitution type.Select the appropriate activity from the drop-down list.
Value TypeDisplays only when Value is selected as the substitution type. Yourselection here dynamically changes the window options.
On Demand attribute: Use this type to substitute an attribute from an OnDemand activity. In the Attribute name field, specify the name of theattribute returned by the On Demand activity.
Note: Leave out any non-alphanumeric characters and replace allspaces with underscores (_). If an attribute name begins with anon-alphanumeric character followed by a space, omit both. Forexample, % User Time is entered as User_Time and Avg % ProcessorTime is entered as Avg__Processor_Time.
XML element: Use this type to substitute XML data. Fill out the nowvisible Element substitution section providing the appropriate attributeand XML data. Typically this is not used.
Diagnosis typeDisplays when Diagnosis is selected as the substitution type. Select one ofthe following options:
Request: Use when you want the content of the request sent by thespecified Web Services Activity.
Response: Use when you want the response returned by the request. Noresponse is available for the Configure Tivoli Application DependencyDiscovery Manager Integration activity or the Send a Tivoli ApplicationDependency Discovery Manager Update activity; N/A is returned if theseactivities are selected as the web service.
Status: Use when you want the HTTP status of the request.
Other valuesDisplays only when Other is selected as the substitution type. Select theappropriate value from the drop-down list.
Chapter 11. Automating actions and responses 339
Send an e-mail:
Use the Send an e-mail window to send notification of a situation event or activityin your workflow to a single recipient. This activity does not support multiplee-mail recipients. This activity is not supported on a z/OS monitoring server.
However, if the hub monitoring server is not running on z/OS, a policy runningon a z/OS remote monitoring server can be configured to send e-mails through thehub’s SOAP server.
ITM Web Server URLThe default value is Localhost. Protocol options: http (default) or https.Only http and https are supported. Select Localhost or Other. Whenselecting Other, enter the specific hub monitoring server where thetargeted SOAP server is running and to which the e-mail request will besent. You must also specify the valid port number used by the SOAPserver.
SMTP ServerYour e-mail server. For example, smpt.us.ibm.com.
SenderThe e-mail address that is sending the notification.
To The e-mail address of a single recipient. Separate a list of recipients withcommas.
SubjectSpecify the subject heading of the e-mail. This field is optional.
Text Specify any text to be included in the e-mail. This field is optional.
Insert Variable DataSpecify Situation Attribute or Other value to substitute data from apreceding situation or On Demand activity.
The Situation Attribute button becomes active if the policy contains a"Wait until a situation is true" activity and you select a row cell underValue.
The Other value button becomes active if the user selects a field. Selectingthis button displays a dialogue that facilitates the substitution of datareturned by a preceding On Demand activity, as well as diagnosticinformation regarding TADDM and On Demand activities.
If multiple data items are returnedYour selection here controls how this activity behaves if the triggeringsituation returns multiple rows of data.
If an update request should be sent only for the first situation row, selectExecute request once. Otherwise, select Execute request for each row fromactivity, then select the situation that triggered the workflow or the OnDemand activity. Ensure the Continue processing rows on failure optionis selected.
Tivoli Application Dependency Discovery Manager policiesYou can create policies that interact with your Tivoli Application DependencyDiscovery Manager (TADDM) environment. These policies can forward updatessuch as, new, changed, or destroyed resources to your TADDM server.
Two types of policies are associated with TADDM:
340 IBM Tivoli Monitoring: Tivoli Enterprise Portal User's Guide
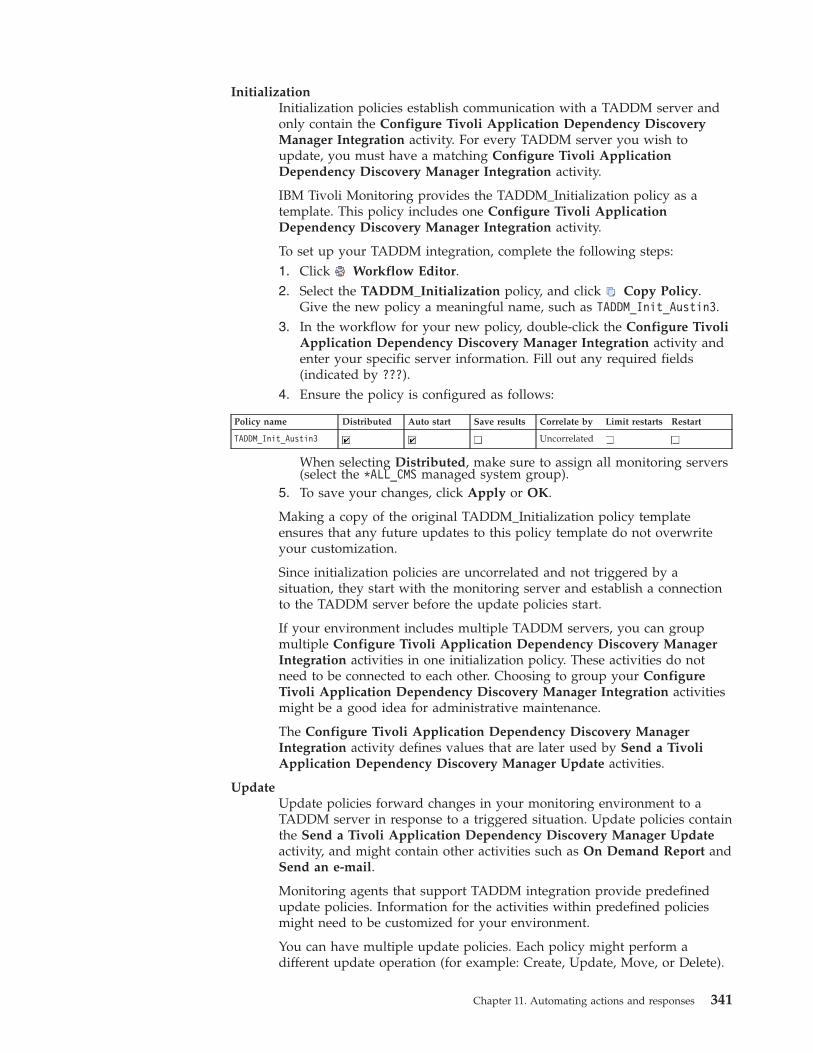
InitializationInitialization policies establish communication with a TADDM server andonly contain the Configure Tivoli Application Dependency DiscoveryManager Integration activity. For every TADDM server you wish toupdate, you must have a matching Configure Tivoli ApplicationDependency Discovery Manager Integration activity.
IBM Tivoli Monitoring provides the TADDM_Initialization policy as atemplate. This policy includes one Configure Tivoli ApplicationDependency Discovery Manager Integration activity.
To set up your TADDM integration, complete the following steps:1. Click Workflow Editor.2. Select the TADDM_Initialization policy, and click Copy Policy.
Give the new policy a meaningful name, such as TADDM_Init_Austin3.3. In the workflow for your new policy, double-click the Configure Tivoli
Application Dependency Discovery Manager Integration activity andenter your specific server information. Fill out any required fields(indicated by ???).
4. Ensure the policy is configured as follows:
Policy name Distributed Auto start Save results Correlate by Limit restarts Restart
TADDM_Init_Austin3 Uncorrelated
When selecting Distributed, make sure to assign all monitoring servers(select the *ALL_CMS managed system group).
5. To save your changes, click Apply or OK.
Making a copy of the original TADDM_Initialization policy templateensures that any future updates to this policy template do not overwriteyour customization.
Since initialization policies are uncorrelated and not triggered by asituation, they start with the monitoring server and establish a connectionto the TADDM server before the update policies start.
If your environment includes multiple TADDM servers, you can groupmultiple Configure Tivoli Application Dependency Discovery ManagerIntegration activities in one initialization policy. These activities do notneed to be connected to each other. Choosing to group your ConfigureTivoli Application Dependency Discovery Manager Integration activitiesmight be a good idea for administrative maintenance.
The Configure Tivoli Application Dependency Discovery ManagerIntegration activity defines values that are later used by Send a TivoliApplication Dependency Discovery Manager Update activities.
UpdateUpdate policies forward changes in your monitoring environment to aTADDM server in response to a triggered situation. Update policies containthe Send a Tivoli Application Dependency Discovery Manager Updateactivity, and might contain other activities such as On Demand Report andSend an e-mail.
Monitoring agents that support TADDM integration provide predefinedupdate policies. Information for the activities within predefined policiesmight need to be customized for your environment.
You can have multiple update policies. Each policy might perform adifferent update operation (for example: Create, Update, Move, or Delete).
Chapter 11. Automating actions and responses 341
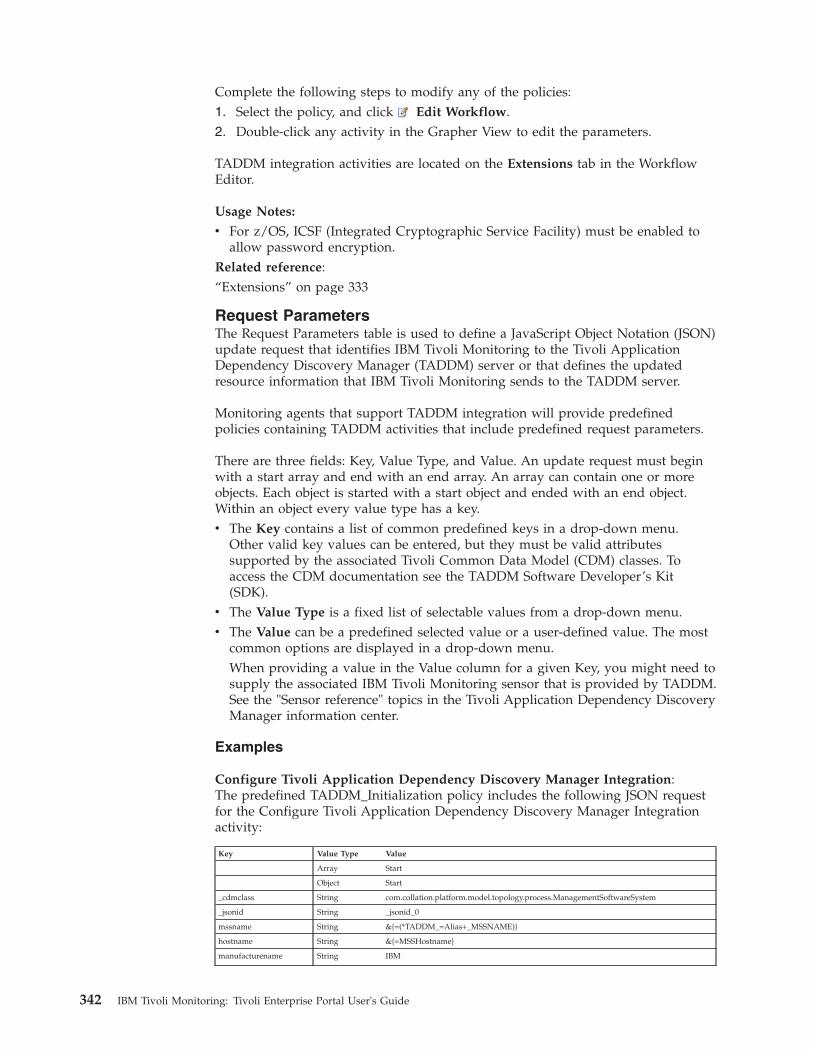
Complete the following steps to modify any of the policies:1. Select the policy, and click Edit Workflow.2. Double-click any activity in the Grapher View to edit the parameters.
TADDM integration activities are located on the Extensions tab in the WorkflowEditor.
Usage Notes:
v For z/OS, ICSF (Integrated Cryptographic Service Facility) must be enabled toallow password encryption.
Related reference:“Extensions” on page 333
Request ParametersThe Request Parameters table is used to define a JavaScript Object Notation (JSON)update request that identifies IBM Tivoli Monitoring to the Tivoli ApplicationDependency Discovery Manager (TADDM) server or that defines the updatedresource information that IBM Tivoli Monitoring sends to the TADDM server.
Monitoring agents that support TADDM integration will provide predefinedpolicies containing TADDM activities that include predefined request parameters.
There are three fields: Key, Value Type, and Value. An update request must beginwith a start array and end with an end array. An array can contain one or moreobjects. Each object is started with a start object and ended with an end object.Within an object every value type has a key.v The Key contains a list of common predefined keys in a drop-down menu.
Other valid key values can be entered, but they must be valid attributessupported by the associated Tivoli Common Data Model (CDM) classes. Toaccess the CDM documentation see the TADDM Software Developer’s Kit(SDK).
v The Value Type is a fixed list of selectable values from a drop-down menu.v The Value can be a predefined selected value or a user-defined value. The most
common options are displayed in a drop-down menu.When providing a value in the Value column for a given Key, you might need tosupply the associated IBM Tivoli Monitoring sensor that is provided by TADDM.See the "Sensor reference" topics in the Tivoli Application Dependency DiscoveryManager information center.
Examples
Configure Tivoli Application Dependency Discovery Manager Integration:The predefined TADDM_Initialization policy includes the following JSON requestfor the Configure Tivoli Application Dependency Discovery Manager Integrationactivity:
Key Value Type Value
Array Start
Object Start
_cdmclass String com.collation.platform.model.topology.process.ManagementSoftwareSystem
_jsonid String _jsonid_0
mssname String &{=(*TADDM_=Alias+_MSSNAME)}
hostname String &{=MSSHostname}
manufacturename String IBM
342 IBM Tivoli Monitoring: Tivoli Enterprise Portal User's Guide
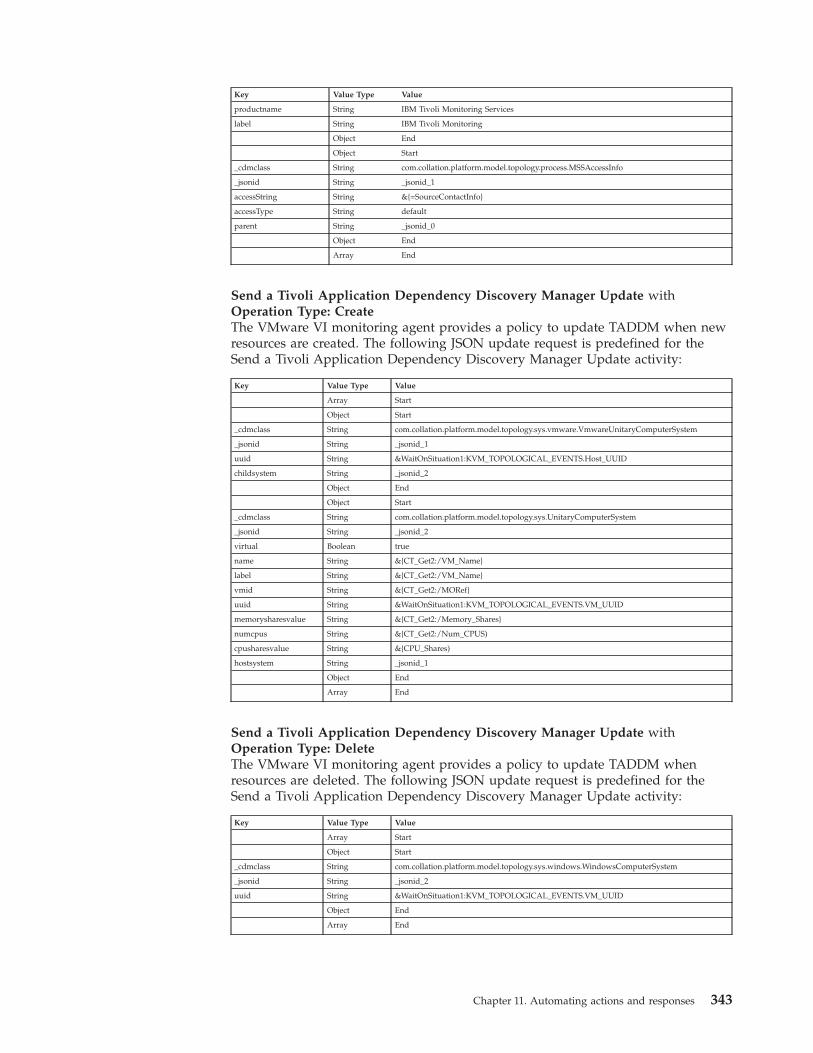
Key Value Type Value
productname String IBM Tivoli Monitoring Services
label String IBM Tivoli Monitoring
Object End
Object Start
_cdmclass String com.collation.platform.model.topology.process.MSSAccessInfo
_jsonid String _jsonid_1
accessString String &{=SourceContactInfo}
accessType String default
parent String _jsonid_0
Object End
Array End
Send a Tivoli Application Dependency Discovery Manager Update withOperation Type: CreateThe VMware VI monitoring agent provides a policy to update TADDM when newresources are created. The following JSON update request is predefined for theSend a Tivoli Application Dependency Discovery Manager Update activity:
Key Value Type Value
Array Start
Object Start
_cdmclass String com.collation.platform.model.topology.sys.vmware.VmwareUnitaryComputerSystem
_jsonid String _jsonid_1
uuid String &WaitOnSituation1:KVM_TOPOLOGICAL_EVENTS.Host_UUID
childsystem String _jsonid_2
Object End
Object Start
_cdmclass String com.collation.platform.model.topology.sys.UnitaryComputerSystem
_jsonid String _jsonid_2
virtual Boolean true
name String &{CT_Get2:/VM_Name}
label String &{CT_Get2:/VM_Name}
vmid String &{CT_Get2:/MORef}
uuid String &WaitOnSituation1:KVM_TOPOLOGICAL_EVENTS.VM_UUID
memorysharesvalue String &{CT_Get2:/Memory_Shares}
numcpus String &{CT_Get2:/Num_CPUS)
cpusharesvalue String &{CPU_Shares)
hostsystem String _jsonid_1
Object End
Array End
Send a Tivoli Application Dependency Discovery Manager Update withOperation Type: DeleteThe VMware VI monitoring agent provides a policy to update TADDM whenresources are deleted. The following JSON update request is predefined for theSend a Tivoli Application Dependency Discovery Manager Update activity:
Key Value Type Value
Array Start
Object Start
_cdmclass String com.collation.platform.model.topology.sys.windows.WindowsComputerSystem
_jsonid String _jsonid_2
uuid String &WaitOnSituation1:KVM_TOPOLOGICAL_EVENTS.VM_UUID
Object End
Array End
Chapter 11. Automating actions and responses 343
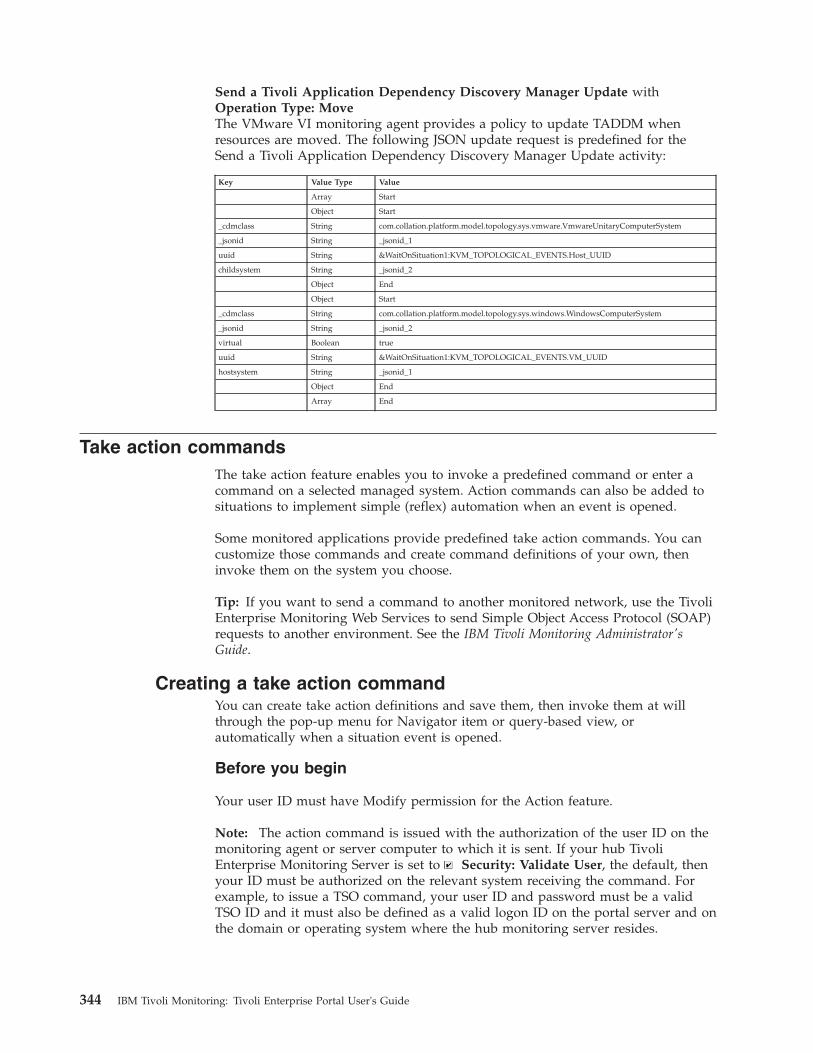
Send a Tivoli Application Dependency Discovery Manager Update withOperation Type: MoveThe VMware VI monitoring agent provides a policy to update TADDM whenresources are moved. The following JSON update request is predefined for theSend a Tivoli Application Dependency Discovery Manager Update activity:
Key Value Type Value
Array Start
Object Start
_cdmclass String com.collation.platform.model.topology.sys.vmware.VmwareUnitaryComputerSystem
_jsonid String _jsonid_1
uuid String &WaitOnSituation1:KVM_TOPOLOGICAL_EVENTS.Host_UUID
childsystem String _jsonid_2
Object End
Object Start
_cdmclass String com.collation.platform.model.topology.sys.windows.WindowsComputerSystem
_jsonid String _jsonid_2
virtual Boolean true
uuid String &WaitOnSituation1:KVM_TOPOLOGICAL_EVENTS.VM_UUID
hostsystem String _jsonid_1
Object End
Array End
Take action commandsThe take action feature enables you to invoke a predefined command or enter acommand on a selected managed system. Action commands can also be added tosituations to implement simple (reflex) automation when an event is opened.
Some monitored applications provide predefined take action commands. You cancustomize those commands and create command definitions of your own, theninvoke them on the system you choose.
Tip: If you want to send a command to another monitored network, use the TivoliEnterprise Monitoring Web Services to send Simple Object Access Protocol (SOAP)requests to another environment. See the IBM Tivoli Monitoring Administrator'sGuide.
Creating a take action commandYou can create take action definitions and save them, then invoke them at willthrough the pop-up menu for Navigator item or query-based view, orautomatically when a situation event is opened.
Before you begin
Your user ID must have Modify permission for the Action feature.
Note: The action command is issued with the authorization of the user ID on themonitoring agent or server computer to which it is sent. If your hub TivoliEnterprise Monitoring Server is set to Security: Validate User, the default, thenyour ID must be authorized on the relevant system receiving the command. Forexample, to issue a TSO command, your user ID and password must be a validTSO ID and it must also be defined as a valid logon ID on the portal server and onthe domain or operating system where the hub monitoring server resides.
344 IBM Tivoli Monitoring: Tivoli Enterprise Portal User's Guide
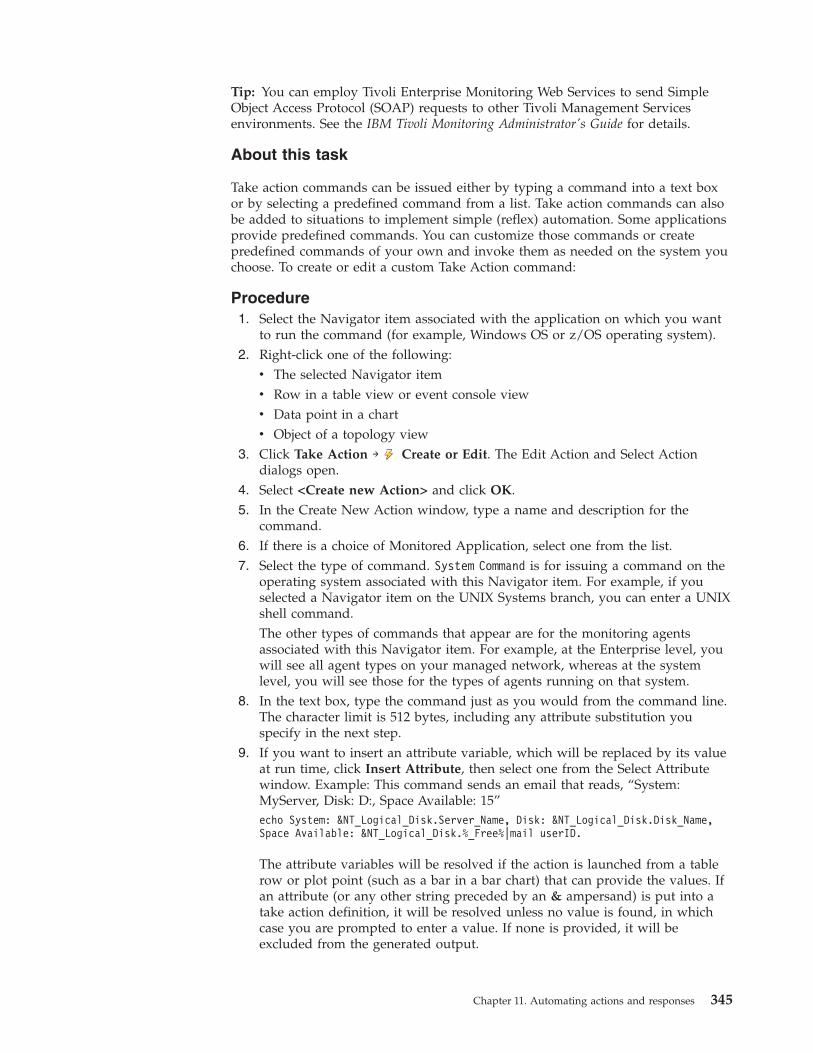
Tip: You can employ Tivoli Enterprise Monitoring Web Services to send SimpleObject Access Protocol (SOAP) requests to other Tivoli Management Servicesenvironments. See the IBM Tivoli Monitoring Administrator's Guide for details.
About this task
Take action commands can be issued either by typing a command into a text boxor by selecting a predefined command from a list. Take action commands can alsobe added to situations to implement simple (reflex) automation. Some applicationsprovide predefined commands. You can customize those commands or createpredefined commands of your own and invoke them as needed on the system youchoose. To create or edit a custom Take Action command:
Procedure1. Select the Navigator item associated with the application on which you want
to run the command (for example, Windows OS or z/OS operating system).2. Right-click one of the following:
v The selected Navigator itemv Row in a table view or event console viewv Data point in a chartv Object of a topology view
3. Click Take Action → Create or Edit. The Edit Action and Select Actiondialogs open.
4. Select <Create new Action> and click OK.5. In the Create New Action window, type a name and description for the
command.6. If there is a choice of Monitored Application, select one from the list.7. Select the type of command. System Command is for issuing a command on the
operating system associated with this Navigator item. For example, if youselected a Navigator item on the UNIX Systems branch, you can enter a UNIXshell command.The other types of commands that appear are for the monitoring agentsassociated with this Navigator item. For example, at the Enterprise level, youwill see all agent types on your managed network, whereas at the systemlevel, you will see those for the types of agents running on that system.
8. In the text box, type the command just as you would from the command line.The character limit is 512 bytes, including any attribute substitution youspecify in the next step.
9. If you want to insert an attribute variable, which will be replaced by its valueat run time, click Insert Attribute, then select one from the Select Attributewindow. Example: This command sends an email that reads, “System:MyServer, Disk: D:, Space Available: 15”echo System: &NT_Logical_Disk.Server_Name, Disk: &NT_Logical_Disk.Disk_Name,Space Available: &NT_Logical_Disk.%_Free%|mail userID.
The attribute variables will be resolved if the action is launched from a tablerow or plot point (such as a bar in a bar chart) that can provide the values. Ifan attribute (or any other string preceded by an & ampersand) is put into atake action definition, it will be resolved unless no value is found, in whichcase you are prompted to enter a value. If none is provided, it will beexcluded from the generated output.
Chapter 11. Automating actions and responses 345
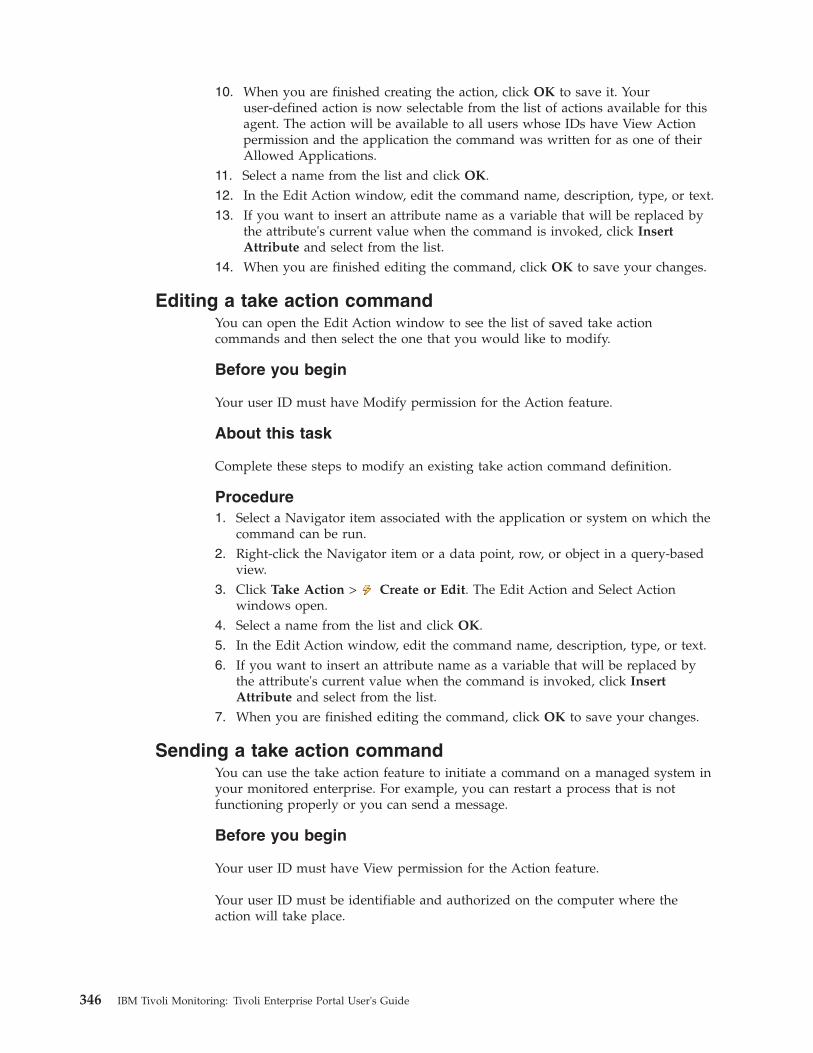
10. When you are finished creating the action, click OK to save it. Youruser-defined action is now selectable from the list of actions available for thisagent. The action will be available to all users whose IDs have View Actionpermission and the application the command was written for as one of theirAllowed Applications.
11. Select a name from the list and click OK.12. In the Edit Action window, edit the command name, description, type, or text.13. If you want to insert an attribute name as a variable that will be replaced by
the attribute's current value when the command is invoked, click InsertAttribute and select from the list.
14. When you are finished editing the command, click OK to save your changes.
Editing a take action commandYou can open the Edit Action window to see the list of saved take actioncommands and then select the one that you would like to modify.
Before you begin
Your user ID must have Modify permission for the Action feature.
About this task
Complete these steps to modify an existing take action command definition.
Procedure1. Select a Navigator item associated with the application or system on which the
command can be run.2. Right-click the Navigator item or a data point, row, or object in a query-based
view.3. Click Take Action > Create or Edit. The Edit Action and Select Action
windows open.4. Select a name from the list and click OK.5. In the Edit Action window, edit the command name, description, type, or text.6. If you want to insert an attribute name as a variable that will be replaced by
the attribute's current value when the command is invoked, click InsertAttribute and select from the list.
7. When you are finished editing the command, click OK to save your changes.
Sending a take action commandYou can use the take action feature to initiate a command on a managed system inyour monitored enterprise. For example, you can restart a process that is notfunctioning properly or you can send a message.
Before you begin
Your user ID must have View permission for the Action feature.
Your user ID must be identifiable and authorized on the computer where theaction will take place.
346 IBM Tivoli Monitoring: Tivoli Enterprise Portal User's Guide
About this task
To send a take action command, complete these steps:
Procedure1. Take one of the following actions:
v Select the Navigator item associated with type of command you want to runor the managed system on which you want to run the command.
v Open the workspace containing the view from which you want to launch theapplication.
2. Right-click one of the following:v Navigator item.v Row in a table or event console view.v Data point in a chart (such as a pie chart slice)v Topology view object.
3. Click Take Action > Select.4. Select a predefined action or enter a command using the Command field.
To select a predefined action:
a. In the Name field click the List button to see and select an actionname.The command is displayed in the field below. Some actions do notrequire you to add a value. Those that do open the Edit ArgumentValues window automatically. Other actions might display asuggested value, which you can change by clicking Arguments andentering a different value.
b. If the Edit Argument Values window opens, enter a value toidentify the item on which the action must take place.
c. If the action command fills in the value automatically and youwant to change it, click Arguments and enter the value thatidentifies what to act on.A two-column window opens with the attribute in the Namecolumn and a place to enter the value of the attribute in the Valuecolumn. For example, if you chose the action that starts a process,you must identify the process by entering its name as the value. Ifno argument is required for the action command, this function willbe disabled.
d. Click an application host in the Destination System list.If you want to send the command to multiple systems, useCtrl+click to select more or Shift+click to select all systems between.
To enter a command:
a. In the Command text box, type a command. For example:Net send mars The server is running out of memory.Close some applications
The user at the system named mars sees the message, "The server isrunning out of memory. Close some applications."
b. Click an application host in the Destination System list.If you want to send the command to multiple systems, useCtrl+click to select more or Shift+click to select all systems between.
Chapter 11. Automating actions and responses 347
After you click OK, the command is run on the selected system orsystems. If a message is returned, it will be from the application onwhich the command was run.
Creating a take action viewTivoli Enterprise Portal enables you to interact directly with your applications andoperating system through its take action feature. You can use the take action viewto enter a system command or to stop or start a process at the system.
Before you begin
Your user ID must have Workspace Author Mode permission to use this function.
Procedure1. Open the workspace where you want the view2. If you want the view to occupy a new pane, click Split Vertically or Split
Horizontally in one of the views. The pane divides and a duplicate is created. Ifyou split the Navigator, the new view is empty.
3. Click Take Action. The mouse pointer changes to the view icon (hand iconon Linux). If you get the wrong icon or decide not to add the view, pressEscape or click somewhere in the toolbar.
4. Click inside the view where you want the take action view. After you click, theold view is replaced by the take action view.
What to do next
If you want to keep the take action view in this workspace for future worksessions, either click Save to update the workspace properties with the newview, or click File > Save Workspace As to save this as a new workspace andleave the original unchanged.
Rules and guidelines for take action commandsFollow these rules when specifying arguments and commands for a take actiondefinition.v A single parameter should not contain interleaving blanks, unless you enclose
the text in double quotes ("). Arguments containing interleaving blanks areseparated into individual values. Example: F HCHECKER,UPDATE,CHECK=(&Health_Checker_Checks.Check_Owner,&Health_Checker_Checks.Check_Name),PARM=“&Health_Checker_Checks.Parameters”
v Specify substitution variables by prefixing attribute names with an &ersand.
v Specify fully qualified attributes in the &Groupname.Attributename format,indicating that a value can only be substituted from a specific attribute group.
v Command strings are created by concatenating the contents of the Commandentry field with all the arguments in the Arguments field.
v When an attribute is selected and added to the Arguments field, the attribute isremoved from the list of available attributes.
v A command string (Command + Arguments) definition is limited to 512 bytes.The formatted command string, after variable substitution, is limited to 256bytes.
348 IBM Tivoli Monitoring: Tivoli Enterprise Portal User's Guide
v The action command is issued with the authorization of the user ID on themanaged system or monitoring server machine to which it is sent. If yourmanaged network validates user IDs, then your ID must be authorized on therelevant system receiving the command. For example, to issue a TSO command,your user ID must be a valid TSO ID and it must also be defined as a validlogon ID for the Tivoli Enterprise Portal.
Launch applicationUse the launch application feature to write and save definitions that startapplications on your computer. For example, using single sign-on in the browserclient or Java Web Start client, you can launch into another participating Tivoli webapplication.
A launch definition can include arguments that are passed to the application whenit is started. The definition can be an operating system command or URL, and caninclude arguments. A simple example is opening a specific text file in a text editor.And another example is opening your browser to access the RMF™ Monitor IIIPortal.
You can launch an application by creating a definition right when you need it orby selecting from a list of existing definitions. Some monitoring products providepredefined launch definitions. You can customize those definitions or use thelaunch application feature to build a set of command definitions for yourself or forall users in your monitored environment.
The Tivoli Enterprise Portal single sign-on (SSO) feature enables you to launch outof the portal into other Tivoli web-based or web-enabled applications withouthaving to re-enter your user credentials. From the portal browser client or JavaWeb Start client, you can launch into another participating Tivoli web application.
Creating a launch definitionCreate a custom launch definition from the Navigator item or query-based view(including event console views) where you want to enter the command. Whenlaunched from a query-based view, the command can include attribute values fromthe launch point, such as IP address or process name.
Before you begin
If your monitored application has predefined launch application definitions or youwould like to include attribute names in the argument as symbols to be replacedby the attribute values at launch time, see the product user's guide for the settings.
Your user ID must have View and Modify permission for the Launch Applicationfeature. If you want the new launch definition to be available to other users, youmust be in Workspace administration mode when you create it.
About this task
Take these steps to create a launch definition:
Procedure1. Select the Navigator item to launch from.2. If the launch definition will originate from a table, chart, event console view,
or relational-based topology view, open the workspace containing the view. If
Chapter 11. Automating actions and responses 349
the workspace is not the default, use the Workspace Gallery to select it. Youcan add an argument that includes attribute names in the definition that areresolved at launch time with the current attribute values.
3. Right-click one of the following:v Navigator item.v Row in a table or event console view.v Data point in a chart (such as a plot chart point).v Topology view object.
4. Click Launch and, in the Create or Edit Launch Definitions window, clickCreate New.
5. In the Name text box, type a descriptive name.6. In the Target text box, click Browse to locate and select the application to
launch. If you leave the field empty, the default behavior is to open WindowsInternet Explorer as the launch application. This is desirable when a URL isincluded in the definition and it will be launched from different computers. Ifyou want a different browser used, the kjr.browser.default client parametercan be changed through Manage Tivoli Monitoring Services, as described inthe IBM Tivoli Monitoring: Administrator's Guide.
7. In the Arguments text box, type any arguments to be added to start theapplication:v To launch a web page, enter the URL, such as http://ibm.com.v To add a file name, click Browse, select Filename, then locate and select
the file.If any of the argument contains spaces, surround it with double quotes, asin “C:\Documents and Settings\Administrator\My Documents\db_notes.doc”. If you have multiple files to specify, separate each entrywith a space and enclose in double quotes, as in “C:temp\my_log.txt”“C:temp\your_log.txt”.
v To add an attribute or other symbolic reference that is known at thislocation, click Browse, select Substitutable Items, then select an attributefrom the Selected Context list or a symbol from the Extended Contextlist. The value will be retrieved at launch time. For example, User Id (AsTyped) shows as &-12002 in the argument and evaluates to sysadmin;Process Name shows as &NT_Process.Process_Name in the argument andevaluates to BigProcess.
v To prompt for a value, type a ^ caret mark then the prompt, as in ^Name,followed by a single space or a comma. If you would like to supply adefault value, but also enable the user to change it, append the prompt withan = equal sign and the value. For example, ^Name=Fred, where Name is theprompt and Fredis the default value.
v To prompt for a hidden value, such as a password, type two ^^ caret marksthen the prompt (no spaces are allowed), as in ^^Password.
v To add data or an attribute to look up in context, precede the data with an& ampersand.
v To include an & ampersand or ^ caret in the filename or value, precede itwith a / forward slash. For example john&jane.lwp would be entered asjohn/&jane.lwp.
8. If you added arguments, you can give the user the option to change thevalues at launch time by selecting Edit arguments before execution.
9. If you need to specify the Start in location, click Browse to locate and selectthe folder for the program or other required files.
350 IBM Tivoli Monitoring: Tivoli Enterprise Portal User's Guide
10. If the definition originates from a Navigator item and you want to restrict itsavailability to this item only or to others of the same type, click Advanced toopen the Advanced Options for Launch Definition window and select one ofthe options.
11. Click Evaluate to see how the arguments will resolve when the applicationlaunches.
12. When you are finished with the launch definition, click Apply to save yourchanges and keep the window open; or click OK to save your changes andclose the window.
Copying or editing a launch definitionYou can use an existing launch definition as a template for creating anotherdefinition and edit the copy. The predefined definitions for your product can offera good starting point.
Before you begin
Your user ID must have View and Modify permission for the Launch Applicationfeature.
About this task
Take these steps to copy or edit a launch definition:
Procedure1. Select the Navigator item where the launch definition originates.2. If the launch definition was created from a table, chart or event console view,
open the workspace containing the view. Use the Workspace Gallery to seethumbnail graphics of the workspaces for a Navigator item, and select one toopen.
3. Right-click one of the following:v Navigator item.v Row in a table or event console view.v Data point in a chart (such as a pie slice or bar).v Topology view object
4. Click Launch and select the definition you want to copy or edit.5. If you want to create a copy of the definition, click Create Another.6. Starting at the step for selecting the application to launch in the Target text box,
continue with the remaining steps for "Creating a launch definition".
Deleting a launch definitionWhen you no longer need to keep a launch definition, remove it from the list.
Before you begin
Your user ID must have View and Modify permission for the Launch Applicationfeature.
About this task
Take these steps to delete a launch definition:
Chapter 11. Automating actions and responses 351
Procedure1. Select the Navigator item where the launch definition originates.2. If the launch definition was created from a table, chart or event console view,
open the workspace containing the view.3. Right-click one of the following:
v Navigator item.v Row in a table or event console view.v Point in a chart (such as a pie slice or anywhere in a gauge)v Topology view object
4. Click Launch.5. Select the definition from the list and click Delete.6. Click Apply to save your changes and keep the window open, or click OK to
save your changes and close the window.
Launch application examplesThese examples illustrate some of the uses for launch application and give thedefinition syntax.
Launching a batch fileTo launch a batch file, you must specify the command prompt as the targetand the batch file as the argument. This example starts myscript.bat.
Target: c:\windows\system32\cmd.exeArguments: /c start c:\scripts\myscript.batStart in: c:\windows\system32
Launching a website with search textIn this example the user typed everything in the Arguments text boxexcept for &NT_Logical_Disk;:Disk_Name, which was added whenDiskName was selected from the list of Substitutable items. The attribute isreplaced by the current value when the application is launched.
Target: C:\Program Files\Mozilla Firefox\firefox.exeArguments: http://www.ibm.com/search?q=+&NT_Logical_Disk.Disk_Name
Launching a website with no target browser specifiedThis example specifies a URL for the argument, much like the previousexample. Notice, however, that there is no specified target. When theTarget field is left blank, the Microsoft Internet Explorer is assumed (unlessanother browser was specified with the kjr.browser.default clientparameter).
Arguments: http://www.ibm.com
Launching another Tivoli Enterprise Portal browser client on a different portalserver This example is similar to the previous one. You can start a new browser
client in another Tivoli managed network. If the browser supports multipletabbed windows, a new tab is started for the launched portal workspace.
Target: C:\Program Files\Mozilla Firefox\firefox.exe
Arguments: http://floor3west.usca.ibm.com:1920///cnp/kdh/lib/cnp.html?hostname=floor3west*
Launching a Telnet sessionTo launch a Telnet session, you must specify the command prompt as thetarget and the Telnet session as the argument.
Target: c:\windows\system32\cmd.exe
352 IBM Tivoli Monitoring: Tivoli Enterprise Portal User's Guide
Arguments: /c start telnet.exe computer, , where computer is thelocation where the Telnet executable is found.Start in: c:\windows\system32
Chapter 11. Automating actions and responses 353

354 IBM Tivoli Monitoring: Tivoli Enterprise Portal User's Guide
Chapter 12. User administration
Every portal work session begins with a successful logon and connection to theTivoli Enterprise Portal. The logon user IDs and user groups are created andprofiled through the Administer Users window.
Administer Users is a multi-tabbed two-paned window. The top frame has twotabs: Users and User Groups, that list the user IDs, distinguished names ifthe portal server is configured for authentication to an LDAP repository, and theuser groups that are stored on the portal server. The profile of the selected user oruser group is reflected in the bottom frame:
Permissions has a list of the portal features in the Authorities box. On theright are the possible operations for the selected feature. A selected check boxmeans the selected user or user group has permission to perform thatoperation; a indicator next to the check box means the permission was addedto a user group the user belongs to.
Applications shows all the applications being monitored and that areavailable for assigning to the user or user group. One user or user group, forexample, can be profiled to see only the OMEGAMON® applications, another tosee only Linux and Oracle, middleware, and another to see all applications.
Navigator Views shows all the Navigator views that are on the portal serverand that are available for assigning to the user or user group. The user or usergroup can be restricted to seeing only a certain branch of a Navigator viewrather than the entire hierarchy.
Member of, when the Users tab is selected, or Members, when the UserGroups tab is selected, is a list of the groups the user belongs to or the usernames in the group.
The User Administration function enables you to maintain user IDs and usergroups on the portal server, and provides varying degrees of access to the featuresand views of your monitored environment to accommodate any combination of jobroles, such as operators who respond to alerts and direct them to the appropriateperson for handling and administrators who plan, design, customize, and managethe monitoring environment.
In some managed enterprises one person might assume all of these roles. In largerenterprises, the roles are often divided. You can choose to assign roles byindividual user or by user type or both.
Managing user IDsManaging user IDs begins with planning the authorities to grant to users andwhether they will belong to user groups.
The Administer Users window provides the tools for creating and maintaining userIDs, and adjusting permissions. This is also where user IDs are mapped to theirunique identifier in the LDAP repository if user authentication through the portalserver has been configured.
© Copyright IBM Corp. 2005, 2012 355
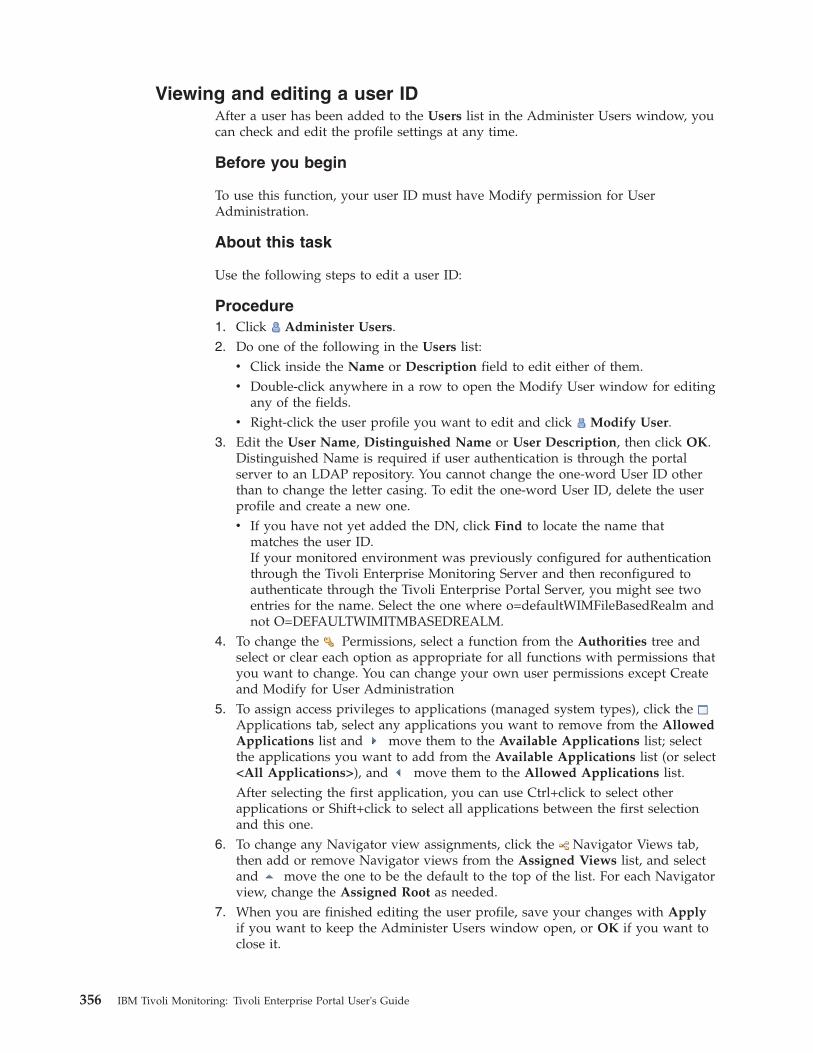
Viewing and editing a user IDAfter a user has been added to the Users list in the Administer Users window, youcan check and edit the profile settings at any time.
Before you begin
To use this function, your user ID must have Modify permission for UserAdministration.
About this task
Use the following steps to edit a user ID:
Procedure1. Click Administer Users.2. Do one of the following in the Users list:
v Click inside the Name or Description field to edit either of them.v Double-click anywhere in a row to open the Modify User window for editing
any of the fields.v Right-click the user profile you want to edit and click Modify User.
3. Edit the User Name, Distinguished Name or User Description, then click OK.Distinguished Name is required if user authentication is through the portalserver to an LDAP repository. You cannot change the one-word User ID otherthan to change the letter casing. To edit the one-word User ID, delete the userprofile and create a new one.v If you have not yet added the DN, click Find to locate the name that
matches the user ID.If your monitored environment was previously configured for authenticationthrough the Tivoli Enterprise Monitoring Server and then reconfigured toauthenticate through the Tivoli Enterprise Portal Server, you might see twoentries for the name. Select the one where o=defaultWIMFileBasedRealm andnot O=DEFAULTWIMITMBASEDREALM.
4. To change the Permissions, select a function from the Authorities tree andselect or clear each option as appropriate for all functions with permissions thatyou want to change. You can change your own user permissions except Createand Modify for User Administration
5. To assign access privileges to applications (managed system types), click theApplications tab, select any applications you want to remove from the AllowedApplications list and move them to the Available Applications list; selectthe applications you want to add from the Available Applications list (or select<All Applications>), and move them to the Allowed Applications list.After selecting the first application, you can use Ctrl+click to select otherapplications or Shift+click to select all applications between the first selectionand this one.
6. To change any Navigator view assignments, click the Navigator Views tab,then add or remove Navigator views from the Assigned Views list, and selectand move the one to be the default to the top of the list. For each Navigatorview, change the Assigned Root as needed.
7. When you are finished editing the user profile, save your changes with Applyif you want to keep the Administer Users window open, or OK if you want toclose it.
356 IBM Tivoli Monitoring: Tivoli Enterprise Portal User's Guide
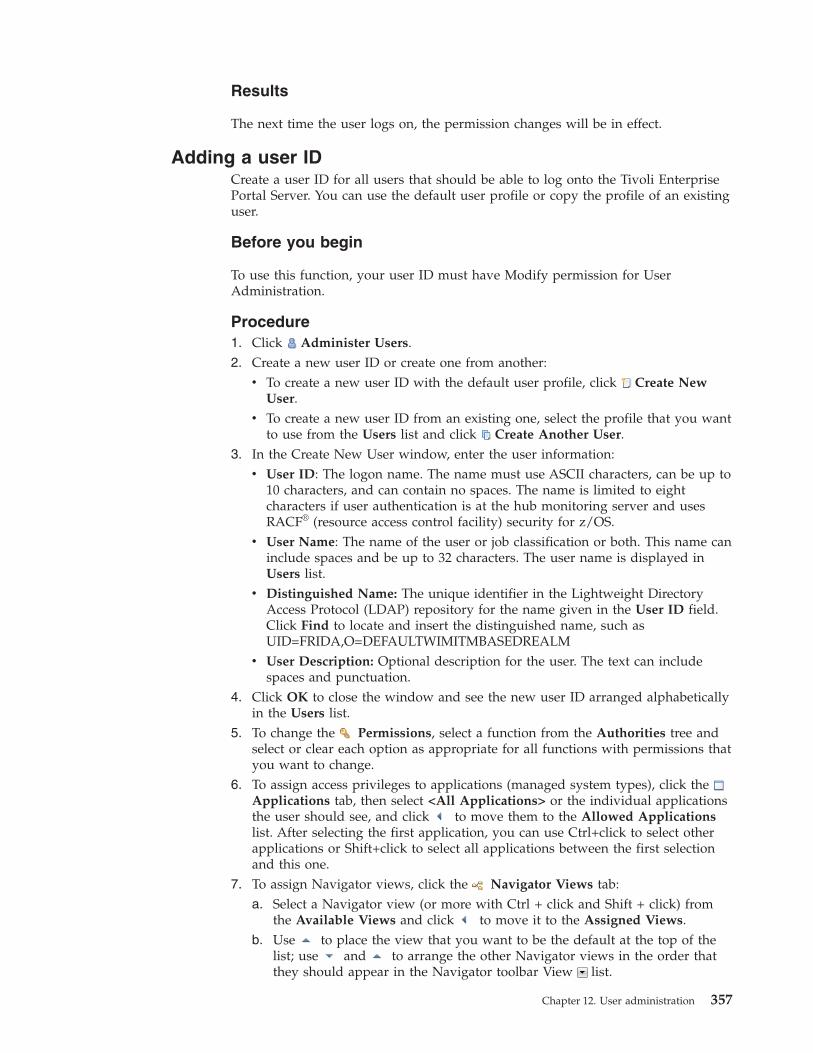
Results
The next time the user logs on, the permission changes will be in effect.
Adding a user IDCreate a user ID for all users that should be able to log onto the Tivoli EnterprisePortal Server. You can use the default user profile or copy the profile of an existinguser.
Before you begin
To use this function, your user ID must have Modify permission for UserAdministration.
Procedure1. Click Administer Users.2. Create a new user ID or create one from another:
v To create a new user ID with the default user profile, click Create NewUser.
v To create a new user ID from an existing one, select the profile that you wantto use from the Users list and click Create Another User.
3. In the Create New User window, enter the user information:v User ID: The logon name. The name must use ASCII characters, can be up to
10 characters, and can contain no spaces. The name is limited to eightcharacters if user authentication is at the hub monitoring server and usesRACF® (resource access control facility) security for z/OS.
v User Name: The name of the user or job classification or both. This name caninclude spaces and be up to 32 characters. The user name is displayed inUsers list.
v Distinguished Name: The unique identifier in the Lightweight DirectoryAccess Protocol (LDAP) repository for the name given in the User ID field.Click Find to locate and insert the distinguished name, such asUID=FRIDA,O=DEFAULTWIMITMBASEDREALM
v User Description: Optional description for the user. The text can includespaces and punctuation.
4. Click OK to close the window and see the new user ID arranged alphabeticallyin the Users list.
5. To change the Permissions, select a function from the Authorities tree andselect or clear each option as appropriate for all functions with permissions thatyou want to change.
6. To assign access privileges to applications (managed system types), click theApplications tab, then select <All Applications> or the individual applicationsthe user should see, and click to move them to the Allowed Applicationslist. After selecting the first application, you can use Ctrl+click to select otherapplications or Shift+click to select all applications between the first selectionand this one.
7. To assign Navigator views, click the Navigator Views tab:a. Select a Navigator view (or more with Ctrl + click and Shift + click) from
the Available Views and click to move it to the Assigned Views.b. Use to place the view that you want to be the default at the top of the
list; use and to arrange the other Navigator views in the order thatthey should appear in the Navigator toolbar View list.
Chapter 12. User administration 357
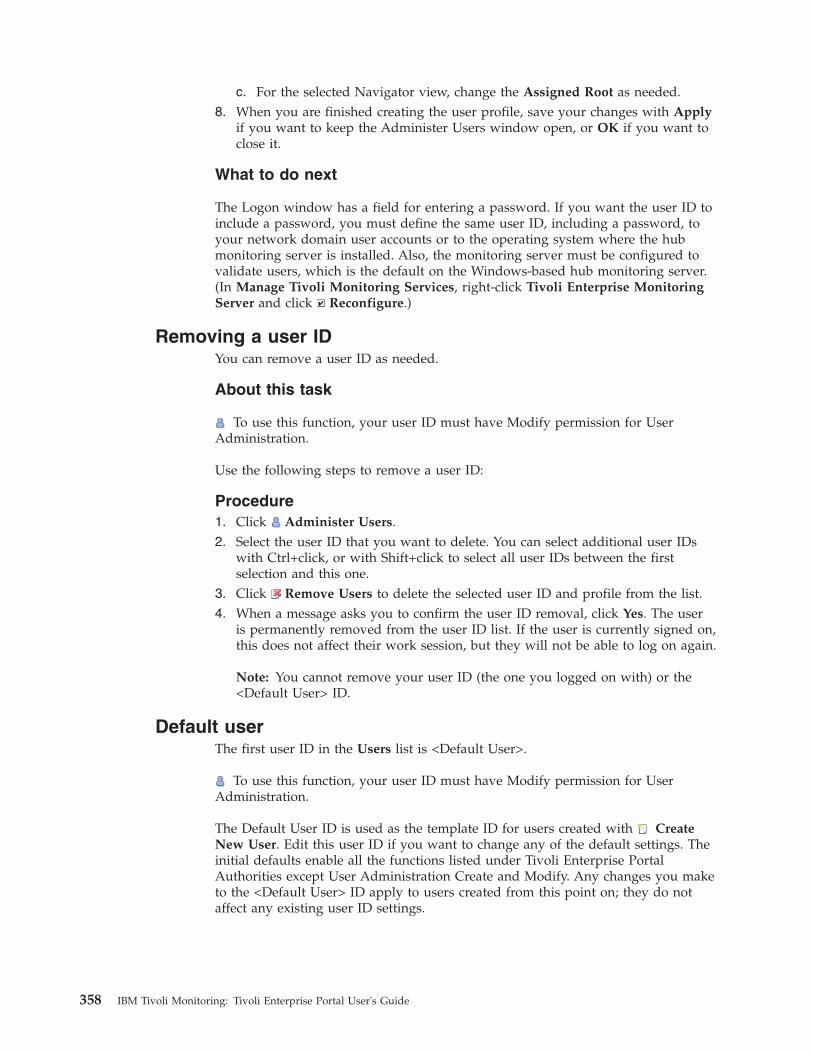
c. For the selected Navigator view, change the Assigned Root as needed.8. When you are finished creating the user profile, save your changes with Apply
if you want to keep the Administer Users window open, or OK if you want toclose it.
What to do next
The Logon window has a field for entering a password. If you want the user ID toinclude a password, you must define the same user ID, including a password, toyour network domain user accounts or to the operating system where the hubmonitoring server is installed. Also, the monitoring server must be configured tovalidate users, which is the default on the Windows-based hub monitoring server.(In Manage Tivoli Monitoring Services, right-click Tivoli Enterprise MonitoringServer and click Reconfigure.)
Removing a user IDYou can remove a user ID as needed.
About this task
To use this function, your user ID must have Modify permission for UserAdministration.
Use the following steps to remove a user ID:
Procedure1. Click Administer Users.2. Select the user ID that you want to delete. You can select additional user IDs
with Ctrl+click, or with Shift+click to select all user IDs between the firstselection and this one.
3. Click Remove Users to delete the selected user ID and profile from the list.4. When a message asks you to confirm the user ID removal, click Yes. The user
is permanently removed from the user ID list. If the user is currently signed on,this does not affect their work session, but they will not be able to log on again.
Note: You cannot remove your user ID (the one you logged on with) or the<Default User> ID.
Default userThe first user ID in the Users list is <Default User>.
To use this function, your user ID must have Modify permission for UserAdministration.
The Default User ID is used as the template ID for users created with CreateNew User. Edit this user ID if you want to change any of the default settings. Theinitial defaults enable all the functions listed under Tivoli Enterprise PortalAuthorities except User Administration Create and Modify. Any changes you maketo the <Default User> ID apply to users created from this point on; they do notaffect any existing user ID settings.
358 IBM Tivoli Monitoring: Tivoli Enterprise Portal User's Guide
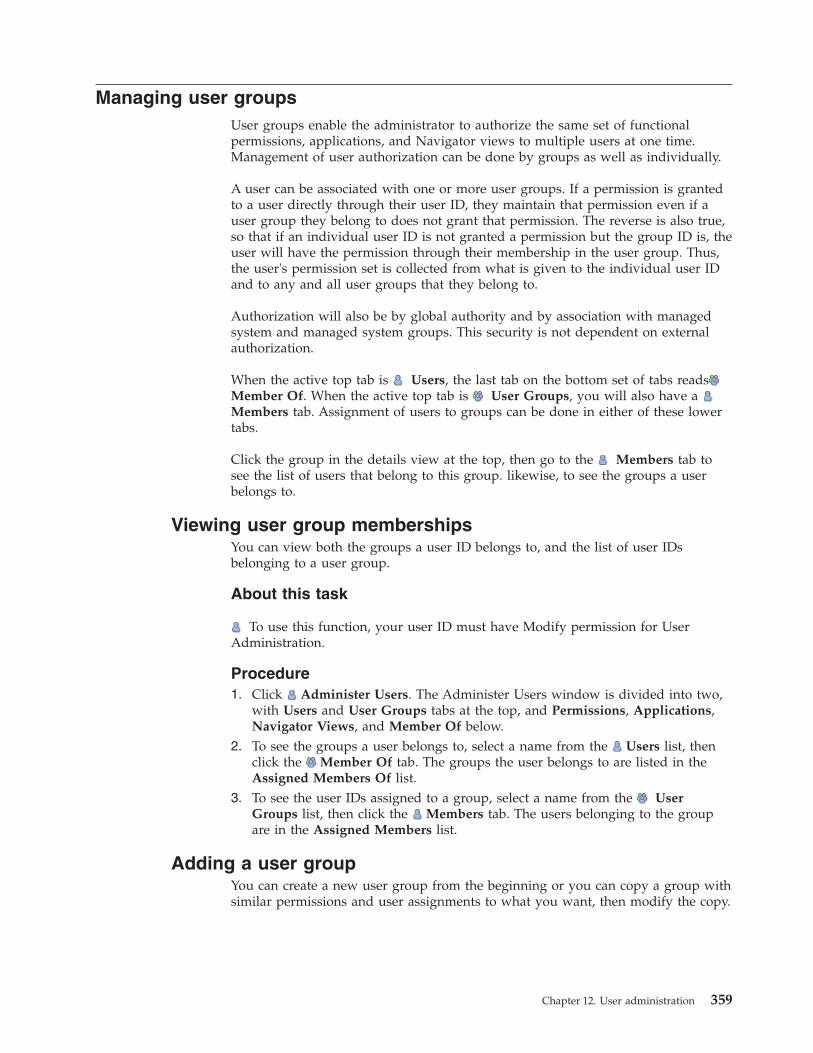
Managing user groupsUser groups enable the administrator to authorize the same set of functionalpermissions, applications, and Navigator views to multiple users at one time.Management of user authorization can be done by groups as well as individually.
A user can be associated with one or more user groups. If a permission is grantedto a user directly through their user ID, they maintain that permission even if auser group they belong to does not grant that permission. The reverse is also true,so that if an individual user ID is not granted a permission but the group ID is, theuser will have the permission through their membership in the user group. Thus,the user's permission set is collected from what is given to the individual user IDand to any and all user groups that they belong to.
Authorization will also be by global authority and by association with managedsystem and managed system groups. This security is not dependent on externalauthorization.
When the active top tab is Users, the last tab on the bottom set of tabs readsMember Of. When the active top tab is User Groups, you will also have aMembers tab. Assignment of users to groups can be done in either of these lowertabs.
Click the group in the details view at the top, then go to the Members tab tosee the list of users that belong to this group. likewise, to see the groups a userbelongs to.
Viewing user group membershipsYou can view both the groups a user ID belongs to, and the list of user IDsbelonging to a user group.
About this task
To use this function, your user ID must have Modify permission for UserAdministration.
Procedure1. Click Administer Users. The Administer Users window is divided into two,
with Users and User Groups tabs at the top, and Permissions, Applications,Navigator Views, and Member Of below.
2. To see the groups a user belongs to, select a name from the Users list, thenclick the Member Of tab. The groups the user belongs to are listed in theAssigned Members Of list.
3. To see the user IDs assigned to a group, select a name from the UserGroups list, then click the Members tab. The users belonging to the groupare in the Assigned Members list.
Adding a user groupYou can create a new user group from the beginning or you can copy a group withsimilar permissions and user assignments to what you want, then modify the copy.
Chapter 12. User administration 359
Before you begin
To use this function, your user ID must have Modify permission for UserAdministration.
About this task
Complete these steps to add a user group:
Procedure1. Click Administer Users to open the Administer Users window.2. Click the User Groups tab.3. Do one of the following:
v To create a new user group, click Create New Group.v To copy an existing user group, select the group name from the list and
click Create Another Group.4. In the Create New Group or Create Another Group window, enter the
following user information:a. Group ID: The group identifier. This name can be up to 10 characters and
can contain no spaces. The name is limited to eight characters if the hubmonitoring server uses RACF (resource access control facility) security forz/OS.
b. Group Name: The name or job classification for the user group. This namecan include spaces..
c. Group Description: The text to describe the user group, such as theirresponsibilities. The description can include spaces and punctuation.
5. Click OK to close the window and see the new user group arrangedalphabetically in the User Group list.
6. Add members to the group in the Members tab by selecting one or moreuser IDs in the Available Members list and clicking to move to theAssigned Members list.
7. To change the Permissions for the group, select a function from theAuthorities tree and select or clear each option check box for all functions.
8. To assign access privileges to applications (managed system types) for thegroup, click the Applications tab, then select <All Applications> or theindividual applications the user should see, and click to move them to theAllowed Applications list. After selecting the first application, you can useCtrl+click to select other applications or Shift+click to select all applicationsbetween the first selection and this one.
9. To assign Navigator views to the group, click the Navigator Views tab,then add or remove Navigator views from the Assigned Views list, and use
to place the default view at the top of the list. For each Navigator view,change the Assigned Root as needed.
10. When you are finished creating the user group, save your changes with Applyto keep the Administer Users window open, or OK to close it.
Reviewing and editing a user groupAfter a user group has been added to the User Groups list in the Administer Userswindow, you can check and edit the profile settings at any time.
360 IBM Tivoli Monitoring: Tivoli Enterprise Portal User's Guide
About this task
To use this function, your user ID must have Modify permission for UserAdministration.
Use the following steps to edit a user ID:
Procedure1. Click Administer Users to open the Administer Users window.2. Click the User Groups tab.3. Right-click the user group to edit and click .4. Edit the Group Name and Group Description, then click OK. You cannot
change the one-word group ID. You must, instead, create another user groupfrom this one and give it a new name, then delete this one.
5. To change the Permissions, select a function from the Authorities tree andselect or clear each option as appropriate for all functions with permissions thatshould change.
6. To change the group access privileges to applications (managed system types),click the Applications tab, select any applications you want to remove fromthe Allowed Applications list and click ; select the applications you want toadd from the Available Applications list (or select <All Applications>), andclick . After selecting the first application, you can use Ctrl+click to selectother applications or Shift+click to select all applications between the firstselection and this one.
7. To change any Navigator view assignments for the group, click theNavigator Views tab, then add or remove Navigator views from the AssignedViews list, and use to place the one you want to be the default at the top ofthe list. For each Navigator view, change the Assigned Root as needed.
8. When you are finished editing the user group, save your changes with Applyto keep the Administer Users window open, or OK to close it. The user groupchanges are effective the next time each group member logs on.
Note: You can change the permissions, except Create and Modify for UserAdministration, of any groups you are a member of.
Removing a user groupYou can remove a user group.
About this task
To use this function, your user ID must have Modify permission for UserAdministration.
Use the following steps to remove a user ID:
Procedure1. Click Administer Users to open the Administer Users window.2. Click the User Groups tab.3. Select the user group to delete from the list and click Remove Selected
Group. You can select additional user IDs with Ctrl+click, or with Shift+click toselect all user groups between the first selection and this one.
Chapter 12. User administration 361
4. When a message asks you to confirm the user group removal, click Yes. Thegroup is permanently removed from the user group list. Any members of thisuser group who receive permissions from the group will not be affected untilthey next log on to the portal server.
Administer UsersYour user ID and the user groups you are a member of are profiled with a set ofpermissions that determines which Tivoli Enterprise Portal features you areauthorized to see and use, a list of monitored applications you are authorized tosee, and a list of Navigator views (and the highest level within a view) you canaccess.
Clicking Administer Users opens the Administer Users window. This is atwo-paned window with Users and User Groups tabs in the top frame, and severaltabs in the bottom frame. This arrangement enables the administrator to manageuser profiles by individual user, by user groups, or a combination of the two. Youmight create a user profile, then copy the profile for each additional user andchange settings as needed (such as, for the Action feature, granting Viewpermission to one user and granting Modify permission to a different user). Oryou might create a user group with a particular profile and add users to the group.Then you can modify the permissions once for a group and apply to all membersautomatically.
Users and User GroupsThe Users and User Groups tabs list the user IDs and the user groups thatare stored on the portal server.
After you select a user or user group from one of the lists, you can click any of thetabs in the lower half of the window to see the what permissions have beengranted and what has been assigned. User groups enable the administrator toauthorize the same set of functional permissions, applications, and Navigatorviews to multiple users at one time. Management of user authorization can bedone by groups as well as individually. A user can be associated with one or moreuser groups; authorization by group will be by inclusion and not exclusion (nestedgroups are supported). Authorization will also be by global authority and byassociation with managed system and managed system lists. This security is notdependent on external authorization.
PermissionsYou can authorize the same set of functional permissions multiple users, usergroup or each user ID at one time.
The following features are enabled or disabled individually for each user ID oruser group.
ActionView allows the user to see and run a take action command from the
available list of commands in the Take Action view and in the pop-upmenu for the Navigator item.
Modify allows the user to create and save Take Action commands.When enabled, Edit Action appears in the Navigator pop-up menu.
When issuing a take action command, you must be authorized on therelevant system for the requested command. For example, to issue a TSO
362 IBM Tivoli Monitoring: Tivoli Enterprise Portal User's Guide
command, your user ID must be both a valid TSO ID and a valid user IDon the portal server. The user ID must be typed with the same letter casingexactly as typed when logging on to the portal server (with the same lettercasing).
Agent ManagementManage allows the user to perform agent deployment throughout the
managed network. This includes installing a monitored product, keepingthe software revisions up-to-date, and removing an agent from themanaged network. This permission also requires Action - Modify to beenabled.
Start/Stop allows the user to start a monitoring agent or to stop itrunning.
Custom Navigator ViewsModify allows the user to create new Navigator views, edit and delete
them. With Modify cleared, the user will not see Edit Navigator Viewin the Navigator toolbar.
Event Attach allows the user to attach a file (such as detailed notes) to thesituation event. This permission requires that the user also have theAcknowledge and View permissions.
Close lets you close a pure event or an event that was open before asituation was stopped manually. When it is enabled, Close SituationEvent appears in the pop-up menu of the situation event flyover list, eventNavigator item, and situation event console view when the selected eventis a pure event or the situation has been stopped.
View enables you to see situation event indicators in the Navigatorwhen situations become true.
Acknowledge allows you to acknowledge a situation event. When thispermission is enabled, Acknowledge Event appears in the pop-up menu ofthe situation event flyover list, event Navigator item, and situation eventconsole view.
FeatureEnable is dimmed because you cannot change it. The access to this
feature is determined by your organization's IBM Tivoli Monitoring license.
HistoryConfigure allows the user to open the History Collection Configuration
window, configure history files and data rolloff, and start and stop datacollection for the different attribute groups. When this permission isenabled, History Configuration appears in the main toolbar.
Launch ApplicationLaunch allows the user to invoke any of the launch definitions
available for the Navigator item, table view, chart view, or situation eventconsole view. When this permission is enabled, History Configurationappears in the main toolbar.
View allows the user to see the composition of the selected launchdefinition.
Modify allows the user to create, edit and delete launch definitions.
Managed System GroupView allows the user to access the Object group editor for viewing
Chapter 12. User administration 363
managed system groups. The user also needs Modify permission for theObject group editor tools to be available.
Modify allows the user to open the Object group editor to create, edit,and delete managed system groups.
Policy View allows the user to open the Workflows window to see the policies
and their definitions. With View permission, the Workflow Editor is
available in the main toolbar and Manage Policies is available in theNavigator pop-up menu at the agent level.
Start/Stop lets you start and stop policies. With this permission
enabled, Start Policy and Stop Policy are available when you selecta policy.
Modify allows the user to open the Workflow editor to create and editpolicies. With the Modify permission enabled, New Policy is available
after the user selects a policy, as are the other editing tools: Edit
Workflow, Copy Policy, and Delete Policy.
Query View allows the user to access the Query editor through the Propertieseditor and select a query for the selected table or chart. With the Viewpermission enabled, the user can assign a query through the Query tab ofthe Properties editor.
Modify allows the user to create, edit and delete queries in the Queryeditor. With the Modify permission enabled, Query Editor is availablefrom the main toolbar, as are the query editing tools.
SituationView allows the user to see situations in the Situation editor, including
any expression overrides, and in the Manage Situations at ManagedSystem window. With the View permission enabled, Situation Editor isavailable in the main toolbar and in the Navigator item (except at theplatform level) pop-up menu.
Modify lets you create new situations and manage them. When theModify permission has been granted, the situation editing tools andpop-up menu options are available in the Situation editor, as well as theOverride Formula button in the Distribution tab for qualifying situations.
Start/Stop lets you start or stop a situation and enable or disable a
situation override. When this permission is enabled, Start Situation and
Stop Situation are available in the situation event flyover list, situationevent console view, Situation editor pop-up menu, and the ManageSituations at Managed System window; and Enable Situation Overridesand Disable Situation Overrides are available in the Situation editorpop-up menu.
Terminal ScriptView allows the user to run or stop running a terminal emulator script
and to see scripts, but not to edit them. If View is disabled the user will beable only to run or stop a script.
Modify allows the user to create or record new terminal emulatorscripts, edit, and delete them.
User AdministrationIf you are viewing your own user ID, you will see that View and Modifyare disabled; you cannot change your User Administration permissions.
364 IBM Tivoli Monitoring: Tivoli Enterprise Portal User's Guide
Logon Permitted enables log on to the portal server with this user ID.The administrator can clear the check box to deny a user access to theportal. This option works in conjunction with theKFW_AUTHORIZATION_MAX_INVALID_LOGIN (the default is 0,unlimited attempts are allowed) parameter in the Tivoli Enterprise PortalServer Environment Configuration file, kfwenv. When the value has beenset and the invalid attempts have been exceeded, the check box is clearedautomatically and the administrator must select the check box to reset thelogon attempt count. See the IBM Tivoli Monitoring Administrator's Guide fordetails. Modify allows the editing of user IDs and removing them.
When this permission is enabled, Administer Users is available in themain toolbar and the tools are available in the Administer Users window.
Author Mode Eligible allows the user to enable or disable their AuthorMode permission under Workspace Administration (see next authority),but not for any other user IDs.
View allows the user to open the Administer Users window and seetheir user profile.
Administration Mode Eligible allows the user to enable or disabletheir Administration Mode permission under Workspace Administration(see next authority), but not for any other user IDs.
Workspace AdministrationWorkspace Author Mode allows the user to create and edit
workspaces, links, and terminal emulator scripts. If Workspace AuthorMode is disabled, the user cannot make any of these changes but cancontinue monitoring and responding to alerts; the tools can still be seen,but they are disabled.
Workspace Administration Mode is available only for the SYSADMINuser ID and new IDs made from it in the Create Another User window.When administration mode is enabled, changes you make to workspacesaffect all users who log on to the same portal server . When it is disabled,workspace changes you make are not shared with other users. Be sure toselect Do not allow modifications in the Workspace Propertieswhenever you create or edit a workspace in administration mode.Otherwise, if a user edits that workspace, you no longer own theworkspace and cannot override their changes.
WebSphere MQ Configuration AuthoritiesIBM Tivoli OMEGAMON XE for Messaging: WebSphere MQ Configurationinstallations will see this folder.
View allows the user to see, but not change, your organization'sWebSphere MQ configuration in the Navigator Configuration view.
Modify allows the user to change your organization's WebSphere MQconfiguration or to schedule updates in the Configuration view.
Storage Subsystem AuthoritiesIBM Tivoli OMEGAMON XE for Storage installations will see this folder.Select View to allow the user to see, but not change data. SelectModify to allow the user to change data.
Data Collection Configuration allows the user to view or modify thecollection control interval for the DFSMSrmm Status workspace andDataset Attributes System Summary workspace.
Chapter 12. User administration 365
Dataset Groups Collection Interval allows the user to view or modify thecontrol interval for the Dataset Group Summary workspace.
Define/Update Dataset Groups allows the user to view or modify thegroup definitions for the Dataset Group Summary workspace.
ApplicationsYour user ID is set so you can see some or all the application types beingmonitored. For example, one user might be able to see only mainframeapplications, while another can see only middleware, and another sees allapplications.
Allowed ApplicationsShows the applications that you can access from Tivoli Enterprise Portal.
Available ApplicationsShows the applications available for assignment to the selected user. If<All Applications> is on the Allowed Applications list, then no otherentries can be added. You must move it back to Available Applicationsbefore you can select a subset of applications to assign.
Select the applications you want to add, or select <All Applications>, andmove them to the Allowed Applications list. After selecting the first
application, you can use Ctrl+click to select other applications orShift+click to select all applications between the first selection and this one.
Navigator viewsWhen a Navigator view is created, only the author is able to see the view, but it isavailable for the administrator to assign to users. An assigned Navigator viewmeans the user can open it. For each assigned view, the user can be restricted tosee only a certain branch rather than the entire hierarchy.
Assigned ViewsShows the Navigator views the user is able to see and access. The firstNavigator view in this list is the default for the user; it displaysautomatically whenever the user logs on. You can select any views towhich you do not want the user to have access, and click right arrow tomove them to the Available Views list. Select the appropriate entries andclick left arrow to move them to the Assigned Views. You can move aNavigator view to the top of the list to make it the default by clicking the
up arrow.
Available ViewsShows the Navigator views not assigned to the user and available forassignment. Select the Navigator views you want to add and move them tothe Assigned Views list by using the left arrow. After selecting the firstview, you can use Ctrl+click to select other views or Shift+click to select allviews between the first selection and this one.
Assigned RootShows the Navigator view chosen in Assigned Views, with the user'sassigned Navigator root highlighted. The root is the top-most level of thisNavigator view that the user can access. The user can access this item andall items below it, but no items parallel to or above it in the Navigator.
For example, you can assign UNIX Systems as the assigned root. The usersees the UNIX Systems workspaces and those below, but is not able to seethe Enterprise workspaces or anything under Windows Systems.
366 IBM Tivoli Monitoring: Tivoli Enterprise Portal User's Guide
Member Of and MembersWhen you select a user or user group from the list, the last tab on the bottom setof tabs reads either Member Of or Members (reflecting the selection of a User orUser Group). Assignment of users to groups can be done in either tab.
Notes on user administrationRead these notes to understand the user ID contribution to Tivoli Enterprise Portalfunctions and modes.
Workspace administration mode
Any changes you make to workspaces, links, and terminal host session scripts inthe Tivoli Enterprise Portal are available only to your user ID. The exception iswhile Workspace Administration Mode is enabled.
Workspace administration mode enables you to customize and add workspaces,links, and terminal emulator scripts that are shared with all users connected to thesame Tivoli Enterprise Portal Server. See “Starting workspace administrationmode” on page 65.
SYSADMIN logon ID
The Tivoli Enterprise Portal requires your logon ID whenever you start a worksession. Every ID must first have been registered on the portal server. You can logonto the portal server with SYSADMIN and register other user IDs through theAdminister Users window. The initial user ID, SYSADMIN, has full access andcomplete administrator authority. The system administrator registers additionalusers and sets their access privileges and authority.
User ID and groups
Each user ID is stored at the Tivoli Enterprise Portal Server and contains:v The user namev Job descriptionv Permissions for viewing or modifying Tivoli Enterprise Portal functionsv Assigned Navigator views and which Navigator item in each view appears as
the root (default is the first item)v Access to specific monitoring applicationsv The user groups the user belongs to and indicators to signify when a permission
has been granted to the user by a user group
Each user group is also stored at the portal server and has the same contents as forindividual user IDs. But, instead of a list of user groups, it has a list of the userIDs assigned to the group.
Default user
The first user ID in the list is <Default User> and is used as the template ID forusers created with Create New User. Edit this user ID if you want to change any ofthe default settings. The initial defaults enable all the functions listed under TivoliEnterprise Portal Authorities, except the Modify permission for UserAdministration. Any changes you make to <Default User> ID apply to userscreated from this point on; they will not affect any existing user ID settings.
Chapter 12. User administration 367
Granting access to a user
You set the authority privileges for each user when you create their user IDs.Giving users access to operational areas and customization options takes planning.Consider the job responsibilities of each user and the company securityrequirements when specifying authority privileges.
Important: Anyone with permission to create custom queries obtains access to allof the ODBC data source names (DSNs) created at the Tivoli Enterprise PortalServer. Add database user IDs, to be used in the DSN, to your database software,making sure to restrict user access to only those tables, columns, and so on,allowed by your organization's security policies.
Validating user access
The Tivoli Enterprise Portal Server verifies user IDs whenever users log on. If a jobdescription changes and the user requires different access to the portal server, youmust review and perhaps change the user's permissions.
The user ID for logging on to the portal server might include a password. You donot establish passwords in the portal. Instead, you must define a matching user IDwith password to the network domain user accounts or to the operating systemwhere the hub Tivoli Enterprise Monitoring Server resides:v User Accounts on the Windows systemv Password file on the UNIX systemv RACF or ACF/2 host security system on the z/OS system
As well, the monitoring server must be configured to Validate User. When userslog on to the portal server, the hub monitoring server makes a request to thedomain or the operating system to validate the user ID and password.
If the monitoring server has been installed on a distributed system, you can checkif it has been configured to Validate User:1. Start the Manage Tivoli Monitoring Services program:
Start → Programs →IBM Tivoli Monitoring → Manage TivoliMonitoring Services.
Change to the Install_dir/bin directory and run the followingcommand: ./itmcmd manage [-h Install_dir] where Install_dir is theinstallation directory (default is opt/IBM/ITM).
2. Right-click the Tivoli Enterprise Monitoring Server row for TEMS1 (hub) andselect Reconfigure.
3. In the Tivoli Enterprise Monitoring Server Configuration window, observe thesetting of the Security: Validate User check box.When this option is selected, the password is required whenever a user logs onto the portal server; when it is cleared, the user name is required to log on butno password is required.
Note: Be aware that passwords must follow the security requirements for yourorganization. If this includes periodic password changes, you might get a Logonpassword has expired message while attempting to log on to the portal server.Should this happen, you must change your system password before you can logon. For example, on Windows this means changing the password through theAdministrative Tools User Accounts.
368 IBM Tivoli Monitoring: Tivoli Enterprise Portal User's Guide
Launching into the portal from other applications
In addition to any security requirements for launching into the Tivoli EnterprisePortal (such as single sign-on requirements), the Tivoli Enterprise Portal user IDthat receives control after a launch from an external application must bepre-authorized to access the target managed system and workspaces. The user IDalso must be authorized to issue any required take action commands.
User ID for Take Action commands
When the Tivoli Enterprise Portal sends a Take Action command to a managedsystem, the user ID might or might not be checked for authority to perform theaction. In the simplest case, the command is sent to the managed system andexecuted using the user ID under which the agent is running. TheTivoli EnterprisePortal user ID is sent along with the action command in these contexts:v On-demand: user ID currently logged onv Situation action: user ID of the last person to update the situationv Workflow action: user ID of the last person to update the policy
However, the ID is ignored by the managed system unless told otherwise by acommand prefix. These are command handlers implemented in the TivoliMonitoring products to control whether the Tivoli Enterprise Portal user ID shouldbe validated before passing the command to the agent for execution.
Command prefixWhen a command prefix is present in the Take Action, the agent passes thecommand to the application handler rather than executing the command.The syntax of the prefix and take action command isproductcode:CNPuserID:command and the agent routes it to theapplication for execution. The application is free to execute the commandwith whatever user ID is appropriate. In the case of OMEGAMON XE forWebSphere MQ on z/OS, the Tivoli Enterprise Portal user ID is used.
If the special prefix is missing, the agent executes the command with theuser ID under which the agent is running.
Most monitoring products do not employ a command prefix. TivoliMonitoring for WebSphere MQ does and, in fact, prepends any on-demandTake Action commands with a hidden MQ:CNPuserID: prefix, althoughyou cannot see it.
UNIX setuid commandIn addition to the command prefix and security exit, UNIX offers anotheroption: a setuid command, which causes the process to dynamicallychange its userid. Thus, the agent could be changed to set the ID to thevalue passed as a parameter, issue the command, then change the user IDback again after the command is issued.
Troubleshooting logon error messagesLogon prompts and progress messages are displayed in the Logon window statusbar. If a user cannot log on, a message is displayed.
If a user cannot log on, one of the following messages is displayed:
Failed connection to Tivoli Enterprise Portal Server
Chapter 12. User administration 369
1. On the system where the Tivoli Enterprise Portal Server is installed,click Start -> Programs -> IBM Tivoli Monitoring -> Manage TivoliMonitoring Services.
2. Optional: Right-click the Tivoli Enterprise Portal Server entry and clickChange Startup. In the window that opens, select System Accountand Allow Service to Interact with Desktop and click OK.This opens a command line window when the Tivoli Enterprise PortalServer is started and displays the internal commands.
3. Ensure that the Tivoli Enterprise Portal Server is started:- If it is started, recycle it.- If it is stopped, start it.
4. If you are still unable to connect, review the following information. If itdoes not apply to your situation, contact IBM Software Support.
If you are running in browser mode and going across networks to reachthe Tivoli Enterprise Portal Server, it is possible the host name cannot beresolved by the network system. If this is the case, doing the followingshould resolve the problem:1. On the system where the Tivoli Enterprise Portal Server is installed,
click Start -> Programs -> IBM Tivoli Monitoring -> Manage TivoliMonitoring Services.
2. Right-click the Tivoli Enterprise Portal Browser service and clickReconfigure.
3. Change the host name to the IP address in two places:In the Launch URL field, change hostname in http://hostname:1920///cnp/client to the IP address of the Tivoli Enterprise Portal Server. Forexample, http://10.21.2.166:1920///cnp/client.In the Host field, change the host name to the IP address of the TivoliEnterprise Portal Server.
4. Click OK.5. Start Tivoli Enterprise Portal browser mode using the IP address
instead of the host name.6. If you are still unable to connect, contact IBM Software Support.
Logon password has expiredIf the hub Tivoli Enterprise Monitoring Server is set to Validate Users, thenpasswords are required. Passwords must follow the security requirementsof your organization. If this includes periodic password changes, youmight get this message while attempting to log on to the portal server.Should this happen, you must change your system password before youcan log on. For example, on Windows this means changing the passwordthrough the Administrative Tools User Accounts.
User authorization has failed -OR- Unable to process logon requestTivoli Enterprise Portal uses the TEPS database to locally validate users. Ifyour hub monitoring server is set for user validation (Windows default),the user ID is also validated at the monitoring server to verify thepassword.
The portal server did not validate the user credentials as entered. For the“Unable to process logon request” message, the portal server was able tovalidate the user credentials but did not complete the logon request. Ineither case, have the user try logging on again. If the message is displayedagain, do the following:
370 IBM Tivoli Monitoring: Tivoli Enterprise Portal User's Guide
1. On the system where the monitoring server is installed, ensure that theserver is running in Manage Tivoli Monitoring Services.
2. If the monitoring server is running, ensure that the user ID has beendefined in Tivoli Enterprise Portal: Click Administer Users, then findthe ID in the Users list.
3. If the user has been defined, check if host level security was turned onfor the hub monitoring server and that the user ID has been authorizedto the host environment:In Manage Tivoli Monitoring Services, right-click Tivoli EnterpriseMonitoring Server, and click Reconfigure. If host level security hasbeen configured, the Security: Validate User box is selected.If the monitoring server has been configured to Validate User, the userID for Tivoli Enterprise Portal must also be added to the networkdomain user accounts or to the operating system where the monitoringserver is installed, including a password.If non-ASCII characters were included in the user ID, they are notsaved with the user ID.
4. Try logging on to Tivoli Enterprise Portal with the user ID in question.5. If you cannot log on to Tivoli Enterprise Portal and the monitoring
server is running properly, the problem might be with the TivoliEnterprise Portal Server. Try recycling the portal server. If the user isstill unable to log on, contact IBM Software Support.
This message is also displayed after a retry period of several minutes (thedefault is 10 minutes and can be changed through Manage TivoliMonitoring Services) where the status bar shows Validating usercredentials continuously. This can be a symptom that the monitoringserver is stopped.
Chapter 12. User administration 371

372 IBM Tivoli Monitoring: Tivoli Enterprise Portal User's Guide
Chapter 13. Managing the environment
Managing your Tivoli monitored environment involves monitoring and managingthe availability of the components of the Tivoli Management Services infrastructureand the agents that use its services. It also involves organizing managed systemsand situations into logical groupings that can be applied to situations and policydistributions with a single action.
These topics describe the tools and functions you can use to monitor the status ofmanaged systems and manage components and agents on distributed systems. SeeAdministering IBM Tivoli Monitoring Products for detailed information on day-to-dayadministrative tasks.
Grouping objectsUse the Object group editor to organize situations, managed systems, andhistorical configurations into named collections that can be applied with a singleaction.
Situations in groups can be started or stopped, and they can be distributed tomanaged systems. Managed systems can be assigned as a group to customNavigator view items, to situation distribution lists, to policy distribution lists, andto historical collection configurations. Similarly, historical collections in groups canbe distributed to managed systems as if they were a single collection.
Object group editorUse the Object group editor to organize Tivoli Monitoring objects (historicalconfigurations, managed systems, and situations) into named groups that you canreference in distribution lists.
The navigation tree shows the types of object groups that are available and anygroups that have been created. Click to expand the list of groups for the objecttype. Some object types have categories that expand to show their groups. Toreplace this user assistance with an object group definition, do either of thefollowing:v Click a group name.v Click a group type, click Create new group, and enter a name and
description.
The object definition has tabs that show the objects that are assigned to the groupand those that are available. When a member of a group is an object group itself,you can select it to see its constituents. You can assign individual objects to agroup and you can assign a group to another group, thus creating nested groups.
Historical configurationsUse historical configuration groups to combine related historical collectionsinto groups. You can then control collection for the group rather thanhaving to select collection definitions individually.
MembersThe text boxes show the historical configuration members of agroup, as well as any groups that are contained in (members of)
© Copyright IBM Corp. 2005, 2012 373
other object groups, and any that are available for inclusion in agroup. Individual members represent historical collectiondefinitions for an attribute group.
Member ofThis tab shows any groups that the selected historical configurationgroup belongs to and any that are available.
DistributionsThe distributions are the managed systems and managed systemgroups that the historical configuration group is distributed to, aswell as any available managed systems and groups. Select amanaged system group to see its constituent objects in the SelectedAssigned Object Members or Selected Available Object Memberslist.
Managed systemAny set of managed systems that have a relationship, such as bygeography or business function, can be organized into a managed systemgroup for assigning to custom Navigator views, historical collectiondistributions, situation distributions, or policy distributions. The navigationtree lists all the managed system types that are available, including AllManaged Systems for creating managed system groups that combinemultiple managed system types.
MembersThe text boxes show the managed system members and groupsthat have been assigned to the group and any members that areavailable for assignment. Any members that are object groupsthemselves can be selected from the Members... list to see theobjects that belong to it in the Selected... list below.
Assigned toAny groups that the managed system group is assigned to areshown here. If, for example, a situation or situation group has beendistributed to this managed system group, that distribution will belisted here.
SituationIf you frequently distribute a particular set of situations, create a situationobject group for them. You can then distribute the group in the same wayas for a single situation, thus saving time and ensuring consistency inapplying your best practices.
MembersThe text boxes show the situation members and groups that havebeen assigned to the group and any that are available forassignment. If a member is an object group, you can select it fromthe Members list. The objects that belong to it are displayed in thecorresponding Selected list below.
Member ofShown here are any groups the situation group belongs to and anythat are available.
DistributionsThe distributions are the managed systems and managed systemgroups that the situation group is distributed to, as well as theavailable managed systems and groups. You can select a managed
374 IBM Tivoli Monitoring: Tivoli Enterprise Portal User's Guide
system group to see its constituent objects in the Selected AssignedObject Members or Selected Available Object Members list.
Managed system groupsA managed system group is a named collection of managed systems. Whendistributing a situation, policy, or historical collection configuration to managedsystems, or when assigning managed systems to a custom Navigator view, you canspecify a managed system group (or groups).
If the main toolbar has no Object group editor, your user ID does not haveView permission for managed system groups. If you can open the editor, but thetools not enabled after you select one of the managed system groups, your user IDdoes not have Modify permission for managed system groups.
Predefined managed system groupsThe Tivoli Enterprise Monitoring Server and every IBM Tivoli Monitoring producthas at least one predefined managed system group, indicated by an asterisk at thebeginning of the list name, such as *NT_SYSTEM for IBM Tivoli Monitoring forWindows.
You can also create new managed system groups for different purposes. Forexample, you can create a group of Linux managed systems for a particulargeographic region named LINUX_LONDON, so that you can distribute situationsthat are specific to that location. Managed system groups are stored at the HubTivoli Enterprise Monitoring Server, thus any lists you create are available to allusers who are logged on to the Tivoli Enterprise Portal Server that connects to thathub monitoring server.
When you assign a predefined managed system group to a situation, policy, query,custom Navigator, historical collection, historical configuration object group, or asituation object group, all managed systems of that type are selected. And as newmanaged systems are added to the monitored network, they automatically becomemembers of the predefined managed system group of their agent type.
You cannot edit or delete a predefined managed system group.
The monitoring server provides three managed system groups. These lists can beapplied at the Enterprise level of the Navigator Physical view and anywhere in acustom Navigator view:
*ALL_CMS applies to the hub monitoring server and any remote monitoringservers.*EIB applies to the hub monitoring server.*HUB applies to the hub monitoring server.
Creating a managed system groupOrganize managed systems into named groups that can be assigned to thedistribution of situations, policies, historical collections, queries, and dynamicNavigator items in custom Navigator views.
About this task
Take these steps to create a managed system group:
Chapter 13. Managing the environment 375
Procedure1. Click Object group editor.2. If Managed system is collapsed, expand it.3. Click one of the available managed system types, then click Create new
group. One of the managed system types is All Managed Systems. Select itif you want to combine multiple agent types (such as Windows OS and Oracle)in one managed system group.
4. Type a descriptive name for the managed system group and click OK. The newmanaged system group is displayed in the managed system folder.
5. Select a managed system from the Available Managed Systems list andmove it to the Assigned list. You can select multiple managed systems by
holding down Ctrl while clicking each managed system. You can also, afterselecting a managed system, use Shift+click to select all managed systemsbetween this and the first selection.
6. Save your changes and either keep the editor open with Apply or exit withOK. The managed system group is now available to all users who are signedon to the portal server that connects to this hub monitoring server.
Note: Be sure that the managed systems added to the managed system groupare at a supported version level. Otherwise, it is possible that after youdistribute a situation to the managed system group and then attempt to start
the situation, its status will show as Problem in the situation event consoleand message log views.
What to do next
You can now assign the managed system group to any object that has managedsystem assignments. Each of these locations has a Edit Managed System Groupsbutton for convenient access to the Object group editor for managed systemgroups:v Distribution tab of the History Collection Configuration editorv Distribution tab of the Situation editorv Monitored resources tab of the Navigator item propertiesv Change Policy Distribution dialog box, which opens after you select the
Distributed check box for a policy in the Workflows editorv Query Results Source tab of the Query Editor
Copying a managed system groupYou can create a copy of a managed system group as needed.
About this task
Use the following steps to create a copy of a managed system list:
Procedure1. Click Object group editor.2. Click to expand a managed system folder.3. Select the managed system group you want to copy.4. Click Create another group.5. Type a descriptive name for the managed system group and click OK. The new
managed system group is displayed in the managed system folder.
376 IBM Tivoli Monitoring: Tivoli Enterprise Portal User's Guide
6. Remove a managed system from the Assigned list by selecting it and clicking. Add a managed system to the list by selecting it in the Available Managed
Systems list and clicking . You can select multiple managed systems byholding down Ctrl while clicking each managed system. You can also, afterselecting a managed system, use Shift+click to select all managed systemsbetween this and the first selection.
7. Save your changes and either keep the editor open with Apply or exit withOK. The managed system group is now available to users whose TivoliEnterprise Portal Server connects to the same hub monitoring server.
Editing a managed system groupYou can edit a managed system group to better suit your environment.
About this task
Use the following steps to edit a managed system list. Be aware that anysituations, policies, queries, or custom Navigator views this managed system groupis assigned to might be affected by changes you make to the list.
Procedure1. Click Object group editor.2. Click to expand a managed system folder.3. Select the managed system group that you want to edit.4. To remove a managed system from the Assigned list, select it and move it
back to the Available list. To assign a managed system, select it in the AvailableManaged Systems list and move it to the Assigned list. You can selectmultiple managed systems by holding down Ctrl while clicking each managedsystem. You can also, after selecting a managed system, use Shift+click to selectall managed systems between this and the first selection.
5. Save your changes and either keep the editor open with Apply or exit withOK.
Deleting a managed system groupYou can delete a managed system group if it is no longer needed.
About this task
Be aware that if you delete a managed system group that is assigned to a situation,policy, query, or custom Navigator view, the assignment will no longer be valid.
To delete a managed system group:
Procedure1. Click Object group editor.2. Click to expand a managed system folder.3. Select the managed system group you want to delete and click Remove
selected group. You can also right-click the managed system group and clickRemove selected group.
4. When a message asks if you are sure, click Yes; or click No if you are not sureof the effect this will have on your monitoring configuration.
5. Select another managed system type or list to work with or click Cancel toclose the editor.
Chapter 13. Managing the environment 377
Creating a historical configuration groupOrganize the historical collections that you have defined into named groups thatcan be managed collectively.
Before you begin
Historical configuration groups are made up of historical data collections that weredefined in the History Collection Configuration window. Create the historicalcollections that you intend to include in the historical group before opening theObject Group editor.
This feature is available when the Tivoli Enterprise Portal Server and TivoliEnterprise Monitoring Server are at Version 6.2.2 or later and the historical datacollection that you want to add to the group is configured for Managed System(Agent) as the distribution method.
About this task
Take these steps to create a historical configuration group:
Procedure1. Open the Object group editor from either of these locations:
v Click Object group editor, then click Historical configurations.v If the History Collection Configuration window, is not open, click History
Configuration. Click a monitored application, click an undistributed ordistributed historical collection definition, then click Group.
2. Click Create a new object group.3. Type a name for the historical group and, optionally, a description, then click
OK. The new historical configuration group is displayed in the Historicalconfigurations branch.
4. In the Members tab, select a historical collection from the list of AvailableMembers and move it to the Assigned Members list. You can selectmultiple collection definitions for an attribute group by holding down Ctrlwhile clicking; or use Shift+click to select all entries between this and the firstselection. Historical collections that are configured for “Managing System(TEMS)” distribution are not displayed in the list.
5. If you have historical configuration groups available and want to assign agroup to this one, click the Member of tab, then select a group and move itto the Assigned Members Of list.
6. In the Distributions tab, select the managed systems and managed systemgroups to assign to the historical configuration group. Select a managed systemgroup to see its constituent objects in the Selected Assigned Object Membersor Selected Available Object Members list.
7. Save your changes and either keep the editor open with Apply or exit withOK.
Results
The historical configuration group is now available to all users who log onto thesame portal server. Historical data samples are collected to the short-term historyfiles for the managed systems in the distribution.
378 IBM Tivoli Monitoring: Tivoli Enterprise Portal User's Guide
When you next view the historical data collection in the History CollectionConfiguration window, the Distribution tab shows the historical configurationgroup in the Start collection on list. The group name is disabled (dimmed); youcannot remove it from the distribution. To do that, you would return to the Objectgroup editor and remove the historical collection from the historical group.Related tasks:Creating a managed system group
Creating a situation groupOrganize situations that you have defined into named groups that can be managedcollectively. The situation group can include a distribution of managed systems.
Before you begin
Your use ID must have Modify permission for Situations to use this function.
About this task
You can start from the Situation editor or from the Object group editor. Take thesesteps to create a situation group:
Procedure1. Create a situation group from either the Situation editor or Object Group editor:
v Start from the Situation editor:a. Open or create a situation that you want to add to the new situation
group.b. While the situation is open in the Situation editor, click Group, then
Create a new object group.c. Enter a name for the new situation group and, optionally, a description.
The name can be up to 128 characters.
After you click OK, the Object group editor opens the new situation groupwith the situation listed in Assigned Members.
v Start from the Object group editor:a. Click Object group editor.b. Click Situation, then Create a new object group.c. Enter a name for the new situation group and, optionally, a description.
The name can be up to 128 characters.
The new situation group is displayed in the Situation branch of the tree.2. In the Members tab, select a situation from Available Members and move
it to the Assigned Members list. You can select multiple situations by holdingdown Ctrl while clicking; or use Shift+click to select all entries between thisand the first selection.
3. If you have situation groups available and want to assign a group to this one,select a group and move it to the Assigned Members list. You can alsoassign situation groups from the Member of tab.
4. In the Distributions tab, select the managed systems and managed systemgroups to assign and move them to Assigned managed systems. You canselect a managed system group to see its constituent objects in the SelectedAssigned Object Members or Selected Available Object Members list.
5. Save your changes and either keep the editor open with Apply or exit withOK.
Chapter 13. Managing the environment 379
Results
The situations that belong to this group are distributed to the managed systemsthat were assigned.
What to do next
When you view the distribution of a member situation in the Situation editor, anymanaged systems that were assigned to the group distribution will be disabled(dimmed). You can right-click a disabled item in the Assigned list and click ShowGroups to see the situation groups that the managed system or managed systemgroup is a member of.
Whenever you create a situation that you want to add to the situation group, clickGroup, then Update an existing object group to add it.
Managed system statusThe Tivoli Enterprise Portal dynamically builds the Navigator Physical view toshow all the managed systems connected to the hub monitoring server and anyremote monitoring servers, and their availability. Workspaces and situations at theEnterprise level keep you apprised of managed system status.
You can always see the availability of an agent in the Navigator. Offlinemonitoring agents are dimmed, such as the Universal Database shown here:
EnterpriseWindows Systems
MyComputerUniversal Database
Windows
You can also see the status of managed systems in the Managed System Statusworkspace, or in a Managed System Status table view added to any workspace.
Managed System Status workspaceThe Managed System Status workspace is one of the predefined workspaces forthe Enterprise Navigator item, and offers a high level overview of your managednetwork. The workspace has a single view: Managed System Status table view.
Accessing the workspace
To open the Managed System Status workspace, take the following steps:1. Click the Enterprise Navigator item to open its default workspace.2. Click Workspace gallery, then click the thumbnail graphic for Managed
System Status.
What the workspace shows
The Managed System Status table view is a list of monitoring agents in yourmanaged network. The Status column reports the ONLINE or OFFLINE status ofthe agent, with offline agents shown first.
380 IBM Tivoli Monitoring: Tivoli Enterprise Portal User's Guide
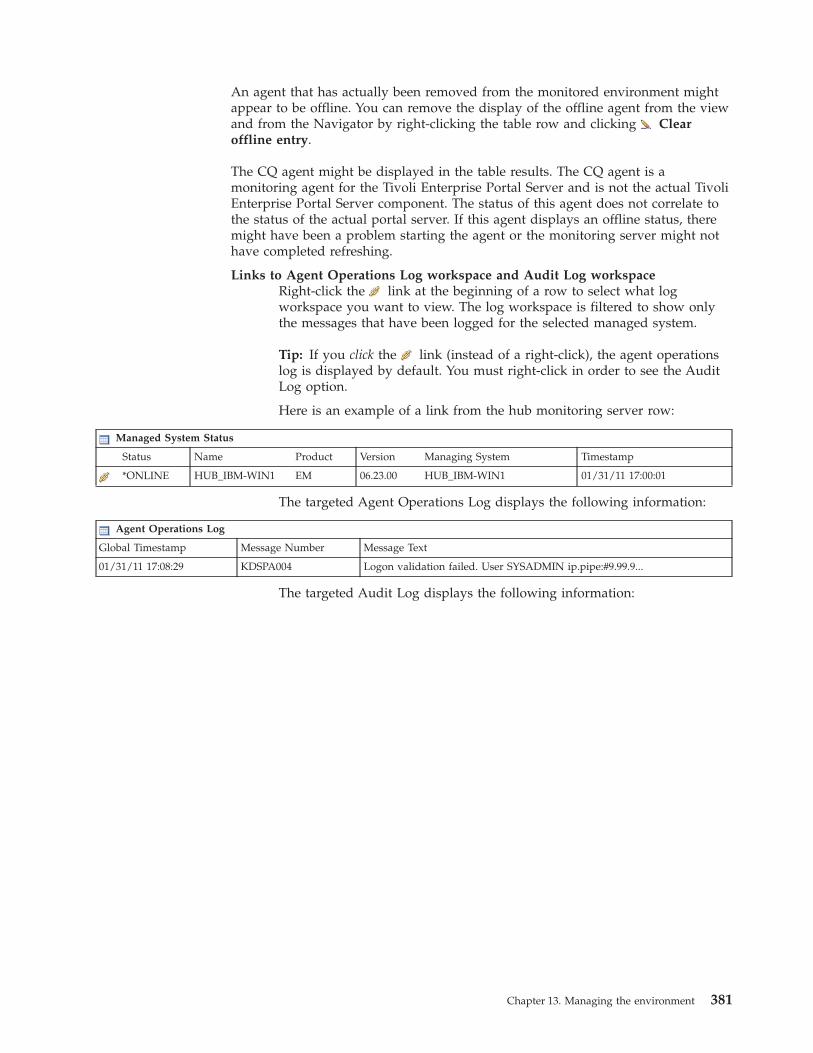
An agent that has actually been removed from the monitored environment mightappear to be offline. You can remove the display of the offline agent from the viewand from the Navigator by right-clicking the table row and clicking Clearoffline entry.
The CQ agent might be displayed in the table results. The CQ agent is amonitoring agent for the Tivoli Enterprise Portal Server and is not the actual TivoliEnterprise Portal Server component. The status of this agent does not correlate tothe status of the actual portal server. If this agent displays an offline status, theremight have been a problem starting the agent or the monitoring server might nothave completed refreshing.
Links to Agent Operations Log workspace and Audit Log workspaceRight-click the link at the beginning of a row to select what logworkspace you want to view. The log workspace is filtered to show onlythe messages that have been logged for the selected managed system.
Tip: If you click the link (instead of a right-click), the agent operationslog is displayed by default. You must right-click in order to see the AuditLog option.
Here is an example of a link from the hub monitoring server row:
Managed System Status
Status Name Product Version Managing System Timestamp
*ONLINE HUB_IBM-WIN1 EM 06.23.00 HUB_IBM-WIN1 01/31/11 17:00:01
The targeted Agent Operations Log displays the following information:
Agent Operations Log
Global Timestamp Message Number Message Text
01/31/11 17:08:29 KDSPA004 Logon validation failed. User SYSADMIN ip.pipe:#9.99.9...
The targeted Audit Log displays the following information:
Chapter 13. Managing the environment 381
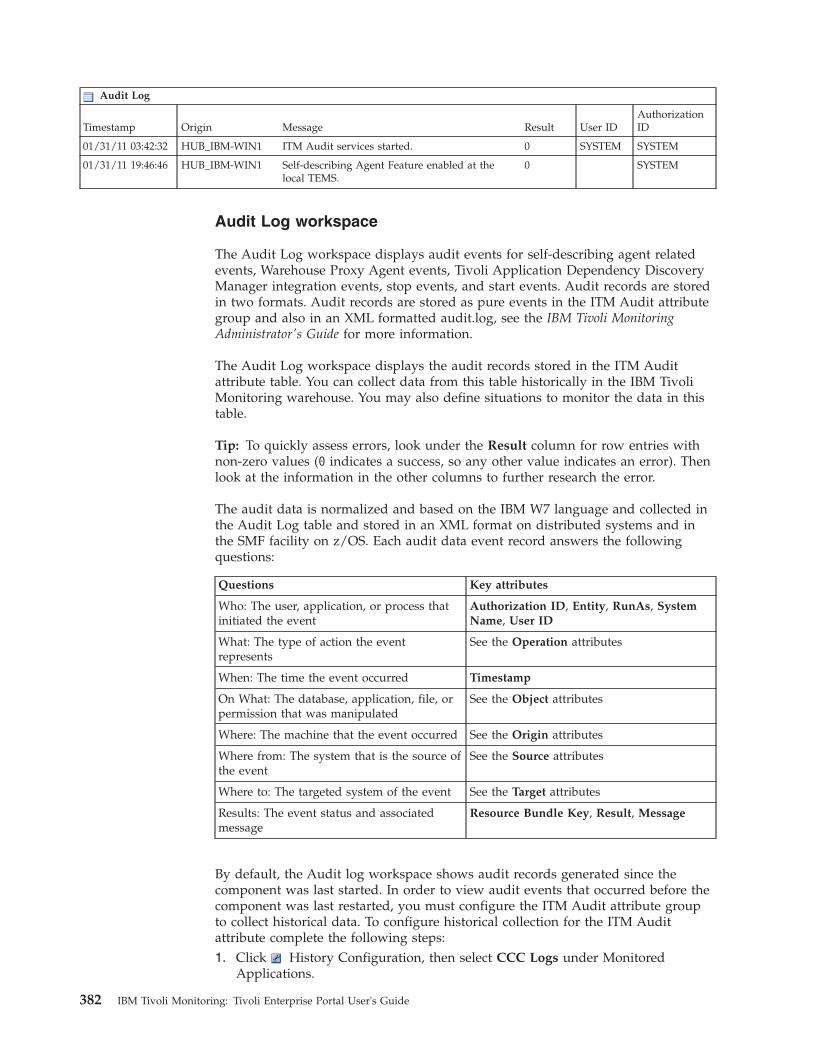
Audit Log
Timestamp Origin Message Result User IDAuthorizationID
01/31/11 03:42:32 HUB_IBM-WIN1 ITM Audit services started. 0 SYSTEM SYSTEM
01/31/11 19:46:46 HUB_IBM-WIN1 Self-describing Agent Feature enabled at thelocal TEMS.
0 SYSTEM
Audit Log workspace
The Audit Log workspace displays audit events for self-describing agent relatedevents, Warehouse Proxy Agent events, Tivoli Application Dependency DiscoveryManager integration events, stop events, and start events. Audit records are storedin two formats. Audit records are stored as pure events in the ITM Audit attributegroup and also in an XML formatted audit.log, see the IBM Tivoli MonitoringAdministrator's Guide for more information.
The Audit Log workspace displays the audit records stored in the ITM Auditattribute table. You can collect data from this table historically in the IBM TivoliMonitoring warehouse. You may also define situations to monitor the data in thistable.
Tip: To quickly assess errors, look under the Result column for row entries withnon-zero values (0 indicates a success, so any other value indicates an error). Thenlook at the information in the other columns to further research the error.
The audit data is normalized and based on the IBM W7 language and collected inthe Audit Log table and stored in an XML format on distributed systems and inthe SMF facility on z/OS. Each audit data event record answers the followingquestions:
Questions Key attributes
Who: The user, application, or process thatinitiated the event
Authorization ID, Entity, RunAs, SystemName, User ID
What: The type of action the eventrepresents
See the Operation attributes
When: The time the event occurred Timestamp
On What: The database, application, file, orpermission that was manipulated
See the Object attributes
Where: The machine that the event occurred See the Origin attributes
Where from: The system that is the source ofthe event
See the Source attributes
Where to: The targeted system of the event See the Target attributes
Results: The event status and associatedmessage
Resource Bundle Key, Result, Message
By default, the Audit log workspace shows audit records generated since thecomponent was last started. In order to view audit events that occurred before thecomponent was last restarted, you must configure the ITM Audit attribute groupto collect historical data. To configure historical collection for the ITM Auditattribute complete the following steps:1. Click History Configuration, then select CCC Logs under Monitored
Applications.
382 IBM Tivoli Monitoring: Tivoli Enterprise Portal User's Guide
2. Configure how long to keep Detailed data for the ITM Audit attribute groupavailable locally.a. In the Select Attribute Group section, select ITM Audit.b. In the Configuration Controls section under Pruning select Detailed data
and specify how long to keep the data.c. Click Apply.
3. Create a History Collection setting for the ITM Audit attribute group.a. Right-click CCC Logs under Monitored Applications and select Create
new collection settings.b. Supply a Name, Description and select the ITM Audit Attribute group.c. If you plan to historically collect monitoring server Audit records, on the
Basic tab you must specify Collection Location: TEMS.d. On the Distribution tab, Distribute to Managed System (Agent) and then
select the Managed System Group or systems to start collection on.e. Click OK.
Adding a Managed System Status view to a workspaceYou can add a Managed System Status view to a workspace.
About this task
Use the following steps to create this table:
Procedure1. Open the workspace where you want the view.2. If you want the view to occupy a new space, click Split Vertically or
Split Horizontally in one of the views.3. Click Table.4. Click inside the view where you want the table.5. In the table view title bar click Properties.6. In the Query tab, click Click here to assign a query. The Query editor
shows a tree on the left with queries organized by product and then byattribute group:
QueriesTivoli Enterprise Monitoring Server
Managed SystemCurrent Managed Systems Status
7. Under the Managed System node, Select Current Managed Systems Statusquery and click OK.
8. If you want *OFFLINE values to be highlighted, click the Thresholds tab,click inside a Status cell and select *OFFLINE from the list. Change thethreshold color if you like.
9. If you want to add a title, click the Style tab and type new title text.10. Click OK to close the Properties editor and save the table view.
Chapter 13. Managing the environment 383
EIB Change Log workspaceThe Enterprise Information Base (EIB) is a database used by the Tivoli EnterpriseMonitoring Server to store situation, policy, user definitions and configurationinformation. The EIB Change Log view is a log with details of changes made toinformation in the database.
Accessing the workspace
This workspace is a secondary workspace associated with the EnterpriseNavigator item.
Do the following to open the EIB Change Log workspace.1. Click the Enterprise Navigator item to open its default workspace.2. Click Workspace gallery, then click the thumbnail graphic for the EIB
Change Log workspace. If the list is long, you might need to scroll to locate theworkspace.
What the workspace shows
The EIB Change Log workspace consists of one table view (in addition to theNavigator view): EIB Change Log. The values in the log are the results of a querydesigned using the EIB change log attributes. The log shows, for example, the dataand time at which a change was made, the ID of the user who made the lastchange, the name of the object (situation, policy, or other entity) that was changed,and the type of operation that took place.
Self-Monitoring Topology workspaceThe Self-Monitoring Topology workspace provides a high level overview of yourmanaged infrastructure and its health and introduces you to the Tivoli EnterprisePortal self-monitoring capabilities.
Accessing the workspace
The Self-Monitoring Topology workspace is a secondary workspace associated withthe Enterprise Navigator item.
Do the following to open this workspace.1. Click the Enterprise Navigator item to open its default workspace.2. Click Workspace gallery, then click the thumbnail graphic for
Self-Monitoring Topology. If the list is long, you might need to scroll to locatethe workspace.
What the workspace shows
The workspace contains three views:
TMS Infrastructure - Base
TMS Infrastructure - Base is a topological display of the TivoliManagement Services (TMS) components and their availability status. TheTivoli Enterprise Portal Server connects to the hub Tivoli EnterpriseMonitoring Server, as does the Tivoli Data Warehouse, the Summarizationand Pruning agent, and any remote monitoring servers. See TMSInfrastructure view for a description of the view features and tools formanipulating the topology.
384 IBM Tivoli Monitoring: Tivoli Enterprise Portal User's Guide
Users Logged on to TEPS
Users Logged on to TEPS is a table view of the users logged on to theportal server, with the IP address of the client computer and logon timestamp.
Managed Systems count per Managing System
This view is a bar chart showing a count of managed systems grouped bymanaging system. Also called through node, this is the parent system thatcollects data from the agent or subagent. If the agent is directly connectedto the hub Tivoli Enterprise Monitoring Server, the hub monitoring serveris the managing system; if the agent is connected to a remote monitoringserver, then that is the managing system. An agent with subagents is themanaging system for each subagent.
Tivoli Enterprise Monitoring Server statusFor self-monitoring, the Tivoli Enterprise Monitoring Server has attributes that areon display in workspaces and used in situations that are available through theEnterprise Navigator item.
Manage Tivoli Enterprise Monitoring Servers workspacesUse the Manage Tivoli Enterprise Monitoring Servers workspaces and situations togather information for diagnosing and correcting typical monitoring serverconfiguration issues.
The Manage Tivoli Enterprise Monitoring Servers workspace is available with theother workspaces from the Enterprise Navigator item. Open the workspace as aquick health check whenever you have updated any components. While an
Enterprise-level workspace is open, click Workspace Gallery, then scroll toand click the Manage Tivoli Enterprise Monitoring Servers workspace.
The Tivoli Enterprise Monitoring Server Topology view shows the hubmonitoring server and all remote monitoring servers that connect to it in theenterprise, with a status indicator overlaying the monitoring server icon. Movethe mouse pointer over the icon to see an information box with identifying data forthe monitoring server, such as the host address and the status. Right-click amonitoring server icon to see and select a workspace to open with moreinformation about that monitoring server.
The Monitoring Servers view lists each Tivoli Enterprise Monitoring Server andwhether it is online or offline. The hub is distinguished by an icon after thename. This view persists in all the Manage Tivoli Enterprise Monitoring Serversworkspaces and in the same position.
Click a link to open one of the detailed workspaces with data from themonitoring server:
Manage Tivoli Enterprise Monitoring Servers - Enterprise CatalogsThis workspace is displayed after you select the Installed Catalogs -Enterprise View link from the hub monitoring server. The link to thisworkspace is available only for a hub monitoring server.
The application catalogs that are installed on every remote monitoringserver in the enterprise are compared with those on the hub monitoringserver and any discrepancies are highlighted in the Status column. Thetimestamp was taken when the configuration file was last edited.
Chapter 13. Managing the environment 385
OK indicates that the timestamps and column counts of the hub andremote monitoring servers match.
Timestamp Mismatch indicates that the time the remote monitoringserver was last updated does not match the time the hub was lastupdated.
Hub Newer indicates that the hub monitoring server was updatedmore recently than a remote monitoring server.
Missing At RTEMS indicates that the catalog ID that is present atthe hub monitoring server is missing at a remote monitoring server.
Count Mismatch indicates that the column count at the remotemonitoring server does not match the column count at the hubmonitoring server.
RTEMS Newer indicates that a remote monitoring server wasupdated more recently than the hub monitoring server.
Missing At Hub indicates that the catalog ID that is present on aremote monitoring server is missing at the hub monitoring server.
Typically, the hub and remote monitoring servers have similar or anidentical set of catalogs. If any of the following catalogs are missing at thehub, it is most likely not a problem (especially if this is a distributed hub):PDSSTATS, OMSMS, KSD, and MV.
Manage Tivoli Enterprise Monitoring Servers - Installed CatalogsThis workspace is displayed after you select the Installed Catalogs linkfrom a remote monitoring server. The Remote Server shows a comparisonof the application catalogs that are installed on the selected Remote TivoliEnterprise Monitoring Server with those on the hub monitoring server.Here you can get a report of catalog out-of-sync conditions. The “Status”column has the same values as those shown in the Manage TivoliEnterprise Monitoring Servers - Enterprise Catalogs workspace.
The link to this workspace is available to all remote monitoring servers,but not the hub.
Manage Tivoli Enterprise Monitoring Servers - ProtocolsThis workspace is displayed after you select the Protocols link. Theworkspace shows the Local and Global Communications Protocol (locationbroker) entries for the monitoring server. These are the definitions thatwere created during installation for connection between components, suchas the protocol, IP address, and port number. The global communicationsprotocol entries are available only for the hub monitoring server. Thisworkspace is available only for monitoring servers that are at Version 6.2.2or later.
Manage Tivoli Enterprise Monitoring Servers - Situation StatusThis workspace is displayed after you select the Situation Status link. Theworkspace reports the situations that are started on the monitoring serverand has summarized and detailed views of the situations that count thenumber of times the status type has persisted on the monitoring server.
Manage Tivoli Enterprise Monitoring Servers - System InformationThis workspace is displayed after you select the System Information link.The workspace supplies detailed information about the monitoring serverprocess and system configuration. It is available for monitoring serversfrom Version 6.2.2 onward. The Server Configuration view shows theparameters that have been configured for the monitoring server.
386 IBM Tivoli Monitoring: Tivoli Enterprise Portal User's Guide
These subordinate workspaces are available only through their parent ManageTivoli Enterprise Monitoring Servers workspace. (The exception is when you are inworkspace administration mode, although no data is returned if you access theworkspaces directly.)
Manage Tivoli Enterprise Monitoring Server situationsThe Manage Tivoli Enterprise Monitoring Server predefined situations are used tomonitor the status of the monitoring server catalogs.
These situations monitor the status of the Tivoli Enterprise Monitoring Servercatalogs:
Hub_Catalog_CriticalThis situation becomes true and an event is opened when an applicationcatalog that is installed at a remote monitoring server is not installed at thehub monitoring server. This can happen when application support has notbeen selected for the hub during installation. Default: Do not Run atstartup. Show Formula:( Status == Missing At Hub) AND (Catalog != ’PDSSTATS’)
Hub_Catalog_WarningThis situation becomes true and an event is opened when an applicationcatalog that is installed at a remote monitoring server is newer than whatis installed at the hub monitoring server. This is a warning that theapplication support for the component is out of date. This might not be aproblem if the hub has not been upgraded yet. Default: Do not Run atstartup. Show Formula:( Status == RTEMS Newer)
Remote_Catalog_WarningThis situation becomes true and an event is opened when an applicationcatalog that is installed at the hub monitoring server is not also installed ata remote monitoring server; or an application catalog that is installed at thehub is newer than what is installed at a remote monitoring server.
This might not be a problem if the remote monitoring server has not beenupgraded yet. Also, the remote system might be intentionally notsupporting the subject application, or might only be supporting an olderversion of the application. Default: Do not Run at startup. ShowFormula:((Status == Missing At Hub) AND (Catalog != ’PDSSTATS’)) OR(Status == Hub_Newer)
Managing monitoring agentsWith the Tivoli Enterprise Portal you can deploy and maintain distributed TivoliEnterprise Monitoring Agents, such as the Sybase Server monitoring agent, andconnect to a distributed Hub Tivoli Enterprise Monitoring Server.
Before you can remotely install and configure distributed monitoring agents on acomputer, the computer must have an OS enterprise monitoring agent installed forthe operating system the monitoring product will run under. When the OS agentshave been installed, the Navigator Physical view adds an item for each onlinemanaged system. Monitoring agents that do not support the remote agentdeployment feature will not display the Add Managed System, Configure, andRemove options in the Navigator pop-up menu. The types of managed systemsthat you can add to a computer depend on what agent bundles are in the depot on
Chapter 13. Managing the environment 387
the monitoring server to which the OS agent is connected. See the IBM TivoliMonitoring Installation and Setup Guide for more information.
Agent deployment workspacesUse the agent deployment workspaces to see your package list, the results of adeployment prerequisite check, and the progress of the agent deployment process.
Deploy Depot Package List workspaceUse the Deploy Depot Package List workspace to see the installation packages thatare available in the agent depot at the Tivoli Enterprise Monitoring Server.
This is one of the predefined workspaces available from the Enterprise Navigatoritem.
Accessing the workspace1. Click the Enterprise item in the Navigator Physical view.2. Click Workspace gallery.3. Scroll to Deploy Depot Package List, then click the thumbnail graphic to open
the workspace.
What the workspace shows
The Deploy Depot Package List workspace shows a table listing all of the agentinstallation packages available in the agent depot for remote deployment. For eachpackage, the table includes the product ID, version, host type, and other detailsabout the package.
For more information about the agent depot, see theDeploying monitoring agentsacross your environment topics in the IBM Tivoli Monitoring Installation and SetupGuide (http://publib.boulder.ibm.com/infocenter/tivihelp/v15r1/topic/com.ibm.itm.doc_6.2.3fp1/itm623FP1_install.htm).Related reference:“Deployment Status Summary by Transaction workspace” on page 390
Deployment Status Summary workspaceUse the Deployment Status Summary workspace to get ongoing status detail aboutpending and completed asynchronous remote agent deployments. The charts andtables have visual indicators for quick assessment of the success rate and anyproblems that arise.
Accessing the workspace1. Click the Enterprise item in the Navigator Physical view.2. Click Workspace gallery.3. Scroll to Deployment Status Summary, then click the thumbnail graphic to
open the workspace.
What the workspace shows
Deployment Status SummaryDeployment Status Summary is a table view showing total counts of thepending asynchronous agent deployments. For each target managedsystem, the table shows the number of deployments in each status(succeeded, failed, retrying, queued, and in progress).
388 IBM Tivoli Monitoring: Tivoli Enterprise Portal User's Guide
Status Summary of Complete DeploymentsStatus Summary of Complete Deployments is a stacked bar chart showingthe asynchronous agent deployments that have finished processing. Foreach target managed system, the chart shows how many deploymentssucceeded and how many failed.
Status Summary of Incomplete DeploymentsStatus Summary of Incomplete Deployments is a stacked bar chartshowing the asynchronous agent deployments that have not yet finishedprocessing. For each target managed system, the chart shows thedeployments that are queued, in progress, or retrying.
Deployment Status DetailDeployment Status Detail is a table view showing detailed informationabout all asynchronous agent deployments. The table shows the status,product ID, target managed system, and other details about eachdeployment request. Click on a row to link to a more detailedworkspace for the selected deploy group or product. See “DeploymentStatus by Deploy Group workspace” on page 391 and “Deployment Statusby Product workspace” on page 392 for details.
Tip: The timestamps for a transaction are generated by the monitoringserver that is processing the deployment. The hub monitoring serverinserts the transaction first. You might have a start time that is earlier thanthe latest timestamp because the remote monitoring server is behind thehub monitoring server. To avoid this confusion, you might want to syncthe time on the hub monitoring server and remote monitoring server.
Deployment notes
Asynchronous remote agent deploymentAgents can be remotely deployed asynchronously as well assynchronously. With asynchronous deployment, you can request that asecond remote agent be deployed, even if the previously deployed agenthas not initialized fully. You can also group agents for bulk remotedeployment.
See theDeploying monitoring agents across your environment topics in theIBM Tivoli Monitoring Installation and Setup Guide (http://publib.boulder.ibm.com/infocenter/tivihelp/v15r1/topic/com.ibm.itm.doc_6.2.3fp1/itm623FP1_install.htm) for details.
CLI commands for agent deploymentThe tacmd getdeploystatus command reports the deployment status fromthe command line.
The tacmd clearDeployStatus command can be used to clear all or afiltered list of entries in the status table.
The tacmd checkprereq command checks for prerequisites on the targetsystem before you begin deploying a monitoring agent there. You canreview the results in the Deployment Status Summary workspace or withthe tacmd getDeployStatus command.
The tacmd restartFailedDeploy command restarts failed deployments. Youcan restart all the failed entries in the status table or filter the table entries
Chapter 13. Managing the environment 389
The IBM Tivoli Monitoring Command Reference (http://publib.boulder.ibm.com/infocenter/tivihelp/v15r1/topic/com.ibm.itm.doc_6.2.3fp1/itm623fp1_cmdref.htm) describes thesecommands and their syntax.
Deployment Status Summary by Transaction workspaceThe Deployment Status Summary by Transaction workspace shows summarystatus information about pending and completed asynchronous remote agentdeployments, sorted by transaction. This is one of the predefined workspacesavailable from the Enterprise Navigator item.
Accessing the workspace1. Click the Enterprise item in the Navigator Physical view.2. Click Workspace gallery.3. Scroll to Deployment Status Summary by Transaction, then click the
thumbnail graphic to open the workspace.
What the workspace shows
The workspace contains four views:
Deployment Status Summary by TransactionDeployment Status Summary by Transaction is a table view showing totalcounts of the pending asynchronous agent deployment transactions. Foreach target managed system, the table shows the number of deploymenttransactions in each status (succeeded, failed, retrying, queued, and inprogress).
Status Summary of Complete Deployments by TransactionStatus Summary of Complete Deployments by Transaction is a stacked barchart showing the asynchronous agent deployment transactions that havefinished processing. For each target managed system, the chart shows howmany succeeded and how many failed.
Status Summary of Incomplete Deployments by TransactionStatus Summary of Incomplete Deployments by Transaction is a stackedbar chart showing the asynchronous agent deployment transactions thathave not yet finished processing. For each target managed system, thechart shows the transactions that are queued, in progress, or retrying.
Deployment Status DetailDeployment Status Detail is a table view showing detailed informationabout all asynchronous agent deployments. The table shows the status,product ID, target managed system, and other details about eachdeployment request. Click on a row to link to a more detailedworkspace for the selected deploy group or product. See “DeploymentStatus by Deploy Group workspace” on page 391 and “Deployment Statusby Product workspace” on page 392 for details.
Tip: The timestamps for a transaction are generated by the monitoringserver that is processing the deployment. The hub monitoring serverinserts the transaction first. You might have a start time that is earlier thanthe latest timestamp because the remote monitoring server is behind thehub monitoring server. To avoid this confusion, you might want to syncthe time on the hub monitoring server and remote monitoring server.
390 IBM Tivoli Monitoring: Tivoli Enterprise Portal User's Guide
Deployment notes
Asynchronous remote agent deploymentAgents can be remotely deployed asynchronously as well assynchronously. With asynchronous deployment, you can request that asecond remote agent be deployed, even if the previously deployed agenthas not initialized fully. You can also group agents for bulk remotedeployment.
See theDeploying monitoring agents across your environment topics in theIBM Tivoli Monitoring Installation and Setup Guide (http://publib.boulder.ibm.com/infocenter/tivihelp/v15r1/topic/com.ibm.itm.doc_6.2.3fp1/itm623FP1_install.htm) for details.
CLI commands for agent deploymentThe tacmd getdeploystatus command reports the deployment status fromthe command line.
The tacmd clearDeployStatus command can be used to clear all or afiltered list of entries in the status table.
The tacmd checkprereq command checks for prerequisites on the targetsystem before you begin deploying a monitoring agent there. You canreview the results in the Deployment Status Summary workspace or withthe tacmd getDeployStatus command.
The tacmd restartFailedDeploy command restarts failed deployments. Youcan restart all the failed entries in the status table or filter the table entries
The IBM Tivoli Monitoring Command Reference (http://publib.boulder.ibm.com/infocenter/tivihelp/v15r1/topic/com.ibm.itm.doc_6.2.3fp1/itm623fp1_cmdref.htm) describes thesecommands and their syntax.
Related reference:“Deploy Depot Package List workspace” on page 388
Deployment Status by Deploy Group workspaceThe Deployment Status by Deploy Group workspace shows status informationabout asynchronous remote agent deployments for a particular deploy group.
This workspace is accessed from the Deployment Status Summary workspaces.
Accessing the workspace1. Open the Deployment Status Summary workspace or Deployment Status
Summary by Transaction workspace from the Enterprise Navigator item.2. In the Deployment Status Detail table, click the link in the row of the deploy
group for which you want detailed status.3. Click Deployment Status by Deploy Group to open the workspace.
What the workspace shows
The workspace contains four views:
Deployment Status Summary by Deploy Group
Deployment Status Summary is a table view showing total counts of thepending asynchronous agent deployments for the selected deploy group.
Chapter 13. Managing the environment 391
For each target managed system, the table shows the number ofdeployments in each status (succeeded, failed, retrying, queued, and inprogress).
Status Summary of Complete DeploymentsStatus Summary of Complete Deployments is a stacked bar chart showingthe asynchronous agent deployments for the selected deploy group thathave finished processing. For each target managed system, the chart showshow many deployments succeeded and how many failed.
Status Summary of Incomplete DeploymentsStatus Summary of Incomplete Deployments is a stacked bar chartshowing the asynchronous agent deployments for the selected deploygroup that have not yet finished processing. For each target managedsystem, the chart shows the deployments that are queued, in progress, orretrying.
Deployment Status Detail by Deploy GroupDeployment Status Detail is a table view showing detailed informationabout all asynchronous agent deployments for the selected deploy group.The table shows the status, product ID, target managed system, and otherdetails about each deployment request.
Deployment Status by Product workspaceThe Deployment Status by Product workspace shows status information aboutasynchronous remote agent deployments for a particular product ID.
This workspace is accessed from the Deployment Status Summary workspaces.
Accessing the workspace1. Open the Deployment Status Summary workspace or Deployment Status
Summary by Transaction workspace from the Enterprise Navigator item.2. In the Deployment Status Detail table, click the link in the row for which you
want detailed status by product.3. Click Deployment Status by Product to open the workspace.
What the workspace shows
The workspace contains four views:
Deployment Status Summary by Product
Deployment Status Summary is a table view showing total counts of thepending asynchronous agent deployments for the selected product ID. Foreach target managed system, the table shows the number of deploymentsin each status (succeeded, failed, retrying, queued, and in progress).
Status Summary of Complete DeploymentsStatus Summary of Complete Deployments is a stacked bar chart showingthe asynchronous agent deployments for the selected product ID that havefinished processing. For each target managed system, the chart shows howmany deployments succeeded and how many failed.
Status Summary of Incomplete DeploymentsStatus Summary of Incomplete Deployments is a stacked bar chartshowing the asynchronous agent deployments for the selected product IDthat have not yet finished processing. For each target managed system, thechart shows the deployments that are queued, in progress, or retrying.
392 IBM Tivoli Monitoring: Tivoli Enterprise Portal User's Guide
Deployment Status Detail by ProductDeployment Status Detail is a table view showing detailed informationabout all asynchronous agent deployments for the selected product ID. Thetable shows the status, target managed system, and other details abouteach deployment request.
Stopping a monitoring agentYou can stop running any of the distributed monitoring agents other than the OSagents, which are used for agent deployment and configuration.
About this task
To stop a monitoring agent:
Your user ID must have Agent Management Start/Stop permission to use thisfeature.
Procedure1. In the Navigator physical view, right-click the agent-level Navigator item.2. Click Stop. The agent goes offline and the Navigator item is dimmed. The
agent will not come online again until it has been restarted on the monitoringserver to which it is assigned.
Recycling a monitoring agentYou can recycle a monitoring agent.
About this task
To recycle a monitoring agent:
Your user ID must have Agent Management Start/Stop permission to use thisfeature.
Procedure1. In the Navigator physical view, right-click the agent-level Navigator item.2. Click Restart to stop, then start the monitoring agent.
Starting an offline monitoring agentAn offline monitoring agent can be started.
About this task
To start an offline monitoring agent:
Your user ID must have Agent Management Start/Stop permission to use thisfeature.
Procedure1. In the Navigator physical view, right-click the offline agent-level Navigator
item.
Chapter 13. Managing the environment 393
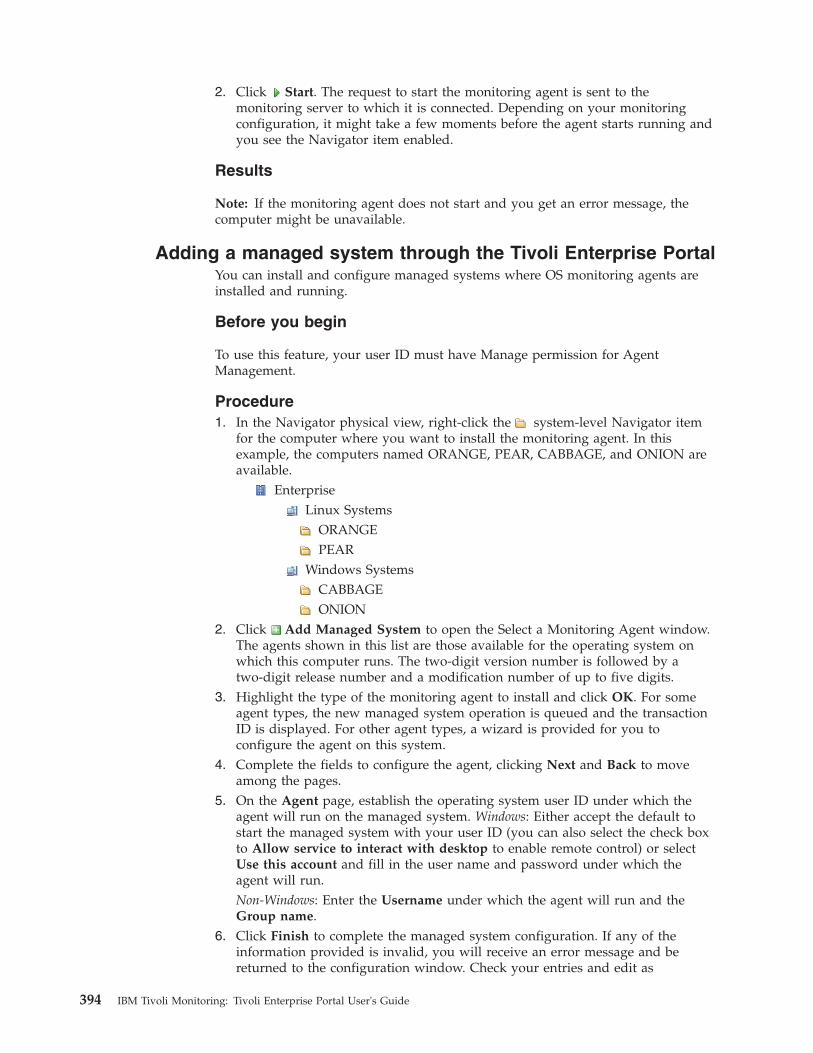
2. Click Start. The request to start the monitoring agent is sent to themonitoring server to which it is connected. Depending on your monitoringconfiguration, it might take a few moments before the agent starts running andyou see the Navigator item enabled.
Results
Note: If the monitoring agent does not start and you get an error message, thecomputer might be unavailable.
Adding a managed system through the Tivoli Enterprise PortalYou can install and configure managed systems where OS monitoring agents areinstalled and running.
Before you begin
To use this feature, your user ID must have Manage permission for AgentManagement.
Procedure1. In the Navigator physical view, right-click the system-level Navigator item
for the computer where you want to install the monitoring agent. In thisexample, the computers named ORANGE, PEAR, CABBAGE, and ONION areavailable.
EnterpriseLinux Systems
ORANGEPEAR
Windows SystemsCABBAGEONION
2. Click Add Managed System to open the Select a Monitoring Agent window.The agents shown in this list are those available for the operating system onwhich this computer runs. The two-digit version number is followed by atwo-digit release number and a modification number of up to five digits.
3. Highlight the type of the monitoring agent to install and click OK. For someagent types, the new managed system operation is queued and the transactionID is displayed. For other agent types, a wizard is provided for you toconfigure the agent on this system.
4. Complete the fields to configure the agent, clicking Next and Back to moveamong the pages.
5. On the Agent page, establish the operating system user ID under which theagent will run on the managed system. Windows: Either accept the default tostart the managed system with your user ID (you can also select the check boxto Allow service to interact with desktop to enable remote control) or selectUse this account and fill in the user name and password under which theagent will run.Non-Windows: Enter the Username under which the agent will run and theGroup name.
6. Click Finish to complete the managed system configuration. If any of theinformation provided is invalid, you will receive an error message and bereturned to the configuration window. Check your entries and edit as
394 IBM Tivoli Monitoring: Tivoli Enterprise Portal User's Guide
appropriate to configure correctly. Installation and setup begins and might takeseveral minutes to complete depending on your Tivoli monitoringconfiguration, the location of the managed system, and the type of monitoringagent.
7. After the managed system has been added to the enterprise, click ApplyPending Updates in the Navigator view toolbar. The new managed system(such as Universal Database) is displayed below the system Navigator item.
Configuring a managed systemAfter adding a managed system to your enterprise, you can open the ConfigureManaged System window whenever you want to adjust the configuration settings.
Before you begin
To use this feature, your user ID must have Manage permission for AgentManagement.
Procedure1. Right-click the Navigator item for the agent to configure or upgrade.2. Click Configure to open the Configure Managed System window.3. Edit the fields to configure the agent, clicking Next and Back to move among
the pages. Any pages besides Agent are specific to the agent type.v Warehouse Proxy: See the “Install and configure communications for the
Warehouse Proxy agent” topics under "Setting up data warehousing" in theIBM Tivoli Monitoring Installation and Setup Guide (http://publib.boulder.ibm.com/infocenter/tivihelp/v15r1/topic/com.ibm.itm.doc_6.2.3fp1/itm623FP1_install.htm).
v Summarization and Pruning Agent: See "Configuring the Summarization andPruning agent (JDBC connection)" in the IBM Tivoli Monitoring Installation andSetup Guide (http://publib.boulder.ibm.com/infocenter/tivihelp/v15r1/topic/com.ibm.itm.doc_6.2.3fp1/itm623FP1_install.htm).
v Performance Analyzer Warehouse Agent: See the IBM Tivoli MonitoringInstallation and Setup Guide (http://publib.boulder.ibm.com/infocenter/tivihelp/v15r1/topic/com.ibm.itm.doc_6.2.3fp1/itm623FP1_install.htm).
v Universal Agent: Specify the Metafile and Script files. These are described inthe New in this release.
v Non-base agents: See your product's installation guide in the IBM TivoliMonitoring information center or on IBM developerWorks® TivoliDocumentation Central.
4. On the Agent page, establish the user ID that will be used to maintain theagent:
Windows:Accept the default Use local system account to use your TivoliEnterprise Portal user ID. You can also select Allow service tointeract with desktop to enable remote control. Or select Use thisaccount and fill in the user name and password under which the agentwill be controlled.
Non-Windows:Enter the Username under which the agent will run and the Groupname.
Chapter 13. Managing the environment 395
5. Click Finish to complete the managed system configuration. If any of theinformation provided is invalid, you will receive an error message and bereturned to the configuration window. Check your entries and edit asappropriate to configure correctly.
Updating a monitoring agentWhen a new version of a distributed monitoring agent is released, you can applythe new version locally or remotely to one managed system at a time, or to manysimultaneously. Use the Configure Managed System window to apply the update.
Note: Agent updates are automatic and this procedure is not required if yourmonitoring agent is at Version 6.2.3 or higher unless the self-describing capabilityis disabled.
Before you begin
A patch is for a specific version of the agent. The prereq field of the depot entrycontains an agent of the same type as the agent itself. For example, if 6.1 UD (DB2monitoring) is the selected agent, the prereq field in the depot entry must contain adeployment bundle notation such as ud:061000000.
You cannot upgrade an agent to a new version with this procedure, but rather withthe tacmd upgradeAgent command, which is described in the IBM TivoliMonitoring Command Reference (http://publib.boulder.ibm.com/infocenter/tivihelp/v15r1/topic/com.ibm.itm.doc_6.2.3fp1/itm623fp1_cmdref.htm). Do not try tochange the configuration of a managed system at this time because your changeswill be lost when the installation of the updates begins.
To use this feature, your user ID must have Manage permission for AgentManagement.
About this task
Complete these steps to apply a patch for a monitoring agent:
Procedure1. Right-click the Navigator item for the agent that you want to upgrade.2. Click Configure to open the Configure Managed System window.3. Click the Agent tab.4. Compare the installed version of the monitoring agent with any available
product updates, then highlight the row of the agent to update and click InstallUpdates.
Results
Installation of the updates begins and might take several minutes to complete. Thelist that displays reflects the contents of the deployment depot. If Install Updatesis disabled, one or more of the following conditions exist:v The depot entry does not match the product type.v The VVRR fields for the agent and the depot entry are the same, where VV is the
version number and RR is the revision number. For example, an entry of 0610prevents you from applying a fix pack intended for a version 6.2 agent.
v The depot entry is at an older version than the agent.
396 IBM Tivoli Monitoring: Tivoli Enterprise Portal User's Guide
v The host version field of the depot entry does not contain the host platform forthe agent.
v The prereq field of the depot entry does not contain an agent of the same typeas the agent itself. For example, if 6.1 UD (DB2 monitoring) is the selected agent,the prereq field in the depot entry must contain a deployment bundle notationsuch as ud:061000000, which is one way to denote a patch deployment bundle.
Removing a managed system and monitoring agentUse Remove to stop a managed system and permanently remove it from theNavigator Physical view.
(You can add it back in at a later time using Add Managed System.)
Before you begin
To use this feature, your user ID must have Manage permission for AgentManagement.
About this task
After you have removed all managed systems, you can choose to completelyuninstall the monitoring agent. If you plan to reinstall the monitoring agent infuture, it is best to leave it installed.
Procedure1. Right-click the agent Navigator item.2. Click Remove.3. Click Yes when a message asks you to confirm the removal of the managed
system; or No to cancel.4. If another message asks you to confirm that you want to uninstall the
monitoring agent, click Yes to permanently uninstall the monitoring agent fromthe computer; or No to cancel.
Results
The agent item no longer appears in the Navigator.Related tasks:“Removing an offline managed system Navigator item” on page 33
Optimizing IBM Tivoli Monitoring resources
Here are some tips for making the most of your monitoring resources:v
Tivoli Enterprise Portal must run every query you use for different chart andtable views. If you use the same query for these views, data retrieval speeds upand you conserve Tivoli Enterprise Portal Server and monitoring serverresources.
v
Tivoli Enterprise Portal uses queries to specify the attributes to retrieve for atable or chart. After that data is retrieved, you can use the Properties editorFilters tab to filter out any unwanted data from the view. You can use the same
Chapter 13. Managing the environment 397
filtering capability in the query itself to filter the data before it is retrieved. Thispre-filtering means the portal server has less data to retrieve and therefore speedsup the process.
v
You can control the time span shown in a chart or table by adding a filter(through the Properties window) or by using time span in the chart or tableview toolbar. Using the Filters tab causes the filtering to be done afterthe datahas been received at the client. time span pre-filters at the server, so only therows that pass the test are returned, and you conserve network resources.
v
When you create a situation, the interval is set to 15 minutes by default. Set thesituation to a longer interval between data samplings to reduce traffic on themonitoring server. This is done in the Sampling interval area of the Formula tabin the Situation editor.
v
A workspace gathers new data samplings when you first open it. You can set theworkspace to refresh automatically anywhere from every 30 seconds to once anhour. If you have workspaces set for automatic refresh, set the interval as highas possible to reduce network traffic (requests from the portal client go throughthe portal server to the monitoring server, then to the monitoring agent, and theinformation is sent back through the same path).
v
Event data is stored in the KFW tables on the portal server. To ensure theperformance of your portal server, you must periodically prune this data. Youcan do this by controlling how long the event data is kept (using theKFW_EVENT_RETENTION parameter), at what time of the day the pruningbegins (using the KFW_PRUNE_START parameter), and when the pruning ends(using the KFW_PRUNE_END parameter). Set these parameters in the TivoliEnterprise Portal Server environment file (KFWENV), as described in the IBMTivoli Monitoring Administrator's Guide.
v A poorly written situation can have a surprisingly large impact on CPU usageon a monitoring server. Using wildcard characters (*) in situations is one of themost common mistakes made in writing situations. Using fields longer thanrequired can also cause additional work to evaluate the situation. Making thechanges below have, in some instances, reduced CPU usage on a monitoringserver from close to full utilization to nearly completely idle. The CPU usagemanifests itself in the kdsmain process. See “High CPU usage on the monitoringserver” on page 312 for more information.
Organization of predefined workspacesThe Enterprise Navigator item has workspaces that query the Tivoli EnterpriseMonitoring Server. Use these predefined workspaces to get status informationabout the monitoring server and monitoring agents and about situations andpolicies.
Use the Workspace Gallery to see what is available for the Navigator item.These are the Enterprise Navigator item workspaces and the workspaces they linkto:
Enterprise StatusThe default workspace is Enterprise Status, which gives an overview of thesituation event status throughout your enterprise.
Event Details - Similar by Situation Name
398 IBM Tivoli Monitoring: Tivoli Enterprise Portal User's Guide
Event Details - Similar by SourceEvent Details - Similar by Resource
Manage Tivoli Enterprise Monitoring ServersThe Manage Tivoli Enterprise Monitoring Servers workspaces provide avisual health check of the monitoring servers in your enterprise and theapplication support that has been applied.
Installed Catalogs - Enterprise ViewInstalled Catalogs - Remote ServerProtocolsSituation StatusSystem Information
Managed System StatusThe Managed System Status is a list of monitoring agents in your managednetwork and their ONLINE or OFFLINE status.
Audit LogAgent Operations Log
EIB Change LogThis workspaces displays entries in the Enterprise Information Base (EIB)log. The EIB is a database used by the Tivoli Enterprise Monitoring Serverto store situation, policy, user definitions, and configuration information.
Self-Monitoring TopologyThe Self-Monitoring Topology workspace provides a high level overview ofyour managed infrastructure and its health.
Deploy Depot Package ListThe Deploy Depot Package List workspace shows the installation packagesthat are available in the agent depot.
Deployment Status SummaryThe Deployment Status Summary workspace shows summary statusinformation about remote agent deployments.
Deployment Status by Deploy GroupDeployment Status by Product
Deployment Status Summary by TransactionThe Deployment Status Summary by Transaction workspace showssummary status information about remote agent deployments, sorted bytransaction.
Related reference:“Enterprise Status workspace” on page 53“Manage Tivoli Enterprise Monitoring Servers workspaces” on page 385“Managed System Status workspace” on page 380“EIB Change Log workspace” on page 384“Self-Monitoring Topology workspace” on page 384“Agent deployment workspaces” on page 388
Tivoli Enterprise Monitoring Server situationsThe Enterprise Navigator item has a set of predefined situations. They appearwithin the Tivoli Enterprise Monitoring Server entry of the Situation editor.
Chapter 13. Managing the environment 399
Deploy_FailedThis situation becomes true and an event is opened when one or moreagent deployments has failed. Default: Do not Run at startup. ShowFormula:( Status == Failed)
Deploy_RetryingThis situation becomes true and an event is opened when one or moreagent deployments is in the FailedRetry state, which means it has failed anattempt to deploy and is making another attempt. Default: Do not Runat startup. Show Formula:( Status == ’Failed Retrying’)
Hub_Catalog_CriticalThis situation becomes true and an event is opened when an applicationcatalog that is installed at a remote monitoring server is not installed at thehub monitoring server. This can happen when application support has notbeen selected for the hub during installation. Default: Do not Run atstartup. Show Formula:( Status == Missing At Hub) AND (Catalog != ’PDSSTATS’)
Hub_Catalog_WarningThis situation becomes true and an event is opened when an applicationcatalog that is installed at a remote monitoring server is newer than whatis installed at the hub monitoring server. This is a warning that theapplication support for the component is out of date. This might not be aproblem if the hub has not been upgraded yet. Default: Do not Run atstartup. Show Formula:( Status == RTEMS Newer)
Remote_Catalog_WarningThis situation becomes true and an event is opened when an applicationcatalog that is installed at the hub monitoring server is not also installed ata remote monitoring server; or an application catalog that is installed at thehub is newer than what is installed at a remote monitoring server.
This might not be a problem if the remote monitoring server has not beenupgraded yet. Also, the remote system might be intentionally notsupporting the subject application, or might only be supporting an olderversion of the application. Default: Do not Run at startup. ShowFormula:((Status == Missing At Hub) AND (Catalog != ’PDSSTATS’)) OR(Status == Hub_Newer)
TEMS_BusyThis situation becomes true and an event is opened when the TivoliEnterprise Monitoring Server is continually busy. Default: Do not Run atstartup. Show Formula:( Product == ’EM’ AND Reason == ’H’)
400 IBM Tivoli Monitoring: Tivoli Enterprise Portal User's Guide
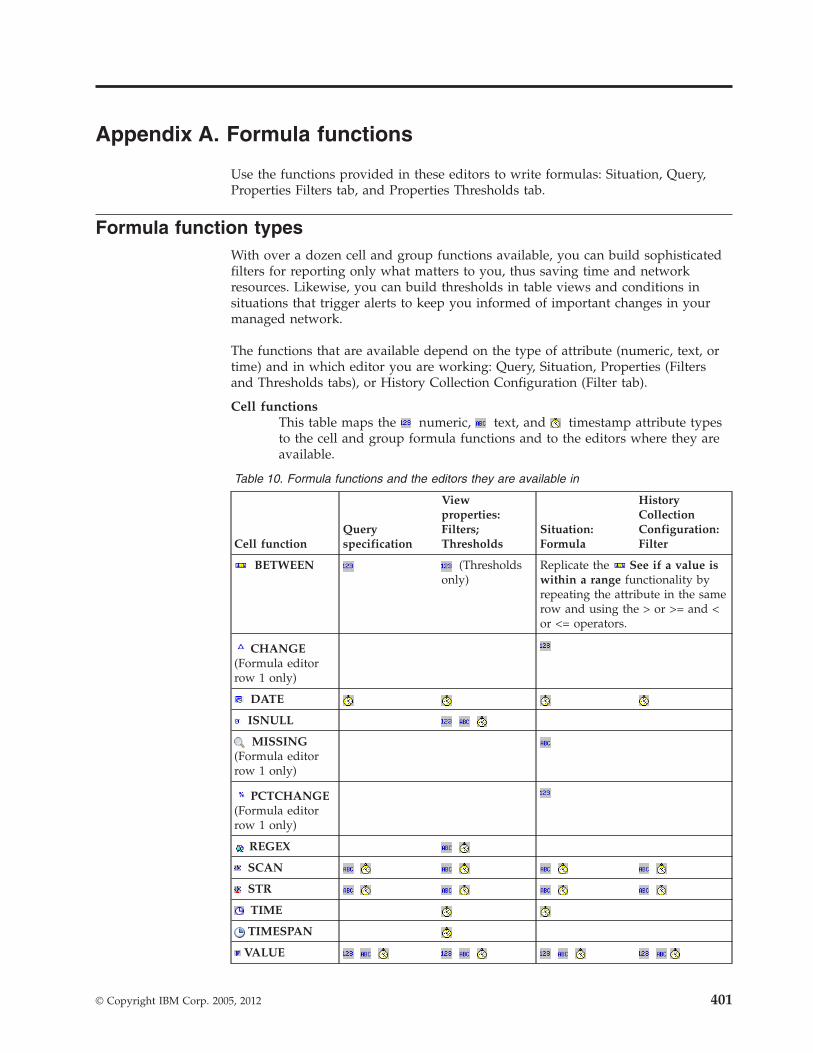
Appendix A. Formula functions
Use the functions provided in these editors to write formulas: Situation, Query,Properties Filters tab, and Properties Thresholds tab.
Formula function typesWith over a dozen cell and group functions available, you can build sophisticatedfilters for reporting only what matters to you, thus saving time and networkresources. Likewise, you can build thresholds in table views and conditions insituations that trigger alerts to keep you informed of important changes in yourmanaged network.
The functions that are available depend on the type of attribute (numeric, text, ortime) and in which editor you are working: Query, Situation, Properties (Filtersand Thresholds tabs), or History Collection Configuration (Filter tab).
Cell functionsThis table maps the numeric, text, and timestamp attribute typesto the cell and group formula functions and to the editors where they areavailable.
Table 10. Formula functions and the editors they are available in
Cell functionQueryspecification
Viewproperties:Filters;Thresholds
Situation:Formula
HistoryCollectionConfiguration:Filter
BETWEEN (Thresholdsonly)
Replicate the See if a value iswithin a range functionality byrepeating the attribute in the samerow and using the > or >= and <or <= operators.
CHANGE(Formula editorrow 1 only)
DATE
ISNULL
MISSING(Formula editorrow 1 only)
PCTCHANGE(Formula editorrow 1 only)
REGEX
SCAN
STR
TIME
TIMESPAN
VALUE
© Copyright IBM Corp. 2005, 2012 401
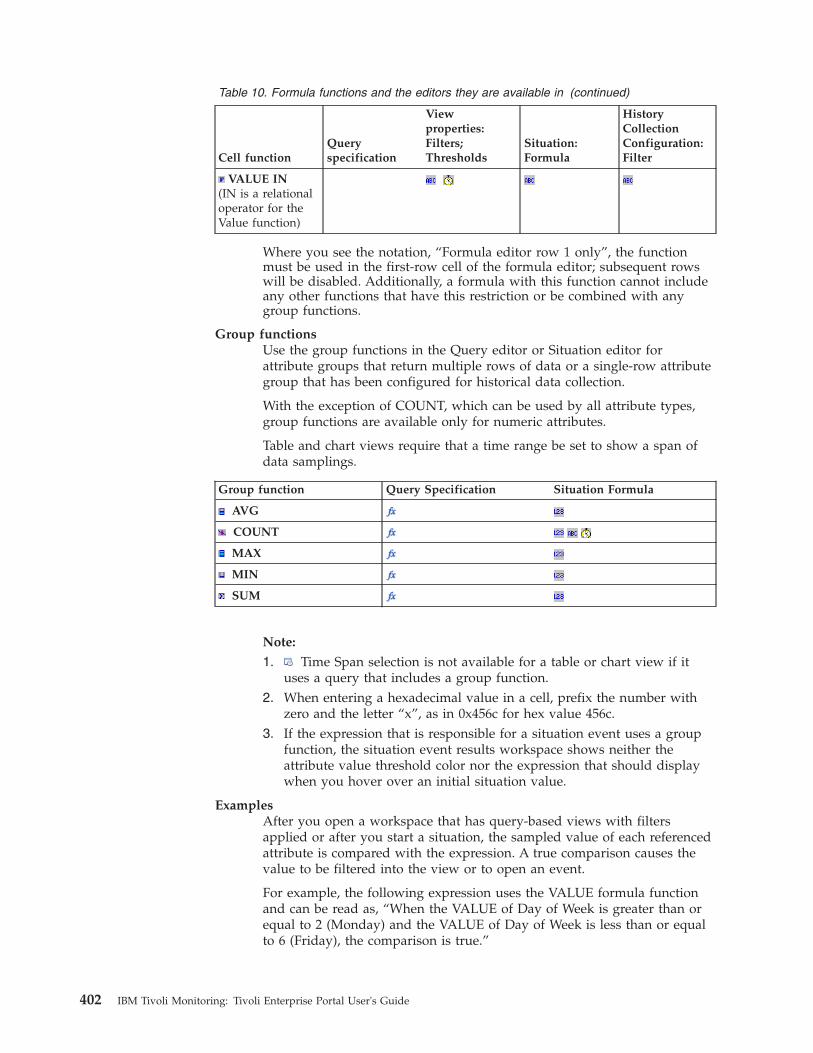
Table 10. Formula functions and the editors they are available in (continued)
Cell functionQueryspecification
Viewproperties:Filters;Thresholds
Situation:Formula
HistoryCollectionConfiguration:Filter
VALUE IN(IN is a relationaloperator for theValue function)
Where you see the notation, “Formula editor row 1 only”, the functionmust be used in the first-row cell of the formula editor; subsequent rowswill be disabled. Additionally, a formula with this function cannot includeany other functions that have this restriction or be combined with anygroup functions.
Group functionsUse the group functions in the Query editor or Situation editor forattribute groups that return multiple rows of data or a single-row attributegroup that has been configured for historical data collection.
With the exception of COUNT, which can be used by all attribute types,group functions are available only for numeric attributes.
Table and chart views require that a time range be set to show a span ofdata samplings.
Group function Query Specification Situation Formula
AVG
COUNT
MAX
MIN
SUM
Note:
1. Time Span selection is not available for a table or chart view if ituses a query that includes a group function.
2. When entering a hexadecimal value in a cell, prefix the number withzero and the letter “x”, as in 0x456c for hex value 456c.
3. If the expression that is responsible for a situation event uses a groupfunction, the situation event results workspace shows neither theattribute value threshold color nor the expression that should displaywhen you hover over an initial situation value.
ExamplesAfter you open a workspace that has query-based views with filtersapplied or after you start a situation, the sampled value of each referencedattribute is compared with the expression. A true comparison causes thevalue to be filtered into the view or to open an event.
For example, the following expression uses the VALUE formula functionand can be read as, “When the VALUE of Day of Week is greater than orequal to 2 (Monday) and the VALUE of Day of Week is less than or equalto 6 (Friday), the comparison is true.”
402 IBM Tivoli Monitoring: Tivoli Enterprise Portal User's Guide
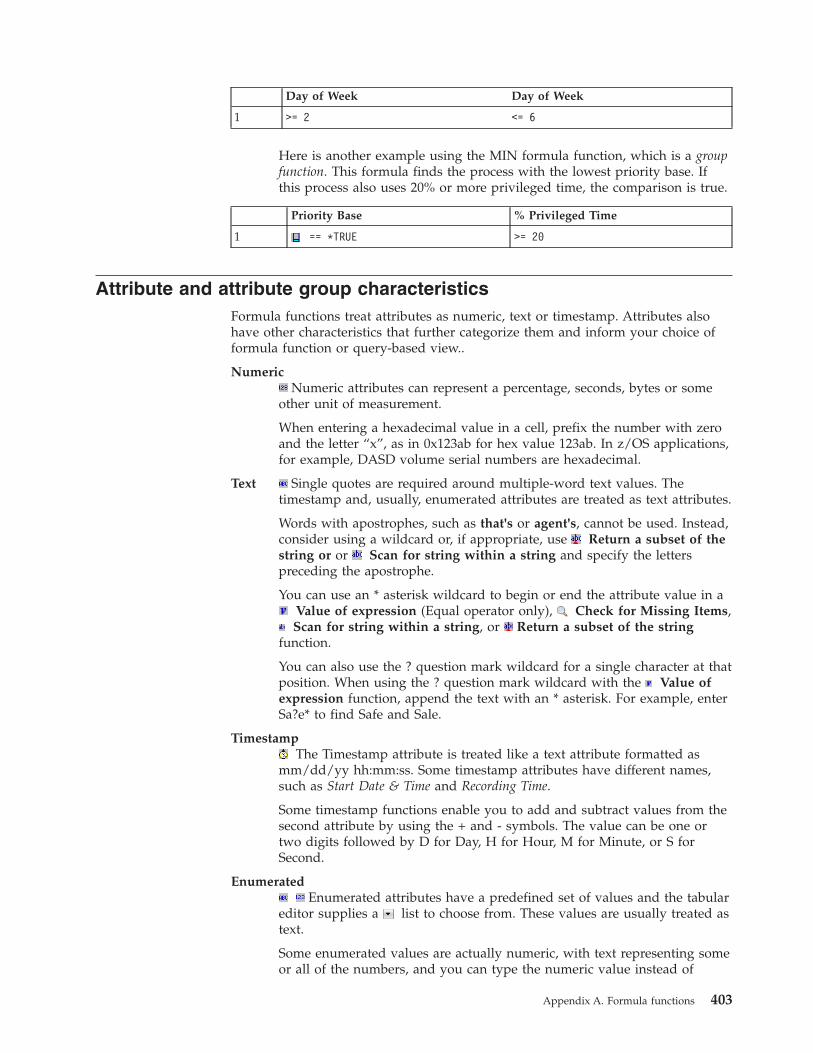
Day of Week Day of Week
1 >= 2 <= 6
Here is another example using the MIN formula function, which is a groupfunction. This formula finds the process with the lowest priority base. Ifthis process also uses 20% or more privileged time, the comparison is true.
Priority Base % Privileged Time
1 == *TRUE >= 20
Attribute and attribute group characteristicsFormula functions treat attributes as numeric, text or timestamp. Attributes alsohave other characteristics that further categorize them and inform your choice offormula function or query-based view..
NumericNumeric attributes can represent a percentage, seconds, bytes or some
other unit of measurement.
When entering a hexadecimal value in a cell, prefix the number with zeroand the letter “x”, as in 0x123ab for hex value 123ab. In z/OS applications,for example, DASD volume serial numbers are hexadecimal.
Text Single quotes are required around multiple-word text values. Thetimestamp and, usually, enumerated attributes are treated as text attributes.
Words with apostrophes, such as that's or agent's, cannot be used. Instead,consider using a wildcard or, if appropriate, use Return a subset of thestring or or Scan for string within a string and specify the letterspreceding the apostrophe.
You can use an * asterisk wildcard to begin or end the attribute value in aValue of expression (Equal operator only), Check for Missing Items,Scan for string within a string, or Return a subset of the string
function.
You can also use the ? question mark wildcard for a single character at thatposition. When using the ? question mark wildcard with the Value ofexpression function, append the text with an * asterisk. For example, enterSa?e* to find Safe and Sale.
TimestampThe Timestamp attribute is treated like a text attribute formatted as
mm/dd/yy hh:mm:ss. Some timestamp attributes have different names,such as Start Date & Time and Recording Time.
Some timestamp functions enable you to add and subtract values from thesecond attribute by using the + and - symbols. The value can be one ortwo digits followed by D for Day, H for Hour, M for Minute, or S forSecond.
EnumeratedEnumerated attributes have a predefined set of values and the tabular
editor supplies a list to choose from. These values are usually treated astext.
Some enumerated values are actually numeric, with text representing someor all of the numbers, and you can type the numeric value instead of
Appendix A. Formula functions 403
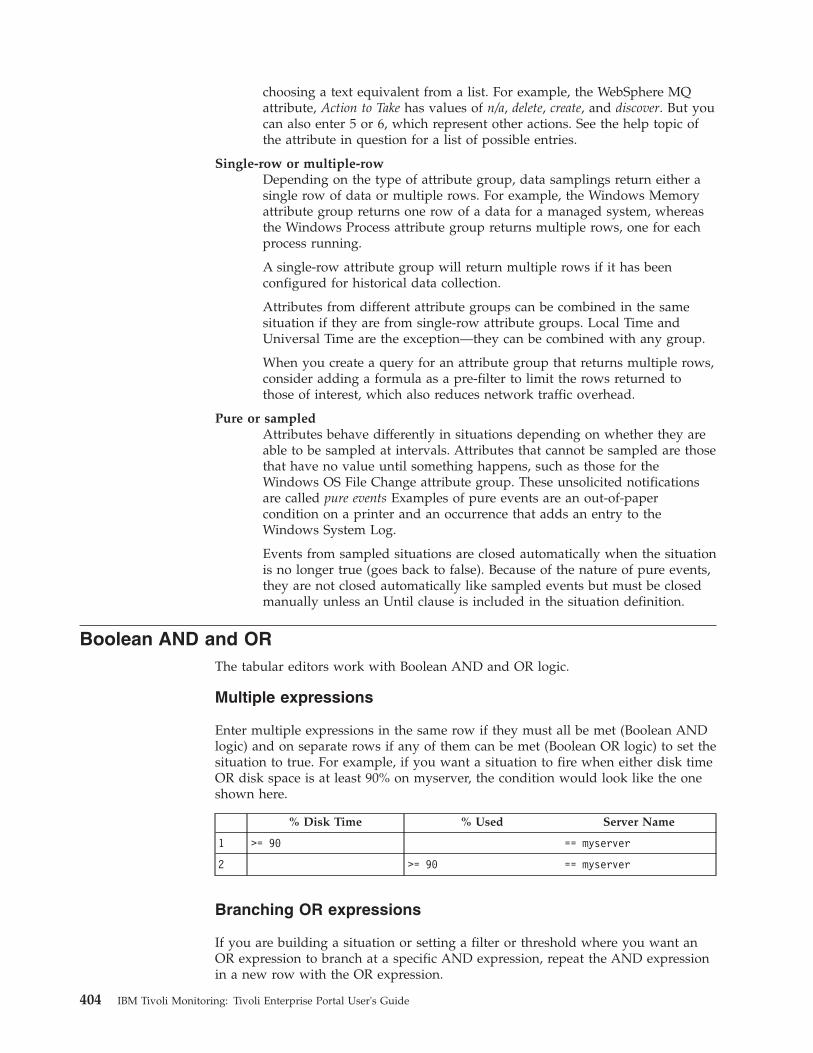
choosing a text equivalent from a list. For example, the WebSphere MQattribute, Action to Take has values of n/a, delete, create, and discover. But youcan also enter 5 or 6, which represent other actions. See the help topic ofthe attribute in question for a list of possible entries.
Single-row or multiple-rowDepending on the type of attribute group, data samplings return either asingle row of data or multiple rows. For example, the Windows Memoryattribute group returns one row of a data for a managed system, whereasthe Windows Process attribute group returns multiple rows, one for eachprocess running.
A single-row attribute group will return multiple rows if it has beenconfigured for historical data collection.
Attributes from different attribute groups can be combined in the samesituation if they are from single-row attribute groups. Local Time andUniversal Time are the exception—they can be combined with any group.
When you create a query for an attribute group that returns multiple rows,consider adding a formula as a pre-filter to limit the rows returned tothose of interest, which also reduces network traffic overhead.
Pure or sampledAttributes behave differently in situations depending on whether they areable to be sampled at intervals. Attributes that cannot be sampled are thosethat have no value until something happens, such as those for theWindows OS File Change attribute group. These unsolicited notificationsare called pure events Examples of pure events are an out-of-papercondition on a printer and an occurrence that adds an entry to theWindows System Log.
Events from sampled situations are closed automatically when the situationis no longer true (goes back to false). Because of the nature of pure events,they are not closed automatically like sampled events but must be closedmanually unless an Until clause is included in the situation definition.
Boolean AND and ORThe tabular editors work with Boolean AND and OR logic.
Multiple expressions
Enter multiple expressions in the same row if they must all be met (Boolean ANDlogic) and on separate rows if any of them can be met (Boolean OR logic) to set thesituation to true. For example, if you want a situation to fire when either disk timeOR disk space is at least 90% on myserver, the condition would look like the oneshown here.
% Disk Time % Used Server Name
1 >= 90 == myserver
2 >= 90 == myserver
Branching OR expressions
If you are building a situation or setting a filter or threshold where you want anOR expression to branch at a specific AND expression, repeat the AND expressionin a new row with the OR expression.
404 IBM Tivoli Monitoring: Tivoli Enterprise Portal User's Guide
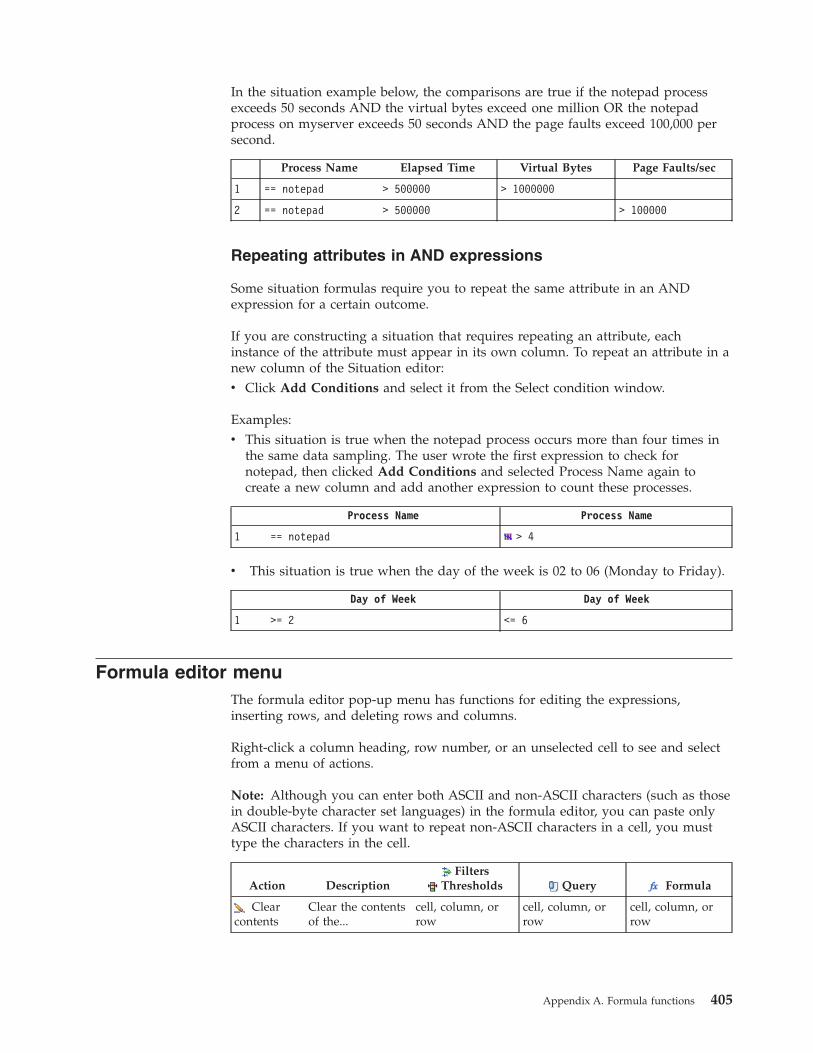
In the situation example below, the comparisons are true if the notepad processexceeds 50 seconds AND the virtual bytes exceed one million OR the notepadprocess on myserver exceeds 50 seconds AND the page faults exceed 100,000 persecond.
Process Name Elapsed Time Virtual Bytes Page Faults/sec
1 == notepad > 500000 > 1000000
2 == notepad > 500000 > 100000
Repeating attributes in AND expressions
Some situation formulas require you to repeat the same attribute in an ANDexpression for a certain outcome.
If you are constructing a situation that requires repeating an attribute, eachinstance of the attribute must appear in its own column. To repeat an attribute in anew column of the Situation editor:v Click Add Conditions and select it from the Select condition window.
Examples:v This situation is true when the notepad process occurs more than four times in
the same data sampling. The user wrote the first expression to check fornotepad, then clicked Add Conditions and selected Process Name again tocreate a new column and add another expression to count these processes.
Process Name Process Name
1 == notepad > 4
v This situation is true when the day of the week is 02 to 06 (Monday to Friday).
Day of Week Day of Week
1 >= 2 <= 6
Formula editor menuThe formula editor pop-up menu has functions for editing the expressions,inserting rows, and deleting rows and columns.
Right-click a column heading, row number, or an unselected cell to see and selectfrom a menu of actions.
Note: Although you can enter both ASCII and non-ASCII characters (such as thosein double-byte character set languages) in the formula editor, you can paste onlyASCII characters. If you want to repeat non-ASCII characters in a cell, you musttype the characters in the cell.
Action DescriptionFilters
Thresholds Query Formula
Clearcontents
Clear the contentsof the...
cell, column, orrow
cell, column, orrow
cell, column, orrow
Appendix A. Formula functions 405
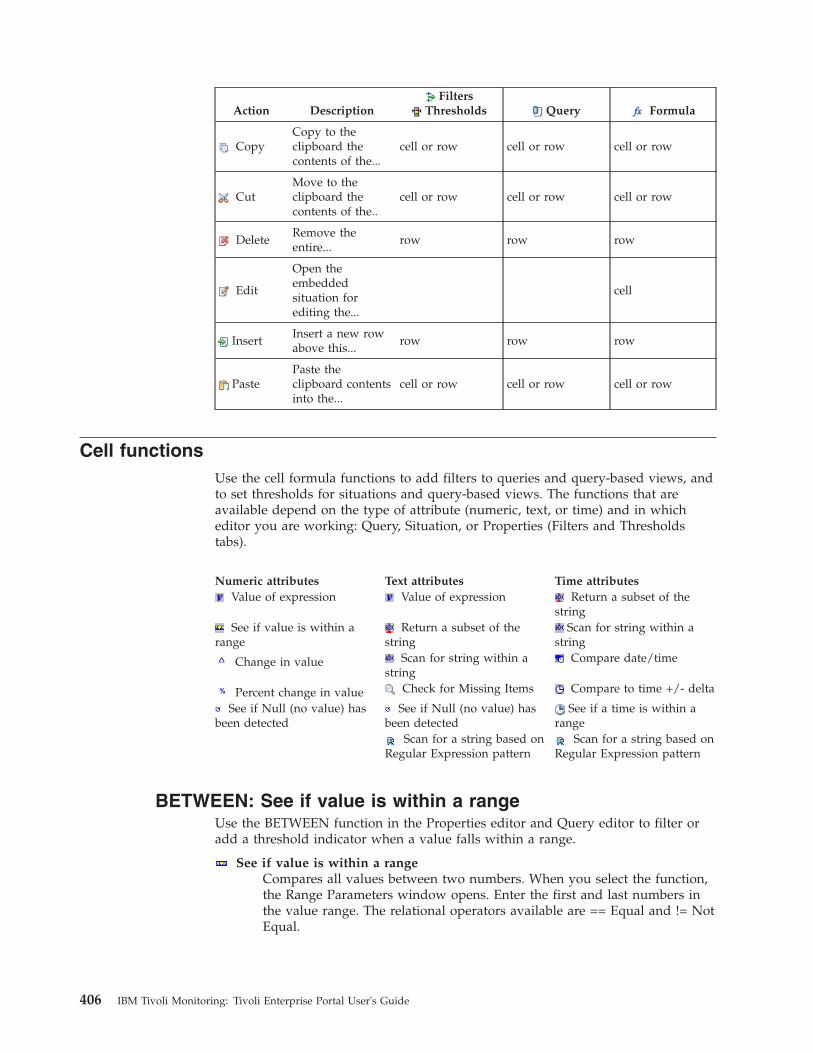
Action DescriptionFilters
Thresholds Query Formula
CopyCopy to theclipboard thecontents of the...
cell or row cell or row cell or row
CutMove to theclipboard thecontents of the..
cell or row cell or row cell or row
DeleteRemove theentire...
row row row
Edit
Open theembeddedsituation forediting the...
cell
InsertInsert a new rowabove this...
row row row
PastePaste theclipboard contentsinto the...
cell or row cell or row cell or row
Cell functionsUse the cell formula functions to add filters to queries and query-based views, andto set thresholds for situations and query-based views. The functions that areavailable depend on the type of attribute (numeric, text, or time) and in whicheditor you are working: Query, Situation, or Properties (Filters and Thresholdstabs).
Numeric attributes Text attributes Time attributesValue of expression Value of expression Return a subset of the
stringSee if value is within a
rangeReturn a subset of the
stringScan for string within a
string
Change in value Scan for string within astring
Compare date/time
Percent change in value Check for Missing Items Compare to time +/- delta
See if Null (no value) hasbeen detected
See if Null (no value) hasbeen detected
See if a time is within arange
Scan for a string based onRegular Expression pattern
Scan for a string based onRegular Expression pattern
BETWEEN: See if value is within a rangeUse the BETWEEN function in the Properties editor and Query editor to filter oradd a threshold indicator when a value falls within a range.
See if value is within a rangeCompares all values between two numbers. When you select the function,the Range Parameters window opens. Enter the first and last numbers inthe value range. The relational operators available are == Equal and != NotEqual.
406 IBM Tivoli Monitoring: Tivoli Enterprise Portal User's Guide
Exclude range start/end from evaluation, when left unchecked,includes the values entered in the range. The expression ends with 0 if thisis left unchecked; 1 if it is checked (see example).
ExampleThe comparison is true if Copy Read Hits is between 50% and 60%.BETWEEN (Copy Read Hits %) == 50,60,1
Hexadecimal numbersWhen entering a hexadecimal value in a cell, prefix the number with zeroand the letter “x”, as in 0x123ab for hex value 123ab.
CHANGE: Change in valueUse the CHANGE formula function in a situation to compare the change betweenthe value of the current data sample and the previous sample.
Change in valueThe CHANGE function takes the amount of change between the sampledvalue of the attribute and the previous value, then compares it with thevalue you enter here. If the result meets the comparison, the situation istrue. Valid values are numeric integers.
ExampleIn the following example, the situation becomes true if the Virtual Byteshave increased by at least 100 bytes since the last data sampling. Duringthe first monitor iteration the value of Virtual Bytes is 200 and during thesecond iteration the value is 500, which is an increase of 300 betweensamples, thus the situation is true.CHANGE (Virtual Bytes) >= 100
RestrictionsYou can have only one CHANGE function in a situation.
The CHANGE function must be written on row 1 of the formula editor; allsubsequent rows are disabled.
You cannot combine the CHANGE function with a PCTCHANGE,MISSING or group function in a situation.
A formula with the CHANGE function can use values from one attributegroup only.
The function list shows CHANGE for monitoring agents that are of thecorrect version; older versions will not display CHANGE in the list.
If the expression that is responsible for a situation event uses this function,the event results workspace will show neither the attribute value nor theexpression that should display when you hover over an initial situationvalue.
Hexadecimal numbersWhen entering a hexadecimal value in a cell, prefix the number with zeroand the letter “x”, as in 0x123ab for hex value 123ab.
DATE: Compare Date and TimeUse the DATE formula function in a situation, query, query-based view filter, ortable view threshold formula to compare the time stamp from the data samplewith the value specified.
Appendix A. Formula functions 407
Compare date/timeThis is the default function for time attributes. It compares the Timestampvalue from the data sampling with the value entered here.
After you select the DATE function and click inside the value cell, theSelect the Time Comparison dialog opens for selecting the exact date andtime to compare. The format is the date as seen in the date columns(mm/dd/yy hh:mm:ss) or as defined for your locale.
ExampleThis formula checks the Timestamp attribute value. When it matches thedate set here, the comparison is true.DATE(Timestamp)== 09/30/03 23:59:00
ISNULL: See if Null has been detectedUse the ISNULL formula function in a query-based view filter or a table viewthreshold to find cells that have receive no value and insert “null”.
See if Null (no value) has been detectedInserts null into a cell that has received no value from the numeric or textattribute for the view. In the Formula editor, the value shows as True andthe operators available are == Equal and != Not Equal.
ExampleIn the Filters tab, any row that has no value in the Contents field will beexcluded from the view. If, instead, this formula is written in theThresholds tab, all cells that have a valid value in this column will bedisplayed with the threshold color or theshold icon.ISNULL(Contents) != True
MISSING: Check for missing itemsUse the MISSING function in a situation to compare the data sample with a list oftext entries. If no match is found, a situation event is opened.
Check for Missing ItemsCompares the value of the specified text attribute with a list of values yousupply. The condition is true when the value does not match any in thelist. This function is useful when you want notification that something isnot present in your system.
ExamplesAn event opens when the anti-virus scanning program is not available.MISSING (ProcessName) == (VirusGone.exe)
This example builds on the last one. Two names were added to the MissingList and a system name specified with a wildcard. An event will open ifany of these processes is missing on any system whose name starts withSERVER (such as SERVER_BLDG100 or SERVERSOUTH). If you wanted tobe notified when this is the case, you could add a notification action to beexecuted when the situation becomes true.(MISSING (ProcessName)== (VirusGone.exe,DBServer.exe,iexplore.exe))ANDServerName == SERVER*
RestrictionsYou can have only one MISSING function in a situation.
The MISSING function must be written on row 1 of the formula editor; allsubsequent rows are disabled.
408 IBM Tivoli Monitoring: Tivoli Enterprise Portal User's Guide
You cannot combine the MISSING function with any grouping functionslike MAX or COUNT but you can combine it with value-type functionslike VALUE, SCAN, DATE, etc.
WildcardsYou can use an * asterisk wildcard to begin or end the attribute value. Youcan also use the ? question mark wildcard for a single character at thatposition.
Tip If the formula is for a multiple-row attribute group, add a display item (inthe Condition tab, click Advanced) if you want the situation to continuetesting for missing items after opening an event for the first one.
PCTCHANGE: Percent change in valueUse the PCTCHANGE formula function in a situation to compare the percentchange between the value of the current data sample and the previous sample.
Percent change in valueThe PCTCHANGE function takes the percentage change between thesampled value of the attribute and the previous value, then compares itwith what you enter here. If the result meets the comparison, the situationis true. Valid values are numeric integers.
ExampleThis situation is true when the memory usage of a process increases by50% or more between sampling intervals.PCTCHANGE (% Processor Time) >= 50
RestrictionsYou can have only one PCTCHANGE function in a situation.
The PCTCHANGE function must be written on row 1 of the formulaeditor; all subsequent rows are disabled.
You cannot combine the PCTCHANGE function with a CHANGE,MISSING or group function in a situation.
A formula with the PCTCHANGE function can use values from oneattribute group only.
The function list shows PCTCHANGE for monitoring agents that are of thecorrect version; older versions do not display PCTCHANGE in the list.
If the expression that is responsible for a situation event uses this function,the event results workspace shows neither the attribute value thresholdcolor nor the expression that should display when you hover over aninitial situation value.
Hexadecimal numbersWhen entering a hexadecimal value in a cell, prefix the number with zeroand the letter “x”, as in 0x123ab for hex value 123ab.
REGEX: Scan for a string based on Regular Expressionpattern
Use the REGEX formula function in a query-based view filter or a table viewthreshold for the text or timestamp that matches a pattern. The pattern is based ona regular expression.
Scan for a string based on Regular Expression patternThe REGEX function looks for a pattern match to the expression. The
Appendix A. Formula functions 409
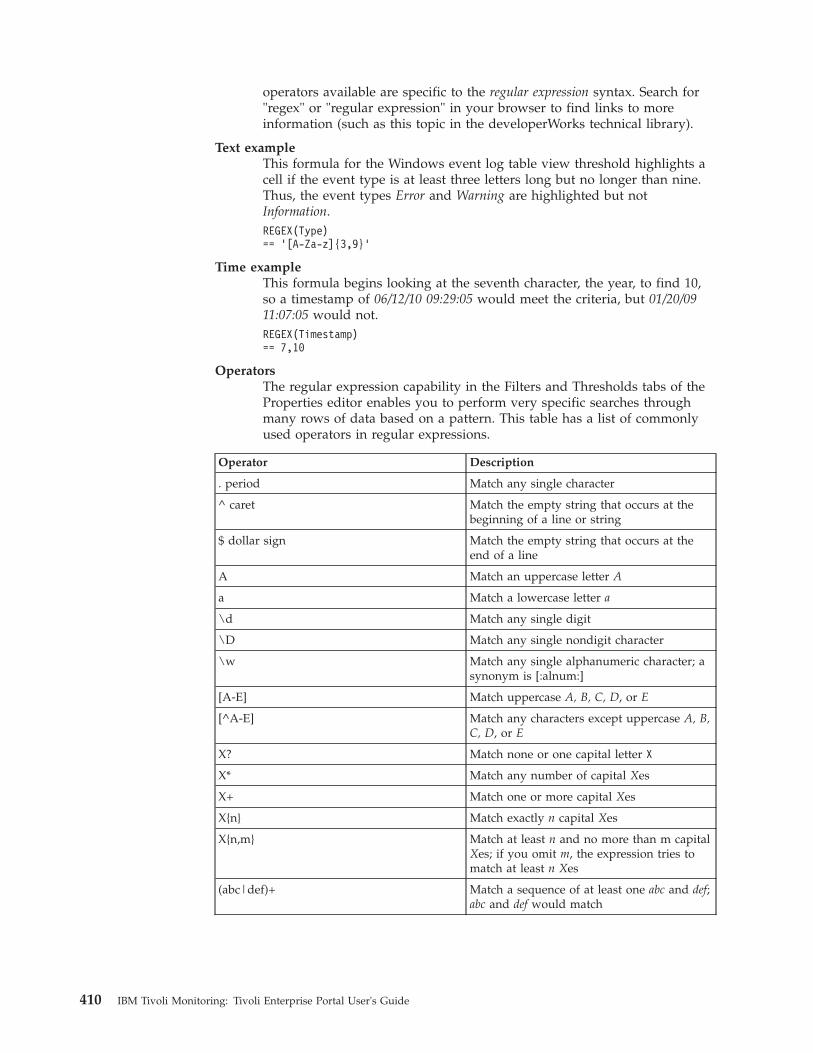
operators available are specific to the regular expression syntax. Search for"regex" or "regular expression" in your browser to find links to moreinformation (such as this topic in the developerWorks technical library).
Text exampleThis formula for the Windows event log table view threshold highlights acell if the event type is at least three letters long but no longer than nine.Thus, the event types Error and Warning are highlighted but notInformation.REGEX(Type)== ’[A-Za-z]{3,9}’
Time exampleThis formula begins looking at the seventh character, the year, to find 10,so a timestamp of 06/12/10 09:29:05 would meet the criteria, but 01/20/0911:07:05 would not.REGEX(Timestamp)== 7,10
OperatorsThe regular expression capability in the Filters and Thresholds tabs of theProperties editor enables you to perform very specific searches throughmany rows of data based on a pattern. This table has a list of commonlyused operators in regular expressions.
Operator Description
. period Match any single character
^ caret Match the empty string that occurs at thebeginning of a line or string
$ dollar sign Match the empty string that occurs at theend of a line
A Match an uppercase letter A
a Match a lowercase letter a
\d Match any single digit
\D Match any single nondigit character
\w Match any single alphanumeric character; asynonym is [:alnum:]
[A-E] Match uppercase A, B, C, D, or E
[^A-E] Match any characters except uppercase A, B,C, D, or E
X? Match none or one capital letter X
X* Match any number of capital Xes
X+ Match one or more capital Xes
X{n} Match exactly n capital Xes
X{n,m} Match at least n and no more than m capitalXes; if you omit m, the expression tries tomatch at least n Xes
(abc|def)+ Match a sequence of at least one abc and def;abc and def would match
410 IBM Tivoli Monitoring: Tivoli Enterprise Portal User's Guide
SCAN: Scan for string within a stringUse the SCAN formula function in a situation, query, view filter or table viewthreshold to scan the data sample for the specified text or time stamp.
Scan for string within a stringSearches for the value or partial value occurring anywhere in the text ortime stamp returned by the attribute. The == Equal relational operator isvalid; all other operators return invalid or unwanted results.
Text examplesThis formula scans the value of Owner for CD anywhere in the text. Forexample, an owner named ABCDEF would meet the comparison.SCAN(Owner) == CD
This formula scans the value of ProcessName for ho, so svchost and shopperwould meet the comparison.SCAN(ProcessName) == ho
Time exampleThis formula scans the timestamp for a value of 07/08. A date of 07/08/10would meet the comparison as would 12/07/08.SCAN(Timestamp) == 07/08
WildcardsYou can use an * asterisk wildcard to begin or end the attribute value. Youcan also use the ? question mark wildcard for a single character at thatposition.
STR: Return a subset of the stringUse the STR formula function in a situation, query, view filter or table viewthreshold to start searching for the value in the text or time stamp at a specificcharacter position.
Return a subset of the stringSearches for a value occurring at a specific location in the data returned bythe attribute. When you select STR, a Substring Comparison Informationwindow opens for you to enter the starting position, such as 4 for thefourth character from the left to begin looking for the value.
Text exampleThis formula looks for ar starting with the second character in returnedvalues for Handle of the User, so aardvark, parrot and sardine meet thecomparison, but not artist, star or SARDINE (case-sensitive).STR(Handle of the User) == 2,ar
Time exampleThis formula begins looking at the seventh character, the year, to find 10,so a timestamp of 07/12/10 09:29:05 would meet the criteria but 10/11/0911:07:05 would not.STR(Timestamp) == 7,10
WildcardsYou can use an * asterisk wildcard to begin or end the attribute value. Youcan also use the ? question mark wildcard for a single character at thatposition.
Appendix A. Formula functions 411
TIME: Compare to a time +/- deltaUse the TIME formula function in a situation, query-based view filter, or tableview threshold formula to compare the time stamp attribute (such a recordingtime) with the specified difference in number of days, hours, minutes, or seconds.
Compare to time +/- deltaCompares the time difference you enter with the timestamp returned by anattribute. After you select the TIME function and click inside the value cell,the Select Time Comparison Criteria window opens. Select a timestampattribute from the list. Specify the delta by combining + or - with thenumber of days (D), hours (H), minutes (M), or seconds (S). The sampledtimestamps are compared to the delta.
ExampleThis formula compares the time the event was logged (Entry Time) withthe timestamp from the data sampling. If the event occurred seven daysearlier, the comparison is true. If the == were changed to <=, thecomparison would be true after eight days, nine days, and so on.TIME(Entry Time) == #NT_Event_Log.Timestamp - 7D
TIMESPAN: See if a time is within a rangeUse the TIMESPAN formula function to filter a query-based view or to addthreshold indicators to a table view. The data sample time stamp is compared withthe specified time span.
See if a time is within a rangeThe TIMESPAN function selects rows based on the comparison of theTimestamp value to the time span indicated. When you select this functionand click inside the value cell, the Select Time Span dialog opens for youto choose a time span. Note that only the == and != relational operatorsare available for this function.
ExampleThis formula selects all rows with timestamps within the last two hours.TIMESPAN(Timestamp)== ,,7200
VALUE: Value of expressionUse the VALUE formula function in a situation, query, view filter or table viewthreshold to look for the partial or complete number or text in the data sample.
Value of expressionTakes the sampled value of the attribute. When used with other functions,VALUE is evaluated before the others, acting as a filter to the otherfunctions.
Numeric exampleThis formula looks through all CPU Utilization values. If one is over 50%the comparison is true.VALUE(CPU Utilization)> 50
Text examplesThe comparison is true if the system name is redwood.VALUE(System Name) == redwood
This formula uses a wildcard to find log files that start with uppercase S,such as System and Security.
412 IBM Tivoli Monitoring: Tivoli Enterprise Portal User's Guide
VALUE(Log Name) == S*
WildcardsFor text attributes only, you can use wildcards to enter partial values thatwill find everything that includes those characters provided that youappend the text with an * asterisk. Use an * asterisk wildcard for anynumber of characters beginning at that position. Use a ? question markwildcard for a single character at that position. The last character of thetext must be an * asterisk. For example, enter Sa?e* to find Safe and Sale;and enter *System* to find AIX_System and UNIX_Systems. Be aware thatonly the == Equal operator is valid; all other operators will return invalidor unwanted results. For another example, db2*.exe* will find db2fmp.exeand db2systray.exe; and db2???.* will find db2fmp.exe but notdb2systray.exe.
Hexadecimal numbersWhen entering a hexadecimal value in a cell, prefix the number with zeroand the letter “x”, as in 0x123ab for hex value 123ab.
Tip For situations on multiple-row attribute groups, you can add a displayitem (in the Condition tab, click Advanced) to open an event for each rowthat meets the condition and not just the first one.
IN: Value of expression INUse the IN relational operator with the Value of expression function in asituation or a query-based view filter or threshold to compare the data samplewith a list of text values. The condition is met when a match is found.
Value of expression INCompares the value of the specified text attribute with a list of values thatyou supply. The condition is true when a match is found in the list. Usingthe IN relational operator with the Value of expression function is usefulfor highlighting specific names or text values that are present in the datasamplings, such as certain process names.
ExamplesThis is a filter used to display only those rows that have a user name ofAnne, Jane or John in the table.(User Name *IN (’Anne’,’John’,’Jane’))
This is a threshold formula for a view of situations used to apply theMinor severity threshold color to any cell that contains one of these names.((--- Minor ---) Name *IN (’NT_Percent_Processor_Time’,
’NT_Memory_Pages_Sec_Low’,’NT_Percent_Disk_Time_Low’))
Situation tipIf the formula is for a multiple-row attribute group, add a display item (inthe Condition tab, click Advanced) if you want the situation to continuetesting for missing items after opening an event for the first one.
Group functionsUse the group functions in the Query editor or Situation editor for attribute groupsthat return multiple rows of data or a single-row attribute group that has beenconfigured for historical data collection. With the exception of COUNT, which canbe used by all attribute types, group functions are available only for numericattributes.
Note:
Appendix A. Formula functions 413
1. Time Span selection is not available for a table or chart view if it uses aquery that includes a group function.
2. When entering a hexadecimal value in a cell, prefix the number with zero andthe letter “x”, as in 0x456c for hex value 456c.
3. If the expression that is responsible for a situation event uses a group function,the situation event results workspace shows neither the attribute valuethreshold color nor the expression that should display when you hover over aninitial situation value.
AVG: Average of groupUse the Average of group function in a query or situation to calculate theaverage from a range of values.
Average of groupThe AVG function totals the attribute values specified and calculates theaverage.
Query exampleThis function averages all returned values of % User Time. GROUP BY isServer Name, so the view will show the average user time, one row foreach managed system.AVG(% User Time)
Situation exampleThis formula averages all returned values of % User Time. If the averageexceeds 20%, the comparison is true.AVG (% User Time)> 20
COUNT: Count of group membersUse the Count of group members formula function in a query or situation tocount the number of returned rows, which can be filtered by an AND expression.
COUNT in a query to the monitoring server works differently than it does in asituation: It counts the column specified within the group referenced (Advancedbutton, Group By tab), and displays the result in the count column.
Note: When using COUNT in an AND expression, it must be the last function inthe expression.
Query exampleThis function counts the number of processes. GROUP BY is Server Name,and the number of processes counted for each system appears in the IDProcess column. Example as it would be written in an SQL statement:COUNT(ID_Process)
Situation examplesExamples as they appear in Show Formula:v The comparison is true when more than 10 rows have been counted.
COUNT(Timestamp) > 10
v This formula first filters the rows for those with the notepad process,then counts the returned rows by referencing the Timestamp attribute.The attribute used for the count does not matter, because the COUNTfunction is simply counting the number of rows where this attributeappears. When the count exceeds four, the comparison is true.(Process Name) == notepad AND COUNT(Timestamp) > 4
414 IBM Tivoli Monitoring: Tivoli Enterprise Portal User's Guide
v The next formula counts the processes that have been running for morethan an hour. When at least five processes have been counted, thecomparison is true.(Elapsed Time (Seconds) >= 3600)) AND COUNT(Timestamp) >= 5
MAX: Maximum in groupUse the Maximum in group function in a query or situation to compare theattributes returned and select the one with the highest value.
Maximum in groupFor attributes that return multiple rows, the MAX function finds thehighest returned value (or values).
Query exampleThis function finds the process with the highest thread count. GROUP BYis Server Name, so the view shows the process with the highest threadcount on each system.MAX(Thread Count)
Situation exampleThe relational operator is set to == and the value to TRUE. The MAXfunction is meaningful when combined with another expression. Thisformula finds the process with the highest thread count. If the process alsohas more than 150 million virtual bytes, the comparison is true.MAX(Thread Count)== *TRUE AND Virtual Bytes >= 150,000,000
MIN: Minimum in groupUse the Minimum in group function in a query or situation to compare theattributes returned and select the one with the lowest value.
Minimum in groupFor attributes that return multiple rows, the MIN function finds the lowestreturned value (or values).
Query exampleThis function finds the process with the lowest priority base. GROUP BY isServer Name, so the view will show the process with the lowest prioritybase on each system.MIN(Priority Base)
Situation exampleThe relational operator is set to == and the value to TRUE. The MINfunction is meaningful when combined with another expression. Thisformula finds the process with the lowest priority base. If it also has morethan 20% privileged time, the comparison is true.MIN(Priority Base)== *TRUE AND % Privileged Time >= 20
SUM: Sum of groupUse the Sum of group function in a query or situation to calculate the totalfrom a range of values.
Sum of groupTakes the attribute values returned that meet the criteria and totals them.
Query exampleThis formula totals all CPU Utilization values in the data sampling.GROUP BY is Server Name, so the view will show the total for eachmanaged system.
Appendix A. Formula functions 415
SUM(CPU Utilization)
Situation exampleThis formula totals all CPU Utilization values in the data sampling fromthe system named redwood. If the sum of these values exceeds 50%, thecomparison is true.SUM(CPU Utilization)> 50 AND System Name == redwood
416 IBM Tivoli Monitoring: Tivoli Enterprise Portal User's Guide
Appendix B. Tivoli Enterprise Monitoring Server and globalattributes
The Tivoli Enterprise Monitoring Server has attributes for monitoring enterpriselogs and status. Global attributes are also available for use alone or combined withother attribute groups in situations.
Every monitoring agent connects to a Tivoli Enterprise Monitoring Server, whichacts as a collection and control point for alerts received from the agents, andgathers performance and availability data from them. The main, or hub,monitoring server correlates the monitoring data collected by agents and remoteservers and passes it to the Tivoli Enterprise Portal Server for presentation in theTivoli Enterprise Portal.
Monitoring agents are made up of attributes, which represent the properties ofsystems or networks, such as the amount of CPU usage or the message ID.Attributes are organized into attribute groups. The attributes in a group can bedisplayed in a query-based view (table, chart or relational topology) or used tospecify a condition for testing in a situation. When you open the view or start thesituation, data samples are taken of the selected attributes.
The Tivoli Enterprise Monitoring Server has attribute groups that you can use forreporting the status of enterprise activities, monitoring agents, and situations:v Agent Operations Log for use in query-based views and situations to monitor
message-related information about the monitoring agent. See the “AgentOperations Log attributes” on page 418.
v Three attribute groups for the Depotv Enterprise Information Base (EIB) Change log for use in query-based views of
the changes made by users to deploy situations and policies. See the “EIBChange Log attributes” on page 423.
v Managed System for use in query-based views and situations regarding thestatus of the monitoring server and agents. See the “Managed Systemsattributes” on page 430.
v Situation Definition for use in query-based views to report the completedefinition of situations. See the “Situation Definition attributes” on page 431.
v Active Situation Status and Situation Status for use in query-based views toreport the situation and policy status. See the “Situation Status Currentattributes” on page 435 and “Situation Status Log attributes” on page 436.
The Tivoli Enterprise Monitoring Server also has several global attribute groups forusing alone or combining with a product attribute group to create situations:v Local Time and Universal Time for use in situations, including embedded
situations on any managed system. See the “Local Time attributes” on page 429and “Universal Time attributes” on page 439.
v Universal Message for monitoring the messages that have been generatedthrough a situation or policy action command. See the “Universal Messagesattributes” on page 438.
v The Situation Status Event attributes for information on situation events. Viewsthat display this information include My Acknowledged Events, Selected Event,and Similar Events and are used in some of the Enterprise workspaces.
© Copyright IBM Corp. 2005, 2012 417
v ITM Audit attributes give information on critical state-changing events in themonitoring environment. See the“ITM Audit attributes” on page 424.
You can also work with attributes of other applications by creating SQL queries toretrieve them from ODBC-compliant databases.
Agent Operations Log attributes
The Agent Operations Log collects the messages that occur on managed systems inyour enterprise. This log provides a list of message-related information about themonitoring agent.
Note: The i5/OS and z/OS monitoring agents do not list information in the AgentOperations Log. As well, because this log is specific to the individual agent, itreports data only at the agent and attribute levels of the Navigator Physicalview.
Global Timestamp The date and time at the monitoring server when the operationtook place. The format is MM/DD/YY HH:MM:SS.
Help Text The text description of the operation.
Managed System Type The type of managed system.
Message Number The message ID that corresponds to the text.
Message Severity A numeric indicator of the severity of the operation.
Message Text The operation that took place at the agent, such as execution of atake action command or connection to the monitoring server.
Server Name The name of the monitoring server where the operation took place.
Catalog Check attributes
The Catalog Check attributes compare the application catalogs of the hub TivoliEnterprise Monitoring Server with remote monitoring servers and report anydiscrepancies. These are the predefined queries for Catalog Check attributes:Compare Enterprise Catalogs and Compare Tivoli Enterprise Monitoring Server Catalogs.
Application Name The identifier of an application catalog that is installed at theTivoli Enterprise Monitoring Server. Some of the catalog IDs are identified in theIBM Tivoli Monitoring Messages Guide.
Hub Column Count The total number of table columns for this application at theHub Tivoli Enterprise Monitoring Server. The catalog contains all the agent tabledefinition, with multiple tables of multiple columns.
Hub Timestamp The timestamp of the application catalog at the Hub TivoliEnterprise Monitoring Server. The format is MM/DD/YY HH:MM:SS.
Server Column Count The total number of table columns for this application. Ifthe total is different from the hub column count, it might signify that the versioninstalled is different from the version of application support installed on the hubmonitoring server.
418 IBM Tivoli Monitoring: Tivoli Enterprise Portal User's Guide
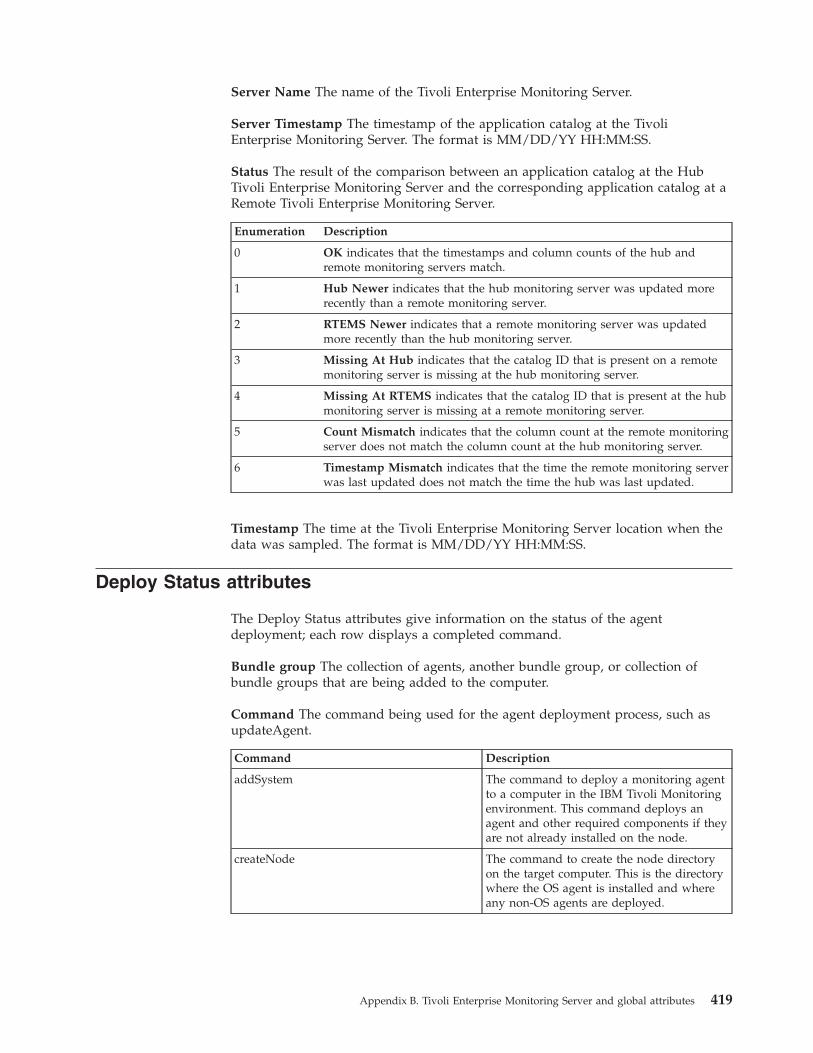
Server Name The name of the Tivoli Enterprise Monitoring Server.
Server Timestamp The timestamp of the application catalog at the TivoliEnterprise Monitoring Server. The format is MM/DD/YY HH:MM:SS.
Status The result of the comparison between an application catalog at the HubTivoli Enterprise Monitoring Server and the corresponding application catalog at aRemote Tivoli Enterprise Monitoring Server.
Enumeration Description
0 OK indicates that the timestamps and column counts of the hub andremote monitoring servers match.
1 Hub Newer indicates that the hub monitoring server was updated morerecently than a remote monitoring server.
2 RTEMS Newer indicates that a remote monitoring server was updatedmore recently than the hub monitoring server.
3 Missing At Hub indicates that the catalog ID that is present on a remotemonitoring server is missing at the hub monitoring server.
4 Missing At RTEMS indicates that the catalog ID that is present at the hubmonitoring server is missing at a remote monitoring server.
5 Count Mismatch indicates that the column count at the remote monitoringserver does not match the column count at the hub monitoring server.
6 Timestamp Mismatch indicates that the time the remote monitoring serverwas last updated does not match the time the hub was last updated.
Timestamp The time at the Tivoli Enterprise Monitoring Server location when thedata was sampled. The format is MM/DD/YY HH:MM:SS.
Deploy Status attributes
The Deploy Status attributes give information on the status of the agentdeployment; each row displays a completed command.
Bundle group The collection of agents, another bundle group, or collection ofbundle groups that are being added to the computer.
Command The command being used for the agent deployment process, such asupdateAgent.
Command Description
addSystem The command to deploy a monitoring agentto a computer in the IBM Tivoli Monitoringenvironment. This command deploys anagent and other required components if theyare not already installed on the node.
createNode The command to create the node directoryon the target computer. This is the directorywhere the OS agent is installed and whereany non-OS agents are deployed.
Appendix B. Tivoli Enterprise Monitoring Server and global attributes 419
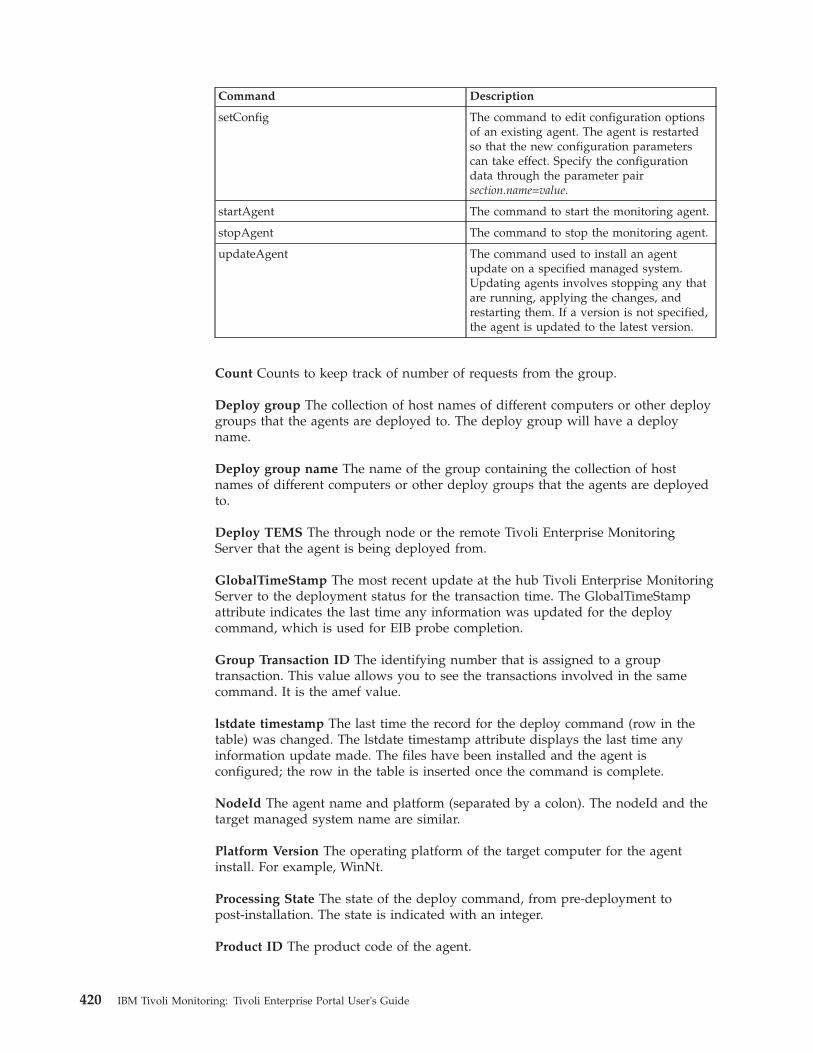
Command Description
setConfig The command to edit configuration optionsof an existing agent. The agent is restartedso that the new configuration parameterscan take effect. Specify the configurationdata through the parameter pairsection.name=value.
startAgent The command to start the monitoring agent.
stopAgent The command to stop the monitoring agent.
updateAgent The command used to install an agentupdate on a specified managed system.Updating agents involves stopping any thatare running, applying the changes, andrestarting them. If a version is not specified,the agent is updated to the latest version.
Count Counts to keep track of number of requests from the group.
Deploy group The collection of host names of different computers or other deploygroups that the agents are deployed to. The deploy group will have a deployname.
Deploy group name The name of the group containing the collection of hostnames of different computers or other deploy groups that the agents are deployedto.
Deploy TEMS The through node or the remote Tivoli Enterprise MonitoringServer that the agent is being deployed from.
GlobalTimeStamp The most recent update at the hub Tivoli Enterprise MonitoringServer to the deployment status for the transaction time. The GlobalTimeStampattribute indicates the last time any information was updated for the deploycommand, which is used for EIB probe completion.
Group Transaction ID The identifying number that is assigned to a grouptransaction. This value allows you to see the transactions involved in the samecommand. It is the amef value.
lstdate timestamp The last time the record for the deploy command (row in thetable) was changed. The lstdate timestamp attribute displays the last time anyinformation update made. The files have been installed and the agent isconfigured; the row in the table is inserted once the command is complete.
NodeId The agent name and platform (separated by a colon). The nodeId and thetarget managed system name are similar.
Platform Version The operating platform of the target computer for the agentinstall. For example, WinNt.
Processing State The state of the deploy command, from pre-deployment topost-installation. The state is indicated with an integer.
Product ID The product code of the agent.
420 IBM Tivoli Monitoring: Tivoli Enterprise Portal User's Guide
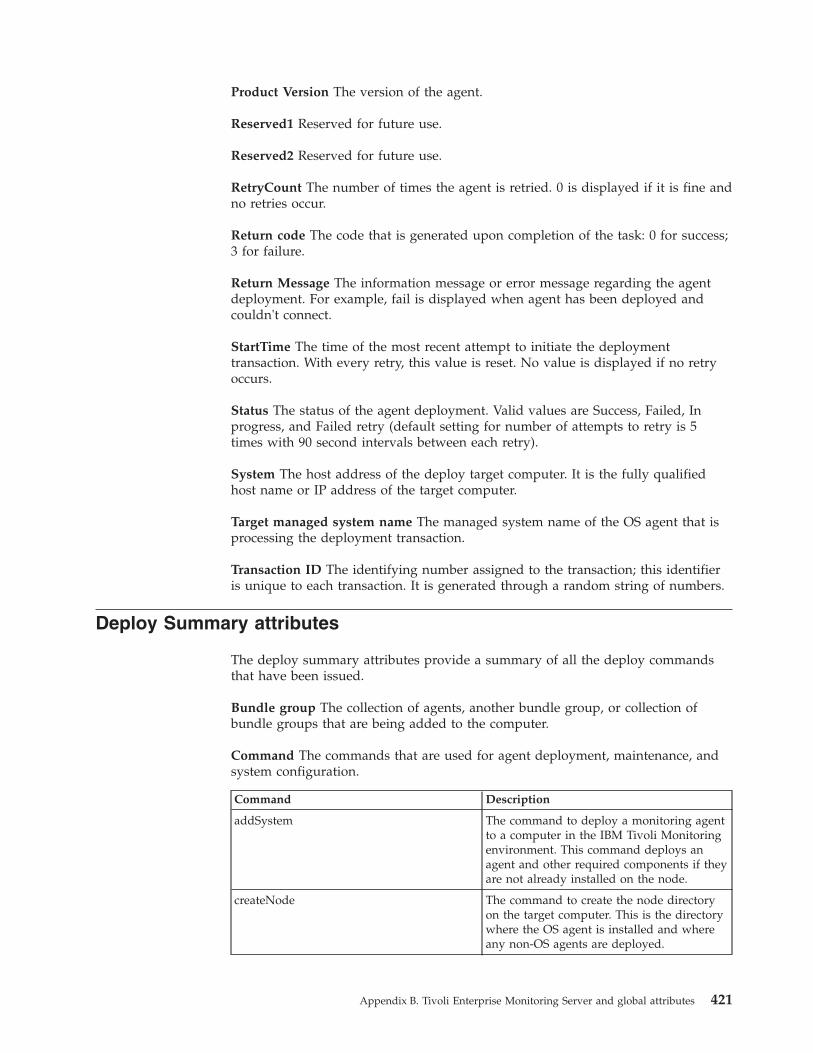
Product Version The version of the agent.
Reserved1 Reserved for future use.
Reserved2 Reserved for future use.
RetryCount The number of times the agent is retried. 0 is displayed if it is fine andno retries occur.
Return code The code that is generated upon completion of the task: 0 for success;3 for failure.
Return Message The information message or error message regarding the agentdeployment. For example, fail is displayed when agent has been deployed andcouldn't connect.
StartTime The time of the most recent attempt to initiate the deploymenttransaction. With every retry, this value is reset. No value is displayed if no retryoccurs.
Status The status of the agent deployment. Valid values are Success, Failed, Inprogress, and Failed retry (default setting for number of attempts to retry is 5times with 90 second intervals between each retry).
System The host address of the deploy target computer. It is the fully qualifiedhost name or IP address of the target computer.
Target managed system name The managed system name of the OS agent that isprocessing the deployment transaction.
Transaction ID The identifying number assigned to the transaction; this identifieris unique to each transaction. It is generated through a random string of numbers.
Deploy Summary attributes
The deploy summary attributes provide a summary of all the deploy commandsthat have been issued.
Bundle group The collection of agents, another bundle group, or collection ofbundle groups that are being added to the computer.
Command The commands that are used for agent deployment, maintenance, andsystem configuration.
Command Description
addSystem The command to deploy a monitoring agentto a computer in the IBM Tivoli Monitoringenvironment. This command deploys anagent and other required components if theyare not already installed on the node.
createNode The command to create the node directoryon the target computer. This is the directorywhere the OS agent is installed and whereany non-OS agents are deployed.
Appendix B. Tivoli Enterprise Monitoring Server and global attributes 421
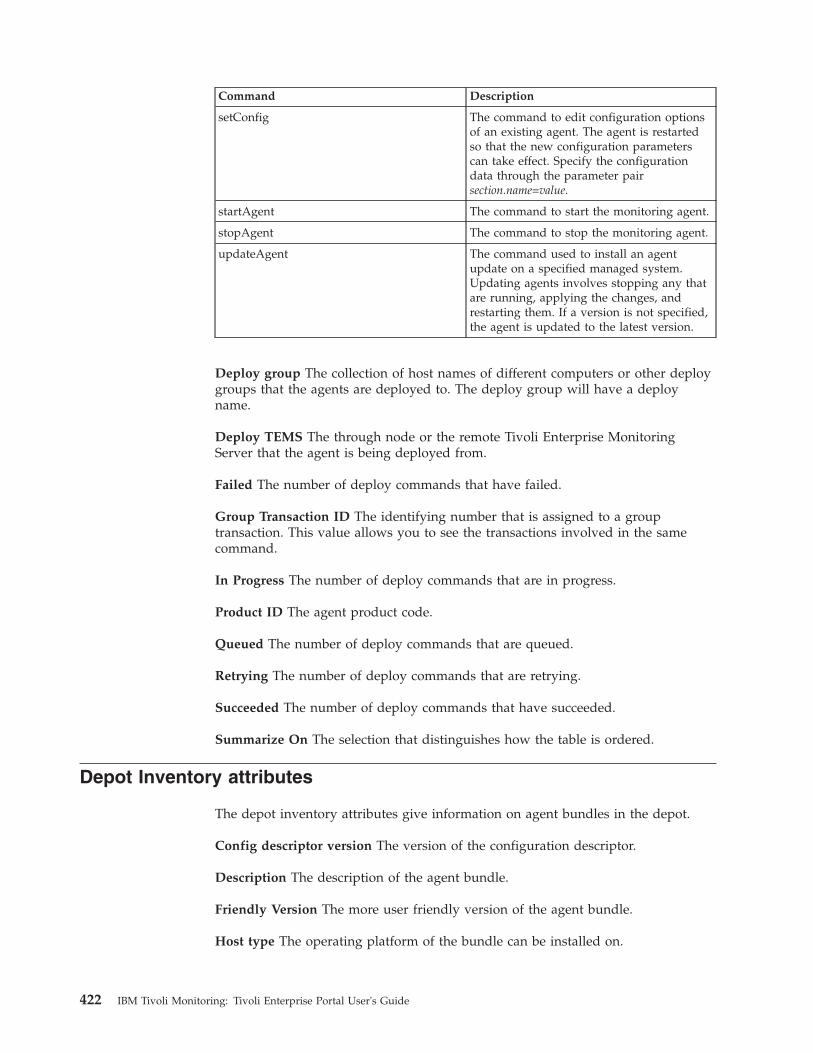
Command Description
setConfig The command to edit configuration optionsof an existing agent. The agent is restartedso that the new configuration parameterscan take effect. Specify the configurationdata through the parameter pairsection.name=value.
startAgent The command to start the monitoring agent.
stopAgent The command to stop the monitoring agent.
updateAgent The command used to install an agentupdate on a specified managed system.Updating agents involves stopping any thatare running, applying the changes, andrestarting them. If a version is not specified,the agent is updated to the latest version.
Deploy group The collection of host names of different computers or other deploygroups that the agents are deployed to. The deploy group will have a deployname.
Deploy TEMS The through node or the remote Tivoli Enterprise MonitoringServer that the agent is being deployed from.
Failed The number of deploy commands that have failed.
Group Transaction ID The identifying number that is assigned to a grouptransaction. This value allows you to see the transactions involved in the samecommand.
In Progress The number of deploy commands that are in progress.
Product ID The agent product code.
Queued The number of deploy commands that are queued.
Retrying The number of deploy commands that are retrying.
Succeeded The number of deploy commands that have succeeded.
Summarize On The selection that distinguishes how the table is ordered.
Depot Inventory attributes
The depot inventory attributes give information on agent bundles in the depot.
Config descriptor version The version of the configuration descriptor.
Description The description of the agent bundle.
Friendly Version The more user friendly version of the agent bundle.
Host type The operating platform of the bundle can be installed on.
422 IBM Tivoli Monitoring: Tivoli Enterprise Portal User's Guide
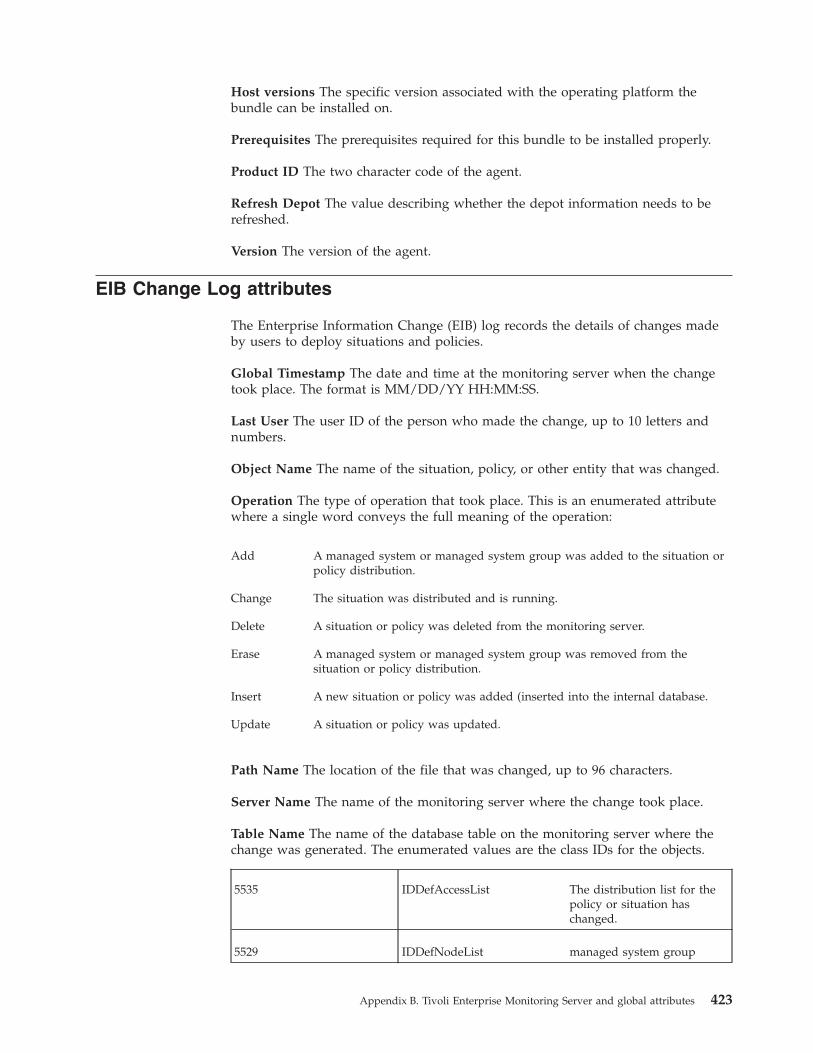
Host versions The specific version associated with the operating platform thebundle can be installed on.
Prerequisites The prerequisites required for this bundle to be installed properly.
Product ID The two character code of the agent.
Refresh Depot The value describing whether the depot information needs to berefreshed.
Version The version of the agent.
EIB Change Log attributes
The Enterprise Information Change (EIB) log records the details of changes madeby users to deploy situations and policies.
Global Timestamp The date and time at the monitoring server when the changetook place. The format is MM/DD/YY HH:MM:SS.
Last User The user ID of the person who made the change, up to 10 letters andnumbers.
Object Name The name of the situation, policy, or other entity that was changed.
Operation The type of operation that took place. This is an enumerated attributewhere a single word conveys the full meaning of the operation:
Add A managed system or managed system group was added to the situation orpolicy distribution.
Change The situation was distributed and is running.
Delete A situation or policy was deleted from the monitoring server.
Erase A managed system or managed system group was removed from thesituation or policy distribution.
Insert A new situation or policy was added (inserted into the internal database.
Update A situation or policy was updated.
Path Name The location of the file that was changed, up to 96 characters.
Server Name The name of the monitoring server where the change took place.
Table Name The name of the database table on the monitoring server where thechange was generated. The enumerated values are the class IDs for the objects.
5535 IDDefAccessList The distribution list for thepolicy or situation haschanged.
5529 IDDefNodeList managed system group
Appendix B. Tivoli Enterprise Monitoring Server and global attributes 423
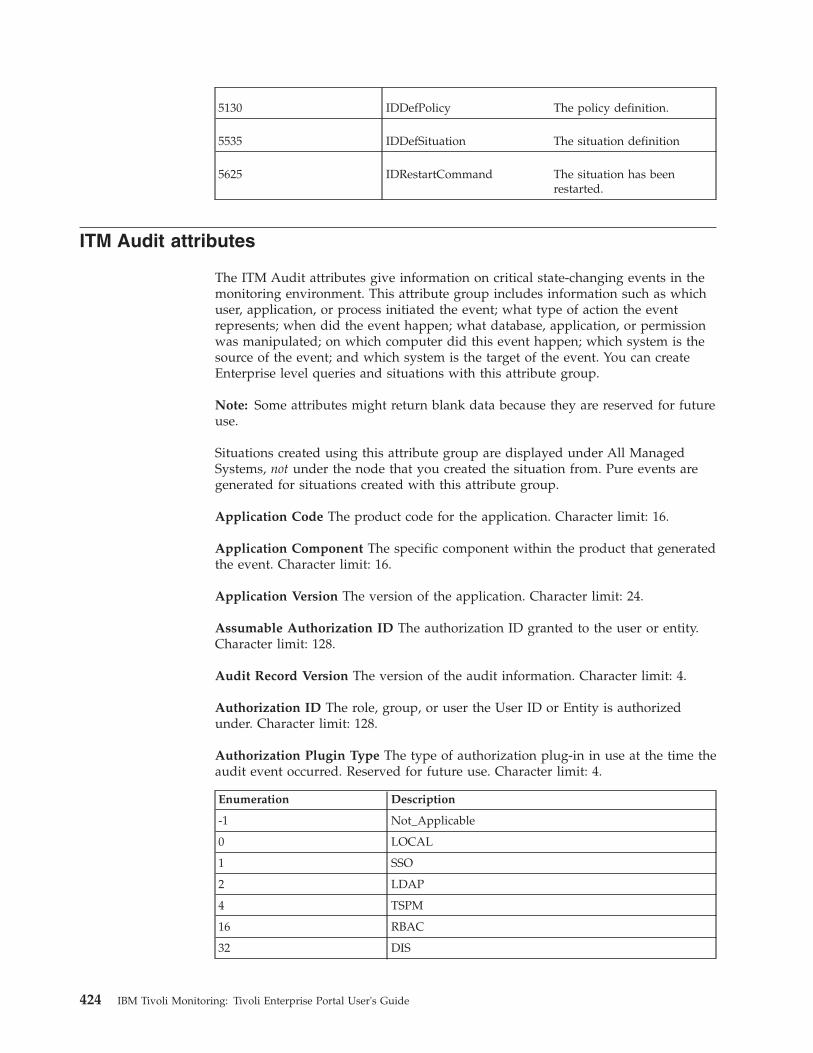
5130 IDDefPolicy The policy definition.
5535 IDDefSituation The situation definition
5625 IDRestartCommand The situation has beenrestarted.
ITM Audit attributes
The ITM Audit attributes give information on critical state-changing events in themonitoring environment. This attribute group includes information such as whichuser, application, or process initiated the event; what type of action the eventrepresents; when did the event happen; what database, application, or permissionwas manipulated; on which computer did this event happen; which system is thesource of the event; and which system is the target of the event. You can createEnterprise level queries and situations with this attribute group.
Note: Some attributes might return blank data because they are reserved for futureuse.
Situations created using this attribute group are displayed under All ManagedSystems, not under the node that you created the situation from. Pure events aregenerated for situations created with this attribute group.
Application Code The product code for the application. Character limit: 16.
Application Component The specific component within the product that generatedthe event. Character limit: 16.
Application Version The version of the application. Character limit: 24.
Assumable Authorization ID The authorization ID granted to the user or entity.Character limit: 128.
Audit Record Version The version of the audit information. Character limit: 4.
Authorization ID The role, group, or user the User ID or Entity is authorizedunder. Character limit: 128.
Authorization Plugin Type The type of authorization plug-in in use at the time theaudit event occurred. Reserved for future use. Character limit: 4.
Enumeration Description
-1 Not_Applicable
0 LOCAL
1 SSO
2 LDAP
4 TSPM
16 RBAC
32 DIS
424 IBM Tivoli Monitoring: Tivoli Enterprise Portal User's Guide
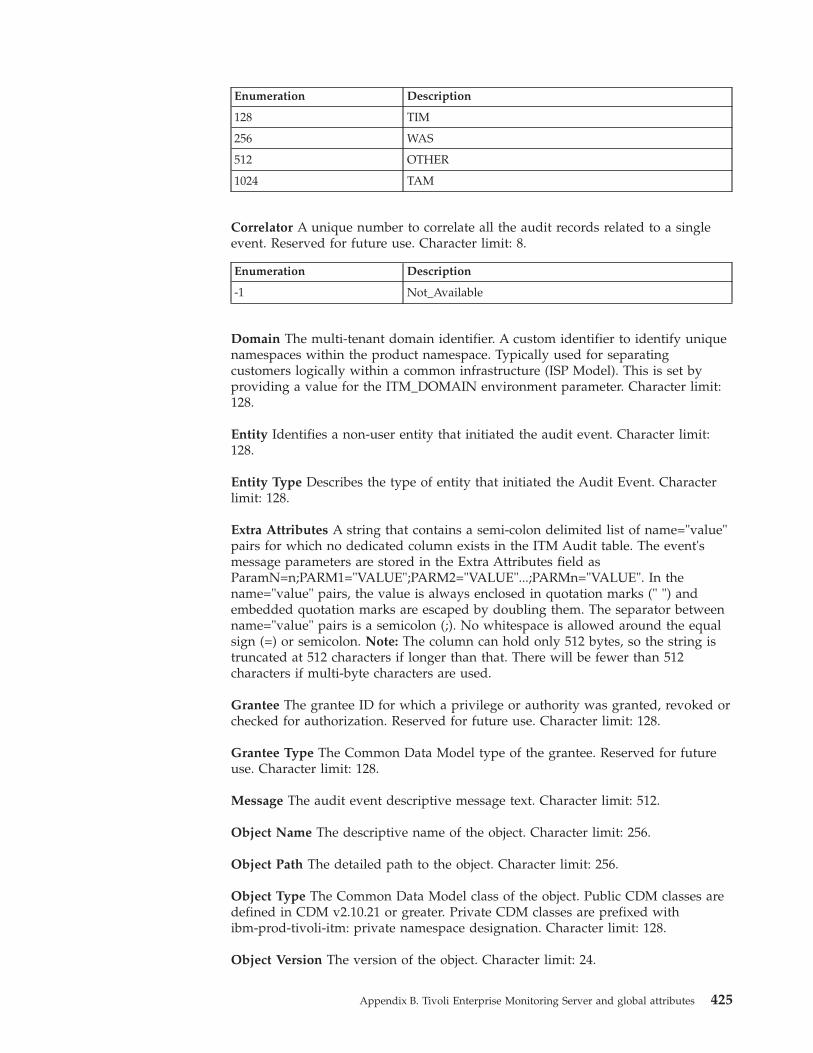
Enumeration Description
128 TIM
256 WAS
512 OTHER
1024 TAM
Correlator A unique number to correlate all the audit records related to a singleevent. Reserved for future use. Character limit: 8.
Enumeration Description
-1 Not_Available
Domain The multi-tenant domain identifier. A custom identifier to identify uniquenamespaces within the product namespace. Typically used for separatingcustomers logically within a common infrastructure (ISP Model). This is set byproviding a value for the ITM_DOMAIN environment parameter. Character limit:128.
Entity Identifies a non-user entity that initiated the audit event. Character limit:128.
Entity Type Describes the type of entity that initiated the Audit Event. Characterlimit: 128.
Extra Attributes A string that contains a semi-colon delimited list of name="value"pairs for which no dedicated column exists in the ITM Audit table. The event'smessage parameters are stored in the Extra Attributes field asParamN=n;PARM1="VALUE";PARM2="VALUE"...;PARMn="VALUE". In thename="value" pairs, the value is always enclosed in quotation marks (" ") andembedded quotation marks are escaped by doubling them. The separator betweenname="value" pairs is a semicolon (;). No whitespace is allowed around the equalsign (=) or semicolon. Note: The column can hold only 512 bytes, so the string istruncated at 512 characters if longer than that. There will be fewer than 512characters if multi-byte characters are used.
Grantee The grantee ID for which a privilege or authority was granted, revoked orchecked for authorization. Reserved for future use. Character limit: 128.
Grantee Type The Common Data Model type of the grantee. Reserved for futureuse. Character limit: 128.
Message The audit event descriptive message text. Character limit: 512.
Object Name The descriptive name of the object. Character limit: 256.
Object Path The detailed path to the object. Character limit: 256.
Object Type The Common Data Model class of the object. Public CDM classes aredefined in CDM v2.10.21 or greater. Private CDM classes are prefixed withibm-prod-tivoli-itm: private namespace designation. Character limit: 128.
Object Version The version of the object. Character limit: 24.
Appendix B. Tivoli Enterprise Monitoring Server and global attributes 425
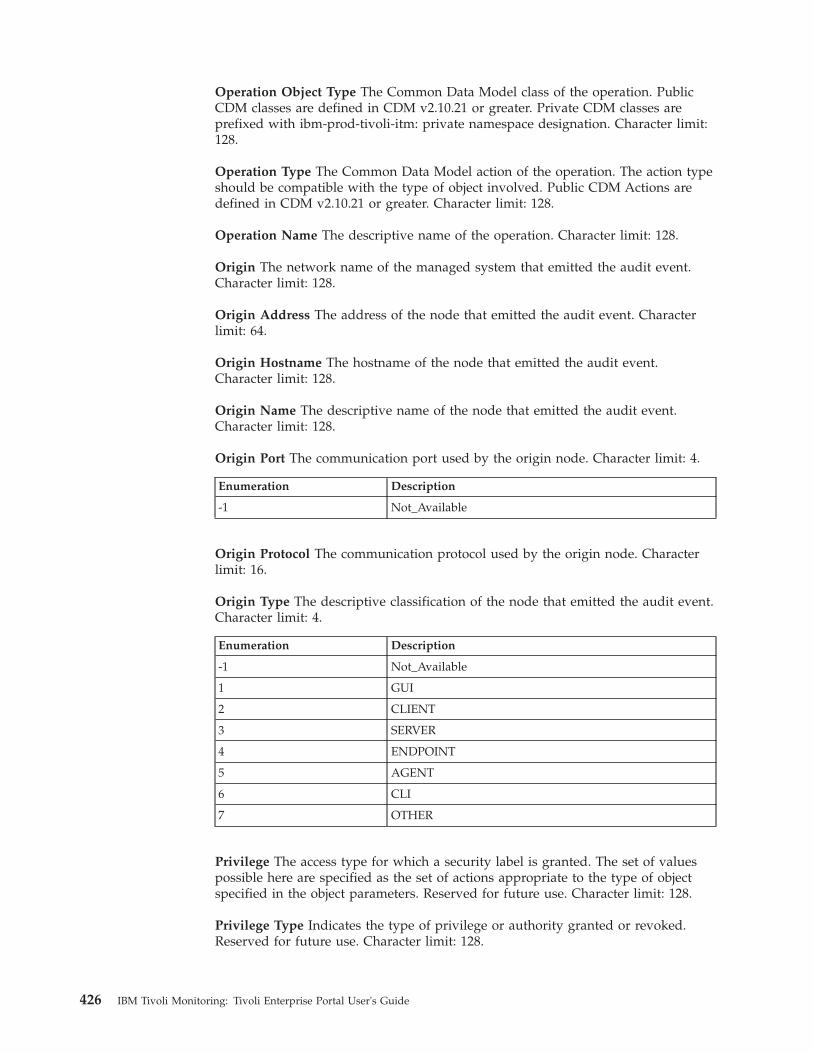
Operation Object Type The Common Data Model class of the operation. PublicCDM classes are defined in CDM v2.10.21 or greater. Private CDM classes areprefixed with ibm-prod-tivoli-itm: private namespace designation. Character limit:128.
Operation Type The Common Data Model action of the operation. The action typeshould be compatible with the type of object involved. Public CDM Actions aredefined in CDM v2.10.21 or greater. Character limit: 128.
Operation Name The descriptive name of the operation. Character limit: 128.
Origin The network name of the managed system that emitted the audit event.Character limit: 128.
Origin Address The address of the node that emitted the audit event. Characterlimit: 64.
Origin Hostname The hostname of the node that emitted the audit event.Character limit: 128.
Origin Name The descriptive name of the node that emitted the audit event.Character limit: 128.
Origin Port The communication port used by the origin node. Character limit: 4.
Enumeration Description
-1 Not_Available
Origin Protocol The communication protocol used by the origin node. Characterlimit: 16.
Origin Type The descriptive classification of the node that emitted the audit event.Character limit: 4.
Enumeration Description
-1 Not_Available
1 GUI
2 CLIENT
3 SERVER
4 ENDPOINT
5 AGENT
6 CLI
7 OTHER
Privilege The access type for which a security label is granted. The set of valuespossible here are specified as the set of actions appropriate to the type of objectspecified in the object parameters. Reserved for future use. Character limit: 128.
Privilege Type Indicates the type of privilege or authority granted or revoked.Reserved for future use. Character limit: 128.
426 IBM Tivoli Monitoring: Tivoli Enterprise Portal User's Guide
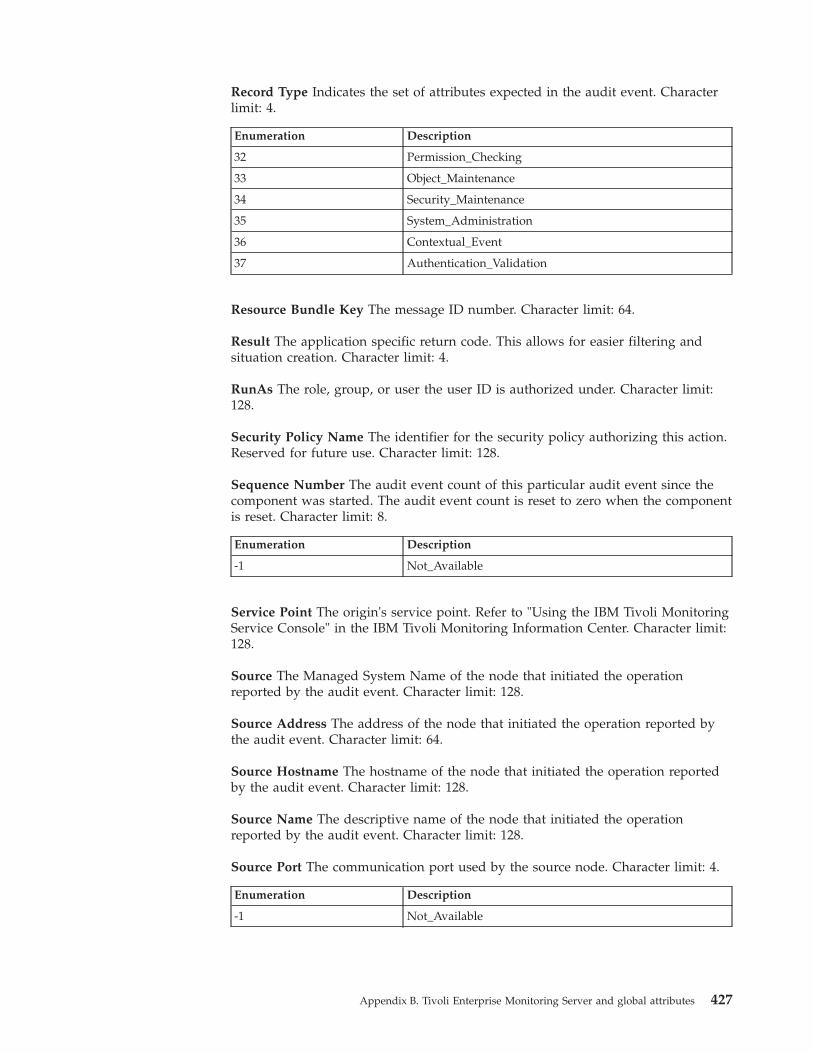
Record Type Indicates the set of attributes expected in the audit event. Characterlimit: 4.
Enumeration Description
32 Permission_Checking
33 Object_Maintenance
34 Security_Maintenance
35 System_Administration
36 Contextual_Event
37 Authentication_Validation
Resource Bundle Key The message ID number. Character limit: 64.
Result The application specific return code. This allows for easier filtering andsituation creation. Character limit: 4.
RunAs The role, group, or user the user ID is authorized under. Character limit:128.
Security Policy Name The identifier for the security policy authorizing this action.Reserved for future use. Character limit: 128.
Sequence Number The audit event count of this particular audit event since thecomponent was started. The audit event count is reset to zero when the componentis reset. Character limit: 8.
Enumeration Description
-1 Not_Available
Service Point The origin's service point. Refer to "Using the IBM Tivoli MonitoringService Console" in the IBM Tivoli Monitoring Information Center. Character limit:128.
Source The Managed System Name of the node that initiated the operationreported by the audit event. Character limit: 128.
Source Address The address of the node that initiated the operation reported bythe audit event. Character limit: 64.
Source Hostname The hostname of the node that initiated the operation reportedby the audit event. Character limit: 128.
Source Name The descriptive name of the node that initiated the operationreported by the audit event. Character limit: 128.
Source Port The communication port used by the source node. Character limit: 4.
Enumeration Description
-1 Not_Available
Appendix B. Tivoli Enterprise Monitoring Server and global attributes 427
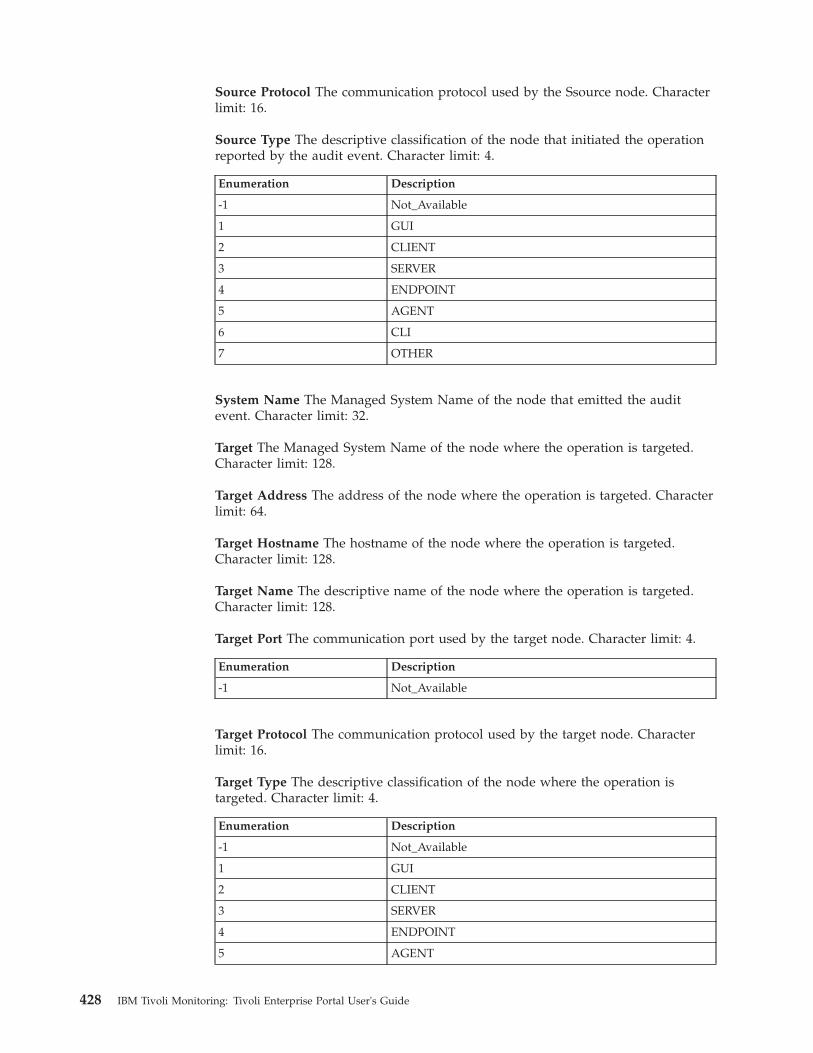
Source Protocol The communication protocol used by the Ssource node. Characterlimit: 16.
Source Type The descriptive classification of the node that initiated the operationreported by the audit event. Character limit: 4.
Enumeration Description
-1 Not_Available
1 GUI
2 CLIENT
3 SERVER
4 ENDPOINT
5 AGENT
6 CLI
7 OTHER
System Name The Managed System Name of the node that emitted the auditevent. Character limit: 32.
Target The Managed System Name of the node where the operation is targeted.Character limit: 128.
Target Address The address of the node where the operation is targeted. Characterlimit: 64.
Target Hostname The hostname of the node where the operation is targeted.Character limit: 128.
Target Name The descriptive name of the node where the operation is targeted.Character limit: 128.
Target Port The communication port used by the target node. Character limit: 4.
Enumeration Description
-1 Not_Available
Target Protocol The communication protocol used by the target node. Characterlimit: 16.
Target Type The descriptive classification of the node where the operation istargeted. Character limit: 4.
Enumeration Description
-1 Not_Available
1 GUI
2 CLIENT
3 SERVER
4 ENDPOINT
5 AGENT
428 IBM Tivoli Monitoring: Tivoli Enterprise Portal User's Guide
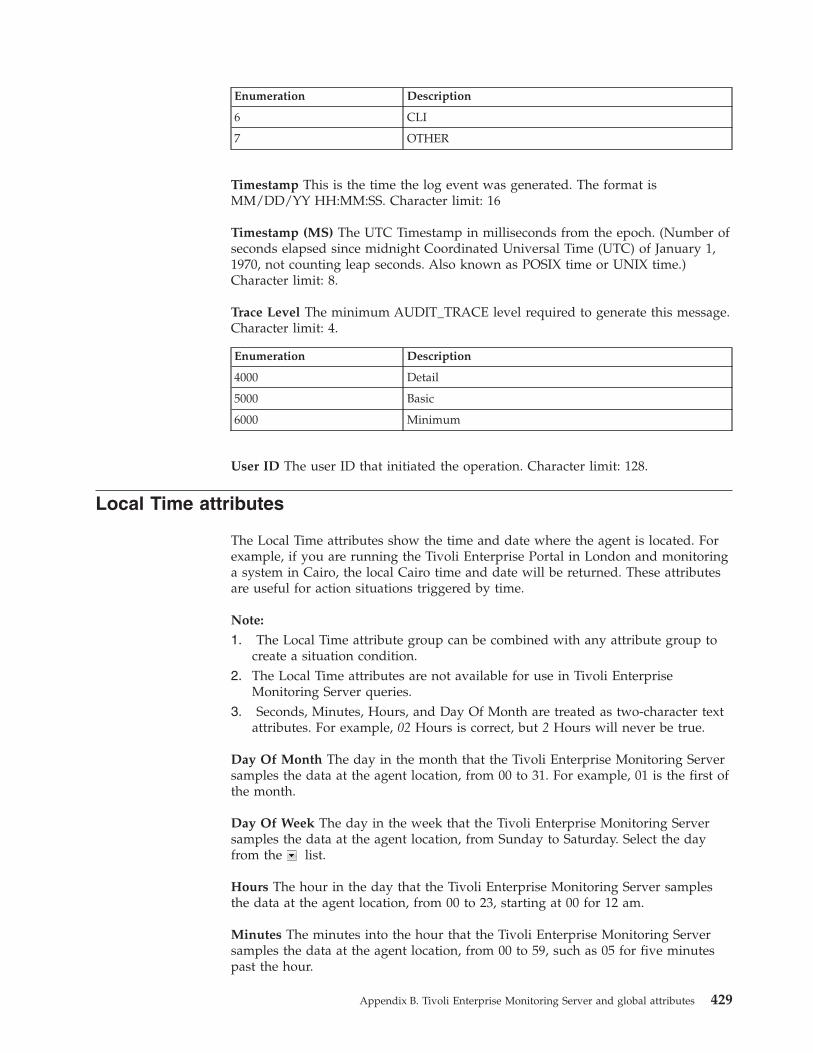
Enumeration Description
6 CLI
7 OTHER
Timestamp This is the time the log event was generated. The format isMM/DD/YY HH:MM:SS. Character limit: 16
Timestamp (MS) The UTC Timestamp in milliseconds from the epoch. (Number ofseconds elapsed since midnight Coordinated Universal Time (UTC) of January 1,1970, not counting leap seconds. Also known as POSIX time or UNIX time.)Character limit: 8.
Trace Level The minimum AUDIT_TRACE level required to generate this message.Character limit: 4.
Enumeration Description
4000 Detail
5000 Basic
6000 Minimum
User ID The user ID that initiated the operation. Character limit: 128.
Local Time attributes
The Local Time attributes show the time and date where the agent is located. Forexample, if you are running the Tivoli Enterprise Portal in London and monitoringa system in Cairo, the local Cairo time and date will be returned. These attributesare useful for action situations triggered by time.
Note:
1. The Local Time attribute group can be combined with any attribute group tocreate a situation condition.
2. The Local Time attributes are not available for use in Tivoli EnterpriseMonitoring Server queries.
3. Seconds, Minutes, Hours, and Day Of Month are treated as two-character textattributes. For example, 02 Hours is correct, but 2 Hours will never be true.
Day Of Month The day in the month that the Tivoli Enterprise Monitoring Serversamples the data at the agent location, from 00 to 31. For example, 01 is the first ofthe month.
Day Of Week The day in the week that the Tivoli Enterprise Monitoring Serversamples the data at the agent location, from Sunday to Saturday. Select the dayfrom the list.
Hours The hour in the day that the Tivoli Enterprise Monitoring Server samplesthe data at the agent location, from 00 to 23, starting at 00 for 12 am.
Minutes The minutes into the hour that the Tivoli Enterprise Monitoring Serversamples the data at the agent location, from 00 to 59, such as 05 for five minutespast the hour.
Appendix B. Tivoli Enterprise Monitoring Server and global attributes 429
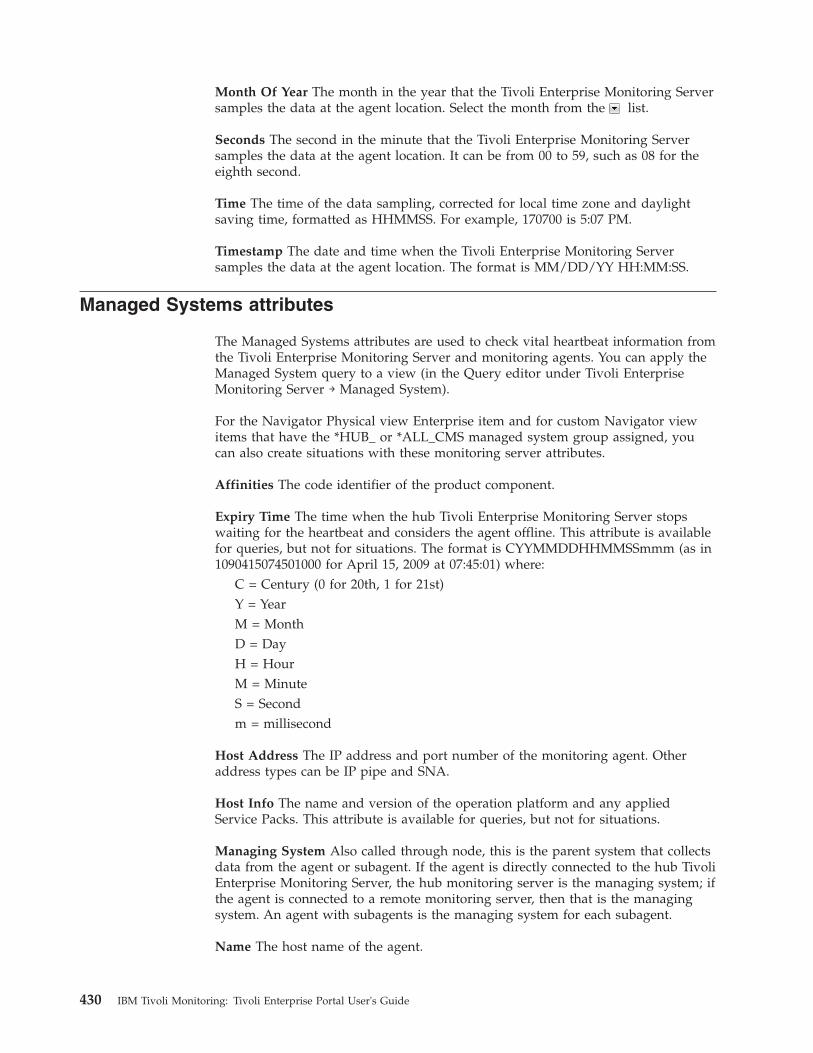
Month Of Year The month in the year that the Tivoli Enterprise Monitoring Serversamples the data at the agent location. Select the month from the list.
Seconds The second in the minute that the Tivoli Enterprise Monitoring Serversamples the data at the agent location. It can be from 00 to 59, such as 08 for theeighth second.
Time The time of the data sampling, corrected for local time zone and daylightsaving time, formatted as HHMMSS. For example, 170700 is 5:07 PM.
Timestamp The date and time when the Tivoli Enterprise Monitoring Serversamples the data at the agent location. The format is MM/DD/YY HH:MM:SS.
Managed Systems attributes
The Managed Systems attributes are used to check vital heartbeat information fromthe Tivoli Enterprise Monitoring Server and monitoring agents. You can apply theManaged System query to a view (in the Query editor under Tivoli EnterpriseMonitoring Server → Managed System).
For the Navigator Physical view Enterprise item and for custom Navigator viewitems that have the *HUB_ or *ALL_CMS managed system group assigned, youcan also create situations with these monitoring server attributes.
Affinities The code identifier of the product component.
Expiry Time The time when the hub Tivoli Enterprise Monitoring Server stopswaiting for the heartbeat and considers the agent offline. This attribute is availablefor queries, but not for situations. The format is CYYMMDDHHMMSSmmm (as in1090415074501000 for April 15, 2009 at 07:45:01) where:
C = Century (0 for 20th, 1 for 21st)Y = YearM = MonthD = DayH = HourM = MinuteS = Secondm = millisecond
Host Address The IP address and port number of the monitoring agent. Otheraddress types can be IP pipe and SNA.
Host Info The name and version of the operation platform and any appliedService Packs. This attribute is available for queries, but not for situations.
Managing System Also called through node, this is the parent system that collectsdata from the agent or subagent. If the agent is directly connected to the hub TivoliEnterprise Monitoring Server, the hub monitoring server is the managing system; ifthe agent is connected to a remote monitoring server, then that is the managingsystem. An agent with subagents is the managing system for each subagent.
Name The host name of the agent.
430 IBM Tivoli Monitoring: Tivoli Enterprise Portal User's Guide
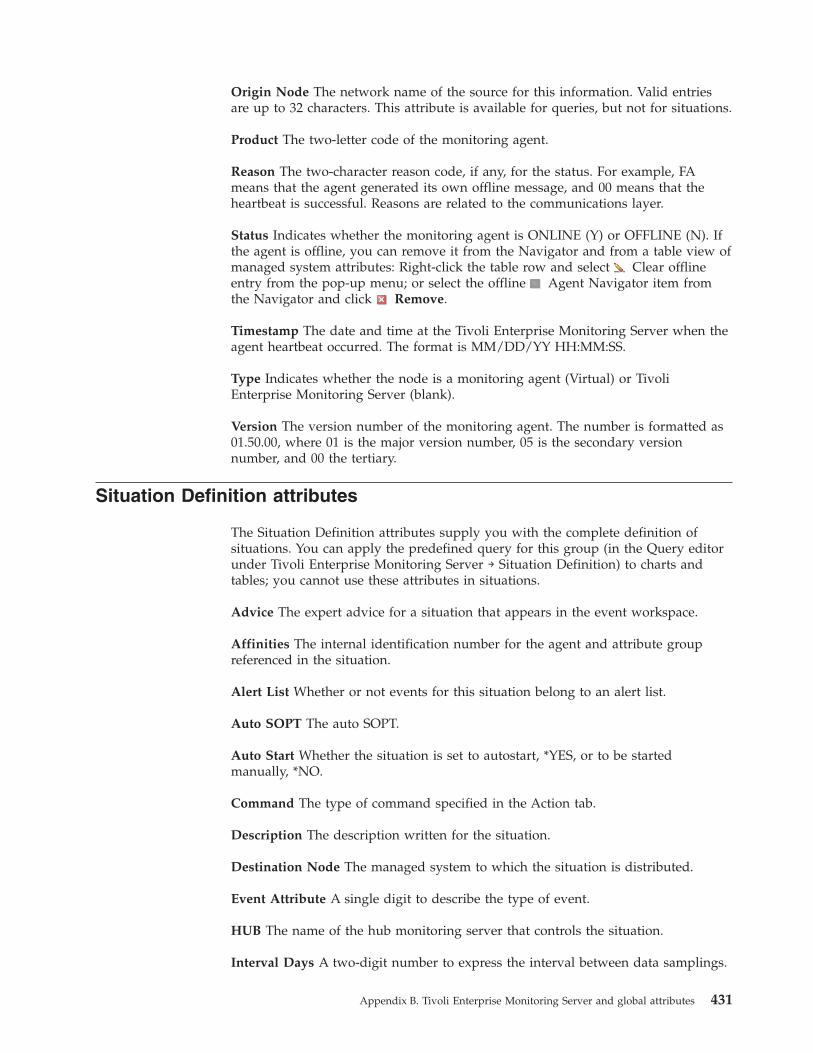
Origin Node The network name of the source for this information. Valid entriesare up to 32 characters. This attribute is available for queries, but not for situations.
Product The two-letter code of the monitoring agent.
Reason The two-character reason code, if any, for the status. For example, FAmeans that the agent generated its own offline message, and 00 means that theheartbeat is successful. Reasons are related to the communications layer.
Status Indicates whether the monitoring agent is ONLINE (Y) or OFFLINE (N). Ifthe agent is offline, you can remove it from the Navigator and from a table view ofmanaged system attributes: Right-click the table row and select Clear offlineentry from the pop-up menu; or select the offline Agent Navigator item fromthe Navigator and click Remove.
Timestamp The date and time at the Tivoli Enterprise Monitoring Server when theagent heartbeat occurred. The format is MM/DD/YY HH:MM:SS.
Type Indicates whether the node is a monitoring agent (Virtual) or TivoliEnterprise Monitoring Server (blank).
Version The version number of the monitoring agent. The number is formatted as01.50.00, where 01 is the major version number, 05 is the secondary versionnumber, and 00 the tertiary.
Situation Definition attributes
The Situation Definition attributes supply you with the complete definition ofsituations. You can apply the predefined query for this group (in the Query editorunder Tivoli Enterprise Monitoring Server → Situation Definition) to charts andtables; you cannot use these attributes in situations.
Advice The expert advice for a situation that appears in the event workspace.
Affinities The internal identification number for the agent and attribute groupreferenced in the situation.
Alert List Whether or not events for this situation belong to an alert list.
Auto SOPT The auto SOPT.
Auto Start Whether the situation is set to autostart, *YES, or to be startedmanually, *NO.
Command The type of command specified in the Action tab.
Description The description written for the situation.
Destination Node The managed system to which the situation is distributed.
Event Attribute A single digit to describe the type of event.
HUB The name of the hub monitoring server that controls the situation.
Interval Days A two-digit number to express the interval between data samplings.
Appendix B. Tivoli Enterprise Monitoring Server and global attributes 431
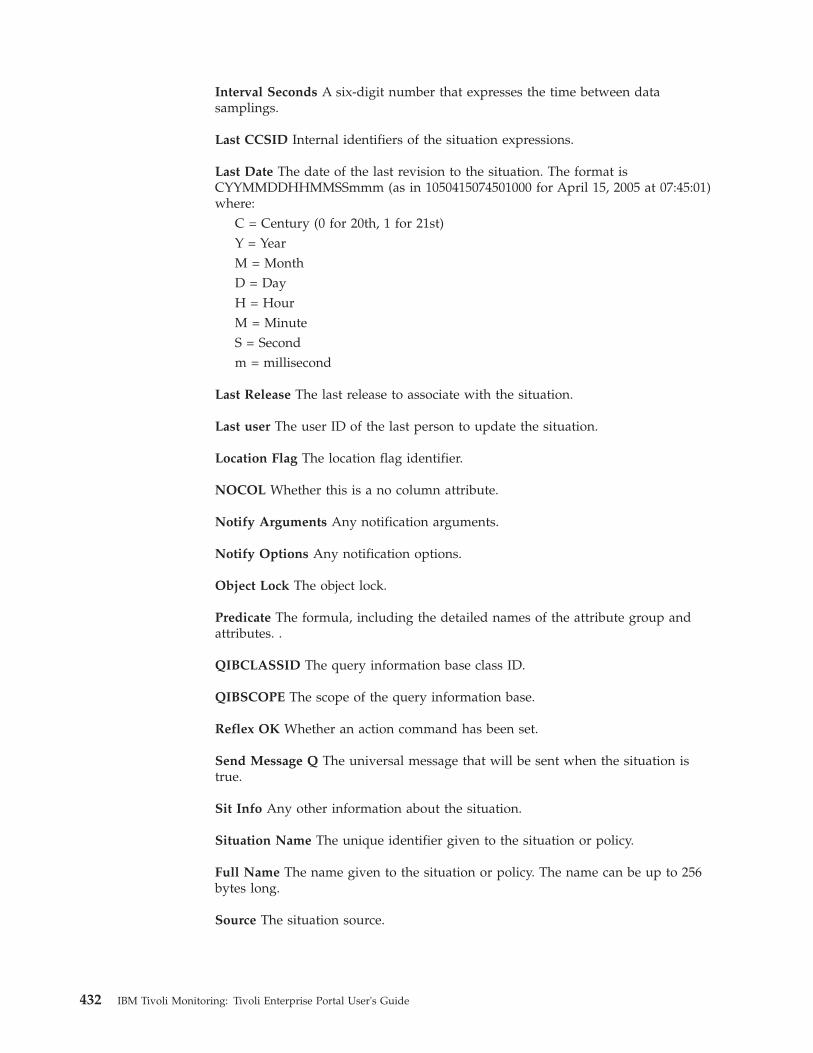
Interval Seconds A six-digit number that expresses the time between datasamplings.
Last CCSID Internal identifiers of the situation expressions.
Last Date The date of the last revision to the situation. The format isCYYMMDDHHMMSSmmm (as in 1050415074501000 for April 15, 2005 at 07:45:01)where:
C = Century (0 for 20th, 1 for 21st)Y = YearM = MonthD = DayH = HourM = MinuteS = Secondm = millisecond
Last Release The last release to associate with the situation.
Last user The user ID of the last person to update the situation.
Location Flag The location flag identifier.
NOCOL Whether this is a no column attribute.
Notify Arguments Any notification arguments.
Notify Options Any notification options.
Object Lock The object lock.
Predicate The formula, including the detailed names of the attribute group andattributes. .
QIBCLASSID The query information base class ID.
QIBSCOPE The scope of the query information base.
Reflex OK Whether an action command has been set.
Send Message Q The universal message that will be sent when the situation istrue.
Sit Info Any other information about the situation.
Situation Name The unique identifier given to the situation or policy.
Full Name The name given to the situation or policy. The name can be up to 256bytes long.
Source The situation source.
432 IBM Tivoli Monitoring: Tivoli Enterprise Portal User's Guide
Situation State Event attributes
The Situation Event attributes collect status information on situation events. Viewsthat display this information include My Acknowledged Events, Selected Event,and Similar Events and comprise some of the predefined workspaces for theEnterprise Navigator item.
Affinities The affinity identifier.
Close Indicator The close indicator for conveying how the event was closed, suchas closed by a user or by a process and whether the event record contains notes.
Close Time Not in use. The time at the hub monitoring server when the event wasclosed.
Display Item For multiple-row attribute groups, enables the situation to continuesampling rows with a different display item than the one that caused the situationto become true.
Expiration Interval The length of time assigned to keep an acknowledgement openbefore it expires automatically. Valid values are four digits.
Expiration Time The time that the acknowledgement is scheduled to expire. Validvalues follow the MM/DD/YY HH:MM:SS format, as in 12/30/08 23:59:59.
Full Name The name given to the situation.
Group ID The identifier for the group that the situation belongs to.
HUBCMS The hub monitoring server that the portal server connects to.
Impact The name of the Navigator item where the event originated.
Last Update Time The time of the last event activity, either the last user action or asignificant system-generated action.
Local Timestamp The time the event occurred or the condition was observed bythe originating managed system. The format is MM/DD/YY HH:MM:SS, as in10/14/08 13:45:35 for October 14, 2008 at 1:45:35 PM.
LocFlag Not in use. The location flag.
Misc Not in use. Miscellaneous event data.
MOBJ The Navigator item the situation is associated with (where the eventindicator originates).
Node The name of the monitoring server where the situation is running.
Opened The time at the managed system when the situation status changed.
Owner The user ID of the person who owns this event.
Pathname Not in use. The path to any attachments and saved notes.
Appendix B. Tivoli Enterprise Monitoring Server and global attributes 433
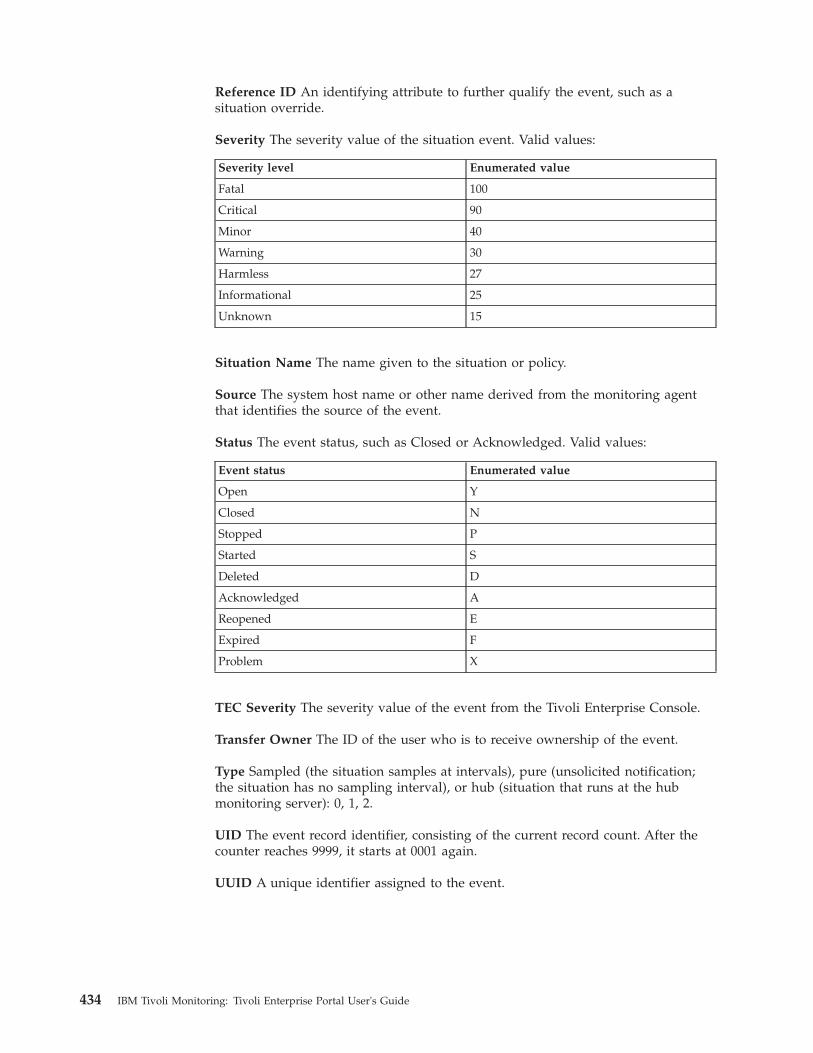
Reference ID An identifying attribute to further qualify the event, such as asituation override.
Severity The severity value of the situation event. Valid values:
Severity level Enumerated value
Fatal 100
Critical 90
Minor 40
Warning 30
Harmless 27
Informational 25
Unknown 15
Situation Name The name given to the situation or policy.
Source The system host name or other name derived from the monitoring agentthat identifies the source of the event.
Status The event status, such as Closed or Acknowledged. Valid values:
Event status Enumerated value
Open Y
Closed N
Stopped P
Started S
Deleted D
Acknowledged A
Reopened E
Expired F
Problem X
TEC Severity The severity value of the event from the Tivoli Enterprise Console.
Transfer Owner The ID of the user who is to receive ownership of the event.
Type Sampled (the situation samples at intervals), pure (unsolicited notification;the situation has no sampling interval), or hub (situation that runs at the hubmonitoring server): 0, 1, 2.
UID The event record identifier, consisting of the current record count. After thecounter reaches 9999, it starts at 0001 again.
UUID A unique identifier assigned to the event.
434 IBM Tivoli Monitoring: Tivoli Enterprise Portal User's Guide
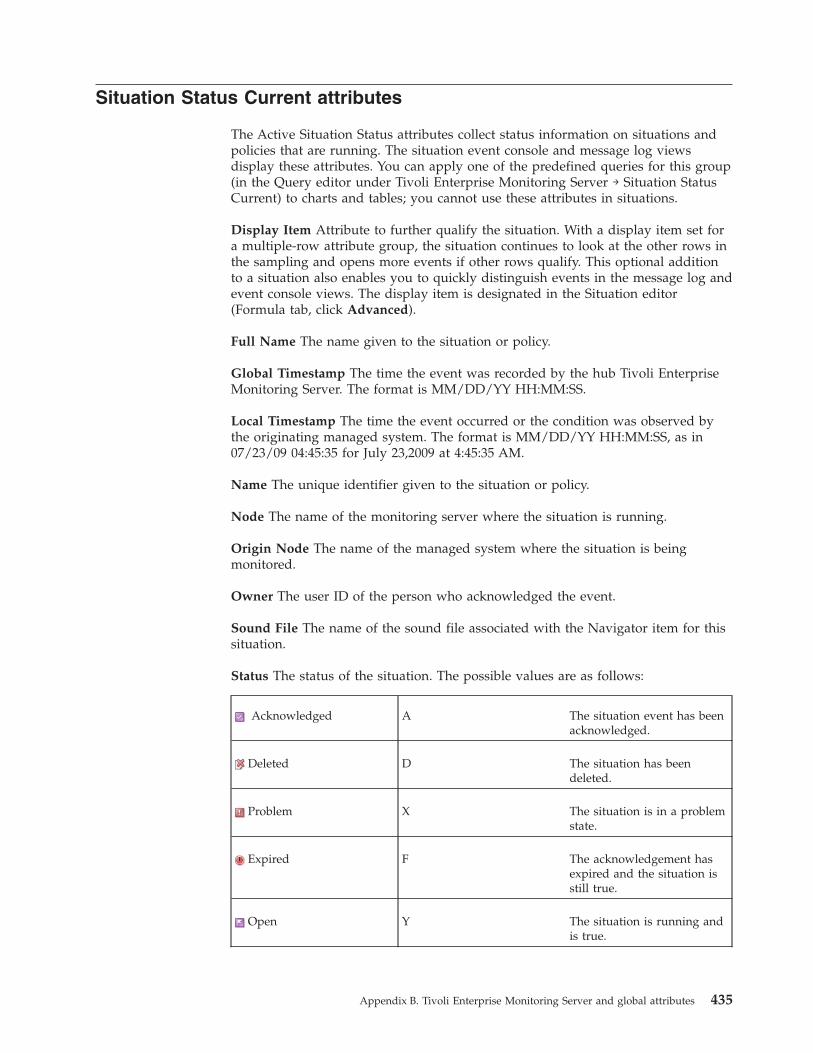
Situation Status Current attributes
The Active Situation Status attributes collect status information on situations andpolicies that are running. The situation event console and message log viewsdisplay these attributes. You can apply one of the predefined queries for this group(in the Query editor under Tivoli Enterprise Monitoring Server → Situation StatusCurrent) to charts and tables; you cannot use these attributes in situations.
Display Item Attribute to further qualify the situation. With a display item set fora multiple-row attribute group, the situation continues to look at the other rows inthe sampling and opens more events if other rows qualify. This optional additionto a situation also enables you to quickly distinguish events in the message log andevent console views. The display item is designated in the Situation editor(Formula tab, click Advanced).
Full Name The name given to the situation or policy.
Global Timestamp The time the event was recorded by the hub Tivoli EnterpriseMonitoring Server. The format is MM/DD/YY HH:MM:SS.
Local Timestamp The time the event occurred or the condition was observed bythe originating managed system. The format is MM/DD/YY HH:MM:SS, as in07/23/09 04:45:35 for July 23,2009 at 4:45:35 AM.
Name The unique identifier given to the situation or policy.
Node The name of the monitoring server where the situation is running.
Origin Node The name of the managed system where the situation is beingmonitored.
Owner The user ID of the person who acknowledged the event.
Sound File The name of the sound file associated with the Navigator item for thissituation.
Status The status of the situation. The possible values are as follows:
Acknowledged A The situation event has beenacknowledged.
Deleted D The situation has beendeleted.
Problem X The situation is in a problemstate.
Expired F The acknowledgement hasexpired and the situation isstill true.
Open Y The situation is running andis true.
Appendix B. Tivoli Enterprise Monitoring Server and global attributes 435
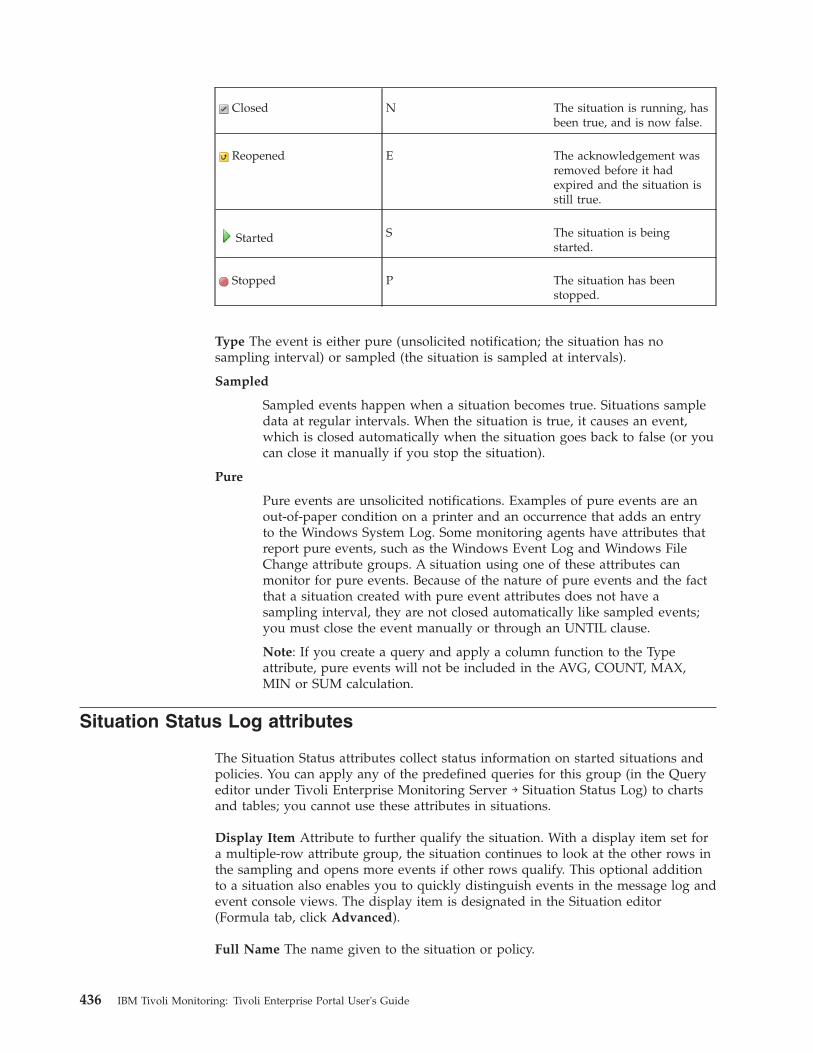
Closed N The situation is running, hasbeen true, and is now false.
Reopened E The acknowledgement wasremoved before it hadexpired and the situation isstill true.
Started S The situation is beingstarted.
Stopped P The situation has beenstopped.
Type The event is either pure (unsolicited notification; the situation has nosampling interval) or sampled (the situation is sampled at intervals).
Sampled
Sampled events happen when a situation becomes true. Situations sampledata at regular intervals. When the situation is true, it causes an event,which is closed automatically when the situation goes back to false (or youcan close it manually if you stop the situation).
Pure
Pure events are unsolicited notifications. Examples of pure events are anout-of-paper condition on a printer and an occurrence that adds an entryto the Windows System Log. Some monitoring agents have attributes thatreport pure events, such as the Windows Event Log and Windows FileChange attribute groups. A situation using one of these attributes canmonitor for pure events. Because of the nature of pure events and the factthat a situation created with pure event attributes does not have asampling interval, they are not closed automatically like sampled events;you must close the event manually or through an UNTIL clause.
Note: If you create a query and apply a column function to the Typeattribute, pure events will not be included in the AVG, COUNT, MAX,MIN or SUM calculation.
Situation Status Log attributes
The Situation Status attributes collect status information on started situations andpolicies. You can apply any of the predefined queries for this group (in the Queryeditor under Tivoli Enterprise Monitoring Server → Situation Status Log) to chartsand tables; you cannot use these attributes in situations.
Display Item Attribute to further qualify the situation. With a display item set fora multiple-row attribute group, the situation continues to look at the other rows inthe sampling and opens more events if other rows qualify. This optional additionto a situation also enables you to quickly distinguish events in the message log andevent console views. The display item is designated in the Situation editor(Formula tab, click Advanced).
Full Name The name given to the situation or policy.
436 IBM Tivoli Monitoring: Tivoli Enterprise Portal User's Guide
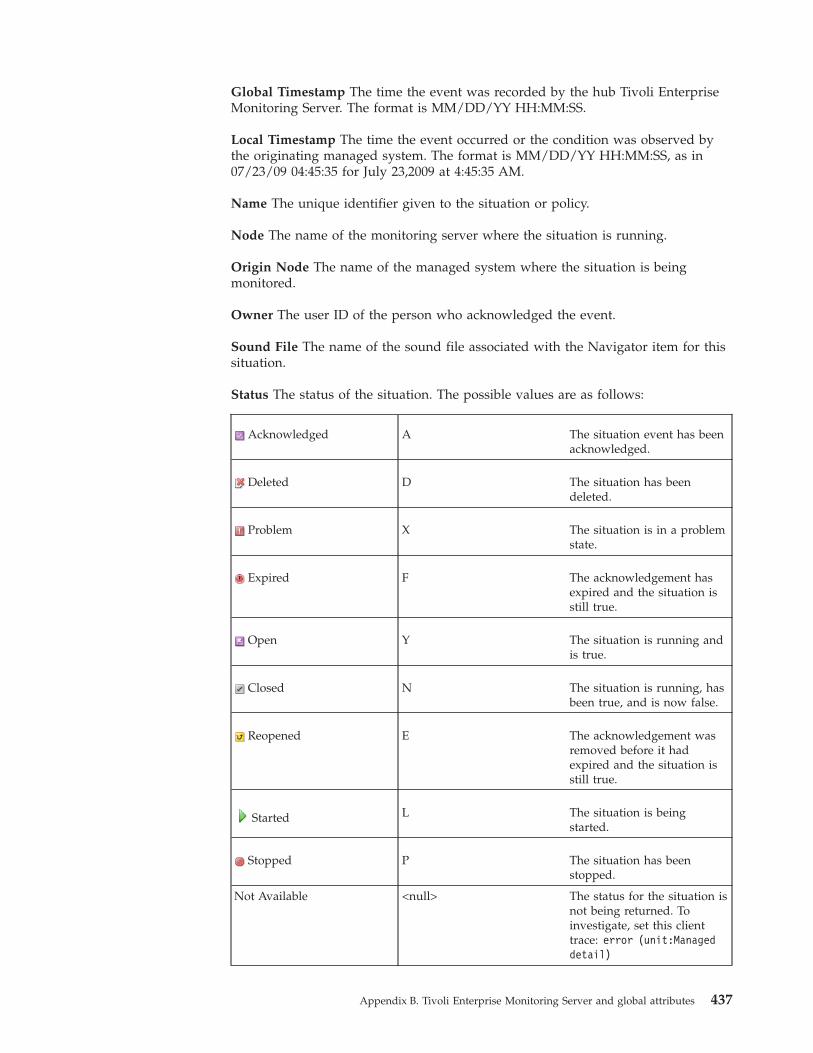
Global Timestamp The time the event was recorded by the hub Tivoli EnterpriseMonitoring Server. The format is MM/DD/YY HH:MM:SS.
Local Timestamp The time the event occurred or the condition was observed bythe originating managed system. The format is MM/DD/YY HH:MM:SS, as in07/23/09 04:45:35 for July 23,2009 at 4:45:35 AM.
Name The unique identifier given to the situation or policy.
Node The name of the monitoring server where the situation is running.
Origin Node The name of the managed system where the situation is beingmonitored.
Owner The user ID of the person who acknowledged the event.
Sound File The name of the sound file associated with the Navigator item for thissituation.
Status The status of the situation. The possible values are as follows:
Acknowledged A The situation event has beenacknowledged.
Deleted D The situation has beendeleted.
Problem X The situation is in a problemstate.
Expired F The acknowledgement hasexpired and the situation isstill true.
Open Y The situation is running andis true.
Closed N The situation is running, hasbeen true, and is now false.
Reopened E The acknowledgement wasremoved before it hadexpired and the situation isstill true.
Started L The situation is beingstarted.
Stopped P The situation has beenstopped.
Not Available <null> The status for the situation isnot being returned. Toinvestigate, set this clienttrace: error (unit:Manageddetail)
Appendix B. Tivoli Enterprise Monitoring Server and global attributes 437
To determine why the status is set as it is, the following client trace will help:error (unit:Managed detail).
Type The event is either pure (unsolicited notification; the situation has nosampling interval) or sampled (the situation is sampled at intervals).
Sampled
Sampled events happen when a situation becomes true. Situations sampledata at regular intervals. When the situation is true, it causes an event,which gets closed automatically when the situation goes back to false (oryou can close it manually if you stop the situation).
Pure Pure events are unsolicited notifications. Examples of pure events are anout-of-paper condition on a printer and an occurrence that adds an entryto the Windows System Log. Some monitoring agents have attributes thatreport pure events, such as the Windows Event Log and Windows FileChange attribute groups. A situation using one of these attributes canmonitor for pure events. Because of the nature of pure events and the factthat a situation created with pure event attributes does not have asampling interval, they are not closed automatically like sampled events;you must close the event manually or through an UNTIL clause.
Note: If you create a query and apply a column function to the Typeattribute, pure events will not be included in the AVG, COUNT, MAX,MIN or SUM calculation.
Universal Messages attributes
Universal Messages attributes keep track of the messages that have been generatedthrough a situation or policy action command. The Universal Message Consoleview uses these attributes, and they can be used to create situations.
Category The category name that was given for the message, such as 'Information'or 'SiteCritical'.
Message Severity The severity name that was given for the message to indicate itsimportance, such as 'Low' or '5'.
Message Text The content of the message, up to 256 characters. You can use theSCAN function to find a value anywhere in the message, and it can include anasterisk (*) as a wildcard, such as inciden* to find messages containing incidence,incident, or incidental. You can also use the STRing function to look for matchingtext at a specific location in the message.
Originnode The network name of the managed system where the situationtriggering the Universal Message became true. Valid entries are up to 32 characters.
Situation Name The name of the situation generating the Universal Message.
Timestamp The date and time at the Tivoli Enterprise Monitoring Server when theuniversal message was sent. The format is MM/DD/YY HH:MM:SS.
438 IBM Tivoli Monitoring: Tivoli Enterprise Portal User's Guide
Universal Time attributes
The Universal Time attributes show the time and date at the monitoring agentexpressed in UTC (Coordinated Universal Time) format. For example, if the UTCtime is 19:15.00 for an agent in New York, the local time is 2:15 PM Standard Time.These attributes are useful for action situations triggered by time.
Note:
1. When building situations, you will see that the Universal Time attribute groupcan be combined with any attribute group to create a condition.
2. The attributes are not available in Tivoli Enterprise Monitoring Server queries.3. Seconds, Minutes, Hours, and Day Of Month are treated as two-character text
attributes. For example, == 05 Minutes is correct, but == 5 Minutes will neverbe true.
Day Of Month The day in the month at the agent location when the data wassampled, from 01 to 31. The first day of the month is 01.
Day Of Week The numeric representation for the day in the week at the agentlocation when the data was sampled, from Sunday to Saturday. Select the day fromthe list.
Hours The hour in the day at the agent location when the data was sampled, from00 to 23, such as 01 for 1 am.
Minutes The minute in the hour at the agent location when the data was sampled,from 00 to 59, such as 05 for the fifth minute.
Month Of Year The numeric representation of the month in the year at the agentlocation when the data was sampled. Select the month from the list.
Seconds The seconds into the minute at the agent location when the data wassampled, from 00 to 59, such as 05 for the fifth second.
Time The time at the agent location when the data was sampled, formatted asHHMMSS. For example, 153000 is 3:30 PM
Timestamp The time stamp at the agent location when the data was sampled. Theformat is MM/DD/YY HH:MM:SS.
Appendix B. Tivoli Enterprise Monitoring Server and global attributes 439

440 IBM Tivoli Monitoring: Tivoli Enterprise Portal User's Guide
Documentation library
This appendix contains information about the publications related to IBM TivoliMonitoring and to the commonly shared components of Tivoli ManagementServices.
These publications are listed in the following categories:v IBM Tivoli Monitoring libraryv Related publications
See the IBM Tivoli Monitoring Documentation Guide for information about accessingand using the publications. You can find the Documentation Guide in the IBM TivoliMonitoring and OMEGAMON XE Information Center at http://publib.boulder.ibm.com/infocenter/tivihelp/v15r1/index.jsp. To open theDocumentation Guide in the information center, select Using the publication in theContents pane.
To find a list of new and changed publications, click What's new on the Welcomepage of the IBM Tivoli Monitoring and OMEGAMON XE Information Center. Tofind publications from the previous version of a product, click Previous versionsunder the name of the product in the Contents pane.
IBM Tivoli Monitoring libraryThe following publications provide information about IBM Tivoli Monitoring andabout the commonly shared components of Tivoli Management Services:v Quick Start Guide
Introduces the components of IBM Tivoli Monitoring.v Installation and Setup Guide, GC32-9407
Provides instructions for installing and configuring IBM Tivoli Monitoringcomponents on Windows, Linux, and UNIX systems.
v Program Directory for IBM Tivoli Management Services on z/OS, GI11-4105Gives instructions for the SMP/E installation of the Tivoli Management Servicescomponents on z/OS.
v Configuring the Tivoli Enterprise Monitoring Server on z/OS, SC27-2313Provides instructions for preparing, configuring, and customizing yourmonitoring servers on z/OS. This guide complements the IBM TivoliOMEGAMON XE and IBM Tivoli Management Services on z/OS Common Planningand Configuration Guide and the IBM Tivoli Monitoring Installation and Setup Guide.
v High Availability Guide for Distributed Systems, SC23-9768Gives instructions for several methods of ensuring the availability of the IBMTivoli Monitoring components.
v IBM Tivoli zEnterprise Monitoring Agent Installation and Configuration Guide,SC14-7358Provides instructions for installing and configuring Tivoli zEnterprise monitoringagent components on Windows, Linux, and UNIX systems. Also includesmigration and backup information, Enterprise Common Collectortroubleshooting, Hardware Management Console configuration, and use of the
© Copyright IBM Corp. 2005, 2012 441
command line interface or APIs to customize the collector. This guidecomplements the Tivoli zEnterprise Monitoring Agent User’s Guide.
v Administrator's Guide, SC32-9408Describes the support tasks and functions required for the Tivoli EnterprisePortal Server and clients, including Tivoli Enterprise Portal user administration.
v Command Reference, SC32-6045Provides detailed syntax and parameter information, as well as examples, for thecommands you can use in IBM Tivoli Monitoring.
v Messages, SC23-7969Lists and explains messages generated by all IBM Tivoli Monitoring componentsand by z/OS-based Tivoli Management Services components (such as TivoliEnterprise Monitoring Server on z/OS and TMS:Engine).
v Troubleshooting Guide, GC32-9458Provides information to help you troubleshoot problems with the software.
v Tivoli Enterprise Portal online helpProvides context-sensitive reference information about all features andcustomization options of the Tivoli Enterprise Portal. Also gives instructions forusing and administering the Tivoli Enterprise Portal.
v Tivoli Enterprise Portal User's Guide, SC32-9409Complements the Tivoli Enterprise Portal online help. The guide provideshands-on lessons and detailed instructions for all Tivoli Enterprise Portalfeatures.
v Agent Builder User's Guide, SC32-1921Explains how to use the Agent Builder for creating monitoring agents and theirinstallation packages, and for adding functions to existing agents.
v Tivoli Universal Agent User’s Guide, SC32-9459Introduces you to the IBM Tivoli Universal Agent, an agent of IBM TivoliMonitoring. The IBM Tivoli Universal Agent enables you to use the monitoringand automation capabilities of IBM Tivoli Monitoring to monitor any type ofdata you collect.
v Performance Analyzer User’s Guide, SC27-4004Explains how to use the Performance Analyzer to understand resourceconsumption trends, identify problems, resolve problems more quickly, andpredict and avoid future problems.
v IBM Tivoli Universal Agent API and Command Programming Reference Guide,SC32-9461Explains the procedures for implementing the IBM Tivoli Universal Agent APIsand provides descriptions, syntax, and return status codes for the API calls andcommand-line interface commands.
v IBM Tivoli zEnterprise Monitoring Agent User’s Guide, SC14-7359Complements the Tivoli zEnterprise monitoring agent online help. The guideprovides reference information about the interface, usage scenarios, agenttroubleshooting information, and information about Tivoli Common Reportingreports. This guide complements the Tivoli zEnterprise Monitoring AgentInstallation and Configuration Guide.
Documentation for the base agentsIf you purchased IBM Tivoli Monitoring as a product, you received a set of basemonitoring agents as part of the product. If you purchased a monitoring agent
442 IBM Tivoli Monitoring: Tivoli Enterprise Portal User's Guide
product (for example, an OMEGAMON XE product) that includes the commonlyshared components of Tivoli Management Services, you did not receive the baseagents.
The following publications provide information about using the base agents.v Operating system agents:
– Windows OS Agent User's Guide, SC32-9445– UNIX OS Agent User's Guide, SC32-9446– Linux OS Agent User's Guide, SC32-9447– i5/OS Agent User's Guide, SC32-9448– UNIX Log Agent User's Guide, SC32-9471
v Agentless operating system monitors:– Agentless Monitoring for Windows Operating Systems User's Guide, SC23-9765– Agentless Monitoring for AIX Operating Systems User's Guide, SC23-9761– Agentless Monitoring for HP-UX Operating Systems User's Guide, SC23-9763– Agentless Monitoring for Solaris Operating Systems User's Guide, SC23-9764– Agentless Monitoring for Linux Operating Systems User's Guide, SC23-9762
v Warehouse agents:– Warehouse Summarization and Pruning Agent User's Guide, SC23-9767– Warehouse Proxy Agent User's Guide, SC23-9766
v System P agents:– AIX Premium Agent User's Guide, SA23-2237– CEC Base Agent User's Guide, SC23-5239– HMC Base Agent User's Guide, SA23-2239– VIOS Premium Agent User's Guide, SA23-2238
v Other base agents:– Tivoli Log File Agent User’s Guide, SC14-7484– Systems Director base Agent User’s Guide, SC27-2872– Monitoring Agent for IBM Tivoli Monitoring 5.x Endpoint User's Guide,
SC32-9490
Related publicationsYou can find useful information about related products in the IBM TivoliMonitoring and OMEGAMON XE Information Center at http://publib.boulder.ibm.com/infocenter/tivihelp/v15r1/index.jsp.
Other sources of documentationYou can also obtain technical documentation about IBM Tivoli Monitoring andrelated products from the following sources:v IBM Integrated Service Management Library
http://www.ibm.com/software/brandcatalog/ismlibrary/IBM Integrated Service Management Library is an online catalog that containsintegration documentation and other downloadable product extensions.
v Redbookshttp://www.redbooks.ibm.com/
Documentation library 443
IBM Redbooks and Redpapers include information about products fromplatform and solution perspectives.
v TechnotesTechnotes provide the latest information about known product limitations andworkarounds. You can find Technotes through the IBM Software Support Website at http://www.ibm.com/software/support/.
v Tivoli wikis on the IBM developerWorks Web siteTivoli Wiki Central at http://www.ibm.com/developerworks/wikis/display/tivoli/Home is the home for interactive wikis that offer best practices andscenarios for using Tivoli products. The wikis contain white papers contributedby IBM employees, and content created by customers and business partners.Two of these wikis are of particular relevance to IBM Tivoli Monitoring:– Tivoli Distributed Monitoring and Application Management Wiki at
http://www.ibm.com/developerworks/wikis/display/tivolimonitoring/Home provides information about IBM Tivoli Monitoring and relateddistributed products, including IBM Tivoli Composite ApplicationManagement products.
– Tivoli System z Monitoring and Application Management Wiki athttp://www.ibm.com/developerworks/wikis/display/tivoliomegamon/Home provides information about the OMEGAMON XE products, NetViewfor z/OS, Tivoli Monitoring Agent for z/TPF, and other System z monitoringand application management products.
444 IBM Tivoli Monitoring: Tivoli Enterprise Portal User's Guide
Support information
If you have a problem with your IBM software, you want to resolve it quickly. IBMprovides ways for you to obtain the support you need.
OnlineThe following sites contain troubleshooting information:v Go to the IBM Software Support site at http://www.ibm.com/software/
support/probsub.html and follow the instructions.v Go to the IBM Tivoli Distributed Monitoring and Application
Management Wiki at http://www.ibm.com/developerworks/wikis/display/tivolimonitoring/Home. Feel free to contribute to this wiki.
IBM Support AssistantThe IBM Support Assistant (ISA) is a free local software serviceabilityworkbench that helps you resolve questions and problems with IBMsoftware products. The ISA provides quick access to support-relatedinformation and serviceability tools for problem determination. To installthe ISA software, go to http://www.ibm.com/software/support/isa.
Troubleshooting GuideFor more information about resolving problems, see the product'sTroubleshooting Guide.
Using IBM Support AssistantThe IBM Support Assistant is a free, stand-alone application that you can install onany workstation. You can then enhance the application by installingproduct-specific plug-in modules for the IBM products you use.
The IBM Support Assistant saves you the time it takes to search the product,support, and educational resources. The IBM Support Assistant helps you gathersupport information when you need to open a problem management record(PMR), which you can then use to track the problem.
The product-specific plug-in modules provide you with the following resources:v Support linksv Education linksv Ability to submit problem management reports
For more information, and to download the IBM Support Assistant, seehttp://www.ibm.com/software/support/isa. After you download and install theIBM Support Assistant, follow these steps to install the plug-in for your Tivoliproduct:1. Start the IBM Support Assistant application.2. Select Updater on the Welcome page.3. Select New Properties and Tools or select the New Plug-ins tab (depending on
the version of IBM Support Assistant installed).4. Under Tivoli, select your product, and then click Install. Be sure to read the
license and description.If your product is not included on the list under Tivoli, no plug-in is availableyet for the product.
© Copyright IBM Corp. 2005, 2012 445
5. Read the license and description, and click I agree.6. Restart the IBM Support Assistant.
Obtaining fixesA product fix might be available to resolve your problem. To determine whichfixes are available for your Tivoli software product, follow these steps:1. Go to the IBM Software Support website at http://www.ibm.com/software/
support.2. Under Select a brand and/or product, select Tivoli.
If you click Go, the Search within all of Tivoli support section is displayed. Ifyou don't click Go, you see the Select a product section.
3. Select your product and click Go.4. Under Download, click the name of a fix to read its description and, optionally,
to download it.If there is no Download heading for your product, supply a search term, errorcode, or APAR number in the field provided under Search Support (thisproduct), and click Search.
For more information about the types of fixes that are available, see the IBMSoftware Support Handbook at http://www14.software.ibm.com/webapp/set2/sas/f/handbook/home.html.
Receiving weekly support updatesTo receive weekly e-mail notifications about fixes and other software support news,follow these steps:1. Go to the IBM Software Support website at http://www.ibm.com/software/
support.2. Click My support in the far upper-right corner of the page under
Personalized support.3. If you have already registered for My support, sign in and skip to the next
step. If you have not registered, click register now. Complete the registrationform using your e-mail address as your IBM ID and click Submit.
4. The Edit profile tab is displayed.5. In the first list under Products, select Software. In the second list, select a
product category (for example, Systems and Asset Management). In the thirdlist, select a product sub-category (for example, Application Performance &Availability or Systems Performance). A list of applicable products isdisplayed.
6. Select the products for which you want to receive updates.7. Click Add products.8. After selecting all products that are of interest to you, click Subscribe to email
on the Edit profile tab.9. In the Documents list, select Software.
10. Select Please send these documents by weekly email.11. Update your e-mail address as needed.12. Select the types of documents you want to receive.13. Click Update.
446 IBM Tivoli Monitoring: Tivoli Enterprise Portal User's Guide
If you experience problems with the My support feature, you can obtain help inone of the following ways:
OnlineSend an e-mail message to [email protected], describing your problem.
By phoneCall 1-800-IBM-4You (1-800-426-4968).
Contacting IBM Software SupportIBM Software Support provides assistance with product defects. The easiest way toobtain that assistance is to open a PMR or ETR directly from the IBM SupportAssistant.
Before contacting IBM Software Support, your company must have an active IBMsoftware maintenance contract, and you must be authorized to submit problems toIBM. The type of software maintenance contract that you need depends on thetype of product you have:v For IBM distributed software products (including, but not limited to, Tivoli,
Lotus, and Rational products, as well as DB2 and WebSphere products that runon Windows or UNIX operating systems), enroll in Passport Advantage in oneof the following ways:
OnlineGo to the Passport Advantage website at http://www-306.ibm.com/software/howtobuy/passportadvantage/pao_customers.htm .
By phoneFor the phone number to call in your country, go to the IBM SoftwareSupport website at http://techsupport.services.ibm.com/guides/contacts.html and click the name of your geographic region.
v For customers with Subscription and Support (S & S) contracts, go to theSoftware Service Request website at https://techsupport.services.ibm.com/ssr/login.
v For customers with Linux, iSeries, pSeries, zSeries, and other supportagreements, go to the IBM Support Line website at http://www.ibm.com/services/us/index.wss/so/its/a1000030/dt006.
v For IBM eServer software products (including, but not limited to, DB2 andWebSphere products that run in zSeries, pSeries, and iSeries environments), youcan purchase a software maintenance agreement by working directly with anIBM sales representative or an IBM Business Partner. For more informationabout support for eServer software products, go to the IBM Technical SupportAdvantage website at http://www.ibm.com/servers/eserver/techsupport.html.
If you are not sure what type of software maintenance contract you need, call1-800-IBMSERV (1-800-426-7378) in the United States. From other countries, go tothe contacts page of the IBM Software Support Handbook on the web athttp://www14.software.ibm.com/webapp/set2/sas/f/handbook/home.html andclick the name of your geographic region for phone numbers of people whoprovide support for your location.
Support information 447

448 IBM Tivoli Monitoring: Tivoli Enterprise Portal User's Guide
Notices
This information was developed for products and services offered in the U.S.A.IBM may not offer the products, services, or features discussed in this document inother countries. Consult your local IBM representative for information on theproducts and services currently available in your area. Any reference to an IBMproduct, program, or service is not intended to state or imply that only that IBMproduct, program, or service may be used. Any functionally equivalent product,program, or service that does not infringe any IBM intellectual property right maybe used instead. However, it is the user's responsibility to evaluate and verify theoperation of any non-IBM product, program, or service.
IBM may have patents or pending patent applications covering subject matterdescribed in this document. The furnishing of this document does not give youany license to these patents. You can send license inquiries, in writing, to:
IBM Director of LicensingIBM CorporationNorth Castle DriveArmonk, NY 10504-1785 U.S.A.
For license inquiries regarding double-byte (DBCS) information, contact the IBMIntellectual Property Department in your country or send inquiries, in writing, to:
Intellectual Property LicensingLegal and Intellectual Property LawIBM Japan, Ltd.1623-14, Shimotsuruma, Yamato-shiKanagawa 242-8502 Japan
The following paragraph does not apply to the United Kingdom or any othercountry where such provisions are inconsistent with local law:
INTERNATIONAL BUSINESS MACHINES CORPORATION PROVIDES THISPUBLICATION "AS IS" WITHOUT WARRANTY OF ANY KIND, EITHEREXPRESS OR IMPLIED, INCLUDING, BUT NOT LIMITED TO, THE IMPLIEDWARRANTIES OF NON-INFRINGEMENT, MERCHANTABILITY OR FITNESSFOR A PARTICULAR PURPOSE.
Some states do not allow disclaimer of express or implied warranties in certaintransactions, therefore, this statement might not apply to you.
This information could include technical inaccuracies or typographical errors.Changes are periodically made to the information herein; these changes will beincorporated in new editions of the publication. IBM may make improvementsand/or changes in the product(s) and/or the program(s) described in thispublication at any time without notice.
Any references in this information to non-IBM websites are provided forconvenience only and do not in any manner serve as an endorsement of thosewebsites. The materials at those websites are not part of the materials for this IBMproduct and use of those websites is at your own risk.
© Copyright IBM Corp. 2005, 2012 449
IBM may use or distribute any of the information you supply in any way itbelieves appropriate without incurring any obligation to you.
Licensees of this program who wish to have information about it for the purposeof enabling: (i) the exchange of information between independently createdprograms and other programs (including this one) and (ii) the mutual use of theinformation which has been exchanged, should contact:
IBM Corporation2Z4A/10111400 Burnet RoadAustin, TX 78758 U.S.A.
Such information may be available, subject to appropriate terms and conditions,including in some cases payment of a fee.
The licensed program described in this document and all licensed materialavailable for it are provided by IBM under terms of the IBM Customer Agreement,IBM International Program License Agreement or any equivalent agreementbetween us.
Any performance data contained herein was determined in a controlledenvironment. Therefore, the results obtained in other operating environments mayvary significantly. Some measurements may have been made on development-levelsystems and there is no guarantee that these measurements will be the same ongenerally available systems. Furthermore, some measurement may have beenestimated through extrapolation. Actual results may vary. Users of this documentshould verify the applicable data for their specific environment.
Information concerning non-IBM products was obtained from the suppliers ofthose products, their published announcements or other publicly available sources.IBM has not tested those products and cannot confirm the accuracy ofperformance, compatibility or any other claims related to non-IBM products.Questions on the capabilities of non-IBM products should be addressed to thesuppliers of those products.
All statements regarding IBM's future direction or intent are subject to change orwithdrawal without notice, and represent goals and objectives only.
All IBM prices shown are IBM's suggested retail prices, are current and are subjectto change without notice. Dealer prices may vary.
This information is for planning purposes only. The information herein is subject tochange before the products described become available.
This information contains examples of data and reports used in daily businessoperations. To illustrate them as completely as possible, the examples include thenames of individuals, companies, brands, and products. All of these names arefictitious and any similarity to the names and addresses used by an actual businessenterprise is entirely coincidental.
COPYRIGHT LICENSE:
This information contains sample application programs in source language, whichillustrate programming techniques on various operating platforms. You may copy,modify, and distribute these sample programs in any form without payment to
450 IBM Tivoli Monitoring: Tivoli Enterprise Portal User's Guide
IBM, for the purposes of developing, using, marketing or distributing applicationprograms conforming to the application programming interface for the operatingplatform for which the sample programs are written. These examples have notbeen thoroughly tested under all conditions. IBM, therefore, cannot guarantee orimply reliability, serviceability, or function of these programs. You may copy,modify, and distribute these sample programs in any form without payment toIBM for the purposes of developing, using, marketing, or distributing applicationprograms conforming to IBM‘s application programming interfaces.
Each copy or any portion of these sample programs or any derivative work, mustinclude a copyright notice as follows:
© IBM 2012. Portions of this code are derived from IBM Corp. Sample Programs. ©Copyright IBM Corp. previous releases to 2012.
If you are viewing this information in softcopy form, the photographs and colorillustrations might not be displayed.
Notices 451

452 IBM Tivoli Monitoring: Tivoli Enterprise Portal User's Guide
Glossary
activityOne phase within a sequence ofpredefined steps called a policy thatautomate system responses to a situationthat has fired (that is, become true).
administration modeSee workspace administration mode.
affinityA label that classifies objects by managedsystem.
agent Software installed on systems you want tomonitor that collects data about anoperating system, subsystem, orapplication running on each such system.Because an executable file gathersinformation about a managed system,there is always a one-to-onecorrespondence between them. Also calleda Tivoli Enterprise Monitoring Agent.
agentless monitorAn agentless monitor uses a standard API(such as SNMP or CIM) to identify andnotify you of common problems with theoperating system running on a remotecomputer. Thus, as their name implies,the agentless monitors can retrievemonitoring and performance datawithout requiring OS agents on thecomputers being monitored. The agentlessmonitors provide monitoring, datagathering, and event management forWindows, Linux, AIX, HP-UX, and Solarissystems.
agentless monitoring serverA computer with an OS agent installedthat has one or more agentless monitorsrunning on it. Each agentless monitoringserver can support up to 10 activeinstances of the various types of agentlessmonitors, in any combination. Eachinstance can communicate with up to 100remote nodes, which means a singleagentless monitoring server can supportas many as 1000 monitored systems.
alert A warning message that appears at aconsole to indicate that something hasoccurred that might require intervention.
associateThe process of linking a situation with aNavigator item that enables a light to goon and a sound to play for an open event.Predefined situations are associatedautomatically, as are situations created oredited through the Navigator item pop-upmenu. When you open the Situationeditor from the toolbar, any situations youcreate cannot be associated with aNavigator item during this editingsession. You must close the Situationeditor, then open it again from the pop-upmenu of the Navigator item with whichthe situation should be associated.
attribute(1) A system or application element beingmonitored by the monitoring agent, suchas Disk Name and Disk Read/Writes PerSecond. (2) A characteristic of a managedobject; that is, a field in the data structureof a managed object or in the workspaceassociated with that managed object. (3) Afield in an ODBC-compliant database.
attribute groupA set of related attributes that can becombined in a data view or a situation.When you open the view or start thesituation, data samples of the selectedattributes are retrieved. Each type ofmonitoring agent has its own set ofattribute groups.
browser clientThe software installed with the TivoliEnterprise Portal Server that isdownloaded to your computer when youstart the Tivoli Enterprise Portal browserclient. The browser client runs undercontrol of a web browser.
chart A graphical view of data returned from amonitoring agent. A data point is plottedfor each attribute chosen and, for bar andpie charts, a data series for each row.Types of charts include pie, bar, plot, andgauge.
© Copyright IBM Corp. 2005, 2012 453
class fileA file containing Java object code for asingle Java object class.
class loaderA Java component that loads Java classfiles.
client An application that receives requesteddata from a server.
client/server architectureAn architecture in which the client(usually a personal computer orworkstation) is the machine requestingdata or services and the server is themachine supplying them. Servers can bemicrocomputers, minicomputers, ormainframes. The client provides the userinterface and may perform applicationprocessing. In IBM Tivoli Monitoring theTivoli Enterprise Portal is the client to theTivoli Enterprise Portal Server.
A database server maintains thedatabases and processes requests from theclient to extract data from or to updatethe database. An application serverprovides additional business-supportprocessing for the clients.
Common Object Request Broker ArchitectureAn industry specification for the designand standardization of different types ofobject request brokers (ORBs). ORBs allowdifferent computers to exchange objectdata; CORBA enables ORBs from differentsoftware vendors (often running underdissimilar computer systems andoperating systems) to exchange objectdata. CORBA is an architecture andspecification that facilitatescommunication among programcomponents in a network using objects.Prior to IBM Tivoli Monitoring v6.2.3, theTivoli Enterprise Portal Server is aCORBA implementation.
Configure History permissionYour user ID must have ConfigureHistory permission to open the HistoryCollection Configuration window forsetting up history files and data rolloff. Ifyou do not have this permission, you willnot see the menu item or tool forhistorical configuration.
CORBASee Common Object Request BrokerArchitecture.
critical stateThe indication that a situation associatedwith a Navigator item is in anunacceptable state and that you must takecorrective action. The critical state isrepresented by the color red.
Custom Navigator Views permissionYour user ID has a Modify checkbox forthe Custom Navigator Views feature. Thispermission must be enabled for you toopen the Navigator view editor tomaintain and update Navigator views.
datasource nameThe name that is stored in the databaseserver and that enables you to retrieveinformation from the database throughODBC. The DSN includes suchinformation as the database name,database driver, user ID, and password.
datasourcesData pertaining to J2EE data sources,which are logical connections to databasesubsystems.
DB2 on the workstationIBM's DB2 Database for Linux, UNIX, andWindows systems is a relational databasemanagement system that runs on desktopcomputers. You install a DB2 database onthe same system as the Tivoli EnterprisePortal Server; it stores the portal queries,customized workspaces, user IDs, andcustom Navigator views. DB2 on theworkstation can also serve as the datarepository for the Tivoli Data Warehouse,which stores historical monitoringinformation.
Demilitarized ZoneThe area of a Worldwide Web applicationthat enables a company to host Internetservices without allowing unauthorizedaccess.
Derby An open-source, public-domain, relationaldatabase management systemimplemented in Java and designed toconform to accepted database standards(such as SQL and JDBC). Derby cameabout when IBM contributed itsCloudscape database manager to theApache project and features a small
454 IBM Tivoli Monitoring: Tivoli Enterprise Portal User's Guide
machine footprint. IBM Tivoli Monitoringimplements Derby as an embeddeddatabase within the Tivoli EnterprisePortal Server extended services (TEPS/e),and runs within the portal server's Javavirtual machine.
desktop clientSoftware supplied with IBM TivoliMonitoring that you install on aworkstation that you plan to use forinteracting with the Tivoli EnterprisePortal Server and the Tivoli EnterpriseMonitoring Server. The Tivoli EnterprisePortal desktop client provides thegraphical user interface into the TivoliMonitoringnetwork.
detailed attribute nameThe name used in formulas, expertadvice, Take Action commands, andheaders and footers when referencing amonitoring agent attribute. In theProperties and Situation editors, you clickShow Formula, then check Show detailedformula to see the detailed attributename.
display itemAn attribute designated to further qualifya situation. With a display item set for amultiple-row attribute group, the situationcontinues to look at the other rows in thesampling and opens more events if otherrows qualify. The value displays in theevent workspace and in the message logand situation event console views. Youcan select a display item when building asituation with a multiple-row attributegroup.
distributionThe managed systems on which thesituation is running.
DLL See Dynamic Link Library.
DMZ See Demilitarized Zone.
DSN See datasource name.
Dynamic Link LibraryA composite of one or more executableobjects that is bound together by a linkingprocedure and loaded at run time (ratherthan when the application is linked). Thecode and data in a dynamic link librarycan be shared by several applicationssimultaneously. DLLs apply only toWindows operating environments
EIB See Enterprise Information Base.
EIF See Event Integration Facility.
endcodeYou assign endcodes in a policy as youconnect one activity to another. Theendcode indicates the result of thisactivity that will trigger the next activity.
Enterprise Information BaseA database used by the Tivoli EnterpriseMonitoring Server that serves as arepository of shared objects for allsystems across your enterprise. The EIBstores all persistent data, includingsituations, policies, user definitions, andmanaged-object definitions.
enterprise situationA situation that is created for amonitoring agent that reports events tothe Tivoli Enterprise Monitoring Server itconnects to. Enterprise situations arecentrally defined at the monitoring serverand distributed at agent startup. See alsosituation.
event An action or some occurrence, such asrunning out of memory or completing atransaction, that can be detected by asituation. Events cause a change in thestate of a managed object associated witha situation, thereby make the situationtrue and causing an alert to be issued.
event indicatorThe colored icon that displays over aNavigator item when an event opens fora situation.
Event Integration FacilityAn application programming interfacethat external applications can invoke tocreate, send, or receive Tivoli EnterpriseConsole events. These events are referredto as either EIF events or TEC/EIF events.
event itemA Navigator item that shows when youopen the event workspace for a truesituation (by selecting it from the eventflyover listing or from the situation eventconsole pop-up menu).
event soundThe sound file that plays when an eventopens. This sound file is set in theSituation editor when the situation is
Glossary 455
associated with a Navigator item and candiffer for different Navigator items.
expert adviceA description within the Situation editorof each situation provided with amonitoring agent to help you quicklyunderstand and interpret events arisingfrom it.
Extensible Markup LanguageA data-description language derived fromStandard Generalized Markup Language(SGML). A tool for encoding messages sothey describe their own fields, XMLallows you to format a document as adata structure. As program objects, suchdocuments can have their contents anddata hidden within the object, whichallows you to control who can manipulatethe document and how. In addition,documents can carry with them theobject-oriented procedures calledmethods. The XML standard aids inexchanging data between applications andusers.
filter criteriaThese limit the amount of informationreturned to the data view in response to aquery. You can apply a prefilter to thequery to collect only certain data, orapply a postfilter to the view propertiesto show only certain data from theinformation collected.
georeferenced mapA special type of graphic that has built-inknowledge of latitude and longitude andcan be zoomed into and out of quickly.The Tivoli Enterprise Portal usesproprietary .IVL files generated with themap-rendering component. These filescannot be opened or saved in a graphiceditor.
historical data managementThe procedures applied to short-termbinary history files that roll off historicaldata to either the Tivoli Data Warehouseor to delimited text files (the krarloffutility on UNIX or Windows; jobnameKPDXTRA for the z/OS PersistentDatastore), and then delete entries in theshort-term history files over 24 hours old,thereby making room for new entries.
hot standbyA redundant Tivoli Enterprise Monitoring
Server that, if the primary or hub shouldfail, assumes the responsibilities of thefailed monitoring server.
hub (1) A central host system that collects thestatus of situations running on yoursystems. (2) The Tivoli EnterpriseMonitoring Server that your site hasselected to act as the focal point to whichthe Tivoli Enterprise Portal Server and allremote monitoring servers in thismonitored network connect. A remotemonitoring server passes its collected datato the hub to be made available to clients,creating an enterprise-wide view.
IBM Tivoli MonitoringA client/server implementation formonitoring enterprise-wide computernetworks that comprises a TivoliEnterprise Monitoring Server, anapplication server known as the TivoliEnterprise Portal Server, one or moreTivoli Enterprise Portal clients, andmultiple monitoring agents that collectand distribute data to the monitoringserver.
integral web serverA proprietary web server developed forIBM Tivoli Monitoring that is installedand configured automatically with theTivoli Enterprise Portal Server. You enterthe URL of the integral web server to startthe Tivoli Enterprise Portal client inbrowser mode.
Interoperable Object ReferenceConnects clients to the Tivoli EnterprisePortal Server. The IOR identifies a remoteobject, including such information asname, capabilities, and how to contact it.The URL may include an IOR because itgoes through the web server; the portalserver uses it to tell the client which IORto fetch. After it does that, the portalserver extracts the host and portinformation and tells the client where toroute the request.
intervalThe number of seconds that have elapsedbetween one sample and the next.
IOR See Interoperable Object Reference.
Java Database ConnectivityA standard API that enables applicationdevelopers to access and update relational
456 IBM Tivoli Monitoring: Tivoli Enterprise Portal User's Guide
databases (RDBMSes) from within Javaprograms. The JDBC standard is based onthe X/Open SQL Call Level Interface(CLI) and complies with the SQL-92 EntryLevel standard; it provides aDBMS-independent interface that enablesSQL-compliant database access for Javaprogrammers.
JDBC See Java Database Connectivity.
LDAP See Lightweight Directory AccessProtocol.
Lightweight Directory Access ProtocolA protocol that conforms to theInternational Standards Organization'sX.500 directory standard that uses TCP/IPto access directory databases whereapplications can store and retrievecommon naming and location data. Forexample, applications can use LDAP toaccess such directory information as emailaddresses, service configurationparameters, and public keys.
location brokerThe component of the Tivoli EnterpriseMonitoring Server that managesconnections for the hub monitoringserver, enabling it to find all other TivoliMonitoring components, including remotemonitoring servers, the Tivoli EnterprisePortal Server, and Tivoli EnterpriseMonitoring Agents.
managed objectAn icon created in the Tivoli EnterprisePortal from a managed object templatethat represents resources you monitorusing situations. Managed objects areconverted to items in the NavigatorLogical view.
managed systemA particular operating system, subsystem,or application in your enterprise where amonitoring agent is installed and running.This is any system that the TivoliEnterprise Monitoring Server ismonitoring.
managed system listA named list of managed systems of thesame type that is maintained by a user.Example: a list of Linux managed systemsfor a geographic region namedLINUX_LONDON. You can see and selecta managed system list when you
distribute a situation or policy, edit aquery specification, or assign managedsystems to Navigator items in customNavigator views.
If a managed system list is updated(usually when a constituent managedsystem is added or deleted), then all thesituations and policies that use that listare redistributed to all managed systemsin the list.
Microsoft Management ConsoleThis feature of Microsoft's variousWindows Server environments provides acentralized, consistent, and extensibleinterface to Windows' various monitoringand management utilities. In particular,MMC manages directory services, jobscheduling, event logging, performancemonitoring, and user environments.
middlewareSoftware that enables the exchange ofinformation between components in adistributed computing environment. Themiddleware is the data-exchange andcommunications channel that allowsprograms to cooperate with each otherwithout having to know details abouthow they are implemented or where theyare deployed. Middleware typicallyprovides a range of related facilities suchas persistence, auditing, and the ability tobuild a transactional unit of work. IBM'sCICS and WebSphere MQ are examples ofmiddleware.
MMC See Microsoft Management Console.
monitor intervalA specified time, scalable to seconds,minutes, hours, or days, for how often theTivoli Enterprise Monitoring Serverchecks to see if a situation has becometrue. The minimum monitor interval is 30seconds; the default is 15 minutes.
NAT See Network Address Translation.
NavigatorThe upper-left pane of the TivoliEnterprise Portal window. The NavigatorPhysical view shows your networkenterprise as a physical hierarchy ofsystems grouped by platform. You canalso create other views to create logicalhierarchies grouped as you specify, suchas by department or function.
Glossary 457
Network Address TranslationA scheme used by local-area networks(LANs) to establish an internal andexternal set of IP addresses. Internal IPaddresses are kept private and must betranslated to and from the externaladdresses for outbound and inboundcommunications. NAT is often used infirewall configurations.
node (1) One computer in a computer network.(2) Any managed system, such as anAIX-based pSeries server, that IBM TivoliMonitoring is monitoring. A node canalso be a managed system of subnodes,all of which are being managed ascomponents of the primary node.
non-agent bundlesThese custom bundles let you remotelydeploy components that need not connectto a Tivoli Enterprise Monitoring Server,such as those that support other Tivoliproducts like Netcool/OMNIbus.
object An instance of a class, which comprisesan implementation and an interface. Anobject reflects its original, holding dataand methods and responds to requests forservices. CORBA defines an object as acombination of state and a set of methodscharacterized by the behavior of relevantrequests.
ODBCSee Open Database Connectivity.
Open Database ConnectivityA standard for accessing differentdatabase systems using procedural,non-object-based languages such as C.The Query editor enables you to writecustom SQL queries for creating viewsthat retrieve data from ODBC-compliantdatabases.
platformThe operating system upon which themanaged system is running, such as z/OSor Linux. The Navigator's Physicalmapping places the platform level underthe Enterprise level.
policy A set of automated system processes thatcan perform actions, schedule work forusers, or automate manual tasks,frequently in response to events. Policiesare the IBM Tivoli Monitoring automationtool; they comprise a series of automated
steps, called activities, whose order ofexecution you control.
In most cases, a policy links a Take Actioncommand to a situation that has turnedtrue. When started, the policy's workflowprogresses until all activities have beencompleted or until the Tivoli EnterprisePortal user manually stops the policy. Youcan create both policies that fullyautomate workflow strategies and thosethat require user intervention. As withsituations, policies are distributed to themanaged systems you want to monitorand to which you are sending commands.
private situationA situation that is defined in an XML“privateconfiguration” file for the localTivoli Enterprise Monitoring Agent orTivoli System Monitor Agent and doesnot interact with a Tivoli EnterpriseMonitoring Server. Events are viewedthrough the Agent Service Interface or canbe sent as EIF events or SNMP alerts to areceiver. See also situation.
product codeThe three-letter code used by IBM TivoliMonitoring to identify the productcomponent. For example, the productcode for IBM Tivoli Monitoring forWebSphere Application Server is KWE.
Properties editorA multi-tabbed window for specifying theproperties of the individual views thatmake up a workspace, as well as thegeneral workspace properties.
pure eventA pure event is one that occursautomatically, such as when a paper-outcondition occurs on the printer or when anew log entry is written. Situationswritten to notify you of pure eventsremain true until they are manuallyclosed or automatically closed by anUNTIL clause.
query A particular view of specified attributes ofselected instances of a set ofmanaged-object classes, arranged tosatisfy an end-user request. Queries arewritten using SQL.
remote Tivoli Enterprise Monitoring ServerA remote monitoring server collectsmonitoring data from a subset of your
458 IBM Tivoli Monitoring: Tivoli Enterprise Portal User's Guide
site's monitoring agents and passes itscollected data to the hub Tivoli EnterpriseMonitoring Server to be made available toone or more Tivoli Enterprise Portalclients through the Tivoli EnterprisePortal Server, thereby creating anenterprise-wide view.
sampleThe data that the monitoring agentcollects for the monitoring server instance.The interval is the time between datasamplings.
sampled eventSampled events happen when a situationbecomes true. Situations sample data atregular intervals. When the situationbecomes true, it opens an event, whichgets closed automatically when thesituation goes back to false (or when youclose it manually).
Secure Sockets LayerA security protocol for communicationprivacy that provides secure client/serverconversations.
server An application that satisfies data andservice requests from clients.
Simple Network Management ProtocolA TCP/IP transport protocol forexchanging network management dataand controlling the monitoring of networknodes in a TCP/IP environment. TheSNMP software protocol facilitatescommunications between different typesof networks. IBM Tivoli Monitoring usesSNMP messaging to discover the deviceson your network and their availability.
Simple Object Access ProtocolThe Simple Object Access Protocol is anXML-based interface that vendors use tobridge remote procedure calls betweencompeting systems. SOAP makes itunnecessary for sites to choose betweenCORBA/Java/EJB and Microsoft'sCOM+.
Because XML and SOAP are platform-and language-neutral, users can mixoperating systems, programminglanguages, and object architectures yetmaintain business-componentinteroperability across platforms: usingSOAP, applications can converse with
each other and exchange data over theInternet, regardless of the platforms onwhich they run.
single sign-onThis feature lets IBM Tivoli Monitoringusers start other Tivoli web-enabledapplications from any Tivoli EnterprisePortal client (desktop, browser, or JavaWeb Start), or to start the portal clientfrom those applications, without havingto re-enter their user credentials (useridand password). For SSO to function, UserAuthentication must be configuredthrough the Tivoli Enterprise PortalServer for an external LDAP registry thatis shared by all participating Tivoliapplications. All the participatingapplications must be configured for SSOand must belong to the same securitydomain and realm.
situationThe set of monitored conditions runningon a managed system that, when met,creates an event. A situation comprises anattribute, an operator such as greater thanor equal to, and a value. It can be read as"If system_condition compared_to valueis_true." An example of a situation is:"If CPU_usage > 90% TRUE." Theexpression "CPU_usage > 90%" is thesituation condition.
SNMPSee Simple Network ManagementProtocol.
SOAP See Simple Object Access Protocol.
socketsRefers to the sockets method of passingdata back and forth between a networkedclient and server or between programlayers on the same computer.
sound The WAV file that plays whenever asituation becomes true for the currentNavigator item. Sound is assigned to theNavigator item for a situation in the sameway a state is assigned.
SQL See Structured Query Language.
SSL See Secure Sockets Layer.
SSO See single sign-on.
state The severity of the situation event:critical, warning, or informational.Indicated by a colored event indicator,
Glossary 459
state is set in the Situation editor and canbe different for different Navigator items.
status The true or false condition of a situation.
Structured Query LanguageA programming language for extractinginformation from and updatinginformation within a relational database.The Query editor enables you to writeSQL queries to ODBC datasources forretrieval and display in table and chartviews.
subnetworkA configuration wherein a single IPnetwork address is split up so it can beused on several interconnected localnetworks. Subnetworking is a localconfiguration; outside it appears as asingle IP network.
summarization and pruning agentOne of the Tivoli Monitoring base agents,the summarization and pruning agent isused to keep the data warehouse fromgrowing too large by summarizing andpruning your stored historical data atintervals that you set. For every attributegroup that has data collection configured,you specify how often to aggregate(summarize) data in the Tivoli DataWarehouse and the length of time todelete (prune) data from the warehouse.
symbolRepresents a variable that can be addedto header or footer text for data views,expert-advice text, or query specification.The detailed attribute name is enclosed indollar signs, such as $ORIGINNODE$, andresolves to the attribute's value. For TivoliEnterprise Monitoring Server queries, ==$NODE$ specifies the managed systemsfrom which to retrieve data. For queriesto be used in link target workspaces, youcan create symbols for attributes using the$symbolname$ format.
System Monitor AgentThese agents were introduced with IBMTivoli Monitoring V6.2.2 for nodes thatrun the desktop operating systems(Windows, Linux, UNIX). These agentsoperate only autonomously (that is, theyrun without a connection to a TivoliEnterprise Monitoring Server) and passSNMP trap data about operating system
performance to an SNMP Event Collectorsuch as IBM Tivoli Netcool/OMNIbus'sMTTRAPD receiver.
No other IBM Tivoli Monitoring agents orother components should be installed onthe same node as a System MonitorAgent. The only exception to this rule isagents created with the Agent Builder toolfor V6.2.2 or subsequent.
Take ActionA Tivoli Enterprise Portal dialog box fromwhich you can enter a command orchoose from a list of predefinedcommands. It also lists systems on whichto effect the command, which is usually aresponse to an event.
Take Action commandA Take Action command allows you tosend commands to your managedsystems, either automatically, in responseto a situation that has fired (that is,turned true), or manually, as the TivoliEnterprise Portal operator requires. WithTake Action commands, you can enter acommand or select one of the commandspredefined by your product and run it onany system in your managed network.Thus you can issue Take Actioncommands either against the managedsystem where the situation fired or adifferent managed system in yournetwork.
TCP/IPSee Transmission ControlProtocol/Internet Protocol.
TDW See Tivoli Data Warehouse.
telnet A terminal emulation program used onTCP/IP networks. You can start a telnetsession with another system and entercommands that execute on that system. Avalid user ID and password for thatremote system are required.
thresholdA level set in the system at which amessage is sent or an error-handlingprogram is called. For example, in a userauxiliary storage pool, the user can set thethreshold level in the system values, andthe system notifies the system operatorwhen that level is reached.
Tivoli Data WarehouseThis member of the IBM Tivoli
460 IBM Tivoli Monitoring: Tivoli Enterprise Portal User's Guide
Monitoring product family stores TivoliMonitoring agents' monitoring data inseparate relational database tables so youcan analyze historical trends using thatenterprise-wide data. Reports generatedfrom Tivoli Data Warehouse data provideinformation about the availability andperformance of your monitoredenvironment over different periods oftime.
Tivoli Enterprise Monitoring ServerThe host data-management component forIBM Tivoli Monitoring. It receives andstores data from either the agents or othermonitoring servers.
Tivoli Enterprise PortalThe client component of a TivoliEnterprise Portal Server. The TivoliEnterprise Portal provides the graphicaluser interface into monitoring datacollected by the Tivoli EnterpriseMonitoring Server and prepared for userdisplay by the portal server. The TivoliEnterprise Portal comes in two versions:the desktop client and the browser client.
Tivoli Enterprise Portal ServerThe server you log onto and connect tothrough the Tivoli Enterprise Portal client.The portal server connects to the hubTivoli Enterprise Monitoring Server; itenables retrieval, manipulation, andanalysis of data from your enterprise'smonitoring agents.
Tivoli Enterprise Web ServicesAn open standards-based interface to themonitoring server that uses SOAPrequests. Using SOAP, any monitoringagent can be dynamically queried, whichmeans that its performance andavailability data can be processed byexternal applications not a part of IBMTivoli Monitoring.
Tivoli Management ServicesAn integrated, layered architectureconsisting of data-access, communication,and presentation components that enablecross-platform operation and integrationof enterprise-wide data forsystems-management applications. Thesoftware foundation that supports thedevelopment and operations of the TivoliEnterprise Monitoring Server, the Tivoli
Enterprise Portal Server and TivoliEnterprise Portal, and their monitoringagents.
Transmission Control Protocol/Internet ProtocolAn open, portable communicationsprotocol that is the software basis for theInternet.
value of expressionA function in a situation condition, queryspecification, or data view filter orthreshold that uses the raw value of anattribute. A value can be a number, textstring, attribute, or modified attribute.Use this function with any operator.
view A window pane, or frame, in aworkspace. It may contain data from anagent in a chart or table, or it may containa terminal session or browser, forexample. A view can be split into twoseparate, autonomous views.
warehouse proxy agentOne of the Tivoli Monitoring base agents,the warehouse proxy agent passes datafrom either a monitoring agent or theTivoli Enterprise Monitoring Server to theTivoli Data Warehouse. Thismulti-threaded server process can handleconcurrent requests from multiplemonitoring agents to roll off data fromtheir short-term history files to the datawarehouse.
WAV fileWaveform audio format for storing soundin files, developed jointly by Microsoftand IBM.
wildcardAn * (asterisk) used to represent anycharacters that may follow or precedethose entered, such as Sys* to find Systemand SysTray. Used in formulas with theVALUE function or MISSING function (inthe Missing Task List). Used also with theSCAN function, but at the beginning ofthe text as in *Z to find markZ and typeZ.
workspaceThe viewing area of the Tivoli EnterprisePortal window, excluding the Navigator.Each workspace comprises one or moreviews. Every Navigator item has its owndefault workspace and may have multipleworkspaces.
Glossary 461
workspace administration modeA global parameter set in the AdministerUsers editor but which is available onlyfor user IDs with administrator authority.When enabled for a user ID,customization of workspaces, links, andterminal-session scripts automaticallybecomes available to all users connectedto the same Tivoli Enterprise PortalServer.
XML See Extensible Markup Language.
462 IBM Tivoli Monitoring: Tivoli Enterprise Portal User's Guide
Index
Aabout this document viiacknowledgement
open an existing 56administer users 362administration
mode 65advanced filter 92agent not connected to the monitoring
server 310Agent Operations Log
query 204Agent Operations Log workspace 381agents 12
deploy depot workspace 388deployment status workspace 388,
390, 391, 392deployment workspaces 388
all managed systems situations 255AND expression 404, 405application server 454application support events 32architecture 6area chart 106
plot area 111thresholds 112value and category axes 119
ASCII and non-ASCIIgraphic view icon file names 143paste into formula editor 405threshold icon file names 98user ID 357
associate a situation 275associate situations 243attribute groups
pure or sampled 403single-row or multiple-row 403
attributes 417audio files 261Audit Log workspace 382automation
policies 315Average of group 414AVG formula function 414
Bbackground information 315bar chart 104
overlay 116plot area 111thresholds 112value and category axes 119
baselinesadd historical 125add monitored 120add statistics to a chart view 123monitored chart examples 122
BETWEEN formula function 406Boolean AND and OR 404
branching OR expressions 404browser client 11, 453browser view
create 159find 45launching an external web
browser 160link symbols in the URL address 160relative URL reference 160toolbar 159
built-in functions 177
Ccategory axis of chart 119cell functions 406CHANGE formula function 407Change in value 407chart
area 106bar 104circular gauge 108linear gauge 109pie 102plot 105
chart viewscomparison 98
chartscompare situations with 120historical baselining in 125legend label 117model situations with 278monitored baselines examples 122statistical baselining in 123zoom in on an area 44
Check for missing items 408circular gauge 108clear a formula editor cell, column, or
row 405client/server architecture 454color 118column functions 413common event console view
create 150details 151
Common Object Request BrokerArchitecture 454, 459
Compare date/time 408Compare to a time +/- delta 412configure historical data collection 211,
214Configure Tivoli Application Dependency
Discovery Manager Integration 335console
common eventfilter, column value 154quick filter, removing 154
eventquick thresholds, remove 155setting view properties 155
copy the contents of a cell or row in theformula editor 405
CORBA 454COUNT formula function 414Count of group members 414CPU
high on monitoring server 313create a new workspace 68create situation 257creating a new view 81, 99custom audio files 261custom color 118custom navigator views 227
add a child item 230characteristics 227creating a view 228delete a view or item 234edit a view 231edit item properties 232renaming a view or item 233
customer support 447customizing workspace views
creating a new view 81, 99editing a view 82
cut the contents from a formula editorcell or row 405
Ddatabase server 454DATE formula function 408delete or restore a workspace 70delete the contents from a row in the
formula editor 405deploy
depot package list workspace 388status summary by transaction
workspace 390status summary workspace 388
desktop client 455dissociate a situation 276distinguished name
mapping to TEP user ID 356distribute a historical collection to
managed systems 217DLL 455Dynamic Link Library 455dynamic thresholding 286
Eediting a view 82EIB 455EIB Change Log 204EIB change log workspace 384EIB Change Log workspace
accessing the workspace 384what the workspace shows 384
EIF 455map enumerations window 272
© Copyright IBM Corp. 2005, 2012 463
EIF (continued)slot customization window 269
EIF receiverforward event 268
embedded situationedit 405
embedding situations 300emitter activities 332emulator functions 180Enterprise Information Base 455enterprise workspace 53Enterprise-level workspace
Event Details 54enumerated attributes 403event
acknowledgement 55common, console view
filter, column value 154quick filter, removing 154
consolequick thresholds, remove 155setting view properties 155
indicators 25not closing 312not opening 310results workspace 51
event console viewsadding column thresholds 97
Event Integration Facility 455event views 135
common console 151common event console 150graphical representation of the
Navigator 139message log 135situation event console 145Tivoli Enterprise Console 156universal message console 138
event, situationadding notes 57close (pure events) 58view status 56
eventsapplication support mismatch 32pure or sampled 403situation 49
expert advice 250, 262export data 44Extensible Markup Language 456extensions 333
Ffilters
advanced 92formula functions 401in queries 191
findbrowser view 45examples 47notepad view 45table view data 46
fixes, obtaining 446footer label 120formula
situation override 286
formula editorpop-up menu 405
formula functionBoolean AND and OR 404multiple expressions 404
formula functions 401attribute characteristics 403Average of group 414BETWEEN 406cell 406CHANGE 407Count of group members 414DATE 408group 413IN 413ISNULL 408Maximum in group 415Minimum in group 415MISSING 408PCTCHANGE 409REGEX 409SCAN 411STR 411Sum of group 415TIME 412TIMESPAN 412VALUE 412
forwarding the event to an EIFreceiver 268
functionsterminal emulator scripting 177
Ggallery 36general activities 327georeferenced map 456global attributes 417glossary 453graphic view
change default graphics 145create 139creating custom background
image 142custom icons 143style properties 141toolbar 140
groupSee object group
group functions 413See also column functionsAverage of group 414Count of group members 414Maximum in group 415Minimum in group 415Sum of group 415
group objects 373
Hheader label 111historical
baselines in charts 125navigation mode 210
historical collectiondistribute 217
historical configurationchange distribution method 224
historical data collectionconfigure 214configure summarization and
pruning 219create another 220delete historical collection
definition 225overview 207start 223stop 222unconfigure 225
historical reportingdisable 209
historyconfiguration groups 221, 378, 379configuration overview 211configure 211set a time span to view 41, 208
hot-standby 456
IIBM Redbooks 445IBM Support Assistant 445IBM Tivoli Distributed Monitoring and
Application Management Wiki 445IN formula function 413insert a new row in the formula
editor 405integral web server 456Interoperable Object Reference 456IOR 456ISA 445ISNULL formula function 408ITM Audit Log 204
JJava Database Connectivity 456JDBC 457JDBC database query
create 197notes 198symbols used 200
jobname KPDXTRAs 456JSON payload 342JSON update request 342
Kkrarloff utility 456
Llaunch application definitions 349
copy or edit 351create 349delete 351examples 352
LDAP 457Lightweight Directory Access
Protocol 457linear gauge 109
464 IBM Tivoli Monitoring: Tivoli Enterprise Portal User's Guide
linkanchor 75create 71delete 75editing a link definition 74open 40testing 74
link wizardcreate a link 71
link workspacesexamples 76
logical navigator viewsSee custom navigator views
Mmanage
Tivoli Enterprise Monitoring Serversituations 387
manage monitoring serverworkspace 385
managed systemadd view 383copying a list 376creating a list 375deleting lists 377editing a list 377EIB Change Log workspace 384
accessing the workspace 384monitoring status 380predefined groups 375removing 397Self-Monitoring Topology workspace
accessing the workspace 384what the workspace shows 384
status workspace 380managed system groups 375
copying 376creating 375deleting 377editing 377predefined 16, 375
managed system listsSee managed system groups
managed systemsfind 28
managing the environment 373MAX function 415Maximum in group 415menu 7message log view 135
adding column thresholds 97edit properties 137set a row limit 137set or remove a quick filter 137set or remove a quick threshold 137what the view shows 136
Microsoft Management Console 457MIN function 415Minimum in group 415MISSING formula function 408MMC 457model situation 277
overview and limitations 277window 279
model situationswith an existing situation 279
model situations (continued)with view data 278
monitoring agentsadding a managed system 394configuring a managed system 395introduction 12recycling 393removing 397starting an offline 393stopping 393updating 396
monitoring serverSee also TEMSattribute groups 417high CPU 313
more... indicators 26move a view 43
NNAT 457navigator 23
collapse and expand 28expand in increments 26item properties 232refresh 31remove offline managed system 33removing an event item 33tour 18view toolbar 24
Navigatorfind items 28open 30
navigator viewsSee also custom navigator viewslist for current item 239
Network Address Translation 458new in this release 1
v6.2.2 4v6.2.2 fix pack 2 3
notepad viewadding 161
Oobject group
editor 373object groups
historical configuration 221, 378, 379introduction 373managed system 375
ODBC 458ODBC database query
create 197create another query 199notes 198symbols used 200
offline managed systems 33On Demand Report 337Open Database Connectivity 458optimizing resources 397override situation 286overrides
creating situation 287enabling or disabling situation 290modeling expression 296
overrides (continued)removing situation 291
Ppaste into a formula editor cell or
row 405PCTCHANGE formula function 409Percent change in value 409Persistent Datastore 456pie chart 102plot chart 105
area chartoverlay 116
overlay 116plot area 111thresholds 112value and category axes 119
policiescopy 319deleting 320editing 319predefined 16rename 319start or stop 321workflow editor 325workflows window 322
policy 315create a new 316details list 323Tivoli Application Dependency
Discovery Manager 340view details 316
predefined objects 16predefined situations 255predefined workspace
deploy depot package list 388deployment status summary 388
print 48problem resolution 445properties
chart legend label 117footer label 120header label 111tour 21workspace 67, 87
properties editor 86configuration 91configuration tab 164filters 89query 88style 92thresholds 90view
properties 88pure events 403
Qqueries
custom 191predefined 16Tivoli Enterprise Monitoring Server
predefined 204understanding 191
Index 465
queryadding a database to the list 200assign to a view 84creating a query to the monitoring
server 193deleting 203editing 201formula functions 401JDBC or ODBC database 197, 198symbols 196to the monitoring server 191
query editorcolumn functions 413
query to the monitoring server 191create 193creating another query 195
query-based views 83bar chart 104filtering 85pie chart 102set a time span to display 41, 208
RRedbooks 445reflex automation 264refresh
on demand or intervals 39REGEX formula function 409release information 1repeating 405Return a subset of the string 411
Ssampled events 241save a workspace 68Scan for a string based on Regular
Expression pattern 409Scan for string within a string 411SCAN formula function 411search 45Secure Sockets Layer API 459See if Null has been detected 408See if value is within a range 406self-monitoring
topology workspace 384Self-Monitoring Topology workspace
accessing the workspace 384what the workspace shows 384
Send a Tivoli Application DependencyDiscovery Manager Update 336
JSON update request 342Value substitution 339
Send an e-mail 340Simple Network Management
Protocol 459Simple Object Access Protocol 459single sign-on 459Situation Definition query 205situation editor
action tab 251Action tab 264Distribution tab 249, 261EIF tab 253expert advice 250
situation editor (continued)Expert Advice tab 262Formula tab 247tree 246until 254Until tab 266
situation event console view 145applying filters and thresholds 148what the view shows 146
situation events 49situation override
limitations 288Situation State Events 205Situation Status 205Situation Status Current 206Situation Status Log 206situations 241
add expression overrideswindow 291
all managed systems 255association with Navigator items 274compare to chart values 120correlating 301create 257creating overrides 287delete 285edit 284edit embedded 405editor 245embedding 300enabling or disabling overrides 290event indicators 25event overview 49examples 307examples of conditional
expressions 263formula functions 401formula override 286model expression overrides 296modeling 277modeling an existing situation 279modeling with view data 278open the editor 243overview 241playing sound 260predefined 16, 255remove overrides 291starting or stopping 273Tivoli Enterprise Monitoring
Server 256, 400tour 20tree filter 244troubleshooting 309Tutorial: Correlating situations 304workspace 51
situations editorgroup functions 413
SNMP 459SOAP 459Software Support 445
contacting 447receiving weekly updates 446
soundoff 59
SQL 459SQL custom queries
symbols used 200
SSL 459SSO 459statistical calculations
compare to chart values 123status
managed system 380status bar 11STR formula function 411Structured Query Language 460SUM function 415Sum of group 415summarization and pruning 219support assistant 445Support Assistant 445SYSADMIN 367
Ttable
examples of find function 47table view 94
adding column thresholds 97column adjustments 95create 94custom thresholds 98features 95find data 46multiple pages 95
tablesmodel situations with 278
tacmdacceptBaseline 287addCalendarEntry 287createEventDest 268histListCollections 211setOverride 287suggestBaseline 287upgradeAgent 396
TADDMConfigure Tivoli Application
Dependency Discovery ManagerIntegration 335
Request Parameters JSON updaterequest 342
Send a Tivoli Application DependencyDiscovery Manager Update 336
TADDM initialization policy 340TADDM_Event 340TADDM_Initialization 340
take action 344create 344edit 346in a situation 264rules and guidelines 348send a command 346
take action commandsuser ID for 369
take action viewcreate 161, 348
TCP/IP 460TDW 460telnet 460Terminal Emulator scripting language
constants and variables 170flow control statements 173operators and expressions 171script syntax 168
466 IBM Tivoli Monitoring: Tivoli Enterprise Portal User's Guide
terminal view 162adding 162managing scripts 167properties 164recording a script 167running a script 166script functions 177scripting language 168what the view shows 163
text scripting languagein expert advice 263
thresholdschart 112creating dynamic situation 287enabling or disabling dynamic
situation 290formula functions 401model expression overrides 296removing dynamic situation 291
TIME formula function 412TIMESPAN formula function 412timestamp attributes 403title bar 7title bar and toolbar
view 41title of a view 111Tivoli Application Dependency Discovery
Manager 342See TADDM
Tivoli Enterprise Console eventviewer 156
disabled view 159Tivoli Enterprise Console event viewer
and console toolbars 157buttons 158
Tivoli Enterprise Monitoring Agentsmanage through the portal 387
Tivoli Enterprise Monitoring Serversituations 256, 400status 385workspace 385workspaces 398
Tivoli Enterprise Monitoring Serverpredefined queries
monitoring serverpredefined queries 204
Tivoli Enterprise Portalnew in this release 1resource optimization 397tour 18window 7
TMS Infrastructure view 133creating 134style properties 131what the view shows 134
toolbar 8topology view
creating 128manipulating 129Self-Monitoring Topology workspace
accessing the workspace 384what the workspace shows 384
self-monitoring workspace 384toolbar and options 129understanding the view 127
Transmission Control Protocol/InternetProtocol 461
troubleshootingevent
not closing 312not opening 310
high CPU on monitoring server 313troubleshooting logon error
messages 369tutorial 18
Correlating situations 304
UUniversal Message console view 138Universal Message Events 264universal message view
adding column thresholds 97Until clause in a situation 254Until modifier 266update request, JSON 342upgrade
historical distribution method 211,224
URL in browser view 160user administration 355
applications 366default user 367granting access to a user 368major controls 367managing user groups 359managing user IDs 355members 367Navigator views 366permissions 362SYSADMIN logon ID 367troubleshooting logon error
messages 369user ID and groups 367user ID for Take Action
commands 369Users and User Groups window 362validating user access 368workspace administration mode 367
user groups 359adding 360removing 361reviewing and editing 361viewing memberships 359
user IDs 355adding a user ID 357default user 358removing a user ID 358viewing and editing a user ID 356
user-defined functions 176
Vvalue axis of chart 119VALUE formula function 412Value of expression 412Value of expression IN 413version
new in 6.2.2 4new in 6.2.2 Fix Pack 2 3
viewassign a query to 84create 81, 99
view (continued)create navigator 228edit 82export data 44move 43print 48query-based 83
view propertiesconfiguration 91filters 89query 88style 92thresholds 90
viewschart 98customize 81event 135table 94terminal 162title bar and toolbar 41tour 19
visual baseliningfor modeling expression
overrides 296for situation modeling 277of historical data in chart views 125of situation thresholds in chart
views 120of statistical function results in chart
views 123with charts 120
WWAV file 461web client
See See browser clientwhat is new 1wiki 445wildcard 461window 7
new 37Windows Dynamic Link Library 455workflow editor
Configure Tivoli ApplicationDependency Discovery ManagerIntegration 335
emitter activities 327, 332emitter settings 333extensions 333general activities 327grapher view 327On Demand Report 337Send a Tivoli Application Dependency
Discovery Manager Update 336Send an e-mail 340Value substitution 339
workflows 322policy details 323
workspaceadministration mode 65create new 67creating links 71customize 61delete 70delete or restore 70edit 69
Index 467
workspace (continued)gallery 36historical navigation mode 210link 40open 36print 48properties 67, 87refresh 39rename 69restore original 70save 68suspend and stop refresh 40tabbed 38tabbed workspaces 38tour 18Tutorial: Defining a workspace 63
workspace viewscustomize 81
workspacesagent deployment 388characteristics 35design guidelines and tips 61link examples 76overview 35predefined 16Tivoli Enterprise Monitoring
Server 398
XXML 462
Zz/OS
RACF or ACF/2 for uservalidation 368
zoom a chart view 44
468 IBM Tivoli Monitoring: Tivoli Enterprise Portal User's Guide


����
Printed in USA
SC32-9409-05