tm 5-815-1 air pollution control systems for boilers and ... · pdf fileair pollution control...
TRANSCRIPT

NAVFAC DM 3.15 ARMY TM 5-815-1 AIR FORCE AFR 19 - 6
AIR POLLUTION CONTROL SYSTEMS FOR
BOILERS AND INCINERATORS
DEPARTMENTS OF THE ARMY AND THE AIR FORCEMAY 1988

REPRODUCTION AUTHORIZATION/RESTRICTIONS
This manual has been prepared by or for the Government and, except to the extentindicated below, is public property and not subject to copyright.
Copyright material included in the manual has been used with the knowledge andpermission of the proprietors and is acknowledged as such at point of use. Anyonewishing to make further use of any copyrighted materials, by itself and apartfromthis text, should seek necessary permission directly from the proprietors.
Reprints or republications of this manual should include a credit substantially asfollows: “Joint Departments of the Army and Air Force, U.S., Technical ManualTM 5-815-l/AFR 19-6, AIR POLLUTION CONTROL SYSTEMS FORBOILERS AND INCINERATORS.”
If the reprint or republication includes copyrighted material, the credit should alsostate: “Anyone wishing to make, further use of copyrighted materials, by itself andapart from this text, should seek necessary permission directly from the pro-prietors.”

*TM 5-815-1/AFR 19-6
Technical ManualNo. 5-815-1AIR FORCE REGULATION
HEADQUARTERSDEPARTMENT OF THE ARMY AND
THE AIR FORCENo. 19-6 WASHINGTON, D.C., 9 May 1988
AIR POLLUTION CONTROL SYSTEMS FORBOILERS AND INCINERATORS
Paragraph
GENERALPage
l - l1 - 2l - 3l - 4
l - ll - ll - ll - l
2 - l 2 - l2-2 2 - l2-3 2 - l2-4 2 - l2-5 2 - l2-6 2-32-7 2-32-8 2-6
3 - l 3 - l3-2 3 - l3-3 3 - l3-4 3-23-5 3-23-6 3-33-7 3-33-8 3-43-9 3-6
4 - l 4 - l4-2 4 - l4-3 4 - l4-4 4-24-5 4-34-6 4-34-7 4-3
5 - l 5 - l5-2 5 - l5-3 5 - l5-4 5-35-5 5-3
6 - l 6 - l6-2 6-16-3 6 - l6-4 6-56-5 6-66-6 6-126-7 6-136-8 6-156-9 6-16
*This manual supersedes TM5-815-1; AFR 19-6; NAVFAC DM3.15, dated November 1980.
i
Chapter 1.Purpose . . . . . . . . . . . . . . . . . . . . . . . . . . . . . . . . . . . . . . . . . . . . . . . . . . . . . . . . . . . . . . . . . . . . . . . .Scope . . . . . . . . . . . . . . . . . . . . . . . . . . . . . . . . . . . . . . . . . . . . . . . . . . . . . . . . . . . . . . . . . . . . . . .Unique control problems . . . . . . . . . . . . . . . . . . . . . . . . . . . . . . . . . . . . . . . . . . . . . . . . . . .Economic considerations . . . . . . . . . . . . . . . . . . . . . . . . . . . . . . . . . . . . . . . . . . . . . . . . . . . . .
Chapter 2. INCINERATOR EMISSIONSIncineration . . . . . . . . . . . . . . . . . . . . . . . . . . . . . . . . . . . . . . . . . . . . . . . . .Types of incinerator waste materials . . . . . . . . . . . . . . . . . . . . . . . . . . . . . . . .Functions of incinerators . . . . . . . . . . . . . . . . . . . . . . . . . . . . . . . . . . . .Effect of waste properties . . . . . . . . . . . . . . . . . . . . . . . . . . . . . . . . . . . . . . . . . .Types of incinerators . . . . . . . . . . . . . . . . . . . . . . . . . . . . . . . . . . . . . . . . . . . . . . .Particulate emission standards . . . . . . . . . . . . . . . . . . . . . . . . . . . . . . . . . . . . . .Particulate emission estimating . . . . . . . . . . . . . . . . . . . . . . . . . . . . . . . . . . . . . . .Sample calculations . . . . . . . . . . . . . . . . . . . . . . . . . . . . . . . . . . . . . . . . . . . . . . . . . . .
Chapter 3. BOILER EMISSIONSGeneration processes . . . . . . . . . . . . . . . . . . . . . . . . . . . . . . . . . . . . . . . . . . . . . . . . .Types of fuels . . . . . . . . . . . . . . . . . . . . . . . . . . . . . . . . . . . . . . . . . . . . . . . . . . . . . .Fuel burning systems . . . . . . . . . . . . . . . . . . . . . . . . . . . . . . . . . . . . . . . . . . . . . .Emissionstandards . . . . . . . . . . . . . . . . . . . . . . . . . . . . . . . . . . . . . . . . . . . . . . . . .Formation of emissions . . . . . . . . . . . . . . . . . . . . . . . . . . . . . . . . . . . . . . . . . . . . .Fuel selection . . . . . . . . . . . . . . . . . . . . . . . . . . . . . . . . . . . . . . . . . . . . . . . .Emission factors . . . . . . . . . . . . . . . . . . . . . . . . . . . . . . . . . . . . . . . . . . . . .Opacity . . . . . . . . . . . . . . . . . . . . . . . . . . . . . . . . . . . . . . . . . . . . . . . . . . . . . . .Sample problems of emissions estimating . . . . . . . . . . . . . . . . . . . . . . . . . . . . . . .
Chapter 4. STACK EMISSION REGULATIONS AND THE PERMITTING PROCESS
Stack emissions ................ . . . . . . . . . . . . . . . . . . . . . . . . . . . . . . .Air quality standards ........... . . . . . . . . . . . . . . . . . . . . . . . . . . . . . . . . . . . . .Permit acquisition process . . . . . . . . . . . . . . . . . . . . . . . . . . . . . . . . . . . . . . . . . . . .Mathematical modeling . . . . . . . . . . . . . . . . . . . . . . . . . . . . . . . . . . . .Monitoring . . . . . . ..................... . . . . . . . . . . . . . . . . . . . . . . . .Presentation and hearings . . . . . . . . . . . . . . . . . . . . . . . . . . . . . . . .Factors affecting stack design . . . . . . . . . . . . . . . . . . . . . . . . . . . . . ....MEASURING TECHNIQUESCriteria.. . . . . . . . . . . . . . . . . . . . . . . . . . . . . . . . . . . . . . . . . . . . . . . . . . . . . . . . . . . . . . . . . .Stack and source measurement techniques . . . . . . . . . . . . . . . . . . . . . . . . . . . . . . . . . . . .Meteorological and ambient air measurement . . . . . . . . . . . . . . . . . . . . . . . . . . . . . . . . . .Flue gas sampling ports . . . . . . . . . . . . . . . . . . . . . . . . . . . . . . . . . . . . . . . . . . . . . . . . . . . .Air pollution project contacts . . . . . . . . . . . . . . . . . . . . . . . . . . . . . . . . . . . . . . . . . . . . . . . .
CYCLONES AND MULTICYCLONESCyclone.. . . . . . . . . . . . . . . . . . . . . . . . . . . . . . . . . . . . . . . . . . . . . . .Cyclone types . . . . . . . . . . . . . . . . . . . . . . . . . . . . . . . . . . . . . . . . . . . . . . . . . .Cyclone collection efficiency . . . . .. . . . . . . . . . . . . . . . . . . . . . . . . . . . . . . . . . . . . . .
Chapter 5.
Chapter 6.
Cyclone pressure drop and energy requirements . . . . . . . . . . . . . . . . . . . . . . . . . . . .Application . . . . . . . . . . . . . . . . . . . . . . . . . . . . . . . . . . . . . . . . . . . .Cyclone performance . . . . . . . . . . . . . . . . . . . . . . . . . . . . . . . . . . . . . . . . .Cyclone operation . . . . . . . . . . . . . . . . . . . . . . . . . . . . . . . . . . . . . . .Selection of materials . . . . . . . . . . . . . . . . . . . . . . . . . . . . . . . . . . .Advantages and disadvantages . . . . . . . . . . . . . . . . . . . . . . . . . . . . . . . . . . . .

*TM 5-815-1/AFR 19-6
Chapter 7.
Chapter 8.
Chapter 9.
Chapter 10.
Chapter 11.
Chapter 12.
Chapter 13.
Appendix A:
Bibliography
Glossary
ii
HIGH AND LOW ENERGY SCRUBBER SYSTEMSScrubbers . . . . . . . . . . . . . . . . . . . . . . . . . . . . . . . . . . . . . . . . . . . . . . . . . . . . . . . . . . . . . . . . . . . . . . .Types of scrubbers . . . . . . . . . . . . . . . . . . . . . . . . . . . . . . . . . . . . . . . . . . . . . . . . . . . . . . . . . . . . . . .Application . . . . . . . . . . . . . . . . . . . . . . . . . . . . . . . . . . . . . . . . . . . . . . . . . . . . . . . . . . . . . . . . . . . . . .Treatment and disposal of waste materials . . . . . . . . . . . . . . . . . . . . . . . . . . . . . . . . . . . . . . . . . .Selection of materials . . . . . . . . . . . . . . . . . . . . . . . . . . . . . . . . . . . . . . . . . . . . . . . . . . . . . . . . . . . . .Auxiliary equipment . . . . . . . . . . . . . . . . . . . . . . . . . . . . . . . . . . . . . . . . . . . . . . . . . . . . . . . . . . . . . .Advantages and disadvantages.. . . . . . . . . . . . . . . . . . . . . . . . . . . . . . . . . . . . . . . . . . . . . . . . . . . .
ELECTROSTATIC PRECIPITATORSElectrostatic precipitator (ESP) . . . . . . . . . . . . . . . . . . . . . . . . . . . . . . . . . . . . . . . . . . . . . . . . . . .Types of electrostatic precipitators . . . . . . . . . . . . . . . . . . . . . . . . . . . . . . . . . . . . . . . . . . . . . . . . .Modes of operation . . . . . . . . . . . . . . . . . . . . . . . . . . . . . . . . . . . . . . . . . . . . . . . . . . . . . . . . . . . . . . .Applications . . . . . . . . . . . . . . . . . . . . . . . . . . . . . . . . . . . . . . . . . . . . . . . . . . . . . . . . . . . . . . . . . . . . .Performance . . . . . . . . . . . . . . . . . . . . . . . . . . . . . . . . . . . . . . . . . . . . . . . . . . . . . . . . . . . . . . . . . . . . .Description of Components . . . . . . . . . . . . . . . . . . . . . . . . . . . . . . . . . . . . . . . . . . . . . . . . . . . . . . . .Control systems . . . . . . . . . . . . . . . . . . . . . . . . . . . . . . . . . . . . . . . . . . . . . . . . . . . . . . . . . . . . . . . . .Advantages and disadvantages . . . . . . . . . . . . . . . . . . . . . . . . . . . . . . . . . . . . . . . . . . . . . . . . . . . . .
FABRIC FILTERSFabric filtration . . . . . . . . . . . . . . . . . . . . . . . . . . . . . . . . . . . . . . . . . . . . . . . . . . . . . . . . . . . . . . . . . .Types of filtering systems . . . . . . . . . . . . . . . . . . . . . . . . . . . . . . . . . . . . . . . . . . . . . . . . . . . . . . . . .Fabric characteristics and selection . . . . . . . . . . . . . . . . . . . . . . . . . . . . . . . . . . . . . . . . . . . . . . . . .Materials and construction . . . . . . . . . . . . . . . . . . . . . . . . . . . . . . . . . . . . . . . . . . . . . . . . . . . . . . . .Auxiliary equipment and control systems . . . . . . . . . . . . . . . . . . . . . . . . . . . . . . . . . . . . . . . . . . .Energy requirements . . . . . . . . . . . . . . . . . . . . . . . . . . . . . . . . . . . . . . . . . . . . . . . . . . . . . . . . . . . . .Application . . . . . . . . . . . . . . . . . . . . . . . . . . . . . . . . . . . . . . . . . . . . . . . . . . . . . . . . . . . . . . . . . . . . . .Performance . . . . . . . . . . . . . . . . . . . . . . . . . . . . . . . . . . . . . . . . . . . . . . . . . . . . . . . . . . . . . . . . . . . . .Advantages and disadvantages.. . . . . . . . . . . . . . . . . . . . . . . . . . . . . . . . . . . . . . . . . . . . . . . . . . . .
SULFUR OXIDES (SOx) CONTROL SYSTEMSFormation of sulphur oxides (SOx) . . . . . . . . . . . . . . . . . . . . . . . . . . . . . . . . . . . . . . . . . . . . . . . . . .Available methods for reducing SOx emission . . . . . . . . . . . . . . . . . . . . . . . . . . . . . . . . . . . . . . . .Procedure to minimize SOx emission . . . . . . . . . . . . . . . . . . . . . . . . . . . . . . . . . . . . . . . . . . . . . . . .Sample problems . . . . . . . . . . . . . . . . . . . . . . . . . . . . . . . . . . . . . . . . . . . . . . . . . . . . . . . . . . . . . . . . .
NITROGEN OXIDES (NOx) CONTROL AND REDUCTION TECHNIQUESFormation of nitrogen oxides . . . . . . . . . . . . . . . . . . . . . . . . . . . . . . . . . . . . . . . . . . . . . . . . . . . . . .Factors affecting NOx emissions . . . . . . . . . . . . . . . . . . . . . . . . . . . . . . . . . . . . . . . . . . . . . . . . . . .NOx reduction techniques . . . . . . . . . . . . . . . . . . . . . . . . . . . . . . . . . . . . . . . . . . . . . . . . . . . . . . . . .Post combustion systems for NOx reduction . . . . . . . . . . . . . . . . . . . . . . . . . . . . . . . . . . . . . . . . .Step-by-step NOx method . . . . . . . . . . . . . . . . . . . . . . . . . . . . . . . . . . . . . . . . . . . . . . . . . . . . . . . . .
EMISSION CONTROL EQUIPMENT SELECTION FOR INCINERATORS ANDBOILERS
Principles of selection . . . . . . . . . . . . . . . . . . . . . . . . . . . . . . . . . . . . . . . . . . . . . . . . . . . . . . . . . . . . .Flue gas properties . . . . . . . . . . . . . . . . . . . . . . . . . . . . . . . . . . . . . . . . . . . . . . . . . . . . . . . . . . . . . . .Particulate properties . . . . . . . . . . . . . . . . . . . . . . . . . . . . . . . . . . . . . . . . . . . . . . . . . . . . . . . . . . . .Application of emission control systems for boilers . . . . . . . . . . . . . . . . . . . . . . . . . . . . . . . . . . .Municipal solid waste boilers and boilers using refuse derived fuels . . . . . . . . . . . . . . . . . . . . .Applications of emission control systems for incinerators . . . . . . . . . . . . . . . . . . . . . . . . . . . . . .Technical evaluation of control equipment . . . . . . . . . . . . . . . . . . . . . . . . . . . . . . . . . . . . . . . . . . .Tradeoffs and special considerations . . . . . . . . . . . . . . . . . . . . . . . . . . . . . . . . . . . . . . . . . . . . . . . .
FLUIDIZED BED BOILERSFluidized bed boilers . . . . . . . . . . . . . . . . . . . . . . . . . . . . . . . . . . . . . . . . . . . . . . . . . . . . . . . . . . . . .Types of fluidized bed boilers . . . . . . . . . . . . . . . . . . . . . . . . . . . . . . . . . . . . . . . . . . . . . . . . . . . . . .Applications.. . . . . . . . . . . . . . . . . . . . . . . . . . . . . . . . . . . . . . . . . . . . . . . . . . . . . . . . . . . . . . . . . . . .Fluidized bed performance . . . . . . . . . . . . . . . . . . . . . . . . . . . . . . . . . . . . . . . . . . . . . . . . . . . . . . . .Materials and construction . . . . . . . . . . . . . . . . . . . . . . . . . . . . . . . . . . . . . . . . . . . . . . . . . . . . . . . .Auxiliary equipment . . . . . . . . . . . . . . . . . . . . . . . . . . . . . . . . . . . . . . . . . . . . . . . . . . . . . . . . . . . . . .Advantages and disadvantages.. . . . . . . . . . . . . . . . . . . . . . . . . . . . . . . . . . . . . . . . . . . . . . . . . . . .
REFERENCES
Paragraph Page
7 - l 7 - l7-2 7 - l7-3 7-67-4 7-67-5 7-67-6 7-77-7 7-9
8 - l 8-18-2 8-18-3 8 - la-4 8 - l8-5 8-38-6 8-38-7 8-58-8 8-7
9 - l 9 - l9-2 9 - l9-3 9-49-4 9-89-5 9-109-6 9-109-7 9-109-8 9-119-9 9-11
10- l10-210-310-4
11-l11-211-311-411-5
10-l10-l10-710-9
11- l11-l11-211-411-5
12-1 12-112-2 12-112-3 12-212-4 12-212-5 12-412-6 12-512-7 12-612-8 12-6
13-113-213-313-413-513-613-7
13-113-113-613-813-813-913-10
A - l
Biblio-1
Gloss-l

*TM 5-815-1/AFR 19-6
LIST OF FIGURES
Figure No.
l - l .
6-1.6-2.6-3.6-4.6-5.6-6.6-7.6-8.
Title
Emissions control procedure . . . . . . . . . . . . . . . . . . . . . . . . . . . . . . . . . . . . . . . . . . . . . . . . . . . . . . . . . . . . . . . . . . . . . .
Cycloneconfiguration.. . . . . . . . . . . . . . . . . . . . . . . . . . . . . . . . . . . . . . . . . . . . . . . . . . . . . . . . . . . . . . . . . . . . . . . . . . .Types of cyclones in common use . . . . . . . . . . . . . . . . . . . . . . . . . . . . . . . . . . . . . . . . . . . . . . . . . . . . . . . . . . . . . . . . . .Relative effect of cyclone dimensions on efficiency . . . . . . . . . . . . . . . . . . . . . . . . . . . . . . . . . . . . . . . . . . . . . . . . . . .Efficiency curve and dimensions for a high efficiency single cyclone . . . . . . . . . . . . . . . . . . . . . . . . . . . . . . . . . . . .Parallel and series arrangement for cyclones.. . . . . . . . . . . . . . . . . . . . . . . . . . . . . . . . . . . . . . . . . . . . . . . . . . . . . . .Efficiency curve and illustration of a multicyclone unit . . . . . . . . . . . . . . . . . . . . . . . . . . . . . . . . . . . . . . . . . . . . . . .Size-efficiency curve for high-efficiency (long cone) irrigated cyclone . . . . . . . . . . . . . . . . . . . . . . . . . . . . . . . . . . .Particle size distributions curve (by weight) of particulate emitted from uncontrolled power plants
(pulverized coal fired boiler) . . . . . . . . . . . . . . . . . . . . . . . . . . . . . . . . . . . . . . . . . . . . . . . . . . . . . . . . . . . . . . . . . . . .Fractional efficiency curves . . . . . . . . . . . . . . . . . . . . . . . . . . . . . . . . . . . . . . . . . . . . . . . . . . . . . . . . . . . . . . . . . . . . . . .Effect of smaller cyclones in parallel on theoretical cyclone collection efficiency . . . . . . . . . . . . . . . . . . . . . . . . .Effect of altering individual cyclone dimensions on theoretical collection efficiency for an 8 inch diameter
Page
1-2
6-26-36-56-66-76-86-9
6-106-116-12
6-9.6-10.6-11.
6-136-146-15
7-27-37-47-57-57-67-7
8-28-48-58-6
9-29-39-49-69-79-8
10-510-610-710-810-810-9
11-2
13-113-213-313-413-513-613-713-813-9
cyclone . . . . . . . . . . . . . . . . . . . . . . . . . . . . . . . . . . . . . . . . . . . . . . . . . . . . . . . . . . . . . . . . . . . . . . . .Effects of cyclone inlet velocity and grain loading . . . . . . . . . . . . . . . . . . . . . . . . . . . . . .Effects of gas viscosity, dust specific gravity, and dust particle size distribution . . . . . . . .
6-12.6-13.
7 - l .7-2.7-3.7-4.7-5.7-6.7-7.
8-1.8-2.8-3.8-4.
9 - l .9-2.9-3.9-4.9-5.9-6.
10-l.10-2.10-3.10-4.10-5.10-6.
11-l.
13-l.13-2.13-3.13-4.13-5.13-6.13-7.13-8.13-9.
Plate type scrubber . . . . . . . . . . . . . . . . . . . . . . . . . . . . . . . . . . . . . . . . . . . . . . . . . . . . . . . . .Types of spray and centrifugal scrubbers . . . . . . . . . . . . . . . . . . . . . . . . . . . . . . . .Types of entrainment and moving bed scrubbers . . . . . . . . . . . . . . . . . . . . . . . . . . . . . .Gas atomized spray (venturi) scrubber . . . . . . . . . . . . . . . . . . . . . . . . . . . .Throat sections of variable venturi scrubbers . . . . . . . . . . . . . . . . . . . . . . . . . . . . . . . . .Spray dryer system . . . . . . . . . . . . . . . . . . . . . . . . . . . . . . . . . . . . . . . . . .Schematic diagram of scrubber flow . . . . . . . . . . . . . . . . . . . . . . . . . . . . . . . . . . . . .
Schematic views of flat and tubular surface type electrostatic precipitators . . . . . . . . . . . . . . . . . . .Operating ranges for hot/cold electrostatic precipitators . . . . . . . . . . . . . . . . . . . . . . . . . . . . .Factors affecting particle resistivity . . . . . . . . . . . . . . . . . . . . . . . . . . . . . . . . . . . . . . . . . . . . . . . . . . . . . . . . .Bus sections vs. efficiency for different sulfur percentages in coal . . . . . . . . . . . . . . . . . . . . . . . . . . . . . . . . .
Typical baghouse (shake clean) ............... . . . . . . . . . . . . . . . . . . . . . . . . . . . . . . . . . . . . .Fabric filter housing design . . . . . . . . . . . . . . . . . . . . . . . . . . . . . . . . . . . . . . . . . . . . . . .Filter shape and arrangement . . . . . . . . . . . . . . . . . . . . . . . . . . . . . . . . . . . . . . . . . . .Reverse flow baghouse (without bag collapse) . . . . . . . . . . . . . . . . . . . . . . . . . . . . . .Reverse flow cleaning (with bag collapse) . . . . . . . . . . . . . . . . . . . . . . . . . . . . . . . . . . . . . .Pulse-jet baghouse . . . . . . . . . . . . . . . . . . . . . . . . . . . . . . . . . . . . . . . . . . . . . . . .
Lime (limestone) injection system schematic . . . . . . . . . . . . . . . . . . . . . . . . . . . . . . . . . . . . . . .Magnesia slurry SO2 recovery process . . . . . . . . . . . . . . . . . . . . . . . . . . . . . . . . . . . . . . . . . . . . .Wellman-Lord SO2 reduction system . . . . . . . . . . . . . . . . . . . . . . . . . . . . . . . . . . . . .Catalytic oxidation system . . . . . . . . . . . . . . . . . . . . . . . . . . . . . . . . . . . . . . . . . .Single alkali sodium carbonate scrubber . . . . . . . . . . . . . . . . . . . . . . . . . . . . . . . . . . . . .Dual alkali system . . . . . . . . . . . . . . . . . . . . . . . . . . . . . . . . . . . . . . . . . . . . . . . . .
Possible NO, reductions vs. load reductions . . . . . . . . . . . . . . . . . . . . . . . . . . . . . . . . . . . . . . . . . . . . . . . . . . . . . . . .
Types of fluid bed combustors size comparison . . . . . . . . . . . . . . . . . . . . . . . . . . . . . . . . . . . . . . . . . . . . . . . . . . . . . .Pressure drop vs. gas velocity . . . . . . . . . . . . . . . . . . . . . . . . . . . . . . . . . . . . . . . . . . . . . . . . . . . . . . . . . . . . . . . . . . . .Velocity vs. bed expansion.. . . . . . . . . . . . . . . . . . . . . . . . . . . . . . . . . . . . . . . . . . . . . . . . . . . . . . . . . . . . . . . . . . . . . . .Bubbling bed boiler I . . . . . . . . . . . . . . . . . . . . . . . . . . . . . . . . . . . . . . . . . . . . . . . . . . . . . . . . . . . . . . . . . . . . . . . . . . . .Bubbling bed boiler II . . . . . . . . . . . . . . . . . . . . . . . . . . . . . . . . . . . . . . . . . . . . . . . . . . . . . . . . . . . . . . . . . . . . . . . . . . .Circulating fluid bed boiler system . . . . . . . . . . . . . . . . . . . . . . . . . . . . . . . . . . . . . . . . . . . . . . . . . . . . . . . . . . . . . . . .Dual bed fluidized bed boiler . . . . . . . . . . . . . . . . . . . . . . . . . . . . . . . . . . . . . . . . . . . . . . . . . . . . . . . . . . . . . . . . . . . . . .SO2 reduction vs. combustion temperature . . . . . . . . . . . . . . . . . . . . . . . . . . . . . . . . . . . . . . . . . . . . . . . . . . . . . . . . .NO, emissions vs. combustion temperature . . . . . . . . . . . . . . . . . . . . . . . . . . . . . . . . . . . . . . . . . . . . . . . . . . . . . . . . .
iii

*TM 5-815-1/AFR 19-6
LIST OF TABLES
Table No.2-l.2-2.2-3.2-4.3-l.3-2.3-3.3-4.3-5.3-6.3-7.5-l.5-2.5-3.6-l.6-2.8-1.9-l.9-2.9-3.
10-l.10-2.10-3.10-4.11-l.11-2.
11-3.11-4.12-1.12-2.12-3.
Waste Classifications.. . . . . . . . . . . . . . . . . . . . . . . . . . . . . . . . . . . . . . . . . . . . . . . . . . . . . . . . . . . . . . . . . . . . . . . . . .Ultimate analysis of a typical general solid waste . . . . . . . . . . . . . . . . . . . . . . . . . . . . . . . . . . . . . . . . . . . . . . . .Emission factors for refuse incinerators without controls . . . . . . . . . . . . . . . . . . . . . . . . . . . . . . . . . . . . . . . .Emission factors for sewage sludge incinerators . . . . . . . . . . . . . . . . . . . . . . . . . . . . . . . . . . . . . . . . . . . . . .
Allowable federal emission rates . . . . . . . . . . . . . . . . . . . . . . . . . . . . . . . . . . . . . . . . . . . . . . . . . . . . . . . . . . .Factors relating to particulate emissions . . . . . . . . . . . . . . . . . . . . . . . . . . . . . . . . . . . . . . . . . . . . . . . .Emission factors for bituminous coal combustion without control equipmentEmission factors for fuel oil combustion . . . . . . . . . . . . . . . . . . . . . . . . . . . . . . . . . . . . . . . . . .Emission factors for natural gas combustion . . . . . . . . . . . . . . . . . . . . . . . . . . . . . . . . . . . . . . . .Emission factors for bark and wood waste combustion in boilers . . . . . . . . . . . . . . . . . . . . . . . .Factors affecting NO, emissions . . . . . . . . . . . . . . . . . . . . . . . . . . . . . . . . . . . . . . . . . . . . . .
EPA emission sampling techniques . . . . . . . . . . . . . . . . . . . . . . . . . . . . . . . . . . . . . . . . . . . . . . . . . . . . . . . .Air quality sampling method survey . . . . . . . . . . . . . . . . . . . . . . . . . . . . . . . . . . . . . . . . . . . . . . . . . . . . . .Ringelmannstandards . . . . . . . . . . . . . . . . . . . . . . . . . . . . . . . . . . . . . . . . . . . . . . . . . . . . . . . . . . . . . . . . . . .Cyclone classification . . . . . . . . . . . . . . . . . . . . . . . . . . . . . . . . . . . . . . . . . . . . . . . . . . . . . . . . . .Removal of uncontrolled particulate emissions from combustion processes . . . . . . . . . . . . . . . .Operating characteristics of precipitators . . . . . . . . . . . . . . . . . . . . . . . . . . . . . . . . . . . . . . . . . . .Performance comparison of fabric filter cleaning methods . . . . . . . . . . . . . . . . . . . . . . . . . . . . . . . . .Properties of fibers for high temperature filtration . . . . . . . . . . . . . . . . . . . . . . . . . . . . . . .Operating characteristics of fabric filters . . . . . . . . . . . . . . . . . . . . . . . . . . . . . . . . . . . . . . . . .
Convertibility of steam boilers . . . . . . . . . . . . . . . . . . . . . . . . . . . . . . . . . . . . . . . . . . . . . . . . . . . . . . . . . . . . . . . . . . . . . . . .Performance characteristics of flue-gas desulfurization . . . . . . . . . . . . . . . . . . . . . . . . . . . . . . . . . . . . . . . . . . . . . . . . . . . .Typical analysis of fuel oil types . . . . . . . . . . . . . . . . . . . . . . . . . . . . . . . . . . . . . . . . . . . . . . . . . . . . . . . . . . . . . . . . . . . . . . . .Typical analysis of coal types . . . . . . . . . . . . . . . . . . . . . . . . . . . . . . . . . . . . . . . . . . . . . . . . . . . . . . . . . . . . . . . . . . . . . . . . . .General NO, emission and excess air requirements for fuel types . . . . . . . . . . . . . . . . . . . . . . . . . . . . . . . . . . . . . . . .Possible NO, emission reductions attainable with a 50 percent reduction in excess air from normal levels
(greater than 10% excess air) . . . . . . . . . . . . . . . . . . . . . . . . . . . . . . . . . . . . . . . . . . . . . . . . . . . . . . . . . . . . . . . . . . . . .Possible NO, reductions, percent of normal emissions . . . . . . . . . . . . . . . . . . . . . . . . . . . . . . . . . . . . . . . . . . . . . . . . . .Comparison of NO, reduction techniques . . . . . . . . . . . . . . . . . . . . . . . . . . . . . . . . . . . . . . . . . . . . . . . . . . . . . . . . . . . . .
Range of collection efficiencies for common types of particulate control equipment . . . . . . . . . . . . . . . . . . . . . . . . .Comparison of some dust collector characteristics . . . . . . . . . . . . . . . . . . . . . . . . . . . . . . . . . . . . . . . . . . . . . . . . . . . . .General guidelines in the selection of emission control equipment for boiler flue gases . . . . . . . . . . . . . . . . . . . . . .
Page2-22-l2-42-53-23-43-53-63-73-83-95-l5-l5-36-46-128-39-59-99-12
10-l10-310-1110-1211-2
11-311-411-712-712-812-10
iv

TM 5-815-1/AFR 19-6
CHAPTER 1GENERAL
1-1. Purposea. This manual is designed to facilitate the identifica-
tion of air pollutant emission rates, and the selection ofcontrol equipment required to meet local, state, andfederal compliance levels. Presented herein are fuelclassifications, burning equipment types, emission ratefactors, emission measuring techniques, control equip-ment types, and control methods. Also included arediscussions of stack dispersion techniques, and controlequipment selection.
b. Each control equipment chapter provides per-formance data and equipment limitations which aid inthe comparative selection of control equipment types.Each chapter includes a discussion of the basic controltheory, various equipment types, collection efficiency,pressure drop, operating requirements and limitations,application, materials of construction, and advantagesand disadvantages in relation to other type controlequipment.
1-2. Scopea. This manual has been limited to the application of
control equipment to fuel burning boilers and incin-erators for the purpose of reducing point-source emis-sion rates. A procedural schematic for its use isillustrated in figure 1-l. Although the selection of asite, a fuel, and burning equipment are outside thescope of this manual, there are alternatives available tothe engineer in arriving at the least-cost solution to airpollutant problems. Once these factors have beendecided, boiler or incineration emission rates andreduction requirements can be estimated using chap-ters 2 and 3.
b. If emission rates are in compliance with local,state, and federal regulations for point-sources, theireffect on local air quality must yet be ascertained. Suchfactors as stack height and prevailing meteorologicalconditions, while affecting ambient pollution levels, donot have an effect on point-source emission rates. Theyare considered in this manual only to make the readeraware of their importance. These factors are unique foreach particular site, and usually warrant expert con-sultation. If emission rates for a boiler or incineratorare above local, state or federal requirements, or if air-quality regulations might be violated, selection of apollution control device will be required. The technicaland cost selection of control equipment are embodied inthis manual.
c. Appendix A contains a list of references used inthis manual. A bibliography listing publications of sub-
ject material relating to the topic of this manual can befound at the end of this manual. Also included is aglossary listing abbreviations and a brief definition ofterminology used in the text.
1-3. Unique control problemsMilitary facilities have air pollution control problemswhich are unique to their mission. Among the problemsare those associated with classified waste disposal,ammunition, plant wastes, chemical warfare wastes,hazardous toxic waste, and radioactive wastes. Eachwill require a consultant or a specialist to help solve theunique problem. Therefore, each unique problem willrequire special handling on a case-to-case basis. Themanual does not include any information on treatmentof emissions, or the incineration of these unique mate-rials.
1-4. Economic considerationsThe selection of one particular type of design for amechanical system for a given application when two ormore types of design are known to be feasible must bebased on the results of a life cycle cost analyses, pre-pared in accordance with the requirements of theDepartment of Defense Construction Criteria Manual(DOD 4270.1-M). Standards for the conduct of all eco-nomic studies by and for the Department of the Armyand the Department of the Air Force are contained inAR 11-28 and AFR 178-1, respectively. Subject toguidance resulting from implementation of ExecutiveOrder 12003 and related guidance from DOD, the citedeconomic analysis techniques are to remain valid. Thebasic underlying principles and the most commonlyused techniques of economic analysis are described insome detail in a variety of publications and standardtextbooks on engineering economy such as Principlesof Engineering Economy by Grant, Ireson, and Leav-enworth; guides published by professional organiza-tions such as the American Institute of Architects’ LifeCycle Cost Analysis-a Guide for Architects; andhandbooks prepared by government agencies such asthe Naval Facilities Engineering Command’s “EC O-nomic Analysis Handbook”, NAVFAC P-442. Clar-ification of the basic standards and guidelines for aparticular application and/or supplementary standardsfor guidelines which may be required for special casesmay be obtained by request through normal channels toHeadquarters of the particular service branchinvolved.
1-1

TM 5-815-1/AFR 19-6
U.S. Army Corps of Engineers
Figure 1-1. Emission control procedure.
1-2

TM 5-815-1/AFR 19-6
CHAPTER 2
INCINERATOR EMISSIONS
2-1. IncinerationThis chapter describes and quantifies whenever possi-ble the air pollution particulate emissions which are thedirect result of the incineration process.
a. Incineration process. The incineration processconsists of burning solid, semisolid, liquid, or gaseouswaste to produce carbon dioxide, water, and ash. It isan efficient means of reducing waste volume. The solid,incombustible residue of incineration is inert, sanitary,and sensibly odorless.
b. Emissions. Incineration contributes to air pollu-tion. The polluting emissions are ash, hydrocarbons,sulfur oxides (SO,), nitrous oxides (NO,), chlorides,and carbon monoxide. Estimating absolute quantitiesof these pollutants is not an exact science, but historicaltesting data from typical incinerators allow estimates ofemissions to be made. Also, measurement methods forincinerator emissions are sufficiently advanced to per-mit actual data to be obtained for any existing incin-erator. These measurements are preferred in all casesover analytical estimates.
c. Pollution codes. Air pollution particulate emis-sions must be considered in regard to federal, state andlocal pollution codes. In general, incinerators cannotmeet current pollution code requirements without par-ticulate control devices.
2-2. Types of incinerator waste materialsWaste materials are classified as shown in table 2-l. Anultimate analysis of a typical general solid waste isshown in table 2-2. Because of the wide variation incomposition of waste materials, an analysis of the actualmaterial to be incinerated should be made before sizingincineration equipment.
Table 2-2
Ultimate analysis of a typical general solid wasteMoisture 35.00%Carbon 20.00%Oxygen 18.00%Hydrogen 2.50%Nitrogen 0.60%sulfur 0.06%Noncombustibles 23.84%
100.00%From: Environmental Protection Agency, “Control Techniques forParticulate Emissions for Stationary Sources”
2-3. Function of incineratorsIncinerators are engineered apparatus capable of with-standing heat and are designed to effectively reduce
solid, semi-solid, liquid, or gaseous waste at specifiedrates, so that the residues contain little or no combusti-ble material. In order for an incinerator to meet thesespecifications, the following principles of solid fuel com-bustion generally apply:
-Air and fuel must be in the proper proportion,-Air and fuel, especially combustible gases, must
be properly mixed,-Temperatures must be high enough to ignite both
the solid fuel and the gaseous components,-Furnace volumes must permit proper retention
time needed for complete combustion,-Furnace configurations must maintain ignition
temperatures and minimize fly-ash entrainment.
2-4. Effect of waste propertiesThe variability of chemical and physical properties ofwaste materials, such as ash content, moisture content,volatility, burning rate, density, and heating value,makes control of incineration difficult. All of these fac-tors affect to some degree the operating variables offlame-propagation rate, flame travel, combustion tem-perature, combustion air requirements, and the needfor auxiliary heat. Maximum combustion efficiency ismaintained primarily through optimum incineratordesign.
2-5. Types of incineratorsa. Municipal incinerators. Incinerators are classi-
fied either as large or small units, with the dividingpoint at a processing rate of 50 tons of waste per day.The trend is toward the use of the smaller units becauseof their lower cost, their simplicity, and lower air emis-sion control requirements. There are three major typesof municipal incinerators.
(1) Rectangular incinerators. The most commonmunicipal incinerator is the rectangular type.The multiple chamber units are either refrac-tory lined or water cooled and consist of acombustion chamber followed by a mixingchamber. The multicell units consist of two ormore side-by-side furnace cells connected to acommon mixing chamber. Primary air is fedunder the grate. Secondary air is added in themixing chamber to complete combustion. Asettling chamber often follows the mixingchamber. Ash is removed from pits in the bot-tom of all of the chambers.
2-1

TM 5-815-1/AFR 19-6
TABLE 2-1
WASTE CLASSIFICATIONS
TYPE
0
1
2
3
4
5
6
APPROXI-MATECOMPOSI-
DESCRIP- PRINCIPAL TION %TION COMPONENTS BY WEIGHT
Trash Highly combustible waste; Trash 100paper, wood, ca rdboard ca r -tons, including up to 10%t r e a t e d p a p e r s , p l a s t i c o rrubber scraps ; commercia la n d i n d u s t r i a l s o u r c e s .
R u b b i s h C o m b u s t i b l e was t e , p a p e r , Rubbishcar tons , rags , wood scraps , 80combustible floor sweepings, Garbagedomestic, commercial, and 20i n d u s t r i a l s o u r c e s .
Refuse Rubbish and garbage; Rubbishr e s i d e n t i a l s o u r c e s . 50
Garbage50
Garbage Animal and vegetable wastes; Garbager e s t a u r a n t s , h o t e l s , 65m a r k e t s ; i n s t i t u t i o n a l c o m - R u b b i s hmerc ia l , and c lub sources 35
Animal C a r c a s s e s , o r g a n s , s o l i d Animalsol ids o r g a n i c w a s t e s f r o m andand h o s p i t a l , l a b o r a t o r y , Humanorgan ic aba t to i r s , an imal pounds T i s s u ewaste and s imi lar sources . 100
Gaseous , Indus t r ia l p rocess was tes Var iab lel iqu id o u c h a s , t a r , p a i n t ,o r s e m i - solvent , s ludge and fumes.l iqu idwastes
Semi- I n d u s t r i a l p r o c e s s w a s t e s , Var iab lesolid s u c h a s , r u b b e r , p l a s t i cand and wood.so l idwastes
MOISTURECONTENT
10
25
50
70
85
Dependenton pre-dominantcomponents
Dependenton pre-dominantcomponents
INCOM-BUSTIBLE
SOLIDS %
5
10
7
5
5
Varies Variesaccording to according towastes wastes
Varies Variesaccording to according towastes wastes
BTUVALUE/LB OFREFUSE
AS FIRED
8500
6500
4300
2500
1000
U. S. Army Corps of Engineers.
(2) Vertical circular incinerators. Waste is usu-ally fed into the top of the refractory linedchamber. The grate consists of a rotating conein the center surrounded by a stationary sec-tion with a dumping section around it. Armsattached to the rotating cone agitate the wasteand move the ash to the outside. Primary air isfed underneath the grate. Overtire air is fedinto the upper section of the chamber.
(3) Rotary kiln incinerators. Rotary kiln incin-erators are used to further the combustion ofwaste that has been dried and partially burnedin a rectangular chamber. The waste is mixed
2-2
with combustion air by the tumbling action ofthe kiln. Combustion is completed in the mix-ing chamber following the kiln where secon-dary air is added. The ash is discharged at theend of the kiln.
b. Industrial and commercial incinerators. Indus-trial and commercial incinerators generally fall into sixcategories. The capacities of these incinerators gener-ally range from a half to less than 50 tons per day. Theyare usually operated intermittently.
(1) Single chamber incinerators. Single chamberincinerators consist of a refractory lined com-bustion chamber and an ash pit separated by a

TM 5-815-1/AFR 19-6
grate. There is no separate mixing chamber.An auxiliary fuel burner is normally providedunderneath the grate. The units are normallynatural draft (no fans). Emissions from singlechamber units are high because of incompletecombustion.
(2) Multiple chamber incinerators. Multiplechamber refractory lined incinerators nor-mally consist of a primary chamber, a mixingchamber and a secondary combustion cham-ber. The primary chamber is similar to a singlechamber unit. Air is fed under the grate andthrough overfire air ports. Secondary air isadded in the mixing chamber. Combustion iscompleted in the secondary combustion cham-ber where some settling occurs. These unitsare also normally natural draft.
(3) Conical incinerators. Conical incineratorsknown commonly as “tee-pee” burners havebeen used primarily in the wood productsindustry to dispose of wood waste. Since theycannot meet most local particulate emissionrequirements, and since wood waste is becom-ing more valuable as a fuel, conical incineratorsare being phased out.
(4) Trench incinerators. Trench incinerators areused for disposal of waste with a high heatcontent and a low ash content. The incineratorconsists of a U-shaped chamber with airnozzles along the rim. The nozzles are directedto provide a curtain of air over the pit and toprovide air in the pit.
(5) Controlled-air incinerators. Controlled-airincinerators consist of a refractory lined pri-mary chamber where a reducing atmosphere ismaintained and a refractory lined secondarychamber where an oxidizing atmosphere ismaintained. The carbon in the waste burns andsupplies the heat to release the volatiles in thewaste in the form of a dense combustiblesmoke. Overtire air is added between cham-bers. The smoke is ignited in the secondarychamber with the addition of air. Auxiliary fuelburners are sometimes provided in the secon-dary chamber if the mixture does not supportcombustion. Air for this type of incinerator isprovided by a forced draft fan and is controlledby dampers in order to provide the properdistribution. Controlled-air incinerators areefficient units with low particulate emissionrates.
(6) Fluidized bed incinerators. Fluidized bedincinerators consist of a refractory lined ver-tical cylinder with a grid in the lower part thatsupports a bed of granular material, such assand or fine gravel. Air is blown into the cham-ber below the grid causing the bed to fluidize.
Waste is fed above the bed and then mixes withthe media where it burns. Fluidized bed incin-erators are normally self sustaining andrequire an auxiliary fuel burner only for start-up. Fluidizing air is supplied by a centrifugalblower. Ash leaves the fluidized bed incin-erator when it becomes fine enough to be car-ried out by the flue gas. Fluidized bed incin-erators are capable of burning most types ofliquid or solid waste.
c. Sludge incinerators. Sludge incinerators handlematerials high in water content and low in heat content.Two types of incinerators are normally used for sludgeincineration.
(1) Multiple hearth incinerators. Multiple hearthincinerators consist of vertically stackedgrates. The sludge enters the top where theexiting flue gas is used to drive off themoisture. The burning sludge moves throughthe furnace to the lower hearths. Ash isremoved from under the last hearth.
(2) Fluidized bed incinerator. Fluidized bed incin-erators are particularly well suited for sludgedisposal because of the high heat content of thebed media. Heat from the combustion of thesludge is transferred to the bed media. Thisheat is then transferred back to the incomingsludge, driving off the moisture.
2-6. Particulate emission standardsThe Clean Air Act requires all states to issue regula-tions regarding the amount of particulate emissionfrom incinerators. Each state must meet or exceed theprimary standards set forth by the federal act, limitingparticulate emissions for incinerators with a chargingrate of more than 50 tons per day of solid to .08 grainsper standard cubic foot (gr/std ft3) of dry gas at 12percent carbon dioxide (CO2). Federal guidelines forsewage sludge incinerators limit emissions to 1.3pounds (lbs) per ton of dry sludge input and opacity to20 percent maximum. No federal guidelines currentlyexist for gaseous emissions. State and local regulationsmay meet or exceed the federal guidelines. These reg-ulations are subject to change and must be reviewedprior to selecting any air pollution control device.
2-7. Particulate emission estimatingIn order to select a proper pollution control device, thequantities of particulate emissions from an incineratormust be measured or estimated. Measurement is thepreferred method. For new incinerator installationswhere particulate emissions must be estimated, tables2-3 and 2-4 should be used unless concurrent dataguaranteed by a qualified Vendor is provided.
a. Factors affecting emission variability. The quan-tity and size of particulate emissions leaving the fur-nace of an incinerator vary widely, depending upon
2-3

TM 5-815-1/A
FR 19-6
2-4

TM 5-815-1/AFR 19-6
TABLE 2-4
EMISSION FACTORS FOR SEWAGE SLUDGE INCINERATORS
Emiss ions*Uncon t ro l l ed
P o l l u t a n t l b / t o nP a r t i c u l a t e 100
S u l f u r d i o x i d e 1
Carbon monoxide Neg
N i t r o g e n o x i d e s ( a s N O2) 6
Hydrocarbons 1 . 5
Hydrogen chloride gas 1 . 5
* U n i t w e i g h t s i n t e r m s o f d r i e d s l u d g e .
From: E n v i r o n m e n t a l P r o t e c t i o nEmiss ion Factors” .
such factors as incinerator design, refuse type, incin-erator capacity, method of feeding, and method of oper-ation. Improved incinerator performance reduces bothdust loading and mean particle size.
(1)
(2)
(3)
Incinerator capacity. Large incinerators burnrefuse at higher rates creating more turbulentgas flow conditions at the grate surface. Rapid,turbulent, combustion aided by the use of moreunderfire air causes particle suspension andcarry over from the incinerator grate surfaceresulting in higher emission rates for largeincinerators.Underfire air flow. The effect of increasingunderfire grate air flow is to increase particu-late emission rate.Excess air. Excess air is used to control com-bustion efficiency and furnace temperatures.Incinerators are operated at levels of excess airfrom 50 percent to 400 percent. However, par-ticulate emission levels increase with theamount of excess air employed. Increases inexcess air create high combustion gasvelocities and particle carry over. Excess air isimportant as a furnace temperature controlbecause incomplete combustion will occur atfurnace temperatures below 1400 degreesFahrenheit, and ash slagging at the grate sur-face and increased NO, emissions will occurabove furnace temperatures of 1900 degreesFahrenheit.
Agency, “Compi la t ion of Air
(4) Opacity. For information on the use of visibleopacity measurement as an aid to achievingefficient combustion, see paragraph 3-8.
b. Data reduction. The state regulations for particu-late emissions are expressed in a variety of units. Thefollowing techniques permit the user to reduce particu-late test data to grains per dry standard cubic foot at 12percent CO2, as well as to convert other particulateconcentration units, as used by some states, to thisbasis.
(1) Test data conversion to grains per dry stand-ard cubic foot at 12 percent CO2. Equation 2-lapplies.
0.68C s at 12 percent CO2 = CO2
x (tm + 460) x C(eq. 2-l)
pwhere: Cs at 12 percent CO2 = particulate
concentration in grains per dry standard cubicfoot at gas conditions corrected to 12 percentCO 2 and standard temperature of 68 degreesFahrenheit.
C = particulate concentration attest conditions in grains perdry cubic foot of gas
t m= gas temperature at the test
equipment conditionsC O2 = percent by volume of the
CO, in the dry gas
2-5

TM 5-815-1/AFR 19-6
P = barometric pressure ininches of mercury at thetest equipment conditions.
(2) To convert particulate loadings given aspounds per 1000 pounds of dry gas at 50 per-cent excess air, equation 2-2 applies.
C s at 12 C at 50 percent EApercent CO2 = CO2 (eq. 2-2)
x .325 x AT x MA A
where: C at 50 percent EA = pounds ofparticulate per 1000 pounds of gas at 50 per-cent excess air
AT = theoretical air required perA A actual air used
M = Molecular weight of the gassample
=A TN 2 - 3.788 (02- .5 CO)
A A N 2
(eq. 2-3)
M = .16 CO2 + .04 02 + 28 (eq. 2-4)
where: N2 = percent N2 from Orsat anal-ysis
O2= percent 02 from Orsat anal-
ysisCO = percent CO from Orsat
analysisC O2 = percent CO, from Orsat
analysis
(3) To convert grains per dry standard cubic footat 50 percent excess air to grains per drystandard cubic foot at 12 percent CO2, equa-tion 2-5 applies.
C s at 12percent CO2 =
18 x Cs at 50 percent EA
CO2
A T
(eq. 2-5)x
A A
(4) To convert pounds of particulate per ton ofrefuse charged to grains per dry standardcubic foot at 12 percent CO2, equation 2-6applies.
Cs at 12 lbs of particulatepercent CO2 = tons-of refuse
x . 4 2 x 1 06 x 1(eq. 2-6)
GCV Fc
where: GCV = gross calorific value ofwaste, British thermalunits (Btu)/lb
F c= carbon F factor, std ft3/mil-
lion (MM)Btu
F = 0.321 x 10⁶ x percent carboncGCV
(eq. 2-7)
Percent carbon is by weight from the ultimate analy-sis of the refuse. The GCV and tons of refuse must beconsistent with the ultimate analysis. If the ultimateanalysis is on a dry basis, the GCV and tons of refusemust be on a dry basis.
(5)
(6)
To convert grains per dry standard cubic footat 7 percent 02 to grains per dry standardcubic foot at 12 percent CO2, equation 2-8applies.
Cs at 12percent CO2 = 1.714
O2x Cs at 7 Percent 02x CO2
(eq. 2-8)
To convert pounds of particulate per millionBritish thermal units fired to grains per drystandard cubic foot at 12 percent CO2, equa-tion 2-9 applies.
Cs at 12 lbs of particulatepercent CO2 = MMBtu
x 840(eq. 2-9)
Fc
2-8 Sample calculationsa. An industrial multichamber incinerator burns a
type I waste at 10 percent moisture of the analysisshown below. What is the estimated particulate emis-sion rate in grains per dry standard cubic foot at 12percent CO2?
Waste Analysis (Percent by Weight on Wet Basis)
(1)
(2)
(3)
Carbon 50 percentHeating value 8500 Btu/lb
Table 2-3 lists industrial multichamber incin-erators as having a particulate emission factorof 7 lb/ton of refuse.
Using equation 2-7,
Fc
= 0.321 x 106 x 50 = 18888500
Using equation 2-6,
C s a t 12 .42 x 106 1
percent CO2
=7 x x8500 1888
= 0.183 gr/std ft3
b. Test data from an incinerator indicates a particu-late concentration of 0.5 gr/ft3 at 9 percent CO2. Cor-rect the particulate concentration to grains per drystandard cubic foot at 12 percent CO2. Test conditionswere at 72 degrees Fahrenheit and a barometric pres-sure of 24 inches of mercury.
2-6

(1) Using equation 2-1,
C s at 12 0.5 x 0.68 (72 + 460)x
p e r c e n t C O2 9 24
= 0.84 gr/std ft3
c. The emission rate of an incinerator is 10 lb/1000 lbof dry flue gas at 50 percent excess air. The Orsatanalysis is 8.0 percent O2, 82.5 percent N2, 9.5 percentCO 2 and 0 percent CO. Convert the emission rate tograins per dry standard cubic foot at 12 percent CO2.
(1) Using equation 2-3,
AT = 82.5 - 3.788(8.0-.5(0)) = 0.633
A A82.5
(2) Using equation 2-4,
M = .16(9.5) + .04(8.0) + 28 = 29.84
(3) Using equation 2-2,
C s at 12= 10 x .325 x .633 x 29.84percent CO2 9.5
TM 5-815-1/AFR 19-6
d. An incinerator burning waste of the analysisshown below has a measured emission rate of 5 pounds/MMBtu. What is the expected particulate emission ratein grains per dry standard cubic foot at 12 percent CO2?
Waste Analysis
Carbon 35 percent by weight on dry basisHeating Value 6500 Btu/pound as firedMoisture 21 percent
(1)
(2)
(3)
In order to use equation 2-7, the percent car-bon and the heating value must be on the samebasis.
Percent C on wet basis =35 x (100-21) = 28
100
Using equation 2-7,
F =0.321 x 106 x 28
=c 6500
1382
Using equation 2-9,
C s at 12percent CO2
= 5 x 8 4 01383
= 6.46 gr/std ft3 = 3.04 gr/std ft3
2-7

TM 5-815-1/AFR 19-6
CHAPTER 3
BOILER EMISSIONS
3-1. Generation processesThe combustion of a fuel for the generation of steam orhot water results in the emission of various gases andparticulate matter. The respective amounts and chem-ical composition of these emissions formed are depen-dent upon variables occurring within the combustionprocess. The interrelationships of these variables donot permit direct interpretation by current analyticalmethods. Therefore, most emission estimates arebased upon factors compiled through extensive fieldtesting and are related to the fuel type, the boiler typeand size, and the method of tiring. Although the use ofemission factors based on the above parameters canyield an accurate first approximation of on-site boileremissions, these factors do not reflect individual boileroperating practices or equipment conditions, both ofwhich have a major influence on emission rates. Aproperly operated and maintained boiler requires lessfuel to generate steam efficiently thereby reducing theamount of ash, nitrogen and sulfur entering the boilerand the amount of ash, hydrocarbons, nitrogen oxides(NO,) and sulfur oxides (SOx) exiting in the flue gasstream. Emissions from conventional boilers are dis-cussed in this chapter. Chapter 13 deals with emissionsfrom fluidized bed boilers.
3-2. Types of fuelsa. Coal. Coal is potentially a high emission produc-
ing fuel because it is a solid and can contain largepercentages of sulfur, nitrogen, and noncombustibles.Coal is generally classified, or “ranked”, according toheating value, carbon content, and volatile matter. Coalranking is important to the boiler operator because itdescribes the burning characteristics of a particularcoal type and its equipment requirements. The maincoal fuel types are bituminous, subbituminous,anthracite, and lignite. Bituminous is most common.Classifications and analyses of coal may be found in“Perry’s Chemical Engineering Handbook”,
b. Fuel oil. Analyses of fuel oil may be found in“Perry’s Chemical Engineering Handbook”.
(1) Distillates. The lighter grades of fuel oil (No.1,No.2) are called distillates. Distillates are cleanburning relative to the heavier grades becausethey contain smaller amounts of sediment, sul-fur, ash, and nitrogen and can be fired in avariety of burner types without a need for pre-heating.
(2) Residuals. Residual fuel oils (No.4, No.5,No.6) contain a greater amount of ash, sedi-ment, sulfur, and nitrogen than is contained indistillates. They are not as clean burning as thedistillate grades.
c. Gaseous fuel. Natural gas, and to a limited extentliquid petroleum (butane and propane) are ideallysuited for steam generation because they lend them-selves to easy load control and require low amounts ofexcess air for complete combustion. (Excess air isdefined as that quantity of air present in a combustionchamber in excess of the air required for stoichiometriccombustion). Emission levels for gas firing are lowbecause gas contains little or no solid residues, noncom-bustibles, and sulfur. Analyses of gaseous fuels may befound in “Perry’s Chemical Engineering Handbook”.
d. Bark and wood waste. Wood bark and woodwaste, such as sawdust, chips and shavings, have longbeen used as a boiler fuel in the pulp and paper andwood products industries. Because of the fuel’s rela-tively low cost and low sulfur content, their use outsidethese industries is becoming commonplace. Analyses ofbark and wood waste may be found in EnvironmentalProtection Agency, “Control Techniques for ParticulateEmissions from Stationary Sources”. The fuel’s lowheating value, 4000-4500 British thermal units perpound (Btu/lb), results from its high moisture content(50-55 percent).
e. Municipal solid waste (MSW) and refuse derivedfuel (RDF). Municipal solid waste has historically beenincinerated. Only recently has it been used as a boilerfuel to recover its heat content. Refuse derived fuel isbasically municipal solid waste that has been preparedto burn more effectively in a boiler. Cans and othernoncombustibles are removed and the waste is reducedto a more uniform size. Environmental ProtectionAgency, “Control Techniques for Particulate Emissionsfrom Stationary Sources” gives characteristics of refusederived fuels.
3-3. Fuel burning systemsa. Primary function. A fuel burning system
provides controlled and efficient combustion with aminimum emission of air pollutants. In order to achievethis goal, a fuel burning system must prepare, dis-tribute, and mix the air and fuel reactants at theoptimum concentration and temperature.
3-1

TM 5-815-1/AFR 19-6
b. Types of equipment.(1) Traveling grate stokers. Traveling grate
(2)
(3)
(4)
stokers are used to burn all solid fuels exceptheavily caking coal types. Ash carryout fromthe furnace is held to a minimum through useof overfire air or use of the rear arch furnacedesign. At high firing rates, however, as muchas 30 percent of the fuel ash content may beentrained in the exhaust gases from grate typestokers. Even with efficient operation of agrate stoker, 10 to 30 percent of the particulateemission weight generally consists ofunburned combustibles.Spreader stokers. Spreader stokers operate onthe combined principles of suspension burningand nonagitated type of grate burning. Par-ticulate emissions from spreader stoker firedboilers are much higher than those from fuelbed burning stokers such as the traveling gratedesign, because much of the burning is done insuspension. The fly ash emission measured atthe furnace outlet will depend upon the firingrate, fuel sizing, percent of ash contained in thefuel, and whether or not a fly ash reinjectionsystem is employed.Pulverized coal burners. A pulverized coalfired installation represents one of the mostmodern and efficient methods for burningmost coal types. Combustion is more completebecause the fuel is pulverized into smaller par-ticles which require less time to burn and thefuel is burned in suspension where a bettermixing of the fuel and air can be obtained.Consequently, a very small percentage ofunburned carbon remains in the boiler fly ash.Although combustion efficiency is high, sus-pension burning increases ash carry over fromthe furnace in the stack gases, creating highparticulate emissions. Fly ash carry over canbe minimized by the use of tangentially firedfurnaces and furnaces designed to operate attemperatures high enough to melt and fuse theash into slag which is drained from the furnacebottom. Tangentially fired furnaces and slag-tap furnaces decrease the amount of fuel ashemitted as particulates with an increase inNOx emissions.Fuel oil burners. Fuel oil may be prepared forcombustion by use of mechanical atomizingburners or twin oil burners. In order for fuel oilto be properly atomized for combustion, itmust meet the burner manufacturers require-ments for viscosity. A fuel oil not heated to theproper viscosity cannot be finely atomized andwill not burn completely. Therefore, unburnedcarbon or oil droplets will exit in the furnaceflue gases. A fuel oil heated above the proper
viscosity may ignite too rapidly forming pulsa-tions and zones of incomplete combustion atthe burner tip. Most burners require an atom-izing viscosity between 100 and 200 SayboltUniversal Seconds (SUS); 150 SUS is gener-ally specified.
(5) Municipal solid waste and refuse derived fuelburning equipment. Large quantities of MSWare fired in water tube boilers with overfeedstokers on traveling or vibrating grates.Smaller quantities are fired in shop assembledhopper or ram fed boilers. These units consistof primary and secondary combustion cham-bers followed by a waste heat boiler. The com-bustion system is essentially the same as the“controlled-air” incinerator described in para-graph 2-5(b)(5). The type of boiler used forRDF depends on the characteristics of thefuel. Fine RDF is fired in suspension. Pel-letized or shredded RDF is fired on a spreaderstoker. RDF is commonly fired in combinationwith coal, with RDF constituting 10 to 50 per-cent of the heat input.
3-4. Emission standardsThe Clean Air Act requires all states to issue regula-tions regarding the limits of particulate, SOx and NOx
emissions from fuel burning sources. State and localregulations are subject to change and must be reviewedprior to selecting any air pollution control device. Table3-l shows current applicable Federal Regulations forcoal, fuel oil, and natural gas. The above allowableemission rates shown are for boilers with a heat input of250 million British thermal units (MMBtu) and above.
Table 3-1Allowable federal emission rates
Fuel Particulate SO2 NOxOpacity
Coal 0.1 lb/MMBtu 1.2 lb/MMBtu .7 lb/MMBtu 20 PercentFuel Oil 0.1 lb/MMBtu 0.8 lb/MMBtu .3 lb/MMBtu 20 PercentNaturalGas 0.1 lb/MMBtu - .2 lb/MMBtu 20 Percent
From: 40CFR86-“National Primary and Secondary Ambient AirQuality Standards”.
3-5. Formation of emissionsa. Combustion parameters. In all fossil fuel burning
boilers, it is desirable to achieve a high degree of com-bustion efficiency, thereby reducing fuel consumptionand the formation of air pollutants. For each particulartype fuel there must be sufficient time, proper tem-perature, and adequate fuel/air mixing to insure com-plete combustion of the fuel. A deficiency in any of thesethree requirements will lead to incomplete combustionand higher levels of particulate emission in the form ofunburned hydrocarbon. An excess in time, tem-perature, and fuel/air mixing will increase the boilerformation of gaseous emissions (NOx). Therefore, thereis some optimum value for these three requirements
3-2

TM 5-815-1/AFR 19-6
regarding fuel selection, such as AR 420-49 for theArmy’s use.
3-7. Emission factorsEmission factors for particulates, SOx, and NOx, arepresented in the following paragraphs. Emission fac-tors were selected as the most representative valuesfrom a large sampling of boiler emission data and havebeen related to boiler unit size and type, method offiring and fuel type. The accuracy of these emissionfactors will depend primarily on boiler equipment age,condition, and operation. New units operating at lowerlevels of excess air will have lower emissions than esti-mated. Older units may have appreciably more. There-fore, good judgement should accompany the use ofthese factors. These factors are from, EnvironmentalProtection Agency, “Compilation of Air PollutantEmission Factors”. It should be noted that currentlyMSW and RDF emission factors have not been estab-lished.
a. Particulate emissions. The particulate loadingsin stack gases depend primarily on combustion effi-ciency and on the amount of ash contained in the fuelwhich is not normally collected or deposited within theboiler. A boiler firing coal with a high percentage of ashwill have particulate emissions dependent more on thefuel ash content and the furnace ash collection or reten-tion time than on combustion efficiency. In contrast, aboiler burning a low ash content fuel will have particu-late emissions dependent more on the combustion effi-ciency the unit can maintain. Therefore, particulateemission estimates for boilers burning low ash contentfuels will depend more on unit condition and operation.Boiler operating conditions which affect particulateemissions are shown in table 3-2. Particulate emissionfactors are presented in tables 3-3, 3-4, 3-5 and 3-6.
b. Gaseous emissions.(1) Sulfur oxide emissions. During combustion,
sulfur is oxidized in much the same way carbonis oxidized to carbon dioxide (CO2). Therefore,almost all of the sulfur contained in the fuel willbe oxidized to sulfur dioxide (SO2) or sulfurtrioxide (SO2) in efficiently operated boilers.Field test data show that in efficiently operatedboilers, approximately 98 percent of the fuel-bound sulfur will be oxidized to SO2, one per-cent to SO3, and the remaining one percentsulfur will be contained in the fuel ash. Boilerswith low flue gas stack temperatures may pro-duce lower levels of SO, emissions due to theformation of sulfuric acid. Emission factors forSOx are contained in tables 3-3, 3-4, 3-5, and3-6.
(2) Nitrogen oxide emissions. The level of nitro-gen oxides (NOx) present in stack gasesdepends upon many variables. Furnace heatrelease rate, temperature, and excess air are
3-3
within the boiler’s operating range which must be metand maintained in order to minimize emission rates.The optimum values for time, temperature, and fuel-airmixing are dependent upon the nature of the fuel (gas-eous, liquid or solid) and the design of the fuel burningequipment and boiler.
b. Fuel type.(1) Gaseous fuels. Gaseous fuels burn more read-
ily and completely than other fuels. Becausethey are in molecular form, they are easilymixed with the air required for combustion,and are oxidized in less time than is required toburn other fuel types. Consequently, theamount of fuel/air mixing and the level ofexcess air needed to burn other fuels are mini-mized in gas combustion, resulting in reducedlevels of emissions.
(2) Solid and liquid fuels. Solid and liquid fuelsrequire more time for complete burningbecause they are tired in droplet or particleform. The solid particles or fuel droplets mustbe burned off in stages while constantly beingmixed or swept by the combustion air. The sizeof the droplet or fired particle determines howmuch time is required for complete combus-tion, and whether the fuel must be burned on agrate or can be burned in suspension. Systemsdesigned to fire solid or liquid fuels employ ahigh degree of turbulence (mixing of fuel andair) to complete combustion in ‘the requiredtime, without a need for high levels of excessair or extremely long combustion gas paths. Asa result of the limits imposed by practicalboiler design and necessity of high tem-perature and turbulence to complete particleburnout, solid and liquid fuels develop higheremission levels than those produced in gas fir-ing.
3-6. Fuel selectionSeveral factors must be considered when selecting afuel to be used in a boiler facility. All fuels are notavailable in some areas. The cost of the fuel must befactored into any economic study. Since fuel costs varygeographically, actual delivered costs for the particulararea should be used. The capital and operating costs ofboiler and emission control equipment vary greatlydepending on the type of fuel to be used. The methodand cost of ash disposal depend upon the fuel and thesite to be used. Federal, state and local regulations mayalso have a bearing on fuel selection. The Power Plantand Fuel Use Act of 1978 requires that a new boilerinstallation with heat input greater than 100 MMBtuhave the capability to use a fuel other than oil or naturalgas. The Act also limits the amount of oil and naturalgas firing in existing facilities. There are also regula-tions within various branches of the military service

TM 5-815-1/AFR 19-6
Table 3-2
FACTORS RELATING TO PARTICULATE EMISSIONS
F u e l c h a r a c t e r i s t i c s :High ash contentHigh mois ture contentS i z i n gHigh deg ree o f a t omiza t i on
o r p u l v e r i z a t i o n
B o i l e r c h a r a c t e r i s t i c s :High combust ion ra teD r y b o t t o m a s h c o l l e c t i o nW e t b o t t o m a s h c o l l e c t i o nF l u e - g a s r e c i r c u l a t i o nM e t h o d o f f i r i n g
T a n g e n t i a lH o r i z o n t a lS p r e a d e r s t o k e r
B o i l e r o p e r a t i o n :I m p r o p e r o i l p r e s s u r eI m p r o p e r o i l v i s c o s i t yHigh combust ion a i r
t e m p e r a t u r eNonuniform air f low
( b e t w e e n r e g i s t e r o ra i r compar tments)
H i g h e x c e s s a i rLow furnace temperature
Equipment condi t ion:Worn burner (nozzles ,
s p r a y e r , p l a t e s , e t c . )Unc l ean o r s l agg ing bo i l e r
t u b e s u r f a c e s
U. S. Army Corps of Engineers
major variables affecting NOx emission levels,but they are not the only ones. Therefore,while the emission factors presented in tables3-3, 3-4, 3-5, and 3-6 may not totally reflecton site conditions, they are useful in determingif a NOx emission problem may be present.Factors which influence NOx formation areshown in table 3-7.
3-8. OpacityVisual measurements of plume opacity (para 5-3j) canaid in the optimization of combustion conditions. Par-ticulate matter (smoke), the primary cause of plumeopacity, is dependent on composition of fuel and effi-
3-4
L e v e l o f P a r t i c u l a t e E m i s s i o n sHigh Low
X -X -
- X
X -X -- XX -
- XX -X -
X -X -
X -X -X -
X -
X -
- X
ciency of the combustion process. Smoke varies in colorbut is generally observed as gray, black, white, brown,blue, and sometimes yellow, depending on the condi-tions under which certain types of fuels or materials areburned. The color and density of smoke is often anindication of the type or combustion problems whichexist in a process.
a. Gray or black smoke is often due to the presenceof unburned combustibles. It can be an indicator thatfuel is being burned without sufficient air or that thereis inadequate mixing of fuel and air.
b. White smoke may appear when a furnace is oper-ating under conditions of too much excess air. It mayalso be generated when the fuel being burned contains

TM 5-815-1/A
FR 19-63-5

TM 5-815-1/AFR 19-6
TABLE 3-4
EMISSION FACTORS FOR FUEL OIL COMBUSTION
Pollutant
Particulate b
Sulfur dioxided
Sulfur triorided
Carbon monoxidee
Hydrocarbons (total, as CH4)
f
(Nitrogen oxides(total, as NO2)
Type of Boilera
Power Plant Industrial and Commercial DomesticResidual Residual Oil Distillate Oil Distillate Oil
lb/103 gal
c157S
2S
lb/10 3 gal lb/10 3 gal lb/10 3 gal
c157S
2 2.5142S 142S
2S 2S 2S5 5 5
1 1 1 1
105(50)8 gh 60fi 22 18
a.
b.
c.
d.e.
f.
g.
h.
i.
Boilers can be classified, roughly, according to their gross (higher) heat input rate asshown below.Power plant (utility) boilers: greater than 250 x 106 Btu/hrIndustrial boilers: greater than 15 x 106
Commercial boilers: greater than 0.5 x 10⁶,but less than 250 x 106 Btu/hrbut legs than 15 x 106 Btu/hr
Domestic (residential) boilers: less than 0.5 x 10⁶ Btu/hrParticulate is defined in this table as that material collected by EPA Method 5 (fronthalf catch).Particulate emission factors for residual oil combustion are best described, on theaverage, as a function of fuel oil grade and sulfur content, as shown below.Grade 6 oil: lb/103 gal = 10 (S) + 3
Where: S is the percentage. by weight, of sulfur in the oilGrade 5 oil: 10 lb/103 galGrade 4 oil: 7 lb/103 galS is the percentage, by weight, of sulfur in the oil.Carbon monoxide emissions may increase by a factor of 10 to 100 if a unit is improperlyoperated or not well maintained.Hydrocarbon emissions are generally negligible unless unit is improperly or not wellmaintained. In which case emissions may increase by several orUse 50 lb/103 gal for tangentially fired boilers and 105 lb/103
ders of magnitude.gal for all others,
at full load, and normal (greater than 15 percent) excess air. At reduced loads, NOx
emissions are reduced by 0.5 to 1 percent , on the average. for every percentagereduction in boiler load.Several combustion modifications can be employed for NOx reductions: (1) limitedexcess air firing can reduce NOx emissions by 5 to 30 percent. (2) staged combustioncan reduce NOx emissions by 20 to 45 percent, and (3) flue gas recirculation canreduce NOx emissions by 10 to 45 percent. Combinations of the modifications have beenemployed to reduce NOx emissions by as much as 60 percent in certain boilers.Nitrogen oxides emissions from residual oil combustion in industrial and commercialboilers are strongly dependent on the fuel nitrogen content and can be estimated moreaccurate1lb N02/10 3
by the following empirical relationship:gal = 22 + 400 (N)2
Where: N is the percentage, by weight, of nitrogen in the oil.Note: For residual oils having high (greater than 0.5 percent by Weight) nitrogencontents, one should use 120 lb N02/10
3 gal as an emission factor.From: Environmental Protection Agency, "Compilation of Air Emission Factors".
U.S. Corps of Engineers
excessive amounts of moisture or when steam atomiza- MMBtu) to grains per standard cubic foot (gr/std ft3)tion or a water quenching system is employed. dry basis is accomplished by equation 3-l.
c. A blue or light blue plume may be produced by theburning of high sulfur fuels. However, the color is onlyobserved when little or no other visible emission ispresent. A blue plume may also be associated with theburning of domestic trash consisting of mostly paper orwood products.
E = C x Fd x20.9
x 700020.9 - %02
(eq. 3-l)
d. Brown to yellow smoke may be produced by pro-cesses generating excessive amounts of nitrogen diox-ide. It may also result from the burning of semi-solidtarry substances such as asphalt or tar paper encoun-tered in the incineration of building material waste.
3-9. Sample problems of emission estima-ting
a. Data Conversion. Pounds per million Btu (lb/
3-6
where: E = pound/MMBtuC = concentration, gr/std ft3 dry%O 2 = percent by volume of oxygen in the
flue gasF d
= dry F factor, std ft3/MMBtu
Fuel Type F d
Anthracite coal lO100Bituminous coal 9780Fuel oil 9190Gaseous fuels 8710Wood 9240Wood bark 9600

TM 5-815-1/AFR 19-6
TABLE 3-5
EMISSION FACTORS FOR NATURAL GAS COMBUSTION
P o l l u t a n t
P a r t i c u l a t e s 5-15 5-15 5-15
S u l f u r o x i d e s ( S O2)a 0.6 0.6 0.6
Carbon monoxide 17 17 20
Hydrocarbons (as CH4)
Ni t rogen oxides (NO2)
Power Plant
lb/MCF gas
1
700b
Type of UnitI n d u s t r i a l D o m e s t i c a n d
Process CommercialB o i l e r Heat ing
lb/MCF gas lb/MCF gas
3 8
(120-230) c (80-120 )d
a . B a s e d o n a n a v e r a g e s u l f u r c o n t e n t o f n a t u r a l g a s o f 2 0 0 0gr /mil l ion cubic feet (MMCF).
b . U s e 3 0 0 l b / M C F f o r t a n g e n t i a l l y f i r e d u n i t s .c . T h i s r e p r e s e n t s a t y p i c a l r a n g e f o r m a n y i n d u s t r i a l
b o i l e r s . F o r l a r g e i n d u s t r i a l u n i t s ( g r e a t e r t h a n 1 0 0M M B t u / h r ) u s e t h e N Ox fac tors presented for powerp l a n t s .
d . Use 80 for domest ic heat ing uni ts and 120 for commercia lu n i t s .
From: Environmental Protect ion Agency, “Compila t ion of AirEmiss ion Factors” .
b. Sample Problem Number 1. An underfed stokerfired boiler burns bituminous coal of the analysis shownbelow. If this unit is rated at 10 MMBtu per hour (hr) offuel input, what are the estimated emission rates?
Bituminous Coal Analysis (percent by weight)
Ash 13.0Sulfur 0.7Heating value 12,360 Btu/pound
(1) Using table 3-3 (footnote e), particulate emis-sions are given as 5A pound/ton of coal where Ais the percent ash in the coal.
(a) 5 x 13% ash = 65 pounds of particulate/tonof coal.
(b) 65 pounds/ton x ton/2000 pounds = .0325pound of particulate/pound of coal
(c) (.0325 lb/lb) x lb of coal x l06 Btu12,360 Btu MMBtu
= 2.63 lbs/MMBtu
(2) Using table 3-3, SO, emissions are given as38S pound/ton of coal, where S is the percentsulfur in the coal.
(a) 38 x .7% sulfur = 26.6 pounds of SO2/ton ofcoal
(b) 26.6 pounds/ton = ton/2000 pounds =.0133 pound of SO2/pound of coal
3-7

TM 5-815-1/AFR 19-6
TABLE 3-6
EMISSION FACTORS FOR BARR ANDWOOD WASTE COMBUSTION IN BOILERS
Pol lu tant
P a r t i c u l a t e s a
Bark b
With f ly-ash re inject ion c
Without fly-ash reinjectionWood/bark mixture b
With f ly-ash re inject ion c
Without fly-ash reinjectionWood d
Sulfur oxides (SO 2) e
Carbon monoxide f
Hydrocarbons f
Nitrogen oxides (NO2)
Emissionsl b / t o n
7550
4530
5-151 .52-602-70
10
a. These emission factors were determined for boilersburning gas or oil as an auxiliary fuel, and it wasassumed all particulates resulted from the waste fuelalone. When coal is burned as an auxiliary fuel, theappropriate emission factor from Table 3-3 should be usedin addition to the above factor.
b. These factors based on an as-fired moisture content of50 percent.
c. This factor represents a typical dust loading reachingthe control equipment for boilers employing fly-ashre in j ec t i on .
d. This waste includes clean, dry (5 to 50 percent moisture)sawdust, shavings, ends, etc. and no bark. For welldesigned and operated boilers, use lower value and highervalues for others. This factor is expressed on anas-fired moisture content basis assuming no fly-ashre in j ec t i on .
e. This factor is calculated by material balance assuming amaximum sulfur content of 0.1 percent in the waste. Whenauxiliary fuels are burned, the appropriate factors fromTables 3-3, 3-4, and 3-5 should be used in addition todetermine sulfur oxide emissions.
f. Use lower values for well designed and operated boilers.
From: Environmental Protection Agency, "Compilation of AirEmission Factors"
3-8

TM 5-815-1/AFR 19-6
TABLE 3-7
FACTORS AFFECTING NOx EMISSIONS
Variable Effect on NOX Emission
Increasing
Heat release rate
Heat quenching rate
(wa t e r coo l ed fu rnaces )
Boiler capacity
Boiler load
Excess air
Furnace temperature
Combustion air temperature
Fuel nitrogen content
Fuel oxygen content
Fuel moisture content
Distance between burners
Number of burners per unit
F u e l / a i r m i x i n g ( t u r b u l e n c e )
Time available for particle burnout
(tangentially fired boilers)
U. S. Army Corps of Engineers.
lb of coal(c) (.0133 lb/lb) x
12,360 Btu106 Btu
xMMBtu
= 1.08 lbs/MMBtu(3) Using table 3-3, NOx emissions are given as 15
pounds/ton of coal.(a) 15 pounds/ton x ton/2000 pounds = .0075
pound of NOx/pound of coallb of coal(b) (0075 lb/lb) x x 106 Btu12,360 Btu MMBtu
= .61 lbs/MMBtu(4) If particulate emission must be reduced to .2
Increase Decrease
pounds/MMBtu, the required removal effi-ciency is determined as,
.2l - =2.63
.924 (92.4%)
(5) If the oxygen in the flue gas is estimated at 5percent by volume, what is the dust con-centration leaving the boiler in grains/stand-ard cubic foot (dry)?Using equation 3-1,
7000 x 2.63 20.9 - 5C =9780 20.9
= 1.43 gr/std ft3 dry
3-9

TM 5-815-1/AFR 19-6
c. Sample Problem Number 2. A boiler rated at 50MMBtu/hr burns fuel oil of the analysis shown below.What are the estimated emission rates?
#6 Fuel Oil Analysis (percent by weight)Sulfur 2Nitrogen .2Heating Value 150,000 Btu per gallon (gal)
(1) Using table 3-4, particulate emissions aregiven as [10(S) + 3] pound/1000 gal, where S isthe percent sulfur in the fuel oil.
(a) (10 x 2% sulfur) + 3 = 23 pounds of par-ticulate/1000 gal
gal of oil(b) 23 lbs/l000 gal x x
106 Btu150,000 Btu MMBtu
= .15 lb/MMBtu(2) Using table 3-4, SO, emissions are given as
157S pound/1000 gal, where S is the percentsulfur in the fuel oil.
(a) 157 x 2% sulfur = 314 pounds/1000 galgal of oil
(b) 314 lbs/l000 gal x x106 Btu
150,000 Btu MMBtu
= 2.09 lb/MMBtu(3) Using table 3-4, NOx emissions are given as
[22 + 400 (N)2] pound/1000 gal, where N is thepercent nitrogen in the fuel oil.
(a) 22 + 400 x (.2)2 = 38 pounds of NOx/1000gal
gal of oil(b) 38 lbs/l000 gal x x
106 Btu
150,000 Btu MMBtu
= .25 lb/MMBtud. Sample Problem Number 3. A commercial boiler
rated at 10 MMBtu/hr tires natural gas with a heatingvalue of 1000 Btu/ft3. What are the estimated particu-late and NOx emission rates?
(1) Using table 3-5, particulate emissions aregiven as a maximum of 15 pound per millioncubic feet (MCF) of natural gas.
(a) 15 lb/MCF xMCF x 10 x 106 Btu
106ft3 h rf t3
x = .15lb/hr1000 Btu
(b) .15 lb/hr x =h r
.015 lb/MMBtu10MMBtu
(2) Using table 3-5 (footnote d), NOx emissionsare given as 120 pound/MCF of natural gas.
(a) 120 lb/MCF x x10 x 106BtuMCF
1 06f t3
f t3
X = 1.2 lb/hr1000 Btu
(b) 1.2 lb/hr x =h r .12 lb/MMBtu10 MMBtu
e. Sample Problem Number 4. A spreader stokerfired boiler without reinjection burns bark and coal incombination. The bark firing rate is 2000 pound/hr. Thecoal firing rate is 1000 pound/hr of bituminous coal withan ash content of 10 percent and a heating value of12,500 Btu/pound. What is the estimated particulateemission rate from this boiler?
(1)
(2)
Using table 3-6, the bark firing particulateemission rate is given as 50 pounds/ton of fuel.
50 pounds/ton x ton/2000 pounds x 2000pound/hr = 50 pounds/hr of particulate frombark.Using table 3-3, the coal firing particulateemission rate for a heat input of 12.5 MMBtu/hr is 13A pounds/ton of fuel.
(13 x 10) pound/ton x 1000 pound/hr xton/2000 pound = 65 pounds/hr of particulatefrom coal.
(3) The total particulate emission rate from theboiler is,
50 pounds/hr from bark + 65 pounds/hrfrom coal = 115 pounds/hr
3-10

TM 5-815-1/AFR 19-6
CHAPTER 4
STACK EMISSION REGULATIONS AND THE PERMITTING PROCESS
4-1. Stack emissionsThe discharge of pollutants from the smokestacks ofstationary boilers and incinerators is regulated by bothFederal and State Agencies. A permit to construct ormodify an emission source will almost certainly berequired.
a. The emissions must comply with point source reg-ulations, dependent upon characteristics of the pointsource, and also with ambient air quality limitationswhich are affected by physical characteristics of thelocation and the meteorology of the area of the newsource.
b. The permitting procedure requires that estimatesbe made of the effect of the stack emissions on theambient air quality. Predictive mathematical modelsare used for arriving at these estimates.
c. Due to the time requirements and the complexityof the process and the highly specialized nature of manyof the tasks involved, it is advisable to engage consul-tants who are practiced in the permitting proceduresand requirements. This should be done at a very earlystage of planning for the project.
4-2. Air quality standardsa. Federal standards-Environmental Protection
Agency Regulations on National Primary and Secon-dary Ambient Air Quality Standards (40 CFR 50).
b. State standards. Federal installations are alsosubject to State standards.
4-3. Permit acquisition processa. New Source Review. The state agency with juris-
diction over pollution source construction permitsshould be contacted at the very beginning of the projectplanning process because a New Source Review (NSR)application will probably have to be filed in addition toany other State requirements. A New Source Review isthe process of evaluating an application for a “Permit toConstruct” from the Air Quality Regulatory Agencyhaving jurisdiction.
b. Planning. Consideration of air quality issues veryearly in the planning process is important because engi-neering, siting, and financial decisions will be affectedby New Source Review. Engineering and constructionschedules should include the New Source Review pro-cess which can take from 6 to 42 months to completeand which may require the equivalent of one year ofmonitoring ambient air quality before the review pro-cess can proceed.
c. Emission levels. One must file for a New SourceReview application if, after use of air pollution controlequipment, the new boiler or incinerator will result inincreased emissions of any pollutant greater than aspecified limit. Proposed modifications of existingboilers and incinerators that will cause increases inpollutant emissions greater than certain threshold lev-els (“de minimis” emission rate) require New SourceReview.
d. General determinants for steps required for per-mitting. Steps required for a New Source Reviewdepend upon the location of the new source, charac-teristics of the other sources in the area, and on discus-sions with the State Air Pollution Control Agencies,possibly the EPA, and how well one is current with thechanges in regulations and administrative practices.Because of the constantly changing picture, it is usuallyvery beneficial to engage an air quality consultant to aidin planning permitting activities.
e. Technical tusks. The principal technical tasks thatare required for the permitting effort in most cases maybe summarized as follows:
(1)
(2)
(3)
Engineering studies of expected emissionrates and the control technology that must beused.Mathematical modeling to determine theexpected impact of the changed emissionsource.Collection of air quality monitoring datarequired to establish actual air quality con-centrations and to aid in analysis of air qualityrelated values. All technical tasks are open topublic questioning and critique before the per-mitting process is completed.
f. New Source Review program steps. The stepsrequired in a New Source Review vary. However, it isalways required that a separate analysis be conductedfor each pollutant regulated under the Act. Differentpollutants could involve different paths for obtaining apermit, and may even involve different State and Fed-eral Agencies.
(1) Attainment or nonattainment ureas. A con-cern which must be addressed at the beginningof a New Source Review is whether the loca-tion is in a “nonattainment” or “attainment”area. An area where the National Ambient AirQuality Standards (NAAQS) are not met is a“nonattainment” area for any particular pollu-
4-1

TM 5-815-1/AFR 19-6
(2)
(3)
(4)
tant exceeding the standards. Areas where theNational Ambient Air Quality Standards(NAAQS) that are being met are designated asan “attainment” area. Designation of the areaas “attaining”, or “nonattaining”, for each pol-lutant encountered determines which of thetwo routes is followed to procure a permit.Note that the area can be attaining for onepollutant and nonattaining for another pollu-tant. If this occurs one must use differentroutes for each of the pollutants and wouldhave to undertake both “preventation of signifi-cant deterioration” (PSD) and “nonattain-ment” (NA) analyses simultaneously.
Attainment urea. If the proposed source is inan “attainment” area, there is a specifiedallowed maximum increase, or “increment”, ofhigher air pollutant concentrations. The upperlimit of this increment may be well below theprevailing National Ambient Air QualityStandard (NAAQS). The “increment” conceptis intended to “prevent significant deteriora-tion” of ambient air quality. The new sourcemight be allowed to consume some part of the“increment” as determined by regulatoryagency negotiations.
Nonattainment urea. If the proposed newsource is in a “nonattainment” area, it mayhave to be more than off-set by decreases ofemissions from existing sources, resulting inair cleaner after addition of the new sourcethan before it was added. In the absence ofpollutant reductions at an existing sourcewhich is within administrative control, it maybe necessary to negotiate for, and probably payfor, emission reductions at other sources.
Summary of permitting path. The steps listedbelow present a summary of the permittingsteps:
(a) Formulate a plan for obtaining a con-struction permit. It is usually advisable toengage a consultant familiar with the per-mitting procedures to aid in obtaining thepermit.
(b) Contact state regulatory agencies.(c) Determine if the modification could qualify
for exemption from the New Source Reviewprocess.
(d) Determine if the proposed facility will beconsidered a “major source” or “major mod-ification” as defined by the regulations.
(e) Determine if, and how, with appropriatecontrols, emissions can be held to less than“de minimis” emission rates for the pollu-tant so New Source Review proceduresmight be avoided.
(f) Consider the questions related to preven-tion of significant deterioration and nonat-tainment. If it is found the facility will be amajor source, determine for which areasand pollutants you will have to follow PSDrules. Determine possible “off-sets” if anywill be required.
(g) List the tasks and steps required for a per-mit and estimate the costs and time incre-ments involved in the review process.Coordinate the New Source Review sched-ule with the facility planning schedule anddetermine how the New Source Review willaffect construction plans, siting, budgetaryimpact, schedules and the engineering forcontrols technology.
4-4 . Mathematical model inga. Modeling requirement. Air quality modeling is
necessary to comply with rules for proposed sources inboth attaining and nonattaining areas. Modeling is amathematical technique for predicting pollutant con-centrations in ambient air at ground level for the spe-cific site under varying conditions.
b. Modeling in attainment ureas. Modeling is used,under PSD rules, to show that emissions from thesource will not cause ambient concentrations to exceedeither the allowable increments or the NAAQS for thepollutant under study. It may be necessary to model theproposed new source along with others nearby to dem-onstrate compliance for the one being considered.
c. Modeling in nonattainment ureas. Modeling isused to determine the changes in ambient air con-centrations due to the proposed new source emissionsand any off-setting decreases which can be arrangedthrough emissions reduction of existing sources. Themodeling then verifies the net improvement in airquality which results from subtracting the proposedoff-sets from the new source emissions.
d. Monitoring. Modeling is also used to determinethe need for monitoring and, when necessary, to selectmonitoring sites.
e. Guideline models. EPA’s guideline on air qualityrecommends several standard models for use in reg-ulatory applications. Selection requires evaluation ofthe physical characteristics of the source and surround-ing area and choice of a model that will best simulatethese characteristics mathematically. Selection of theproper model is essential because one that greatly over-predicts may lead to unnecessary control measures.Conversely, one that under-predicts ambient pollutionconcentration requires expensive retrofit control mea-sures. Because of the subtleties involved, it is usuallyadvisable to consult an expert to help select and applythe model.
4-2

TM 5-815-1/AFR 19-6
4-7. Factors affecting stack designa. Design of the stack has a significant effect on the
resulting pollutant concentrations in nearby ambientair. Stack emission dispersion analysis is used to deter-mine increases in local air pollution concentrations forspecific emission sources. Factors which bear upon thedesign of stacks include the following:
-Existing ambient pollutant concentrations inthe area where the stack will be located
-Meteorological characteristics for the area-Topography of the surrounding area
b. Specific regulations having to do with stack designhave been promulgated by the EPA to assure that thecontrol of air pollutant shall not be impacted by stackheight that exceeds “good engineering practice” or byany other dispersion technique. These regulations havea direct bearing on the specific location and height of astack designed for a new pollution source.
4-5. MonitoringFor a New Source Review, monitoring may be requiredto obtain data which shows actual baseline air qualityconcentrations. If monitoring is required, prepare amonitoring plan that includes monitor siting, measure-ment system specifications, and quality assurance pro-gram design. Once the plan is ready, it should bereviewed with the relevant agencies.
4-6. Presentation and hearingsAfter a New Source Review application is prepared, itmust be reviewed with the appropriate agency. Often apublic hearing will be necessary and the application willhave to be supported with testimony. At the hearing,all phases of work will be subject to public scrutiny andcritique.
4-3

TM 5-815-1/AFR 19-6
CHAPTER 5
MEASURING TECHNIQUES
5-1. CriteriaIn order to evaluate the nature and magnitude of airpollution, establish remedial measures, and determinecontrol programs, it is necessary to test for the exist-ence of pollutants. In the upgrading of existing installa-tions, compliance is determined through “point sourceemission rate tests.” Revisions to the regulationsregarding air pollution test requirements for federalinstallations appear in the Federal Register.
5-2. Stack and source measurement tech-niques
The point source emission rate test methods andrequirements are covered under Environmental Pro-tection Agency Regulations on Standards of Perform-ance for New Stationary Sources, 40 CFR 60 andsubsequent revisions. The techniques are listed in table5 - l .
EPAMethodNumber
1
23
4566A6B7
7A8
910
17
18
Table 5-l
EPA emissions sampling techniques Pollutant
ToDetermine:
Sampling site and the maximum number of samplingpoints required for the extraction of a representativesample of flue gas from a stationary source.Velocity and volumetric flow rate of flue gas.Concentration by volume of carbon dioxide (CO2),carbon monoxide (CO) and Oxygen (02) in flue gas, alsoexcess air and dry molecular weight.Moisture content of flue gas.Particulate emissions from stationary sources.Sulphur dioxide (SO2) concentration in flue gas.SO2, CO2, moisture.SO2 and CO2 daily average emission.All nitrogen oxides (NOx) in flue gas except nitrousoxide (NO).All NOx emissions except nitrous oxides (NO).Sulphur dioxide and sulphuric acid (H2S04) mistconcentrations in flue gas.Opacity of visible emissions.Carbon monoxide (CO) emissions from stationarysources when specified for determining compliancewith new Source Performance Standards.Particulate emissions from stationary sources (in-stackfiltration method).Gaseous organic compound emissions determination bygas chromatography.
CO * Nondispersive infrared*Flame ionization
SO2West-Gaeke sulfuric acid
* West-Gaeke calorimetric* Conductimetric* Coulometric*G. C. flame photometric*Pulsed fluorescence
Oxidants(03) * Chemiluminescence
Calorimetric* Coulometric
NO2Gas PhaseChemiluminescence
* Calorimetric* Coulometric
Sodium arsenite bubblerHydrocarbon Gas Chromatography
(correctedfor methane)*Continuous sampling method
(1) Continuous sampling is the recommendedtechnique for obtaining the most reliable infor-mation concerning the variation of pollutantconcentration in the real atmosphere. Discretesampling can be used for plume tracking andrandom checking. Discrete sampling should beused with caution, however, when measuringany of several pollutants that have daily varia-tions. (For example, ozone has very low con-centrations at night.) In addition, use of
5-3. Meteorological and ambient air mea-surement
a. Measurements. Air quality measurements areused to trace emission sources and determine if these
sources comply with federal, state, and local air qualitystandards. For the determination of possible violationsof air quality, the continuous monitoring of pollutantconcentrations is normally required for a one-yearperiod. Air quality measurements are a function of thesampling site, the local meteorology, the methods used,and the existing pollutant concentration in theatmosphere. Personnel knowledgeable and experi-enced in meteorology and air quality testing are neededto conduct and evaluate air-quality measurements.
b. Sampling technique. The criteria for instrumen-tation, calibration, and use of EPA-approved sam-pling techniques are covered under 40 CFR 53Environmental Protection Agency Regulations onAmbient Air Monitoring Reference and EquivalentMethods. See table 5-2.
Table 5-2
Air quality sampling method summary
MethodEPA
Approved Unapproved
X -- XX- X- X- X- X- X
X -- X- X
X -- X- X- XX -
5-1

TM 5-815-1/AFR 19-6
discrete sampling methods will often result ineconomically unacceptable manpower require-ments. In these cases, sampling with continu-ous instruments and recording on data chartsprovides a lower cost solution.
(2) Air quality regulations require the measure-ment of extremely small pollutant con-centrations (l/100 of a part per million byvolume). Sensitive instruments capable ofdetecting small concentrations are needed.
c. Sampling method for carbon monoxide. The fed-eral reference method for measuring carbon monoxideis the instrumental nondispersive infrared technique.A typical instrument consists of a reference cell filledwith CO free air, and a sample, or detector, cell. Thedifference in transmittance of infrared radiation pass-ing through the sample cell and the reference cell issensed by a photon detector. The difference is a meas-ure of the optical absorption of the CO in the sample celland is proportional to the CO concentration in thesample. The signal from the detector is amplified andused to drive an output meter as a direct measure of COconcentration. This method is precise and accurate.
d. Sampling method for sulfur dioxide. The West-Gaeke sulfuric acid method is the Federal referencemethod for measuring sulfur oxides. The West-Gaekemethod is a discrete bubbler technique which involvesbubbling ambient air through an impinger for 24 hours.Sulfuric acid is added to the absorber to eliminate inter-ferences from oxides of nitrogen. SO2 is collected in atetrachloromercurate solution. When acid bleach para-rosaniline is added to the collected SO2 together withformaldehyde, a red-violet compound is formed whichis then measured spectrophotometrically. This methodis a discrete instrumental sampling method, but may bemodified for continuous use.
e. Sampling method for oxidants and ozone. Theinstrumental-chemiluminescence method is the federalreference method for measuring ozone. Upon mixingambient air and ethylene in the testing instrument,ozone reacts with the ethylene to emit light. This lightis measured by a photomutiplier. If the air and ethyleneflow rates are constant, and the proportion of air andethylene therefore known, the resulting signal can berelated to ozone concentration. Analyzers are cali-brated with a known ozone concentration.
f. Sampling method for nitrogen dioxide. The fed-eral reference method for NO2 is the indirect measure-ment of the concentration of nitrogen dioxide byphotometrically measuring the light intensity of wave-lengths greater than 600 nanometers resulting from thegas phase chemiluminescent reaction of nitric oxide(NO) with ozone (03).
g. Sampling method for total hydrocarbons. Gaschromatography flame ionization is the federal refer-ence method of measuring total hydrocarbons.
h. Sampling method for particulates.
(1) Total suspended particulates. The high volumeair sample is the federal reference method formeasuring total suspended particulates. Air isdrawn (at 40 to 60 ft3/min) through a glass fiberfilter by means of a blower, and suspendedparticles having an aerodynamic diameterbetween 100 and 1.0 micron are collected. Thesuspended particulate is calculated by dividingthe net weight of the particulate by the total airvolume samples and is reported in ug/m3.
(2) Coefficient of haze (COH). A few states havestandards for a particulate measurementcalled the coefficient of haze. This measure-ment is reported in units of COH/l000 linearfeet of sampled air. In this method, air is drawnthrough a small spot on a circle of filter paperuntil the equivalent of a 1000 feet long columnof air of the diameter of the spot has passedthrough the filter paper. Transmittancethrough this spot then serves as a measure-ment of particulate material collected on thefilter. There are considerable doubts as to theusefulness and true meaning of COH data,since the transmittance recorded is a functionof the nature of the particulate as well as thetotal weight sampled.
(3) Dustfall (settleable particulates). Severalstates have standards for the amount of par-ticulate that settles out of the air over a givenlength of time (one common unit is grams/square meter/30 days). The method of collec-tion is generally the dust bucket. A dustbucket is a 15-inch deep metal or plate con-tainer with a 6-inch opening that is exposed tothe air generally for a period of one month.Dust buckets should be partially filled withdistilled water (or antifreeze) which preventsthe transporting of dust out of the buckets bystrong winds. This water also acts as a wash atanalysis time. After evaporating the water,the remaining material is weighed and the res-idues are converted to the required units.
i. Traceable compounds. Test methods for com-pounds other than those for which standards exist areoften useful in evaluating stack dispersion. If unusualfuel additives are used, or if incinerators are used todispose of specialized materials, laboratory chemistscan often devise sampling methods to measure thesecompounds in the atmosphere.
j. Ringelmann standards. Particulate matter suchas soot, fly ash, and droplets of unburned combustiblespresent in exhaust gases tend to impart blackness oropacity to a plume. It is assumed that the darker theshade of gray or black, the greater the concentration ofparticulate matter present in a plume. The RingelmannChart offers a set of standards with which to measurethe opacity of an effluent plume. By the comparison of
5-2

TM 5-815-1/AFR 19-6
the blackness of a plume to the blackness of a series ofgraduated light diffusers, a Ringelmann number corre-sponding to a percent opacity can be assigned to theplume (see table 5-3). It should be noted that whileRingelmann numbers give a relative indication of plumeopacity, they bear no direct relationship to plume par-ticulate loading. They should supplement but notreplace point-source emission tests.
Table 5-3Ringleman standards
Ringlemann Opacity (percent)
No. 1 20No. 2 40No. 2-½ 50No. 3 60No. 3-½ 70No. 4 80No. 4-½ 90No. 5 100
5-4. Flue gas sampling portsSampling ports are approximately 4 inches in diameter,extend out approximately 4 inches from the stack, and
have a removable cover. On double wall stacks samplingports may consist of a 4-inch diameter pipe extendingfrom 4 inches outside the stack to the inner edge of theinner stack wall. Accessible sampling ports shall beprovided and located so that the cross sectional area ofthe stack or flue can be traversed to sample the flue gasin accordance with the applicable current federal orstate regulations for fuel burning equipment.
5-5. Air pollution project contactsU.S. Army Environmental Hygiene Agency (AEHA),Aberdeen Proving Grounds, MD, may be contacted forthe respective service air pollution projects on the fol-lowing:
a. Source testing to characterize pollutants fordesign controls.
b. Consultation on test performance standards andwitnessing tests.
c. Testing of installed air pollution abatement equip-ment for compliance with regulatory standards.
5-3

TM 5-815-1/AFR 19-6
CHAPTER 6
CYCLONES AND MULTICYCLONES
6-1. CycloneThe cyclone is a widely used type of particulate collec-tion device in which dust-laden gas enters tangentiallyinto a cylindrical or conical chamber and leaves througha central opening. The resulting vortex motion or spi-raling gas flow pattern creates a strong centrifugalforce field in which dust particles, by virtue of theirinertia, separate from the carrier gas stream. Theythen migrate along the cyclone walls by gas flow andgravity and fall into a storage receiver. In a boiler orincinerator installation this particulate is composed offly-ash and unburned combustibles such as wood char.Two widely used cyclones are illustrated in figure 6-l.
6-2. Cyclone typesa. Cyclones are generally classified according to
their gas inlet design and dust discharge design, theirgas handling capacity and collection efficiency, andtheir arrangement. Figure 6-2 illustrates the varioustypes of gas flow and dust discharge configurationsemployed in cyclone units. Cyclone classification isillustrated in table 6-l.
b. Conventional cyclone. The most commonly usedcyclone is the medium efficiency, high gas throughput(conventional) cyclone. Typical dimensions are illus-trated in figure 6-3. Cyclones of this type are usedprimarily to collect coarse particles when collectionefficiency and space requirements are not a major con-sideration. Collection efficiency for conventionalcyclones on 10 micron particles is generally 50 to 80percent.
c. High efficiency cyclone. When high collection effi-ciency (80-95 percent) is a primary consideration incyclone selection, the high efficiency single cyclone iscommonly used (See figure 6-4). A unit of this type isusually smaller in diameter than the conventionalcyclone, providing a greater separating force for thesame inlet velocity and a shorter distance for the parti-cle to migrate before reaching the cyclone walls. Theseunits may be used singly or arranged in parallel orseries as shown in figure 6-5. When arranged in paral-lel they have the advantage of handling larger gas vol-umes at increased efficiency for the same power con-sumption of a conventional unit. In parallel they alsohave the ability to reduce headroom space require-ments below that of a single cyclone handling the samegas volumes by varying the number of units in opera-tion.
d. Multicyclones. When very large gas volumesmust be handled and high collection efficiencies areneeded a multiple of small diameter cyclones are usu-ally nested together to form a multicyclone. A unit ofthis type consists of a large number of elements joinedtogether with a common inlet plenum, a common outletplenum, and a common dust hopper. The multicycloneelements are usually characterized by having a smalldiameter and having axial type inlet vanes. Their per-formance may be hampered by poor gas distribution toeach element, fouling of the small diameter dust outlet,and air leakage or back flow from the dust bin into thecyclones. These problems are offset by the advantage ofthe multicyclone’s increased collection efficiency overthe single high efficiency cyclone unit. Problems can bereduced with proper plenum and dust dischargedesign. A typical fractional efficiency curve for multi-cyclones is illustrated in figure 6-6.
e. Wet or irrigated cyclone. Cyclones may be oper-ated wet in order to improve efficiency and prevent wallbuildup or fouling (See fig. 6-7). Efficiency is higher forthis type of operation because dust particles, once sepa-rated, are trapped in a liquid film on the cyclone wallsand are not easily re-entrained. Water is usuallysprayed at the rate of 5 to 15 gallons per 1,000 cubic feet(ft3) of gas. Wet operation has the additional advan-tages of reducing cyclone erosion and allowing the hop-per to be placed remote from the cyclones. If acids orcorrosive gases are handled, wet operation may resultin increased corrosion. In this case, a corrosion resis-tant lining may be needed. Re-entrainment caused byhigh values of tangential wall velocity or accumulationof liquid at the dust outlet can occur in wet operation.However, this problem can be eliminated by propercyclone operation. Wet operation is not currently acommon procedure for boilers and incinerators.
6-3. Cyclone collection efficiencya. Separation ability. The ability of a cyclone to
separate and collect particles is dependent upon theparticular cyclone design, the properties of the gas andthe dust particles, the amount of dust contained in thegas, and the size distribution of the particles. Mostefficiency determinations are made in tests on a geo-‘metrically similar prototype of a specific cyclone designin which all of the above variables are accuratelyknown. When a particular design is chosen it is usuallyaccurate to estimate cyclone collection efficiency based
6-1

TM 5-815-1/AFR 19-6
U.S. Army Corps of Engineers
Figure 6-l. Cyclone configuration
upon the cyclone manufacturer’s efficiency curves for ciency curve in order to determine overall cyclone col-handling a similar dust and gas. All other methods of lection efficiency.determining cyclone efficiency are estimates and (1) A particle size distribution curve shows theshould be treated as such. weight of the particles for a given size range in
b. Predicting cyclone collection efficiency. A parti- a dust sample as a percent of the total weight ofcle size distribution curve for the gas entering a cycloneis used in conjunction with a cyclone fractional effi-
6-2
the sample. Particle size distributions aredetermined by gas sampling and generally con-

TM 5-815-1/AFR 19-6
U.S. Army Corps of Engineers
Figure 6-2. Types of cyclones in common use.
6-3

TM 5-815-1/A
FR 19-6
6-4

TM 5-815-1/AFR 19-6
PARTICLE SIZE, MICRONS
ADAPTED FROM EPA-450/3-81-005a,CONTROL TECHNIQUES FORPARTICULATE EMISSIONS FROMSTATIONARY SOURCES
Figure 6-3. Relative effect of cyclone dimensions on efficiency.
form to statistical distributions. See figure6-8.
(2) A fractional cyclone efficiency curve is used toestimate what weight percentage of the parti-cles in a certain size range will be collected at aspecific inlet gas flow rate and cyclone pressuredrop. A fractional efficiency curve is bestdetermined by actual cyclone testing and maybe obtained from the cyclone manufacturer. Atypical manufacturer’s fraction efficiency curveis shown on figure 6-9.
(3) Cyclone collection efficiency is determined bymultiplying the percentage weight of particlesin each size range (size distribution curve) bythe collection efficiency corresponding to thatsize range (fractional efficiency curve), andadding all weight collected as a percentage ofthe total weight of dust entering the cyclone.
6-4. Cyclone pressure drop and energyrequirements
a. Pressure drop. Through any given cyclone therewill be a loss in static pressure of the gas between the
inlet ductwork and the outlet ductwork. This pressuredrop is a result of entrance and exit losses, frictionallosses and loss of rotational kinetic energy in the exitinggas stream. Cyclone pressure drop will increase as thesquare of the inlet velocity.
b. Cyclone energy requirements. Energy require-ments in the form of fan horsepower are directly pro-portional to the volume of gas handled and the cycloneresistance to gas flow. Fan energy requirements areestimated at one quarter horsepower per 1000 cubicfeet per minute (cfm) of actual gas volume per one inch,water gauge, pressure drop. Since cyclone pressuredrop is a function of gas inlet and outlet areas, cycloneenergy requirements (for the same gas volume anddesign collection efficiency) can be minimized by reduc-ing the size of the cyclone while maintaining the samedimension ratios. This means adding more units inparallel to handle the required gas volume. The effecton theoretical cyclone efficiency of using more units inparallel for a given gas volume and system pressuredrop is shown in figure 6-10. The increased collectionefficiency gained by compounding cyclones in parallelcan be lost if gas recirculation among individual units isallowed to occur.
6-5

TM 5-815-1/AFR 19-6
PARTICLE SIZE, MICRONS
SIZE-EFFICIENCY CURVE FOR HIGH EFFICIENCY (LONG CONE)
H I G H E F F I C I E N C Y
S I N G L E C Y C L O N E U N I T ( L O N G C O N E )
D E S I G N C R I T E R I A
100 - 2,000 ft 3/ m i n
50 - 70 f t /s
D - LESS THAN 3 FEET
P - 2 TO 6 in H2 0
U.S. Army Corps of Engineers
Figure 6-4. Efficiency curve and dimensions for a high efficiency single cyclone
6-5. Applicationa. Particulate collection. Cyclones are used as par-
ticulate collection devices when the particulate dust iscoarse, when dust concentrations are greater than 3grains per cubic foot (gr/ft3), and when collection effi-ciency is not a critical requirement. Because collectionefficiencies are low compared to other collection equip-ment, cyclones are often used as pre-cleaners for other
6-6
equipment or as a final cleaner to improve overall effi-ciency.
b. Pre-cleaner. Cyclones are primarily used as pre-cleaners in solid fuel combustion systems such asstoker fired coal burning boilers where large coarseparticles may be generated. The most common applica-tion is to install a cyclone ahead of an electrostaticprecipitator. An installation of this type is particularly

TM 5-815-1/AFR 19-6
a. Paral le l
TWIN CYCLONES
GROUP OF FOUR CYCLONES
b. Se r ies
GROUP OF THREE CYCLONES
GROUP OF SIX CYCLONES
SERIES CYCLONE ARRANGEMENT
U.S. Army Corps of Engineers
Figure 6-5. Parallel and series arrangements for cyclones.
6-7

TM 5-815-1/AFR 19-6
0 IO 20 30 40 50 60 70Part ic le Size , microns
S IZE-EFF IC IENCY CURVE FOR SMALL-D IAMETER MULTIPLE CYCLONE
HIGH EFFICIENCY MULTIPLEC Y C L O N E U N I T S ( M U L T I C L O N E S )
DESIGN CRITERIA
30,000 - 100,000 ft3/min
50 - 70 ft/s
D - 6 - 12 inches
p - 3 to 6 in H2O
U.S. Army Corps of Engineers
Figure 6-6. Efficiency curve and illustration of a multicyclone unit.
6-8

TM 5-815-1/AFR19-6
0 10 2 0 3 0 4 0 5 0 6 0 7 0 8 0P A R T I C L E S I Z E , M I C R O N S
U.S. Army Corps of Engineers
Figure 6-7. Size-efficiency curve for high-effjciency (long cone) irrigated cyclone.
6-9

TM 5-815-1/AFR 19-6
W E I G H T P E R C E N T A G E L E S S T H A N S T A T E D P A R T I C L E S I Z E
PARTICLE SIZE DISTRIBUTIONS OF PARTICULATE EMITTEDFROM UNCONTROLLED POWER PLANTS
( P U L V E R I Z E D C O A L F I R E D B O I L E R ) ( 7 )
U.S. Army Corps of Engineers
Figure 6-8. Particle size distribution curve (by weight) of particulate emitted from uncontrolled power
efficient because the cyclone exhibits an increased col-lection efficiency during high gas flow and dust loadingconditions, while the precipitator shows and increase incollection efficiency during decreased gas flow and dustloading. The characteristics of each type of equipmentcompensate for the other, maintaining good efficiencyover a wide range of operating flows and dust loads.Cyclones are also used as pre-cleaners when large dustloads and coarse abrasive particles may affect the per-formance of a secondary collector. They can also be used
6-10
for collection of unburned particulate for re-injectioninto the furnace.
c. Fine particles. Where particularly fine stickydust must be collected, cyclones more than 4 to 5 feet indiameter do not perform well. The use of small diame-ter multicyclones produces better results but may besubject to fouling. In this type of application, it isusually better to employ two large diameter cyclones inseries.
d. Coarse particles. When cyclones handle coarse

TM 5-815-1/AFR 19-6
b. TYPICAL MANUFACTURER’S FRACTIONAL EFFICIENCY CURVE
U.S. Army Corps of Engineers
Figure 6-9. Fractional efficiency curves
6-11
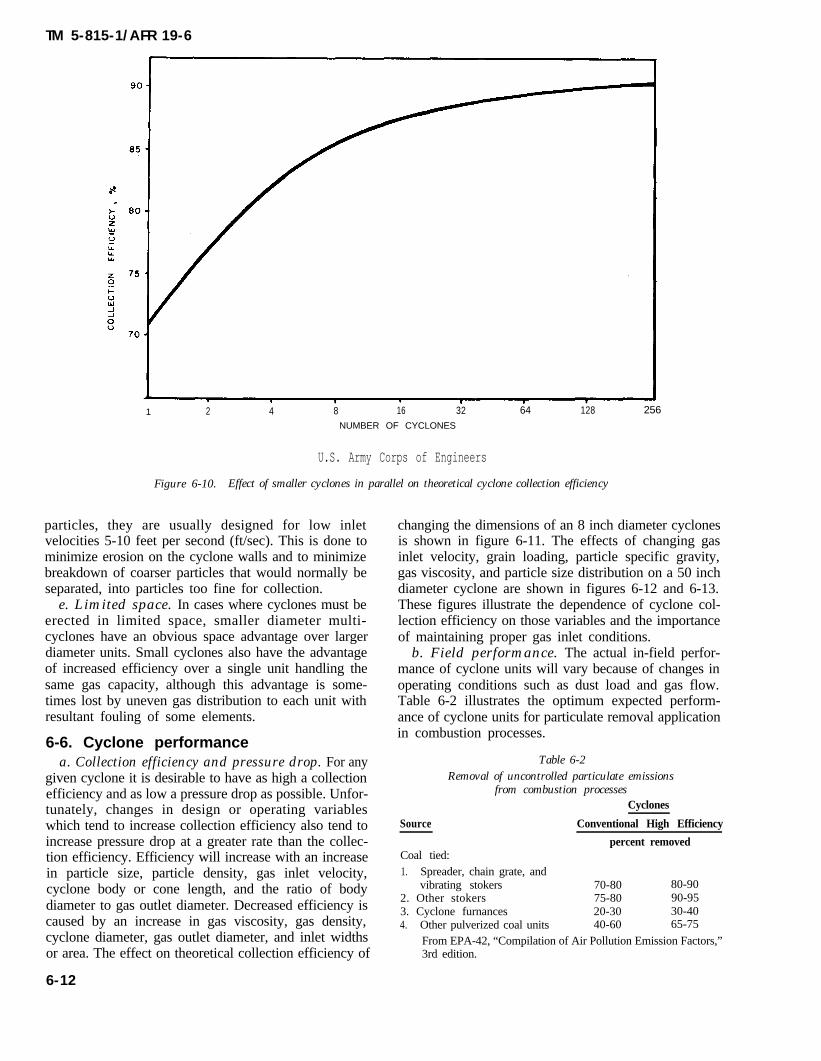
TM 5-815-1/AFR 19-6
1 2 4 8 16 32 64 128 256
NUMBER OF CYCLONES
U.S. Army Corps of Engineers
Figure 6-10. Effect of smaller cyclones in parallel on theoretical cyclone collection efficiency
particles, they are usually designed for low inletvelocities 5-10 feet per second (ft/sec). This is done tominimize erosion on the cyclone walls and to minimizebreakdown of coarser particles that would normally beseparated, into particles too fine for collection.
e. Limited space. In cases where cyclones must beerected in limited space, smaller diameter multi-cyclones have an obvious space advantage over largerdiameter units. Small cyclones also have the advantageof increased efficiency over a single unit handling thesame gas capacity, although this advantage is some-times lost by uneven gas distribution to each unit withresultant fouling of some elements.
6-6. Cyclone performancea. Collection efficiency and pressure drop. For any
given cyclone it is desirable to have as high a collectionefficiency and as low a pressure drop as possible. Unfor-tunately, changes in design or operating variableswhich tend to increase collection efficiency also tend toincrease pressure drop at a greater rate than the collec-tion efficiency. Efficiency will increase with an increasein particle size, particle density, gas inlet velocity,cyclone body or cone length, and the ratio of bodydiameter to gas outlet diameter. Decreased efficiency iscaused by an increase in gas viscosity, gas density,cyclone diameter, gas outlet diameter, and inlet widthsor area. The effect on theoretical collection efficiency of
6-12
changing the dimensions of an 8 inch diameter cyclonesis shown in figure 6-11. The effects of changing gasinlet velocity, grain loading, particle specific gravity,gas viscosity, and particle size distribution on a 50 inchdiameter cyclone are shown in figures 6-12 and 6-13.These figures illustrate the dependence of cyclone col-lection efficiency on those variables and the importanceof maintaining proper gas inlet conditions.
b. Field performance. The actual in-field perfor-mance of cyclone units will vary because of changes inoperating conditions such as dust load and gas flow.Table 6-2 illustrates the optimum expected perform-ance of cyclone units for particulate removal applicationin combustion processes.
Table 6-2Removal of uncontrolled particulate emissions
from combustion processesCyclones
Source Conventional High Efficiency
percent removedCoal tied:1. Spreader, chain grate, and
vibrating stokers 70-80 80-902. Other stokers 75-80 90-953. Cyclone furnances 20-30 30-404. Other pulverized coal units 40-60 65-75
From EPA-42, “Compilation of Air Pollution Emission Factors,”3rd edition.

TM 5-815-1/AFR 19-6
Figure 6-11. Effect of altering individual cyclone dimensions on theoretical collection efficiency for an 8-inch diameter cyclone
Curve 1 = cyclone body diameterCurve 2 = c y c l o n e g a s o u t l e t d i a m e t e rCurve 3 = cyclone inlet widthCurve 4 = cyc lone in l e t he igh t
U.S. Army Corps of Engineers
6-7. Cyclone operationa. Erosion. Erosion in cyclones is caused by
impingement and rubbing of dust on the cyclone walls.Erosion becomes increasingly worse with high dustloading, high inlet velocities, larger particle size, andmore abrasive dust particles. Any defect in cyclonedesign or operation which tends to concentrate dustmoving at high velocity will accelerate erosion. Theareas most subject to erosive wear are opposite theinlet, along lateral or longitudinal weld seams on thecyclone walls, near the cone bottom where gasesreverse their axial flow, and at mis-matched flangeseams on the inlet or dust outlet ducting. Surface irreg-ularities at welded joints and the annealed softening ofthe adjacent metal at the weld will induce rapid wear.The use of welded seams should be kept to a minimumand heat treated to maintain metal hardness. Continu-ous and effective removal of dust in the dust outlet
region must be maintained in order to eliminate a highcirculating dust load and resultant erosion. The cyclonearea most subject to erosion is opposite the gas inletwhere large incoming dust particles are thrown againstthe wall, and in the lower areas of the cone. Erosion inthis area may be minimized by use of abrasion resistantmetal. Often provisions are made from removable lin-ings which are mounted flush with the inside surface ofthe shell. Erosion resistant linings of troweled or castrefractory are also used. Dust particles below the 5 to10 micron range do not cause appreciable erosionbecause they possess little mass and momentum. Ero-sion is accelerated at inlet velocities above approx-imately 75 ft/sec.
b. Fouling. Decreased collection efficiency,increased erosion, and increased pressure drop resultfrom fouling in cyclones. Fouling generally occurseither by plugging of the dust outlet or by buildup of
6-13

TM 5-815-1/AFR 19-6
U. S. Army Corps of Engineers
Figure 6-12. Effects of cyclone inlet velocity and grain loading
materials on the cyclone wall. Dust outlets becomeplugged by large pieces of extraneous material in thesystem, by overfilling of the dust bin, or by the break-off of materials caked on the cyclone walls. The buildupof sticky materials on the cyclone walls is primarily afunction of the dust properties. The finer or softer thedust, the greater is the tendency to cake on the walls.Condensation of moisture on the walls will contribute todust accumulations. The collector should therefore beinsulated to keep the surface temperature above theflue gas dew point. Wall buildup can generally be mini-mized by keeping the gas inlet velocity above 50 ft/sec.
c. Corrosion. Cyclones handling gases containing
6-14
sulfur oxides or hydrogen chloride are subject to acidcorrosion. Acids will form when operating at low gastemperatures, or when the dust hopper may be coolenough to allow condensation of moisture. Corrosion isusually first observed in the hopper or between boltedsections of the cyclone inlet or outlet plenum spaceswhere gasketing material is used and cool ambient aircan infiltrate. Corrosion at joints can be minimized byusing welded sections instead of bolted sections. Duct-work and hoppers should be insulated and in cold cli-mates the hoppers should be in a weather protectedenclosure. Heat tracing of the hoppers may be neces-sary.

TM 5-815-1/AFR 19-6
U. S. Army Corps of Engineers
Figure 6-13. Effects of gas viscosity, dust specific gravity, and dust particle size distribution.
d. Dust hopper design. A properly designed dusthopper should be air tight and large enough to preventthe dust level from reaching the cyclone dust outlets.Dust hoppers are usually conical or pyramidal in shapeand are designed to prevent dust buildup against thewalls. All designs should include a means of continuousremoval of dust from the hopper to a storage bin, withan adequate alarm system to indicate a malfunction.Bin level alarms are frequently used for this purpose.On negative pressure systems, hoppers and removalsystem must be air tight. If hot unburned combustiblesor char are present in the collected particulate, intro-duction of fresh air can cause a hopper fire. Pneumaticash transport systems are not recommended for ash
containing unburned combustibles or char for the samereason.
6-8. Selection of materialsa. Conditions. Cyclones can be constructed of a vari-
ety of types of metals. The type of materials specified isdependent upon the erosion characteristics of the dust,the corrosion characteristics of the gases, and the oper-ating temperature of the cyclone. Generally, cyclonesare constructed of mild steel or cast iron. (See para 7-5for additional information on materials selection forpollution control systems).
b. Erosion. Erosion is the single most importantcriterion in specifying the materials for cyclone con-
6-15

TM 5-815-1/AFR 19-6
struction. Erosion life of a cyclone may be extended byusing harder and thicker grades of steel. A stainlesssteel of 400 Brinell rating or better is normally chosenfor cyclones subject to erosive conditions. When ero-sion is extreme, it is necessary to provide for replacea-ble liners in cyclone construction. Liners are made ofhard stainless steels or erosion resistant refractory. Inlow temperature fly ash applications, cyclones of mildsteel or iron can be used because dust loadings aregenerally too small to cause appreciable erosion. Castiron is most often used in multicyclones in boiler ser-vice.
c. Temperature. Cyclones operated above 800degrees Fahrenheit cannot be constructed of mildsteels because the metal will creep and form ridges orbuckled sections. Above 800 degrees Fahrenheit,nickel-copper bearing steel such as Monel is used toprovide added strength. When temperatures are inexcess of 1000 degrees Fahrenheit, nickel-chromiumsteel of the 400 series is used in conjunction with refrac-tory linings. Silica carbide refractories provide excel-lent protection against erosion and high temperaturedeformation of the cyclone metal parts.
6-9. Advantages and disadvantagesa. Advantages. The advantages of selecting cyclones
over other particulate collection devices are:-No moving parts,-Easy to install and replace defective parts,-Constructed of a wide variety of materials,-Minimum space requirements,-Designed to handle severe service conditions of
temperature, pressure, dust loading, erosion,corrosion, and plugging,
-Can be designed to remove liquids from gas,-Low capital costs,-Low maintenance costs.
b. Disadvantages. The disadvantages of selectingcyclones over other particulate collection devices are:
-Lower collection efficiency,-Higher collection efficiencies (90-95 percent)
only at high pressure drops (6 inches, watergauge),
-Collection efficiency sensitive to changes in gasflow, dust load, and particle size distribution,
-Medium to high operating costs.
6-16

TM 5-815-1/AFR 19-6
CHAPTER 7
HIGH AND LOW ENERGY SCRUBBER SYSTEMS
7-1. ScrubbersA scrubber utilizes a liquid to separate particulate orgaseous contaminants from gas. Separation is achievedthrough mass contact of the liquid and gas. Boiler emis-sions to be controlled include fly ash and sulfur oxides.Incinerator emissions to be controlled include fly ash,sulfur oxides and hydrogen chloride.
7-2. Types of scrubbersa. Low energy scrubbers. Low energy scrubbers are
more efficient at gaseous removal than at particulateremoval. A low energy scrubber utilizes a long liquid-gas contact time to promote mass transfer of gas. Lowenergy scrubbers depend on extended contact surfaceor interface between the gas and liquid streams to allowcollection of particulate or gaseous emissions.
(1) Plate-type scrubbers. A plate-type scrubberconsists of a hollow vertical tower with one ormore plates (trays) mounted transversely inthe tower (figure 7-l). Gas comes in at thebottom of the tower, and must pass throughperforations, valves, slots, or other openings ineach plate before exiting from the top. Liquidis usually introduced at the top plate, and flowssuccessively across each plate as it movesdownward to the liquid exit at the bottom. Gaspassing through the openings in each platemixes with the liquid flowing over the plate.The gas and liquid contact allows the masstransfer or particle removal for which the platescrubber was designed. Plate-type scrubbershave the ability to remove gaseous pollutantsto any desired concentration provided a suffi-cient number of plates are used. They can alsobe used for particle collection with severalsieve (perforated) plates combining to form asieve-plate tower. In some designs, impinge-ment baffles are placed a short distance aboveeach perforation on a sieve plate, forming animpingement plate upon which particles arecollected. The impingement baffles are belowthe level of liquid on the perforated plates andfor this reason are continuously washed cleanof collected particles. Particle collection effi-ciency is good for particles larger than onemicron in diameter. Design pressure drop isabout 1.5 inches of water for each plats.
(2) Preformed spray scrubbers. A preformedspray scrubber (spray tower) is a device whichcollects particles or gases on liquid dropletsand utilizes spray nozzles for liquid dropletatomization (figure 7-2). The sprays aredirected into a chamber suitably shaped toconduct the gas through the atomized liquiddroplets. Spray towers are designed for lowpressure drop and high liquid consumption.They are the least expensive method forachieving gas absorption because of theirsimplicity of construction with few internals.The operating power cost is low because of thelow gas pressure drop. Spray towers are mostapplicable to the removal of gases which havehigh liquid solubilities. Particle collection effi-ciency is good for particles larger than severalmicrons in diameter. Pressure drops rangefrom 1 to 6 inches, water gauge.
(3) Centrifugal scrubbers. Centrifugal scrubbersare cylindrical in shape, and impart a spinningmotion to the gas passing through them. Thespin may come from introducing gases to thescrubber tangentially or by directing the gasstream against stationary swirl vanes (figure7-2). More often, sprays are directed throughthe rotating gas stream to catch particles byimpaction upon the spray drops. Sprays can bedirected outward from a central spray manifoldor inward from the collector walls. Spraynozzles mounted on the wall are more easilyserviced when made accessible from the out-side of the scrubber. Centrifugal scrubbers areused for both gas absorption and particle col-lection and operate with a pressure drop rang-ing from 3 to 8 inches, water gauge. They areinefficient for the collection of particles lessthan one or two microns in diameter.
(4) Impingement and entrainment scrubbers.Impingement and entrainment scrubbersemploy a shell which holds liquid (figure 7-3).Gas introduced into a scrubber is directed overthe surface of the liquid and atomizes some ofthe liquid into droplets. These droplets act asthe particle collection and gas absorption sur-faces. Impingement and entrainment scrub-bers are most frequently used for particle
7-1

TM 5-815-1/AFR 19-6
U. S. Army Corps of Engineers
Figure 7-1. Plate type scrubber
collection of particles larger than severalmicrons in diameter. Pressure drops rangefrom 4 to 20 inches, water gauge.
(5) Moving bed scrubbers. Moving bed scrubbersprovide a zone of mobile packing consisting ofplastic, glass, or marble spheres where gas andliquid can mix intimately (figure 7-3). A cylin-drical shell holds a perforated plats on whichthe movable packing is placed. Gas passesupward through the perforated plate and/ordown over the top of the moving bed. Gasvelocities are sufficient to move the packingmaterial when the scrubber is operating whichaids in making the bed turbulent and keeps thepacking elements clean. Moving bed scrubbers
7-2
are used for particle collection and gas absorp-tion when both processes must be carried outsimultaneously. Particle collection efficiencycan be good down to particle sizes of onemicron. Gas absorption and particulate collec-tion are both enhanced when several movingbed stages are used in series. Pressure dropsrange from 2.5 to 6 inches water gauge perstage.
b. High energy scrubbers. High energy scrubbersutilize high gas velocities to promote removal of parti-cles down to sub-micron size. Gas absorption efficien-cies are not very good because of the co-currentmovements of gas and liquid and resulting limited gas/liquid contact time.

PREFORMED SPRAY SCRUBBER
Figure 7-2.
TM 5-815-1/AFR 19-6
CENTRIFUGAL SCRUBBERS
U.S. Army Corps of Engrs.
Types of spray and centrifugal scrubbers
(1) Venturi scrubbers. The venturi scrubber uti-lizes a moving gas stream to atomize and accel-erate the liquid droplets (figure 7-4). A con-vergent-divergent nozzle is used to achieve agas velocity of 200 to 600 feet per second (ft/sec) which enhances liquid atomization andparticulate capture. Collection efficiency in agas atomized venturi scrubber increases withpressure drop. Pressure drops of 25 incheswater gauge or higher are utilized to collectsub-micron particles. Scrubbers of the gasatomized type have the advantage of adjust-ment of pressure drop and collection efficiencyby varying gas velocity. The gas velocity iscontrolled by adjusting the area of the venturithroat. Several possible methods for doing thisare illustrated in figure 7-5. This can be usedto control performance under varying gas flowrates by maintaining a constant pressure dropacross the venturi throat. Due to the absence ofmoving parts, scrubbers of this type may beespecially suitable for the collection of stickyparticles. Disadvantages include high pressuredrop for the collection of sub-micron particlesand limited applicability for gas absorption.
(2) Ejector venturi. The ejector venturi scrubberutilizes a high pressure spray to collect parti-cles and move the gas. High relative velocitybetween drops and gas aids in particle collec-tion. Particle collection efficiency is good for
particles larger than a micron in diameter. Gasabsorption efficiency is low because of the co-current nature of the gas and liquid flow. Liq-uid pumping power requirements are high andcapacity is low making this type impractical forboiler or incinerator emissions control.
(3) Dynamic (wetted fan) scrubber. This scrubbercombines a preformed spray, packed bed orcentrifugal scrubber with an integral fan tomove the gas stream through the scrubber.Liquid is also sprayed into the fan inlet wherethe rotor shears the liquid into dispersed drop-lets. The turbulence in the fan increases liquid/gas contact. This type of scrubber is effectivein collection of fine particulate. Construction ofthis scrubber is more complex due to the neces-sity of the fan operating in a wet and possiblycorrosive gas stream. The design must preventbuild-up of particulates on the fan rotor.
c. Dry scrubbers. Dry scrubbers are so namedbecause the collected gas contaminants are in a dryform.
(1) Spray dryer The spray dryer is used to removegaseous contaminants, particularly sulfuroxides from the gas stream. An alkalinereagent slurry is mechanically atomized in thegas stream. The sulfur oxides react with theslurry droplets and are absorbed into the drop-lets. At the same time, the heat in the gas
7-3

TM 5-815-1/AFR 19-6
IMPlNGEMENT AND ENTRAINMENTSCRUBBER
M O V I N G B E DSCRUBBER
U.S. Army Corps of Engineers
Figure 7-3. Types of entrainment and mowing bed scrubbers
stream evaporates the water from the dropletsleaving a dry powder. The gas stream is thenpassed through a fabric filter or electrostaticprecipitator where the dry product and any flyash particulate is removed. The scrubberchamber is an open vessel with no internalsother than the mechanical slurry atomizernozzles. The vessel is large enough to allowcomplete drying of the spray before impingingon the walls and to allow enough residence timefor the chemical reaction to go to completion. Aschematic of the system is shown in figure 7-6.Refer to chapters 8 and 9 for discussion of thefabric filter or electrostatic precipitator.
(2) Gravel bed. The gravel bed, while referred to
as a dry scrubber, is more a filter using sizedgravel as the filter media. A bed of gravel iscontained in a vertical cylinder between twoslotted screens. As the gas passes through theinterstices of the gravel, particulates impacton, and are collected on the gravel surface.Sub-micron size particles are also collected onthe surface because of their Brownian move-ment. Dust-laden gravel is drawn off the bot-tom and the dust is separated from the gravelby a mechanical vibrator or pneumatic sepa-rator. The cleaned gravel is then conveyed upand dumped on top of the gravel bed. Thecylindrical bed slowly moves down and is con-stantly recycled.
7-4

TM 5-815-1/AFR 19-6
G A S A T O M I Z E D S P R A Y ( V E N T U R I ) S C R U B B E R
U.S. Army Corps of Engineers
Figure 7-4. Gas atomized spray (venturi) scrubber
DIRTY GAS IN
TO LIQUID ENTRAINMENTSEPARATOR
a. Movable-blade venturi
D I R T Y G A S I N
TO LIQUID ENTRAINMENTSEPARATOR
c. Radial-flow venturi
LIQUORINLET
MOVABLEDRUM
DIRTY GAS IN
TO LIQUID ENTRAINMENTSEPARATOR
b. Plumb-bob venturi
DIRTY GAS IN
d. Flooded-disc venturi
U.S. Army Corps of Engineers
Figure 7-5. Throat sections of variable venturi scrubbers
7-5

TM 5-815-1/AFR 19-6
U.S. Army Corps of Engineers
Figure 7-6. Spray dryer system
7-3. Applicationa. Particulate removal. Scrubbers may be used as
control devices on incinerators and boilers for fly ashcollection. The plate, spray, venturi, and moving bedtypes have been successfully applied; however, theirapplication has been limited because they require:
-more energy than dry particulate collectiondevices of the same collection efficiency,
-water supply and recovery system,-more extensive solid waste disposal system,-system to control the scrubbing process in
response to gas flow rate changes.b. In making decisions on applicability to a par-
ticular process, figure 7-7 is useful in determining allcomponents which must be taken into consideration.
c. Gaseous removal. Scrubbers have been used pri-marily for the removal of sulfur oxides in stack gases.(See chapter 10 for a more detailed description of sulfuroxides (SOx) control techniques.) However, as new con-trol systems are devised, simultaneous removal ofgases and particulate material will become the acceptedprocedure for designing scrubbers for combustion pro-cesses.
7-4. Treatment and disposal of waste mate-rials
Wet scrubber systems are designed to process exhauststreams by transfer of pollutants to some liquidmedium, usually water seeded with the appropriate
7-6
reactants. Liquid effluent treatment and disposal aretherefore an essential part of every wet scrubber sys-tem. Installation and maintenance of the associatedcomponents can add appreciably to the system capitaland operating costs. The degree of treatment requiredwill depend upon the methods of disposal or recycle andon existing regulations. Required effluent quality, envi-ronmental constraints, and availability of disposal sitesmust be established before design of a treatment facil-ity or the determination of a disposal technique canproceed. In many industrial applications the scrubberliquid wastes are combined with other plant wastes fortreatment in a central facility. Design of this wastetreatment should be by an engineer experienced inindustrial waste treatment and disposal.
7-5. Selection of materialsa. General conditions. When choosing construction
materials for scrubber systems, certain pertinent oper-ating parameters should be considered. The metal sur-face of an exhaust gas or pollution control system willbehave very differently in the same acid mist environ-ment, depending on conditions of carrier gas velocity,temperature, whether the conditions are reducing oroxidizing, and upon the presence of impurities. Forexample, the presence of ferric or cupric iron traces inacids can dramatically reduce corrosion rates ofstainless steels and titanium alloys. On the other hand,traces of chloride or fluoride in sulfuric acid can cause

TM 5-815-1/AFR 19-6
U.S. Army Corps of Engineers
Figure 7-7. Schematic diagram of scrubber flow
severe pitting in stainless steels. This condition is fre-quently encountered in an incinerator which burnslarge quantities of disposable polyvinyl chloride (PVC)materials.
b. Temperature. Corrosion rates generally increasewith increases in exhaust temperatures. This is due tothe increased mobility of ions and increased reactionrates. However, in cases where the corrosion process isaccelerated by the presence of oxygen, increasing theacid temperature eventually boils out dissolved oxy-gen, rapidly diminishing corrosion rate. This is the casewith Monel, a nickel-copper alloy.
c. Velocity. Often the corrosion resistance of an alloydepends on the existence of an adhering oxide layer onits surface. A high exhaust gas velocity can remove orerode the surface layer. Once removed, this layer can-not be renewed because the oxide film is washed awayas it forms.
d. State of oxidation. Under reducing condition,Monel is very resistant to moderate sulfuric-acid con-centrations. Under oxidizing conditions, or in the pres-ence of oxidizing ions, however, very rapid corrosion
occurs. The reverse is true of stainless steels which areresistant to oxidizing acid environments, but areattached by acids under reducing conditions. Theequipment designer should select materials based onindividual case conditions including temperature, abra-sion, pH, etc.
7-6. Auxiliary equipmenta. Gas transport.
(1) Ducts and stacks. Large boiler plant stackshave a wind shield of reinforced concrete or ofsteel, with a separate inner flue or numerousflues of steel, acid-resistant brick, and occa-sionally, stainless steel. The space between theinner flue and the outer wind shield may beinsulated with a mineral wool wrapping. This isto prevent the condensation of acid dew on theinside of the metal chimney, which occursbelow dew point temperature, and also to pre-vent acid “smut” from being blown out of thechimney. Acid smut is a term for ash particlescontaminated with acid. It is heavy and tends
7-7

TM 5-815-1/AFR 19-6
to fall out of the gas plume soon after exitingfrom the stack. In smaller plants, stacks maybe a single wall steel construction with insula-tion and lagging on the outer surface. For wetscrubbing practice, chimneys for vapor-satu-rated gases containing corrosive substancesmay be made of rubber-lined steel, fiberglass-reinforced resin or other corrosion-resistantmaterial. With materials that have a limitedmaximum temperature, provisions must bemade to protect the stack from high tem-peratures because of loss of scrubbing liquid.Chimney or stack velocities are generally 30 ft/sec to prevent re-entrainment of moisture fromthe stack wall which would rain down aroundthe plant. Sometimes cones are fitted at the topto give exit velocities as high as 75 ft/sec. Thechief reason for high velocities is to eject thegases well away from the top of the stack toincrease the effective height and to avoiddownwash. Downwash can damage the metalstructure supporting the stack, the stackitself, or the outside steel of a lined metalstack. (For a more detailed analysis of themeteorological considerations involved in stackdesign, see chapter 4.)
(2) Fans. In a wet scrubber system the preferredlocation for the boiler or incinerator induced-draft fan is upstream of the scrubber. Thiseliminates the need for special corrosion-resis-tant construction required to handle the wetdownstream gas. The fan should be selected toresist build-up of dry ash or erosion of the rotorsurfaces. For high dust load applications aradial blade or radial tip blade fan is moredurable. In a dry scrubber application the fanshould be downstream of the scrubber in theclean gas stream. Here a more efficient air-foilor squirrel-cage rotor can be used.
b. Liquid transport.(1) Pipework. For most scrubbing duties, the liq-
uid to be conveyed will be corrosive. Thereexists a wide variety of acid resistant pipeworkto choose from, but generally speaking, rub-ber-lined steel pipe has high versatility. It iseasy to support, has the strength of steel, willwithstand increases in temperature for a shorttime and will not disintegrate from vibration orliquid hammer. Fiberglass filament woundplastic pipe is also suitable for a very widerange of conditions of temperature, pressure,and chemicals. The chief disadvantage of rub-ber-lined pipe is that it cannot be cut to size andhas to be precisely manufactured with correctlengths and flange drilling. Site fabrication isnot possible. Most piping is manufactured to
ANSI specifications for pressure piping. Con-siderations must also be made for weather-proofing against freezing conditions.
(2) Pumps. Centrifugal pumps are used to supplythe scrubbing liquid or recycled slurry to thescrubber nozzles at the required volume flowrate and pressure. Where no solids are presentin the liquid, bare metal pumps, either iron orstainless steel construction, are used. In recy-cle systems with solids in the liquid, specialrubber-lined or hard-iron alloy pumps are usedto control erosion of the pump internals. Theseare generally belt driven to allow selection ofthe proper speed necessary for the designcapacity and head. Solids content must still becontrolled to limit the maximum slurry consis-tency to meet the scrubber and pump require-ments.
c. Entrainment separation. After the wetted gasstream leaves the scrubbing section, entrained liquiddroplets must be removed. Otherwise they would rainout of the stack and fall on the surrounding area.Removal can be by gravity separation in an expandedvessel with lowered velocity or a cyclonic separator canswirl out the droplets against the vessel wall. Knittedwire or plastic mesh demisters or chevron or “zig-zag”vanes can be located at the scrubber outlet to catch anydroplets.
d. Process measurement and control. The scrubbercontrol system should be designed to follow variationsin the boiler or incinerator gas flow and contaminantload to maintain outlet emissions in compliance withselected criteria.
(1) Measurements. Measurement of data from theprocess to provide proper control shouldinclude inlet gas flow rate, temperature andpressure, scrubber gas pressure drop, liquidpressure, flow rate, solids consistency, pH, andoutlet gas temperature. Selection of instru-mentation hardware should be on an individualapplication basis.
(2) Control. Pressure drop across a scrubber canbe referenced as an indication of performancefollowing initial or periodic, outlet gas testing.In a variable throat venturi, for instance, thispressure drop can be used to control the throatopening, maintaining constant performanceunder varying gas volume flow rates. Measure-ment of scrubber slurry solids consistency canbe used to control bleed-off of high solids slurryand make-up with fresh water. If sulfur dioxide(SO2) is being controlled then measurement ofscrubber liquid pH can control make-up ofcaustic to maintain efficiency of SO2 removal.Complete specification or design of a controlsystem must be on a case-by-case basis.
7-8

TM 5-815-1/AFR 19-6
7-7. Advantages and disadvantages
a. Advantages. The advantages of selecting scrub-bers over other collection devices are:
-Capability of gas absorption for removal ofharmful and dangerous gases,
-High efficiency of particulate removal,
-Capability of quenching high temperatureexhaust gases,
-Capability of controlling heavy particulate load-ings,
b. Disadvantages. The disadvantages of selectingscrubbers over other collection devices are:
-Large energy usage for high collection effi-ciency,
-High maintenance costs,-Continuous expenses for chemicals to remove
gaseous materials,-Water supply and disposal requirements,-Exhaust gas reheat may be necessary to main-
tain plume dispersion,-Weather proofing is necessary to prevent freeze-
up of equipment.
7-9

TM 5-815-1/AFR 19-6
CHAPTER 8
ELECTROSTATIC PRECIPITATORS
8-1. Electrostatic precipitator (ESP)An electrostatic precipitator is a device which removesparticles from a gas stream. It accomplishes particleseparation by the use of an electric field which:
-imparts a positive or negative charge to theparticle,
-attracts the particle to an oppositely chargedplate or tube,
-removes the particle from the collection surfaceto a hopper by vibrating or rapping the collec-tion surface.
8-2. Types of electrostatic precipitatorsa. Two stage ESPs. Two stage ESPs are designed so
that the charging field and the collecting field are inde-pendent of each other. The charging electrode is locatedupstream of the collecting plates. Two stage ESPs areused in the collection of fine mists.
b. Single stage ESPs. Single stage ESPs aredesigned so that the same electric field is used forcharging and collecting particulates. Single stage ESPsare the most common type used for the control of par-ticulate emissions and are either of tube or parallelplate type construction. A schematic view of the tubeand parallel plate arrangement is given in figure 8-1.
(1)
(2)
The tube type precipitator is a pipe with adischarge wire running axially through it. Gasflows up through the pipe and collected par-ticulate is discharged from the bottom. Thistype of precipitator is mainly used to handlesmall gas volumes. It possesses a collectionefficiency comparable to the parallel platetypes, usually greater than 90 percent. Waterwashing is frequently used instead of rappingto clean the collecting surface.Parallel plate precipitators are the most com-monly used precipitator type. The plates areusually less than twelve inches apart with thecharging electrode suspended verticallybetween each plate. Gas flow is horizontalthrough the plates.
8-3. Modes of operation.All types of ESPs can be operated at high or low tem-peratures, with or without water washing (table 8-l).
a. Hot precipitation. A hot precipitator is designedto operate at gas temperatures above 600 degrees Fahr-
enheit and is usually of the single stage, parallel platedesign. It has the advantage of collecting more particu-late from the hot gas stream because particle resistanceto collection decreases at higher temperatures. Theability to remove particles from the collection platesand hoppers is also increased at these temperatures.However, hot precipitators must be large in con-struction in order to accommodate the higher specificvolume of the gas stream.
b. Cold precipitation. Cold precipitators aredesigned to operate at temperatures around 300degrees Fahrenheit. The term “cold” is applied to anydevice on the low temperature side of the exhaust gasheat exchanger. Cold ESPs are also generally of thesingle stage, parallel plate design. They are smaller inconstruction than hot precipitator types because theyhandle smaller gas volumes due to the reduced tem-perature. Cold precipitators are most effective at col-lecting particles of low resistivity since particleresistance to collection is greater at lower tem-peratures. These precipitators are subject to corrosiondue to the condensation of acid mist at the lower tem-peratures.
c. Wet precipitation. A wet precipitator uses waterto aid in cleaning the particulate collection plates. Itmay employ water spray nozzles directed at the collec-tion plates, or inject a fine water mist into the gasstream entering the precipitator. Wet precipitatorsenhance the collection efficiency of particulates byreducing reentrainment from the collection plates.Care should be taken so that water addition does notlower gas temperature below the dewpoint tem-perature, thus allowing the formation of acids. A wetprecipitator can be of either plate or tube type con-struction.
8-4. ApplicationsElectrostatic precipitators are among the most widelyused particulate control devices. They are used to con-trol particulate emissions from the electric utilityindustry, industrial boiler plants, municipal incin-erators, the non-ferrous, iron and steel, chemical,cement, and paper industries. It is outside the scope ofthis manual to include all of these application areas.Only applications to boilers and incinerators will bereviewed.
a. Boiler application. Parallel plate electrostaticprecipitators are commonly employed in the utility
8-1

TM 5-815-1/AFR 19-6
U.S. Army Corps of Engineers
Figure 8-l. Schematic views of flat end tubular surface type electrostatic precipitators
industry to control emissions from coal-fired boilers.Cold type precipitators are the prevalent type becausethey are most easily retrofitted. In the design of newinstallations, the use of hot precipitators has becomemore common, because of the greater use of lowersulfur fuels. Low sulfur fuels have higher particleresistivity and therefore particulate emissions aremore difficult to control with cold precipitation. Figure8-2 may be used for estimating whether hot pre-cipitators or cold precipitators should be selected for aparticular sulfur content of coal.
b. Wood refuse boiler applications. An ESP can beused for particulate collection on a wood fired boilerinstallation if precautions are taken for fire prevention.The ESP should be preceded by some type of mechan-ical collection device to prevent hot glowing char fromentering the precipitator and possibly starting a fire.
8-2
c. Incinerator application. Until relatively recently,ESPs were used for pollution control on incinerationunits only in Europe. In the United States, however,the ESP is now being viewed as one of the more effec-tive methods for the control of emissions from incin-erators. The major problem associated with the use ofprecipitators on incinerators is high gas temperatures.Temperatures up to 1800 degrees Fahrenheit can beencountered at the incinerator outlet. These tem-peratures must be reduced before entering a pre-cipitator. Several methods can be used to accomplishthis temperature reduction:
-mixing of the gas with cooler air,
-indirect cooling such as waste heat boilers,
--evaporative cooling in which droplets of waterare sprayed into the gas.

TM 5-815-1/AFR 19-6
TABLE 8-1OPERATING CHARACTERISTICS OF PRECIPITATORS
8-5. PerformanceThe performance of an electrostatic precipitator is pre-dominantly affected by particle resistivity, particlesize, gas velocity, flow turbulence, and the number ofenergized bus sections (electrically independent sec-tions) in operation.
a. Particle resistivity. Particle resistivity is an elec-trical property of a particle and is a measure of itsresistance of being collected. Particle resistivity isaffected by gas temperature, humidity, sodium con-tent, and sulfur trioxide (SO3) content. See figure 8-3.
b. Collection plate area. Collection plate area, andgas volume, affect electrostatic precipitator perform-ance. The basic function relating these factors is shownin equation 8-l.
C E = l - e - (A c x w)e (eq. 8-1)V g
Where: CE = collection efficiencyA c
= collection plate area in square feet (ft2)
V g= gas flow rate in cubic feet/minute (ft3/
min)w = migration velocity or precipitation rate
parameter, feet/minute (ft/min).
U.S. Army Corps of Engineers
c. Bus sections. The number of energized bus sec-tions in a precipitator has an effect upon collectionefficiency. A power loss in one energized bus sectionwill reduce the effectiveness of the precipitator. Seefigure 8-4.
d. Turbulence. Turbulence in the gas flow throughan electrostatic precipitator will decrease its collectionefficiency. For proper operation all segments of the flowshould be within 25 percent of the mean flow velocity.
8-6. Description of componentsa. Shell. The shell of an ESP has three main func-
tions: structural support, gas flow containment, andinsulation. Shell material is most commonly steel; ifnecessary, insulation can be applied to the exterior toprevent heat loss, Brick or concrete linings can beinstalled on shell interiors if gas stream corrosion of themetal may occur. Corrosion resistant steel can also beused as a lining, but the cost may be uneconomical andat times prohibitive. Since the shell is also used forstructural support, normal civil engineering precau-tions should be taken in the design.
b. Weighted wire discharge electrodes. Wires vary intype, size, and style. Provision is made to keep the
8-3

TM 5-815-1/AFR 19-6
COAL FLY ASHRESISTIVITY-SULPHUR-TEMPERATURE
U.S. Army Corps of Engineers
Figure 8-2. Operating ranges for hot/cold electorstatic precipitators
discharge wire from displacement by attachment to asuspended weight. The wires can be made stiff, consist-ing of a formed sheet, or they can be simple variations ofthe normal straight round wire such as being barbed orpronged. Steel alloys are commonly used for wire con-struction, but actually any conducting material with aproper configuration and sufficient tensile strength canbe used.
(1) Rigid frame discharge electrodes. Rigid framedesigns incorporate a framework which sup-ports the discharge electrodes. By using therigid frame design the need for wire weights iseliminated since the frame keeps the wiresproperly supported and aligned.
(2) Rigid electrodes. The rigid electrode designuses electrodes that have sufficient strength tostay in alignment their entire length. The elec-
8-4
trodes are supported from the top and kept inalignment by guides at the bottom. Rigid elec-trodes are the least susceptible to breakage.
c. Collection electrodes. There are numerous typesof collection electrodes designed to minimize reentrain-ment and prevent sparking. The material used in con-struction, however, must be strong enough towithstand frequent rapping. In order to insure correctelectrode application, it is wise to see if the electrodechosen has exhibited good performance at similarinstallations.
d. Hoppers. A hopper is used to collect ash as it fallsfrom the precipitator. The hopper should be designedusing precautions against corrosion in the precipitator,as any leakage due to corrosion will enhance entrain-ment. If the precipitator is dry, a hopper angle shouldbe chosen that will prevent bridging of collected dust.

TM 5-815-1/AFR 19-6
at low temperatures. Provisions should be made for saferodding out the hoppers should they become plugged.
e. Rappers. Rappers are used to remove dust fromthe discharge and collection electrodes. Rappers areusually one of two types, impulse or vibrator. Thevibrator type removes dust from the discharge elec-trode by imparting to it a continuous vibration energy.They are used to remove dust from the collection elec-trodes. Impulse rappers consist of electromagneticsolenoids, motor driven cams, and motor driven ham-mers. Important features to note in choosing rappersare long service life without excessive wear and flexibleenough operation to allow for changing precipitatoroperating conditions. Low intensity rapping of plates(on the order of one impact per minute) should be usedwhenever possible to avoid damage to the plates. Visualinspection of the effect of rapping on reentrainment isusually sufficient to determine a good rapping cycle.
f. High tension insulators. High tension insulatorsserve both to support the discharge electrode frameand also to provide high voltage insulation. The mate-rials used are ceramic, porcelain, fused silica andalumina. Alumina is the most common. The insulatorsmust be kept clean to prevent high voltage shorting andresultant equipment damage. Compressed air or steamcan be used for this purpose.
g. Four point suspension. Rigid electrode and rigidframe units may utilize a four point suspension systemto support the discharge electrode framework in eachchamber. This type of suspension system assures abetter alignment of the discharge and collection elec-trodes. This in turn provides a more consistent opera-tion.
h. Distribution dewices. Perforated plates, baffles orturning vanes are usually employed on the inlet andoutlet of an ESP to improve gas distribution. Improperdistribution can cause both performance and corrosionproblems. These distribution devices may require rap-pers for cleaning.
i. Model testing. Gas flow models are used to deter-mine the location and type of distribution devices. Themodels may include both the inlet and outlet ductworkin order to correctly model the gas flow characteristics.Gas flow studies may not be required if a proven pre-cipitator design is installed with a proven ductworkarrangement.
8-7 Control systemsThe electric power control system is the most impor-tant component system of any ESP The basic compo-nents of this system are: step-up transformer; highvoltage rectifier; voltage and amperage controls; andsensors.
a. Automatic power control. By utilizing a signalfrom a stack transmissionmeter the power level in theprecipitator can be varied to obtain the desired perfor-mance over a wide range of operating conditions.
8-5
Effect of gas humidity in increasingthe conductivity of a typical fly ash.
Sodium content as Na2O percent
Resistivity as function of sodiumcontent of fly ash.
U.S. Army Corps of Engineers
Figure 8-3. Factors affecting particle resistivity
Hoppers must be sized so that the amount of dustcollected over a period of time is not great enough tooverflow and be reentrained. Seals also must be pro-vided around the outlet to prevent any air leakage. Ifthe precipitator is wet, the hopper should allow removalof sludge in a manner compatible with the overallremoval system. In general the collected dust in thehoppers is more free flowing when kept hot. The hop-pers should be insulated and should have heaters tomaintain the desired temperatures. Hoppers heaterswill also prevent the formation of acids that may occur

TM 5-815-1/AFR 19-6
U.S. Amy Corps of Engineers
Figure 8-4. Bus sections vs. efficiency for different sulfur percentages in coal.
b. High voltage transformer. The standard iron coretransformer is the only instrument generally used tostep-up the input voltage. The only care that need betaken is that the transformer is of superior quality andable to put out the quantity of voltage required by theprecipitator. Transformers are designed to withstandhigh ambient temperatures and electrical variationsinduced by sparking. For high temperature operation,the most common transformer cooling method is liquidimmersion.
c. High voltage rectifier. Silicon rectifiers are thelatest advance in rectifying circuitry. They are solidstate devices which have a few of the disadvantages ofthe other types of rectifiers. An assembly of silicon
8-6
rectifiers is used for lower rated current sets, typically500 mili-amperes (mA).
d. Voltage and amperage controls. Controls areneeded to insure that the precipitator is supplied withthe maximum amount of voltage or power input, and tocontrol the effects of sparking. The most modernmethod of accomplishing these aims is through the useof silicon controlled rectifiers (SCR). Other moderncontrol devices are saturable reactors and thyristors(four element, solid state devices). Voltage control canalso be accomplished by tapped series droppingresistors, series rheostats, tapped transformer prim-aries, and variable inductances.
e. Auxiliary control equipment. As with any control

TM 5-815-1/AFR 19-6
device, gas flow should be monitored either by read-outof amperage from the fans or by measuring static pres-sure. It is also useful to have sensors which measure thesulfur dioxide (SO2) concentration and temperature ofthe inlet gas stream in order to determine the dew-point temperature.
8-8. Advantages and disadvantagesa. Advantages.
(1) The pressure drop through a precipitator is afunction of inlet and outlet design and pre-cipitator length. Pressure drop rarely exceeds0.5 inches, water gauge.
(2) The ESP can be designed to have 99.9 + per-cent collection efficiency.
(3) Silicon control rectifiers and other modern con-trol devices allow an electrostatic precipitatorto operate automatically.
(4) Low maintenance costs.b. Disadvantages.
(1) Due to the size of a typical ESP and the erraticnature of most processes (especially if fre-quent start-up and shutdowns occur) the tem-perature in different parts of the structurecould at times drop below the acid dew point.Corrosion can cause structural damage andallow air leakage.
(2) An ESP is sensitive to its design parameters.A change in the type of coal used, for example,could drastically affect performance.
(3) High capital costs.(4) If particulate emission concentrations are
high, a mechanical precleaner may be neces-sary.
(5) High voltages are required.(6) No SO2 control is possible with an ESP.
8-7

TM 5-815-1/AFR 19-6
CHAPTER 9
FABRIC FILTERS
9-1. Fabric filtrationFabric filters are used to remove particles from a gasstream. Fabric filters are made of a woven or feltedmaterial in the shape of a cylindrical bag or a flatsupported envelope. These elements are contained in ahousing which has gas inlet and outlet connections, adust collection hopper, and a cleaning mechanism forperiodic removal of the collected dust from the fabric.In operation, dust laden gas flows through the filters,which remove the particles from the gas stream. Atypical fabric filter system (baghouse) is illustrated infigure 9-1.
9-2. Types of filtering systemsThe mechanisms of fabric filtration are identicalregardless of variations in equipment structure anddesign. In all cases, particulates are filtered from thegas stream as the gas passes through a deposited dustmatrix, supported on a fabric media. The dust isremoved from the fabric periodically by one of theavailable cleaning methods. This basic process may becarried out by many different types of fabric filters witha variety of equipment designs. Filtering systems aredifferentiated by housing design, filter arrangement,and filter cleaning method.
a. Housing design. There are two basic housing con-figurations which apply to boiler and incinerator fluegas cleaning. These are closed pressure, and closedsuction.
(1) The closed pressure baghouse is a completelyclosed unit having the fan located on the dirtyside of the system. Toxic gases and gases withhigh dew points are handled in this type ofbaghouse. Fan maintenance problems arisedue to the fact that the fan is in the dirty gasstream before the baghouse. The floor of theunit is closed and the hoppers are insulated. Aclosed pressure baghouse is illustrated infigure 9-2.
(2) The closed suction is the most expensive typeof baghouse, with the fan being located on theclean gas side. The closed suction baghouse isan all-welded, air-tight structure. The floor isclosed, and the walls and hopper are insulated.Fan maintenance is less than with the pressuretype, but inspection of bags is more difficult. A
closed suction system is illustrated in figure9-2.
b. Filter shape and arrangements.(1) The cylindrical filter is the most common filter
shape used in fabric filtration. The principaladvantage of a cylindrical filter is that it can bemade very long. This maximizes total clotharea per square foot of floor space. Cylindricalfilters are arranged to accommodate each ofthe basic flow configurations shown in figure9-3.
(2) A panel type filter consists of flat areas of clothstretched over an adjustable frame. (See figure9-3.) Flow directions are usually horizontal.Panel filters allow 20 to 40 percent more clothper cubic foot of collector volume and panelsmay be brushed down if dust build-up occurs.However, panel-type filters are not widelyused in boiler and incinerator applications.
c. Cleaning methods. A fabric cleaning mechanismmust impart enough energy to the cloth to overcomeparticle adhering forces without damaging the cloth,disturbing particle deposits in the hopper, or removingtoo much of the residual dust deposit on the filter. Thecleaning period should be much shorter than the filter-ing period. The correct choice of cleaning method for aparticular application will greatly enhance the perfor-mance of the fabric filter system. An incorrectlymatched cleaning method can result in high pressuredrops, low collection efficiency, or decreased bag life. Aperformance comparison of the various cleaning meth-ods is given in table 9-l.
(1) Mechanical shake. Some baghouses employ atype of mechanical shaking mechanism forcleaning. Bags are usually shaken from theupper fastenings, producing vertical, horizon-tal, or a combination of motions, on the bag. Allbags in a compartment may be fastened to acommon framework, or rows of bags areattached to a common rocking shaft. After thebags have been shaken, loosened dust isallowed to settle before filtration is resumed.The entire cleaning cycle may take from 30seconds to a few minutes. Some designs incor-porate a slight reversal of gas flow to aid in dustcake removal and settling, as any slight flow in
9-1

TM 5-815-1/AFR 19-6
U.S. Army Corps of Engineers
Figure 9-1. Typical baghouse (shake clean)
the direction of normal filtration will greatlyreduce the effectiveness of cleaning. For thisreason a positive sealing type valve is recom-mended for baghouse inlet and outlet. Shakerbaghouses are normally used in small capacitysystems or systems with a large number offiltering compartments.
(2) Reverse flow without bag collapse. This clean-ing method is used with a dust that releasesfairly easily from the fabric. (See figure 9-4). Alow pressure reversal of flow is all that is neces-sary to remove deposited dust from fabric. Tominimize flexure and wear, the fabric is sup-ported by a metal grid, mesh, or rings, sewninto the bag. Any flow that is reversed throughthe filter must refiltered. This results inincreased total flow, requiring a greater clotharea, and producing a higher filtering velocity.This net increase in flow is normally less than10 percent. Reverse pressures range from 125pounds/square inch (lb/in2) down to a fewinches, water gauge. The gentle cleaningaction of reverse flow allows the use of glass
fabric bags in high-temperature applications.
(3) Reverse flow with bag collapse. Even thoughflexure can be detrimental to the bag, it isfrequently utilized in order to increase theeffectiveness of cleaning in a reverse baghouse.Filter bags collecting dust on the inside of thefabric are collapsed by a burst of reverse airwhich snaps the dust cake from the cloth sur-face. The bags do not collapse completely butform a cloverleaf type pattern. Collapse clean-ing uses the same equipment arrangement asreverse flow without bag collapse. One designsends a short pulse of air down the inside of thebag, along with the reverse flow, to produceincreased flexure and cleaning as is illustratedin figure 9-5. The principal disadvantage offlexural cleaning is the increased fabric wear. Ifthe dust cake fails to be removed completely,the bag will stiffen in that area and cause wearin adjacent areas during cleaning.
(4) Reverse-flow heating. With a reverse flowcleaning system it may be necessary to have areverse flow heating system. This system
9-2

TM 5-815-1/AFR 19-6
iii. CLOSED SUCTION
U.S. Army Corps of Engineers
Figure 9-2. Fabric filter housing design
would be used to keep the gas temperatures inthe baghouse above the acid dew point duringthe cleaning cycle.
(5) Pulse-jet. A pulse jet system is illustrated infigure 9-6. A short blast of air at 29 to 100 lb/in, is directed into the top of the filter. Thisblast is usually sent through a venturi whichincreases the shock effect. As the pulse startsdown the filter tube, more air is drawn inthrough the top. This combination causes theflow within the bag to temporarily reverse,bulges the fabric, and releases the dust cakefrom the outside of the filter tube. The wholeprocess occurs in a fraction of a second which
enables a virtually continuous filtering flow.Filter elements can be pulsed individually, orin rows. With a multicompartment baghouse, awhole section may be pulsed at one timethrough a single venturi. The pulse producesless fabric motion than in shaking and alsoallows tighter bag spacing. A pulse-jet clean-ing system requires no moving parts for clean-ing and is designed to handle high gas flows persquare foot of cloth area (air to cloth ratio).However, this system requires a compressedair system with a timer mechanism and controlair solenoid valve for automatic cyclic cleaning.Pulse-jet baghouses are used when dust con-
9-3

TM 5-815-1/AFR 19-6
U.S. Army Corps of Engineers
Figure 9-3. Filter shape and arrangement
centrations are high and continuous filtering isneeded.
9-3. Fabric characteristics and selectionFabric filter performance depends greatly upon thecorrect selection of a fabric. A fabric must be able toefficiently collect a specific dust, be compatible with thegas medium flowing through it, and be able to releasethe dust easily when cleaned. Fiber, yarn structure,and other fabric parameters will affect fabric perfor-mance. At the present time, the prediction of fabricpressure drop, collection efficiency, and fabric life isdetermined from past performance. It is generallyaccepted practice to rely on the experience of the man-ufacturer in selecting a fabric for a specific condition.However, the important fabric parameters are definedbelow to aid the user in understanding the significanceof the fabric media in filtration.
9-4
a. Fabric type. The two basic types of fabric used infiltration are woven and felted. The woven fabric acts asa support on which a layer of dust is collected whichforms a microporous layer and removes particles fromthe gas stream efficiently. A felted material consists of amatrix of closely spaced fibers which collect particleswithin its structure, and also utilizes the filter cake forfurther sieving. Filtering velocities for woven fabricsare generally lower than felts because of the necessityof rebuilding the cake media after each cleaning cycle.It is necessary that woven fabrics not be overcleaned,as this will eliminate the residual dust accumulationthat insures rapid formation of the filter cake and highcollection efficiencies. Felts operate with less filtercake. This necessitates more frequent cleaning with ahigher cleaning energy applied. Woven products, usu-ally more flexible than felts, may be shaken or flexed forcleaning. Felts are usually back-washed with higherpressure differential air and are mainly used in pulse-jet baghouses. However, felted bags do not functionwell in the collection of fines because the very fineparticles become embedded in the felt and are difficultto remove in the cleaning cycle.
b. Fiber. The basic structural unit of cloth is thesingle fiber. Fiber must be selected to operate satisfac-torily in the temperature and chemical environment ofthe gas being cleaned. Fiber strength and abrasionresistance are also necessary for extended filter life.The first materials used in fabric collectors were natu-ral fibers such as cotton and wool. Those fibers havelimited maximum operating temperatures (approx-imately 200 degrees Fahrenheit) and are susceptible todegradation from abrasion and acid condensation.Although natural fibers are still used for many applica-tions, synthetic fibers such as acrylics, nylons, andteflon have been increasingly applied because of theirsuperior resistance to high temperatures and chemicalattack (table 9-2).
(1) Acrylics offer a good combination of abrasionresistance and resistance to heat degradationunder both wet and dry conditions. An out-standing characteristic of acrylics is the abilityto withstand a hot acid environment, makingthem a good choice in the filtration of highsulfur-content exhaust gases.
(2) An outstanding nylon fiber available for fabricfilters is Nomex, a proprietary fiber developedby DuPont for applications requiring gooddimensional stability and heat resistance.Nomex nylon does not melt, but degradesrapidly in temperatures above 700 degreesFahrenheit. Its effective operating limit is 450degrees Fahrenheit. When in contact withsteam or with small amounts of water vapor atelevated temperatures, Nomex exhibits a pro-gressive loss of strength. However, it with-stands these conditions better than other

TM 5-815-1/A
FR 19-6
9-5

TM 5-815-1/AFR 19-6
U.S. Army Corps of Engineers
Figure 9-4. Reverse flow baghouse (without bag collapse)
nylons and many other fibers. Because ofNomex’s high abrasion resistance, it is used infiltration of abrasive dusts or wet abrasive sol-ids and its good elasticity makes it ideal forapplications where continuous flexing takesplace. All nylon fabrics provide good cake dis-charge for work with sticky dusts.
(3) Teflon is the most chemically resistant fiberproduced. The only substances known to reactwith this fiber are molten alkali metals, fluo-rine gas at high temperature and pressure, andcarbon trifluoride. Teflon fibers have a very lowcoefficient of friction which produces excellentcake discharge properties. This fact, coupledwith its chemical inertness and resistance todry and moist heat degradation, make Teflonsuitable for filtration and dust collection undersevere conditions. Its major disadvantages areits poor abrasion resistance and high price. For
9-6
these reasons, Teflon would be an economicalchoice only in an application where extremeconditions will shorten the service life of otherfilter fibers. It should be noted that the toxicgases produced by the decomposition of Teflonat high temperatures can pose a health hazardto personnel and they must be removed fromthe work area through ventilation.
c. Yarn type. Performance characteristics of filtercloth depend not only on fiber material, but also on theway the fibers are put together in forming the yarn.Yarns are generally classified as staple (spun) or fila-ment.
(1) Filament yarns show better release charac-teristics for certain dusts and fumes, especiallywith less vigorous cleaning methods.
(2) Staple yarn generally produces a fabric ofgreater thickness and weight with high per-meability to air flow. Certain fumes or dusts

TM 5-815-1/AFR 19-6
TUBE
C O L L E C T I N G
O U S T
R E V E R S E
A I R O N
O N L Y
P R E S S U R E J E T
A N 0 R E V E R S E
A I R O N
undergoing a change of state may condense on (3) Satin fabrics drape very well because the fabricfiber ends and become harder to remove from weight is heavier than in other weaves. Thethe fabric. yarns are compacted which produces fabric
d. Weave. The weave of a fabric is an important body and lower porosity, and they are oftencharacteristic which affects filtration performance. The used in baghouses operating at ambient tem-three basic weaves are plain, twill, and satin. peratures.
(1) Plain weave is the simplest and least expensive e. Finish. Finishes are often applied to fabrics tomethod of fabric construction. It has a high lengthen fabric life. Cotton and wool can be treated tothread count, is firm, and wears well. provide waterproofing, mothproofing, mildewproofing,
(2) Twill weave gives the fabric greater porosity, and fireproofing. Synthetic fabrics can be heat-set togreater pliability, and resilience. For this rea- minimize internal stresses and enhance dimensionalson, twill weaves are commonly used where stability. Water repellents and antistatic agents maystrong construction is essential. also be applied. Glass fabrics are lubricated with silicon
U.S. Army Corps of Engineers
Figure 9-5. Reverse flow cleaning (with bag collapse)
9-7

TM 5-815-1/AFR 19-6
U.S. Army Corps of Engineers
Figure 9-6. Pulse-jet baghouse
or graphite to reduce the internal abrasion from brittleyarns. This has been found to greatly increase bag lifein high temperature operations.
f. Weight. Fabric weight is dependent upon the den-sity of construction, and fiber or yarn weight. Heavierfabric construction yields lower permeability andincreased strength.
9-4. Materials and constructiona. Collector housing. Small unit collectors can be
assembled at the factory or on location. Multicompart-ment assemblies can be shipped by compartment ormodule (group of compartments), and assembled on-site. Field assembly is disadvantageous because of theneed for insuring a good seal between panels, modulesand flanges. Baghouse collector wall and ceiling panels
9-8
are constructed of aluminum, corrugated steel, or con-crete, the limitations being pressure, temperature, andcorrosiveness of the effluent. The metal thickness mustbe adequate to withstand the pressure or vacuumwithin the baghouse and sufficient bracing should beprovided. If insulation is needed, it can be placedbetween wall panels of adjacent compartments andapplied to the outside of the structure. Pressure-reliev-ing doors or panels should be included in the housing orductwork to protect equipment if any explosive dust isbeing handled. An easy access to the baghouse interiormust be provided for maintenance. Compartmentedunits have the advantage of being able to remain on-linewhile one section is out for maintenance. Walkwaysshould be provided for access to all portions of thecleaning mechanism. Units with bags longer than 10 to

TM 5-815-1/A
FR 19-6
9-9

TM 5-815-1/AFR 19-6
12 feet should be provided with walkways at the upperand lower bag attachment levels.
b. Hopper and disposal equipment. The dust-collec-tion hopper of a baghouse can be constructed of thesame material as the external housing. In small lightduty, hoppers 16 gage metal is typical. However, metalwall thicknesses should be increased for largerbaghouses and hopper dust weight. The walls of thehopper must be insulated and should have heaters ifcondensation might occur. The hopper sides should besloped a minimum of 57 degrees to allow dust to flowfreely. To prevent bridging of certain dusts, a greaterhopper angle is needed, but continuous removal of thedust will also alleviate bridging. If dust bridging is asignificant problem, vibrators or rappers may beinstalled on the outside of the hopper. The rappingmechanism can be electrically or pneumatically oper-ated and the size of the hopper must be sufficient to holdthe collected dust until it is removed. Overfilled hop-pers may cause an increased dust load on the filtercloths and result in increased pressure drop across thecollector assembly. Storage hoppers in baghouseswhich are under positive or negative pressure warrantthe use of an air-lock valve for discharging dust. Sincethis will prevent re-entrainment of dust or dust blow-out. A rotary air valve is best suited for this purpose.
c. For low solids flow, a manual device such as a slidegate, trip gate, or trickle valve may be used, however,sliding gates can only be operated when the compart-ment is shut down. For multicompartmented units,screw conveyors, air slides, belt conveyors or bucketconveying systems are practical. When a screw con-veyor or rotary valve is used, a rapper can be operatedby a cam from the same motor.
9-5. Auxiliary equipment and control sys-tems
a. Instrumentation. Optimum performance of a fab-ric filter system depends upon continuous control of gastemperature, system pressure drop, fabric pressure,gas volume, humidity, condensation, and dust levels inhoppers. Continuous measurements of fabric pressuredrop, regardless of the collector size, should be pro-vided. Pressure gages are usually provided by the filtermanufacturer. With high and with variable dust load-ings, correct fabric pressure drop is critical for properoperation and maintenance. Simple draft gages may beused for measuring fabric pressure drop, and they willalso give the static pressures at various points withinthe system. Observation of key pressures within smallsystems, permits manual adjustment of gas flows andactuation of the cleaning mechanisms.
b. The number and degree of sophistication of pres-sure-sensing devices is relative to the size and cost ofthe fabric filter system. High temperature filtrationwill require that the gas temperature not exceed thetolerance limits of the fabric and temperature displays
9-10
are required to indicate whether necessary dilution air-dampers or pre-cooling sprays are operating correctly.A well-instrumented fabric filter system protects theinvestment and decreases chances of malfunctions. Italso enables the operating user to diagnose and correctminor problems without outside aid.
c. Gas preconditioning. Cooling the inlet gas to afabric filter reduce the gas volume which then reducesrequired cloth area; extends fabric life by lowering thefiltering temperature; and permits less expensive anddurable materials to be used. Gas cooling is mandatorywhen the effluent temperature is greater than the max-imum operating temperature of available fabrics. Threepractical methods of gas cooling are radiation con-vection cooling, evaporation, and dilution.
(1) Radiation convection cooling enables fluctua-tions in temperature, pressure, or flow to bedampened. Cooling is achieved by passing thegas through a duct or heat-transfer device andthere is no increase in gas filtering volume.However, ducting costs, space requirements,and dust sedimentation are problems with thismethod.
(2) Evaporative cooling is achieved by injectingwater into the gas stream ahead of the filteringsystem. This effectively reduces gas tem-peratures and allows close control of filteringtemperatures. However, evaporation mayaccount for par t ia l dus t removal andincomplete evaporation may cause wetting andchemical attack of the filter media. A visiblestack plume may occur if gas temperatures arereduced near to or below the dew point.
(3) Dilution cooling is achieved by mixing the gassteam with outside air. This method is inexpen-sive but increases filtered gas volume requiringan increase in baghouse size. It is possible theoutside air which is added may also requireconditioning to control dust and moisture con-tent from ambient conditions.
9-6. Energy requirements.The primary energy requirement of baghouses is thepower necessary to move gas through the filter. Resis-tance to gas flow arises from the pressure drop acrossthe filter media and flow losses resulting from frictionand turbulent effects. In small or moderately sizedbaghouses, energy required to drive the cleaning mech-anism and dust disposal equipment is small, and may beconsidered negligible when compared with primary fanenergy. If heating of reverse air is needed this willrequire additional energy.
9-7. Applicationa. Incinerators. Baghouses have not been widely
used with incinerators for the following reasons:(1) Maximum operating temperatures for fabric
filters have typically been in the range of 450 to

TM 5-815-1/AFR 19-6
550 degrees Fahrenheit, which is below theflue gas temperature of most incineratorinstallations
(2) Collection of condensed tar materials (typicallyemitted from incinerators) could lead to fabricplugging, high pressure drops, and loss ofcleaning efficiency
(3) Presence of chlorine and moisture in solidwaste leads to the formation of hydrochloricacid in exhaust gases, which attacks fiberglassand most other filter media
(4) Metal supporting frames show distortionabove 500 degrees Fahrenheit and chemicalattack of the bags by iron and sulphur at tem-peratures greater than 400 degrees Fahren-heit contribute to early bag failure. Any fabricfiltering systems designed for particulate con-trol of incinerators should include:
-fiberglass bags with silica, graphite, or teflonlubrication; or nylon and, teflon fabric bags forhigh temperature operation, or stainless steelfabric bags,
-carefully controlled gas cooling to reduce hightemperature fluctuations and keep the tem-perature above the acid dew point,
-proper baghouse insulation and positive seal-ing against outside air infiltration. Reverse airshould be heated to prevent condensation.
b. Boilers. Electric utilities and industrial boilersprimarily use electrostatic precipitators for air pollu-tion control, but some installations have been shown tobe successful with reverse air and pulse-jet baghouses.The primary problem encountered with baghouseapplications is the presence of sulphur in the fuel whichleads to the formation of acids from sulphur dioxide(SO2) and sulphur trioxide (SO3) in the exhaust gases.Injection of alkaline additives (such as dolomite andlimestone) upstream of baghouse inlets can reduce SO2
present in the exhaust. Fabric filtering systemsdesigned for particulate collection from boilers should:
-operate at temperatures above the acid dewpoint,
-employ a heated reverse air cleaning method,-be constructed of corrosion resistant material,-be insulated and employ internal heaters to pre-
vent acid condensation when the installation isoff-line.
c. SO2 removal. The baghouse makes a good controldevice downstream of a spray dryer used for SO2
removal and can remove additional SO2 due to the pas-sage of the flue-gas through unreacted lime collected onthe bags.
d. Wood refuse boiler applications. It is not recom-mended that a baghouse be installed as a particulatecollection device after a wood fired boiler. The pos-sibility of a fire caused by the carry over of hot glowingparticles is to great.
9-8. PerformanceSignificant testing has shown that emissions from afabric filter consist of particles less than 1 micron indiameter. Overall fabric filter collection efficiency is 99percent or greater (on a weight basis). The optimumoperating characteristics attainable with proper designof fabric filter systems are shown in table 9-3.
9-9. Advantages and disadvantagesa. Advantages.
(1) Very high collection efficiencies possible(99.9+ percent) with a wide range of inletgrain loadings and particle size variations.Within certain limits fabric collectors have aconstancy of static pressure and efficiency, fora wider range of particle sizes and con-centrations than any other type of single dustcollector.
(2) Collection efficiency not affected by sulfur con-tent of the combustion fuel as in ESPs.
(3) Reduced sensitivity to particle size distribu-tion.
(4) No high voltage requirements.(5) Flammable dust may be collected.(6) Use of special fibers or filter aids enables sub-
micron removal of smoke and fumes.(7) Collectors available in a wide range of config-
urations, sizes, and inlet and outlet locations.b. Disadvantages.
(1) Fabric life may be substantially shortened inthe presence of high acid or alkalineatmospheres, especially at elevated tem-peratures.
(2) Maximum operating temperature is limited to550 degrees Fahrenheit, unless special fabricsare used.
(3) Collection of hygroscopic materials or con-densation of moisture can lead to fabric plug-ging, loss of cleaning efficiency, large pressurelosses.
(4) Certain dusts may require special fabric treat-ments to aid in reducing leakage or to assist incake removal.
(5) High concentrations of dust present an explo-sion hazard.
(6) Fabric bags tend to burn or melt readily attemperature extremes.
9-11

TM 5-815-1/AFR 19-6
TABLE 9-3
OPERATING CHARACTERISTICS OF FABRIC FILTERS
Collection efficiency
Particle size collected
Pressure drop
Maximum operating
temperatures
Dust concentration handled
in particulate collection
Gas volume
Cloth area
Filtering velocities
Average bag life
99 percent+
Greater than .5 microns
.5-6 inches, water gauge
550 degrees Fahrenheit peak
and 500 degrees Fahrenheit
continuous with common fabrics
O-10 gr/ft3
Unlimited
Several square feet to
several thousand square feet
1-15 ft/min
18 months to 2 years
U.S. Army Corps of Engineers
9-12

TM 5-815-1/AFR 19-6
CHAPTER 10
SULFUR OXIDE (SOx) CONTROL SYSTEMS
10-1. Formation of sulfur oxides (SOx)a. Definition of sulfur oxide. All fossil fuels contain
sulfur compounds, usually less than 8 percent of thefuel content by weight. During combustion, fuel-boundsulfur is converted to sulfur oxides in much the sameway as carbon is oxidized to CO2. Sulfur dioxide (SO2)and sulfur trioxide (SO3) are the predominant sulfuroxides formed. See equations 10-l and 10-2.
S + 02 - - - - - > S O2 (eq. 10-l)2 s 02 + 0 2 -----> 2 S O3 (eq. 10-2)
b. Stack-gas concentrations. In efficient fuel com-bustion processes, approximately 95 percent of thefuel-bound sulfur is oxidized to sulfur dioxide with 1 to2% being cover-ted to sulfur trioxide.
c. Factors affecting theformation of SOx.(1)
(2)
(3)
10-2 .
SO3 formation increases as flame temperatureincreases. Above 3,150 degrees Fahrenheit,SO3 formation no longer increases.SO3 formation increases as the excess air rateis increased.SO3 formation decreases with coarser atomiza-tion.
Available methods for reducing SOx
emissionsa. Fuel substitution. Burning low sulfur fuel is the
most direct means of preventing a SOx emissions prob-lem. However, low sulfur fuel reserves are decreasingand are not available in many areas. Because of this,fuel cleaning technology has receive much attention.There are presently more than 500 coal cleaning plantsin this country. At present, more than 20% of the coalconsumed yearly by the utility industry is cleaned.Forty to ninety percent of the sulfur in coal can beremoved by physical cleaning, depending upon the typeof sulfur deposits in the coal. As fuel cleaning tech-nology progresses and the costs of cleaning decrease,fuel cleaning will become a long term solution availablefor reducing sulfur oxide emissions.
b. Considerations of fuel substitution. Fuel sub-stitution may involve choosing a higher quality fuelgrade; or it may mean changing to an alternate fueltype. Fuel substitution may require any of the followingconsiderations:
(1) Alternations in fuel storage, handling, prepa-ration, and combustion equipment.
(2) When changing fuel type, such as oil to coal, anew system must be installed.
(3) When choosing a higher quality fuel, as inchanging from residual to distillate fuel oil,modest modifications, such as changing burnertips, and oil feed pumps, are required.
c. Changes in fuel properties. Consideration of pos-sible differences in fuel properties is important. Someexamples are:
(1)
(2)
(3)
(4)
(5)
Higher ash content increases particulate emis-sions.Lower coal sulfur content decreases ash fusiontemperature and enhances boiler tube slag-ging.Lower coal sulfur content increases fly-ashresistivity and adversely affects electrostaticprecipitator performance.Low sulfur coal types may have higher sodiumcontent which enhances fouling of boiler con-vection tube surfaces.The combination of physical coal cleaning andpartial flue gas desulfurization enables manygenerating stations to meet SO2 standards atless expense than using flue gas desulfuriza-tion alone.
d. Modification of fuel. Some possibilities are:(1) Fuels of varying sulfur content may be mixed
to adjust the level of sulfur in the fuel to a lowenough level to reduce SO2 emissions to anacceptable level.
(2) Fuels resulting from these processes willbecome available in the not too distant future.Gasification of coal removes essentially all ofthe sulfur and liquification of coal results in areduction of more than 85% of the sulfur.
e. Applicability of boiler conversion from one fueltype to another. Table 10-l indicates that most boilerscan be converted to other type of firing but that policiesof the agencies must also be a consideration.
Table 10-1Convertibility of steam boilers
As designed Convertible to:
Coal Oil Gas Coal Oil Gas
**X x - - - yes**X - X - yes -**X - - - yes yes
- X - * p o s s i b l e - yes- - X *possible yes -
Note: *Large DOD boilers must be convertible to coal firing.* * Changing from coal to oil or gas firing is not in accordance
with present AR 420-49.
10-1

TM 5-815-1/AFR 19-6
f. Approach to fuel substitution. An approach to fuelsubstitution should proceed in the following manner:
(1) Determine the availability of low sulfur fuels.(2) For each, determine which would have sulfur
emissions allowable under appropriate regula-tions.
(3) Determine the effect of each on particulateemissions, boiler capacity and gas tem-peratures, boiler fouling and slagging, andexisting particulate control devices.
(4) Identify the required equipment modifica-tions, including transport, storage, handling,preparation, combustion, and control equip-ment.
(5) For the required heat output calculate theappropriate fuel feed rate.
(6) Determine fuel costs.(7) Determine the cost of boiler and equipment
modification in terms of capital investment andoperation.
(8) Annualize fuel costs, capital charges, and oper-ating and maintenance costs.
(9) With the original fuel as a baseline, compareemissions and costs for alternate fuels.
(g. Modification to boiler operations and mainte-nance.
(1)
(2)
(3)
(4)
A method of reducing sulfur oxides emissionsis to improve the boiler use of the availableheat. If the useful energy release from theboiler per unit of energy input to the boiler canbe increased, the total fuel consumption andemissions will also be reduced.An improvement in the boiler release of usefulenergy per unit of energy input can beachieved by increasing boiler steam pressureand temperature. Doubling the steam drumpressure can increase the useful heat releaseper unit of energy input by seven percent.Increasing the steam temperature from 900 to1000 degrees Fahrenheit can result in animprovement in the heat release per unit ofenergy input of about 3.5 percent.Another way to maximize the boiler’s outputper unit of energy input is to increase theattention given to maintenance of the correctfuel to air ratio. Proper automatic controls canperform this function with a high degree ofaccuracy.If additional emphasis can be put on mainte-nance tasks which directly effect the boilersability to release more energy per unit ofenergy input they should be considered a modi-fication of boiler operations. Items which fallinto this category are:
-Washing turbine blades-adjusting for maximum throttle pressure
10-2
-adjusting turbine control valves to insureproper lift
-adjusting preheater seals and feedwater heat-ers
-insuring cleanliness of heat transfer surfaces,such as condensers, superheaters, reheaters,and air heaters.
h. Limestone injection. One of the earliest tech-niques used to reduce sulfur oxide emission was the useof limestone as a fuel additive. This technique involveslimestone injection into the boiler with the coal or intothe high temperature zone of the furnace. The lime-stone is calcined by the heat and reacts with the SO2 inthe boiler to form calcium sulfate. The unreacted lime-stone, and the fly ash are then collected in an elec-trostatic precipitator, fabric bag filter, or other particu-late control device. There are a number of problemsassociated with this approach:
(1)
(2)
(3)
(4)
(5)
(6)
The sulfur oxide removal efficiency of theadditive approach is in the range of 50 to 70% infield applications. However, it is consideredfeasible that when combined with coal clean-ing, it is possible to achieve an overall SO2
reduction of 80 percent.The limestone used in the process cannot berecovered.The addition of limestone increases particulateloadings. In the precipitator this adverselyaffects collection efficiency.The effects of an increased ash load on slaggingand fouling as well as on particulate collectionequipment present a group of problems whichmust be carefully considered.The high particulate loadings and potentialboiler tube fouling in high heat release boilerstend to cause additional expense and technicalproblems associated with handling large par-ticulate loadings in the collection equipment.There have been many claims over the yearsregarding the applicability of fuel additives tothe reduction of sulfur oxide emissions. TheUnited States Environmental ProtectionAgency has tested the effect of additives onresidual and distillate oil-tired furnaces. Theyconclude that the additives have little or noeffect.
i. Flue gas desulfurization (FGD). There are a vari-ety of processes which have demonstrated the ability toremove sulfur oxides from exhaust gases. Althoughthis technology has been demonstrated for some time,its reduction to sound engineering practice and wide-spread acceptance has been slow. This is particularlytrue from the standpoint of high system reliability. Themost promising systems and their performance charac-teristics are shown in table 10-2.
j. Boiler injection of limestone with wet scrubber. Inthis system limestone is injected into the boiler and is

TM 5-815-1/A
FR 19-610-3

TM 5-815-1/AFR 19-6
calcined to lime. The lime reacts with the SO2 presentin the combustion gases to form calcium sulfate andcalcium sulfite. As the gas passes through a wet scrub-ber, the limestone, lime, and reacted lime are washedwith water to form sulfite. As the gas passes through awet scrubber, the limestone, lime, and reacted lime arewashed with water to form a slurry. The resultingeffluent is sent to a settling pond and the sediment isdisposed by landfilling. Removal efficiencies are below50% but can be reliably maintained. Scaling of boilertube surfaces is a major problem.
k. Scrubber injection of limestone. In this FGD sys-tem limestone is injected into a scrubber with water toform a slurry (5 to 15% solids by weight). The limestoneis ground into fines so that 85% passes through a 200-mesh screen. CaCO3 absorbs SO2 in the scrubber and ina reaction tank where additional time is allowed tocomplete the reaction. Makeup is added to the reusableslurry as necessary and the mixture is recirculated tothe scrubber. The dischargeable slurry is taken to athickener where the solids are precipitated and thewater is recirculated to the scrubber. Limestone scrub-bing is a throwaway process and sludge disposal may bea problem. At SO2 removal efficiencies of about 30%,performance data indicate that limestone scrubbershave a 90% operational reliability. Plugging of the de-mister, and corrosion and erosion of stack gas reheattubes have been major problems in limestone scrub-bers. Figure 10-1 shows a simplified process flow-sheetfor a typical limestone scrubbing installation.
l. Scrubber injection of lime. This FGD process issimilar to the limestone scrubber process, except thatlime (Ca(OH)2) is used as the absorbent. Lime is a moreeffective reactant than limestone so that less of it isrequired for the same SO2 removal efficiency. The deci-sion to use one system over the other is not clear-cutand usually is decided by availability.
m. Post furnace limestone injection with spray dry-ing. In this system, a limestone slurry is injected into aspray dryer which receives flue gas directly from theboiler. The limestone in the slurry reacts with the SO2
present in the combustion gases to form calcium sulfateand calcium sulfite. The heat content of the combustiongases drives off the moisture resulting in dry particu-lates exiting the spray dryer and their subsequent cap-ture in a particulate collector following the spray dryer.The particulates captured in the collector are dis-charged as a dry material and the cleaned flue gasespass through the filter to the stack (fig lo-la).
n. Dry, post furnace limestone injection. Grounddry limestone is injected directly into the flue gas ductprior to a fabric filter. The limestone reacts in the hotmedium with the SO2 contained in the combustiongases and is deposited on the filter bags as sodiumsulfate and sodium sulfite. The dry particulate matter isthen discharged to disposal and the cleaned flue gasespass through the filter medium to the stack (fig lo-lb).
10-4
o. Dry furnace injection of limestone. In this sys-tem, dry ground limestone is injected into the boilerwhere it is calcined and reacts with the SO2 formedduring combustion of the fuel. The flue gases containingthe sodium sulfate, sodium sulfite, unreacted lime-stone, and fly ash all exit the boiler together and arecaptured on a particulate collector. The cleaned fluegases pass through the filter medium and out throughthe stack (fig 10-1c).
p. Magnesium oxide (MgO) scrubber. This is aregenerative system with recovery of the reactant andsulfuric acid. As can be seen in figure 10-2 the flue gasmust be precleaned of particulate before it is sent to thescrubber. An ESP or venturi scrubber can be used toremove the particulate. The flue gas then goes to theMgO scrubber where the principal reaction takes placebetween the MgO and SO2 to form hydrated magne-sium sulfite. Unreacted slurry is recirculated to thescrubber where it combines with makeup MgO andwater and liquor from the slurry dewatering system.The reacted slurry is sent through the dewatering sys-tem where it is dried and then passed through a recov-ery process, the main step of which is calcination. Highreliability of this system has not yet been obtained. SO2
removal efficiencies can be high, but scaling and corro-sion are major problems.
q. Wellman Lord process. Sodium sulfite is thescrubbing solution. It captures the SO2 to producesodium bisulfite, which is later heated to evolve SO2 andregenerate the sulfite scrubbing material. The SO2 richproduct stream can be compressed or liquified andoxidized to sulfuric acid, or reduced to sulfur. Scalingand plugging are minimal problems because the sodiumcompounds are highly soluble in water. A Wellman-Lord unit has demonstrated an SO2 removal efficiencyof greater than 90 percent and an availability of over 85percent. The harsh acid environment of the system hascaused some mechanical problems (See figure 10-3).
r. Catalytic oxidation. The catalytic oxidation pro-cess uses a high temperature (850 degrees Fahrenheit)and a catalyst (vanadium pentoxide) to convert SO2 toSO3. The heated flue gas then passes through a gas heatexchanger for heat recovery and vapor condensation.Water vapor condenses in the heat exchanger and com-bines with SO3 to form sulfuric acid. The acid mist isthen separated from the gas in an absorbing tower. Theflue gas must be precleaned by a highly efficient par-ticulate removal device such as an electrostatic pre-cipitator preceding the cat-ox system to avoidpoisoning the catalyst. The major drawback of thissystem is that it cannot be economically retro-fitted toexisting installations (fig 10-4).
s. Single alkali sodium carbonate scrubbing. Inorder to eliminate the plugging and scaling problemsassociated with direct calcium scrubbing, this FGDsystem was developed. As shown in figure 10-5, theprocess is a once through process involving scrubbing

TM 5-815-1/AFR 19-6
U.S. ARMY CORPS OF ENGINEERS
Figure 10-1. Lime (limestone) injection system schematic
10-5

TM 5-815-1/AFR 19-6
U.S. Army Corps of Engineers
Figure 10-2. Magnesia slurry SO2 recovery process
with a solution of sodium carbonate or sodium hydrox- bing. All precipitation occurs outside theide to produce a solution of dissolved sodium sulfur scrubber under controlled reactor conditions.salts. The solution is then oxidized to produce a neutral The principal advantages of the dual alkali sys-solution of sodium sulfate. Because it is a throwaway tem are:process, the cost of chemicals make it an unattractive (a) Scaling problems associated with direct cal-SOx removal process when burning high sulfur fuels cium-based scrubbing processes are signifi-(greater than 1 percent). cantly reduced.
t. Dual alkali sodium scrubbing.(1) The dual alkali SOx removal system is a
regenerative process designed for disposal ofwastes in a solid/slurry form. As shown infigure 10-6, the process consists of three basicsteps; gas scrubbing, a reactor system, andsolids dewatering. The scrubbing system uti-lizes a sodium hydroxide and sodium sulfitesolution. Upon absorption of SO2 in the scrub-ber, a solution of sodium bisulfite and sodiumsulfite is produced. The scrubber effluent con-taining the dissolved sodium salts is reactedoutside the scrubber with lime or limestone toproduce a precipitate of calcium salts con-taining calcium sulfate. The precipitate slurryfrom the reactor system is dewatered and thesolids are deposed of in a landfill. The liquidfraction containing soluable salts is recircu-lated to the absorber. Double alkali systemscan achieve efficiencies of 90 - 95% and close to100% reagent utilization.
(b) A less expensive calcium base can be used.(c) Due to high solubility and concentration of
active chemicals, lower liquid volumes canbe used thereby lowering equipment costs.
(d) Slurries are eliminated from the absorptionloop, thereby reducing plugging and ero-sion problems.
(e) A sludge waste, rather than a liquid waste,is produced for disposal.
(f) High SO2 removal efficiency (90% or more).u. Absorption of SO2.
(2) This system is designed to overcome the inher-ent difficulties of direct calcium slurry scrub-
10-6
(1) Activated carbon has been used as an absor-bent for flue-gas desulfurization. Activatedcarbon affects a catalytic oxidation of SO2 toSO3, the latter having a critical temperature of425 degrees Fahrenheit. This allows absorp-tion to take place at operating temperatures.The carbon is subsequently regenerated in aseparate reactor to yield a waste which is usedin the production of high grade sulfuric acid,and the regenerated absorbent. There areserious problems involved in the regenerationof the absorbent, including carbon losses due

TM 5-815-1/AFR 19-6
1) ABSORBER 9) CATALYTIC REDUCTION SECTION
2) SURGE TANK 10) COOLER
3) REGENERATION SECTION 11) SULPHUR HOLDING PIT
4) DISSOLVING TANK 12,13) CLAUS CONVERTER
5) CONCENTRATED SO DISCHARGE 14, 15) CONDENSORS
6) PREHEATER 16) COALESCER
7) NATURAL GAS ADDITION 17) INCINERATOR
8) HEATER
U.S. Army Corps of Engineers
Figure 10-3. Wellman-Lord SO2 reduction system
to attrition, chemical decomposition, seriouscorrosion problems, and danger of combustionof the reactivated carbon.
(2) Zeolites are a class of highly structured alumi-num silicate compounds. Because of the reg-ular pore size of zeolites, molecules of less thana certain critical size may be incorporated intothe structure, while those greater areexcluded. It is often possible to specify a cer-tain zeolite for the separation of a particularmaterial. Zeolites possesses properties ofattrition resistance, temperature stability,inertness to regeneration techniques, and uni-form pore size which make them ideal absor-bents. However, they lack the ability tocatalyze the oxidation of SO2 to SO3 and thuscannot desulfurize flue-gases at normal operat-ing temperatures. Promising research is underway on the development of a zeolite materialthat will absorb SO2 at flue-gas temperatures
by oxidation of SO3 and subsequently store itas a sulphate in the pores of the zeolite.
v. Cost of flue-gas desulfurization. The actual capitaland operating costs for any specific installation are afunction of a number of factors quite specific to the plantand include:
-Plant size, age, configuration, and locations,-Sulfur content of the fuel and emission control
requirements,-Local construction costs, plant labor costs, and
cost for chemicals, water, waste disposal, etc.,-Type of FGD system and required equipment,-Whether simultaneous particulate emission
reduction is required.
10-3. Procedure to minimize SOx emissiona. Efficiency requirement. The SOx removal effi-
ciency necessary for any given installation is dependentupon the strictest regulation governing that installa-tion. Given a certain required efficiency, a choice can be
10-7

TM 5-815-1/AFR 19-6
U.S. Army Corps of Engineers
Figure 10-4. Catalytic oxidation system
U.S. Army Corps of Engineers
Figure 10-5. Single alkali sodium carbonate scrubber
10-8

TM 5-815-1/AFR 19-6
U.S. Army Corps of Engineers
Figure 10-6. Dual alkali system
made among the different reduction techniques. Thissection shows how a rational basis can be utilized todetermine the best method.
b. Boiler modification. This technique is useful inreducing SOX emissions by 0 to 6% depending upon theboiler. For industrial boilers operating above 20%excess-air the use of proper control equipment or lowexcess-air combustion will usually reduce emissions by4 to 5%. If the operating engineer is not familiar withboiler optimization methods, consultants should be uti-lized.
c. Fuel substitution. This method can be used foralmost any percent reduction necessary. Availabilityand cost of the fuel are the major factors to be consid-ered. Fuels can be blended to produce the desired sul-fur input. Care must be taken, however, so that the ashproduced by the blending does not adversely affect theboiler by lowering the ash fusion temperature or caus-ing increased fouling in the convection banks.
d. Flue-gas desulfurization. Various systems areavailable for flue-gas desulfurization. Some of thesesystems have demonstrated long term reliability ofoperation with high SOx removal efficiency. Lime/lime-stone injection and scrubbing systems have been mostfrequently used. It must be recognized that each boilercontrol situation must be accommodated in the overallsystem design if the most appropriate system is to beinstalled. The selection and design of such a controlsystem should include the following considerations:
(1) Local SO2 and particulate emission require-ments, both present and future,
(2) Local liquid and solid waste disposal regula-tions,
(3) Local market demand for recovered sulfur,(4) Plant design limitations and site charac-
teristics,(5) Local cost and availability of chemicals, util-
ities, fuels, etc.,(6) Added energy costs due to process pumps,
reheaters, booster fans, etc.
10-4. Sample problems.The following problems have been provided to illustratehow to determine the maximum fuel sulfur contentallowable to limit SOx emission to any particular level.
a. Approximately 90 to 97 percent of fuel sulfur isoxidized to sulfur dioxide (SO2) during combustion.This means that for every lb of sulfur in the fuel,approximately 2 lbs of sulfur oxides will appear in thestack gases. (The atomic weight of oxygen is l/2 that ofsulfur.) Since most of the sulfur oxides are in the form ofSO2, emissions regulations are defined in these units.To estimate maximum probable SO2 emissions, the fol-lowing equation applies:
lbs SO2 =MMBtu-
2 x % Sulfur by Weight in Fuel
Fuel Heating Value (Btu/lb)x 1 04
(eq. 10-l)
b. Assume a fuel-oil burning boiler must limit emis-sions to .35 lbs/MMBtu. What is the maximum allowa-ble sulfur content if No. 6 Residual fuel-oil is to be used?
(1) From table 10-3, Typical Analysis of Fuel-Oil
10-9

TM 5-815-1/AFR 19-6
Types, an average heating value of 18,300 Btu/lb for No. 6 residual fuel has been assumed.Maximum allowable sulfur content is deter-mined as:
.35 lbs SO2
MMBtu
x 2 x % Sulfur by Weight in Fuel x 104
18,300 Btu
% Sulfur = (.35) (18,300)2 x 104 = .32%
(2) Table 10-3 shows that No. 5 and No. 6 fuel oilshave fuel sulfur contents in excess of .32%. IfNo. 4 fuel oil is chosen, a fuel with less than.32% sulfur may be available.
c. Assume a fuel-oil burning boiler must limit SOx
emission to .65 lbs/MMBtu. If No. 6 residual fuel oil isto be used, can SOx emission limits be met?
(1) From table 10-3, the minimum sulfur contentin No. 6 fuel oil is .7%. If .7% sulfur fuel can bepurchased, the heating value of the fuel mustbe:
lb SO2a) .65 =2 x .7% Sulfur x 104
MMBtu H. Valueb) Heating Value = 21,538 Btu/lb
(2) Since the heating value of No. 6 fuel oil isgenerally between 17,410 and 18,990 Btu/lb,SOx emission limits cannot be met using thisfuel. If we assume a No. 6 fuel-oil with onepercent sulfur and a heating value of 18,600Btu/lb is used the percent SOx removal effi-ciency that will be required is determined as:
a)lbs SO2 emissions. x x 104 = 1.08
MMBtu
2 x 1% Sulfur
= 18,600 Btu/lb
b)1.08 - .65
1.08= 40% removal of SO2 required
d. Assume a boiler installation burns No. 4 fuel-oilwith a heating value of 19,000 Btu/lb. What is themaximum fuel sulfur content allowable to limit SOx
emissions to .8 lbs/MMBtu?
(1).80 (lbs SO2) 2 x % Fuel Sulfur=
Mil Btux 104
19,000 Btu/lb
(2) % Fuel Sulfur =.80 (19,000)
2 x 104
= .76%
e. Assume a coal burning boiler must limit SOx emis-sions to 1 lb/MMBtu. If sub-bituminous coal with aheating value of 12,000 to 12,500 Btu/lb (see table 10-4)is to be used what is the maximum allowable fuel sulfurcontent?
(1) (1.0 lbs SO2 2 x % Fuel Sulfur
M M B t u= 12,000 Btu/lb
x 10,000
(2) % Fuel Sulfur = 1.0 (12,000)2 x 10,000
= .60%
f. Since coal of this low sulfur content is not avail-able, what SOx removal efficiency would be requiredburning 1% sulfur coal?
2 x 1%(1) Estimated SO2 emissions = x 104lbs
MMBtu 12,000
(2) % Removal Efficiency
1.67 lbs SO2=Mil Btu
1.66-1.0=
1.66
= 40%
10-10

TM 5-815-1/A
FR 19-6
10-11

TM 5-815-1/A
FR 19-6
10-12

TM 5-815-1/AFR 19-6
CHAPTER 11NITROGEN OXIDES (NOx) CONTROL AND REDUCTION,
TECHNIQUES
11-1. Formation of nitrogen oxides.a. Nitrogen oxides (NOx). All fossil fuel burning
processes produce NOx. The principle oxides formedare nitric oxide (NO) which represents 90-95 percent(%) of the NOx formed and nitrogen dioxide (NOx)which represents most of the remaining nitrogenoxides.
ating under highly turbulent and intense flame condi-tions produce more NOx. The more bulk mixing of fueland air in the primary combustion zone, the more tur-bulence is created. Flame color is an index of flameturbulence. Yellow hazy flames have low turbulence,whereas, blue flames with good definition are consid-ered highly turbulent.
b. NOx formation. Nitrogen oxides are formed pri- c. Burner number. The number of burners and theirmarily in the high temperature zone of a furnace where spacing are important in NOx emission. Interactionsufficient concentrations of nitrogen and oxygen are between closely spaced burners, especially in the cen-present. Fuel nitrogen and nitrogen contained in the ter of a multiple burner installation, increases flamecombustion air both play a role in the formation of NOx. temperature at these locations. The tighter spacingThe largest percentage of NOx formed is a result of the lowers the ability to radiate to cooling surfaces, andhigh temperature fixation reaction of atmospheric greater is the tendency toward increased NOx emis-nitrogen and oxygen in the primary combustion zone. sions.
c. NOx concentration. The concentration of NOx
found in stack gas is dependent upon the time, tem-perature, and concentration history of the combustiongas as it moves through the furnace. NOx concentrationwill increase with temperature, the availability of oxy-gen, and the time the oxygen and nitrogen simul-taneously are exposed to peak flame temperatures.
11-Z. Factors affecting NOx emissions
d. Excess air. A level of excess air greatly exceedingthe theoretical excess air requirement is the majorcause of high NOx emissions in conventional boilers.Negotiable quantities of thermally formed NOx aregenerated in fluidized bed boilers.
a. Furnace design and firing type. The size anddesign of boiler furnaces have a major effect on NOx
emissions. As furnace size and heat release ratesincrease, NOx emissions increase. This results from alower furnace surface-to-volume ratio which leads to ahigher furnace temperature and less rapid terminalquenching of the combustion process. Boilers generatedifferent amounts of NOx according to the type of fir-ing. Units employing less rapid and intense burningfrom incomplete mixing of fuel and combustion gasesgenerate lower levels of NOx emissions. Tangentiallytied units generate the least NOx because they operateon low levels of excess air, and because bulk misting andburning of the fuel takes place in a large portion of thefurnace. Since the entire furnace acts as a burner,precise proportioning of fuel/air at each of the individ-ual fuel admission points is not required. A largeamount of internal recirculation of bulk gas, coupledwith slower mixing of fuel and air, provides a combus-tion system which is inherently low in NOx productionfor all fuel types.
b. Burner design and configuration. Burners oper-
e. Combustion temperature. N Ox formation isdependent upon peak combustion temperature, withhigher temperatures producing higher NOX emissions.
f. Firing and quenching rates. A high heat releaserate (firing rate) is associated with higher peak tem-peratures and increased NOx emissions. A high rate ofthermal quenching, (the efficient removal of the heatreleased in combustion) tends to lower peak tem-peratures and contribute to reduced NOx emissions.
g. Mass transportation and mixing. The con-centration of nitrogen and oxygen in the combustionzone affects NOx formation. Any means of decreasingthe concentration such as dilution by exhaust gases,slow diffusion of fuel and air, or alternate fuel-rich/fuel-lean burner operation will reduce NOx formation.These methods are also effective in reducing peak flametemperatures.
h. Fuel type. Fuel type affects NOx formation boththrough the theoretical flame temperature reached,and through the rate of radiative heat transfer. Formost combustion installations, coal-fired furnaces havethe highest level of NOx emissions and gas-firedinstallations have the lowest levels of NOx emissions.
i. Fuel nitrogen. The importance of chemicallybound fuel nitrogen in NOx formation varies with thetemperature level of the combustion processes. Fuel
11-1

TM 5-815-1/AFR 19-6
nitrogen is important at low temperature combustion,but its contribution is nearly negligible as higher flametemperatures are reached, because atmospheric nitro-gen contributes more to NOx formation at higher tem-peratures.
11-3. NOx reduction techniquesa. Fuel selection. Reduction of NOx emissions may
be accomplished by changing to a fuel which decreasesthe combustion excess air requirements, peak flametemperatures, and nitrogen content of the fuel. Thesechanges decrease the concentration of oxygen andnitrogen in the flame envelope and the rate of the NOx
formation reaction.(1) The specific boiler manufacturer should be con-
sulted to determine if a fuel conversion can beperformed without adverse effects. The gen-eral NOx reduction capability of initiating achange in fuel can be seen comparatively intable 11-l.
(2) A consideration when comtemplating a changein fuel type is that NOx emission regulationsare usually based on fuel type. Switching to acleaner fuel may result in the necessity of con-forming to a more strict emission standard.
Table 11-1
General NOx emission andexcess air requirements for fuel types
Range of Excess Air Level, NOx EmissionsFuel Type percent above stoichiometric lbs/Mil Btu
coal 18-25 .5-1.1(Lignite) - (.9-1.1)
Fuel Oil 3 - 1 5 . l - . 4Gaseous fuels 7 - 1 0 .3
(3) Changing from a higher to a lower NOx produc-ing fuel is not usually an economical method ofreducing NOx emissions because additionalfuel costs and equipment capital costs willresult. For additional information on fuel sub-stitution, see paragraph 10-3. In doing so, itshould be noted that changing from coal to oilor gas firing is not in accordance with presentAR 420-49.
b. Load reduction. Load reduction is an effectivetechnique for reducing NOx emissions. Load reductionhas the effect of decreasing the heat release rate andreducing furnace temperature. A lowering of furnacetemperature decreases the rate of NOx formation.
(1) NOx reduction by load reduction is illustratedin figure 11-l. As shown, a greater reduction
U.S. Army Corps of Engineers
Figure 11-1. Possible NOx reductions vs load reductions
11-2

in NO2 is attainable burning gas fuels becausethey contain only a small amount of fuel-boundnitrogen. Fuel-bound nitrogen conversion doesnot appear to be affected by furnace tem-peratures, which accounts for the lower NOx
reductions obtained with coal and oil tiring.Some units such as tangentially fired boilersshow as much as 25 percent decrease in NOx
emissions with a 25 percent load reductionwhile burning pulverized coal.
(2) Although no capital costs are involved in loadreduction, it is sometimes undesirable toreduce load because it may reduce steam cycleefficiency.
c. Low excess air firing (LEA). In order to completethe combustion of a fuel, a certain amount of excess airis necessary beyond the stoichiometric requirements.The more efficient the burners are in misting, thesmaller will be the excess air requirement. A minimumamount of excess air is needed in any system to limit theproduction of smoke or unburned combustibles; butlarger amounts may be needed to maintain steam tem-perature to prevent refractory damage; to completecombustion when air supply between burners is unbal-anced; and to compensate for instrument lag betweenoperational changes. Practical minimums of excess airare 7 percent for natural gas, 3 to 15 percent for oilfiring, and 18 to 25 percent for coal firing.
(1) Since an increase in the amount of oxygen andnitrogen in a combustion process will increasethe formation and concentration of NOx, lowexcess air operation is the first and mostimportant technique that should be utilized toreduce NOx emissions. A 50 percent reductionin excess air can usually reduce NOx emissionsfrom 15 to 40 percent, depending upon the levelof excess air normally applied. Average NOx
reductions corresponding to a 50 percentreduction in excess air for each of the threefuels in different boiler types are shown intable 11-2. Reductions in NOx emissions up to62 percent have been reported on a pulverizedcoal fired boiler when excess air is decreasedfrom a level of 22 percent to a level of 5 percent.
Table 11-2
Possible NOx emission reductions attainable with a50% reduction in excess air from normal levels
(greater than 10% excess air)Fuel Type
Gas Oil Coal
Furnace Type % Reduction
Horizontal front wall 1 5 - 2 0 2 0 - 2 5 2 5 - 3 5Horizontal opposed firing 1 5 - 2 5 2 5 - 3 0 3 0 - 4 0Tangentially fired 1 5 2 0 - 2 5 2 5 - 3 0NOTE: Overall NOx reduction potential for industrial and commer-
cial size boilers for LEA operation is limited to about 40%reduction dependent upon the level of excess air normallyapplied.
TM 5-815-1/AFR 19-6
(2) The successful application of LEA firing to anyunit requires a combustion control system toregulate and monitor the exact proportioningof fuel and air. For pulverized coal fired boilers,this may mean the additional expense ofinstalling uniform distribution systems for thecoal and air mixture.
(3) Low excess air firing is a desirable method ofreducing NOx emission because it can alsoimprove boiler efficiency by reducing theamount of heat lost up the stack. Con-sequently, a reduction in fuel combustion willsometimes accompany LEA firing.
d. Low excess air firing with load reduction. NOx
emissions may be reduced by implementing a loadreduction while operating under low excess air condi-tions (table 11-2). This combined technique may bedesirable in an installation where NOx emissions areextremely high because of poor air distribution and theresultant inefficient operation of combustible equip-ment. A load reduction may permit more accurate con-trol of the combustion equipment and allow reduction ofexcess air requirements to a minimum value. NOx
reduction achieved by simultaneous implementation ofload reduction and LEA firing is slightly less than thecombined estimated NOx reduction achieved by sepa-rate implementation.
e. Two-stage combustion. The application of delayedfuel and air mixing in combustion boilers is referred toas two stage combustion. Two-stage combustion can beof two forms. Normally it entails operating burnersfuel-rich (supplying only 90 to 95 percent ofstoichiometric combustion air) at the burner throat,and admitting the additional air needed to completecombustion through ports (referred to as NO ports)located above and below the burner. There are no portsto direct streams of combustion air into the burnerflame further out from the burner wall thus allowing agradual burning of all fuel. Another form of two-stagecombustion is off-stoichiometric firing. This techniqueinvolves firing some burners fuel-rich and others air-rich (high percentage of excess air), or air only, and isusually applied to boilers having three or more burnerlevels. Off-stoichiometric firing is accomplished bystaggering the air-rich and fuel-rich burners in each ofthe burner levels. Various burner configuration testshave shown that it is generally more effective to operatemost of the elevated burners air-rich or air only. Off-stoichiometric firing in pulverized coal tired boilers usu-ally consists of using the upper burners on air onlywhile operating the lower levels of burners fuel-rich.This technique is called over-fire air operation.
(1) Two-stage combustion is effective in reducingN Ox emissions because: it lowers the con-centration of oxygen and nitrogen in the pri-mary combustion zone by fuel-rich firing; itlowers the attainable peak flame temperature
11-3

TM 5-815-1/AFR 19-6
by allowing for gradual combustion of all thefuel; and it reduces the amount of time the fueland air mixture is exposed to higher tem-peratures.
(2) The application of some form of two stage com-bustion implemented with overall low excessair operation is presently the most effectivemethod of reducing NOx emissions in utilityboilers. Average NOx reductions for this com-bustion modification technique in utilityboilers are listed in table 11-3. However, itshould be noted that this technique is not usu-ally adaptable to small industrial boilers whereonly one level of burners is provided.
Table 11-3Possible NOx reductions, percent of normal emissions
Fuel Type
Furnace Type
Gas Oil Coal
Percent Reduction
Two-stage combustionRange 40-70 20-50 20-40Average 50 40 35
Off-stoichiometric - - 39-60Two-stage combustion or off-
stoichiometric with LEA or loadreduction
Range 50-90 40-70 40-60Average 70 60 50
f. Reduced preheat temperature. NOx emissions areinfluenced by the effective peak temperature of thecombustion process. Any modifications that lower peaktemperature will lower NOx emissions. Lower air pre-heat temperature has been demonstrated to be a factorin controlling NOx emissions. However, reduced pre-heat temperature is not a practical approach to NOx
reduction because air preheat can only be varied in anarrow range without upsetting the thermal balance ofthe boiler. Elimination of air preheat might be expectedto increase particulate emissions when burning coal oroil. Preheated air is also a necessary part of the coalpulverizer operation on coal fired units. In view of hepenalties of reduced boiler efficiency and other disad-vantages, reduced preheat is not a preferred means oflowering NOx emissions.
g. Flue-gas recirculation. This technique is used tolower primary combustion temperature by recirculat-ing part of the exhaust gases back into the boiler com-bustion air manifold. This dilution not only decreasespeak combustion flame temperatures but alsodecreases the concentration of oxygen available forNOx formation. NOx reductions of 20 to 50 percent havebeen obtained on oil-fired utility boilers but as yet havenot been demonstrated on coal-fired units. It is esti-mated that flue gas recirculation has a potential ofdecreasing NOx emissions by 40 percent in coal-firedunits.
(1) Flue gas recirculation has also produced a
11-4
reduction on CO concentrations from normaloperation because of increased fuel-air mixingaccompanying the increased combustion air/gas volume. Gas recirculation does not signifi-cantly reduce plant thermal efficiency but itcan influence boiler operation. Radiation heattransfer is reduced in the furnace because oflower gas temperatures, and convective heattransfer is increased because of greater gasflow.
(2) The extent of the applicability of this modifica-tion remains to be investigated. The quantityof gas necessary to achieve the desired effect indifferent installations is important and caninfluence the feasibility of the application.Implementing flue-gas recirculation meansproviding duct work and recycle fans for diver-ting a portion of the exhaust flue-gas back tothe combustion air windbox. It also requiresenlarging the windbox and adding controldampers and instrumentation to automaticallyvary flue-gas recirculation as required for oper-ating conditions and loads.
h. Steam or water injection. Steam and water injec-tion has been used to decrease flame temperatures andreduce NOx emissions. Water injection is preferredover steam because of its greater ability to reduce tem-perature. In gas and coal fired units equipped withstandby oil firing with steam atomization, the atomizeroffers a simple means for injection. Other installationsrequire special equipment and a study to determine theproper point and degree of atomization. The use ofwater or steam injection may entail some undesirableoperating conditions, such as decreased efficiency andincreased corrosion: A NOx reduction rate of up to 10percent is possible before boiler efficiency is reduced touneconomic levels. If the use of water injection requiresinstallation of an injection pump and attendant piping,it is usually not a cost-effective means of reducing NOx
emissions.
11-4. Post combustion systems for NOx
reduction.a. Selective catalytic reduction (SCR) of NOx is
based on the preference of ammonia to react with NO,rather than with other flue-gas constitutents.Ammonia is injected so that it will mix with flue-gasbetween the economizer and the air heater. Reactionthen occurs as this mix passes through a catalyst bed.Problems requiring resolution include impact ofammonia on downstream equipment, catalyst life, flue-gas monitoring, ammonia availability, and spent-cata-lyst disposal.
b. Selective noncatalytic reduction (SNR) Ammoniais injected into the flue-gas duct where the temperaturefavors the reaction of ammonia with NOx in the flue-gas. The narrow temperature band which favors the

TM 5-815-1/AFR 19-6
-the effects of each technique upon boiler perfor-mance and operational safety.
d. Procedure. A technical program for implement-ing a NOx reduction program should proceed with theaid of equipment manufacturers and personnel whohave had experience in implementing each of the NOx
reduction techniques that may be required in the follow-ing manner:
(1) NOx emission test. A NOx emission test shouldbe performed during normal boiler load timesto ascertain actual on-site NOx generation.This test should include recording of normalboiler parameters such as: flame temperature;excess air; boiler loads; flue-gas temperatures;and firing rate. These parameters can bereferred to as normal operating parametersduring subsequent changes in operation.
(2) Reduction capabilities. The desired reductionin NOx emissions, in order to comply withstandards, should be estimated based on mea-sured NOx emission data. Specific NOx reduc-tion techniques can then be selected based ondesired reductions and reduction capabilitiesoutlined in preceding paragraph 11-3.
(3) Equipment optimization. Any realistic pro-gram for NOx reduction should begin with anevaluation and overhaul of all combustionrelated equipment. A general improvement ofboiler thermal efficiency and combustion effi-ciency will reduce the normal level of NOx
emissions. Of major importance are:(a) the cleanliness of all heat transfer surfaces
(especially those exposed to radiative heatabsorption),
(b) maintaining proper fuel preparation (siz-ing, temperature, viscosity),
(c) insuring control and proper operation ofcombustion equipment (burners nozzles,air registers, fans, preheaters, etc.),
(d) maintaining equal distribution of fuel andair to all burners.
(4) Low excess air operation. Low excess air oper-ation is the most recommended modificationfor reducing NOx emission. Possible reduc-tions are given in preceding table 11-2. How-ever, a control system is needed to accuratelymonitor and correct air and fuel flow inresponse to steam demands. Of the controlsystems available, a system incorporating fueland air metering with stack gas O2 correctionwill provide the most accurate control. A sys-tem of this nature will generally pay for itself infuel savings over a 2 to 3-year period, and iseconomically justified on industrial boilersrated as low as 40,000 lb of steam/hr.
(5) Flue-gas recirculation. Flue-gas recirculationis the second most effective NOx reduction
11-5
reaction and the difficulty of controlling the tem-perature are the main drawbacks of this method.
c. Copper oxide is used as the acceptor for SO,removal, forming copper sulfate. Subsequently boththe copper sulfate which was formed and the copperoxide catalyze the reduction of NO to nitrogen andwater by reaction with ammonia. A regeneration stepproduces an SO, rich steam which can be used to man-ufacture by-products such as sulfuric acid.
11-5. Step-by-step NOx reduction methoda. Applicability. The application of NOx reduction
techniques in stationary combustion boilers is notextensive. (However, NOx reduction techniques havebeen extensively applied on automobiles.) These tech-niques have been confined to large industrial and utilityboilers where they can be more easily implementedwhere NOx emissions standards apply, and whereequipment modifications are more economically justi-fied. However, some form of NOx control is available forall fuel-burning boilers without sacrificing unit outputor operating efficiency. Such controls may become morewidespread as emission regulations are broadened toinclude all fuel-burning boilers.
b. Implementation. The ability to implement a par-ticular combustion modification technique is dependentupon furnace design, size, and the degree of equipmentoperational control. In many cases, the cost of con-version to implement a modification such as flue-gasrecirculation may not be economically justified. There-fore, the practical and economic aspects of boiler designand operational modifications must be ascertainedbefore implementing a specific reduction technique.
(1) Temperature reduction through the use of two-stage combustion and flue-gas recirculation ismost applicable to high heat release boilerswith a multiplicity of burners such as utilityand large industrial boilers.
(2) Low excess air operation (LEA) coupled withflue-gas recirculation offers the most viablesolution in smaller industrial and commercialsize boilers. These units are normally designedfor lower heat rates (furnace temperature) andgenerally operate on high levels of excess air(30 to 60%).
c. Compliance. When it has been ascertained thatNOx emissions must be reduced in order to comply withstate and federal codes, a specific program should bedesigned to achieve the results desired. The programdirection should include:
-an estimate of the NOx reduction desired,-selection of the technique or combination
thereof, which will achieve this reduction;-an economic evaluation of implementing each
technique, including equipment costs, andchanges in operational costs;
-required design changes to equipment

TM 5-815-1/AFR 19-6
technique for boilers where two stage combus-tion cannot be applied. Low excess air opera-tion and flue-gas recirculation must be imple-mented simultaneously from a design point ofview. LEA operation may require installationor retrofitting of air registers to maintainproper combustion air speed and mixing atreduced levels or air flow. Flue gas recircula-tion will require larger air registers to accom-modate the increased volume of flow. There-fore, simultaneous application of LEAoperation and flue-gas recirculation may mini-
mize the need for redesign of burner air regis-ters. Knowledge of furnace thermal designmust accompany any application of flue-gasrecirculation which effectively lowers furnacetemperature and thus, radiative heat transfer.Convective heat transfer is also increased byincreased gas flow due to the dilution of com-bustion air. It is advisable to consult boilermanufacturers as to the applicability of flue-gas recirculation to their furnaces.
e. Summary. The potential and applicability of eachNOx reduction technique is summarized in table 11-4.
11-6

TM 5-815-1/A
FR 19-6

TM 5-815-1/AFR 19-6
CHAPTER 12EMISSION CONTROL EQUIPMENT SELECTION FOR INCINERATORS
AND BOILERS
12-1. Principles of selectiona. Selection of emission control equipment is made
in three basic steps.(1)
(2)
(3)
Performance. The control equipment must becapable of continuously controlling the emis-sion of the pollutant below the permitted quan-tities. The equipment type and design shouldhave a proven record of meeting the requiredremoval or collection efficiency and the man-ufacturer should guarantee the equipment forcontinuous performance.Construction. The materials of constructionshould be compatible with the characteristicsand constituents in the flue gases. Materialsshould be resistant to erosion and corrosionand should be suitable for the operating tem-peratures. The unit should have adequateaccess manholes and service platforms andstairs to inspect and maintain the equipment.Units should be adequately insulated andweather protected.Operation. Where more than one design ortype of device can provide the necessary pollu-tion control it then becomes necessary to eval-uate the various designs based on a life-cyclecost-analysis, and the ease of operation.
b. Preliminary information which is needed to prop-erly select pollution control equipment are as follows:
(1) Site-specific emissions limitations for the stackserving the particular boiler or incineratormust be determined for the applicable sourceand ambient condition. This information is tobe derived from existing federal, state andlocal regulations.
(2) Obtain detailed descriptions of the boiler orincinerator including the combustion controlsystem(s) and all support auxiliaries includingoutline drawings available from the manufac-turers; and the predicted uncontrolled, gas-eous emissions established for the units.
(3) For the particular fuel to be burned, determinethe method of firing and maximum continuousrated heat input per British Thermal Units perhour (BTU’s/Hr) along with applicable com-bustion calculations for normal and upset oper-ating conditions. This may require a fuel
analysis. In the case of coal firing the analysisshould include ultimate and proximate proper-ties and an analysis of the residual ash.
(4) Obtain required construction and operationspermit forms from applicable regulatory agen-cies, complete, and submit where required.
(5) Obtain the requirements and restraints for dis-posing of the collected pollutant. Under somecircumstances such as preliminary studies itbecomes necessary to calculate the processdata and then use empirical data to estimatethe emission quantities.
c. The U.S. Environmental Protection Agency(EPA) has published a Technical Manual “AP-42” andexcerpts from the EPA publication have beenreproduced and included in Chapters 2 and 3 of thismanual to be used as a guide for predicting the emis-sions that will be generated by various fuels and com-bustions apparatus.
d. Present emissions control requirements and lawsare complicated and stringent, and emission controlequipment represents a significant portion of the com-bustion equipment costs. Inadequately specified orapplied control devices could be a very costly error. It isadvisable wherever possible to utilize qualified engi-neers experienced in boiler or incinerator plant designsand operation of such tasks. It is beneficial for theengineer to also have experience in securing necessarypermits.
12-2. Flue gas propertiesa. Gas properties influence the design and perfor-
mance of the pollution control equipment. When work-ing with a particular emission standard or code the gasproperties must be converted to the units used in thecodes, such as lbs per million BTU; gr/ACFM; DSCFMat 32; DSCFM at 68; DSCFM corrected to 8 percent O2.
b. Flow rate. The flow-rate of exhaust gases gener-ated in the combustion process must be measured orcalculated to determine the required volumetric size ofthe collection equipment. Flow-rate variations result invelocity changes and thus influence collector efficiencyand pressure drop. It is necessary therefore to obtainmaximum, average, and minimum values for a cyclicalor modulating operation.
c. Temperature. Gas temperature affects gas volume
12-1

TM 5-815-1/AFR 19-6
(and simultaneously collector volume) and materials ofconstruction for the collector. Temperature may alsolimit use of certain collectors. For instance, tem-peratures above 550 degree Fahrenheit rule out the useof fabric filters.
d. Pressure. Carrier gas pressure must be known orcalculated to determine the structural requirements forthe collector under operating and upset conditions.
e. Viscosity. Gas viscosity is a measure of molecularactivity in a gas stream. The greater the gas viscosity,the greater the resistance to particle migration acrossthe stream normal to gas flow. Since gas viscosityincreases with gas temperature, it is an important fac-tor in the performance of dry particulate collectiondevices. Viscosity effects can be minimized if equip-ment is properly specified.
f. Moisture content. Moisture content affects theperformance of collection equipment and the choice ofconstruction materials. It is important to know the dewpoint of the exhaust gas, as temperatures below dewpoint allows acid vapors to condense and attack struc-tural surfaces. This is a particular concern with boilerflue-gas which often contains a significant amount ofsulfuric acid vapor.
g. Chemical composition. Chemical compositionprimarily affects the choice of construction materialsfor a collector. Collectors must be suitably protected tohandle corrosive gases.
h. Toxicity. Handling of toxic gases requires specialtreatment and equipment and must be reviewed on anindividual basis. This manual does not address incin-eration of toxic or hazardous wastes.
12-3. Particulate propertiesa. Particulate properties that must be determined
for control equipment selection and design aredescribed below. Appropriate test methods are listed intable 5-l.
b. Concentration (loading). Particulate loading is ameasurement of particulate concentration in flue gases(see this manual, chapters 2 and 3) expressed in grainsper cubic foot. Particulate loading is used as a criteria todesign and select applicable collection equipment.Fluctuations in loading (for example: soot blowing inboilers) must be noted and maximum, minimum, andaverage values should be recorded. High grain loadingsmay require a series system of control devices to meetparticulate emissions and air quality standards. Forinstance, a cyclone followed by an electrostatic pre-cipitator or baghouse.
c. Particle size. The particle size analysis affects thecollection efficiency for each control device. Fine par-ticulate collection requires high-efficiency equipmentsuch as venturi scrubbers, electrostatic precipitators,or fabric filters.
d. Resistivity. Particulate resistivity is a limitingfactor in the design of electrostatic precipitators.
12-2
Resistivity must be determined if an electrostatic pre-cipitator is to be selected to control particulate emis-sions. As a general guideline, resistivity above 1010
ohm-cm normally rules out the use of electrostatic pre-cipitation unless provisions are made for particulateelectrical conditioning.
e. Handling characteristics. Particle-handlingcharacteristics influence dust-handling systems (duct-work, collector structure, hoppers, conveyors) andmaterials of construction. Dust-handling charac-teristics include flow properties, abrasiveness,hygroscopicity, moisture content, agglomerating tend-encies. These properties, including specific gravity andbulk density should be evaluated in the design of a dust-collecting system.
f. Chemical composition. Chemical composition ofparticulate affects materials of construction and designof the collector and ash disposal equipment as doescarrier gas composition.
12-4. Application of emission control sys-tems for boilers.
As a result of current, stringent, stack emission regula-tions, applications of certain conventional emissionscontrol systems have evolved that provide satisfactoryperformance when properly sized and specified. Refer-enced are CFR40 part 60 for new source performancestandards (NSPS) only, as ambient regulations havewide variation from site-to-site requiring investigationfor each location. Following is a brief description of themost common combustion sources, fuels, and controldevices employed:
a. Natural gas fired power boiler. NSPS cover par-ticulates; sulfur dioxide SO2; nitrogen dioxide NOx; andopacity.
(1) External devices are not usually required.Properly adjusted combustion controls,burner(s), furnace designs, and gas monitor-ing are sufficient to meet the performancestandards.
(2) Even though natural gas is a relatively cleanfuel, some emissions can occur from the com-bustion reaction. For example, improper oper-ating conditions, including items such as poormixing and insufficient air, may cause largeamounts of smoke, carbon monoxide, andhydrocarbons to be produced. Moreover,because a sulfur-containing mercaptan isadded to natural gas for detection proposes,small amounts of sulfur oxides will also be pro-duced in the combustion process.
(3) Nitrogen oxides are the major pollutants ofconcern when burning natural gas. Nitrogendioxide emissions are a function of the tem-perature in the combustion chamber and therate of cooling of the combustion products.Emission levels generally vary considerably

TM 5-815-1/AFR 19-6
with the type and size of unit and are also afunction of loading.
(4) In some large boilers, several operating modi-fications have been employed for NOx control.In staged combustion, for example, includingoff-stoichiometric firing, also called “biased fir-ing,” some burners are operated fuel-rich,some fuel-lean, while others may supply aironly. In two-staged combustion, the burnersare operated fuel-rich (by introducing only 80to 95 percent stoichiometric air) with combus-tion being completed by air injected above theflame zone through second-stage “NOx-ports”.In staged combustion, NOx emissions arereduced because the bulk of combustion occursunder fuel-rich, reducing conditions.
b. Distillate oil fired power boilers. NSPS cover par-ticulates; SO2; NOx; and opacity. Methods of modifyingor controlling emissions are discussed in the following.
(1) Particulate. The user should note that in mostcases external pollution control devices are notrequired for boilers firing No. 1 or No. 2 fueloils.
(3) N Ox. May be controlled by utilizing limitedexcess-air firing; flue gas recirculation; stagedcombustion; or combinations of these.
(4) Opacity. May be controlled by limiting or col-lecting the particulates and by properlyadjusted and designed combustion controlswith good burner and furnace designs.
d. Pulverized coal-fired power boiler. NSPS coverlimitations for particulates; SO2; NOx; and opacity.Methods of modifying or controlling emissions are dis-cussed in the following.
(1) Particulates.(a) Control by use of electrostatic precipitator(b) Control by use of fabric filters(c) Control by use of venturi scrubber(d) Control by combination of a mechanical col-
lector followed by either (a), (b), or (c),above
(2) SO2.
(2) SO2. Most distillates will contain sulfur quan-tities low enough so that no treatment will benecessary. However, a fuel analysis must bereviewed as some distillates can have as muchas one percent sulfur. When the sulfur contentproduces SO2 emissions in excess of the allowa-ble a wet scrubbing system will be required.
(3) NOx. Control requires the proper combustioncontrols, and burners and furnaces designed tolimit NOx generation from high combustiontemperatures. Usually NOx reductions areaccomplished by limiting excess air firing andstaged combustion. Large utility system unitssometimes also employ flue-gas recirculation inaddition to the other methods.
(4) Opacity. This may be controlled by proper air-fuel ratios; good combustion controls; limitingparticulate emissions; and proper engineeringdesign of the burners and furnace chamber.
c. Residual oil fired power boilers. NSPS cover par-ticulates; SO2; NOx; and opacity. Methods of modifyingor controlling emissions are discussed in the following.
(1) Particulate control.
(a) Use suitable wet scrubber (can double forboth SO2 and particulates)
(b) Use suitable dry scrubber followed by fab-ric filters or electrostatic precipitator
(c) Selection of a wet or dry scrubbing systemis determined by evaluating the economics(installation and operating costs) and thedisposal of the collected pollutant.
(3) NO x. Ensure that the burner and furnace aredesigned for limited excess-air firing andstaged combustion. In some cases it may benecessary to have a second stage air fan desig-nated as an NOx control fan in order to gaincompliance.
(4) Opacity. This may be controlled by particulateremoval and properly adjusted combustioncontrols. In some cases this could be the morestringent requirement for particulate removal.
e. Spreader and muss feed stoker coal fired boilerswith a traveling grate. NSPS cover limitations for par-ticulates; SO2; NOx; and opacity. Methods of modifyingor controlling emissions are discussed in the following.
(1) Particulates.
(a) When using low-sulfur oils, cyclonicmechanical collectors are usually adequate.On larger utility size units electrostatic pre-cipitators are employed to limit particulateemissions.
(a) Control by use of electrostatic precipitator(b) Control by use of suitable fabric filter(c) Control by use of suitable wet scrubber(d) Control by a combination of a mechanical
collector followed by either (a), (b), or (c)above
(2) SO2.
(b) For emissions from combustion of high-sul-fur oils a wet scrubbing system can be usedfor both SO2 removal and particulate con-trol.
(a) Use suitable wet scrubber (can double forboth SO2 and particulate).
(b) Use suitable dry scrubber followed byeither a fabric filter or an electrostatic pre-cipitator
(2) SO2. Use wet scrubbing system with a low (3) NOx. Control by specifying furnace and com-pressure drop. bustion air controls designed to maintain lim-
12-3

TM 5-815-1/AFR 19-6
ited flame temperatures under operating con-ditions.
(4) Opacity. Control by particulate removal andproperly adjusted combustion controls. Thiscan be the more stringent requirement for par-ticulate removal.
f. Wood waste and bark fired boilers. NSPS coverlimitation for particulates and opacity. Methods of mod-ifying or controlling emissions are discussed in thefollowing.
(1) Particulates.(a) Control by use of a mechanical collector
followed by either a scrubber or an elec-trostatic precipitator.
(b) Control by use of wet scrubber.(c) Control by use of electrostatic precipitator.(d) Control by use of gravel bed filter.
(2) Opacity. Opacity is controlled by particulatecollection and properly adjusted combustioncontrols. The “as-fired” condition of woodwaste fuel will impact the choice of particulatecontrol equipment.
(a) Hogged bark and wood chips with 45% to55% moisture usually require a mechanicalcollector followed by a scrubber or an ESP.Material collected in the mechanical collec-tor is a combination of char, ash, and sand.The material is classified to separate thechar from the ash/sand mixture so the charcan be reinjected into the furnace combus-tion zone. The ash/sand mixture is dis-charged by gravity or conveyor to a holdingtank which can be either wet or dry. All ash-hopper discharge openings must be pro-tected from air infiltration by rotary-sealdischarge valves or an air-lock damperarrangement, to prevent ignition of hotcombustibles.
(b) Dry wood wastes that are chipped to lessthan 1” x ½” size may not require themechanical collector and reinjection equip-ment. Gas clean-up equipment of choicemay then be either the scrubber or elec-trostatic precipitator. Ash discharge hop-pers need to be protected by seal valves orair locks in all cases.
(c) Fabric filters are avoided because of thepotential for burning the fabric with hotchar carry over.
(d) Ash-handling is usually accomplished usinga hydraulic conveying system dischargingto an ash settling pond.
(e) Screw conveyors or drag-chain conveyorsare acceptable alternatives for dry handlingof ash from wood-fired boilers when pond-ing is not viable. The dry ash should be
12-4
cooled and conditioned with water beforebeing transported for land fill disposal.
g. Coal fired fluidized bed boilers. NSPS cover lim-itation for particulates; SO2; NOx; and opacity. Meth-ods of modifying or controlling emissions are discussedin the following.
(1)
(2)
(3)
(4)
(5)
1 2 - 5 .
Particulates. Control by use of fabric filter oran electrostatic precipitator. Most units willnot require a mechanical collector in serieswith the baghouse or electrostatic precipitator.However, if high dust loadings are anticipatedan in-line mechanical collector in series withthe baghouse or electrostatic precipitator maybe justified.SO2. Controlled by the metering (feeding) oflime stone into the fluidized fuel bed.N Ox. The comparatively low furnace tem-peratures experienced in fluidized bed boilerslimits the heat generated NOx formation. Nospecial devices or controls are required forNOx control on fluidized bed units.Opacity. Controlled by particulate removal andproperly adjusted and designed combustioncontrols.Ash handling and removal systems. Can bedry or wet and may be automated cycles orcontinuous ash removal utilizing equipmentand methods previously discussed.
Municipal solid waste-fired boilers(MSW) and bo i l e r s u s ing r e fu sederived fuels (RDF)
a. Municipal solid waste fired boilers fall in the sameemission regulation category as an incinerator. Com-pliance is only required for particulate emission regula-tions.
b. Boilers using refuse derived fuels must meet theincinerator regulations and are also required to meetemission standards for any other fuels fired in theboiler. In most states the allowable emissions are calcu-lated on the ratio of fuels fired and which cover controlof particulate, SO2, NOx, and opacity.
(1) Particulates Use mechanical collectors as aprimary device followed by either a fabric filteror an electrostatic precipitator. The ESP isfavored when there is co-firing with coal in theMSW boiler. Without coal co-firing, resistivityof the particulate can be extremely high. Wetscrubbers should be avoided because of possi-ble odor pick up.
(2) SO2. SO2 formation is a function of the sulfurcontent in the refuse and fuel. In most cases noSO2 removal devices are necessary. However,when required a dry scrubber system followedby either a baghouse or an electrostatic pre-cipitator is preferred.

TM 5-815-1/AFR 19-6
(3) NO x. Furnace design and firing methods areused to limit NOx. Two-step combustion isemployed. The primary zone is fired with lim-ited air to maintain a reducing atmosphere andthe secondary zone uses an oxidizingatmosphere to provide a controlled low-tem-perature flame with minimum excess air.
(4) Opacity. Opacity is controlled by limiting par-ticulate emissions and by properly designedcombustion controls.
12-6. Applications of emission control sys-tems for incinerators
Refuse incinerators are type categorized as: municipal;industrial; commercial; and sludge. NSPS cover par-ticulate emissions only. However, incineration of manysolid, liquid, and gaseous wastes will produce noxiousgases that require special treatment.
a. Municipal incinerators. Optimum control ofincinerator particulate emissions begins with properfurnace design and careful operation. A proper designincludes: a furnace/grate system appropriate to thewaste; an adequate combustion gas retention time andvelocity in the secondary combustion chamber; a suit-able underfire and overtire air system; and establishingthe optimum underfire/overfire air ratios.
(1) for compliance with NSPS it is necessary toutilize gas cleaning equipment and to optimizeoperating conditions for the furnace.
(2) Particulates. May be controlled with mechan-ical collectors; settling chambers; afterburners; and low efficiency scrubbers used asprecleaners. These must be followed by anelectrostatic precipitator or a high efficiencyventuri/orifice scrubber for final cleaning. Fab-ric filters may be used if emissions gas tem-perature is maintained below the maximumtemperature rating of fabric media being used.This will usually require water spray injectionfor evaporative cooling of the gas stream.
(3) Odor control is frequently required and can beaccomplished with after-burners strategicallylocated in the furnace to oxidize the odorousgases.
b. Industrial and commercial incinerators. Designof the incinerators and emissions control requirementsare greatly influenced by the composition of the solidwaste that is incinerated.
(1) Single chamber and conical (Teepee) typeincinerators will not meet current NSPS emis-sion requirements.
(2) Multiple chamber incinerators with controlled-combustion features, and fluidized-bed incin-erators including sludge incinerators may beequipped with one or more of the previouslydiscussed or following gas-cleaning systems tomeet NSPS.
(3) When particulates are the controlled pollutant,primary collection devices commonly used are:after-burners; mechanical collectors; wettedbaffles; and spray chambers.
(4) The final collection of small particulate mate-rial is usually accomplished with one of thefollowing devices:
-venturi or orifice-type scrubber-electrostatic precipitator-fabric filter.
c. Incinerator vapor and odor control. Objection-able vapors and odors in incinerator exhaust streamssometimes necessitate specialized control systems.Odorous components present downstream of con-ventional cleaning systems are usually organic in gas-eous or fine particulate form. Several methods availablefor their control are discussed below.
(1) Afterburners. Direct thermal incineration canbe utilized to oxidize odorous fumes. A fumeincineration system, or afterburner, basicallyconsists of a gas or oil-fired burner mounted toa refractor-lined steel shell. Odorous vaporsand particulate matter are exposed to a hightemperature flame (1200 to 1400 degrees Fahr-enheit) and are oxidized into water vapor andcarbon dioxide. The principal advantages ofdirect thermal incineration of odorous pollu-tants are simplicity, consistent performance,easy modification to accommodate changes instandards, and ease of retrofit. The major dis-advantage is the uncertainty and expense offuel supply usually natural gas.
(2) Vapor condenser. Vapor condensers are uti-lized to control obnoxious odors, particularlyin processes where the exhaust gases containlarge quantities of moisture. Condensers canbe either the direct contact type, or shell andtube surface condensers. The resulting con-densate is rich in odorous material and can besewered of treated and disposed of by otherconventional methods. (See paragraph 7-4 forfurther information on treatment and disposalof waste materials.) Condensers are often usedin conjunction with an afterburner. In such asystem, exhaust gases are condensed toambient temperature before incineration,reducing gas stream volume by as much as 95percent and reducing moisture content.Lowering gas volume and moisture content cansubstantially reduce the cost and fuel require-ments of the afterburner assembly.
(3) Catalytic oxidation. Incineration of odorouspollutants in the presence of a suitable catalystcan lower the temperature required for com-plete combustion and reduce the overall reac-tion time. Advantages of catalytic oxidationare:
12-5

TM 5-815-1/AFR 19-6
-Smaller units required because lower gas tem-peratures reduce gas volume,
-Less oxygen required in the effluent streamsince catalyst promotes efficient use of oxy-gen,
-Lower NOx emissions due to lower flame tem-peratures and reduced oxygen loads.
(4) The principle disadvantages are:-High initial capital equipment costs-Periodic replacement of expensive catalysts
(5) Absorbers. Absorption systems for odor con-trol involve the use of selected liquid absor-bents to remove odorous molecules fromeffluent gases. The gas to be absorbed shouldhave a high solubility in the chosen absorbentor should react with the absorbing liquid. Vari-ous methods are used to affect intimate contactof liquid absorbent and gaseous pollutant.
12-7. Technical evaluation of controlequipment
a. Given the site-specific ambient air qualityrequirements, and the NSPS emissions limitations,and then comparing them with the uncontrolled emis-sions data for the combustor, it becomes possible tomake a selection of various emissions controls systemsto meet the emission restraints. Required is a knowl-edge of the various emissions control devices and theirapplication to specific problems including their sizingand operation.
b. Other factors which must be evaluated in select-ing control equipment include: site compatibility; dis-position of the collected pollutant; installation andoperation costs; maintainability; and the ability toprovide continuous protection during operation of thecombustion units. Tables 12-1 and 12-2 offer a com-parison of these characteristics to serve as an aid in thefinal determination of the best control system for aparticular application.
c. Specific operating characteristics that should becompared in evaluating suitable collection equipmentare listed below. Each control device section of thismanual should be consulted for specific descriptions ofvarious control equipment.
(1) Temperature and nature of gas and particles.Collection equipment must be compatible withoperating temperatures and chemical composi-tion of gas and particles.
(2) Collector pressure loss. The power require-ment for gas-moving fans can be a major cost inair pollution control.
(3) Power requirement. Electrostatic pre-cipitators, scrubbers, and fabric filters haveadditional electrical requirements beside fanpower.
(4) Space requirement. Some control equipmentrequires more space than others. This factor
12-6
may, in certain cases, preclude the use of other-wise satisfactory equipment.
(5) Refuse disposal needs. Methods of removal anddisposal of collected materials will vary withthe material, plant process, quantity involved,and collector design (chap 6, 7, and 9). Collec-tors can be unloaded continuously, or inbatches. Wet collectors can require additionalwater treatment equipment and if the polluta-tion control device uses water directly or indi-rectly, the supply and disposal of used watermust be provided for.
12-8. Tradeoffs and special considerationsa. Design considerations. In order to design equip-
ment to meet air pollution control requirements, thetop output or maximum ratings should be used in theselection of control equipment. The additional cost forextra capacity is negligible on the first cost basis, but alater date addition could cost a substantial sum. Itshould also be noted whether the dust-generating pro-cess is continuous or cyclic, since an average dust con-centration design may not satisfy high emissions atstart-up or shut-down. Cyclic operation could also leadto problems in terms of equipment performance rela-tive to high or low temperatures and volumes. Duct-work providing good gas distribution arrangements fora specific volume could cause significant problems if thegas volume were to increase or decrease.
b. Reliability of equipment. Since particulate con-trol equipment is relatively expensive, and due to thefact that it is usually an integral part of the powergeneration process, it is of utmost importance that theequipment provide reliable service. Wrong choices offabric for fabric filters; wrong materials of constructionfor wet scrubbers; the wrong choice of a multicyclone toachieve high efficiency on fine particles; can all lead tocollector outages, or complete failure. Collectorfailures may be accompanied by a loss of production orby expensive replacement with new devices. Evalua-tion trade-offs should be made between costs for anauxiliary control unit and the cost of shutting down theentire process due to collector failure.
c. Space allowance. Special consideration by thedesign engineer must be given to provide space in theplanned plant layout for adding more pollution controlequipment in the future. Future plant modificationswill in most cases have to meet more stringent stand-ards than the existing NSPS.
d. Gas cooling. When high temperature (greaterthan 450 degrees Fahrenheit) exhaust gasses are beinghandled, a study should be made on the cost of install-ing equipment to operate at the elevated temperatureversus the cost and effects of gas cooling.
e. Series operation of collectors. Dust collectors maybe used in series operation for the following reasons:
(1) A primary dust collector acts as a precleaner to

TM 5-815-1/A
FR 19-6
12-7

TM 5-815-1/A
FR 19-6
12-8

TM 5-815-1/AFR 19-6
(3) Utilizing a primary and secondary collector inseries provides some flexibility to the systemin the event there is a failure of one of thecollectors.
f. Wet vs. dry collection. Factors to be taken intoconsideration in a comparison of wet and dry collectioninclude:
-Solubility of aerosol-Ultimate pH of scrubbing liquor-Liquor corrosion and erosion potential-Special metals or protective coatings-Availability of make-up water-Disposal and treatment of waste water-Space required for liquid-handling equipment-Vapor plume visibility-Operating and installed costs-Maintenance and operation
g. Summary. A summary of the general guidelinesin the selection of emission control equipment for boilerflue gases is provided in table 12-3.
prevent plugging, reduce abrasions, or reducethe dust loading to the secondary collector.The addition of a precleaner adds pressuredrop and costs, and should only be appliedwhere the performance of the secondary isinadequate without a primary collector of thetype proposed.
(2) Mechanical collectors of the multicyclone typeare usually the first choice for primary collec-tor service. They are low cost; provide reliablecollection of large diameter suspended solids inthe 85 percent collection efficiency range; andcan be specified in a wide variety of wear resis-tant metals. There are very few NSPS applica-tions where the single or (in series) doublemechanical collector can meet the particulateemission standards. Consequently, a finalcleaning device of high efficiency on small sizeparticulate should follow the mechanical collec-tor.
12-9

TM 5-815-1/AFR 19-6TABLE 12-3
GENERAL GUIDELINES IN THESELECTION OF EMISSION CONTROL EQUIPMENT FOR BOILER FLUE CASES
Statement onemission regu-lations
No. 2 fuel(distillate)
Wood and woodwastes
Pulverized co.1(compliance)- low sulfur -
Pulverized co.1(high sulfur)
12-10
Boilers with less than100 million Btu input
1. Are not regulated by theEPA’s present new sourceperformance standards.
2. Local and state air emissionregulations prevail. Moststates enforce laws whichlimit the rate of emissionsbased on a process weightformula designed to allowhigher emission rates forthe smaller boilers anddecreasing the rate as thefurnace input increases.
3. Controls are usually forparticulate, sulfur dioxideand NOx. Limits areusually expressed in poundsper hour or tons per year.
1. No control device. needed.2. Laws usually cover partic-
ulate and NOx.
1. No control device. needed.2. Laws usually cover partic-
late and NOx.
1. Particulate control bymulticlone mechanical col-lector.
2. SO2 and NOx are notcontrolled.
1. Particulate control bymulticlone mechanicalcollector.
2. SO2 controlled by use oflow sulfur coal.
1. Particulate and NOx aresame as compliance coal.
2. Where state limits will beexceeded by S02, the hour.of operation will have to belimited or an SO2 scrubberwill be required.
Boilers with 100 to209 million Btu input
1. Presently the laws arethe same as the smallerunits. However, the EPAhas proposed changes inthe laws which wouldinclude boilers in thissize range in their reg-ulations.
2. Timing for the adoptionor if in fact thisbecomes law is conjec-ture at this time.
1. Presently same as smallerboilers.
1. Presently same as smallerboilers.
1. Particulate usually con-by two multiclone col-lectors in series.
2. SO2 and NOx are notusually controlled.
1. Particulate controlledby two mechanical collec-tors in series up to+ 150 mm BTU.
2. Above the 150 mm BTU sizeit usually requires anelectrostatic precipita-tor or baghouse to meetcodes.
3. SO2 controlled by lasulfur coal.
4. NOx controlled byproperly adjusted com-bustion controls andspecial method. of dis-tributing combustion air.
1. Particulate and NOx arecontrolled the same ason low sulfur coal.
2. SO2 emissions areusually controlled by awet scrubber in serieswith an electrostaticprecipitator and locateddown stream of the I.D.fan. Dry scrubbers areemployed in series witheither a baghouse orelectrostatic precipita-tor. The dry scrubber islocated directly upstream of the particu-late collector.
Boilers with 250 million Btu furnace inputand larger
1. All boilers this size must meet EPA’s newsource performance standards (NSPS)CO.1 0.1 lb/mm Btu of particulate
1.2 lb/mm Btu of SO2
0.7 lb/mm Btu of NOx
20% opacityFuel Oil 0.1 lb/mm Btu of particulate
0.8 lb/mm Btu of SO2
0.3 lb/mm Btu of NOx
20% opacityNat. Gas. 0.1 lb/mm Btu of particulate
0.2 lb/mm Btu of NOx
2. All boilers must also meet (l) above stateand local ambient air quality standards.The NSPS represent the maximum stackemissions allowed and in a great manycases will not meet the ambient air qualitystandards; in these cases emission ratesare met by the best available controltechnology (BACT).
1. No particulate control required.2. NOx - requires proper burners, furnace
and combustion control design.
1. No particulate control required.2. NO SO2 control device. usually needed.3. NOx requires proper burner and furnace
design and properly adjusted combustioncontrol..
1. Particulate is controlled by:a. a mechanical collector followed by a
wet scrubber;b. a mechanical collector followed by ESP
2. SO2 is not controlled.3. NOx is controlled by properly adjusted
combustion control. and special methods ofdistributing combustion air.
1. Particulate controlled by:a. an electrostatic precipitator;b. a baghouse;c. a mechanical collector followed by
either a or b.2. SO2 controlled by low sulfur quantity
in coal.3. NOx is controlled by properly adjusted
combution controls and special method.of distributing combustion air.
1. Particulate and NOx arc controlled thesame as shown for low sulfur coal.
2. SO2 is controlled by either a wet or adry scrubber.- Wet scrubbers are usually located just up
stream of the stack.- Dry scrubbers are located directly
upstream of either the baghouse or theelectrostatic precipitator.
U.S. Army Corps of Engineers

TM 5-815-1/AFR 19-6
CHAPTER 13
FLUIDIZED BED BOILERS
13-1. Fluidized bed boilers.a. Fluidized bed combustion has now progressed
through the first and into the second and third genera-tion of development. Fluidized bed technology is notnew but has been revived in this country because of fuelcosts and the availability of poor quality fuels. Commer-cial and industrial power plants now have a third type ofsolid fuel boiler to consider for steam requirements.Economics, fuel pricing, availability of low grade fuelsand environmental considerations have made the fluid-ized bed boiler a viable option to evaluate along with thestoker or pulverized coal fired units. The units can withcare be designed to burn a number of fuels including lowgrade coals, lignite, coal mine wastes (culm), refinerygas, woodwastes, waste solvents, sludge, etc.
b. Fluidized bed combustion offers the ability toburn high sulfur coal and meet environmental require-ments without the use of scrubbers. The mixture of fueland limestone is injected in such a way that the fuel andlimestone are distributed across the bed. The fuel andlimestone are kept in turbulent motion by upward airflow from the bottom of the furnace. The furnace com-bustion takes place at about 1550 degrees Fahrenheit to1750 degrees Fahrenheit. Control of sulfur dioxide andnitrogen oxide emissions in the combustion chamberwithout the need for additional control equipment isone of the major advantages over conventional boilers.
13-2. Types of fluidized bed boilers.a. Fluidized bed boilers cover a variety of systems.
There is no unique design. An industrial fluidized bedboiler could assume several possible configurationsdepending on such factors as bed pressure, the choicebetween natural or assisted circulation, the gas velocityin the bed, fuel and air distribution systems, bed designand method of achieving high carbon utilization andcontrol of sulfur dioxide.
b. There are four types which will be given consider-ation for control of sulfur dioxide and nitrogen oxideemissions. These are shown in figure 13-1 and size isalso compared for a 50 million Btu/hour heat input unit.
c. The types can further be demonstrated by com-paring them as stationary fluid bed (bubbling bed) orcirculating bed designs. To determine this type, therelationship between the gas velocity and the differen-tial pressure in the fluidized bed must be established.Figure 13-2 shows this relationship for various beddesigns.
d. The fluidized bed is a system in which the airdistributed by a grid or distribution plate, is blownthrough the bed ‘solids developing a “fluidized con-dition.” Fluidization depends largely on the particlesize and the air velocity. At low air velocities, a densedefined bed surface forms and is usually called a bub-bling fluidized bed. With higher air velocities, the bed
U.S. Army Corps of Engineers
Figure 13-l. Types of fluid bed combustors size comparison
13-1

TM 5-815-1/AFR 19-6
GAS
-> LOG (VELOCITY)PRESSURE DROP VS GAS VELOCITY
Courtesy of Pyropower Corporat ion
Figure 13-2. Pressure drop vs. gas velocity
particles leave the combustion chamber with the fluegases so that solids recirculation is necessary to main-tain the bed solids. This type of fluidization is calledcirculating fluidized bed.
e. The mean solids velocity increases at a slower ratethan does the gas velocity, as illustrated in figure 13-3.Therefore, a maximum slip velocity between the solidsand the gas can be achieved resulting in good heattransfer and contact time with the limestone, for sulfurdioxide removal. When gas velocity is furtherincreased, the mean slip velocity decreases again.These are the operating conditions for transport reac-tor or pulverized coal boiler. The design of the fluidizedbed falls between the stoker fired boiler and the pul-verized coal boiler using the bed expansion.
f. The shallow fluidized bed boiler operates with asingle bed at a low gas velocity. A shallow bed mini-mizes fan horsepower and limits the free-board space.The bed depth is usually about 6 inches to 9 inches and
13-2
the free-board heights are only four to five feet.Desulfurization efficiency of a shallow bed is poor, withonly about 60 to 80 percent removal, because SO2 doesnot have adequate time to react with the limestonebefore moving out of the shallow bed. The shallow bedfluidized boiler is of the bubbling bed design. The shal-low bed will be of very limited use because of its poorsulfur dioxide removal.
g. A deep fluidized bed boiler is a bubbling beddesign.
(1) The bed depth is usually 3 feet to 5 feet deepand the pressure drop averages about one inchof water per inch of bed depth. The bulk of thebed consists of limestone, sand, ash, or othermaterial and a small amount of fuel. The rate atwhich air is blown through the bed determinesthe amount of fuel that can be reacted. Thereare limits to the amount of air that can be blownthrough before the bed material and fuel are

TM 5-815-1/AFR 19-6
Courtesy of Combustion Engineering, Inc.
Figure 13-3. Velocity vs. bed expansion
entrained and blown out of the furnace. Con-versely, when air flow is reduced below theminimum fluidizing velocity, the bed slumpsand fluidization stops.
(2) The fuel feed systems available are eitherunder-bed feed system or over-the-bed feedsystem. The under-bed feed system is quitecomplex. It requires coal at less than 8 percentsurface moisture and crushed to about 6 MMtop size to minimize plugging the coal pipes.Operating and maintenance costs are usuallyhigh for the under-bed feed system. The majoradvantage of the under-bed feed system is thatwith use of recycle combustion efficiencyapproaches 99 percent. The over-bed feed sys-tem is an adaptation of the spreader stokersystem for conventional boilers. This systemhas a potential problem ofeffective carbon uti-lization. Carbon elutriation can be as high as 10percent.
(3) Some bubbling bed units have sectionalized ormodular design for turndown or load response.This allows a section to be cut in or out asrequired. Some are actually divided with watercooled or refractory walls. This type unitshould be matched to the facility demand pro-file to avoid continual bed slumping and oper-ator attention. When continuous stopping of
sections is required to control load forextended periods, the fluidized bed boiler maybecome a big user of auxiliary fuel to maintainbed temperature.
(4) Major limitations of the bubbling bed designare high calcium/sulfur ratios, low combustionefficiency, limited turndown without sec-tionalization of the furnace bottom and com-plexity of the under bed feed system requiredto minimize elutriation of unburned fines. Typ-ical fluidized bed combustors of this type areshown in figures 13-4 and 13-5.
h. In the circulating fluidized bed boiler, the fuel isfed into the lower combustion chamber and primary airis introduced under the bed.
(1) Because of the turbulence and velocity in thecirculating bed, the fuel mixes with the bedmaterial quickly and uniformly. Since there isnot a definite bed depth when operating, thedensity of the bed varies throughout the sys-tem, with the highest density at the levelwhere the fuel is introduced. Secondary air isintroduced at various levels to ensure solidscirculation, provide stage combustion for NOx
reduction, and supply air for continuous finescombustion in the upper part of the combus-tion chamber.
(2) Combustion takes place at about 1600 degrees
13-3

TM 5-815-1/AFR 19-6
Courtesy of Foster Wheeler Energy Corporat ion
Figure 13-4. Bubbling bed boiler I
Fahrenheit for maximum sulfur retention. Thehot gases are separated from the dust particlesin a cyclone collector. The materials collectedare returned to the combustion chamberthrough a nonmechanical seal, and ashes areremoved at the bottom. The hot gases from thecyclone are discharged into the convection sec-tion of a boiler where most of the heat isabsorbed to generate steam. Typical fluidizedbed boilers of this type are as shown in figure13-6.
(3) Major performance features of the circulatingbed system are as follows:
(a) It has a high processing capacity because ofthe high gas velocity through the system.
(b) The temperature of about 1600 degreesFahrenhei t i s reasonably constantthroughout the process because of the high
turbulence and circulation of solids. Thelow combustion temperature also results inminimal NOx formation.
(c) Sulfur present in the fuel is retained in thecirculating solids in the form of calcium sul-phate so it is removed in solid form. The useof limestone or dolomite sorbents allows ahigher sulfur retention rate, and limestonerequirements have been demonstrated tobe substantially less than with bubblingbed combustor.
(d) The combustion air is supplied at 1.5 to 2psig rather than 3-5 psig as required bybubbling bed combustors.
(e) It has a high combustion efficiency.(f) It has a better turndown ratio than bub-
bling bed systems.
13-4
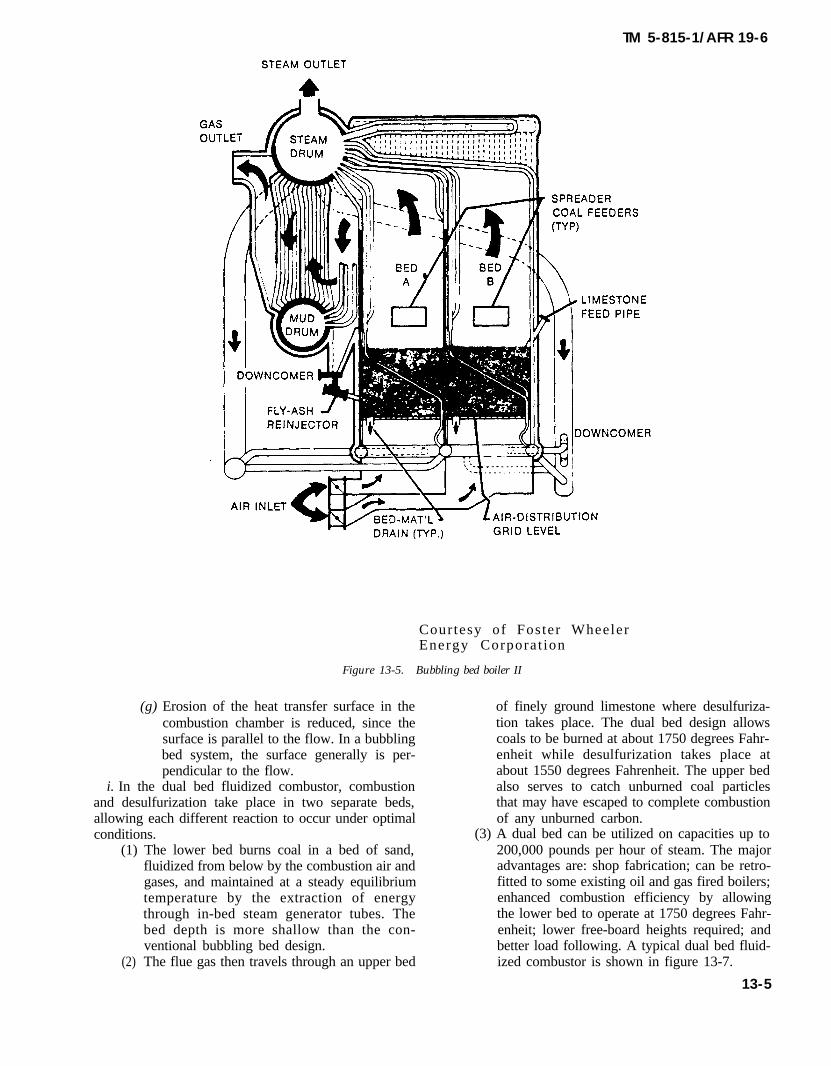
TM 5-815-1/AFR 19-6
Courtesy of Foster WheelerEnergy Corporat ion
Figure 13-5. Bubbling bed boiler II
(g) Erosion of the heat transfer surface in thecombustion chamber is reduced, since thesurface is parallel to the flow. In a bubblingbed system, the surface generally is per-pendicular to the flow.
i. In the dual bed fluidized combustor, combustionand desulfurization take place in two separate beds,allowing each different reaction to occur under optimalconditions.
(1) The lower bed burns coal in a bed of sand,fluidized from below by the combustion air andgases, and maintained at a steady equilibriumtemperature by the extraction of energythrough in-bed steam generator tubes. Thebed depth is more shallow than the con-ventional bubbling bed design.
(2) The flue gas then travels through an upper bed
of finely ground limestone where desulfuriza-tion takes place. The dual bed design allowscoals to be burned at about 1750 degrees Fahr-enheit while desulfurization takes place atabout 1550 degrees Fahrenheit. The upper bedalso serves to catch unburned coal particlesthat may have escaped to complete combustionof any unburned carbon.
(3) A dual bed can be utilized on capacities up to200,000 pounds per hour of steam. The majoradvantages are: shop fabrication; can be retro-fitted to some existing oil and gas fired boilers;enhanced combustion efficiency by allowingthe lower bed to operate at 1750 degrees Fahr-enheit; lower free-board heights required; andbetter load following. A typical dual bed fluid-ized combustor is shown in figure 13-7.
13-5

TM 5-815-1/AFR 19-6
Courtesy of Pyropower Corporation
Figure 13-6. Circulating fluid bed boiler system
13-3. Applicationsa. Fuel Application.(1) A wide range of high grade and low grade fuels of
solid, liquid or gaseous type can be fired. The primaryapplications are fuels with low heating value, high sul-fur, waste materials, usually the least expensive. Fuelcan be lignite, coal washing waste (culm), high sulfurcoal, delayed petroleum coke, or waste material thatwould not burn satisfactorily in a conventional boiler.The fluidized bed boiler has the ability to burn most anyresidual fuel and reduce emissions by removal of sulfurcompounds in the limestone bed.
13-6
(2) A complete evaluation of fuels to be burnedshould be given consideration in selection ofthe equipment. Many factors including heatingvalue, moisture, ash fusion temperature, sul-fur content, and ash content will affect thesystem configuration.
(3) Fuel sizing is important. For coal it is recom-mended that it not be run-of-mine. It should becrushed to avoid large rocks and pieces of coalcausing problems in the bed. Coal sizing isimportant and will vary with each fluidized bedmanufacturer. Typically, sizing will vary from

TM 5-815-1/AFR 19-6
WORMSER GRATE FLUIDIZED BED COAL COMBUSTION SYSTEM
Copyright (c) 1983. Oman Publishing,I n c . , reprinted from Meat Industry,May, 1983, with permission.
Figure 13-7. Dual bed fluidized bed boiler
0-¼ inch x 0 for overfeed systems to ¼ inch x ity location may dictate Best Available Control0 for underfeed systems. Technology (BACT) be used to control SO2 and
b. Process application. NO2 emissions.(1) The fluidized bed can be utilized to control SO2
emissions when high sulfur fuels are used.Also reduction of SO2 emissions can beachieved when nonattainment areas are look-ing for additional steam for process. The capa-bility of fluidized bed combustion to controlemissions makes this technology particularlysuited for applications where stringent emis-sions control regulations are in effect.
(3) Nitrogen oxide emissions can be controlledwith a fluidized bed boiler. The fluidized bedboiler generates very little thermal nitrogenoxide because of the low temperature of opera-tion.
(2) Steam generation in a fluidized bed boiler ver-sus a conventional boiler will not be economicalwhen using compliance coal for control of sulfurdioxide emissions. However, several studiesindicate that fluidized bed boilers are competi-tive with conventional coal fired boilers thatinclude flue-gas desulfurization systems. Facil-
(4) Pressurized fluidized bed boilers continue inresearch and development. Higher efficiencydesigns for utility applications involve consid-erably higher initial costs and design complex-ity. Also, a cost effective way to clean up thehot flue gases before they reach the turbine hasnot been found.
(5) The fluidized bed boiler can be used to incine-rate low grade fuels that would be normallyconsidered waste residues.
13-7

TM 5-815-1/AFR 19-6
13-4. Fluidized bed performancea. With the exception of a baghouse or precipitator,
which is required for particulate removal, additionalgas cleaning devices are not required for environmentalcontrol with fluidized bed systems.
b. Fluidized bed boilers are able to remove sulfurdioxide directly in the combustor. This is accomplishedby using limestone in the fluid bed. The limestonecalcines to form calcium oxide (CaO) and then reactswith SO2 to form calcium sulfate as follows:
C a C O3 > CaO + CO2
C a O + S O2 + l/2 02 > CaSO4
The ideal temperature range for desulfurization in afluidized bed is about 1600 degrees Fahrenheit.
c. A bubbling fluidized bed boiler will require ahigher calcium to sulfur ratio for control of SO2, whilethe circulating fluidized bed boiler can achieve similarSO2 removal with the Ca/S ratio of 1.5 to 2. See figure13-8.
d. Nitrogen oxide is controlled by distribution ofprimary air under the bed and secondary air part wayup the combustor. The staging of combustion limits thenitrogen oxide to that which is formed only by fuel-bound nitrogen. Thermally formed nitrogen oxide isnegligible in the fluidized bed. See figure 13-9 forpredicted nitrogen oxide emissions.
e. Several fluidized bed boiler manufacturers arenow offering performance guarantees based upon expe-rience in the bubbling, circulating, and dual beddesigns.
13-5. Materials and constructionThe materials used for construction of fluidized bedunits are similar to those used in conventional boilersdepending on the design pressure and temperature ofthe system.
a. In-bed tubes. The fluidized bed boilers that havein-bed tubes have experienced high erosion rates insome cases. Vertically oriented tubes are less prone toerosion than the horizontal ones. Where in-bed tubesare used, consideration should be given to use of thickerwalls on the tubes and their metallurgy. Wear fins canbe installed to reduce erosion. Also, some corrosionmay be experienced due to the reducing atmosphere inthe lower regions.
b. Fluidized bed. The fluidized bed or bottom of thecombustor section varies considerably with each typeof design. The method used for air distribution is impor-tant in maintaining uniform fluidization across the bed.Some units have had problems with plugging of the airopenings. The bottom is castable refractory-lined onsome units. Others have heat transfer tubes protected
BED TEMPERATURE, °F
Copyr ight (c ) 1982, TAPPI .Reprinted from TAPPI JOURNAL, Vol.6 5 ( 1 2 ) , p p . 5 3 - 5 6 , w i t h p e r m i s s i o n .
Figure 13-8. SO2 reduction vs. combustion temperature
13-8

TM 5-815-1/AFR 19-6
BED TEMPERATURE, °F
Copyr ight (c ) 1982, TAPPI .Reprinted from TAPPI JOURNAL, Volume6 5 ( 1 2 ) , p p . 5 3 - 5 6 , w i t h p e r m i s s i o n .
Figure 13-9. NOx emissions vs. combustion temperature
with abrasion resistant refractory in regions where thegas flow changes directions.
c. Cyclone. In the circulating fluidized bed unit, thecyclone separator is lined with refractory to minimizeabrasion and prevent heat losses.
d. Ash cooler. The ash cooler is also refractory linedto increase life of the unit due to abrasion of the solidsbeing handled.
13-6. Auxiliary equipmenta. The following briefly describes the major compo-
nents of auxiliary equipment for the fluidized bedboilers.
(1) Materials handling for fuel and limestone. Thehandling of fuel and limestone will varydepending on the source of supply and the typeof delivery. Delivery is usually by truck or rail
(2) The conveying systems for the fuel and lime-stone can be either a pneumatic or a mechan-
ical system. The mechanical system may bebelt, chain, bucket, or screw conveyor, or acombination of these.
(3) Coal can be stored in open piles or storagesilos. From storage, coal is fed to a crusher ordryer as required for efficient burning. Crush-ing of the coal is required when it is run-of-mine, for efficient burning, elimination of rocksin the bed, high moisture content, high ashcontent and when pneumatic conveying is nec-essary.
(4) Drying of the coal is recommended when thefuel moisture content exceeds fifteen percentfor all fluidized bed boilers except the circulat-ing fluidized bed boiler. The flue gas from thefluidized bed can be used for drying the fuel.
b. Coal feed stream splitter. The dual bed unit has aproprietary stream splitter which permits accuratefeed of coal to multipoints under the bed for maximumcombustion efficiency.
13-9

TM 5-815-1/AFR 19-6
c. Startup burners. Startup burners are supplied inthe bed or air ducts to heat the bed up to coal ignitiontemperature. The startup burner can be used for lowloads. Usually it is capable of carrying about 20 percentor more of boiler capacity.
d. Fluidized bed heat exchanger. The fluid bed heatexchanger is used to cool the ash to about 750 degreesFahrenheit. The coolant can be feedwater or any pro-cess fluid which requires heating. The metallurgy of theheat exchanger must be compatible with the fluids it ishandling.
e. Flue gas clean-up for particulate. Either an elec-trostatic precipitator or a baghouse may be used forparticulate control. Basic guidelines established fordetermining which type unit to use on a conventionalcoal fired unit may be used to select the particulatecontrol device for a fluidized bed boiler. Electrostaticprecipitators can encounter resistivity problemsbecause of the low sulfur content in the particulate to becollected.
f. Ash-handling systems.(1) The ash-handling systems are similar to ash-
handling systems for conventional boilers. Thebottom ash does have to be cooled prior todisposal. Most of the ash-handling systems aredry, and the ash can be sold for use in otherproducts.
(2) Some potential uses of the ash are: aggregatein concrete; road base ingredients; stabiliza-tion of soil embankments; pozzolan in masonryunits and mortar; agriculture and livestockfeeds extender; and neutralization of spentacid wastes.
13-7. Advantages and disadvantagesa. Advantage:
(1) Low SO2 emissions
(2) Low NOx emission due to staged combustionand changing of the primary to secondary airratio
(3) Only fuel bound nitrogen converted to NOx
(thermally formed NOx is negligible)(4) High combustion efficiency, (as high as 99 plus
percent) (5) High turn-down and load following ability(6) Uses a variety of fuels including:
-high sulfur-low BTU-high ash-low cost-waste materials
(7) High boiler efficiency (85 to 90 plus percent)(8) Load changes greater than 5% per minute(9) No re t rac table sootb lowers . Rotary
sootblower may be used(10) No slagging of coal ash(11) Low maintenance(12) Dry ash(13) Broad tolerance to changes in coal quality(14) Sulfur removal w/o need for scrubbers
b. Disadvantages:(1) Bed turn-down capability not clear(2) Startup procedures more complex(3) Control response almost instantaneous(4) Use of partial bed slumping as load control
mechanism for bubbling bed(5) Requirement of a free-board for combustion
efficiency for bubbling bed(6) Corrosion susceptibility in bubbling bed(7) Calcium-to-sulfur ratio greater than 2.5 causes
degradation of boiler efficiency(8) Fluidized bed is a newer technology than con-
ventional boilers(9) Complex under-bed fuel-feed system required
for some bubbling beds
13-10

TM 5-815-1/AFR 19-6
APPENDIX A
REFERENCES
Government Publ ica t ions .Department of Defense (DOD)DOD 4270.1-M
Departments of Army, Air Force, and NavyAR 11-28
AR 420-49/AFR 178-1
NAVFAC P-422
Construction Criteria Manual
Economic Analysis and Program Evaluations for ResourceManagementFacilities Engineering - Heating, Energy Selectionand Fuel Storage, Distribution and Dispensing SystemsEconomic Analysis Handbook
Executive Department, The White House, Washington, D.C. Excecutive Order No. 12003(July 1977) Relating to Energy Policy and Conservation.
Environmental Protection Agency (EPA), 401 M Street SW, Washington D.C. 20005AP 42 (May 1983) Compilation of Air Pollutant Emission Factors
EPA450/3-81-005 (Sept. 1982) Control Techniques for Particulate Emissions from StationarySources
Government Printing Office, N. Capital Street, NW, Washington, D.C. 20001Part 50, Title 40, Code of Federal Regulations Environmental Protection Agency Regulations on National
Primary and Secondary Ambient Air Quality Standards
Part 60, Title 40, Code of Federal Regulations Environmental Protection Agency Regulations on Standardsof Performance for New Stationary Sources
Part 53, Title 40, Code of Federal Regulations Environmental Protection Agency Regulations on AmbientAir Monitoring Reference and Equivalent Methods
Nongovernment Publ icat ions
TAPPI Journal, Technical Association of the Pulp and Paper Industry, P.O. Box 105113, Atlanta, GA. 30348Dec. 1982, (pp. 53-56). Fluidized Bed Steam Generation - An Update, by I.G.
Lutes.
McGraw Hill Publishing Company, 1221 Avenue of the Americas, New York, New York 10001Fifth Edition (1973) Perry’s Chemical Engineering Handbook by R.H.
Perry.
Addison-Wesley Publishing Company, Inc., Jacob Way, Redding, Massachusetts 01867(1963) Industrial Electrostatic Precipitators by Harry J. White
Air Pollution Control Association, P.O. Box 2861, Pittsburgh, Pennsylvania 15236APCA #69-162 (1969) The Effect of Common Variables on Cyclone Performance by
J. W. Schindeler.
John Wiley & Sons 605 Third Avenue, New York, New York 10158Fourth Edition (1964) Principles of Engineering Economy by E.L. Grant,
W. G. Ireson
Foster Wheeler Energy Corporation, 110 South Orange Avenue, Livingston, New Jersey 07039(1979) The Technology and Economics of Fluidized Bed Combustion
Combustion Engineering, Inc., 1000 Prospect Hill Road, Windsor, Connecticut 06095TIS-7537 (1984) Circulating Fluid Bed Steam Generation by L. Capuano, K.
Ataby, S.A. FoxA-1

TM 5-815-1/AFR 19-6
BIBLIOGRAPHY
“Coal Cleaning to Improve Boiler Performance and Reduce SO2 Emissions,” Power, Sept. 1981.“Combustion-Fossil Power Systems”, Combustion Engineering Co., Inc., 1981.“Fuel Flexibility High on List of Design Objectives for New Station,” Power, May 1982.Kelly, A.J., and Oakes, E., Pyropower Corporation, “Circulating Fluidized Bed Combustion Systems and Commer-
cial Operating Experience,” 1982 TAPPI Engineering Conference, San Francisco, CA.“Industrial Application of Fluidized-Bed Cogeneration System.”Kelly, W.R., J.M. Rourke, and Mullin, D.E.,
Chemical Engineering Progress, January 1984.Lund, T., Lurgi Corporation, “Lurgi Circulating Bed Boiler: Its Design and Operation,” Seventh International
Conference on Fluidized Bed Combustion, Philadelphia, PA. 1982.“Pollution Control,” Power, April 1982.Ramsdell, Roger G., “Practical Design Parameters for Hot and Cold Precipitators,” Paper presented at the
American Power Conference, Chicago, Illinois, May 1973.Schwieger, R. and J., “Special Report - Fluidized Bed Boilers”, Power, August 1982, Sl-S16.Smith, J.W., Babcock & Wilcox, “AFBC Boiler Development Accomplishments and Requirements.” 1982 TAPPI
Engineering Conference, San Francisco, CA.Steam-Its Generation and Use, 38th edition, Babcock and Wilcox, 1972.Yip, H. H. and Engstrom, F., Pyropower Corporation and Ahlstrom Company, “Operating Experience of Commer-
cial Scale Pyroflow Circulating Fluidized Bed Combustion Boilers. ” Seventh International Conference On Fluid-ized Bed Combustion, Philadelphia, PA. 1983.
Biblio-1

TM 5-815-1/AFR 19-6
GLOSSARY
Acid Dew PointActual Combustion Air
Air Register
Air-to-Cloth Ratio
°API
AshAtmospheric StabilityAtomizationBlinding (blinded)
Boiler (thermal) Efficiency
Burner
Calcine
Cloth Area
Cloth Weight
Co-CurrentCombustion Air WindboxCombustion Efficiency
Continuous Automatic FilteringSystem
Critical TemperatureDilution Air
Entrainment SprayESPExcess Air
Felted Fabrics
FilamentFlue Gas
Temperature at which acid vapor condenses to form acid droplets.The total amount of air supplied for complete combustion and equal to thetheoretical plus the excess air.A type of burner mounting which admits secondary air to the combustionarea.The rate of volumetric capacity of a fabric filter (volume of air or gas in ft 3/min per ft2 of filter fabric) commonly expressed as ft/min. Also calledfiltering velocity, superficial face velocity, and filtration rate.Scale adopted by the American Petroleum Institute to indicate the spe-cific gravity of a fluid. (API gravity for a liquid rises as its temperaturerises.)Non-combustible mineral matter which remains after a fuel is burned.Degree of non-turbulence in the lower atmosphere.The breaking of a liquid into a multitude of tiny droplets.Loading or accumulation of filter cake to the point where the capacity rateis diminished. Also termed “plugging” (Plugged).Ratio of useful heat in delivered steam to the theoretical gross heat in thefuel supplied.A device which positions a flame in a desired location by delivering fuel(and sometimes air) to that location. Some burners may also atomize thefuel, and some mix the fuel and air.To render a substance friable by the expulsion of its volatile contentthrough heat.The total amount of cloth area in the form of bags or envelopes in a fabricfilter system.A measure of filter fabric density. It is usually expressed in ounces persquare yard or ounces per square foot.Scrubbing spray liquid and exhaust gas flowing in the same direction.Inlet plenum for preheated combustion air.The actual combustion heat released divided by the maximum possibleheat that can be released by combustion of a fuel.A fabric filter unit that operates continuously, without interruption forcleaning. The flow pattern through the system is relatively constant.Temperature above which the substance has no liquid-vapqr transition.The air added downstream of the combustion chambers in order to lowerthe exhaust gas temperature (In incinerators).Atomized liquid downstream of scrubber spray nozzles.Electrostatic precipitator.The air remaining after a fuel has been completely burned (also, that airwhich is supplied in addition to the theoretical quantity required).Structures built up by the interlocking action of the fibers themselves,without spinning, weaving, or knitting.A continuous fiber element.All gases which leave the furnace by way of the flue, including gaseousproducts of combustion and water vapor, excess oxygen and nitrogen.
Glossary-l

TM 5-815-1/AFR 19-6
Fly Ash
Gas Absorption
Grain
Heat Content
Heat Release Rate (firing rate)
High Temperature FixationReaction
Horizontal Front Wall FiringHorizontal Opposed FiringImpactionIntermittent Filtering System
In. Water
Mass TransportMicronMultiple Chamber In-Line
Multiple Chamber Retort
Mulicompartment Baghouse
NO x
Overtire Air (Secondary Air)
Orsat Analysis
Permeability (of fabric)
Peak Flame TemperaturePlant Thermal Efficiency
Plenum (or Plenum Chamber)
Porosity (Fabric)
Preheated AirPrimary Combustion Temperature
Suspended particles, charred paper, dust, soot, or other partially burnedmatter, carried in the gaseous by-products of combustion. (Sometimesreferred to as particulate matter, or pollutants).A process for removing a gas constituent from an exhaust gas stream bychemical reaction between the constituent to be removed and a scrubbingliquor.
1 lb.Unit of weight, equal to7000
The sum total of latent and sensible heat stored in a substance minus thatcontained at an arbitrary set of conditions chosen as the base or zeropoint. Usually expressed as Btu/lb, Btu/gal, Btu/ft3 for solid, liquid andgaseous fuels, respectively.The amount of heat liberated during the process of complete combustionand expressed in Btu/hr/ft3 of internal furnace volume.Reaction between nitrogen and oxygen at a high temperature in airforming nitrogen oxides.Horizontal furnace firing with all burners located in the front wall.Horizontal furnace firing with burners located on directly opposing walls.Particle to liquid adherence from collision.A flow pattern in a fabric filter system which is saw-tooth-like. The flowcontinually decreases until it is stopped. Then cleaning takes place andflow is then again resumed at an increased value which again decreases,etc.Inches of water column used in measuring pressure. One inch of watercolumn equals a pressure of .036 lb/in2.Any process or force that causes a mass to flow through an open system.Unit of length, equal to 1 millionth of a meter.An incinerator design that allows combustion gases to flow straightthrough the incinerator with 90-degree turns in only the vertical direc-tion.An incinerator design that causes combustion gases to flow through 90-degree turns in both horizontal and vertical directions.A compartmented filter baghouse that permits a uniform gas flow patternas compartments are taken offline for cleaning.Nitrogen oxides.Any air controlled with respect to quantity and direction, which is sup-plied beyond the fuel bed (as through ports in the walls of the primarycombustion chamber) for the purpose of completing combustion of mate-rials in gases from the fuel bed. (Also used to reduce operating tem-peratures within the furnace and referred to as secondary air).An apparatus used to determine the percentages (by volume) of CO2, O2,and CO in flue gases.The ability of air (gas) to pass through filter fabric, expressed in ft 3 of airper min. per ft2 of fabric with .5” H2O pressure differential.The highest temperature achieved in the primary combustion zone.The actual power output of a plant divided by the theoretical heat inputrate.Part of a piping or duct flow system having a cross-sectional area consider-ably larger than that of any connecting ducts pipes or openings.A term often used interchangeably with permeability. (Actually a percen-tage of voids per unit volume).Air heated prior to its use for combustion, frequently by hot flue gases.Temperature measured at the flame.
Glossary-2

TM 5-815-1/AFR 19-6
Particles reentering the gas stream after having been captured in aparticulate collection device.The fairly stable matrix of dust that remains in a woven fabric after it iscleaned. It accounts for the relatively high collection efficiency of a wovenfabric immediately after cleaning.Four-cornered fuel firing to create a swirling flame pattern in a furnace.The exact amount of air required to supply oxygen for complete combus-tion of a given quantity of a specific fuel.The maximum possible flame temperature from burning a fuel.The number of warp and filling yarns per inch in woven cloth.Any air controlled with respect to quantity and direction, forced orinduced and supplied beneath the grate, that passes through the fuel bed.The quantity (measured in units of volume) of a fluid flowing per unit oftime, as ft3/min or gal/hr.Fabric produced by interlacing strands at approximate right angles.Lengthwise strands are called warp yarns and cross-wise strands arecalled filling yarns.
Reentrainment (re-entrainment)
Residual Dust Accumulation
Tangential FiringTheoretical Air
Theoretical Flame TemperatureThread CountUnderfire Air
Volume Flow Rate
Woven Fabric
LIST OF ABBREVIATIONS USED IN THIS MANUAL
Actual Cubic Feet per MinuteBest. Available Control TechnologyBritish Thermal Units per HourCarbon DioxideCarbon MonoxideCubic Feet per MinuteDegrees FahrenheitDepartment of DefenseDry Standard Cubic Feet, per MinuteElectrostatic PrecipitatorsFeet per MinuteFeet per SecondFlue Gas DesulfurizationGrains per Cubic FootGrains per Square MeterGrains per Standard Cubic Foot
Micro-grams per Cubic MeterMili-amperesMillion British Thermal Units
Municipal Solid WasteMonthNational Ambient Air Quality StandardsNavy Energy and Environmental Support ActivityNew Source ReviewNew Source Performance StandardsNitrogen DioxideNitric OxideNitrogen OxidesNon-attainment (in conjunction w/PSD)OzonePercent
1)2)
(ACFM)(BACT)(Btu/hr)
(CO2)(CO)(CFM)(Deg F)(DOD)(DSCFM)(ESP’s)(Ft/Min)(Ft/Sec)(FGD)(Gr/Ft 3)(Gr/M2)(Gr/Std. Ft3)
(Ug/M3)(mA)(Mil Btu)(MM Btu)(MSW(Mo)(NAAQs)(NEESA)(NSR)(NSPS)(NO2)(NO)(NOx)(NA)( 03)(%)
Glossary-3

TM 5-815-1/AFR 19-6
PoundPounds per Square InchPrevention of Significant DeteriorationRefuse Derived FuelsSquare FeetSquare MeterSulfur DioxideSulfur OxidesSulfur TrioxideU.S. Environmental Protection Agency
U.S. Army Environmental Hygiene AgencyYear
(lb)(Lb/in 2)(PSD)(RDF)(Ft 2)(m2)(S0 2)(SOx)(SO3)
1 ) ( U S E P A )2) (EPA)
(USAEHA)(Yr)
Glossary-4

The proponent agency of this publication is the Office of the Chief of Engineers, United States Army.Users are invited to send comments and suggested improvements on DA Form 2028 (RecommendedChanges to Publications and Blank Forms) direct to HQ USACE (CEEC-EE), WASH., DC 20314-1000.
By Order of the Secretaries of the Army and the Air Force:
Official:R. L. DILWORTHBrigadier General, United States ArmyThe Adjutant General
CARL E. VUONOGeneral, United States ArmyChief of Staff
Official:Larry D. Welch, General, USAFChief of Staff
William O. NATIONS, Colonel, USAFDirector of Information Managementand Administration
Distribution:,Army: To be distributed in accordance with DA Form 12-34B, requirements for Energy Monitoring and
Control Systems (EMCS).Air Force: F