tm2008-281 investigating visual alerting in maritime ... investigating visual alerting in maritime...
TRANSCRIPT

Defence R&D Canada – Atlantic
DEFENCE DÉFENSE&
Investigating Visual Alerting in Maritime
Command and Control
Jacquelyn M. Crebolder
Jeffrey Beardsall
Technical Memorandum
DRDC Atlantic TM 2008-281
December 2008
Copy No. _____
Defence Research andDevelopment Canada
Recherche et développementpour la défense Canada

This page intentionally left blank.
Investigating Visual Alerting in Maritime Command and Control
Jacquelyn M. Crebolder Jeffrey Beardsall
Defence R&D Canada – Atlantic
Technical Memorandum
DRDC Atlantic TM 2008-281
December 2008
Principal Author
Jacquelyn Crebolder
Approved by
Francine Desharnais
Maritime Information and Combat Systems Secion Head
Approved for release by
Calvin Hyatt
Chair DRP
In conducting the research described in this report, the investigators adhered to the policies and procedures set out in the Tri-Council Policy Statement: Ethical conduct for research involving humans, National Council on Ethics in Human Research, Ottawa, 1998 as issued jointly by the Canadian Institutes of Health Research, the Natural Sciences and Engineering Research Council of Canada and the Social Sciences and Humanities Research Council of Canada.
© Her Majesty the Queen in Right of Canada, as represented by the Minister of National Defence, 2008
© Sa Majesté la Reine (en droit du Canada), telle que représentée par le ministre de la Défense nationale, 2008
Original signed by Jacquelyn Crebolder
Original signed by Francine Desharnais
Original signed by Ron Kuwahara for
DRDC Atlantic TM 2008-281 i
Abstract ……..
Two experiments were conducted to investigate automated visual alerting in complex environments where operators rely on multiple display workstations to perform high-intensity tasks. The Halifax Class frigate is an example of such an environment; where the auditory modality is over-taxed and where visual alerts might be an alternate means for alerting operators. The two experiments investigated the ability to detect two types of visual alerts, and alerts appeared on the three displays making up the workstation. In Experiment 1, a flashing border surrounding the perimeter of the display screen was compared to a static sidebar alert positioned on the outer left side of the screen. In Experiment 2 a complete counterbalance of factors was achieved whereby both border and sidebar alerts were presented as flashing and static. Results showed that the sidebar alert was detected faster than border alerts regardless of whether it was flashing or static, and in general, sidebar alerts were detected faster when they appeared on all three displays as compared to one display. Future work will focus on examining the association between the display an alert appears on and the spatial location of operator attention.
Résumé ….....
Deux expériences ont été effectuées en vue d’étudier les alertes visuelles automatisées dans des environnements complexes où les opérateurs s’appuient sur des postes de travail d’affichage multiples pour réaliser des tâches à haute intensité. La frégate de la classe Halifax est un exemple d’un tel environnement, où le mode audible est surchargé et où les alertes visuelles pourraient devenir une solution de rechange pour alerter les opérateurs. Les deux expériences ont porté sur l’étude de la capacité à détecter deux types d’alertes visuelles et les alertes étaient présentées sur les trois écrans qui forment le poste de travail. Dans l’expérience 1, une bordure clignotante entourant le périmètre de l’écran a été comparée à un trait vertical statique placé du côté gauche extérieur de l’écran. Dans l’expérience 2, on a atteint un contrepoids de facteurs complet où les alertes à bordure et à trait vertical étaient toutes deux présentées comme clignotantes et statiques. Les résultats ont démontré que l’alerte à trait vertical était détectée plus rapidement que les alertes à bordure, que ces dernières soient clignotantes ou statiques, et qu’en général, les alertes à trait vertical étaient détectées plus rapidement lorsqu’elles étaient affichées sur les trois écrans au lieu de sur un seul écran. Les travaux futurs seront concentrés sur l’étude de l’association entre l’écran sur lequel est affichée une alerte et l’emplacement spatial de l’attention de l’opérateur.

ii DRDC Atlantic TM 2008-281
This page intentionally left blank.
DRDC Atlantic TM 2008-281 iii
Executive summary
Investigating Visual Alerting in Maritime Command and Control
Jacquelyn Crebolder; Jeffrey Beardsall; DRDC Atlantic TM 2008-281; Defence R&D Canada – Atlantic; December 2008.
Introduction or background:
The Halifax Class Frigate operations room is a busy, complex, and frequently noisy, environment where information from multiple sensors is monitored, analysed, and fused into a common operating picture. Sensor operators rely on multi-display workstations to perform their tasks, and attending to the numerous sources of information can be challenging. Given this environment, automation of certain functions and tasks is imperative to alleviate workload. To this end, the operations room currently supports a number of automated systems, one of which is an auditory alerting system to provide operators with advance warning of system and mission status. However, for a number of reasons the existing alerting system is ineffective:
i) Auditory alerting burdens an already overloaded auditory modality where operators are required to monitor several channels of communication.
ii) The current alerting system is a non-informative single tone, with no hierarchy associated with it so operators are not able to determine the urgency level.
iii) There is no selectivity and all alerts are distributed to all operators.
An alternative to auditory signals is to deliver alerts in the visual modality. However, care must be taken in adding alerts to already busy, and sometimes cluttered, interface displays. Furthermore, a multi-display working environment poses the question of whether or not visual alerts should appear on one or all of the workstation displays. High intensity tasks require focused attention, thus the concept of applying visual alerts requires stimuli sufficiently salient to capture attention while being placed outside the area of focal attention.
Results: Two experiments using a multi-display workstation and a high intensity task were conducted to evaluate two types of alerts, perimeter border and sidebar. Accuracy and response time to detecting alerts were used as performance measures. Results showed that sidebar alerts were always detected significantly faster than border alerts, regardless of whether they were flashing or static, and presenting alerts on all displays was more effective that presenting them on one display alone. Performance in general was slower when alerts appeared on the left display.
Significance: This work evaluated two candidate alerting mechanisms for military command and control (C2) systems, and is part of a larger project that will inform both Army and Navy projects in the design and evaluation of C2 systems. One of the concepts under discussion in the upcoming redesign of the Halifax Class frigate operations room, is to provide an alert in form of a flashing border around the perimeter of the operator’s display screen.
Future plans: The results from this work are somewhat surprising since a dynamic flashing alert was less effective than static, and a smaller sidebar proved to be more effective than a perimeter border covering a larger area of the display. Future work will investigate the association between the location of the alert with respect to the display it appears on, and spatial location of operator attention.

iv DRDC Atlantic TM 2008-281
This page intentionally left blank.
DRDC Atlantic TM 2008-281 v
Sommaire .....
Investigating Visual Alerting in Maritime Command and Control
Jacquelyn Crebolder; Jeffrey Beardsall; DRDC Atlantic TM 2008-281; R & D pour la défense Canada – Atlantique; Décembre 2008.
Introduction ou contexte: Le PC opérations des frégates de classe Halifax est un environnement occupé, complexe et souvent bruyant où l’information provenant de capteurs multiples est surveillée, analysée et fusionnée en une vue d'opérations commune. Les opérateurs de capteurs dépendent de postes de travail à écrans multiples pour effectuer leurs tâches et le fait de s’occuper de nombreuses sources d’information représente un grand défi. Compte tenu de cet environnement, l’automatisation de certaine fonctions et tâches est nécessaire pour atténuer la charge de travail. À cette fin, le PC opérations comporte un bon nombre de systèmes automatisés, dont un est un système d'alerte sonore qui signale à l’avance aux opérateurs les états de systèmes et de missions. Toutefois, pour diverses raisons, le système d'alerte en place est inefficace :
Le fardeau des alertes sonores est déjà un mode sonore surchargé où les opérateurs doivent surveiller plusieurs voies de communication.
Le système d’alerte actuel en est un à ton unique sans information, sans hiérarchie associée de sorte que les opérateurs ne peuvent pas déterminer le niveau d’urgence.
Il n’y a aucune sélectivité et toutes les alertes sont distribuées à tous les opérateurs.
Une solution de rechange aux signaux sonores est de livrer les alertes sous forme visuelle. Toutefois, on doit faire attention lorsqu’on ajoute des alarmes à des écrans d’interface déjà forts occupés, voire même encombrés. De plus, un environnement de travail à écrans multiples pose la question à savoir si des alertes visuelles doivent être présentées sur un ou sur tous les écrans du poste de travail. Les tâches à haute intensité exigent une attention exclusive, ainsi le concept des alertes visuelles exige des stimuli suffisamment saillants pour capter l’attention tout en étant placés à l’extérieur de la zone d’attention focale.
Résultats: Deux expériences utilisant un poste de travail à écrans multiples et une tâche à haute intensité ont été effectuées pour évaluer deux types d’alertes, à bordure de périmètre et à trait vertical. La précision et le temps de réponse à la détection des alertes ont été utilisés comme mesures de rendement. Les résultats ont démontré que les alertes à trait vertical étaient toujours détectées nettement plus vite que les alertes de type bordure, sans égard au fait qu’elles soient clignotantes ou statiques, et que la présentation des alertes sur tous les écrans était plus efficace que leur présentation sur un seul écran. Le rendement était en général plus lent lorsque les alertes étaient présentées sur l’écran de gauche.
Importance: Ces travaux ont servi à l’évaluation de deux mécanismes d’alertes candidats pour les systèmes de commandement et de contrôle (C2) militaires, et font partie d’un projet plus grand qui servira à informer les projets de l’armée et de la marine pour la conception et l’évaluation des systèmes C2. Un des concepts en discussion pour la nouvelle conception à venir des PC opérations de la frégate de la classe Halifax, est de fournir une alerte sous forme d’une bordure clignotante autour du périmètre de l’écran d’affichage de l’opérateur.

vi DRDC Atlantic TM 2008-281
Perspectives: Les résultats des présents travaux sont quelque peut surprenant puisqu’une alerte clignotante dynamique était moins efficace qu’une alerte statique et qu’une alerte par trait vertical plus petite était plus efficace qu’une alerte à bordure de périmètre couvrant une plus grande partie de l’écran. Les travaux futurs devront étudier l’association entre l’emplacement de l’alerte en rapport à l’écran dans lequel elle est présentée, et l’emplacement spatial de d’attention de l’opérateur.
DRDC Atlantic TM 2008-281 vii
Table of contents
Abstract …….. ................................................................................................................................. i
Résumé …..... ................................................................................................................................... i
Executive summary ........................................................................................................................ iii
Table of contents ........................................................................................................................... vii
List of figures ................................................................................................................................. ix
List of tables .................................................................................................................................... x
Acknowledgements ........................................................................................................................ xi
1 Introduction............................................................................................................................... 1 1.1 Background.................................................................................................................... 1 1.2 Visual Alert ................................................................................................................... 2
1.2.1 Alerts............................................................................................................... 2 1.2.2 Location .......................................................................................................... 3
1.3 Overview of Experimentation and Objectives............................................................... 4
2 Experiment 1............................................................................................................................. 5 2.1 Method........................................................................................................................... 5
2.1.1 Participants...................................................................................................... 5 2.1.2 Apparatus ........................................................................................................ 5
2.1.2.1 Middle display - Tactical Display................................................. 5 2.1.2.2 Left display – Status Display........................................................ 6 2.1.2.3 Right display – Report Display .................................................... 6
2.1.3 Task................................................................................................................. 6 2.1.3.1 Alert Response.............................................................................. 7 2.1.3.2 Contact Identification ................................................................... 7
2.1.4 Procedure ........................................................................................................ 8 2.2 Results ........................................................................................................................... 9
2.2.1 Performance Measures .................................................................................... 9 2.2.1.1 Alerts ............................................................................................ 9 2.2.1.2 Contacts ...................................................................................... 10 2.2.1.3 Destroyed Ownship .................................................................... 10
2.2.2 Data Analysis ................................................................................................ 11 2.2.2.1 Primary Task - Alerts ................................................................. 11 2.2.2.2 Secondary Task - Contact Identification .................................... 15
2.3 Discussion.................................................................................................................... 17
3 Experiment 2........................................................................................................................... 19 3.1 Method......................................................................................................................... 19
3.1.1 Participants.................................................................................................... 19 3.1.2 Apparatus ...................................................................................................... 19
viii DRDC Atlantic TM 2008-281
3.1.2.1 Left display – Status display....................................................... 19 3.1.2.2 Right display - Report display .................................................... 20 3.1.2.3 Demographic data....................................................................... 20
3.1.3 Procedure ...................................................................................................... 21 3.2 Results ......................................................................................................................... 21
3.2.1 Performance Measures .................................................................................. 21 3.2.1.1 Alert Responses .......................................................................... 21 3.2.1.2 Contact Identification ................................................................. 22 3.2.1.3 Number of destroyed ownship.................................................... 22
3.2.2 Data Analysis ................................................................................................ 22 3.2.2.1 Primary Task – Alert .................................................................. 23 3.2.2.2 Contact Identification ................................................................. 26 3.2.2.3 Destroyed Ownship .................................................................... 28
3.3 Discussion.................................................................................................................... 29
References ..... ............................................................................................................................... 31
Annex A .. Participant Instructions – Experiment 1 ...................................................................... 33
Annex B .. Participant Instructions – Experiment 2 ...................................................................... 35
Distribution list.............................................................................................................................. 37
DRDC Atlantic TM 2008-281 ix
List of figures
Figure 1: Flashing border on three displays used in experimentation ............................................. 3
Figure 2: Sidebar on three displays used in experimentation .......................................................... 3
Figure 3: Workstation configuration ............................................................................................... 6
Figure 4: Screen capture of ship being destroyed resulting from the ownship being met by a contact ........................................................................................................................... 8
Figure 5: Overall Mean Response Time by Alert Type and Alert Location ................................. 14
Figure 6: Mean Frequency of Attempted Contact Identifications as a function of Block............. 15
Figure 7: Percent correct identifications as a function of Block. .................................................. 16
Figure 8: Example of Apparatus used in Experiment 2; note changes in left and right displays. . 20
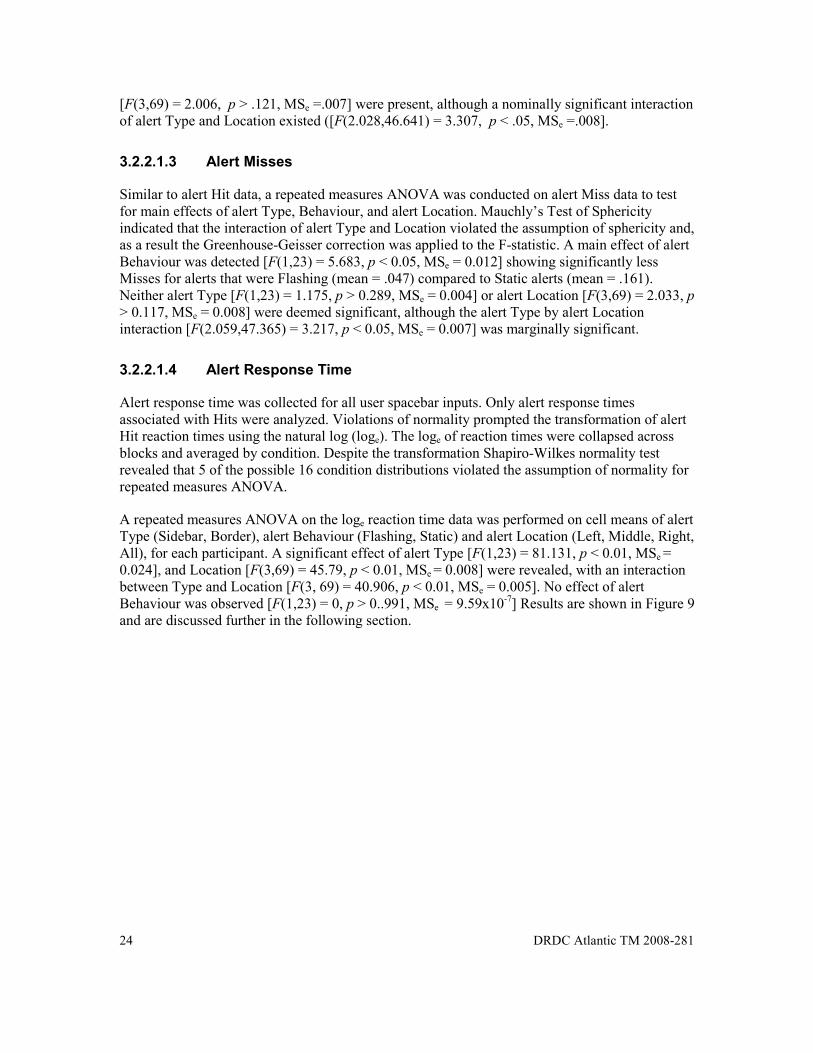
Figure 9: Mean Response Time by Alert Type and Alert Location .............................................. 25
Figure 10: Mean Frequency Count of Total Attempted Contact Identifications by Block ........... 27
Figure 11: Mean Percentage of Correct Identifications by Block ................................................. 28
Figure 12: Mean Frequency of Ownship Explosions by Block..................................................... 29
x DRDC Atlantic TM 2008-281
List of tables
Table 1: Possible contact attributes presented on the Status Display. ............................................. 7
Table 2: Mean Number of Sidebar and Border Alerts presented by Location .............................. 11
Table 3: Mean Hits by Alert Type and Location........................................................................... 12
Table 4: Mean Misses by Alert Type and Location ...................................................................... 12
Table 5: Post Hoc Paired t-test comparisons of Alert type and Location...................................... 14
Table 6: Pairwise Comparisons of Alert Type and Alert Location ............................................... 26

DRDC Atlantic TM 2008-281 xi
Acknowledgements
The authors would like to thank Don Coady, Joshua Salmon, and Shelley Roberts for their technical assistance and support.

xii DRDC Atlantic TM 2008-281
This page intentionally left blank.

DRDC Atlantic TM 2008-281 1
1 Introduction
1.1 Background
The Halifax Class Frigate operations room is manned by approximately twenty personnel who monitor, manage, collect and collate data from a variety of sensors (electronic, visual, auditory). Data and information from the operations room is used to build the common operating picture from which critical decision are made.
The operations room is a demanding environment where critical decisions must be made quickly and accurately. Sensor operators rely on a number of different displays for information and data feeds, and multi-tasking while attending to several information and Tactical Displays at the same time is all too familiar. Given such an intense and critical environment, automated systems that assist operators in performing their tasks are a necessity. An automated system currently available is an auditory warning system that alerts operators to system states, operational states, and situations in need of attention or action. Auditory warnings are typically chosen over visual ones when the visual modality is used for task-related information and when visual workload is high. Salvendy (1997) argues that auditory alerts may be superior to visual warnings as they are omni-directional and operators need not look at a particular location to be alerted. On the other hand, research investigating ways to warn automobile drivers of potential road hazards, found that a visual alert (red static display border) was subjectively preferred and more trusted than an auditory one (clicking tone) (Donmez, Boyle and Lee, 2006).
The auditory modality is massively overloaded in the operations room and it is likely to be utilized further as sensor platforms develop and more and more data is streamed. Currently an operator’s headset delivers two channels of communication that must be monitored while keeping track of face to face verbal communication, often between more than one party.
Recent discussions with navy personnel indicate that the standard informal procedure in the operations room of the Halifax Class Frigate is to switch off the auditory alert system as soon as an operator comes on duty. The system is intentionally disabled for a number of reasons: the auditory modality is already over used; the majority of alerts are auditory; all operators receive all alerts, many are of no concern for an individual operator; alerts are not informative, they are single tone; there is no alert hierarchy, and the presentation of auditory alerts is almost constant.
If the auditory modality is overloaded, as it is in the frigate’s operations room, one way of alleviating the problem might be to replace some of the auditory alerts with visual ones. However, since most of the information required to perform the operator’s task is displayed visually, adding visual alerts to already cluttered displays becomes challenging. This paper reports research exploring visual alerting in complex high intensity environments where an individual’s attention is divided between multiple information sources..
For a visual alert to be detected, attention must be directed to the location in space where the alert appears. Since an operator’s working environment consists of a multi-display workstation, the most likely placement of a visual alert would be on one or all of the displays that the operator is using. However, there are a number of challenges to presenting visual alerts on displays that are used for other visual tasks.
Firstly, it is essential that the alert does not obstruct or interfere with task-related information on the display screen. Thus, text or symbology that makes up an alert must be salient without being
2 DRDC Atlantic TM 2008-281
over-powering or an impediment to the task. A possible location might be in the periphery of the work area; however attending to peripheral information brings its own challenges.
During periods of high workload an operator’s attention will be focused and their concentration wholly absorbed in the task at hand. Under high stress conditions it is not unusual for critical information to be missed if it appears outside the area of focal attention. The phenomenon, where attention is wholly absorbed to the point of missing other relevant information outside the attentional field, has been referred to as attentional tunnelling, or attentional spotlight (Wickens, 2005). Any stimulus used for alerting purposes must be salient enough so that it will be noticed by an operator when he or she is engaged in the task at hand and where his attention may not be focused on the area of the display where the alert appears. This requirement becomes more significant and difficult to apply with larger displays or when there is more than one display used to perform a task.
A further consideration in using visual alerts is the effect of visual dominance in multi-modal environments. Visual dominance refers to the tendency for visual stimuli to dominate attention when they appear simultaneously with non-visual stimuli (e.g., auditory) (Colavita & Weisberg, 1979; Cooper, 1998; Posner, Nissan & Klein, 1976). Research has shown that priority is given to visual stimuli in terms of response time when they are presented simultaneously with auditory stimuli (Cooper, 1998). However, when visual and auditory stimuli are presented separately, response times to visual stimuli are typically slower than to auditory. This phenomenon will be discussed more fully later in the report, in the discussion of future research.
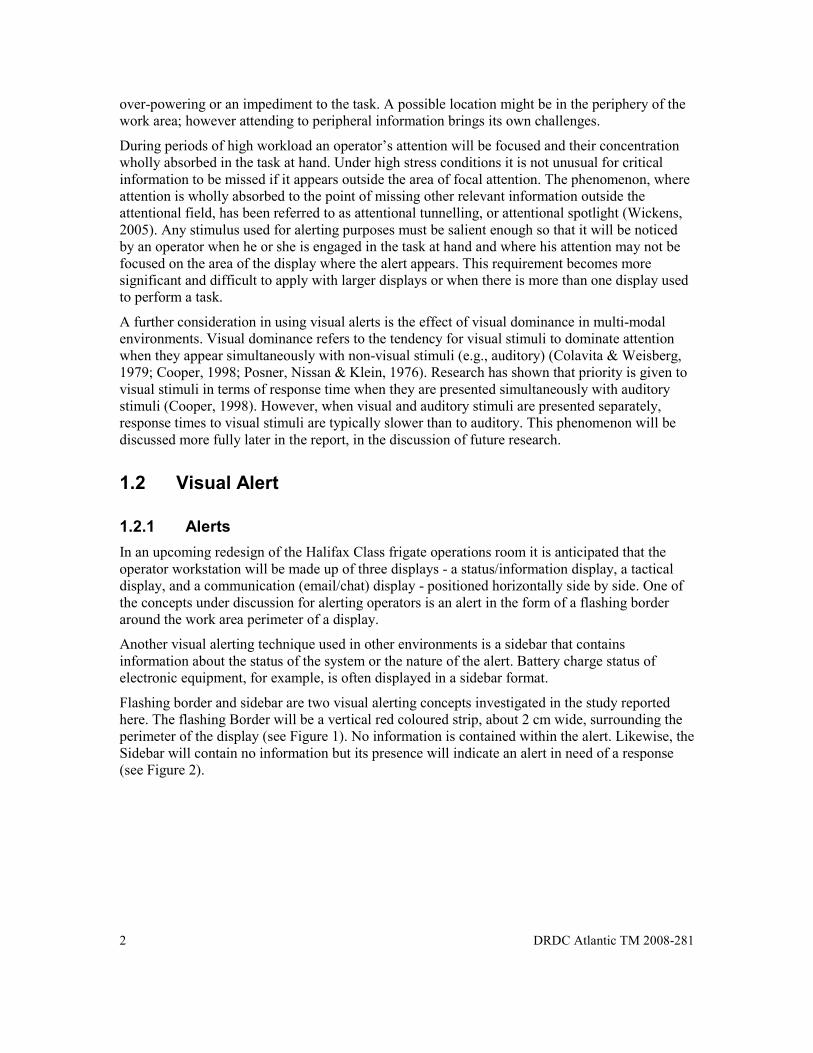
1.2 Visual Alert
1.2.1 Alerts
In an upcoming redesign of the Halifax Class frigate operations room it is anticipated that the operator workstation will be made up of three displays - a status/information display, a tactical display, and a communication (email/chat) display - positioned horizontally side by side. One of the concepts under discussion for alerting operators is an alert in the form of a flashing border around the work area perimeter of a display.
Another visual alerting technique used in other environments is a sidebar that contains information about the status of the system or the nature of the alert. Battery charge status of electronic equipment, for example, is often displayed in a sidebar format.
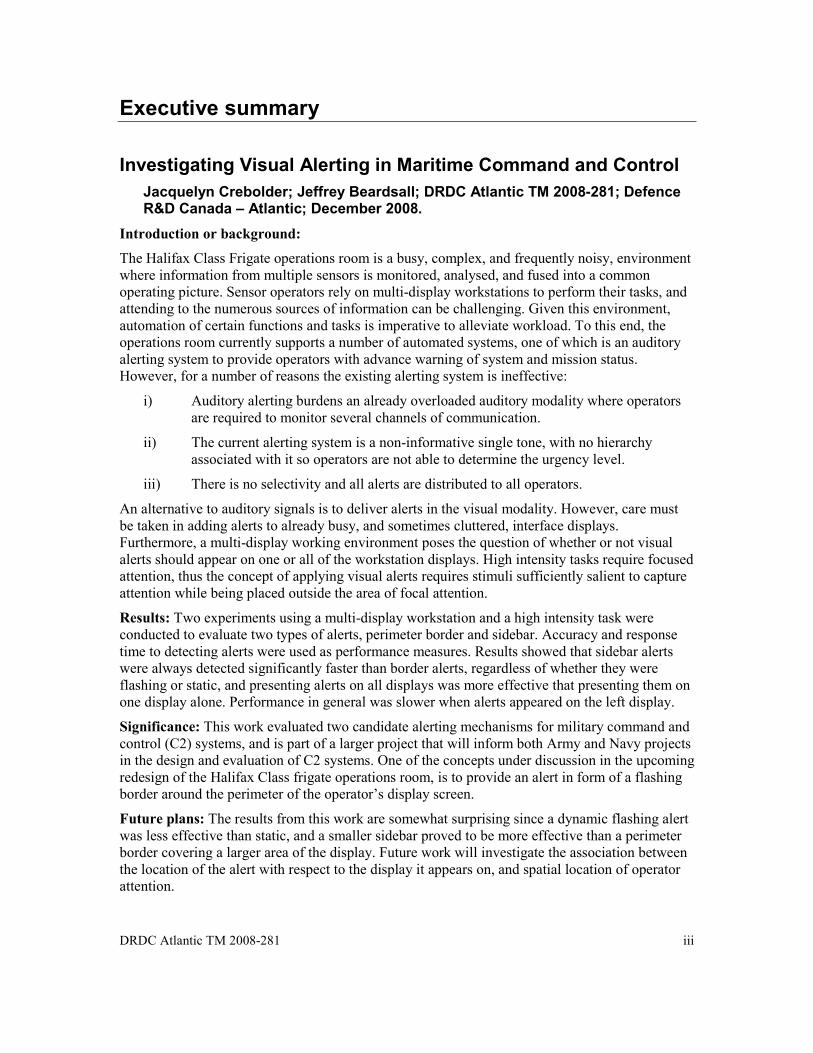
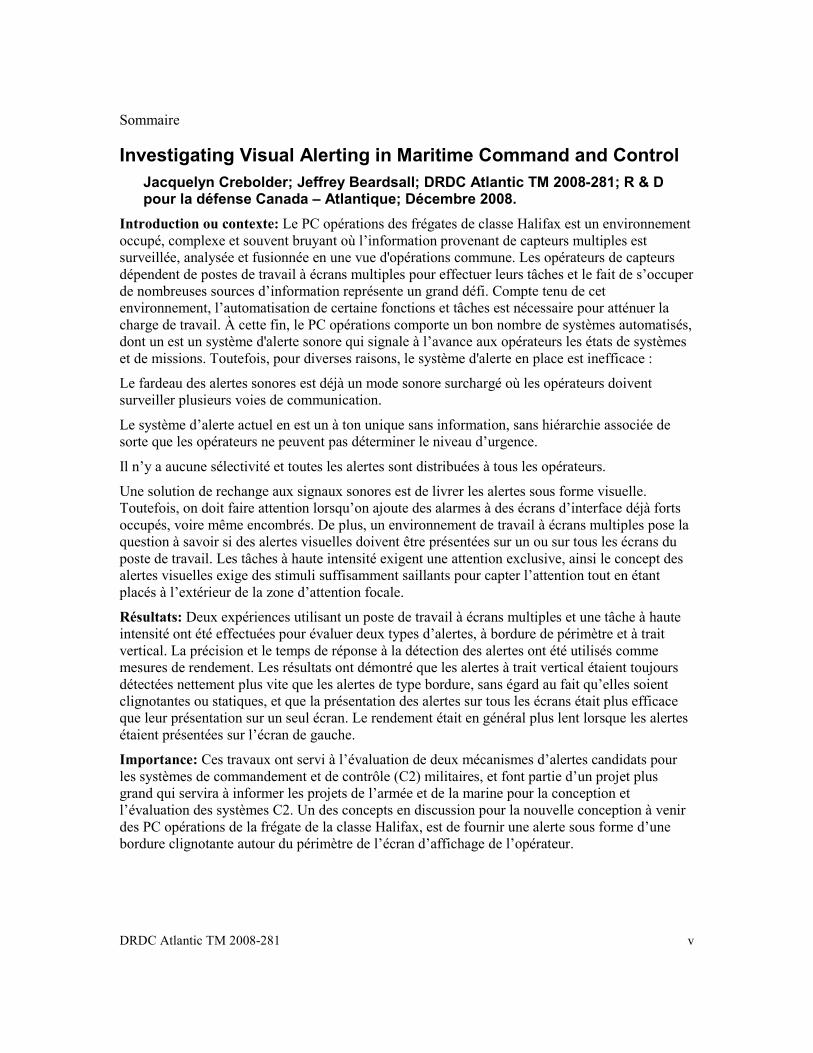
Flashing border and sidebar are two visual alerting concepts investigated in the study reported here. The flashing Border will be a vertical red coloured strip, about 2 cm wide, surrounding the perimeter of the display (see Figure 1). No information is contained within the alert. Likewise, the Sidebar will contain no information but its presence will indicate an alert in need of a response (see Figure 2).

DRDC Atlantic TM 2008-281 3
Figure 1: Flashing border on three displays used in experimentation
Figure 2: Sidebar on three displays used in experimentation
1.2.2 Location
Since the upgraded workstation is expected to accommodate three displays, the question arises as to the effectiveness of visual alerts when they are presented on one display, or simultaneously on all three of the displays. The operator will frequently be involved in tasks that use all three displays so presenting the alert on all displays may reduce the chance of it being missed. However, particularly with respect to flashing symbology, alerts on all three displays could

4 DRDC Atlantic TM 2008-281
distract from the task at hand, especially if the alert is directed to several operators at the same time. The current study will provide empirical evidence as to whether or not there is significant benefit in displaying alerts on all displays as opposed to one, and if the latter, which one.
1.3 Overview of Experimentation and Objectives
The experiments reported here were designed to assess the detectability of two kinds of visual alerts and to examine the impact of displaying alerts in various locations within the operator’s multi-display workstation. Specifically Experiment 1 was completed to obtain a baseline performance level, and a comparison of two unique visual alerts in the specific environment of the CF Halifax Class frigate. Experiment 2’s objectives were to evaluate and compare performance of two alert behaviours: static and flashing. Experiment 2 also served the purpose of finding reproducibility in results found in Experiment 1.
DRDC Atlantic TM 2008-281 5
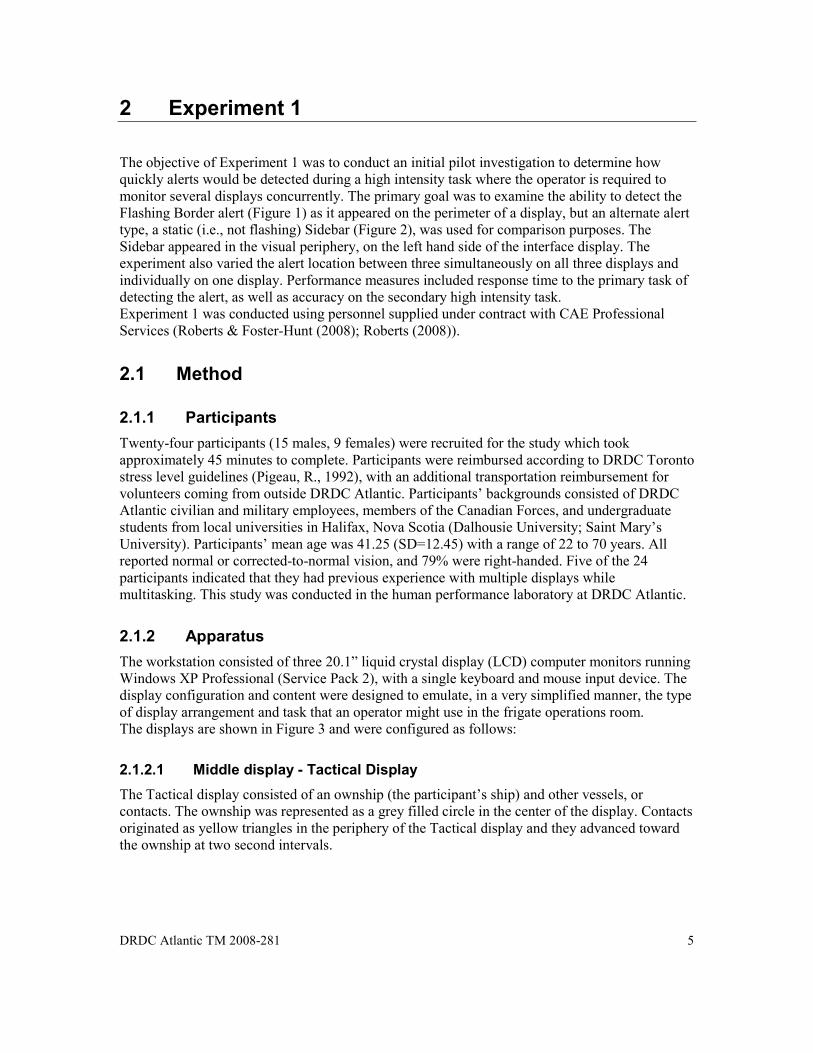
2 Experiment 1
The objective of Experiment 1 was to conduct an initial pilot investigation to determine how quickly alerts would be detected during a high intensity task where the operator is required to monitor several displays concurrently. The primary goal was to examine the ability to detect the Flashing Border alert (Figure 1) as it appeared on the perimeter of a display, but an alternate alert type, a static (i.e., not flashing) Sidebar (Figure 2), was used for comparison purposes. The Sidebar appeared in the visual periphery, on the left hand side of the interface display. The experiment also varied the alert location between three simultaneously on all three displays and individually on one display. Performance measures included response time to the primary task of detecting the alert, as well as accuracy on the secondary high intensity task. Experiment 1 was conducted using personnel supplied under contract with CAE Professional Services (Roberts & Foster-Hunt (2008); Roberts (2008)).
2.1 Method
2.1.1 Participants
Twenty-four participants (15 males, 9 females) were recruited for the study which took approximately 45 minutes to complete. Participants were reimbursed according to DRDC Toronto stress level guidelines (Pigeau, R., 1992), with an additional transportation reimbursement for volunteers coming from outside DRDC Atlantic. Participants’ backgrounds consisted of DRDC Atlantic civilian and military employees, members of the Canadian Forces, and undergraduate students from local universities in Halifax, Nova Scotia (Dalhousie University; Saint Mary’s University). Participants’ mean age was 41.25 (SD=12.45) with a range of 22 to 70 years. All reported normal or corrected-to-normal vision, and 79% were right-handed. Five of the 24 participants indicated that they had previous experience with multiple displays while multitasking. This study was conducted in the human performance laboratory at DRDC Atlantic.
2.1.2 Apparatus
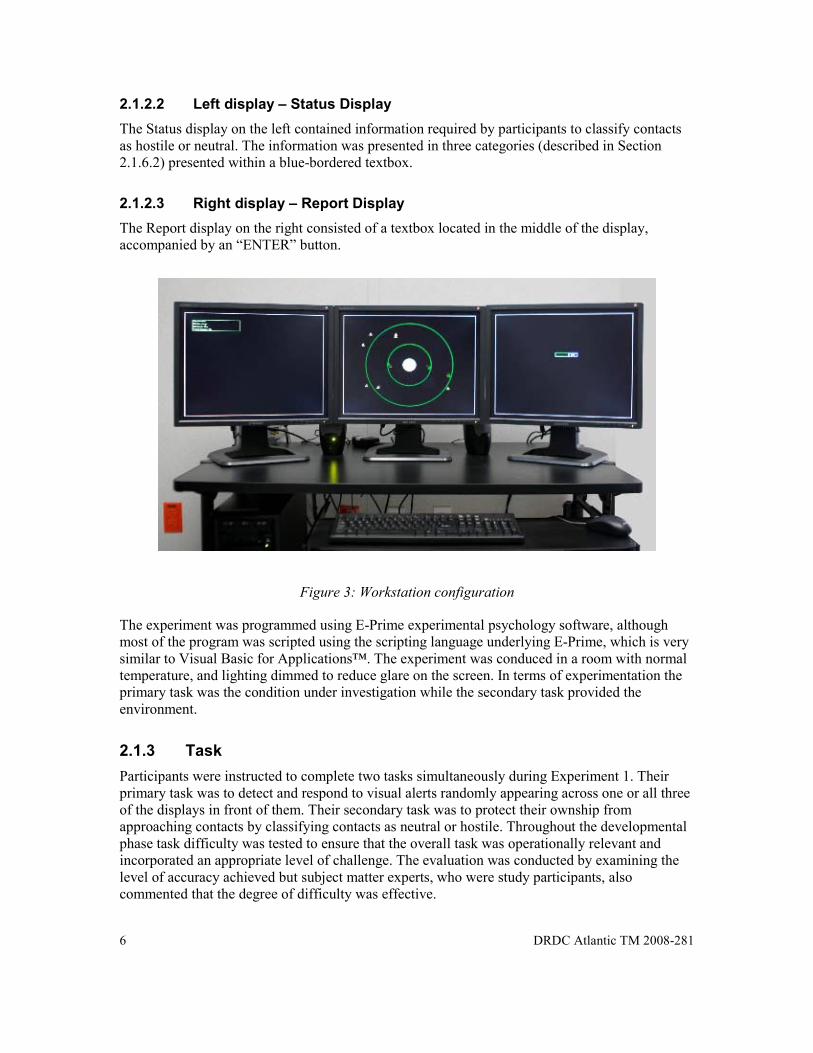
The workstation consisted of three 20.1” liquid crystal display (LCD) computer monitors running Windows XP Professional (Service Pack 2), with a single keyboard and mouse input device. The display configuration and content were designed to emulate, in a very simplified manner, the type of display arrangement and task that an operator might use in the frigate operations room. The displays are shown in Figure 3 and were configured as follows:
2.1.2.1 Middle display - Tactical Display
The Tactical display consisted of an ownship (the participant’s ship) and other vessels, or contacts. The ownship was represented as a grey filled circle in the center of the display. Contacts originated as yellow triangles in the periphery of the Tactical display and they advanced toward the ownship at two second intervals.
6 DRDC Atlantic TM 2008-281
2.1.2.2 Left display – Status Display
The Status display on the left contained information required by participants to classify contacts as hostile or neutral. The information was presented in three categories (described in Section 2.1.6.2) presented within a blue-bordered textbox.
2.1.2.3 Right display – Report Display
The Report display on the right consisted of a textbox located in the middle of the display, accompanied by an “ENTER” button.
Figure 3: Workstation configuration
The experiment was programmed using E-Prime experimental psychology software, although most of the program was scripted using the scripting language underlying E-Prime, which is very similar to Visual Basic for Applications™. The experiment was conduced in a room with normal temperature, and lighting dimmed to reduce glare on the screen. In terms of experimentation the primary task was the condition under investigation while the secondary task provided the environment.
2.1.3 Task
Participants were instructed to complete two tasks simultaneously during Experiment 1. Their primary task was to detect and respond to visual alerts randomly appearing across one or all three of the displays in front of them. Their secondary task was to protect their ownship from approaching contacts by classifying contacts as neutral or hostile. Throughout the developmental phase task difficulty was tested to ensure that the overall task was operationally relevant and incorporated an appropriate level of challenge. The evaluation was conducted by examining the level of accuracy achieved but subject matter experts, who were study participants, also commented that the degree of difficulty was effective.
DRDC Atlantic TM 2008-281 7
2.1.3.1 Alert Response
While participants performed the secondary task visual alerts would randomly present themselves on one (left, middle, or right) or all three displays. Visual alerts were either one of two alert types: Flashing Border or Static Sidebar. The Flashing Border behaved in such a manner that it was on-screen or off-screen, flashing at a rate of 3.333Hz. Presentation of alert type was blocked so that only one alert type appeared in each set of trials, and alert location was randomly varied within a block. Participants were instructed to attend to and dismiss an alert as quickly as possible by pressing the spacebar located on the keyboard. If participants did not dismiss the alert it would remain on the screen for 4000 milliseconds (ms) and then disappear automatically. If the participant responded to an alert, it was recorded as a Hit with an associated response time (computer logged time of spacebar pressed - actual time the alert appeared on the display(s) in milliseconds). If the participant did not dismiss the alert it was recorded as a Miss and no response time was recorded. If the participant pressed the spacebar without an alert on screen it was recorded as a False Alarm.
2.1.3.2 Contact Identification
Contacts were symbolized as yellow triangles and they originated in the periphery of the Tactical display. Pilot work during the development of the software program determined an appropriate level of task difficulty by testing the speed and number of targets on the screen (see 2.1.3). As such, contacts advanced toward the ownship in two second intervals (some contacts advanced in larger increments towards ownship in relation to other contacts). The program allowed no more than ten contacts on the Tactical display at any one time. The ratio of neutral to hostile contacts (on screen) was 7:3. Participants were warned that if any contact came within the grey circle representing the ownship, the ownship would be destroyed. Participants were instructed to left click the mouse over an incoming contact to display the contact’s characteristics on the Status display. Three categories of characteristics were used to classify contacts: Size, Speed, and Weapons on board. Each characteristic was Boolean with one value representing neutral, and the other hostile (see Table 1). Any combination of character values was possible and was randomly decided by the program. To classify a contact as neutral or hostile the participant was required to identify the total number of neutral and hostile values. If the contact possessed 2 neutral values it was deemed neutral, or if the contact possessed 2 hostile values it was deemed hostile.
Table 1: Possible contact attributes presented on the Status Display.
Categorized as Hostile Categorized as Neutral
Size Small Large Speed Fast Slow Weapons Yes No
Once a contact was classified the participant was required to report a response on the Report display. Responses were: “qwe” for neutral or “asd” for hostile. The final step in the categorization task was to confirm their decision by clicking the mouse on a box marked
8 DRDC Atlantic TM 2008-281
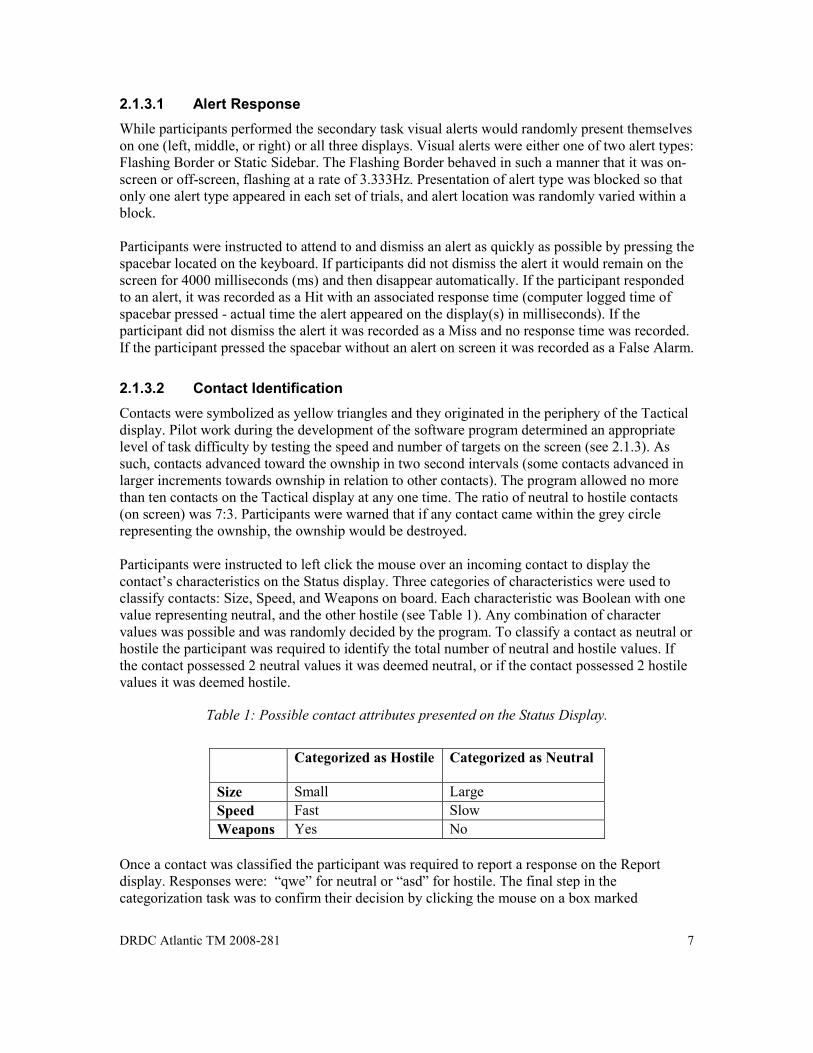
“ENTER” on the Report display. If the participant made the correct classification for the active contact feedback would be displayed on the Report display (“Correct!” in green text) and the contact would disappear from the Tactical display. If the participant made an incorrect classification feedback would be displayed on the Report display (“Incorrect!” in red text), and the contact would remain on its path towards the ownship. An incorrect response could be easily rectified however, by immediately entering the correct response into the Report Display. By choosing contacts closest to the ownship, and by identifying them correctly, threat on ownship could be reduced. Participants were warned that keeping contacts from reaching the ownship was critical to avoid the ownship being destroyed. If a contact arrived within the grey circle defining the ownship (60 pixels diameter) the ownship would be destroyed. If this occurred, the task was immediately paused for 5 seconds while an audio file of a “kaboom” noise was played, and a picture of an exploding ship was displayed on the Tactical display (see Figure 4). The session then continued, with contacts originating in the periphery of the Tactical display and once again moving towards the ownship in the center.
Figure 4: Screen capture of ship being destroyed resulting from the ownship being met by a
contact
2.1.4 Procedure
Participants first read and signed a volunteer consent form, and were then read instructions that put the task they were to perform into context (see Annex A). Following the verbal instructions the participant was presented with two screens of visual instructions followed by a task familiarization session. Each participant completed two blocks of practice trials, one Flashing
DRDC Atlantic TM 2008-281 9
Border block and one Sidebar. Each practice block consisted of 16 alerts presented randomly across each of the four levels of location (Left, Middle, Right, All). After the practice session was complete the experimenter initiated the primary experiment. The first part of the program included five demographic questions (age, sex, handedness, and familiarity with tasks using multiple displays). The primary experiment consisted of 8 blocks and took approximately one hour to complete. Each block lasted approximately 3 minutes. Like the practice session, alert Type was held constant throughout each block, and alert Location was presented randomly so that the alert appeared an equal number of times at all 4 levels of location. The experimental program produced a 2 alert type (Flashing Border, Static Sidebar) x 4 alert Location (Left, Middle, Right, All) within-subjects design, indicating that each participant was exposed to every experimental condition. Each participant received 4 blocks of each alert type, and the order of blocks was counterbalanced across participants. Although the experimental design called for alerts to be presented 16 times within each block – 4 at each of the 4 locations, a timing error in the software resulted in slight variability in the number of alerts presented per block, and accordingly per location. This issue is discussed further under Section 2.2.2.1.3. Participants were instructed that responding to alerts by pressing the spacebar as quickly as possible was their primary task. Participants were told that between each block there would be a chance for a break if they required one. After the primary experimental session participants were debriefed and received their reimbursement.
2.2 Results
2.2.1 Performance Measures
2.2.1.1 Alerts
2.2.1.1.1 Number of alerts detected
Frequency counts were collected for each participant across all trials and blocks, and analyzed as correct responses (Hits). Higher numbers of Hits indicated higher accuracy and better primary task performance. Correct detections were coded as 1 by the data collection system under the variable “AlertAccuracy”.
2.2.1.1.2 Number of alerts missed
Frequency counts were calculated for missed alerts (Miss) data for each participant across all blocks. Missed alerts were those that appeared but were not responded to. Lower counts of Misses indicates a higher level of accuracy and better primary task performance. Misses were coded as 0 by the data collection system under the variable “AlertAccuracy”.
2.2.1.1.3 Number of false alarms
Frequency counts were calculated for spacebar responses when no alert was present (False Alarms). All False Alarms had an associated Alert Response time which was calculated using the
10 DRDC Atlantic TM 2008-281
most recent Alert Onset time. False Alarms were coded as 2 by the data collection system under the variable “AlertAccuracy”. Fewer False Alarms indicated better primary task performance.
2.2.1.1.4 Misses and False Alarms combined
For analysis purposes frequency counts of False Alarms (“2”) and Misses (“0”) were combined as incorrect responses – that is, AlertAccuracy included both types of incorrect responses. Note that, in cases where a response occurred immediately after an alert disappeared (Alert Offset) it is not possible to accurately determine whether that response was a late response to the alert (late Hit), or whether it is independent of the alert and thus a true False Alarm.
2.2.1.1.5 Response time to alert
The experimental program recorded time stamps in milliseconds (ms) for the following events: experiment start-up = 0 ms; Alert Onset = time alert appeared on the screen; Spacebar Input = time spacebar was pressed; Alert Response = calculated as the absolute difference between Alert Onset and Spacebar Input.
Alert Response was always calculated using Alert Onset of the most recent (or current) alert. Therefore, if Alert Response time was greater than 4 seconds (maximum duration of an alert), it was indicative of a False Alarm. Shorter Alert Response time indicates better primary task performance.
2.2.1.2 Contacts
The following metrics were used to assess secondary task performance.
2.2.1.2.1 Identification of contacts
Correct and incorrect classifications of contacts were recorded by the program. Frequency counts of correct identifications, frequency counts of incorrect identifications, and frequency counts of total attempted identifications (correct + incorrect) can be used as indicators of secondary task performance. High correct identification counts indicate better secondary task performance, as do low incorrect identification counts. High total identification attempts indicate faster overall secondary task performance. Percentage of correct identification/total identification can also be calculated to indicate whether or not secondary task performance accuracy is improving or if speed of task performance is increasing with respect to time spent on task. To normalize variation of count data for analyses, arcsine transformations were performed on the count and percentage data, but absolute means are depicted in the figures for easier visual interpretation.
2.2.1.3 Destroyed Ownship
Frequency counts were collected for the number of ownship destroyed during each block for each participant. Lower numbers of destroyed ownship indicated better performance.
DRDC Atlantic TM 2008-281 11
2.2.2 Data Analysis
2.2.2.1 Primary Task - Alerts
The data were analyzed for accuracy and response time to alerts, and participants’ ability to correctly identify contacts as hostile or neutral. Response time and alert accuracy (Hits, Misses) were analyzed to investigate the impact of the two visual alert techniques (Flashing Border, Sidebar), and locations (Left, Middle, Right, and All three displays).
2.2.2.1.1 Missing Data
Data for one participant were deemed incomplete and not usable due to software failure which resulted in the locations in which the alerts were presented not being recorded. The data from this file were not included in any subsequent analyses. All other data files were examined and found to be complete, resulting in 24 data files for analysis.
2.2.2.1.2 Normality
The Shapiro-Wilkes test of normality indicated that the Hit data for both types of visual alerts (Sidebar/Flashing Border) were significantly negatively skewed and thus violated the statistical assumption of normality. The normality test also indicated that the Miss data violated the statistical assumption of normality. The Miss data for both alert types had statistically significant leptukurtic distributions. The repeated measures analysis of variance (RM-ANOVA) test makes assumptions that the data it is being used on is normally distributed. Although it is considered a robust test against violations of assumptions, weak effects should be considered sceptically.
Following standard procedure for normalizing variance in count and percentage data , arcsine transformations were applied to all accuracy data (Hit and Miss) (Hogg, Craig, &McKean, 1995). This transformation alleviated but did not completely remove all non-uniform residuals.
2.2.2.1.3 Alert Accuracy
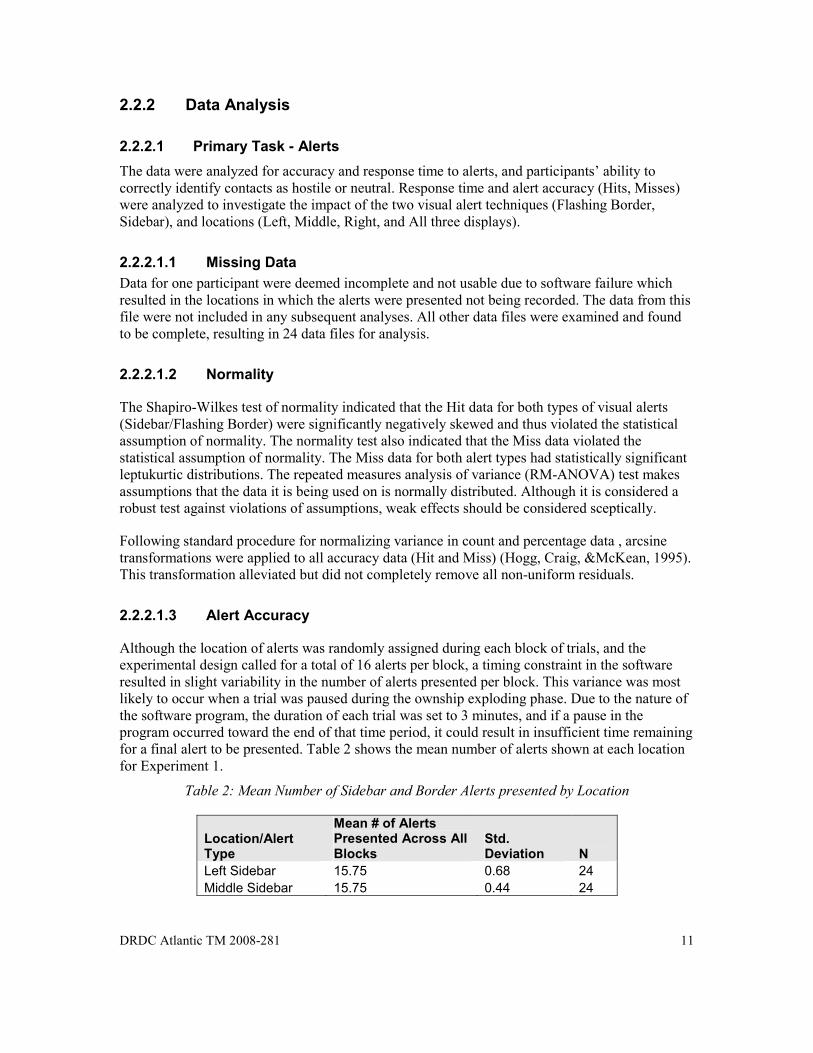
Although the location of alerts was randomly assigned during each block of trials, and the experimental design called for a total of 16 alerts per block, a timing constraint in the software resulted in slight variability in the number of alerts presented per block. This variance was most likely to occur when a trial was paused during the ownship exploding phase. Due to the nature of the software program, the duration of each trial was set to 3 minutes, and if a pause in the program occurred toward the end of that time period, it could result in insufficient time remaining for a final alert to be presented. Table 2 shows the mean number of alerts shown at each location for Experiment 1.
Table 2: Mean Number of Sidebar and Border Alerts presented by Location
Location/Alert Type
Mean # of Alerts Presented Across All Blocks
Std. Deviation N
Left Sidebar 15.75 0.68 24
Middle Sidebar 15.75 0.44 24

12 DRDC Atlantic TM 2008-281
Right Sidebar 15.42 0.78 24
All Sidebar 15.38 0.71 24
Left Border 15.46 0.98 24
Middle Border 15.50 0.88 24
Right Border 15.17 1.09 24
All Border 15.33 0.64 24
In spite of non-normality of Hit and Miss data, a 2 alert type (Flashing Border/Sidebar) x 4 location (Left/Middle/Right/All displays) repeated measures Analysis of Variance (ANOVA) was performed on the root-arcsine transformed data in order to investigate the effects on response accuracy. The repeated measures ANOVA revealed no significant effect of alert type (Sidebar/Flashing Border) [F(1,21) = 1.469, p > .238, MSe = .990; F(1,21) = .718, p > .405, MSe = .127] or location (display Left/Middle/Right/All) [F(3,63) = 2.131, p > .104, MSe = .818; F(3,63) = .905, p > .443, MSe = .042] on either Hit or Miss data (shown respectively).
Tables 3 and 4, respectively, show the mean number of Hits and Misses for each alert Type and alert Location. Note that, approximately 15.5 alerts were presented within each block and, on average 15.35 of those were responded to. Based on this finding, a close to maximum score, or ceiling effect, in the accuracy data appears to be evident.
Table 3: Mean Hits by Alert Type and Location
Location/Alert Type
Mean # of Hits Collapsed Across Blocks
Std. Deviation N
Left Sidebar 15.63 0.77 24
Mid Sidebar 15.50 0.93 24
Right Sidebar 15.21 0.83 24
All Sidebar 15.42 0.65 24
Left Border 15.21 0.98 24
Mid Border 15.54 0.72 24
Right Border 15.00 1.10 24
All Border 15.25 1.11 24
Table 4: Mean Misses by Alert Type and Location
Location/Alert Type
Mean # of Misses Collapsed Across Blocks
Std. Deviation N
Left Sidebar 0.08 0.28 24
Left Border 0.08 0.41 24
Middle Sidebar 0.00 0.00 24
Middle Border 0.08 0.41 24
Right Sidebar 0.00 0.00 24
Right Border 0.13 0.45 24
All Sidebar 0.04 0.20 24
All Border 0.00 0.00 24
DRDC Atlantic TM 2008-281 13
2.2.2.1.4 Alert Response Time
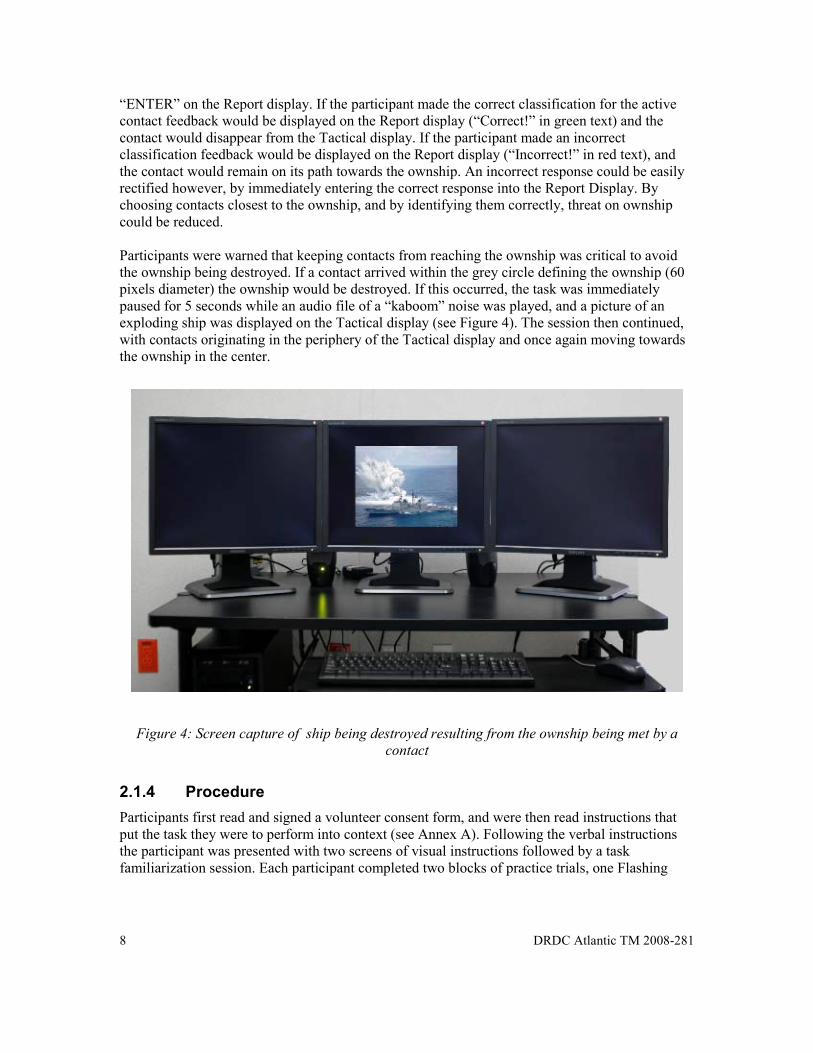
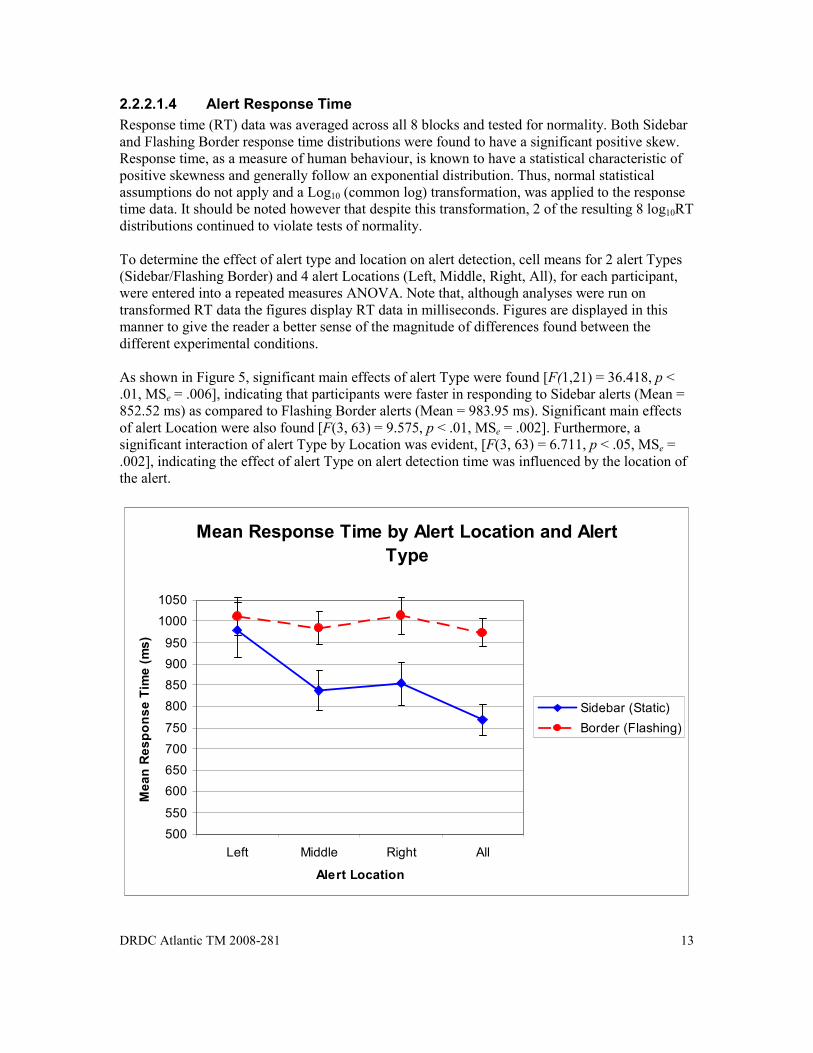
Response time (RT) data was averaged across all 8 blocks and tested for normality. Both Sidebar and Flashing Border response time distributions were found to have a significant positive skew. Response time, as a measure of human behaviour, is known to have a statistical characteristic of positive skewness and generally follow an exponential distribution. Thus, normal statistical assumptions do not apply and a Log10 (common log) transformation, was applied to the response time data. It should be noted however that despite this transformation, 2 of the resulting 8 log10RT distributions continued to violate tests of normality. To determine the effect of alert type and location on alert detection, cell means for 2 alert Types (Sidebar/Flashing Border) and 4 alert Locations (Left, Middle, Right, All), for each participant, were entered into a repeated measures ANOVA. Note that, although analyses were run on transformed RT data the figures display RT data in milliseconds. Figures are displayed in this manner to give the reader a better sense of the magnitude of differences found between the different experimental conditions. As shown in Figure 5, significant main effects of alert Type were found [F(1,21) = 36.418, p < .01, MSe = .006], indicating that participants were faster in responding to Sidebar alerts (Mean = 852.52 ms) as compared to Flashing Border alerts (Mean = 983.95 ms). Significant main effects of alert Location were also found [F(3, 63) = 9.575, p < .01, MSe = .002]. Furthermore, a significant interaction of alert Type by Location was evident, [F(3, 63) = 6.711, p < .05, MSe = .002], indicating the effect of alert Type on alert detection time was influenced by the location of the alert.
Mean Response Time by Alert Location and Alert
Type
500
550
600
650
700
750
800
850
900
950
1000
1050
Left Middle Right All
Alert Location
Mean Response Tim
e (ms)
Sidebar (Static)
Border (Flashing)

14 DRDC Atlantic TM 2008-281
Figure 5: Overall Mean Response Time by Alert Type and Alert Location
To better understand the simple effects of alert Location and alert Type on response time, sixteen post hoc paired t-test comparisons were conducted. The Bonferroni-Sidak correction was used to control for family wise error rate (FWE) at α = 0.05 and resulted in a test-wise α = 0.003, meaning that paired t-tests are not significant until p < .003. For a summary of obtained test values and significance levels refer to Table 5. Paired t-tests revealed that the Sidebar condition was detected significantly faster than the Border at Right, Middle, and All display locations, but not at the Left location. Within the Flashing Border condition paired t-tests indicated that there were no significant differences regardless of alert location. With respect to the Sidebar condition, the Left display location (mean = 979 ms) was associated with significantly slower response times than Middle (mean = 838 ms) and All displays (769 ms), but there was no difference when compared to the Right display location (mean = 854 ms). Though not significant, it should be noted that the All display location was marginally faster than both Right and Middle locations. Had a less restricting correction been used to control FWE it is suspected that these comparisons would also have been reported significantly different in favour of the All display condition. Of course caution should be practiced when interpreting these t-values due to the skewed nature of some response time data.
Table 5: Post Hoc Paired t-test comparisons of Alert type and Location.
Paired Samples t-test of Common Log Response Times
Difference in Means
t-score
Sig. (2-tailed)
Pair 1 Left Sidebar - Left Border -0.0246 -1.2243 0.2344 Pair 2 Middle Sidebar - Middle
Border -0.0752 -4.5692 0.0002
Pair 3 Right Sidebar - Right Border -0.0797 -4.9017 0.0001 Pair 4 All Sidebar - All Border -0.1068 -8.7680 0.0000 Pair 5 Middle Sidebar - Left Sidebar -0.0610 -4.1022 0.0005 Pair 6 Middle Sidebar - Right Sidebar -0.0068 -0.4860 0.6320 Pair 7 Middle Sidebar - All Sidebar 0.0341 2.4833 0.0215 Pair 8 Right Sidebar - All Sidebar 0.0409 2.4878 0.0213 Pair 9 Left Sidebar - All Sidebar 0.0951 4.7126 0.0001 Pair 10 All Border - Right Border -0.0138 -1.2764 0.2158 Pair 11 All Border - Middle Border -0.0025 -0.2316 0.8191 Pair 12 All Border - Left Border -0.0129 -1.0344 0.3127 Pair 13 Middle Border - Left Border -0.0104 -1.1320 0.2704 Pair 14 Middle Border - Right Border -0.0112 -1.1554 0.2609 Pair 15 Left Sidebar - Right Sidebar 0.0542 2.7187 0.0129 Pair 16 Left Border - Right Border -0.0009 -0.1067 0.9160

DRDC Atlantic TM 2008-281 15
2.2.2.2 Secondary Task - Contact Identification
Tests of normality (Shapiro-Wilkes) on the sampling distribution for attempted identifications of contacts indicated that the data had a normal distribution. However, Mauchly’s Test of Sphericity revealed that the data were heteroscedastic, and as a result the Greenhouse-Geisser correction is used on subsequent F-statistics to reduce the chance of Type I error.
2.2.2.2.1 Number of Attempted Contact Identifications
Performance on the secondary task was measured by assessing the frequency of input on the Report display – or the number of attempted contact identifications, regardless of whether the report was correct and incorrect. A one-way repeated measures ANOVA revealed that Block (time on task) had a significant main effect on the number of attempted contact identifications [F(7,147) = 22.235, p < 0.01, MSe = .000]. As shown in Figure 6, generally speaking, the number of reports increased as time on task increased. A such, the analysis indicates that the number of contacts reported increased across time. The number includes correct and incorrect responses and is an indicator of the speed at which participants were performing the contact identification task. The results suggest a learning effect in that, as time progressed, participants continued to become more proficient, and more efficient in using the three displays and running through the sequence of steps that made up the contact identification task.
Mean Frequency of Attempted Contact Identifications
10
15
20
25
30
35
40
45
1 2 3 4 5 6 7 8
Block
Attempted Contact Identifications
Figure 6: Mean Frequency of Attempted Contact Identifications as a function of Block.
16 DRDC Atlantic TM 2008-281
2.2.2.2.2 Contact Identification Accuracy
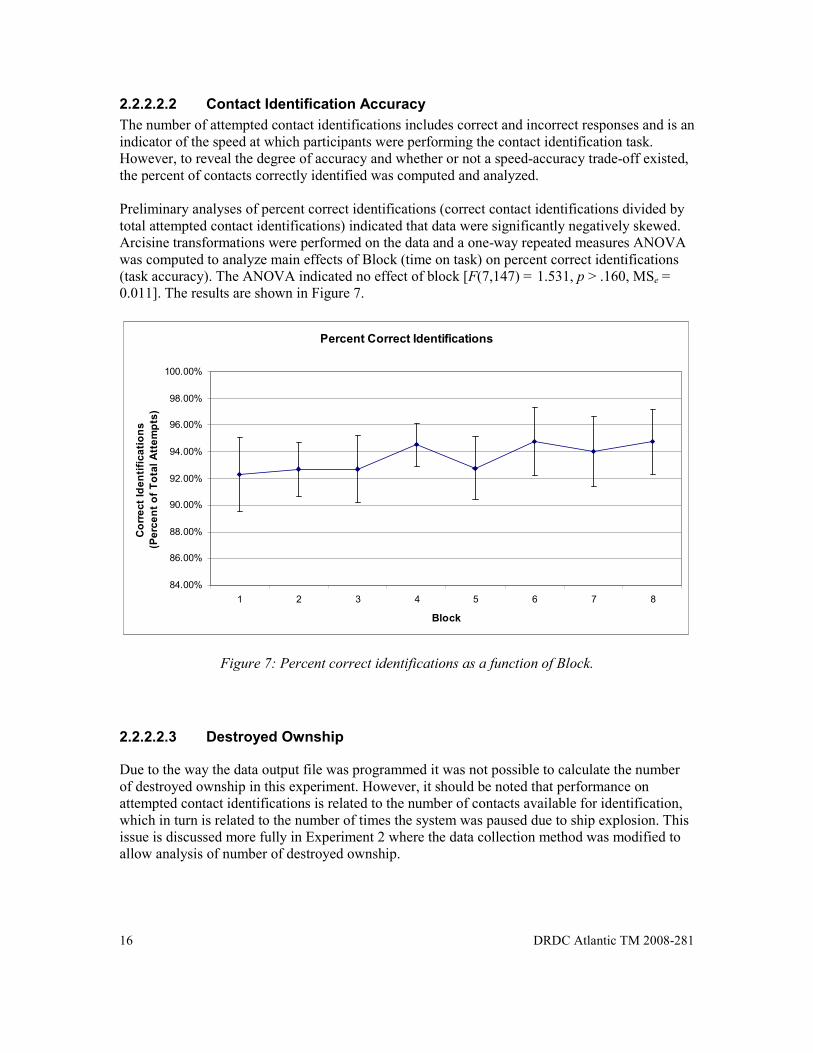
The number of attempted contact identifications includes correct and incorrect responses and is an indicator of the speed at which participants were performing the contact identification task. However, to reveal the degree of accuracy and whether or not a speed-accuracy trade-off existed, the percent of contacts correctly identified was computed and analyzed. Preliminary analyses of percent correct identifications (correct contact identifications divided by total attempted contact identifications) indicated that data were significantly negatively skewed. Arcisine transformations were performed on the data and a one-way repeated measures ANOVA was computed to analyze main effects of Block (time on task) on percent correct identifications (task accuracy). The ANOVA indicated no effect of block [F(7,147) = 1.531, p > .160, MSe = 0.011]. The results are shown in Figure 7.
Percent Correct Identifications
84.00%
86.00%
88.00%
90.00%
92.00%
94.00%
96.00%
98.00%
100.00%
1 2 3 4 5 6 7 8
Block
Correct Identifications
(Percent of Total Attempts)
Figure 7: Percent correct identifications as a function of Block.
2.2.2.2.3 Destroyed Ownship
Due to the way the data output file was programmed it was not possible to calculate the number of destroyed ownship in this experiment. However, it should be noted that performance on attempted contact identifications is related to the number of contacts available for identification, which in turn is related to the number of times the system was paused due to ship explosion. This issue is discussed more fully in Experiment 2 where the data collection method was modified to allow analysis of number of destroyed ownship.
DRDC Atlantic TM 2008-281 17
2.3 Discussion
The purpose of Experiment 1 was to investigate operators’ performance in detecting visual alerts while carrying out a high intensity secondary task and interacting with several displays. The operator’s task was purposefully designed to incorporate the use of a multi-display workstation and engage participants in the secondary task of identifying contact targets while detecting alerts appearing in the peripheral visual field of the displays.
Although participants were instructed to make detecting the alerts their primary task, it was anticipated that performing the secondary task would require a high level of attentional focus that might result in a phenomenon known as attentional tunnelling (Wickens, 2005). Attentional tunnelling occurs when attention is focused on the central spatial area of the display, creating an attentional spotlight, and in this state information and events occurring in the visual periphery are frequently missed, overlooked, or detected slowly or inaccurately. In Experiment 1, since alerts appeared in the periphery of the display, there was a high chance that attentional tunnelling would occur, and alerts would be missed or detected slowly. Two different alerting stimulus types were used and the goal of the study was to investigate whether there were differences in detection rate and accuracy as a function of alert type, as well as whether detection was affected by an alert appearing on one display or all displays.
Results suggest that, although accuracy was no different between the two alert types, response time was significantly slower for the flashing border alert as compared to the non-flashing sidebar. This is an interesting finding, and perhaps somewhat surprising given what we know about the physiological properties of vision. Movement is a highly salient cue that captures attention when it occurs in peripheral vision, outside the central fovea, and it is generally considered to be one of the flight or fight response defence mechanisms. Since the border alert was flashing it could, in a sense, be considered moving, at least more so than the static sidebar. Thus, we expected the flashing border to be more likely to capture a participant’s attention.
So the question arises as to why a static bar located in the periphery would be detected faster than a flashing border, especially considering the fact that overall real-estate occupied by the flashing border was greater than the sidebar. On the other hand, because the border was flashing and the sidebar was not, actual time visible, that is time on the screen, was less for the flashing border than for the sidebar. Consequently, participants may have been more likely to miss the border because it was an intermittent event.
Location of the alert was also investigated, primarily to determine whether there is a benefit to displaying visual alerts on all of the operator’s displays simultaneously, or whether presentation on only one will suffice. Thus, comparisons were made between alerts appearing on a single display and those appearing on multiple (3) displays. For accuracy, there was no advantage to presenting alerts on all three displays, and this was true regardless of whether the alert was the flashing border or the sidebar. For speed of detection, there was no effect of alert location for the flashing border. However, sidebar alerts were responded to marginally faster when the alert appeared on all the displays simultaneously, as compared to a single display. It should be noted here that a relatively conservative correction factor was used to control for Familywise Error. Had a less restricting correction been used, a more robust effect of alert type, in favour of the All display condition, would probably have been observed. Additionally note, that caution should be practiced in interpreting the data due to the skewed nature of some of the response time data.

18 DRDC Atlantic TM 2008-281
As previously stated, sidebar alerts were responded to significantly faster than border alerts, and this was true for all locations except when the alert appeared on the left display, where detection of the sidebar was significantly slower. One reason for slower responses to detecting the sidebar when it appeared on the left display might be that the position of the sidebar alert on the screen was always on the left hand side. Consequently, it was further out in the visual field on the left display than on any other display, and participants had to look further in the periphery to see it.
Another explanation for slower response times to alerts when they appeared on the left display may be implicit in the categorization task. The left display was the Status display where information related to contacts was presented and used in the decision-making process to judge whether a contact was hostile or neutral. At least that was the experimenters’ intention - however, there were only two contact types (hostile/neutral) in the task and consequently a 50% chance of making a correct report on the Reporting display. Thus, participants could perform quite well without using the Status display information to help make their choice. Since feedback was provided on the Report display, an incorrect response could easily be rectified by immediately replacing it with a correct response. Although there is no evidence that individuals were using this strategy in Experiment 1, the requirement to use the Status display was purposely increased in Experiment 2.
Performance on the secondary task, contact identification, was also analyzed because it provides an indication of overall task difficulty as well as the intrusiveness of alert detection. Across time we note that performance on contact identification improved so that individuals were responding to more contacts as the trial progressed. This indicates somewhat of a learning effect as individuals become more proficient at performing the sequence of steps required to conduct contact identification. Although the number of contacts identified increased across time, accuracy remained relatively stable and high. In fact, over 90% of contacts tagged were identified correctly. Coupled with the high level of accuracy observed on detecting alerts, this finding suggests somewhat of a ceiling effect on the overall task. Ceiling effects can mask effects of interest and in this experiment it was especially important to ensure that the secondary task was sufficiently challenging to engage attentional resources. Nevertheless, effects showing differences in responding to the two types of alerts were obtained, suggesting that generally the task was one that required a sufficient level of effort.
DRDC Atlantic TM 2008-281 19
3 Experiment 2
The main question stemming from the findings in Experiment 1, that a static sidebar alert is detected faster than a flashing border, is whether it is the Flashing/Static component or the Sidebar/Border component of the stimulus that is the contributing factor. Experiment 2 was designed to investigate this question further by completely counterbalancing stimulus attributes. Thus, Experiment 2 included 2 alert Types (Sidebar, Border) and 2 alert Behaviours (Static, Flashing), along with 4 alert Locations (Left, Middle, Right, All). Several relatively minor modifications were included as well, all of which are discussed below in the appropriate sections. Formatting the data in Experiment 1 for analysis was labour intensive. Most of the data entry was not automated. Upon further scrutiny, some of the data files have revealed a degree of error. For Experiment 2 a parsing file was created to automate data entry when formatting the data for analysis, thus reducing input error.
3.1 Method
3.1.1 Participants
Twenty-five participants (13 males, 12 females) were recruited from DRDC-Atlantic (civilians, Canadian Forces (CF) employees, and ex-CF) and Dalhousie University. Participant recruitment procedures were consistent with those of Experiment 1 (see Annex B). One participant’s data was considered an outlier and removed from the data set, leaving 24 participants (12 males, 12 females). Participants mean age was 33.58 (SD=13.58) with a range of 18 to 63 years, all reported normal or corrected-to-normal vision, and 88% were right-handed. Fourteen of the 24 participants indicated that they had previous experience with multiple displays while multitasking. Experimental sessions were approximately 1 hour and 30 minutes in duration. Participants were reimbursed according to DRDC Toronto stress level guidelines (Pigeau, R., 1992). DRDC staff conducted Experiment 2.
3.1.2 Apparatus
The apparatus used in Experiment 2 was identical to that used in Experiment 1, with the following exceptions:
3.1.2.1 Left display – Status display
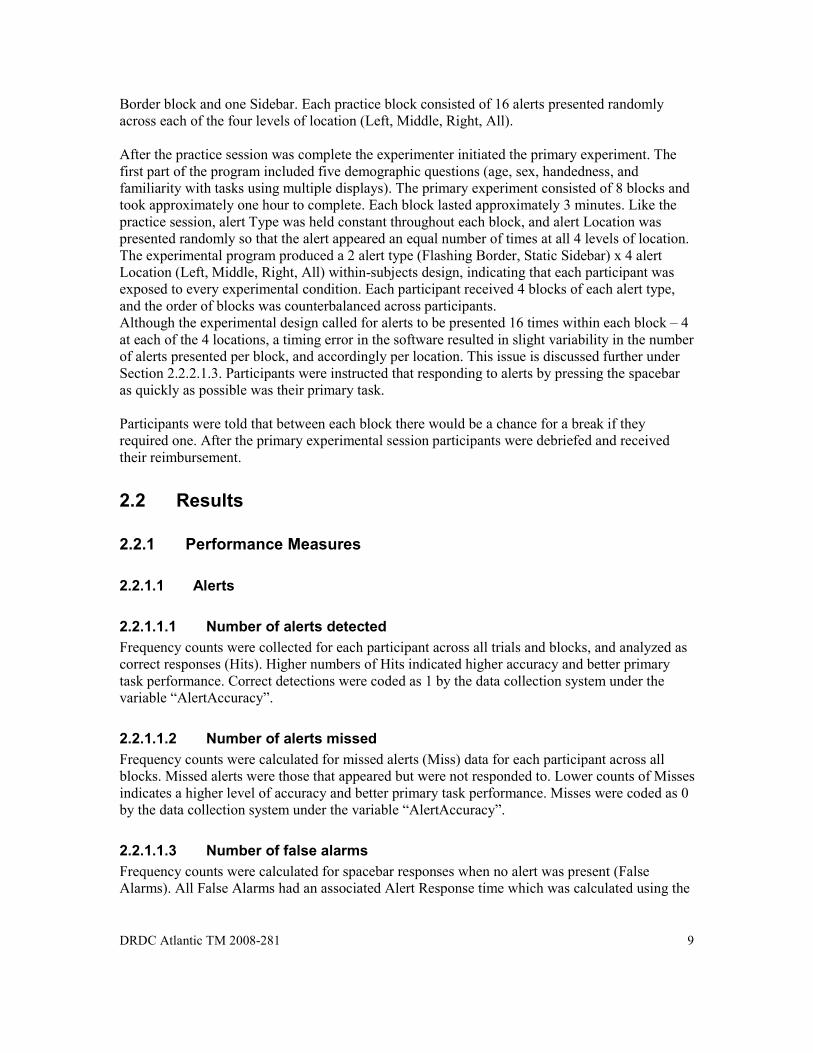
Unlike Experiment 1, the Status display included two buttons, labelled “Neutral” and “Hostile”, located directly below the contact information. Participants were required to use the mouse to press the correct box on the Status display once they had decided on the category of the contact. Necessitating use of the mouse on the Status display was introduced as an effort to equalize the use of all three displays and reduced the chance of participants failing to dedicate an adequate portion of their attention to the left display. An example of the added boxes can be viewed in Figure 8. Note that the top button has been selected and therefore highlighted in yellow.

20 DRDC Atlantic TM 2008-281
3.1.2.2 Right display - Report display
The Report display would not accept an entry until the “neutral” or “hostile” button on the Status display was selected. When that button was selected a blue border around “ENTER” on the Report display changed to yellow. This change served to indicate to the operator that the Report display was active. As in Experiment 1, participants typed “qwe” or “asd” into the textbox to report their classification. An example of the “ENTER” border in yellow can be seen in Figure 8 below.
Figure 8: Example of Apparatus used in Experiment 2; note changes in left and right displays.
3.1.2.3 Demographic data
To address an independent question, of interest to one of the researchers, an additional question, ‘number of hours reading’, was added to the demographic data collected from each participant at the beginning of the experiment. Reading ability has been suggested to be highly correlated with efficient scanning eye movements (known as saccades) (Matlin, 2005). Saccades are recognized as being an important part of visual attention (Pineal, 2007; Matlin, 2005) and serve to create a more detailed visual representation of our environment (Pineal, 2007). Visual detail and color recognition fade as stimuli get deeper into our peripheral visual field (further from our visual focus) (Pineal, 2007). Saccades are unconsciously performed to slightly shift visual focus (where visual acuity is greatest) to our left or right visual periphery, bringing more detail into our visual representation of our environment. Therefore it would seem beneficial to peripheral alert recognition if saccades were more efficient in bringing peripheral visual field into more detail. In an attempt to understand if saccades are a factor in alert detection a demographic question was included which recorded time spent reading for pleasure for each participant. Correlations will be run to quantify the relationship between time spent reading for pleasure and primary task metrics.
DRDC Atlantic TM 2008-281 21
Nine participants reported reading for pleasure 4-6 hours/week, nine reported reading for pleasure less than four hours/week, and six reported reading for seven hours or more. Future work is planned to analyze the correlation between performance on alert detection and number of hours spent reading for pleasure.
3.1.3 Procedure
The procedure used in Experiment 2 was the same as Experiment 1, with the following exceptions: Participant instructions were modified slightly (see Annex B). Participants ran through 4 blocks of practice trials, as compared to 2 in Experiment 1. Based on the observation in Experiment 1 of performance improving across blocks in the experimental trials, the additional trials were added in Experiment 2 to bring performance up to asymptote prior to the experimental trials, thereby reducing the potential for a learning bias. Also, 4 blocks were required to ensure that all the experimental conditions were included in the practice trials. In Experiment 1, the task scenario was paused for 5 seconds during the ownship ‘explosion’ event. Participants commented that the 5 second buffer was too long and in Experiment 2 the pause was reduced to 3 seconds. This also helped somewhat in alleviating the potential situation discussed in Experiment 1 whereby a block could end before the preassigned number of alerts were presented. Trimming the buffer period served to increase time on task and therefore increase the total time available for alerts to be presented.
3.2 Results
3.2.1 Performance Measures
Performance measures were similar to Experiment 1. They are listed here, with any differences noted.
3.2.1.1 Alert Responses
3.2.1.1.1 Number of alerts detected
Participants initiated alert dismissals by pressing the spacebar, and correct responses were recorded as Hits. Frequency counts were collected and analyzed for alert Hit data for each participant across all trials and blocks. Higher numbers of Hits to alerts indicated higher accuracy and better performance. A code of 1 was applied to those alerts that were responded to. Note: After close inspection of the software program (possible because a full-time staff member was dedicated to data collection), an inaccuracy in data collection was discovered during the pilot. Due to the way the script was programmed only the latest response (spacebar press) in every 2 second window was recorded. Thus, if a spacebar response cancelled an alert (Hit) and was followed closely by another spacebar press (False Alarm) the output data file would overwrite the Hit data and only contain evidence of the False Alarm. Fortunately the number of
22 DRDC Atlantic TM 2008-281
times this situation was likely to occur was extremely low due to an appropriate level of difficulty inherent in the task. In preparation for any future work the software has since been modified so that it collects event-based data rather than time-based.
3.2.1.1.2 Number of False Alarms and alerts Missed
Unlike Experiment I, False Alarms were not considered Misses in Experiment 2 and were recorded as ‘2’, Misses being recorded as “0”. However, as previously discussed in Experiment 1, the time-based procedure for collecting responses resulted in potentially inflated False Alarm counts and lower Hit counts, since the last spacebar response overwrote any previous responses within each 2 second window. The number of occasions where more than one spacebar press per alert occurred is negligible. However, modifications to the software since Experiment 2 have removed this flaw resulting in more accurate data collection and a truer reflection of False Alarms and Hits in future work.
3.2.1.1.3 Response time to alerts
Alerts dismissed by the participant were recorded as a Hits. Average alert response time was calculated per condition per participant across blocks. Shorter alert response times indicate better task performance.
3.2.1.2 Contact Identification
As in Experiment 1, frequency counts of correct identifications, frequency counts of incorrect identifications, and frequency counts of total attempted identifications were calculated and used as indicators of secondary task performance. Arcsine transformations were applied to the data for analysis purposes, but absolute means are reported in the figures.
3.2.1.3 Number of destroyed ownship
Instances of destroyed ownship were recorded by the program. Frequency counts of destroyed ownship were analyzed per block. Lower frequency counts indicate better secondary task performance.
The data were analyzed to evaluate participant’s response time on alert Hits, participants alert Hit/Miss data, and participants ability to accurately identify contacts. Significant main effects within alert Hit reaction times are indicators of differences in performance as a result of alert type and alert location; the same holds true for alert Hit/Miss data. Participant’s performance in contact identification indicates how well participants performed their secondary (high intensity) task. All data used in analyses was first checked for incomplete data sets, participant outliers, and normality.
3.2.2 Data Analysis
The data were analyzed to evaluate participants’ alert Hit/Miss data, response time on Hits, and participants’ ability to accurately identify contacts. Significant main effects within alert Hit

DRDC Atlantic TM 2008-281 23
reaction times are indicators of differences in performance as a result of alert type and alert location; the same holds true for alert Hit/Miss data. Participant’s performance in contact identification indicates how well they performed the secondary (high intensity) task. All data used in analyses was first checked for incomplete data sets, participant outliers, and normality. Accuracy data was normalized for analysis by arcsine transformation.
3.2.2.1 Primary Task – Alert
3.2.2.1.1 Normality
Since the calculation of F-statistics assumes that the data comes from a normal distribution the Shapiro-Wilkes test was conducted on all data prior to inferential statistics.
Fifteen of the possible 16 reaction time distributions were found to violate normality. Inspection of their skewness revealed all distributions were positively skewed and since response time data is known to be exponentially distributed a log transformation was applied. Previous papers examining the transformation of reaction time data suggest the natural log (loge) transformation as most suitable (Czarnolewski, 1996). Thus in Experiment 2 a loge transformation was applied to all response time data,, as compared to Log10 in Experiment 1. A subsequent Shapiro-Wilkes test revealed that 8 of the possible 16 distributions continued to exhibit non-normality.
Shapiro-Wilkes test indicated alert Hit data had a significant negative skew. The root arcsine transformation (see Experiment 1) was unable to normalize the Hit data for Experiment 2. Hit frequency counts reveal ceiling effects similar to Experiment 1.
Shapiro-Wilkes Test of Normality also indicated that all alert Miss data violated the assumption of normality. Transformations were not able to normalize alert Miss data.
Shapiro-Wilkes tests were also run on Ownship Explosion data, Total Attempted Contact Identification data, and Percent Correct Contact Identification data. Results indicated that Ownship Explosion and Percent Correct Contact Identification data violated the assumption of normality, while one of the possible 16 attempted contact identification distributions violated the assumption of normality.
3.2.2.1.2 Alert Accuracy
Despite non-normality of the Hit data, cell means for alert Type (Sidebar, Border), alert Behaviour (Flashing, Static) and alert Location (Left, Middle, Right, All), for each participant, were entered into a repeated measures ANOVA. Mauchly’s Test of Sphericity was non-significant for alert type and alert location, but significant for their interaction (W=.381, df = 5, p < 0.01) violating the assumption of sphericity. The Greenhouse-Geisser correction was applied to the interaction F statistic.
A marginal effect of alert Behaviour was observed [F(1,23) = 5.62, p < .05, MSe =.012] showing that a flashing alert (mean – 15.27) resulted in significantly more hits as compared to Static (Mean 15.23). No effect of alert Type [F(1,23) = 1.179, p > 2.88, MSe =.005], or alert Location
24 DRDC Atlantic TM 2008-281
[F(3,69) = 2.006, p > .121, MSe =.007] were present, although a nominally significant interaction of alert Type and Location existed ([F(2.028,46.641) = 3.307, p < .05, MSe =.008].
3.2.2.1.3 Alert Misses
Similar to alert Hit data, a repeated measures ANOVA was conducted on alert Miss data to test for main effects of alert Type, Behaviour, and alert Location. Mauchly’s Test of Sphericity indicated that the interaction of alert Type and Location violated the assumption of sphericity and, as a result the Greenhouse-Geisser correction was applied to the F-statistic. A main effect of alert Behaviour was detected [F(1,23) = 5.683, p < 0.05, MSe = 0.012] showing significantly less Misses for alerts that were Flashing (mean = .047) compared to Static alerts (mean = .161). Neither alert Type [F(1,23) = 1.175, p > 0.289, MSe = 0.004] or alert Location [F(3,69) = 2.033, p > 0.117, MSe = 0.008] were deemed significant, although the alert Type by alert Location interaction [F(2.059,47.365) = 3.217, p < 0.05, MSe = 0.007] was marginally significant.
3.2.2.1.4 Alert Response Time
Alert response time was collected for all user spacebar inputs. Only alert response times associated with Hits were analyzed. Violations of normality prompted the transformation of alert Hit reaction times using the natural log (loge). The loge of reaction times were collapsed across blocks and averaged by condition. Despite the transformation Shapiro-Wilkes normality test revealed that 5 of the possible 16 condition distributions violated the assumption of normality for repeated measures ANOVA.
A repeated measures ANOVA on the loge reaction time data was performed on cell means of alert Type (Sidebar, Border), alert Behaviour (Flashing, Static) and alert Location (Left, Middle, Right, All), for each participant. A significant effect of alert Type [F(1,23) = 81.131, p < 0.01, MSe = 0.024], and Location [F(3,69) = 45.79, p < 0.01, MSe = 0.008] were revealed, with an interaction between Type and Location [F(3, 69) = 40.906, p < 0.01, MSe = 0.005]. No effect of alert Behaviour was observed [F(1,23) = 0, p > 0..991, MSe = 9.59x10⁻⁷] Results are shown in Figure 9 and are discussed further in the following section.
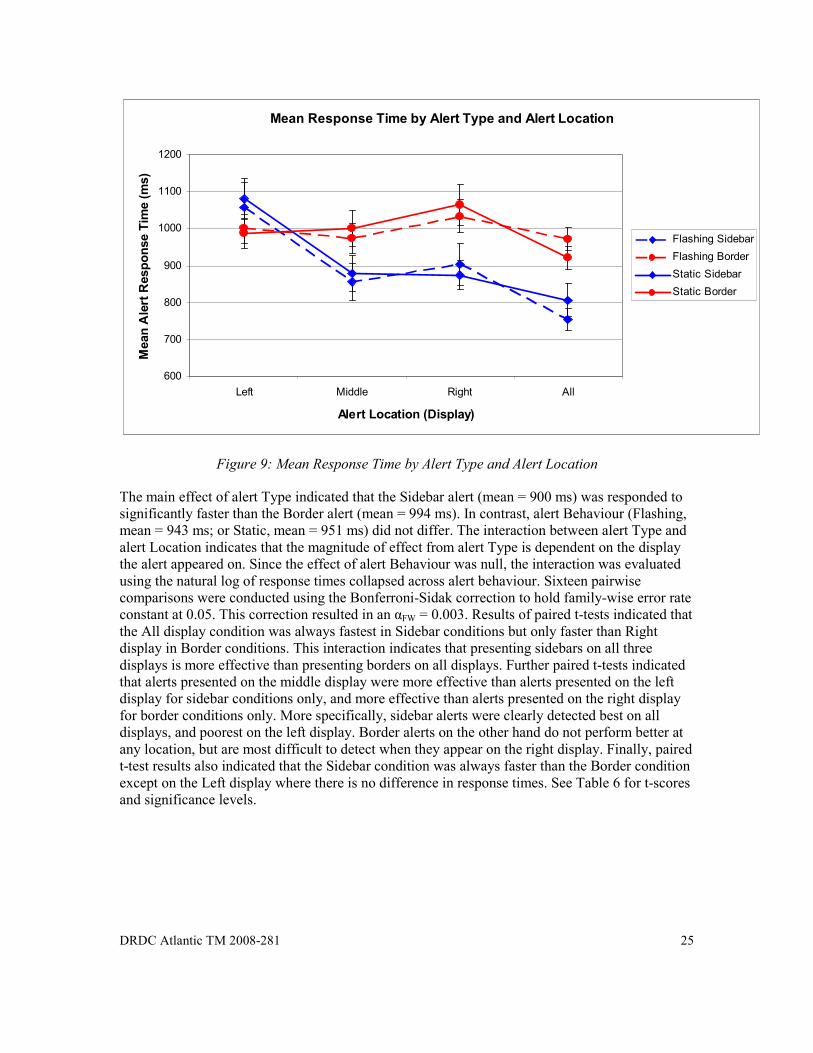
DRDC Atlantic TM 2008-281 25
Mean Response Time by Alert Type and Alert Location
600
700
800
900
1000
1100
1200
Left Middle Right All
Alert Location (Display)
Mean Alert Response Tim
e (ms)
Flashing Sidebar
Flashing Border
Static Sidebar
Static Border
Figure 9: Mean Response Time by Alert Type and Alert Location
The main effect of alert Type indicated that the Sidebar alert (mean = 900 ms) was responded to significantly faster than the Border alert (mean = 994 ms). In contrast, alert Behaviour (Flashing, mean = 943 ms; or Static, mean = 951 ms) did not differ. The interaction between alert Type and alert Location indicates that the magnitude of effect from alert Type is dependent on the display the alert appeared on. Since the effect of alert Behaviour was null, the interaction was evaluated using the natural log of response times collapsed across alert behaviour. Sixteen pairwise comparisons were conducted using the Bonferroni-Sidak correction to hold family-wise error rate constant at 0.05. This correction resulted in an αFW = 0.003. Results of paired t-tests indicated that the All display condition was always fastest in Sidebar conditions but only faster than Right display in Border conditions. This interaction indicates that presenting sidebars on all three displays is more effective than presenting borders on all displays. Further paired t-tests indicated that alerts presented on the middle display were more effective than alerts presented on the left display for sidebar conditions only, and more effective than alerts presented on the right display for border conditions only. More specifically, sidebar alerts were clearly detected best on all displays, and poorest on the left display. Border alerts on the other hand do not perform better at any location, but are most difficult to detect when they appear on the right display. Finally, paired t-test results also indicated that the Sidebar condition was always faster than the Border condition except on the Left display where there is no difference in response times. See Table 6 for t-scores and significance levels.
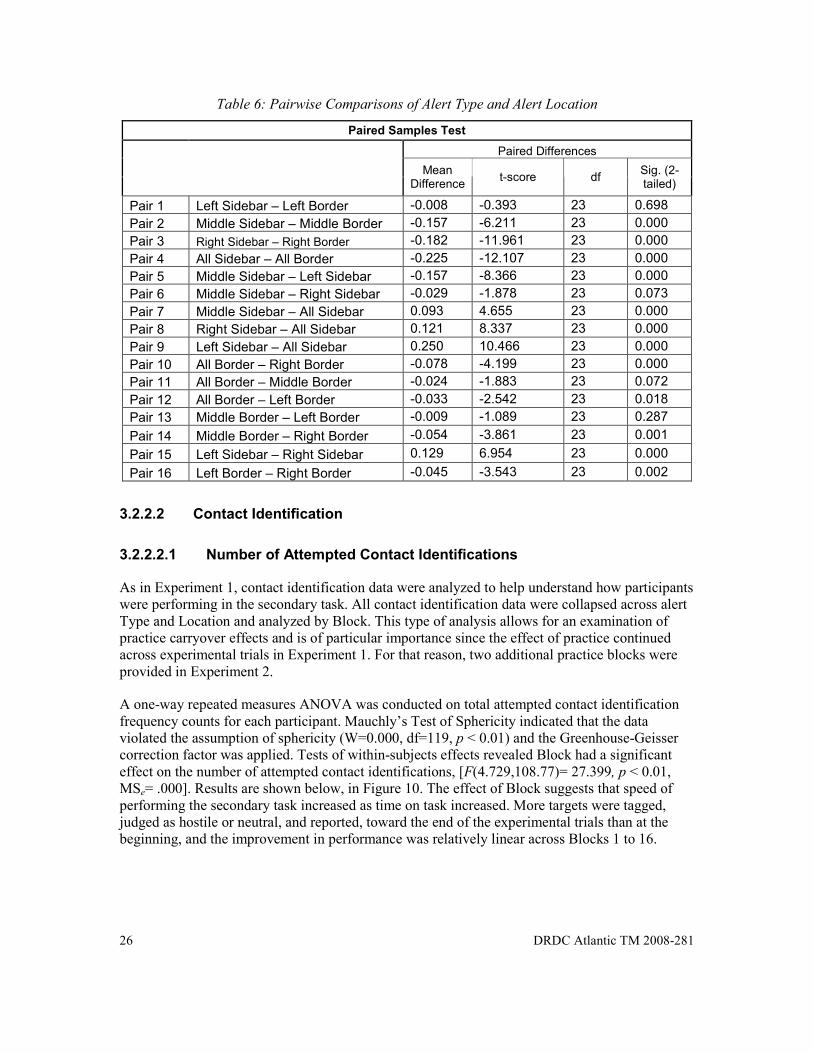
26 DRDC Atlantic TM 2008-281
Table 6: Pairwise Comparisons of Alert Type and Alert Location
Paired Samples Test
Paired Differences
Mean Difference
t-score df Sig. (2-tailed)
Pair 1 Left Sidebar – Left Border -0.008 -0.393 23 0.698
Pair 2 Middle Sidebar – Middle Border -0.157 -6.211 23 0.000
Pair 3 Right Sidebar – Right Border -0.182 -11.961 23 0.000
Pair 4 All Sidebar – All Border -0.225 -12.107 23 0.000
Pair 5 Middle Sidebar – Left Sidebar -0.157 -8.366 23 0.000
Pair 6 Middle Sidebar – Right Sidebar -0.029 -1.878 23 0.073
Pair 7 Middle Sidebar – All Sidebar 0.093 4.655 23 0.000
Pair 8 Right Sidebar – All Sidebar 0.121 8.337 23 0.000
Pair 9 Left Sidebar – All Sidebar 0.250 10.466 23 0.000
Pair 10 All Border – Right Border -0.078 -4.199 23 0.000
Pair 11 All Border – Middle Border -0.024 -1.883 23 0.072
Pair 12 All Border – Left Border -0.033 -2.542 23 0.018
Pair 13 Middle Border – Left Border -0.009 -1.089 23 0.287
Pair 14 Middle Border – Right Border -0.054 -3.861 23 0.001
Pair 15 Left Sidebar – Right Sidebar 0.129 6.954 23 0.000
Pair 16 Left Border – Right Border -0.045 -3.543 23 0.002
3.2.2.2 Contact Identification
3.2.2.2.1 Number of Attempted Contact Identifications
As in Experiment 1, contact identification data were analyzed to help understand how participants were performing in the secondary task. All contact identification data were collapsed across alert Type and Location and analyzed by Block. This type of analysis allows for an examination of practice carryover effects and is of particular importance since the effect of practice continued across experimental trials in Experiment 1. For that reason, two additional practice blocks were provided in Experiment 2.
A one-way repeated measures ANOVA was conducted on total attempted contact identification frequency counts for each participant. Mauchly’s Test of Sphericity indicated that the data violated the assumption of sphericity (W=0.000, df=119, p < 0.01) and the Greenhouse-Geisser correction factor was applied. Tests of within-subjects effects revealed Block had a significant effect on the number of attempted contact identifications, [F(4.729,108.77)= 27.399, p < 0.01, MSe= .000]. Results are shown below, in Figure 10. The effect of Block suggests that speed of performing the secondary task increased as time on task increased. More targets were tagged, judged as hostile or neutral, and reported, toward the end of the experimental trials than at the beginning, and the improvement in performance was relatively linear across Blocks 1 to 16.

DRDC Atlantic TM 2008-281 27
Mean Number of Attempted Contact Identifications by Block
20
22
24
26
28
30
32
34
36
1 2 3 4 5 6 7 8 9 10 11 12 13 14 15 16
Block
Mean Frequency of Attempted Contact ID's
Figure 10: Mean Frequency Count of Total Attempted Contact Identifications by Block
3.2.2.2.2 Correct Identifications Accuracy
Proportion correct identifications of total attempted identifications were calculated by counting the number of correct identifications in a block and dividing it by the number of total attempted identifications. This percentage is used as a metric of the accuracy to which participants performed the secondary, high intensity task. The analysis of total attempted contact identifications previously discussed, showed that speed of performing the secondary task increased across blocks. The present analysis, of the proportion of contacts identified correctly will determine the presence of any speed-accuracy trade-off – that is, cases where increased speed of performing a task is coupled with a decrease in accuracy.
Despite violation of normality, arcsine transformation was applied and the data were entered into a one-way repeated measures ANOVA to examine the effect Block had on performance accuracy on the contact classification task. Mauchly’s Test of Sphericity indicated assumption of sphericity was violated [W=0.000, df=119, p < 0.032] so the Greenhouse-Geisser correction method was used for F-statistics. As shown in Figure 11, the results indicated that Block did have a significant effect on accuracy [F(7.956,182.994) = 3.026, p < 0.004, MSe=0.019]. This result indicates that accuracy on the secondary task did change as a function of block, or time on task. However, the direction was in favour of increased accuracy and therefore contrary to a speed-accuracy trade-off. Accuracy overall was high suggesting that participants were very good at deciding whether a contact was neutral of hostile.

28 DRDC Atlantic TM 2008-281
Mean Percentage of Correct Identifications by Block
88.00%
90.00%
92.00%
94.00%
96.00%
98.00%
100.00%
1 2 3 4 5 6 7 8 9 10 11 12 13 14 15 16
Block
Mean Percentage Correct ID's
Figure 11: Mean Percentage of Correct Identifications by Block
3.2.2.3 Destroyed Ownship
The number of destroyed ownship reflects the ability to identify contacts accurately and quickly and is an indicator of overall task performance. Frequency counts of ownship explosions were analyzed to determine whether there was evidence of a practice effect across 16 blocks. Despite violations of normality a one way repeated measures ANOVA was used to determine the effect of Block on the number of destroyed ownship. Due to three identical scores for three separate blocks, a significance value could not be obtained for Mauchly’s Test, but because Mauchly’s W=0.000 the Greenhouse-Geisser correction was applied to reduce the chance of Type 1 error.
A main effect of Block was discovered, [F(4.785, 110.050) = 3.221, p < 0.05, MSe = 0.424], indicating that the number of ownship explosions was dependent on Block, or time on task (see Figure 12).
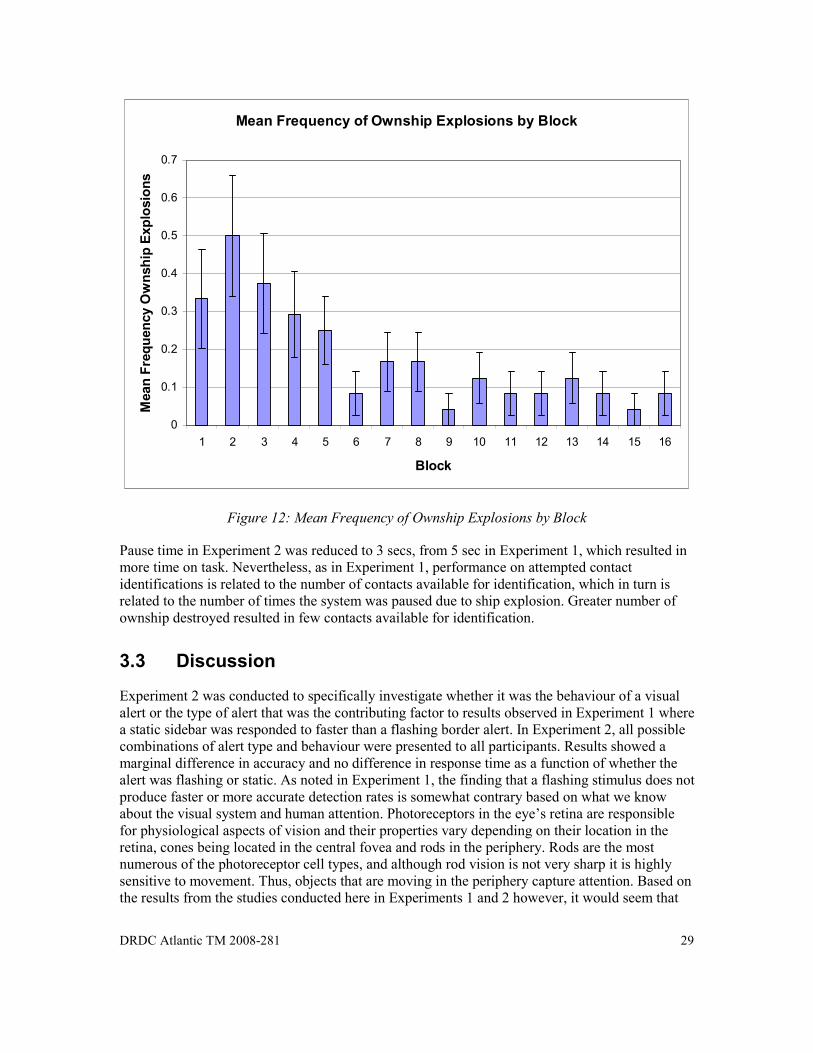
DRDC Atlantic TM 2008-281 29
Mean Frequency of Ownship Explosions by Block
0
0.1
0.2
0.3
0.4
0.5
0.6
0.7
1 2 3 4 5 6 7 8 9 10 11 12 13 14 15 16
Block
Mean Frequency Ownship Explosions
Figure 12: Mean Frequency of Ownship Explosions by Block
Pause time in Experiment 2 was reduced to 3 secs, from 5 sec in Experiment 1, which resulted in more time on task. Nevertheless, as in Experiment 1, performance on attempted contact identifications is related to the number of contacts available for identification, which in turn is related to the number of times the system was paused due to ship explosion. Greater number of ownship destroyed resulted in few contacts available for identification.
3.3 Discussion
Experiment 2 was conducted to specifically investigate whether it was the behaviour of a visual alert or the type of alert that was the contributing factor to results observed in Experiment 1 where a static sidebar was responded to faster than a flashing border alert. In Experiment 2, all possible combinations of alert type and behaviour were presented to all participants. Results showed a marginal difference in accuracy and no difference in response time as a function of whether the alert was flashing or static. As noted in Experiment 1, the finding that a flashing stimulus does not produce faster or more accurate detection rates is somewhat contrary based on what we know about the visual system and human attention. Photoreceptors in the eye’s retina are responsible for physiological aspects of vision and their properties vary depending on their location in the retina, cones being located in the central fovea and rods in the periphery. Rods are the most numerous of the photoreceptor cell types, and although rod vision is not very sharp it is highly sensitive to movement. Thus, objects that are moving in the periphery capture attention. Based on the results from the studies conducted here in Experiments 1 and 2 however, it would seem that

30 DRDC Atlantic TM 2008-281
we cannot make the assumption that flashing in this context is an attention grabbing form of movement.
Results from Experiments 1 and 2 clearly demonstrate superior detectability of the sidebar alert over a border alert. So what is it about the sidebar alert that makes it win out over perimeter border alerts in both these experiments? Peripheral vision picks up the subtle shifts in energy patterns that help direct attention. One possibility worth considering is that the visual system calibrates a ‘radar’ field depending on the size of the visual area in use. In that case it might be that alerts appearing on the same display are not detected as well as alerts that sit outside the field of view of a single display. This question could be addressed by examining the association between spatial location of operator attention and the location (display) of the alert.
Ideally this kind of data could be collected by monitoring eye movement using eye-tracking equipment, to observe what display an operator is looking at when an alert appears, and what display an alert appears on. But a more accessible, though admittedly less sophisticated, method would be to record the location of the mouse cursor on the workstation. This sort of data would provide a relatively good indication of where the operator was looking at the time an alert appeared. A study to investigate the effect of presenting alerts on the same or different displays where operators’ attention is focused is planned.
Another variable of interest in Experiments 1 and 2 of course was the location of alerts with respect to the display they appeared on. In general, alerts response rate was faster when alerts appeared on all three displays simultaneously. Alert on the left display stood out as producing generally slower response times in Experiment 1 and measures were taken in Experiment 2 to increase the requirement to use the left display and equate it with use of the other two displays. This modification appeared to be somewhat successful in increasing the level of use associated with the left display, but results from Experiment 2 continued to show that alert detection on the left display was poorer when compared other displays. One reason discussed is that the location of the sidebar alert is always on the left-hand side of the display. This means that the alert appears at a disproportionally wide visual angle as compared to the right or middle displays. In future work the spatial location of the sidebar will be changed so that it is equal across all displays (e.g., placed at the top or bottom of the display screen).
In summary, sidebar alerts were detected faster than border alerts and alerts were detected faster when the appeared on all displays. The left display showed disproportionately slow detection rates as compared to the other displays. Measures to address this issue are pending. Future work will investigate the relationship between operators’ spatial attentional focus and display location of alerts.

DRDC Atlantic TM 2008-281 31
References .....
1. Colavita, F. B., & Weisberg, D. (1979). A further investigation of visual dominance. Perception and Psychophysics, 25, 345-347.
2. Cooper, R. (1998). Visual Dominance and the Control of Action. Proceedings of the 20th Annual Conference of the Cognitive Science Society, pp. 250-255.
3. Czarnolewski, M. (1996). An empirical validation for the natural log transformation of reaction time. Paper presented at the annual meeting of the Human Factors and Ergonomics Society, Philadelphia, PA.
4. Donmez, B., Boyle, L. N., & Lee, J. D. (2006). Drivers' attitudes toward imperfect distraction mitigation strategies. Transportation Research Part F: Traffic Psychology, 9(6), 387-398.
5. Hogg, R. V., Craig, A.& McKean (2005). Introduction to mathematical statistics. 5th Edition. New Jersey: Prentice Hall.
6. Matlin, M. W. (2005). Percpeptual Processes II: Attention and Consciousness, pp.78-80. In Cognition: Sixth Edition. Crawfordsville: John Wiley & Sons.
7. Pigeau, R. (1992). Command Group’s Guide to stress compensation for human subjects. Unpublished DRDC Document, DRDC Toronto.
8. Pinel, J. P. J. (2007). The Visual System, pp.108-112. In Basics of Biopsychology. Boston: Pearson Education.
9. Posner, M. I., Nissen, M. J., & Klein, R. M. (1976). Visual dominance: An information-processing account of its origins and significance. Psychological Review, 83, 157-171.
10. Roberts, S., & Foster-Hunt, T. (2008). Evaluation of visual alerts in the maritime domain: Behavioural research study. DRDC Atlantic Contract Report CR 2008-057.
11. Roberts, S. (2008) Evaluation of Alerts in the maritime domain: Study 2 program modifications. DRDC Atlantic Contract Report CR 2008- 268.
12. Salvendy, G., (1997) Ed. Chapter 7: Evaluation. In Handbook of Human Factors and Ergonomics. New York: Wiley, second edition, pp. 1449-1633.
13. Wickens, C. D. (2005). Attentional tunnelling and task management. Proceedings of the 13th International Symposium on Aviation Psychology, Dayton, OH.

32 DRDC Atlantic TM 2008-281
This page intentionally left blank.

DRDC Atlantic TM 2008-281 33
Annex A Participant Instructions – Experiment 1
Prior to reading the on screen instructions participants were read the following:
“You are a control operator on a Navy ship. Your primary responsibility is to attend and respond to visual alerts that appear on your displays. Your secondary task is to determine whether targets approaching your ownship are neutral or hostile. I will have you read the first screen for instruction and they we will continue…”
Participants then read the following on the middle screen:
“There are two types of visual alerts that will appear on your displays; a red bar that will always appear on the left top area of the display and a red border that surrounds the periphery of your screen. Only one type of display will appear at a time. The displays may appear on the left display, middle display, right display or all three at once. When you hit the space bar the alert will disappear immediately. Alerts, if not responded to will disappear after a short duration. Just to remind you – it is your primary task to respond to alerts. Any target, whether it is neutral or hostile will destroy your ownship if it reaches the center of the screen. You do not have to move the cursor inside the textbox to enter your answer – you may just type. However, you will need to move the cursor over the enter button on the right screen and click enter with the mouse. You are not able to enter your answer using the “enter button” on the keyboard. To summarize: Responding to alerts is your primary task, your secondary task is to identify whether approaching targets are neutral or hostile. Do you have any questions?”

34 DRDC Atlantic TM 2008-281
This page intentionally left blank.

DRDC Atlantic TM 2008-281 35
Annex B Participant Instructions – Experiment 2
Hello Participant… This experiment will require you to respond to visual alarms that will appear in various locations across your three displays. You will also be required to monitor the center tactical display and evaluate if the incoming ships (triangular targets) are neutral or hostile. Primary Task: Respond to all red alarms. When an alarm appears, press the space bar IMMEDIATELY. Hit any key to continue... Secondary Task: Identify targets as neutral or hostile. To obtain target information, place the cursor over the triangular target and left click the mouse. The information you will use to determine if a target is neutral or hostile will appear on the left screen. Evaluate the information, select the corresponding button, and enter your answer in the text box on the right screen. To enter your answer type "qwe"=neutral or "asd"=hostile. Use the mouse to select "Enter". Correct entries will cause the target to disappear, if the entry is incorrect, the target will continue towards your ownship. If a single target reaches your ownship it will be destroyed. REMEMBER: Your primary task is to respond to red alerts using space bar! Do you have any questions for the Experimenter? GOOD LUCK! Hit any key to begin experiment...
This page intentionally left blank.

36 DRDC Atlantic TM 2008-281
This page intentionally left blank.

DRDC Atlantic TM 2008-281 37
Distribution list
Document No.: DRDC Atlantic TM 2008-281
LIST PART 1: Internal Distribution by Centre
5 DRDC Atlantic Library 2 Jacquelyn Crebolder (SA) 1 HARD COPY + 1 CD
7 TOTAL LIST PART 1
LIST PART 2: External Distribution by DRDKIM 1 Library and Archives Canada 1 DRDKIM
1 1
DRDC Toronto PO Box 2000 Toronto, Ontario M3M 3B9 Attention: Sharon Abel Ann Nakashima
1 1 1 1
ADM(MAT) DGMPD (L&S) PMO CSC 105 Hotel de Ville National Defence 101 Colonel By Drive Ottawa, Ontario K1A 0K2 Attention: Denis Gendron LCdr Jacques Olivier Capt Alexander Natale Philippe Nitchuk
8 TOTAL LIST PART 2
15 TOTAL COPIES REQUIRED

38 DRDC Atlantic TM 2008-281

DOCUMENT CONTROL DATA (Security classification of title, body of abstract and indexing annotation must be entered when the overall document is classified)
1. ORIGINATOR (The name and address of the organization preparing the document. Organizations for whom the document was prepared, e.g. Centre sponsoring a contractor's report, or tasking agency, are entered in section 8.)
Defence R&D Canada – Atlantic 9 Grove Street P.O. Box 1012 Dartmouth, Nova Scotia B2Y 3Z7
2. SECURITY CLASSIFICATION (Overall security classification of the document including special warning terms if applicable.)
UNCLASSIFIED
3. TITLE (The complete document title as indicated on the title page. Its classification should be indicated by the appropriate abbreviation (S, C or U) in parentheses after the title.)
Investigating Visual Alerting in Maritime Command and Control
4. AUTHORS (last name, followed by initials – ranks, titles, etc. not to be used)
Crebolder, J.; Beardsall, J.
5. DATE OF PUBLICATION (Month and year of publication of document.)
December 2008
6a. NO. OF PAGES (Total containing information, including Annexes, Appendices, etc.)
54
6b. NO. OF REFS (Total cited in document.)
13
7. DESCRIPTIVE NOTES (The category of the document, e.g. technical report, technical note or memorandum. If appropriate, enter the type of report, e.g. interim, progress, summary, annual or final. Give the inclusive dates when a specific reporting period is covered.)
Technical Memorandum
8. SPONSORING ACTIVITY (The name of the department project office or laboratory sponsoring the research and development – include address.)
Defence R&D Canada – Atlantic 9 Grove Street P.O. Box 1012 Dartmouth, Nova Scotia B2Y 3Z7
9a. PROJECT OR GRANT NO. (If appropriate, the applicable research and development project or grant number under which the document was written. Please specify whether project or grant.)
12oi03
9b. CONTRACT NO. (If appropriate, the applicable number under which the document was written.)
10a. ORIGINATOR'S DOCUMENT NUMBER (The official document number by which the document is identified by the originating activity. This number must be unique to this document.)
DRDC Atlantic TM 2008-281
10b. OTHER DOCUMENT NO(s). (Any other numbers which may be assigned this document either by the originator or by the sponsor.)
11. DOCUMENT AVAILABILITY (Any limitations on further dissemination of the document, other than those imposed by security classification.)
Unlimited
12. DOCUMENT ANNOUNCEMENT (Any limitation to the bibliographic announcement of this document. This will normally correspond to the Document Availability (11). However, where further distribution (beyond the audience specified in (11) is possible, a wider announcement audience may be selected.))
Unlimited

13. ABSTRACT (A brief and factual summary of the document. It may also appear elsewhere in the body of the document itself. It is highly desirable that the abstract of classified documents be unclassified. Each paragraph of the abstract shall begin with an indication of the security classification of the information in the paragraph (unless the document itself is unclassified) represented as (S), (C), (R), or (U). It is not necessary to include here abstracts in both official languages unless the text is bilingual.)
Two experiments were conducted to investigate automated visual alerting in complex environments where operators rely on multiple display workstations to perform high-intensity tasks. The Halifax Class frigate is an example of such an environment; where the auditory modality is over-taxed and where visual alerts might be an alternate means for alerting operators. The two experiments investigated the ability to detect two types of visual alerts, and alerts appeared on the three displays making up the workstation. In Experiment 1, a flashing border surrounding the perimeter of the display screen was compared to a static sidebar alert positioned on the outer left side of the screen. In Experiment 2 a complete counterbalance of factors was achieved whereby both border and sidebar alerts were presented as flashing and static. Results showed that the sidebar alert was detected faster than border alerts regardless of whether it was flashing or static, and in general, sidebar alerts were detected faster when they appeared on all three displays as compared to one display. Future work will focus on examining the association between the display an alert appears on and the spatial location of operator attention.
Deux expériences ont été effectuées en vue d’étudier les alertes visuelles automatisées dans des environnements complexes où les opérateurs s’appuient sur des postes de travail d’affichage multiples pour réaliser des tâches à haute intensité. La frégate de la classe Halifax est un exemple d’un tel environnement, où le mode audible est surchargé et où les alertes visuelles pourraient devenir une solution de rechange pour alerter les opérateurs. Les deux expériences ont porté sur l’étude de la capacité à détecter deux types d’alertes visuelles et les alertes étaient présentées sur les trois écrans qui forment le poste de travail. Dans l’expérience 1, une bordure clignotante entourant le périmètre de l’écran a été comparée à un trait vertical statique placé du côté gauche extérieur de l’écran. Dans l’expérience 2, on a atteint un contrepoids de facteurs complet où les alertes à bordure et à trait vertical étaient toutes deux présentées comme clignotantes et statiques. Les résultats ont démontré que l’alerte à trait vertical était détectée plus rapidement que les alertes à bordure, que ces dernières soient clignotantes ou statiques, et qu’en général, les alertes à trait vertical étaient détectées plus rapidement lorsqu’elles étaient affichées sur les trois écrans au lieu de sur un seul écran. Les travaux futurs seront concentrés sur l’étude de l’association entre l’écran sur lequel est affichée une alerte et l’emplacement spatial de l’attention de l’opérateur.
14. KEYWORDS, DESCRIPTORS or IDENTIFIERS (Technically meaningful terms or short phrases that characterize a document and could be helpful in cataloguing the document. They should be selected so that no security classification is required. Identifiers, such as equipment model designation, trade name, military project code name, geographic location may also be included. If possible keywords should be selected from a published thesaurus, e.g. Thesaurus of Engineering and Scientific Terms (TEST) and that thesaurus identified. If it is not possible to select indexing terms which are Unclassified, the classification of each should be indicated as with the title.)

This page intentionally left blank.